working group „pesticides and beneficial organisms“ · pdf filebernardo, umberto,...
TRANSCRIPT

IOBC / WPRS
Working Group „Pesticides and Beneficial Organisms“
OILB / SROP
Groupe de Travail „Pesticides et Organismes Utiles“
Proceedings of the meeting
at
Avignon, France
8-11 October, 2002
Editors:
Heidrun Vogt & Udo Heimbach & Elisa Vinuela
IOBC wprs Bulletin Bulletin OILB srop Vol. 26 (5) 2003

The IOBC/WPRS Bulletin is published by the International Organization for Biological and Integrated Control of Noxious Animals and Plants, West Palearctic Regional Section (IOBC/WPRS) Le Bulletin OILB/SROP est publié par l‘Organisation Internationale de Lutte Biologique et Intégrée contre les Animaux et les Plantes Nuisibles, section Regionale Ouest Paléarctique (OILB/SROP) Copyright: IOBC/WPRS 2003
The Publication Commission of the IOBC/WPRS: Horst Bathon Federal Biological Research Center for Agriculture and Forestry (BBA) Institute for Biological Control Heinrichstr. 243 D-64287 Darmstadt (Germany) Tel +49 6151 407-225, Fax +49 6151 407-290 e-mail: [email protected]
Luc Tirry University of Gent Laboratory of Agrozoology Department of Crop Protection Coupure Links 653 B-9000 Gent (Belgium) Tel +32-9-2646152, Fax +32-9-2646239 e-mail: luc.tirry@ rug.ac.be
Address General Secretariat: INRA – Centre de Recherches de Dijon Laboratoire de recherches sur la Flore Pathogène dans le Sol 17, Rue Sully, BV 1540 F-21034 DIJON CEDEX France
ISBN 92-9067-153-8

Preface
The IOBC WG „Pesticides and Beneficial Organisms“ held its annual meeting at the Université Ste. Marthe, Avignon, France, from 8th - 11th October 2002.
The meeting was attended by 90 participants from 16 countries (Austria, Belgium, Czech Republic, France, Germany, Hungary, Ireland, Italy, Portugal, Spain, Switzerland, The Netherlands, Tunisia, Turkey, United Kingdom, USA (Hawai)). On the first day subgroup meetings took place, focusing on improvement, harmonization and validation of test methods. They reported the actual state of the method development to the WG and stated, that the Poecilus cupreus larvae test as well as the Aphidius rhopalosiphi extended laboratory test are ready for finalising the guidelines.
At the WG meeting 20 oral contributions and 7 posters were presented, treating results about side effects of pesticides and test methodology, including new developments for soil organisms. From these presentations 16 are published in this volume. I thank my co-editors as well as further colleagues, who have been involved in the review process, for their support and good cooperation.
During the meeting the election of the convenor for the period 2003 to 2007 took place and the present convenor, Heidrun Vogt, was reelected.
Many thanks are due to the local organizers, Margrit Engelhardt and her team. All participants enjoyed the scientific part of the meeting with very fruitful and intense discussions and exchange of knowledge as well as the social events. These included a visit to the impressive Pont du Gard and to a winery in Beaume de Venise with a lot of information about the integrated production of grapes and wine making, and where we enjoyed a nice dinner.
Heidrun Vogt (Convenor)
Dossenheim, 23rd June 2003

ii

iii
List of Participants
1. ALDERSHOF, Saskia, Universiteit van Amsterdam, Dept. of Pure & Applied Ecology, Sect. Population Biology / MITOX, Kruislaan 320, NL-01098 SM Amsterdam, The Netherlands, e-mail: [email protected]
2. BAGNI, Giovanni, via E. Fermi, n.12, I-44042 Cento (FE), Italy, e-mail: [email protected]
3. BAKKER, F.M., Dr., Universiteit van Amsterdam, Dept. of Pure & Applied Ecology, Sect. Population Biology / MITOX, Kruislaan 320, NL-01098 SM Amsterdam, The Netherlands, e-mail: [email protected]
4. BARTELS, Anja, Mag., Österreichische Agentur für Gesundheit und Ernährungssicherheit GmbH, Institut für Pflanzenschutzmittelprüfung, Spargelfeldstraße 191, A-1226 Wien, Austria, e-mail: [email protected]
5. BARTH, Markus, BioChem agrar GmbH, Kupferstr. 6, D-04827 Gerichshain, Germany, e-mail: [email protected]
6. BECKER, Roland, Dr., BASF AG, Agrarzentrum Limburgerhof, Postfach 120, D-67114 Limburgerhof, Germany, e-mail: [email protected]
7. BENKER, Ullrich, Dr., Bayerische Landesanstalt für Bodenkultur und Pflanzenbau, Abteilung Pflanzenschutz, PS 3b - Schädlinge, Nützlinge, Vorratsschutz, Lange Point 10, D-85354 Freising, Germany, e-mail: [email protected]
8. BERNARDO, Umberto, Dr., Centro Studi CNR, Technice di Lotta Biologica, Via Università 100, I-80055 Portici (NA), Italy, e-mail: [email protected]
9. BLAL, Bachar, Dr., Biorize, 8, Rue Sainte Anne, F-21000 Dijon, France
10. BRAZIER, Christine Dr., Service Regional de la Protection des Vegetaux Rhone Alpes, Cite Administrative de la Part Dieu ,165 Rue Garibaldi, F-69401 Lyon Cedex 03, France, e-mail: [email protected]
11. BRUHNKE, Christine, Dipl-Biol., Dr. U. Noack-Laboratorium, D-31157 Sarstedt, Germany, e-mail: [email protected]
12. CALVARIN, Vincent, HORTILAB/ASTREDOR, B.P. 30, F-76640 Fauville en Caux, France
13. CANDOLFI, Marco, Dr., Syngenta Crop Protection AG, Ecological Sciences, WRO-1058.3.60, CH-4002 Basel, Switzerland, e-mail: [email protected]
14. CAVACO, Miriam, Direcção-Geral de Protecção das Culturas, Edifício 1, Tapada da Ajuda, P-1349-018 Lissabon, Portugal, e-mail: [email protected]
15. CHAPMAN, Andrew, Huntingtdon Life Sciences, Alconbury, Huntingdon, Cambs PE28 4HS, United Kingdom, e-mail: [email protected]

iv
16. CHIANELLA, Massimo, Dr., S.P.F GAB Italia s.n.c., Via dell´ Artigianato, 11, I-44028 Poggio Renatico (FE), Italy, e-mail: mchianella@[email protected]
17. CIVOLANI, Stefano, Dr., Universitá degli Studi di Bologna, DiSTA (Diapartimento di Scienze e Tecnologie Agroambientali), Via Filippo Re, 6, I-40126 Bologna, Italy, e-mail: [email protected]
18. COULOMB; Philippe; VITI – SARI; 101, Impasse des Capitelles, Chemin des Combes Noires, F-34400 Villetelle, France, e-mail: [email protected]
19. DINTER, Axel, Dr., Du Pont Crop Protection, Du Pont de Nemours (Deutschland) GmbH, DuPont Str. 1, D-61352 Bad Homburg, Germany, e-mail: [email protected]
20. ENGELHARDT, Margrit, Chemin Notre-Dame des Anges, F-26170 Mollans, France, e-mail: [email protected]
21. EYRE, Dominic, ECOTOX Ltd., Tavistock, P.O.Box 1, Devon PL19 0YU, United Kingdom, e-mail: [email protected]
22. FAYEL, Olivier, ENIGMA, Le Serre, F-26570 Montbrun, France, e-mail: [email protected]
23. FORSTER, Annie, ECOTOX Ltd., Tavistock, P.O.Box 1, Devon PL19 0YU, United Kingdom, e-mail: [email protected]
24. FORSTER, Rolf, Dr., BBA, Department for Plant Protection, Biology Division, Messeweg 11/12, D-38104 Braunschweig, Germany, e-mail: [email protected]
25. GAGNIARRE, Marion, CEREXAGRI, 1 rue des frères Lumière, BP 9, F-78373 Plaisir Cedex, France, e-mail: [email protected]
26. GALICIA, Hector, Dr., Springborn Smithers Laboratories (Europe) AG, Seestrasse 21, CH - 9326 Horn, Switzerland, e-mail: [email protected]
27. GEUIJEN, Ine, NOTOX B.V., P.O. Box 3476, NL-5203 DL´s-Hertogenbosch, The Netherlands, e-mail: [email protected]
28. GONCALVES, Màrio, P-1349-018 Lissabon, Portugal
29. GRAMMARE, Pierre, Sylvan Somycel SA, ZI Sud - Route de Tours, F-37130 Langeais, France, e-mail: [email protected]
30. GRIMM, Christoph, Dr., Syngenta AG, R-1058.3.66, CH-4002 Basel, Switzerland, e-mail: [email protected]
31. GÜVEN, Bilgin, Msc, 35040 Bornova / Izmir, Turkey, e-mail: [email protected]
32. HEIMBACH, Udo, Dr., BBA, Institute for Plant Protection of Field Crops and Grassland, Messeweg 11/12, D-38104 Braunschweig, Germany, e-mail: [email protected]
33. HELLAL, Hamadi, Dr., Société ERRAFRAF - Recherches Agronomiques, 7, Rue du Caire, Raf-Raf-Plage 7045, Aïn-Chiquoua, Tunisia
34. HIRTH, Nicole, GAB, Biotechnologie GmbH, Eutinger Str. 24, D-75223 Niefern-Öschelbronn, Germany, e-mail: [email protected]
35. HUGGETT, David, Dr., Syngenta, Jealott`s Hill International Research Station, Bracknell, Berkshire, RG42 6EY, United Kingdom, e-mail: [email protected]
36. KATZ, Peter, Dr., Industriestr. 38, D-73642 Welzheim, Germany, e-mail: [email protected]

v
37. KOCH, Astrid, Zum Flößchen 26, D-55411 Bingen, Germany
38. KOCH, Heribert, Dr., Landesanstalt für Pflanzenschutz und Pflanzenbau, Essenheimer Str. 144, D-55128 Mainz, Germany, e-mail: [email protected]
39. KÖNINGS, Iris, 3, Av. Boccace, F-8400 Avignon, France, e-mail: [email protected]
40. KUBÁTOVÁ-Hiršová, Hana, Mgr., SRS, Zěmědelská 1a, CZ-61300 Brno, Czech Republic, e-mail: [email protected]
41. LAFUENTE FERNÁNDES, Maria, Ing.agr., GAB, Biotechnologie GmbH, C/Serratella 2, E-46650 Canals (Valencia), Spain, e-mail: [email protected]
42. LANGHOF, Maren, Institut für Pflanzenkrankheiten und Pflanzenschutz, Universität Hannover, Herrenhäuser Str. 2, D-30419 Hannover, Germany, e-mail: [email protected]
43. LE COZ, Brigitte, Ms., Sumitomo Chemical Agro Europe S.A., 2, rue Claude Chappe, F-69370 Saint Didier au Mont d'Or, France, e-mail: [email protected]
44. MARTIN, Sabine, Dr., Umweltbundesamt, Postfach 330022, D-14191 Berlin, Germany, e-mail: [email protected]
45. MAUS, Christian, Dr., Bayer Crop Science, Institute for Environmental Biology, Alfred-Nobel-Str. 50, D-40789 Monheim, Germany, e-mail: [email protected]
46. MCEWEN, P., Dr., I2L, Capital Business Park, Wentloog, Cardiff CF3 2PX, United Kingdom, e-mail: [email protected]
47. MEAD-BRIGGS, Mike, Dr., Mambo-Tox Ltd., Biomedical Sciences Building, Basset Crescent East, Southampton SO16 7PX, United Kingdom, e-mail: [email protected]
48. MEDINA, Maria Pilar, Dr., Unidad de Proteccion de Cultivos, E.T.S.I.Agronomos, Universidad Politecnica de Madrid, E-28040 Madrid, Spain, e-mail: [email protected]
49. MENDEL-KRAUS, Renate, Dr., Feinchemie Schwebda GmbH, c/o Halzenberg 45, D-42929 Wermelskirchen, Germany, e-mail: [email protected]
50. MESSING, Russell, Prof., University of Hawai, 7370, Kuamoo Rd., Kapaa, 96745 Hawai, USA, e-mail: [email protected]
51. MILES, Mark, Dow AgroSciences, European Development Centre, 2nd Floor, 3, Milton Park, Abingdon OX14 4RN, United Kingdom, e-mail: [email protected]
52. MOLL, Monika, Dr., IBACON, Institut für Biologische Analytik und Consulting GmbH, Arheilger Weg 17, D-64380 Rossdorf, Germany, e-mail: [email protected]
53. MORESCHI, Ivana, Dr., Istituto di Entomologia agraria , Università degli Studi di Milano , Via Celoria, 2, I-20133 Milano, Italy, e-mail: [email protected]
54. MOULONGUET, Gilles, PROMO-VERT S.A., Z.I. du Haut Ossau, Rue d'Aste Béon, BP 27, F-64121 Serres Castet, France, e-mail: [email protected]
55. MÜTHER, Jutta, Dr., GAB, Biotechnologie GmbH, Eutinger Str. 24, D-75223 Niefern-Öschelbronn, Germany, e-mail: [email protected]

vi
56. NEUMANN, Paul, Dr., Bayer CropScience, Building 6620, D-40789 Monheim, Germany, e-mail: [email protected]
57. NIENSTEDT, Karin, Dr., Springborn Smithers Laboratories (Europe) AG, Seestr. 21, CH - 9326 Horn, Switzerland, e-mail: [email protected]
58. O'BRIEN, Aoife, Sylvan Ireland Ltd., Beechmount Industrial Estate, Navan, Co.Meath Ireland, e-mail: [email protected]
59. PARAT, Jean, Ing., 9, Avenue Frémiet, F-75016 Paris, France, e-mail: [email protected]
60. PETERS, Arne, Dr., E-Nema GmbH, Klausdorfer Str. 28-36, D-24223 Raisdorf, Germany, e-mail: [email protected]
61. AUWERKERKEN, Annemarie, PCF-Royal Research Station of Gorsem, De Brede Akker 13, B-3800 Sint-Truiden, Belgium, e-mail: [email protected]
62. PHILLIPS, David, Covance Laboratories LTD, Otley Road, Harrogate, North Yorkshire HG3 1PY, United Kingdom, e-mail: [email protected]
63. PINCH, Catherine, Ecological Sciences, Syngenta, Jealottt´s Hill Bracknelll, Berkshire, PSG4 26EY, United Kingdom, e-mail: [email protected]
64. POLGAR, Làszlò, Dr., Plant Protection Institute of Hungarian Academy of Science, Zool. Department, P.O. Box 102, H-1525 Budapest, Hungary, e-mail: [email protected]
65. POULLOT, Delphine, ENIGMA, Hameau de St. Véran, F-84190 Beaumes de Venise, France, e-mail: [email protected]
66. RIOU, Géraldine, PHILAGRO France, Parc dáffaires de Crécy, 2, Claude Chappe, F-69771 Saint-Didier-au-Mont-d'Or Cedex, France, e-mail: [email protected]
67. RODRIGUES, J. Raul, Dep. Ciéncias da Planta e do Ambienta, Escola Superior Agrária de Ponte de Lima, Convento do Refóios, P-4990-706 Ponte de Lima, Portugal, e-mail: [email protected]
68. RÖHLIG, Uta, BioChem agrar GmbH, Kupferstr. 6, D-04827 Gerichshain, Germany, e-mail: [email protected]
69. RIDRAY, Gilles, INRA SAD Alenya, F - 66200 Alenya, France, e-mail: [email protected]
70. SCHIRRA, Karl-Josef, Dr., SLFA, Neustadt an der Weinstraße, Breitenweg 71, D-67435 Neustadt, Germany, e-mail: [email protected]
71. SCHOEN, Leen, Dr., Sica CENTREX, 19, Avenue Grande Bretagne, F-66440 Torreilles, France, e-mail: [email protected]
72. SCHWIENING, Susanne, Dr., IBACON, Institut für Biologische Analytik und Consulting GmbH, Arheilger Weg 17, D-64380 Rossdorf, Germany, e-mail: [email protected]
73. SERVAJEAN, Elisabeth, Dr., Phytosafe sorl, 2 rue Marx Dormoy, F-64000 Pau, France, e-mail: [email protected]
74. SHARPLES, Amanda, Huntingdon Life Sciences Ltd, Alconbury, Huntingdon Cambs PE28 4HS, United Kingdom, e-mail: [email protected]

vii
75. SMITH, Katie, Dr., I2L, Capital Business Park, Wentloog, Cardiff CF3 2PX, United Kingdom, e-mail: [email protected]
76. STÄBLER, Petra, Dr., GAB, D-75223 Niefern-Öschelbronn, Germany, e-mail: [email protected]
77. STACEY, David, Dr., Terrestrial Ecology III/2, Syngenta, Jealott's Hill, Bracknell, Berkshire RG42 6EY, United Kingdom, e-mail: [email protected]
78. UFER, A., Dr., BASF AG, Agrarzentrum Limburgerhof, APD/RL-LI 426, Postfach 120, D-67114 Limburgerhof, Germany, e-mail: [email protected]
79. VAN DE VEIRE, Marc, Dr., University of Gent, Laboratory of Agrozoology, Coupure Links 653, B-9000 Ghent, Belgium, e-mail: [email protected]
80. VAN DER STAAIJ, Marieke, Applied Plant Research Division Glasshouse Horticulture, Kruisbroekweg 5, NL-2670 AA Naaldwijk, The Netherlands, e-mail: [email protected]
81. VAN WATERMEULEN, Aventis CropScience GmbH, Industriepark Höchst, H872, D-65926 Frankfurt, Germany
82. VERGNET, Christine, Dr., Structure Scientifique Mixte -(SSM), Centre INRA de Versailles, Route de Saint-Cyr, F-78026 Versailles Cedex, France, e-mail: [email protected]
83. VIATOUR, Nathalie, Centre de Recherches Agronomiques , de Gembloux, Rue de Liroux, 2, B-5030 Gembloux, Belgium, e-mail: [email protected]
84. VINALL, Stephen, Mambo-Tox Ltd., Biomedical Sciences Building, Bassett Crescent East, P.O. Box 2, Southampton SO16 7PX, United Kingdom, e-mail: [email protected]
85. VIÑUELA, Elisa, Prof., Unidad de Proteccion de Cultivos, E.T.S.I. Agrónomos, Universidad Politécnica de Madrid, E-28040 Madrid, Spain, e-mail: [email protected]
86. VOGT, Heidrun, Dr., Federal Biological Research Centre for Agriculture and Forestry (BBA), Institute for Plant Protection in Fruit Crops, Schwabenheimerstr. 101, D-69221 Dossenheim, Germany, e-mail: [email protected]
87. WALTERSDORFER, Anna, Dr., Aventis CropScience GmbH, Industriepark Höchst, H872, D-65926 Frankfurt, Germany, e-mail: [email protected]
88. WARLOP, Francois, Ing., GRAB - Site Agroparc BP 1222, F-84911 Avignon Cedex 9, France, e-mail: [email protected]
89. WILHELMY, Hermann, Neudorff GmbH KG, An der Mühle 3, D-31860 Emmerthal, Germany, e-mail: [email protected]
90. WINKELMANN, Gunda, Dipl-Ing.agr., Dr. U. Noack-Laboratorium, D-31157 Sarstedt, Germany, e-mail: [email protected]

viii

ix
Contents Preface......................................................................................................................................... i List of participants..................................................................................................................... iii PREDATORY MITES Evaluation of the side effects of five insecticides on predatory mites (Acari:
Phytoseiidae), in apple orchards in two different regions of Portugal Cavaco, M., Gonçalves, M., Nave, A., Santos, J., Silvino, P., Veiga, C. & Rodrigues, R................................................................................................... 1
Testing the effects of spinosad to predatory mites in laboratory, extended laboratory, semi-field and field studies Miles, M. & Dutton, R. ....................................................................................................... 9
CHRYSOPERLA CARNEA
Side effects of pesticides used in cotton and vineyard areas of Aegean Region on the green lacewing, Chrysoperla carnea (Steph.) (Neuroptera: Chrysopidae), in the laboratory Güven, B. & Göven, M.A.................................................................................................. 21
Lab studies with Trichilia havanensis Jacq., a botanical pesticide, and adults of Chrysoperla carnea (Stephens) Huerta, A., Medina, P., Castañera, P. & Viñuela, E. ...................................................... 25
Side effects of six insecticides on different developmental stages of Chrysoperla carnea (Neuroptera: Chrysopidae) Medina, P., Budia, F., del Estal, P., Adán, A. & Viñuela, E............................................ 33
GLASSHOUSE BENEFICIALS
Side effects of pesticides on four species of beneficials used in IPM in glasshouse vegetable crops: “worst case” laboratory tests Van de Veire, M. & Tirry, L. ............................................................................................ 41
FIELD TESTS AND METHODOLOGY
Studies on side effects of some insecticides on aphid-feeding Coccinellidae in Emilia-Romagna fruit crops Pasqualini, E. & Civolani, S. ........................................................................................... 51

x
Water trapping winged insects in cereal fields – trap design and edge effects Eyre, D. & Pease, G......................................................................................................... 57
Sampling methods in orchard trials: A comparison between beating and inventory sampling Müther, J. & Vogt, H........................................................................................................ 67
ASPECTS OF PESTICIDE DRIFT
Field study on the effects of insecticide drift on non-target arthropods: Residual toxicity, effect on populations and recolonisation processes Langhof, M., Gathmann, A. & Poehling, H.M. ................................................................ 73
A field trial to assess effects of spray drift on non-target arthropods when using drift
mitigation measures in an orchard Grimm, C., Bakker, F. & Candolfi, M.P. ......................................................................... 83
SOIL ORGANISMS AND METHOD DEVELOPMENT
New soil invertebrate testing scheme proposed by EPPO – with special reference to PPP formulations like granular formulations and seed dressings Forster, R. & Kula,C........................................................................................................ 93
Testing Hypoaspis aculeifer (Acari: Laelapidae) on standard soils: notes on testing
methodology and species sensitivity Bakker, F. & Stratum, P. van ........................................................................................... 99
Pesticides and entomopathogenic nematodes - current status and future work Peters, A. ....................................................................................................................... 107
POSTER PRESENTATIONS
Susceptibility of Hyposoter didymator (Hymenoptera: Ichneumonidae) adults to several insect growth regulators and spinosad by different exposure methods Schneider, M.I., Smagghe, G. & Viñuela, E................................................................... 111
Comparison of three types of extended laboratory tests with Aphidius rhopalosiphi
(DeStephani-Perez) (Hymenoptera: Braconidae) Bruhnke, C., Winkelmann, G. & Noack, U. ................................................................... 123

Pesticides and Beneficial Organisms IOBC/wprs Bulletin Vol. 26 (5) 2003
pp. 1 - 8
1
Evaluation of the side effects of five insecticides on predatory mites (Acari: Phytoseiidae) in apple orchards in two different regions of Portugal Miriam Cavaco*, Mário Gonçalves*, Anabela Nave**, João Santos**, Paulo Silvino**, Carlos Veiga** & Raul Rodrigues*** * Direcção – Geral de Protecção das Culturas, Edificio 1 Tapada da Ajuda 1349-018 Lisboa ** Associação de Agricultores de Produção de Frutos de Montanha, Av. Monsenhor Mendes
do Carmo, Bloco 6, nº 23, r/c Esq 6300-586 Guarda *** Instituto Politécnico de Viana do Castelo, Escola Superior Agrária de Ponte de Lima -
Refóios do Lima, 4990-706 Ponte de Lima. E-mail: [email protected] Abstract: The use of pesticides may have profound effects on natural predators. Thus, their use may increase the risk of pest resurgences or secondary pest outbreaks. To evaluate the field toxicity of five insecticides on predatory mites (Acari: Phytoseiidae), two experiments were carried out in apple orchards in the regions of Guarda and Castelo Branco, Eastern Portugal. Single applications of the insecticides dimethoate (PERFEKTHION®), endosulfan (THIONEX®), imidacloprid (CONFIDOR®), pirimicarb (PIRIMOR®) and vamidothion (KILVAL®), were tested. A randomised complete block experimental design with five replicates per treatment was used. All insecticides were tested using commercial formulations at recommended field rates. The control plots were treated with water. Assessments of the density of phytoseiids were made before and 4, 7, 14, 21, and 35 days after treatment. The motile stages of phytoseiids and spider mites were counted on 25 leaves per replicate. The toxicities of the insecticides to phytoseiids were calculated using the Henderson-Tilton formula and were classified into four categories according to the standard field methods of the IOBC Working group “Pesticides and Beneficial Organisms”.
The dominant species of phytoseiid in the region of Guarda was Typhlodromus pyri Scheuten (99.9%) and the dominant species in the region of Castelo Branco was Typhlodromus phialatus Athias-Henriot (96.4%).
In both trials imidacloprid showed good selectivity for phytoseiids while dimethoate was harmful. It was found that T. pyri (trial 1) was more tolerant to the other insecticides tested than T. phialatus. Key words: apple orchards; integrated pest management; side-effects; insecticides; predatory mites, Typhlodromus pyri, Typhlodromus phialatus. Introduction The study of the side-effects of pesticides on natural enemies such as predaceous mites (Acari: Phytoseiidae) is an important task in pest management programmes, especially with regard to the use of phytoseiid mites as biological control agents of the fruit tree red spider mite Panonychus ulmi (Koch).
It is well known that spider mites were not primary pests prior to the introduction of broad-spectrum pesticides. Before, mites were usually kept under control by a complex of natural enemies (Croft, 1975, Solomon 1975)
This paper reports on the side-effects of five insecticides, dimethoate, endosulfan, imidacloprid, pirimicarb and vamidothion, on phytoseiids under field conditions in two different regions of Portugal.

2
Material and methods Single foliar applications of five insecticides were tested in two trials (Table 1) in two different commercial apple orchards. The trials were carried out to quantify the side-effects of plant protection products on predatory mites under field conditions using the standard methods of the IOBC (Blümel et al., 2000). Trial 1 An orchard at Quinta do Porto, Sabugal, Guarda consisting of 10-year-old apple trees, variety ‘Starking`, grafted on MM106 and spaced with 4 m x 2 m, was used. Trial 2 An orchard at Fundão, Castelo Branco consisting of 10-year-old apple trees, variety ‘Starking’, grafted on MM106 and spaced with 4.4 m x 2 m, was used. Experimental design The experimental evaluated 6 treatments (including the control), with 5 replicates per treatment in a randomised complete block design. Plots (each replicate) consisted of 4 trees in a row. The control plot was treated with water. The test compounds were applied at dose rates recommended by the manufacturer at a volume of 1000 l/ha (Table 1). Sprays were applied with a knapsack sprayer using a hand-lance. The spray volume of 1000 l/ha was adequate to ensure run-off.
Trial 1 was carried out between 12 July and 19 August 2002, Trial 2 between 24 July and 28 August 2002. Insecticides were applied on 15 July and 24 July 2002 respectively. Leaf samples were taken before and after treatment to assess the population densities of the motile stages of phytoseiids and P. ulmi. A leaf sample consisting of 25 expanded leaves selected hazardly, were taken from the two central trees of each plot on six occasions: before treatment (T0), and 4, 7, 14, 21 and 35 days after treatments (T4, T7, T14, T21 and T35). The exact sampling dates were as follows:
Trial 1: Sabugal, Guarda: 4 days before treatment (T0) (11.07.2002), and 4 (T4) (19.07.2002), 7 (T7) (22.07.2002), 14 (T14) (29.07.2002), 21 (T21) (05.08.2002), 35 (T35) (19.08.2002) days after treatment;
Trial 2: Fundão, Castelo Branco: 1 day before treatment (T0) (23.07.2002); and 4 (T4)(27.07.2002), 7 (T7)(31.07.2002), 14 (T14)(07.08.2002), 21 (T21)(14.08.2002), 35 (T35) (28.08.2002) days after treatment.
The assessment of the motile stages of phytoseiids and P. ulmi was performed in the laboratory with a stereoscopic microscope. The motile stages of predatory mites were counted and mean numbers per leaf calculated and statistically evaluated by univariate ANOVA (SPSS 11.0). When statistically significant treatment effects were found, then the HSD Tukey mean comparison test was performed at the 5% level.
The percentage mortality of predatory mites was calculated using the Henderson-Tilton formula as follows:
1001(%)12
21 ×⎟⎟⎠
⎞⎜⎜⎝
⎛××
−=PKPK
where: K1 = total number of target species before treatment in the control plot, K2 = total number of target species after treatment in the control plot, P1 = total number of target species before treatment in the test plot, and P2 = total number of target species after treatment in the test plot. According to the principles of IOBC, four evaluation categories (% mortality or
reduction in beneficial capacity) were used: 1 = harmless (< 25%), 2 = slightly harmful (25-50%), 3 = moderately harmful (51-75%) and 4 = harmful (>75%) (Hassan, 1994).

3
The phytoseiid species present were identified after each assessment. Experimental plots were maintained without further pesticide sprays during the
observation period. Results Phytoseiid species identified The phytoseiid species present were, in order of abundance, Typhlodromus pyri Scheuten (99.9%) and Euseius finlandicus (Oudemans) (0.1%) in trial 1 and Typhlodromus phialatus (Athias-Henriot) (96.4%) and T. pyri (3.6%) in trial 2. Red Spider Mite P. ulmi occurred at a negligibly low level in both trials. Trial 1
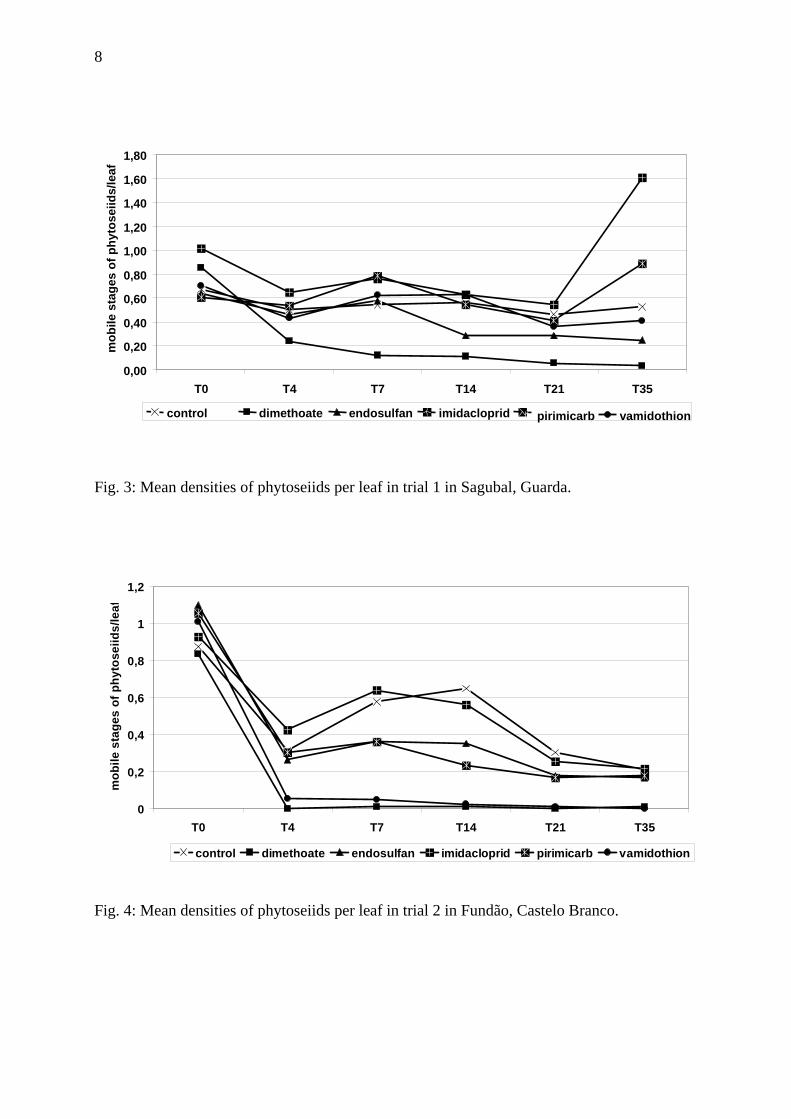
Phytoseiid mites were uniformly distributed within the plots in this trial before insecticide application. No significant differences between treatments were detected at T0 (p= 0.238) (Fig. 1). After treatment, the mean densities of phytoseiids per leaf decreased for all treatments. Treatment effects were statistically significant (p=0.014). Whilst Pirimicarb, imidacloprid and endosulfan did not significantly reduce mite numbers compared to the control, dimethoate and vamidothion did reduce mean mite numbers (p<0.050) (HSD-Tukey multiple comparison). Among the insecticides, a significant reduction was detected only in the plots treated with imidacloprid in comparison to the plots treated with dimethoate (p=0.06 HSD Tukey). The reduction of the phytoseiid mite density was most pronounced for the dimethoate treatment, where the last count (T35) revealed only 0.03 motiles s per leaf (Fig. 3). Dimethoate was highly toxic (class 4) to predatory mites, as the average mortality rate calculated from all sampling dates was 82.6% (Table 2). Endosulfan was classified as being of low toxicity, the mean mortality being 22.3% (class 1). Imidacloprid, pirimicarb and vamidothion had a toxicity level below 25 % (class 1) at all assessments. Trial 2 As in trial 1, phytoseiid mites were uniformly distributed within the plots before insecticide application. No significant differences between treatments were detected at T0 (p= 0.687) (Fig. 2). After treatment, the mean density of phytoseiids per leaf decreased for all treatments including the control (Fig. 2 and 4). Significant differences were detected among several treatments (p<0.001). Pirimicarb, imidacloprid and endosulfan did not differ significantly from the control, while dimethoate and vamidothion significantly reduced numbers (p<0.050), (HSD-Tukey multiple comparison). No significant differences were detected among the plots treated with dimethoate and the plots treated with vamidothion (p=0.976 HSD Tukey).
The most severe reductions were observed with dimethoate and vamidothion, where at T4 the mean densities were 0 and 0.1 motiles per leaf. There was no recovery until the end of the observation period. For the remaining treatments, a decrease in the mean density of phytoseiids per leaf also occurred. The organophosphorous compounds vamidothion and dimethoate resulted in high toxicity values (class 4) (Table 2). The calculated mean toxicities were 92.5% for vamidothion and 98.4% for dimethoate. Pirimicarb and endosulfan showed similar results, being less toxic than the former insecticides, with mean toxicities of 34.4% and 32.7% (both class 2) respectively. Imidacloprid had the lowest toxicity during the whole trial and allowed an increase of the phytoseiid population in relation to the control at T4 and T7.

4
Discussion In trial 1 (Guarda) the most abundant species that occurred was T. pyri, the most abundant species in the region (Nave, 1999). In Trial 2 (Fundão), however, the most abundant species was T. phialatus. This difference may be explained by the preference of T. pyri for more humid climates (Kreiter & Bourdonnaye, 1993) as the climate in the region of Guarda is more humid. All the phytoseiid species identified are considered by McMurty (1992) to be generalist predators that can maintain spider mites at low population densities.
The lower selectivity of dimethoate was confirmed in several trials in Northern Portugal (Rodrigues et al., 2002; Rodrigues, unpublished data). This insecticide is only permitted in Integrated Pest Management (IPM) programmes in apple orchards in Portugal to control Med-fly (Ceratitis capitata Wied.).
Vamidothion, which is authorized in apple IPM programs in Portugal with restrictions, was harmless for T. pyri (trial 1). Similar results were obtained by Costa-Comelles & Garcia-Mari (2001) in Spain with the species Amblyseius andersoni (Chant). In trial 2, vamidothion had poor selectivity for T. phialatus. The results obtained by Rodrigues et al., (2002) confirm the low selectivity of vamidothion in one experiment where T. pyri and Euseius stipulatus (Athias-Henriot) were the most abundant species.
Imidacloprid had good selectivity for both phytoseiid species present in both trials. This confirms the results obtained by Sterk et al. (1994). Contradictory results were obtained by Rodrigues et al. (2002) and Costa-Comelles & Garcia-Mari (2001). They classified this insecticide to be in class 3.
Endosulfan was found to be harmless in trial 1 and slightly harmful in trial 2. Costa-Comelles & Garcia-Mari (2001) considered endosulfan as slightly harmful for A. andersoni. However, Rodrigues et al. (2002) considered this active substance to be moderately harmful to harmful.
Pirimicarb was harmless for T. pyri (trial 1), corroborating the results obtained by Costa-Comelles & Garcia-Mari (2001) on A. andersoni. On the other hand, the toxicity observed for T. phialatus (trial 2) was confirmed by the results obtained by Rodrigues et al. (2002) in Northern Portugal.
These results are of interest for the enhancement of integrated pest management programmes in apple orchards in Portugal. They suggest differences in susceptibility of T. pyri and T. phialatus to the tested insecticides, mainly to vamidothion. More trials are necessary to confirm our results. Dimethoate showed very low selectivity to several phytoseiid species in all trials carried out in apple orchards in Portugal.
Acknowledgements This study was supported by the Project-Agro Nº 317 entitled: “Efeitos Secundários dos
pesticidas sobre fitoseídeos (Acari: Phytoseiidae) associados às culturas da macieira e vinha nas regiões de Entre-Douro e Minho e Beira Interior”

5
References Blümel, S., Aldershof, S., Bakker, F. M., Baier, B., Boller, E., Brown, K., Bylemans, D.,
Candolfi, M.P., Huber, B., Linder, C., Louis, F., Müther, J., Nienstedt, K. M., Oberwalder, C., Schirra, K. J, Ufer, A. & Vogt, H. 2000: Guidance document to detect side effects of plant protection products on predatory mites (Acari: Phytoseiidae) under field conditions: vineyards and orchards. In: Candolfi et al. (Eds.): Guidelines to evaluate side-effects of plant protection products to non target-arthropods. IOBC, BART and EPPO Joint Initiative, IOBC/WPRS Gent: 145-153.
Costa-Comelles, J. & García-Marí, F. 2001: Ensayos de campo para la evaluación del efecto de los plaguicidas sobre el fitoseido Amblyseius andersoni y la araña roja Panonychus ulmi en manzano. Fruticultura professional 118 (5/6): 7-17.
Croft, B.A. 1975: Tree fruit pest management. In: Metcalf, R.L. & Luckmann, W.H. (Eds) Insect Pest Management. Wiley, New York, 471-507.
Hassan, S. A. 1994: Activities of the IOBC/WPRS Working Group "Pesticides and Beneficial Organisms". IOBC/WPRS Bulletin 17(10): 1-5.
McMurty, J. A. 1992: Dynamics and potential impact of ‘generalist’ phytoseiids in agroecosystems and possibilities for establishment of exotic species. Experimental & Applied Acarology 1: 371-382.
Kreiter, S. & Bourdonnaye, D. 1993: Les typhlodromes, acariens predateurs. Clé simplifiée d’identification des principales espèces des cultures de plein champ en France. Les cahiers de Phytoma – La Défense des végétaux, 446 (suplément): I-XI.
Nave, A. 1999: A cochonilha de São José (Quadraspidiotus perniciosus Comst.) em macieira na Beira Interior. Previsão do risco resultante da praga e a luta química. Tese de Mestrado em protecção integrada. UTL/ISA, Lisboa, 193pp.
Rodrigues, J. R., Miranda M. R. C., Rosas, J. D. F., Maciel, C. & Torrres, L M. 2002: Side-effects of fifteen insecticides on predatory mites (Acari: Phytoseiidae) in apple orchards. IOBC/WRPS. Bulletin 25(11): 53-65.
Solomon, M.G. 1975: The colonization of an apple orchard by predators of the fruit tree red spider mite. Annals of Applied Biology 80: 119-122.
Sterk, G., Creemers, P. & Merckx, K. 1994: Testing the side effects of pesticides on the predatory mite Typhlodromus pyri (Acari: Phytoseiidae) in field trials. IOBC/WRPS Bulletin 17(10): 27-40.

6
Table 1. Insecticides evaluated in both trials, their trade names and application rates.
Active substance Trade name Commercial product /ha
Imidacloprid (200 g/l) CONFIDOR 0.5 l
Pirimicarb (50 % p/p) PIRIMOR G 0.5 l
Vamidothion (400 g/l) KILVAL 1.25 l
Endosulfan (380 g/l) THIONEX 1.32 l
Dimethoate (400 g/l) PERFEKTHION 1.00 l Table 2. Toxicity classification of the insecticides tested in Sabugal, Guarda (trial 1),
according to the IOBC Working Group “Pesticides and Beneficial Organisms” (% = % mortality or reduction in beneficial capacity; Cl – class of toxicity, T4 - T35 = days after treatment).
T4 T7 T14 T21 T35 Mean
(T4- T35)
Active substance
% Cl % Cl % Cl % Cl % Cl % Cl
Dimethoate 62.6 3 81.3 4 82.6 4 91.3 4 95.0 4 82.6 4
Endosulfan 3.2 1 -20.0 1 40.0 2 40.0 2 48.3 2 22.3 1
Imidacloprid 15.0 1 0.3 1 17.1 1 28.6 2 -111.0 1 -10.0 1
Pirimicarb -17.5 1 -71.9 1 -19.3 1 10.5 1 -94.7 1 -38.6 1
Vamidothion 18,2 1 -18,2 1 -19,7 1 31,8 2 22.7 1 7.0 1
Table 3. Toxicity classification of insecticides tested in Fundão, Castelo Branco (trial 2), according to the IOBC Working Group “Pesticides and Beneficial Organisms” (% = % mortality or reduction in beneficial capacity; Cl – class of toxicity, T4 - T35 = days after treatment).
T4 T7 T14 T21 T35 Mean
(T4- T35)
Active substance
% Cl % Cl % Cl % Cl % Cl % Cl
Dimethoate 100 4 97.3 4 97.3 4 100.0 4 97.3 4 98.4 4
Endosulfan 32.7 2 8.2 1 10,2 1 55.1 3 57.2 3 32.7 2
Imidacloprid -27.7 1 -92.7 1 -68.7 1 22.9 1 34.9 2 -26.3 1
Pirimicarb 19.5 1 4.7 1 38.6 2 55.5 3 53.4 3 34.4 2
Vamidothion 84.5 4 86.7 4 93.3 4 97.8 4 100.0 4 92.5 4

7
0,00 0,20 0,40 0,60 0,80 1,00 1,20
control
dimethoate
endosulfan
imidacloprid
pirimicarb
vamidothion
mobile stages of phytoseiids/leaf
T0 mean (T4-T35)
A
A
A
A
A
A ab
ab
ab
ab
a
b
Fig. 1: Mean densities of Phytoseiidae per leaf before treatment (T0) and within four weeks
after treatment (mean of five assessments (T4-T35) for trial 1, Sabugal, Guarda. Means in the same columns followed by different letters are significantly different (p<0.05), (HSD-Tukey multiple comparison).
0,00 0,20 0,40 0,60 0,80 1,00 1,20
control
dimethoate
endosulfan
imidacloprid
pirimicarb
vamidothion
mobile stages of phytoseiids/leaf
T0 mean (T4-T35)
A
A
A
A
A
A
c
bc
ab
a
a
a
Fig. 2: Mean densities of Phytoseiidae per leaf before treatment (T0) and within four weeks
after treatment (mean of five assessments (T4-T35) for trial 2, Fundão, Castelo Branco. Means in the same columns followed by different letters are significantly different (p<0.10), HSD- Tukey multiple comparison).
8
Fig. 3: Mean densities of phytoseiids per leaf in trial 1 in Sagubal, Guarda.
0
0,2
0,4
0,6
0,8
1
1,2
T0 T4 T7 T14 T21 T35
mob
ile s
tage
s of
phy
tose
iids/
leaf
control dimethoate endosulfan imidacloprid pirimicarb vamidothion
Fig. 4: Mean densities of phytoseiids per leaf in trial 2 in Fundão, Castelo Branco.
0,00 0,20 0,40 0,60 0,80 1,00 1,20 1,40 1,60 1,80
T0 T4 T7 T14 T21 T35
mob
ile s
tage
s of
phy
tose
iids/
leaf
control dimethoate endosulfan imidacloprid pirimicarb vamidothion

Pesticides and Beneficial Organisms IOBC/wprs Bulletin Vol. 26 (5) 2003
pp. 9 - 20
9
Testing the effects of spinosad to predatory mites in laboratory, extended laboratory, semi-field and field studies Mark Miles & Robert Dutton Dow AgroSciences, European Development Centre, 2nd Floor, 3 Milton Park, Abingdon, OX14 4RN, UK Abstract: A range of laboratory, extended laboratory, semi-field and field tests were conducted with spinosad on predatory mites. Species commonly introduced into glasshouses for biological control and economically important, naturally occurring populations were investigated. In laboratory tests conducted on glass plates spinosad was harmful to Typhlodromus pyri at rates between 48 and 400 g a.i./ha. Under extended laboratory conditions (exposure on natural substrates) no effects were seen on Amblyseius cucumeris, Hypoaspis aculeifer or Hypoaspis miles at rates up to 540 g a.i./ha. When Phytoseiulus persimilis was tested under semi-field conditions spinosad was harmless at rates of 9.6, 19.2 and 36 g a.i./hL. No effects were noted to Amblyseius californicus at 19.2 g a.i./hL under semi-field conditions. In the field, single applications of spinosad at 48 or 96 g a.i./ha in vines caused no unacceptable effects to populations of T. pyri or Kampimodromus aberrans. In orchards in Italy one application at 4.8 or 9.6 g a.i./hL was safe to Amblyseius andersoni but two at 9.6 g a.i./hL caused significant effects. Repeated applications (five in vines or four in apples) at field rates and timings had no effect on indigenous populations of T. pyri in France or Germany. It was concluded that spinosad was highly selective to most predatory mite species and that effects noted in tier I laboratory studies did not translate to higher tiers of testing or use in the field. The exception to this was A. andersoni which was sensitive under field conditions to more than one application of spinosad per season. Keywords: Spinosad, predatory mite, side-effects Introduction Spinosad is a novel insect control agent derived by fermentation of the Actinomycete bacterium, Saccharopolyspora spinosa. The active ingredient is composed of two metabolites, spinosyn A and spinosyn D (Thompson et al., 1997). Spinosad controls many caterpillar pests in vines, pome fruit and vegetables (including tomatoes and peppers), thrips in tomatoes, peppers and ornamental cultivation and dipterous leafminers in vegetables and ornamentals. Application rates vary between 25 to 150 g of active ingredient per hectare (g a.i./ha) and 4.8 to 36 g of active ingredient per hectolitre (g a.i./hL) depending on the crop and target pest. High volume sprays may lead to theoretical worse case application rates of 144, 214 and 540 g a.i./ha.
Spinosad can be used to control pests in crops where the conservation of predatory mites is an important component of Integrated Pest Management (IPM). Additionally, there are governmental and environmental pressures to develop and use products safely with minimum impact on non-target arthropods. Predatory mite species are recognised as both important antagonists of pest species and sensitive indicators of ecologically significant effects. A range of laboratory, extended laboratory, semi-field and field tests were conducted with spinosad on predatory mites. Species commonly introduced into glasshouses for biological control and economically important naturally occurring populations were investigated. The objective of this paper was to review the effects of spinosad to a range of predatory mite species using a

10
sequential testing scheme. The data comes from a range of trials either conducted directly by Dow AgroSciences or by a third party under contract. The data from the semi-field contact tests were provided by G. Sterk (Biobest NV, Ilse Velden 18, B-2260 Westerlo, Belgium). Materials and methods Experimental test systems (study type and mite species) are outlined in Table 1. All studies were carried out using spinosad formulated as either a 120 or a 480 g a.i./L SC formulation. Table 1. Study type and predatory mite species tested in side-effects studies with spinosad.
Study type Species Laboratory (tier I) Typhlodromus pyri (Scheuten) Extended laboratory (natural substrates)
Amblyseius cucumeris (Oudemans), Hypoaspis aculeifer (Canestrini), Hypoaspis miles (Berlese),
Phytoseiulus persimilis Athias-Henriot Semi-field Phytoseiulus persimilis, Amblyseius californicus (McGregor) Field Typhlodromus pyri, Kampimodromus aberrans (Oudemans),
Amblyseius andersoni Chant Laboratory (tier I) study A laboratory tier I study was conducted to investigate the intrinsic toxicity of spinosad to a representative sensitive predatory mite, T. pyri. A glass plate, open method based on that of Overmeer (1988) was used in this preliminary test. Each test unit consisted of a glass plate with a barrier of damp filter paper and a sticky non-toxic gel. Spinosad was applied at three rates of 40, 160 and 320 g a.i. /ha. A toxic reference treatment of dimethoate at 68 g a.i./ha and water treated control were also included. When spray deposits had dried, each test unit was infested with 20 protonymphs and fed on pollen. Each treatment was replicated five times so that 100 mites were exposed. Mortality was assessed one and seven days after application (DAA). Extended laboratory studies These tests are characterised by the inclusion of a natural substrate in the test system. To investigate the compatibility of spinosad with A. cucumeris, H. aculeifer and H. miles in glasshouse biocontrol programmes, samples of these mites were obtained from a commercial supplier. The predator mites were packed and applied in a carrier (bran for A. cucumeris and peat / vermiculite for H. aculeifer and H. miles). In trials with A. cucumeris and H. aculeifer, 4g of product was placed in 9 cm diameter plastic Petri dishes and for H. miles 2 g of product was placed in 5 cm diameter tight fit Petri dishes. Prior to application the number of mites per dish (replicate) was counted. Each dish was sprayed with test solutions of spinosad at either 144 or 540 g a.i./ha. An untreated control and a toxic standard of dimethoate at 340 g a.i./ha was also included. The number of live mites per replicate was counted three days after application using a binocular microscope. Semi-field studies Two types of semi-field test were conducted under glasshouse conditions. Contact semi-field tests, where mites were exposed to fresh dry product residues were conducted with both P. persimilis and A. californicus. French bean plants approximately 20 cm tall were sprayed to the point of incipient run-off with test solutions of spinosad. In the P. persimilis test mites

11
were exposed to spray concentrations of 4.8, 9.6 and 19.2 g a.i./hL and in the test on A. californicus at 19.2 g a.i./hL only. An untreated control and a toxic standard of bifenthrin at 30 g a.i./ha was also included. When spray deposits had dried the plants were infested with Tetranychus urticae Koch as prey. The plants were trimmed to one leaf and five adult predators were placed on each leaf following the method of Sterk and Vanwetswinkel (1988). The number of live predators per plant was counted six days after application.
The direct spray semi-field test was conducted on P. persimilis where mites were present on the plants at the time of application and was based on the method described in OEPP/EPPO guideline No. 151 (Anon, 1990). Spinosad was applied to the point of incipient run-off at 9.6 and 36 g a.i./hL. An untreated control and a toxic reference treatment of dimethoate at 34 g a.i./hL was also included. Each treatment was replicated four times. One week after application 10 leaves were sampled from each replicate and the number of live predator mites and eggs counted. Field studies Spinosad was tested under field conditions on a range of mite species from several European countries. Applications were made under field conditions and mite populations were sampled before and at different times after application. Leaves were collected and the number of mites determined using a washing method. Three mite species were investigated, K. aberrans, A. andersoni and T. pyri. For K. aberrans the effect of a single application of spinosad was investigated in vines in France. One or two applications of spinosad on A. andersoni in orchards were studied in Italy. The effect of five applications on T. pyri in vines was studied in France. Spinosad was applied twice at 9.6 g a.i./ha on the 13th and 20th June 2001 and three times at 4.8 g a.i./hL on the 11th, 18th and 25th July. The effect of a drift rate as a percent of the field rate (2.37% for applications one and two and 6.59% for applications three to five) was also investigated. In Germany the effects of four applications on T. pyri at 14.4 g a.i./hL was investigated in an apple orchard. Applications were made on the 21st and 30th May 2001 and on 14th and 23rd August 2001. The effect of a drift rate as a percent of the field rate (23.61% for applications one and two and 10.12% for applications three and four) was also investigated. A water treated control and a toxic reference of methidathion was also included in both multiple application studies. A summary of test information for field trials with spinosad on predatory mites is given in Table 2. Classification of effects The effect of spinosad was categorised according to the IOBC (International Organisation for Biological and Integrated Control of Noxious Animal and Plants) classification (Hassan 1992) a described in Table 3. Table 3. IOBC (International Organisation for Biological and Integrated Control of Noxious
Animal and Plants) classification system for side effects of plant protection products to beneficial and non-target arthropods (Hassan 1992).
% Effect observed Classification
Laboratory studies All other studies * Class 1 Harmless <30% <25% Class 2 Slightly Harmful 30 – 79% 25 – 50% Class 3 Moderately Harmful 80 – 98% 51 – 75% Class 4 Harmful >99% >75%
Note: *Study types are extended laboratory, semi-field and field tests.

9
Table 2. Summary of test information for field trials with spinosad on predatory mites. For a description of application rates and reference
treatments see text.
Test species No. replicates
Plot size
No leaves sampled
/plot
Pre-treatment sample 3
No. applications
Crop Country Year Guidelines 4
Kampimodromus aberans
4 10 vines
25 2DBA 1 Vines France 1998 Kreiter & Sentenac 1993
Amblyseius andersoni
4 4 trees 30 0 DBA 1 Apples Italy 1999 ---
Amblyseius andersoni
4 24 trees
30 3 DBA 2 Apples Italy 1998 ---
Typhlodromus pyri
4 10-12 vines
25 15DBA 1 Vines France 1996 Kreiter & Sentenac 1993
Typhlodromus pyri
5 15 vines
30 - 50 1 3DBA 5 Vines France 2000 Blümel et al 2000
Typhlodromus pyri
5 8 trees 100 2 4DBA 4 Apples Germany 2000 Blümel et al 2000
Notes: 1 For the pre-treatment sample and the first four samplings 30 leaves were taken. At samples five and six 50 leaves were assessed.
2 Only 100 leaves were taken at samplings after application, the pre-treatment sampling was of 200 leaves. 3 DBA = Days Before the first Application was applied. 4 Where no specific guideline is given the study was conducted to IOBC principles.
12
13
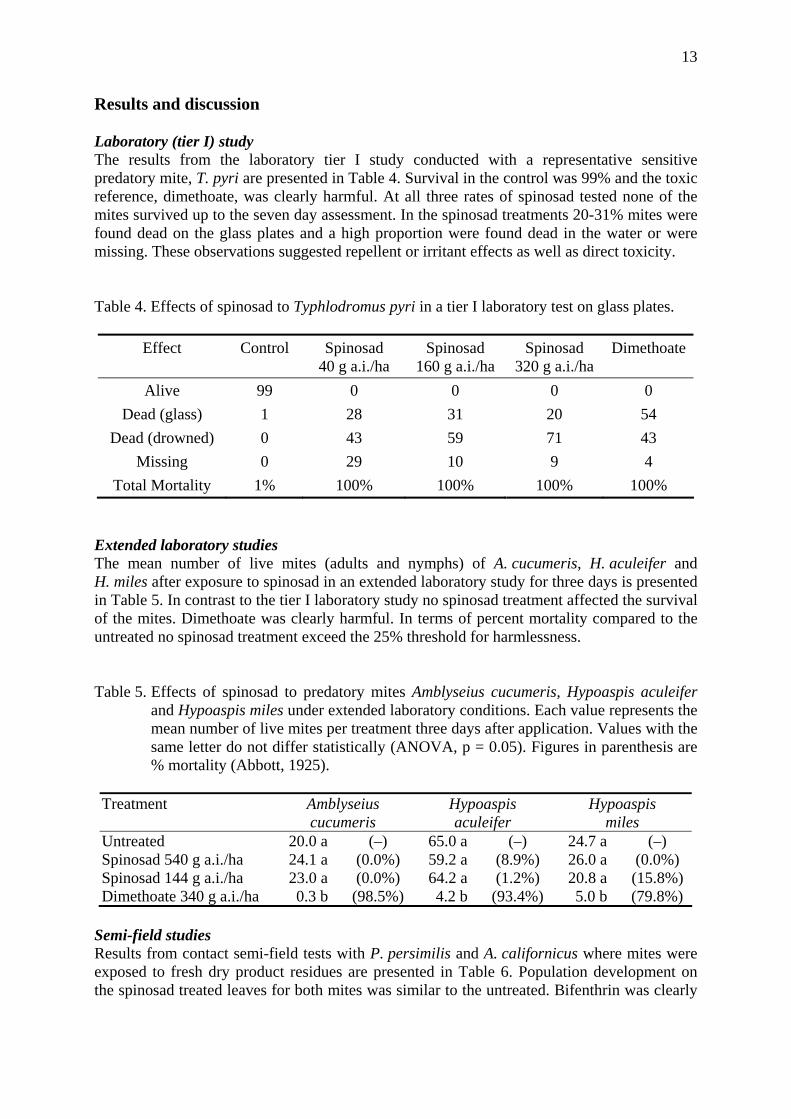
Results and discussion Laboratory (tier I) study The results from the laboratory tier I study conducted with a representative sensitive predatory mite, T. pyri are presented in Table 4. Survival in the control was 99% and the toxic reference, dimethoate, was clearly harmful. At all three rates of spinosad tested none of the mites survived up to the seven day assessment. In the spinosad treatments 20-31% mites were found dead on the glass plates and a high proportion were found dead in the water or were missing. These observations suggested repellent or irritant effects as well as direct toxicity. Table 4. Effects of spinosad to Typhlodromus pyri in a tier I laboratory test on glass plates.
Effect Control Spinosad 40 g a.i./ha
Spinosad 160 g a.i./ha
Spinosad 320 g a.i./ha
Dimethoate
Alive 99 0 0 0 0 Dead (glass) 1 28 31 20 54
Dead (drowned) 0 43 59 71 43 Missing 0 29 10 9 4
Total Mortality 1% 100% 100% 100% 100% Extended laboratory studies The mean number of live mites (adults and nymphs) of A. cucumeris, H. aculeifer and H. miles after exposure to spinosad in an extended laboratory study for three days is presented in Table 5. In contrast to the tier I laboratory study no spinosad treatment affected the survival of the mites. Dimethoate was clearly harmful. In terms of percent mortality compared to the untreated no spinosad treatment exceed the 25% threshold for harmlessness. Table 5. Effects of spinosad to predatory mites Amblyseius cucumeris, Hypoaspis aculeifer
and Hypoaspis miles under extended laboratory conditions. Each value represents the mean number of live mites per treatment three days after application. Values with the same letter do not differ statistically (ANOVA, p = 0.05). Figures in parenthesis are % mortality (Abbott, 1925).
Treatment Amblyseius
cucumeris Hypoaspis aculeifer
Hypoaspis miles
Untreated 20.0 a (–) 65.0 a (–) 24.7 a (–) Spinosad 540 g a.i./ha 24.1 a (0.0%) 59.2 a (8.9%) 26.0 a (0.0%) Spinosad 144 g a.i./ha 23.0 a (0.0%) 64.2 a (1.2%) 20.8 a (15.8%) Dimethoate 340 g a.i./ha 0.3 b (98.5%) 4.2 b (93.4%) 5.0 b (79.8%)
Semi-field studies Results from contact semi-field tests with P. persimilis and A. californicus where mites were exposed to fresh dry product residues are presented in Table 6. Population development on the spinosad treated leaves for both mites was similar to the untreated. Bifenthrin was clearly

14
harmful killing all mites. In terms of percent mortality compared to the untreated no spinosad treatment exceed the 25% threshold for harmlessness.
Results from the direct spray test with P. persimilis are presented graphically in Figures 1 and 2. No statistically significant differences (ANOVA, p = 0.05) were noted after treatment with spinosad at 9.6 or 36 g a.i./ha on either the predatory mite or egg populations. Dimethoate at 34 g a.i./hL was clearly toxic significantly reducing the numbers of both mites and eggs. Table 6. Effects of spinosad to predatory mites Phytoseiulus persimilis and Amblyseius
californicus under semi-field conditions (contact test). Each value represents the mean number of live mites per treatment six days after application. Values with the same letter do not differ statistically (ANOVA, p = 0.05). Figures in parenthesis are % mortality (Abbott, 1925).
Treatment Phytoseiulus persimilis Amblyseius californicus Untreated 27 a (–) 40 a (–) Spinosad 4.8 g a.i./hL 32 a (0.0%) NT Spinosad 9.6 g a.i./hL 26 a (3.7%) NT Spinosad 19.2 g a.i./hL 33 a (0.0%) 47 a (0.0%) Bifenthrin 30 g a.i./hL 0.0 b (100%) 0.0 b (100%)
Note: NT = rate not tested
0
1
2
3
4
5
6
Untreated Spinosad at 9.6gai/hL
Spinosad at 36gai/hL
Dimethoate
No.
mite
s/le
af
a
a
a
b
Fig. 1. Effects of spinosad to the predatory mite Phytoseiulus persimilis under semi-field
conditions (direct spray test). Each bar represents the mean number of live mites per leaf in each replicate seven days after application. Bars with the same letter do not differ statistically (ANOVA, p = 0.05).

15
0
1
2
3
4
5
6
Untreated Spinosad at 9.6gai/hL
Spinosad at 36gai/hL
Dimethoate
No.
egg
s/le
afa
a
a
b
Fig. 2. Effects of spinosad to the predatory mite Phytoseiulus persimilis under semi-field
conditions (direct spray test). Each bar represents the mean number of eggs per leaf for replicate seven days after application. Bars with the same letter do not differ statistically (ANOVA, p = 0.05).
Field studies The effects of a single application of spinosad at 48 g a.i./ha to K. aberrans was investigated in vines in France (Figure 3). The selectivity and effects of a range of other products was also included. Mite populations reached a peak around 21 days after application for all treatments except deltamethrin at 12.5 g a.s./ha. By 58 days after application the mite populations in all treatments had declined. A maximal reduction in the spinosad treated plots of 21.1% was observed 15 days after application whereas deltamethrin was harmful causing 72.9% effect after 8 days and 100% effect by the end of the trial.
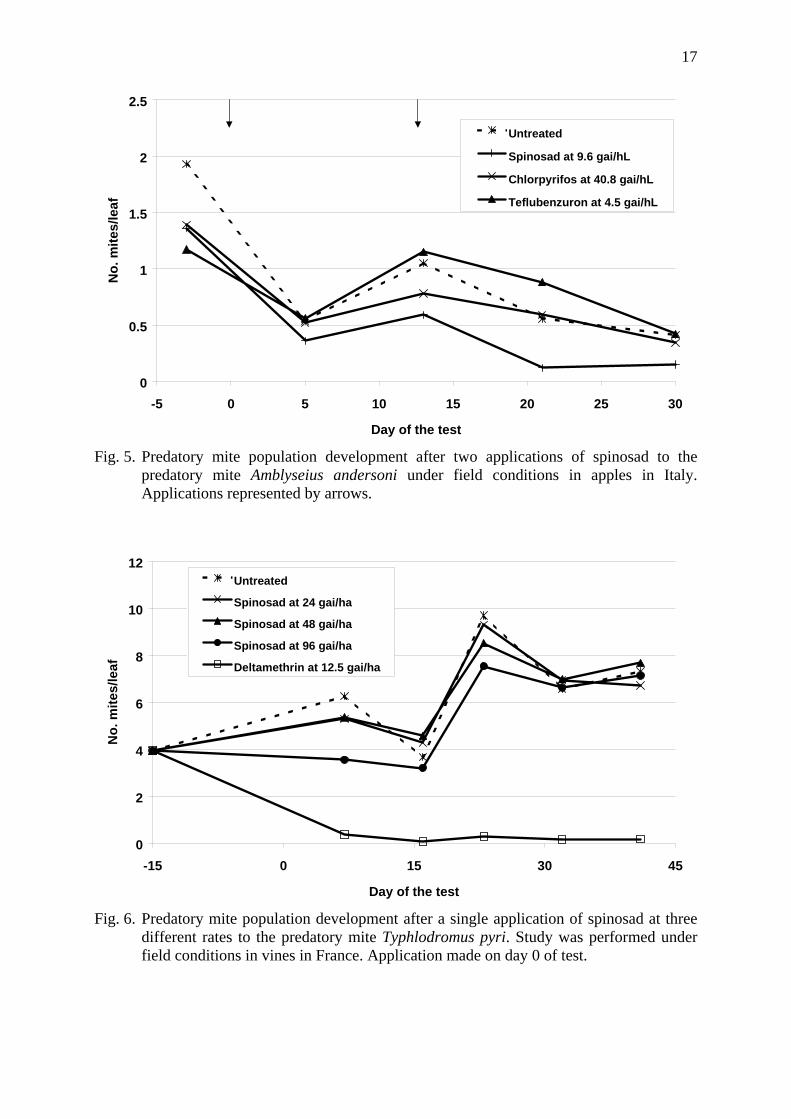
Spinosad was tested in apples in Italy on A. andersoni. The effects of spinosad applied at either 4.8 or 9.6 g a.i./hL is presented in Figure 4. The lower rate had no effect on mite populations however the higher rate caused up to 40.7% reduction in mite numbers 17 days after application. Before application mite populations were between 3.57 and 5.19 mites per leaf and declined throughout the trial to less than one per leaf. The trial was not continued past 17 days after application due to low mite numbers so it was not possible to observe population recovery rate after this time. Chlorpyrifos-methyl (44.2 g a.i./hL) had limited effects on the mites suggesting that the population was resistant to organophosphate insecticides. The selectivity of diflubenzuron (62.5 g a.i./hL) was confirmed. A single application of spinosad was selective to A. andersoni however, due to decline in mite numbers and absence of a harmful reference, the findings from this study should be treated with caution. When two applications of spinosad were applied at 9.6 g a.i./hL (Figure 5) a small reduction in mite numbers was noted (33% and 43.5% effect eight and 13 days after application) which is in agreement with the previous study. However after a second application 75% effect was seen eight days later. The trial was not continued past 17 days after the second application. The declining mite population in all treatments and the absence of a harmful reference suggest that findings from this study should be treated with caution but

16
0
0.5
1
1.5
2
2.5
-10 0 10 20 30 40 50 60
Day of the test
No.
mite
s/le
afUntreated
Spinosad at 48 gai/ha
Fenoxycarb at 150 gai/ha
Chlorpyrifos at 338 gai/ha
Deltamethrin at 12.5 gai/ha
Fig. 3. Predatory mite population development after a single application of spinosad to the
predatory mite Kampimodromus aberrans under field conditions in vines in France. Application made on day 0 of test.
0
1
2
3
4
5
6
0 2 4 6 8 10 12 14 16 18
Day of the test
No.
mite
s/le
af
Untreated
Spinosad at 4.8 gai/hL
Spinosad at 9.6 gai/hL
Chlorpyrifos-methyl at 44.2 gai/hL
Diflubenzuron at 62.5 gai/hL
Fig. 4. Predatory mite population development after a single application of spinosad to the
predatory mite Amblyseius andersoni under field conditions in apples in Italy. Application made on day 0 of test.
17
0
0.5
1
1.5
2
2.5
-5 0 5 10 15 20 25 30
Day of the test
No.
mite
s/le
afUntreated
Spinosad at 9.6 gai/hL
Chlorpyrifos at 40.8 gai/hL
Teflubenzuron at 4.5 gai/hL
Fig. 5. Predatory mite population development after two applications of spinosad to the
predatory mite Amblyseius andersoni under field conditions in apples in Italy. Applications represented by arrows.
0
2
4
6
8
10
12
-15 0 15 30 45
Day of the test
No.
mite
s/le
af
Untreated
Spinosad at 24 gai/ha
Spinosad at 48 gai/ha
Spinosad at 96 gai/ha
Deltamethrin at 12.5 gai/ha
Fig. 6. Predatory mite population development after a single application of spinosad at three
different rates to the predatory mite Typhlodromus pyri. Study was performed under field conditions in vines in France. Application made on day 0 of test.

18
0
1
2
3
4
-7 0 7 14 21 28 35 42 49 56 63 70 77
Day of the test
No.
mite
s/le
af
Untreated
Spinosad drift rate
Spinosad field rate (5 appls.)
Methidathion
Fig. 7. Predatory mite population development after five applications of spinosad to the
predatory mite Typhlodromus pyri under field conditions in vines in France. See text for explanation of treatments. Applications represented by arrows.
0
1
2
3
4
5
-7 0 7 14 21 28 35 42 49 56 63 70 77 84 91 98 105 112 119 126
Day of the test
No.
mite
s/le
af
UntreatedSpinosad drift rateSpinosad field rate (4 appls.)Methidathion
Fig. 8. Predatory mite population development after four applications of spinosad to the
predatory mite Typhlodromus pyri under field conditions in apples in Germany. See text for explanation of treatments. Applications represented by arrows.

19
indicate that two applications of spinosad at 9.6 g a.i./hL may cause reductions in mite populations for A. andersoni.
A range of rates (24, 48 and 96 g a.i./ha) were tested against T. pyri in vines in France (Figure 6). Spinosad at the lower two rates was harmless to populations of T.pyri where maximal effects of 15% at 24 g a.i./ha and 14% at 48 g a.i./ha were observed seven days after application. The highest rate of 96 g a.i./ha caused a maximum reduction of 43% seven days after application. At subsequent assessments the mite population showed a strong recovery in this treatment returning to control levels 16 days after application. Deltamethrin at 12.5 g a.i./ha was clearly harmful giving a 60% reduction after seven days and a 98% reduction 41 days after application. When applied in a series of sprays spinosad was safe to T. pyri in both vines (five applications) and apples (four applications) when applied at field rates or drift rates (Figures 7 and 8). In vines maximum reductions of 12.6% and 28.5% were seen after five applications of the drift and field rates respectively. In apples, four applications of a drift rate caused a maximum reduction of 34.1% with four applications of the field rate appearing to have lesser effect (maximum reduction of 7.1%). In both multiple application scenarios the toxic reference (methidathion) caused clear harmful effects. These findings are in agreement with other studies in top fruit on spinosad (Bylemans & Schoonejans 2000). Conclusions It was concluded that spinosad was highly selective to most predatory mite species and that effects noted in tier I laboratory studies did not translate to higher tiers of testing or use in the field. The exception to this was A. andersoni which was sensitive under field conditions to more than one application of spinosad per season. The reason for this is not clear but could be due to agronomic practice, difference in species sensitivity, sublethal or behavioural effects or even effects on prey. However use patterns safe to predatory mites and compatible with IPM have been developed for spinosad in a wide range of crops. A summary of the effects of spinosad to predatory mites in laboratory, extended laboratory, semi-field and field studies is given in Table 7. Table 7. Summary of the effects of spinosad to predatory mites in laboratory, extended
laboratory, semi-field and field tests. Classifications follow those of the IOBC (Hassan, 1992)
Test Type
Species Rate (s) Classification
Laboratory Typhlodromus pyri 40, 160, 320 gai/ha Harmful Amblyseius cucumeris 144, 540 gai/ha Harmless Hypoaspis aculeifer 144, 540 gai/ha Harmless
Extended laboratory
Hypoaspis miles 144, 540 gai/ha Harmless Semi-field Amblyseius californicus 19.2 gai/hL Harmless Phytoseiulus persimilis 9.6, 19.2 , 36 gai/hL Harmless Field Kampimodromus aberrans 48 gai/ha Harmless Typhlodromus pyri 24, 48, 96 gai/ha Harmless Typhlodromus pyri 2 x 9.6 + 3 x 4.8 gai/hL Harmless Typhlodromus pyri 4 x 14.4 gai/hL Harmless Amblyseius andersoni 4.8 gai/hL Harmless Amblyseius andersoni 2 x 9.6 gai/hL Harmful

20
References Abbott, W.S., 1925: A method of computing the effectiveness of an insecticide. Journal of
Economic Entomology 18: 265-267. Anon, 1990: Guideline for the evaluation of side-effects of plant protection products
Phytseiulus persimilis. Bulletin OEPP/EPPO Bulletin 20: 531-550. Blümel, S., Aldershof, S., Bakker, F., Baier, B., Boller, E, Brown, K, Bylemans, D., Candolfi,
M.P., Huber, B., Linder, C. Louis, F. Müther, J., Nienstedt, K.M., Oberwalder, C., Reber, B., Schirra, K.J., Ufer, A. and & Vogt, H., 2000: Guidance document to detect side effects of plant protection products on predatory mites (Acari: Phytoseiidae) under field conditions: vineyards and orchards. In: Candolfi, M. P., Blümel, S., Forster, R., Bakker, F.M., Grimm, C., Hassan, S.A., Heimbach, U., Mead-Briggs, M.A., Reber, B., Schmuck, R. and Vogt, H. (eds.) 2000: Guidelines to evaluate side-effects of plant protection products to non-target arthropods. IOBC/wprs, Gent, 145-158.
Bylemans, D. & Schoonejans, T. 2000: Spinosad, a useful tool for insect control in top fruit. BCPC Conf. Pests Dis. (2000). 1: 33-40.
Hassan, S.A., 1992: Guidelines for testing the effects of pesticides on beneficial organisms: Description of test methods. Pesticides and Beneficial Organisms IOBC/wprs Bulletin. 15(3): 1-3.
Kreiter, S. & Sentenac, G., 1993: Méthode d'étude des effets non intentionnels à moyen terme sur les phytoseiidae (typhlodromes)de la vigne des produits phytopharmaceutiques utilisés en traitement des parties aériennes. Commission des essais biologiques (CEB) Méthode: 167 Methodes Insecticides - Acaricides: Vigne.
Overmeer, W.P.J., 1988: Laboratory method for testing side-effects of pesticides on the predacious mites Typhldromus pyri and Amblyseius potentillae (Acarina: Phytoseiidae). IOBC/wprs Bulletin 11(4): 65-69.
Sterk, G. & Vanwetswinkel, G., 1988: A semi-field method for testing the side-effects on the predatory mite Phytoseiulus persimilis A.H. (Phytoseiidae, Acari). IOBC/wprs Bulletin 11(4): 135-136.
Thompson, G.D., Michel, K.H., Yao, R.C., Mynderse, J.S., Mosburg, C.T., Worden, T.V., Chio, E.H., Sparks, T.C. & Hutchins, S.H. 1997: The discovery of Saccharopolyspora spinosa and new class of insect control products. Down to Earth 52(1): 1-5. Dow AgroSciences.

Pesticides and Beneficial Organisms IOBC/wprs Bulletin Vol. 26 (5) 2003
pp. 21 - 24
21
Side effects of pesticides used in cotton and vineyard areas of Aegean Region on the green lacewing, Chrysoperla carnea (Steph.) (Neuroptera: Chrysopidae), in the laboratory Bilgin Güven & M. Ali Göven Bornova Plant Protection Research Institute, Gençlik Street 6, 35040, Izmir, Turkey Abstract: The side-effects of pesticides widespread used in cotton and vineyard areas of Aegean Region on the predator Chrysoperla carnea (Steph.) were studied under laboratory conditions between 1999-2001. The tests were performed according to the standard laboratory, initial toxicity test method of the IOBC/WPRS working group “Pesticides and Beneficial Organisms”. As a result of these tests Ekalux (a.i. Quinalphos), Afidrex (a.i. Dimethoate), Korvin (a.i. Carbaryl), Deltanet (a.i. Furathiocarb), Lannate Insecticide (a.i. Methomyl), Flambo (a.i. Profenofos+Cypermethrin) and Zipak (a.i. Bifenthrin+Amitraz) showed high toxicity resulting in a death rate of 100% and Cascade (a.i. Flufenuxuron) causing a death rate of 93%; with Karate Zeon (a.i. Lambda-cyhalothrin) and Rubigan (a.i. Fenarimol) the death rate was 58,3% and 45%, respectivley; Ridomil (a.i. Mancozeb+Metalaxyl), Meteor (a.i. Fenpyroximate) and Thiovit (a.i. Micronize sulphur) revealed low toxicity and caused a mortality of 25%, 20,8% and 13 %, respectively. Reproductive performance was not affected by all insecticides causing lower mortalilies. Key words: Chrysoperla carnea, pesticides, side-effects, laboratory Introduction In Turkey the largest vineyard growing area is in the Aegean region. The production from 151.496 hectare during 1996-1997 was 200.000.000 tons raisin and the main part of this production was exported (Anonymous, 1997). Also according to 1996 data our region is the secondmost important cotton producer following Mediterranean region (Anonymous, 1996). Due to high toxicity of pesticides and the frequency of applications, the natural predator populations in cotton and vineyard areas in many regions world wide have seriously been reduced. For the purpose to protect natural enemies, side-effects of pesticides on beneficials have to be determined. Chrysoperla species long have been considered as important naturally occuring predators in many agricultural cropping systems. Our purpose is to determine the side-effects of pesticides widespread used in cotton and vineyards on C. carnea and to select in this way the more suitable pesticides for use in areas under IPM programs. Material and methods The side-effects of 13 pesticides (10 insecticides and 3 fungicides) used in cotton and vineyard areas of Aegean Region on the predator Chrysoperla carnea (Steph.) were tested under laboratory conditions (see Table 1). The side-effect tests were performed according to the standard laboratory, initial toxicity test method (susceptible life stage) described by Bigler (1988) and on the test method characteristics defined by (Vogt et al., 2000). The IOBC classification is based on the mortality values as indicated by Hassan (1994).

22
Insect rearing Adults of C. carnea were collected from vineyard and cotton areas of Aegean Region and later were sent for identification (Colin Plant Associates (UK) Consultant Entomologists Editor, Entomologist's Record & Journal of Variation).
The adults of C. carnea were reared in the laboratory on an artificial diet consisting of 7 parts of honey, 4 parts of brewer’s yeast and 4 parts of water (simple diet) (Bigler, 1988). Larvae were fed with Ephestia küehniella Zell. in respect to Kaya and Öncüer (1988). Climatic conditions for the rearing were: 22±1°C, 70% rel. humidity and 16 hrs neon day-light. Ephestia küehniella Zell., were reared at the same conditions in an artificial diet consisting of ¼ corn flour, 2/4 wheat flour and ¼ beaten pistachio nut in plexiglass cages as to Tunçyürek (1972). Table 1. Pesticides tested on C. carnea in the laboratory during 2000-2001
Active ingredient Trade name Pesticide rate (formulated product) per
ha
Mode of action
Vineyard
Fenarimol, 120 g/l Rubigan 12 EC 30 ml systemic Sulphur 80% Thiovit 800 g contact Mancozeb, 64%+Metalaxyl, 8% Ridomil MZ 72 WP 500 g systemic protector Fenpyroximate, 50 g/l Meteor SC 150 ml contact Flufenuxuron, 50 g/l Cascade 50 DC 200 ml contact and stomach (IGR)Quinalphos, 250 g/l Ekalux 1250 ml contact and stomach Lambda-Cyhalothrin, 50 g/l Karate Zeon 1500 g contact and stomach Methomyl, 200 g/l Lannate Insecticide 20 800 g contact and stomach
Cotton Carbaryl, 85% Korvin 85% 2000 g contact and stomach Dimethoate, 400 g/l Afidrex 45% 1000 ml contact and stomach Profenofos, 40 g/l + Cypermethrin, 40 g/l Flambo 440 EC 2500 ml contact and stomach
Bifenthrin, 25 g/l +Amitraz, 200 g/l Zipak EC 225 3000 ml contact
Furathiocarb, 400 g/l Deltanet 750 ml contact and stomach Test units and number of replicates One test unit consists of a glass plate of 30 x 15 cm with the pesticide sprayed on one surface. The glass plate with the dried pesticide film was covered with a plexiglass plate with 30 holes, each 2.5 cm in diameter and fastened down with clips. Polystyrol rings (0.8 cm height) were treated with Tangle-trap (sticky compound for insects) as a barrier to prevent the larvae from escaping. The effect of each pesticide was measured by including 30 larvae, held individually, per treatment.

23
Application of pesticides The glass plates were sprayed with the pesticide solutions by using a little hand sprayer with adjustable angle full cone spray type (0.2 mm nozzle orifice, at the pressure of 1.5 atm.) to achieve a spray deposit of 2 mg fluid/cm2. The pestides were tested with the rates as indicated in Table 1. Dimethoate 400g a.i./l EC was used as a reference item. Glass plates were weighed before and after application to ensure the deposit amount of 2 mg fluid/cm². Plexiglass plates were put on the glass plates with dried pesticide film and two days old larvae were added seperately into the rings. Recording of the preadult mortality (larval and pupal mortality) Dead larvae were recorded daily and the pupal mortality was added to the total of dead larvae at the end. Thus, preadult mortality due to the residual action of the pesticide was obtained. The absolute values were corrected with the values observed in the control according to (Abbott, 1925). Recording of the fecundity and fertility Shortly before emergence, the pupae of the test insects were removed from the test units and transfered into a rearing cage (18 cm in diameter and at 20 cm height). In this way, the adults obtained from larvae of treated units were not exposed to pesticides during the assessment of their fertility and fecundity. Nylon gauze placed under the cover of the cage was suitable for C. carnea egg laying. Water was supplied with a wet plug of cotton and the adults were fed with an artificial diet consisting of 7 parts of honey, 4 parts of brewer’s yeast and 4 parts of water (simple diet) (Bigler, 1988). Egg samples were taken twice a week over a 24 hrs period each. The average egg production per female was calculated taking into account the female mortality during the observation intervals. The average number of eggs laid per female lacewing per day was determined by dividing the total number of eggs laid by the average number of viable females in that group. Results According to the effects on pre-adult stages of C. carnea the pesticides can be divided into two groups. Pesticides in the first group resulted in high mortalities of pre-adult stages (Table 2), pesticides in the second group resulted in low to medium mortalities and did not affect fecundity or fertility of the survivors (Table 3). Furthermore, as to the validity criteria, in all tests, the mortality in the control was below the agreed maximum acceptable value and the Table 2. Pesticides revealing a high toxicity on C. carnea with glass plate test
Active ingredient Preadult Mortality(%) (Abbott correction) IOBC class
Carbaryl 100 4 Dimethoate 100 4 Profenofos+Cypermethrin 100 4 Bifenthrin+Amitraz 100 4 Furathiocarb 99 4 Quinalphos 100 4 Methomyl 100 4 Flufenuxuron 93 3

24
Table 3. Pesticides revealing a low toxicity on C. carnea with glass plate test
Active ingredient
Preadult Mortality(%)
(Abbott correction)
Fecundity (eggs per female
per day)
Fertility (%) (mean hatching
rate of eggs)
IOBC class
Lambda-Cyhalothrin 58.3 16.0 93.7 2 Fenarimol 45.0 20.0 90.0 2 Mancozeb+Metalaxyl 25.0 19.1 90.5 1 Fenpyroximate 20.8 25.0 92.5 1 Sulphur 13.0 19.7 91.3 1
level of mortality in the reference item treatment was above 50% (Vogt et al. 2000). According to the IOBC testing scheme, the pesticides from the first group need futher testing in higher testing tiers, e.g. in the semi-field (Hassan, 1985). The second group of pesticides can be taken into consideration in areas under IPM programs. References Abbott, W.S. 1925: A method of computing the effectiveness of an insecticide. J. Econ.
Entomol. 18, 265-267. Anonymous, 1996. Cotton: Review of the world Situation, May-June. Anonymous, 1997. Türkiye Istatistik Yilligi 1996. T.C. Başbakanlık İstatistik Enstitüsü.
Yayin No : 2110, DİE Matbaası, Ankara, ISBN 975-19-1942-8: 58 pp. Bigler, F., 1988. A laboratory method for testing side-effects of pesticides on larvae of the
green lacewing, Chrysoperla carnea (Steph) (Neuroptera: Chrysopidae). IOBC/wprs Bulletin 11(4): 127-134.
Hassan, S.A., 1985. Standard methods to test side-effects of pesticides on natural enemies of insects and mites developed by the IOBC/WPRS Working Group ”Pesticides and Beneficial Organisms” Bulletin OEPP/EPPO 15: 214-255.
Hassan, 1994: Activities of the IOBC/WPRS Working Group "Pesticides and Beneficial Organisms". IOBC/WPRS Bulletin 17 (10), 1-5.
Kaya, Ü. and C. Öncüer, 1988. Laboratuvarda üretilen Chrysoperla carnea (Steph) (Neuro-ptera: Chrysopidae) ’nin biyolojisine farkli iki besinin etkisi üzerinde bir araştirma. Türkiye Entomoloji Dergisi 12(3): 151-159.
Tunçyürek, C.M., 1972. Bracon hebetor Say. (Hym.: Braconidae) ile Cadra cautella (Walk) ve Anagasta kuehniella (Zeller) (Lep.: Pyralidae) ’ya karşi biyolojik savaş imkanlari üzerinde araştirmalar. Tar.Bak.Zir.Müc. ve Zir. Kar.Gn. Md. Araş. Es.Serisi. Teknik Bülten No. 20. Zir. Müc.Arşt.Enst. İzmir, 78 s.
Vogt, H., Bigler, F., Brown, K., Candolfi, M.P., Blümel, S., Kemmeter, F., Kühner, Ch., Moll, M., Travis, A., Ufer, A., Vinuela, E., Waldburger, M. and Waltersdorfer, A., 2000. Laboratory method to test effects of plant protection products on larvae of Chrysoperla carnea (Neuroptera: Chrysopidae). In: Candolfi et al. (eds.): Guidelines to evaluate side-effects of plant protection products to non-target arthropods. IOBC/WPRS, Gent, 27-44.

Pesticides and Beneficial Organisms IOBC/wprs Bulletin Vol. 26 (5) 2003
pp. 25 - 32
25
Lab studies with Trichilia havanensis Jacq., a botanical pesticide, and adults of Chrysoperla carnea (Stephens)
Arturo Huerta1, Pilar Medina1, Pedro Castañera2 & Elisa Viñuela1
1 Protección de Cultivos. E.T.S.I. Agrónomos. E-28040-Madrid, Spain 2 Laboratorio de Biología de Plantas. CIB. Velázquez 144. E-28006-Madrid, Spain Abstract: Side-effects of the Meliacea tree Trichilia havanensis Jacq. have been investigated on the predator Chrysoperla carnea (Stephens). Adults of the chrysopid (<24-h-old) were fed ad libitum continuously the ground seeds or the aqueous extract in the solid diet at rates from 1 to 10%. In both cases there was an inhibition or decrease of fecundity at any rate, and ground seeds were more effective than the aqueous extracts, because they also caused a 100% mortality at the rate of 10%. In a second set of assays, adults of two different ages, <24-h-old (pre-oviposition) and 10-d-old (post-oviposition) were offered ad libitum for five days, treated water with the limonoids azadirone (F12) or the mixture F18 (1,7+3,7-di-0-acethylhavanensin (4:1)) at a rate of 1000 ppm (it had shown high effectiveness against some pests in previous assays). No effect on mortality was recorded, but fecundity was decreased when only old adults drank the treated water. Key words: Trichilia havanensis, botanical pesticide, Chrysoperla carnea, side effects, adults Introduction Adverse environmental contamination effects on nontarget organisms and the build up of resistance, among other problems caused by the abuse of pesticides, have led to the search of more environmental friendly tactics of insect control. In this scenario, the use of plant-derived pesticides is under focus, because the importance of plant secondary metabolites is known in host choice (Bernays, 2000).
At present, more than 100.000 secondary substances with at least 30.000 different chemical structures, have been identified in more than 2.000 species of plants (Harborne, 1982; Balandrín et al., 1985; Schoonhoven et al., 1998).
Among the compounds subjected to considerable study are limonoids (tetranortriter-penes) from the Meliaceae family, because they possess a wide range of biological activities, including insect antifeedant and growth regulator properties (Arnason et al., 2002). The antifeedant activity is produced by affecting chemosensory mouthparts (deterrent effect) and other tissues and organs; the developmental effects appear to be due to the disruption of ecdysteroid and juvenile hormone titres through the blockage of morphogenetic peptide hormones (Banken & Stark, 1997). One of these limonoids, azadirachtin, first isolated from the seed kernels of Azadirachta indica A. Juss, has undergone commercial development. Insecticides based on azadirachtin have been registered and are being used in modern crop protection systems such as Integrated Production (IP) all over the world (Boller et al, 1999), because of their selectivity and short persistence in ecosystems (see review by López-Olguín et al., 2002).
Other limonoids such as trichilids, obtained from the tree Trichilia havanensis Jacq are also under focus because in one of its native areas, Mexico, indians use its fruit powders to protect maize seeds from the attack of soil insect pests, birds and rodents when sowing, and its leaves to protect the stored grains (Lagunes, 1993; López-Olguín, 1998). Among the

26
limonoids characterised from this tree, azadirone (F12) and the mixture 1,7 and 3,7-di-O-acetylhavanensin (F18) have shown a strong antifeedant activity against some important pests: Spodoptera littoralis (Boisduval) (López-Olguín et al., 1997), Helicoverpa armigera (Hübner) (López-Olguín et al., 1998), Ceratitis capitata (Wied.) (López-Olguín et al., 2002) or Leptinotarsa decemlineata L. (Ortego et al., 1998).
However, in the commonest used strategy of integrated Pest Management (IPM) nowadays, the joint use of biological and selective chemical control, it is clear that the knowledge of the activity of insecticides towards the pests, the non-targets insects and the environment, including humans is a necessity.
Among the important naturally occurring predators in many horticultural and agricultural cropping systems, is Chrysoperla carnea (Stephens) (Neuroptera: Chrysopidae) (Canard et al. 1984). Currently, it is one of the most commonly used and commercially available natural enemies (Tauber et al. 2000). Moreover, C. carnea has been selected as one of the proposed beneficial test species for regulatory requirements in the European Union (Candolfi et al., 2001).
In the current study, we evaluated effects of feeding C. carnea adults on T. havanensis in the diet or drinking places : ground seeds, aqueous extracts or the two acetone fractions that previously showed effects on pests. The aim was increasing our knowledge on selectivity of Meliaceae plants, considered promising alternatives to be used in sustainable crop production systems such as IP and others.
Material and methods Plants T. havanensis seeds obtained from fruits harvested in Puebla State (Mexico) in 2001 were used in the assays. Seeds were separated from pericard and ground in an electrical mill (Taurus®). Insects Adults and larvae of the predator were routinely reared in our Crop Protection laboratory, at 25 0 C± 20 C temperature, 75±5 r.h. and a photoperiod of 16 h light. Adults were fed the artificial diet described by Vogt et al. (2000) and larvae were fed on Sitotroga cerealella (Oliver) eggs, ad libitum. Adults were also provided with water in glass containers similar to those described by Budia & Viñuela (1996) because for a successful development they need to drink at least once in four days after emergence (Medina et al., 2003). Treatments Experiments consisted of 4 to 6 replicates of 3 pairs of adults per concentration level and control. Depending on the assay, adults <24-h (pre-oviposition) and/or 10-d-old (post-oviposition) were selected from the routinely mass rearing for the tests. Initially, only <24-h-old C. carnea adults were used, because this age is in general very sensitive to pesticides.
Three different types of assays were done, and the insecticide was offered to adults ad libitum in the diet or in the drinking places: (1) Ground seeds; adults < 24-h-old (2) Aqueous extracts; adults <24-h-old; (3) Acetonic fractions; adults <24-h and 10-d-old.
During experiments, adults were maintained in ventilated plastic cages (11 cm in diam, 5 cm high) under the same environmental conditions described above for the rearing, fed the artificial diet hand brushed in the walls, and provided with water (Medina et al., 2001). Food and water were replaced every third day if needed.

27
Ground seeds Concentrations of 1, 5 and 10% of ground seeds from T. havanensis were added directly to the adult diet and mixed thoroughly with the rest of ingredients before being offered to <24-h-old adults for 17-days. Aqueous extracts Concentrations of 1, 5 and 10% of ground seeds were diluted in distilled water for 2h, filtered, and the broth added instead of pure distilled water to the rest of components of the adult diet. In this case, a starved variant, with no food at all, was also included aiming at detecting the possible antifeedant effect of the extracts, because in the experiments with ground seeds, adults were never seen feeding the treated diet with the highest concentration (10%). The treated diet was offered to <-24-h-old adults continuously for 17 days. Acetone fractions The acetone fractions F12 (azadirone) and F18 were isolated from the seed kernels of T. havanensis as described by López-Olguín (1998). Seeds were subjected to continuous extraction by 12 h (Soxhlet®) and the resultant solution evaporated in a vacuum rotovator to obtain the acetone extracts, and subjected to chromatographic analysis in a silica gel column (Merck®) deactivated with 10% water w/v. The eluents used were n-hexane, n-hexane-ethyl acetate in different rates, and ethyl acetate pure. The chemical structure of the products was determined by comparison of their NMR (nuclear magnetic resonance) spectra, using a Hitachi U-2000 spectrophotometer.
Azadirone was purified to homogeneity and the fraction F18 to 95%. Fractions were diluted in distilled water using 1% acetonitrile, at a selected concentration of 1,000 ppm [it had shown good potency against some insect pests (López-Olguín, 1998)] and offered to adults in the drinking places. Young adults (<-24-h-old) were offered the treated water for 5 days (preovipostion period) and old adults (10-d-old) for the same period of time. Later on, adults of both ages, were offered untreated water for the rest of the observation period (17 days). Statistical analysis The studied parameters were: mortality, fecundity and fertility. Daily mortality was monitored until the end of experiments, because in this period natural adult mortality is still low. The mean number of eggs per female and day laid in a 7 to 9-days period from the starting of the oviposition in <24-h-old adults or from the starting of treatment in 10-d-old ones, was used to study fecundity. To evaluate fertility, on two or three days from the start of oviposition (days 1 and 4, or 1-2-4, respectively), oviposition gauzes with eggs were collected and placed in plastic boxes with some S. cerealella eggs and several slips of filter paper folded in zigzag to prevent cannibalism among neonate larvae before being counted. The number of emerged larvae was evaluated 5-6 days later.
Data, presented as means±SD, were analysed by one-way analysis of variance (ANOVA) using Statgraphics (STSC, 1987). Means were separated by a least significant difference (LSD) multiple range test (P>0.05) and when the F from ANOVA was not significant, a Bonferroni test was applied. Results Ground seeds The ingestion of 10% ground seeds of T. havanensis by young adults of C. carnea gave already a significant increase of 29.2 % in mortality compared to controls from the second day of treatment, and this percentage reached the 100% on the fourth day. At the concentrations of 1 and 5% however, not any statistical significant differences were detected

28
during the observation period and six days after treatment, mortality was still as negligible as in controls (Table 1). Percentages of mortality remained very similar until the end of the experiment. Table 1. Cumulative mortality (%) when <24-h-old C. carnea adults fed ground seeds of T.
havanensis continuously for 17 days
Mortality at different time intervals Concentration (%) 3 d1 4 d2 5 d3 6 d4
0 0.00 ± 0.00 a 0.00 ± 0.00 a 0.00 ± 0.00 a 0.00 ± 0.00 a 1 4.16 ± 4,16 a 4.16 ± 4.16a 8.33 ± 4.81a 8.33 ± 4.81 a 5 4.16 ± 4.16 a 4.16 ± 4.16a 12.50 ± 7.97a 16.66 ± 11.78 a
10 66.66 ± 9.62 b 100 ± 0.00 b 100 ± 0.00 b 100 ± 0.00 b
Within the same column, data followed by the same letter are not statistically different (P>0.05) (ANOVA and LSD; P=0.00; df= 3,16) 1F=46.8 2F=393.44 3F=149.62 4F= 79.23.
At the highest concentration tested (10%), adults seemed to die from starvation because during the routinary observations they were never seen feeding on the diet. Affected adults exhibited low mobility, compressed abdomens laterally, and a lack of the reddish color in the abdomen due to the feeding on T. havanensis seeds, visible in treated insects with lower concentrations.
For adults fed on the treated diet since they were <24-h-old, the mean number of eggs per female and day was significantly decreased by 73.9% compared to controls, at the concentrations of 1% (4.57 and 16.36 eggs/female/day, respectively). At the concentration of 5% a total inhibition of oviposition was observed among female survivors. In contrast, no negative effects were observed on egg viability (Table 2). Table 2. Fecundity and fertility of female C. carnea when <24-h-old adults fed ground seeds
of T. havanensis continuously for 17 days
Concentration (%) Eggs/female/day1 Egg hatch2 (%) 0 16.36±2.78 a 82.34±2.94 a 1 4.57±0.86 b 79.91±4.27 a 5 0.00+0.00 b ----- 10 ----- -----
Within the same column, data followed by the same letter are not statistically different (P>0.05). 1 ANOVA and LSD; F=25,68; df=2,9; P=0.00. Eggs counted 7 days during a 9-days period from the starting of oviposition. 2ANOVA and Bonferroni; F=0.49; df=1,10; P= 0.50. Data are average of three different days (1,2 and 4 from the starting of egg laying). Aqueous extracts When adults of C. carnea were fed aqueous extracts of T. havanensis seeds continuously from emergence (17 days), mortality in treated units never surpassed 20,8 % and was equal to that of controls (Figure 1). Contrary to these results, the lack of food gave however a significant mortality from day 7th, reaching the 66.6% on day 7th, and the 100% on day 11th. In the rest

29
of treatments, at the end of the experiment, mortality never surpassed the 10.4, 16.6 and 20.8% at the concentrations of 1,5 and 10%, respectively.
Fig. 1. Cumulative mortality when <24-h-old adults of C. carnea fed aqueous extracts of T. havanensis seeds continuously from emergence (17 days)
Fecundity (Table 3) was totally inhibited at the concentration of 10%, even though adult survival was high. At the concentrations of 1 and 5%, the average fecundity (14.7 and 5.3 eggs/female/day, respectively) was significantly lower than in controls (23.4 eggs/female/ day). The eggs laid by treated females developed and hatched at the same rate as in controls at any of the studied concentrations where oviposition was not inhibited (Table 3). Table 3. Fecundity and fertility of female C. carnea when <24-h-old adults fed aqueous
extracts of T. havanensis seeds continuously for 17 days
Concentration (%) Eggs/female/day1 Egg hatch2 (%) 0 23.38+2.70a 86.54+1.93a 1 14.66+2.86b 86.49+1.05a 5 5.31+1.58c ------ 10 0.00+0.00c ------
Within the same column data followed by the same letter do not differ significantly (P>0.05). 1 ANOVA and LSD; F=23.75; df=3,20; P=0.00. Eggs counted 7 days during a 9-d period from the starting of oviposition. 2ANOVA and Bonferroni; F=0.00; df=1,10; P=0.98. Data are mean of three different days (1, 2 and 4 from the starting of egg laying). Acetone fractions The ingestion of acetone fractions for adults of different ages did not cause any effect on mortality, fecundity of fertility on those of <24-h-old when treated, and only significantly decreased fecundity on those fed azadirone (F12) when they were 10-d-old (Table 4).
0
20
40
60
80
100
1 3 5 7 9 11 13 15 17
Days
Mor
talit
y %
controlStarved1%5%10%

30
Discussion In this work we have tested effects of T. havanensis seeds on mortality and reproduction of C. carnea adults, because no data are available in literature on the insecticidal properties of this plant on beneficial insects, but only on its toxicity to some important lepidopterous, coleopterous and dipterous pests (López-Olguín et al., 1997, 1998, 2002; Ortego et al., 1998). Table 4. Effects of feeding acetone fractions F12 (azadirone) and F18 (1,7+3,7di-O-acetyl-
havanensin) in water to adult C. carnea during the pre- (5 d) or post- oviposition period (from day 10th to 15th), on fecundity and fertility
Treatments (1000 ppm) Eggs/female/day Egg hatch
(%) <24-h-old adults1a 10-d-old adults2b <24-h-old adults3c 10-d-old adults4d
Control 26.30+1.88a 26.80+2.36a 69.85+2.64a 78.67+1.66a (F12) Azadirone 25.38+2.66a 11.70+1.94b 71.37+5.60a 76.16+1.66a F18 Fraction 25.26+2.66a 27.19+2.56a 67.72+3.67a 80.88+1.37a Within the same column data followed by the same letter do not differ significantly (1,2 ANOVA and LSD. 1,3,4 ANOVA and Bonferroni. P>0.05). 1 F=0,21; df=2,17; P=0.81. 2F=14,83; df= 2,12; P=0,003
F=0.29; df=2,17; P=0.75. 4F=1.44; df= 2,12; P=0.27 a,bEggs counted 4 days during a 7-d period from the starting of oviposition or a 9-d period from the starting of treatment, respectively. cData are mean of one day (1) d Data are mean of two different days (1 and 4 from the starting of egg laying).
We found in our study, that depending on the way of application (ground seeds, water extracts or acetone fractions) some effects on mortality or fecundity were produced, being ground seeds more effective in giving effects than aqueous extracts or acetone fractions, probably because some of the compounds with insecticidal properties are not soluble in the last two.
As such, the results of our study only showed high mortality (100%) when young C. carnea adults ingested ground seeds at a rate of 10%. This demonstrated the higher tolerance of this chrysopid to this botanical pesticide compared to some pests such as S. littoralis, because in this insect, a high mortality was also recorded at the concentration of 5%. In contrast with these results, when adults of C. carnea were fed aqueous extracts or fractions, not any mortality was recorded.
Effects on mean number of eggs per female and day were more conspicuous than effects on mortality, irrespective of the way of exposing adults. Both the ground seeds or the aqueous extracts of T. havanensis, gave reductions in the fecundity of young adults of C. carnea, wheras the acetone fractions did not affect this parameter in young adults, and only azadirone (F12) significantly decreased this parameter in 10-d-old adults. The last result is in agreement with Medina (2001), who found that fecundity of this predator was only reduced when adults close to the period of maximum oviposition were fed azadirachtin, but not when <24-h-old adults fed the insecticide. Affected insects showed a lesser ovary development than controls.
The reduction of fecundity in C. carnea females could be related to a possible antifeedant effect of T. havanensis, because with 5% of ground seeds in the diet or 10% of aqueous extracts, females survive the treatment but they do not lay eggs at all. According to Canard et al. (1984) C. carnea females need to ingest high levels of proteins to correctly develop their oocytes and to produce the secretions of the accesory glands used in reproduction, so both processess could have been impaired through the ingestion of T. havanensis.

31
In contrast, egg hatch was not affected in any case. Other botanical pesticides such as the two commercials of azadirachtin (the non-oil
Align® and the oil Neem Azal-T/S®) and a natural pyrethrum, were however very harmful to larvae of this predator in the laboratory, but in the field they did not cause any mortality or effect on reproduction of the emerged adults (Vogt et al 1998; Viñuela et al, 1996, 2000). Conclusion Based on our laboratory results, T. havanensis only has exhibited some effects on reproduction of C. carnea adults when ingested, but more research is needed to test the side-effects of this botanical pesticide by residual contact, in other developmental stages and under other conditions (semifield, field), before establishing its compatibility with our predator. Acknowledgements This work was suported by the Spanish Ministry of Education and Culture (project AGL2001-1652-C02-02 to E. Viñuela). A. Huerta is recipient of a grant from de ANUIES-SUPERA and the Postgraduated School of México (Mexico). References Arnason, J. Durst, T. & Philogène, B. 2000: Prospection d’insecticides phytoquimiques de
plantes tempérées et tropicales communes ou rares. In Biopesticides d’origine végétale. Editions TEC & DOC. Paris. Regnault-Roger C., Philogène B. Jr & Vincent Ch. Coords.: 41-51
Balandrín, M.F., Klocke, J.A., Wartele, E.S. & Bolinger, W.H. 1985: Natural plant chemicals: sources of industrial and medical materials. Science 228: 1154-1160.
Banken, J.A.O. & Stark, J.D. 1997: Stage and age influence on the susceptibility of Coccinella septempunctata after direct exposure to neemix, a neem insecticide. J. Econ. Entomol. 90(5): 1102-1105.
Bernays, E.A. 2000: Plant-insect interactions. A synthesis. Abstract book I: VIII-XIII. XXI Int. Cong. Entomology. Brazil August 20-26.
Boller, E.F., El Titi, A., Gendrier, J.P., Avilla, J., Jörg, E. & Malavolta, C. 1999: Integrated production. Principles and technical guidelines. 2nd ed. IOBC/wprs Bull. 22(4): 1-37.
Budia, F. & Viñuela, E. 1996. effects of cyromazine on adult C. capitata on mortality and reproduction. J. Econ. Entomol. 89(4): 826-831.
Canard, M., Séméria, Y. & New, T.R. (eds), 1984. Biology of Chrysopidae. Dr. Junk publishers. The Hague: 294 pp.
Candolfi, M.P., Barrett, K.L., Campbell, P.J., Foster, R., Grandy, N., Huet, M.C., Lewis, G., Oomen, P.A., Schmuck, R. & Vogt, H. (eds). 2001. Guidance document on regulatory testing and risk assessment procedures for plant protection products with non-target arthropods. SETAC. USA. 46 pp.
Harborne, J.B. 1982: Introduction to ecological biochemistry. Academic Press. London. 278 pp.
Lagunes, T.A. 1993: Uso de extractos y polvos vegetales y minerales para el combate de plagas del maíz y del frijol en la agricultura de subsistencia. Memoria del Colegio de Postgraduados. México. 31 pp.

32
López-Olguín, J.F. 1998: Actividad y modo de acción de productos de Trichilia havanensis Jacq. y Scutellaria alpina subsp. javalambrensis (Pau), sobre Leptinotarsa decemlineata (Say) y Spodoptera exigua (Hübner). Tesis Doctoral. UPM. Madrid.
López-Olguín, J.F. Adán, A., Ould-Abdallahi, E., Budia, F., Del Estal, P. & Viñuela, E. 2002: Actividad de Trichilia havanensis Jacq. (Meliaceae) en la mosca mediterránea de la fruta Ceratitis capitata (Wied.). Bol. San. Veg. Plagas 28: 301-308.
López-Olguín, J.F., Budia, F., Castañera, P. & Viñuela, E. 1997: Actividad de Trichilia havanensis Jacq. (Meliaceae) sobre larvas de Spodoptera littoralis (Boisduval) (Lepidoptera: Noctuidae). Bol. San. Veg. Plagas 23: 3-10.
López-Olguín, J.F., De La Torre, M.C., Viñuela, E. & Castañera, P. 1998: Actividad de extractos de semillas de Trichilia havanensis Jacq. sobre larvas de Helicoverpa armigera (Hübner). Bol. San. Veg. Plagas 24: 629-636.
Medina, P. 2001. Evaluación de modernos plaguicidas en el depredador Chrysoperla carnea (Stephens, 1836) (Neuroptera: Chrysopidae). Tesis doctoral. UPM. Madrid. 189 pp.
Medina, P., Budia, F., Del Estal, P. & Viñuela, E. 2003. Effects of three modern insecticides, pyriproxyfen, spinosad and tebufenozide, on survival and reproduction of Chrysoperla carnea adults. Ann. Appl. Biol. 142: 55-61.
Medina, P., Budia, F., Smagghe, G. & Viñuela, E. 2001: Activity of spinosad, tebufenozide and azadirachtin on eggs and pupae of the predator Chrysoperla carnea (Stephens) under laboratory conditions. Biocontrol Sci. & Technol. 11: 597-610.
Ortego, F., López-Olguín, J.F., Ruíz, M. & Castañera, P. 1998: Effects of toxic and deterrent terpenoids on digestive protease and detoxication enzyme activities of colorado potato beetle larvae. Pestic. Biochem. Physiol. 63: 76-84.
Schoonhoven, L.M., Jermy, T. & Van Loon, J.J.A. 1998: Insect-plant biology. Chapman and Hall, UK: 409 pp.
STSC 1987: Statgraphics user’s guide, versión 5.0. Graphic Software System. Stsc. Rockville. USA.
Tauber, M.J., Tauber, C.A., Daane, K.M. & Hagen, K.S. 2000: Commercialization of predators: recent lessons from green lacewings (Neuroptera: Chrysopidae: Chrysoperla). Am. Entomol. 46: 26-38.
Viñuela, E., Adán, A., Smagghe, G., González, M., Medina, M.P., Budia, F., Vogt, H. & Del Estal, P. 2000: Laboratory effects of ingestion of azadirachtin, by two pests (Ceratitis capitata and Spodoptera exigua) and three natural enemies (Chrysoperla carnea, Opius concolor and Podisus maculiventris). Biocontrol Sci. Technol. 10: 165-177.
Viñuela, E., Budia, F., Händel, U. & Vogt, H., 1996: Evaluación en campo de los efectos secundarios de dos plaguicidas de origen botánico, una piretrina natural y un extracto de neem, sobre Chrysoperla carnea (Stephens). Bol. San. Veg. Plagas 22: 97-106.
Vogt, H., Bigler, F., Brown, K., Candolfi, M.P., Kemmeter, F., Kühner, C.H., Moll, M., Travis, A., Ufer, A., Viñuela, E., Waldburger, M. & Waltersdorfer, A. 2000: Laboratory method to test effects of plant protection products on larvae of Chrysoperla carnea (Neuroptera: Chrysopidae). In: Guidelines to evaluate side-effects of plant protection products to non-target arthropods. IOBC/wprs. Gent. Candolfi, M.P., Blümel, S., Forster, R., Bakker, F., Grimm, C., Hassan, S.A., Heimbach, U, Mead-Briggs, B., Reber, R., Schmuck, R., Vogt, H. (eds): 27-44.
Vogt, H., Gonzalez, M., Adán, A., Smagghe, G. & Viñuela, E. 1998: Efectos secundarios de la azadiractina, vía contacto residual, en larvas jóvenes del depredador Chrysoperla carnea (Stephens) (Neuroptera: Chrysopidae). Bol. San. Veg. Plagas 24: 57-78
Pesticides and Beneficial Organisms IOBC/wprs Bulletin Vol. 26 (5) 2003
pp. 33 - 40
33
Side effects of six insecticides on different developmental stages of Chrysoperla carnea (Neuroptera: Chrysopidae) Pilar Medina, Flor Budia, Pedro del Estal, Angeles Adán & Elisa Viñuela Unidad de Protección de Cultivos, E.T.S.I. Agrónomos, Ciudad Universitaria, s/n. 28040-Madrid, Spain Abstract: Six insecticides with different modes of action (azadirachtin, diflubenzuron, fipronil, pyriproxyfen, spinosad and tebufenozide) were selected to test them at the maximum field recommended rate in all developmental stages of Chrysoperla carnea (Stephens) under laboratory conditions. Immobile stages: eggs and pupae, were not affected by the studied chemicals when treated by dipping and topical treatment, respectively, whereas the observed effects on mobile stages: third-instar larvae and adults, were strongly dependent on the insecticide tested. Azadirachtin, diflubenzuron and fipronil were very toxic to larvae when topically treated. But, pyriproxyfen, spinosad and tebufenozide were harmless. Only the neurotoxic insecticides spinosad and fipronil, killed C. carnea adults and the effect was more drastic when they fed the products in the drinking water than when topically treated. Some of the insect growth regulators tested diminished fecundity (azadirachtin) or fertility (diflubenzuron), whereas pyriproxyfen and tebufenozide did not modify these reproductive parameters. Key words: Chrysoperla carnea, azadirachtin, diflubenzuron, fipronil, pyriproxyfen, spinosad, tebufenozide, egg, larva, pupa, adult. Introduction Chrysoperla carnea Stephens (Neuroptera: Chrysopidae) is a generalist predator commercially available, that can be used in biological and integrated control programmes against arthropod pests by periodical release of eggs and/or larvae, or by attraction and feeding of adults in order to increase the egg production and oviposition (Tauber et al., 2000). The use of selective insecticides allowing the survival of C. carnea populations is essential in Integrated Pest Management techniques. This implies the implementation of toxicological studies leading to improve our knowledge about the joint use of insecticides and beneficial insects.
Several insecticides with different modes of action and origin, the botanic antiecdysteroid azadirachtin, the chitin synthesis inhibitor diflubenzuron, the neurotoxic fipronil, the juvenile hormone mimic pyriproxyfen, the neurotoxic spinosad (isolated from soil microorganisms) and the ecdysone agonist tebufenozide were selected. Topical and ingestion treatment instead of residual contact were chosen because there is a lot of information available on residual effects of pesticides for this natural enemy. In consequence our main goal in this work was to study other different routes of pesticide uptake and to compare their effects with those previously reported in literature. If possible, all developmental stages were evaluated, and for adults, complementary studies to investigate the influence of both modes of application and the age of adults (before or after the onset of oviposition) were carried out.

34
Materials and methods A laboratory colony of C. carnea (25±2ºC, 75±5% r.h., and 16:8 (L:D) photoperiod) was established from eggs obtained from the BBA Institute for Plant Protection in Orchards (Dossenheim, Germany). Larvae were reared with Sitotroga cerealella (Oliver) eggs, and adults with an artificial diet as described by Vogt et al. (2000).
Fresh dilutions of every compound in distilled water or acetone for topical application tests, were prepared prior to the assays. Control groups were supplied with distilled water or acetone. Topical treatment was performed using a hand microapplicator (Burkard, UK). During experiments, adult rearing containers and oviposition boxes, consisted of plastic cages as described by Medina et al. (2001). Adults survival was monitored on a daily basis. Each replicate consisted of 3 females and 3 males and 4-5 replicates were used per insecticide. Once oviposition had started, the oviposition substrate (a cotton gauze) was replaced at least every one or two days to count the eggs. The mean number of eggs per female laid during the first 7 or 10 days after the first oviposition was used to evaluate fecundity. Egg fertility was tested with eggs collected at day five after the onset of oviposition. Information on the pesticides used and the rates of commercial product following the recommendations in Spain (Liñán, 2002) are presented in Table 1. As amounts of water used vary among insecticides and crops, it has been considered better to uniformize data in mg a.i./l or ng a.i./insect depending on the treatment. Table 1: Test products and concentrations applied. Active ingredient (a.i.)
Trade name
Formulationa. i. (%)
Maximum fieldrate
Conc.a (mg a.i./l)
Doseb (ng a.i/insect)
Azadirachtin Align 3.2 EC 1.5 l/ha 48 24 Diflubenzuron Dimilin 25 WP 600 g/ha 150 75 Fipronil Regente 80 WG 30 g/ha 30 15 Pyriproxyfen Juvinal EC 10 EC 0.75 l/ha 75 31.5 Spinosad Tracer 48 SC – 400 200c Tebufenozide Mimic 2F 24 SC 0.75 l/ha 180 90
a Highest recommended concentration of active ingredient for a water amount applied of 1000 l/ha, with the exception of Spinosad (300 l/ha) and fipronil (800 l/ha).
b Highest recommended dose for a drop size of 0.5 µl. c Spinosad was not registered in Spain when the experiments were carried out. The maximum field
rate used was 120 g a.i./ha and a water amount of 300 l/ha (from manufacturer´s recommendation in cotton).
Ovicidal activity Three samples of 50-70 eggs (<24 h-old) per insecticide tested were collected and dipped into the pesticides solutions for 3 seconds, allowed to dry for 2 h on a glass plate at room temperature, and then transferred to ventilated plastic boxes at the rearing chamber, following the methodology described by Medina et al. (2001). Egg hatch was evaluated 5-6 days later.

35
Topical treatment on pupae Less than 24-h-old pupae (20-40 per insecticide and control) were topically dosed on the silken cocoon with 0.5 µl of the insecticide solutions. The weight of young pupae averaged 10.02±0.002 mg. After treatment, groups of 5 pupae were kept in plastic petri dishes (9 cm in diameter). Upon adult emergence, fecundity and fertility were assessed as described above. Topical treatment on larvae Thirty to forty third-instars (9-d-old) were topically treated on the thoracic dorsum with 0.5 µl of an acetonic solution of each insecticide. After treatment, insects were kept individually in 2 x 1.8 cm3 cylindrical plastic vials to pupate, and after cocoon-spinning, they were moved to bigger plastic cages (11 cm diameter; 5 cm high) over folded paper to facilitate the emergence of adults (slightly modified from Shour and Crowder, 1980). The mean±sd fresh weight of 9-d-old non-treated larvae was 7.5±2.3 mg based on 75 individual measurements. Larvae were treated in the second instar with spinosad and the mean weight of 15 larvae was 1.78±0.1 mg. Treatments on adults Newly emerged adults (≤24-h-old) were topically treated with 0.5 µl of an acetonic solution of each insecticide in the pronotum. The weight of females and males averaged 8.21±0.69 mg and 6.74±0.36 mg respectively. In two series of experiments, newly emerged (≤24 h-old, pre-oviposition) and 10-d-old adults (post-oviposition) were fed continously with the test compounds via drinking water, renewed each day, for four consecutive days, and then offered distilled water until the end of the experiment. Mortality was assessed 72 hours after the beginning of the treatment. Fecundity and fertility were recorded as described above when adults were treated before the onset of oviposition. Reproduction parameters of old adults correspond to the mean number of eggs laid per female on the fourth day of treatment and the percentage of egg hatching of those eggs. Statistical analysis One-way analysis of variance (ANOVA) and the LSD multiple range test were perfomed on the data to determine significant (P<0.05) differences between treatments (STSC, 1987). In those cases where the F value from ANOVA was non-significant, a Bonferroni test was applied. When premises of ANOVA were violated, Kruskal-Wallis test was used. Results Three of the pesticides tested (azadirachtin, spinosad and tebufenozide) were harmless to C. carnea eggs. Fipronil caused a significant slight reduction (18.7%, compared to the control) on the percentage of egg hatching (Table 2).
Adult emergence, fecundity and fertility were not significantly different from those of controls for all insecticides evaluated on young pupae of C. carnea topically treated (Table 2).
Concerning the topical treatment of the third instar larvae, the results of our study indicated that pyriproxyfen and tebufenozide were completely harmless; spinosad reduced the number of formed pupae by 20%, but adult emergence did not differ significantly; and diflubenzuron, azadirachtin and fipronil resulted in being rather toxic. The IGR´s diflubenzuron and azadirachtin allowed the larvae to spin the cocoon, but the insect died inside, decreasing adult emergence by 100 and 77.9%, respectively (Table 3).
The results obtained with newly emerged adults of C. carnea when insecticides were applied according to the maximum recommended field concentrations in Spain with two different modes of application: topical and ingestion treatment (Table 4), showed that the group of IGR´s did not cause mortality on adults, whereas neurotoxics as fipronil and spinosad were harmful. Fipronil killed 100% of adults in less than 72 hours, regardless of the
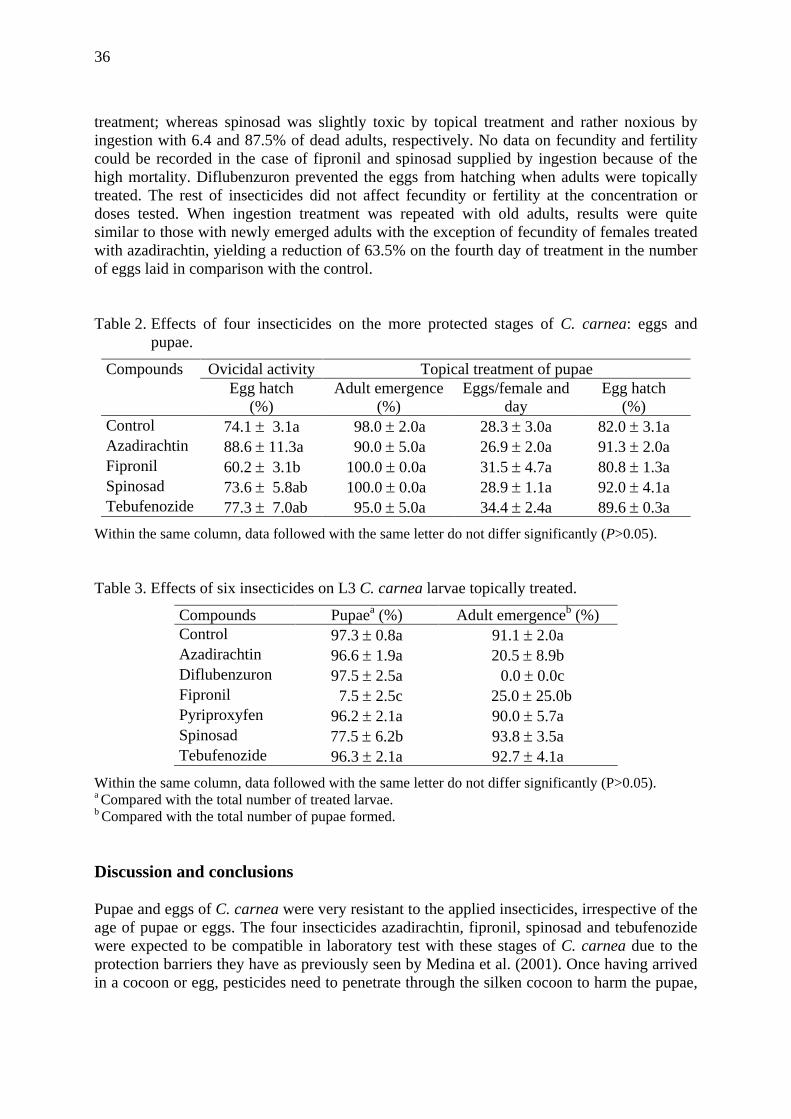
36
treatment; whereas spinosad was slightly toxic by topical treatment and rather noxious by ingestion with 6.4 and 87.5% of dead adults, respectively. No data on fecundity and fertility could be recorded in the case of fipronil and spinosad supplied by ingestion because of the high mortality. Diflubenzuron prevented the eggs from hatching when adults were topically treated. The rest of insecticides did not affect fecundity or fertility at the concentration or doses tested. When ingestion treatment was repeated with old adults, results were quite similar to those with newly emerged adults with the exception of fecundity of females treated with azadirachtin, yielding a reduction of 63.5% on the fourth day of treatment in the number of eggs laid in comparison with the control. Table 2. Effects of four insecticides on the more protected stages of C. carnea: eggs and
pupae.
Ovicidal activity Topical treatment of pupae Compounds Egg hatch
(%) Adult emergence
(%) Eggs/female and
day Egg hatch
(%) Control 74.1 ± 3.1a 98.0 ± 2.0a 28.3 ± 3.0a 82.0 ± 3.1a Azadirachtin 88.6 ± 11.3a 90.0 ± 5.0a 26.9 ± 2.0a 91.3 ± 2.0a Fipronil 60.2 ± 3.1b 100.0 ± 0.0a 31.5 ± 4.7a 80.8 ± 1.3a Spinosad 73.6 ± 5.8ab 100.0 ± 0.0a 28.9 ± 1.1a 92.0 ± 4.1a Tebufenozide 77.3 ± 7.0ab 95.0 ± 5.0a 34.4 ± 2.4a 89.6 ± 0.3a
Within the same column, data followed with the same letter do not differ significantly (P>0.05). Table 3. Effects of six insecticides on L3 C. carnea larvae topically treated.
Compounds Pupaea (%) Adult emergenceb (%) Control 97.3 ± 0.8a 91.1 ± 2.0a Azadirachtin 96.6 ± 1.9a 20.5 ± 8.9b Diflubenzuron 97.5 ± 2.5a 0.0 ± 0.0c Fipronil 7.5 ± 2.5c 25.0 ± 25.0b Pyriproxyfen 96.2 ± 2.1a 90.0 ± 5.7a Spinosad 77.5 ± 6.2b 93.8 ± 3.5a Tebufenozide 96.3 ± 2.1a 92.7 ± 4.1a
Within the same column, data followed with the same letter do not differ significantly (P>0.05). a Compared with the total number of treated larvae. b Compared with the total number of pupae formed. Discussion and conclusions Pupae and eggs of C. carnea were very resistant to the applied insecticides, irrespective of the age of pupae or eggs. The four insecticides azadirachtin, fipronil, spinosad and tebufenozide were expected to be compatible in laboratory test with these stages of C. carnea due to the protection barriers they have as previously seen by Medina et al. (2001). Once having arrived in a cocoon or egg, pesticides need to penetrate through the silken cocoon to harm the pupae,

37
Table 4. Effects of six insecticides on C. carnea adults.
Ingestion treatment Topical treatment Adults < 24 h-old Adults 10 d-old
Compound
Mortality
at 72 h.
Eggs/female,
day
Egg hatch
(%)
Mortality
at 72 h.
Eggs/female
and day
Egg hatch
(%)
Mortality
at 72 h
Eggs/female
and day
Egg hatch
(%)
Control 0.0 ± 0.0a 29.8 ± 1.3a 82.8 ± 2.9a 0.0 ± 0.0a 33.7 ± 2.0a 97.3 ± 0.8a 0.0 ± 0.0a 34.8 ± 3.2a 81.0 ± 5.7a
Azadirachtin 0.0 ± 0.0a 30.4 ± 3.6a 84.0 ± 3.7a 0.0 ± 0.0a 27.5 ± 3.5a 96.6 ± 1.9a 0.0 ± 0.0a 12.7 ± 1.4b 90.0 ± 7.8a
Diflubenzuron 0.0 ± 0.0a 28.4 ± 1.2a 0.0 ± 0.0b Not tested Not tested Not tested Not tested Not tested Not tested
Fipronil 100c (*) (*) 100c (*) (*) Not tested Not tested Not tested
Pyriproxyfen 0.0 ± 0.0a 39.1 ± 3.8b 83.0 ± 3.5a 0.0 ± 0.0a 30.1 ± 2.1a 83.6 ± 2.6a 0.0 ± 0.0a 35.9 ± 2.3a 89.2 ± 2.3a
Spinosad 6.4 ± 3.9b 33.8 ± 3.7ab 79.2 ± 4.4a 87.5 ± 12.5b (*) (*) 78.7 ± 14.2b (*) (*)
Tebufenozide 0.0 ± 0.0a 28.4 ± 1.4a 90.2 ± 9.8a 0.0 ± 0.0a 35.5 ± 2.4a 88.8 ± 2.0a 0.0 ± 0.0a 30.1 ± 3.2a 89.5 ± 4.2a
Within the same column, data followed with the same letter do not differ significantly (P>0.05). (*) No data due to the high mortality.
37

38
or the waterproof chorion to harm the embryo. Moreover, it is known that in natural habitats mature C. carnea larvae prefer to pupate in hidden places that safeguard them from insecticides and eggs can even be more tolerant to pesticides based on the fact that they are laid at the end of a long stalk which prevent the contact with the oviposition surface (Canard et al., 1984). As a consequence, even an insecticide so toxic to C. carnea larvae or adults as fipronil was harmless to eggs and pupae of this predator.
Larvae of C. carnea show a wide range of toxicity, with a broad tolerance to many insecticides, but being extremely sensitive to others (Bartlett, 1964; Ishaaya & Casida, 1981; Pree et al., 1989; Bigler & Waldburger, 1994). Azadirachtin, diflubenzuron and fipronil were very toxic to third instar larvae topically applied, preventing adult from emergence, severely in the two last cases, even at doses rather lower than the maximum field rate (Medina et al., 2003a). The results obtained with azadirachtin agree with those of Vogt et al. (1998) showing that residual contact under laboratory conditions with first-instar larvae at maximum field recommended rate prevented pupation and adult emergence. However, it should be noted that these high mortalities have not been confirmed in the field (Viñuela et al., 1997). Other chitin synthesis inhibitors as teflubenzuron, triflumuron and diflubenzuron were also reported to be very toxic by residual contact treatments towards different instars of Neuroptera as Chrysopa oculata (Say), Micromus tasmaniae Walker and also C. carnea (Broadbent & Pree, 1984; Bigler and Waldburger, 1994; Vogt, 1994; Rumpf et al., 1997; Shuja et al., 1997; Vogt et al., 2001). As was the case in our assays with C. carnea, treated larvae in the last instar were able to spin normal cocoons, but then died during the molting/metamorphosis process and adult formation was inhibited.
Adults were the most sensitive stage to insecticides at the evaluated concentrations. Neurotoxic insecticides were highly toxic to adults, particularly fipronil. These results are in agreement with those of Elzen et al., (1998) that reported 100% of mortality in adults 24 hours after the spraying with several pesticides commonly used in cotton, being fipronil the most toxic. Adult predators such as Orius insidiosus (Say) or Geocoris punctipes (Say) were very sensitive to fipronil when they fed on insecticide treated Helicoverpa zea (Boddie) eggs (Elzen, 2001). Spinosad was consistently less toxic to C. carnea than fipronil. Elzen et al., (1998) also obtained similar comparative data with several predators: O. insidiosus, G. punctipes and Hippodamia convergens Guerin-Meneville. Spinosad was more toxic by ingestion than by topical treatment or residual contact and this is in accord with the results reported by Bret et al. (1997). Elzen et al. (1998) reported 23% of dead C. carnea adults 24 h after residual treatment. This data on mortality were higher than the results obtained in our topical test, which that can be explained due to the higher concentration applied by Elzen et al. (1998) (more than 1 g/l).
Insect growth regulators tested did not cause lethal effects on adults but disturbed reproduction in different manners. Azadirachtin reduced oviposition of the predator (Medina, unreported data) and pyriproxyfen diminished fertility (Medina et al., 2003b) but at higher doses than those tested in the current paper, and only when adults were fed the insecticides after the onset of oviposition. It can be hypotesized that the step of maturity of the ovaries might have an influence on the effect induced by the insecticide, being the immature ovaries less sensitive than the mature ones. Diflubenzuron provoked the embryo death, irrespective of the age of the females treated and tebufenozide was completely harmless (Medina et al., 2002). As such, if only mortality is tested to evaluate the impact of an insecticide on natural enemies, it should be taken into account that we are likely to underestimate the real effect, because the future of the next generations can be seriously affected. This assessment is particularly important in the case of IGR´s because of the broad range of different sublethal effects that they might produce. However, neurotoxic compounds, traditionally evaluated only

39
for direct mortality can yield sublethal effects that might ultimately result in reductions of population densities as Elzen et al., (2000) showed for Catolaccus grandis (Burks). At reduced rates, spinosad was primarily low in toxicity to the pteromalid. Nevertheless, no pupae developed from eggs laid by C. grandis during a 24 hours treatment period with parasitoids exposed to spinosad treated parafilm sheet containing second instar boll weevils.
In conclusion, tebufenozide was completely selective. The other insecticides interfered with some of the developmental stages or with the reproduction of adults, being fipronil and diflubenzuron the more toxic due to their noxious effects on larval and adult stages. In addition, the use of azadirachtin, pyriproxyfen and spinosad should be considered with caution until more field assays are performed to provide a final conclusion. References Bartlett, B.R. 1964: Toxicity of some pesticides to eggs, larvae, and adults of the green
lacewing, Chrysopa carnea. – J. Econ. Entomol. 57: 366-369. Bigler, F. & Waldburger, M. 1994: Effects of pesticides on Chrysoperla carnea in the labora-
tory and semi-field. – IOBC/WPRS Bulletin 17(10): 55-71. Bret, B.L., Larson, L., Schoonover, J.R., Sparks, T.C. & Thompson, G.D. 1997: Biological
properties of Spinosad. – Down to Earth 52: 6-13. Broadbent, A.B. & Pree, B.J. 1984: Effects of diflubenzuron and BAY SIR 8514 on beneficial
insects associated with peach. – Environ. Entomol. 13: 133-136. Canard, M., Séméria, Y. & New, T.R. (Eds) 1984: Biology of Chrysopidae. – Dr. W. Junk
Publishers. The Hague. Elzen G.W., Elzen P.J. & King E.G. 1998: Laboratory toxicity of insecticide residues to Orius
insidiosus, Geocoris punctipes, Hippodamia convergens and Chrysoperla carnea. – Southwestern Entomol. 23:335-341.
Elzen, G.W. 2001: Lethal and sublethal effects of insecticide residues on Orius insidiosus (Hemiptera: Anthocoridae) and Geocoris punctipes (Hemiptera: Lygaeidae). – J. Econ. Entomol. 94: 55-59.
Elzen, G.W., Maldonado, S.N. & Rojas, M.G. 2000: Lethal and sublethal effects of selected insecticides and an insect growth regulator on the boll weevil (Coleoptera: Curculion-idae) ectoparasitoid Catolaccus grandis (Hymenoptera: Pteromalidae). – J. Econ. Entomol. 93: 300-303.
Ishaaya, I., & Casida, J.E. 1981: Pyrethroid esterase(s) may contribute to natural pyrethroid tolerance of larva of the common green lacewing. – Environ. Entomol. 10: 681-684.
Liñán, C. 2002: Vademecum de productos fitosanitarios y nutricionales. – Ediciones agro-técnicas S.A. Madrid: 672 pp.
Medina P., Budia F., Smagghe G. & Viñuela, E. 2001: Activity of Spinosad, Tebufenozide and Azadirachtin on eggs and pupae of the predator Chrysoperla carnea (Stephens) under laboratory conditions. – Biocontrol Sci. Technol. 11: 597-610.
Medina, P., Smagghe, G., Budia, F., del Estal, P., Tirry, L. & Viñuela, E. 2002: Significance of penetration, excretion and transovarial uptake to toxicity of three insect growth regulators in predatory lacewing adults. – Arch. Insect Biochem. Physiol. 51: 91-101.
Medina, P., Smagghe, G., Budia, F., Tirry, L. & Viñuela, E. 2003 a: Toxicity and absorption of azadirachtin, diflubenzuron, pyriproxyfen, and tebufenozide after topical application in predatory larvae of Chrysoperla carnea (Stephens) (Neuroptera: Chrysopidae). – Environ. Entomol. (in press).

40
Medina, P., Budia, F., Del Estal, P. & Viñuela, E. 2003 b: Effects of three modern insecticides: pyriproxyfen, spinosad and tebufenozide on survival and reproduction of Chrysoperla carnea adults. – Ann. Appl. Biol. 142: 55-61.
Pree, D.J., Archibald, D.E. & Morrison, R.K. 1989: Resistance to insecticides in the common green lacewing Chrysoperla carnea (Neuroptera: Chrysopidae) in Southern Ontario. – J. Econ. Entomol. 82: 29-34.
Rumpf, S., Frampton, C. & Chapman, B. 1997: Acute toxicity of insecticides to Micromus tasmaniae (Neuroptera: Hemerobiidae) and Chrysoperla carnea (Neuroptera: Chrys-opidae): LC50 and LC90 Estimates for various test durations. – J. Econ. Entomol. 90: 1493-1499.
Shour, M.H., & Crowder, L.A. 1980: Effects of pyrethroid insecticides on the common green lacewing. – J. Econ. Entomol. 73: 306-309.
Shuja, A., Senior, L.J., McEwen, P.K. & Langley, P.A. 1997: Effects of the chitin synthesis inhibitor, triflumuron on the common green lacewing Chrysoperla carnea (Stephens): influence of residence time. – Acta Zool. Fennica 209: 239-242.
STSC, 1987: User’s Guide Statgraphics. – Graphic software system STSC Inc., Rockville, MD, USA.
Tauber, M.J., Tauber, C.A., Daane, K.M. & Hagen, K.S. 2000: Commercialization of predators: recent lessons from green lacewings (Neuroptera: Chrysopidae: Chrysoperla). – Am. Entom. 46: 26-38.
Viñuela, E., Händel, U. & Vogt, H. 1997: Field evaluation of the side-effects of two botanically-derived pesticides: a natural pyrethrum and a neem extract on Chrysoperla carnea. – Bol. San. Veg. Plagas 22: 97-106 (In Spanish).
Vogt, H. 1994. Effects of pesticides on Chrysoperla carnea in the field and comparison with laboratory and semi-field results. – IOBC/WPRS Bull. 17(10): 71-82.
Vogt, H., Bigler, F., Brown, K., Candolfi, M.P., Kemmeter, F., Kühner, Ch., Moll, M., Travis, A., Ufer, A., Viñuela, E., Waldburger, M. & Waltersdorfer, A. 2000. Laboratory method to test effects of plant protection products on larvae of Chrysoperla carnea (Neuroptera: Chrysopidae). – In: M. P. Candolfi, S. Blümel, R. Forster, F.M. Bakker, C. Grimm, S.A. Hassan, U. Heimbach, B. Mead-Briggs, R. Reber, R. Schmuck & H. Vogt (eds.): Guidelines to evaluate side-effects of plant protection products to non-target arthropods. IOBC/WPRS, Gent: 27-44.
Vogt, H., González, M., Adán, A., Smagghe, G. & Viñuela, E. 1998: Side-effects of aza-dirachtin, via residual contact, on young larvae of predator Chrysoperla carnea (Stephens) (Neuroptera: Chrysopidae). – Bol. San. Veg. Plagas. 24: 67-78 (in Spanish).
Vogt, H., Viñuela, E., Boszik, A., Hilbeck, A & Bigler, F. 2001. Interactions with plant management strategies. – In: P.K. McEwen, T.R. New; A.E. Wittington (eds.) Lacewings in the crop environment. Cambridge University Press, Cambridge: 357-379.

Pesticides and Beneficial Organisms IOBC/wprs Bulletin Vol. 26 (5) 2003
pp. 41 - 50
41
Side effects of pesticides on four species of beneficials used in IPM in glasshouse vegetable crops: “worst case” laboratory tests Marc van de Veire & Luc Tirry Laboratory of Agrozoology, Department of Crop Protection, Faculty of Agricultural and Applied Biological Sciences, Coupure Links 653, B 9000 Ghent, Belgium Abstract: The initial contact toxicity and persistence of a number of recently developed or commercialized pesticides were studied on Encarsia formosa, Orius laevigatus, Macrolophus caliginosus and Amblyseius californicus using "worst case" laboratory tests. The compounds were sprayed on glass plates in a spray chamber (1.5 mg spray fluid per cm2), at the recommended rates for practical use. Adults of E. formosa, nymphs of O. laevigatus and M caliginosus and eggs of A. californicus were then exposed to fresh or aged spray deposits. The following compounds were tested: acetamiprid, abamectin, bifenazate, emamectin, halofenozide, imidacloprid, indoxacarb, methoxy-fenozide, pymetrozine, spinosad, thiacloprid, thiamethoxam and triazamate. Persistence was tested only for those compounds which proved to be toxic in the initial contact toxicity tests. For adults (mortality studies only) of the parasitic wasp E. formosa, halofenozide, bifenazate pymetrozine and methoxyfenozide proved to be harmless, while acetamiprid, abamectin, emamectin, imidacloprid, indoxacarb, spinosad, thiacloprid, thiamethoxam, triazamate were highly toxic. However, persistence studies showed that triazamate was short-lived (toxicity < 5 days). Halofenozide, bifenazate and methoxyfenozide were harmless to nymphs (mortality studies only) of the predatory bug O. laevigatus; acetamiprid, abamectin, imidacloprid, indoxacarb, thiacloprid, thiamethoxam, pymetrozine and spinosad were highly toxic. Especially the neonicotinoids (acetamiprid, imidacloprid, thiacloprid, thiamethoxam) proved to be very persistent (toxicity >30 days). For nymphs (mortality studies only) of the predatory bug M. caliginosus, halofenozide, bifenazate, emamectin, methoxyfenozide, pymetrozine, spinosad and triazamate were harmless while acetamiprid, indoxacarb and thiamethoxam were highly toxic. Halofenozide, bifenazate, indoxacarb, methoxyfenozide, spinosad, thiamethoxam and pymetrozine were harmless to nymphs (mortality studies only) of the predatory mite A. californicus; abamectin, acetamiprid, thiamethoxam proved to be toxic. Halofenozide, bifenazate and methoxyfenozide were the only compounds which were harmless to nymphs or adults of the 4 tested beneficials. Key words: side effect of pesticides, laboratory initial contact toxicity test, laboratory persistence test, Encarsia formosa, Orius laevigatus, Macrolophus caliginosus, Amblyseius californicus, Introduction The total area of the glasshouse vegetable crops in Belgium is about 1.300 ha (average 1-1.5 ha/grower), and consists of 1.000 ha of tomatoes, 180 ha of cucumbers and 100 ha of sweet peppers. Integrated pest managemnet (IPM), mainly based on biological control, is used as pest control method on more than 90% of this area.
Biological control, however, is not always succesful. Insufficient biological control of one or more pests is often corrected with selective chemicals. Buprofezin and cyromazine, used to control whiteflies and leafminers, respectively, are good examples of compounds which proved to be totally harmless to the beneficials used in the aforementioned crops.
Also, biological control is sometimes no option, since for some pests (e.g. Liocoris tripustulatus, the nettle bug, in sweet pepper) no effective beneficial is available.

42
Biological control may also show variable results, often due to insufficient knowledge on basic biological parameters (searching activity, prey preference, parasitization or predation capacity, etc.). Even if biological control is succesful, chemicals (e.g. fungicides) still have to be applied because biological disease control is still in the experimental phase.
The chemicals which are accepted and used now in IPM are harmless or have a low toxicity, or of short persistence to the beneficials.
Despite discouraging EU legislation (registration costs) and high development costs, new chemicals still regularly enter the market. It is of the utmost importance to assess the side effects of these compounds, in order to be able to evaluate their possible use in IPM programs in glasshouse vegetable crops.
In this study, we have tested a number of chemicals, which may be promising for use in IPM, on 4 important beneficials: the parasitoid wasp Encarsia formosa (Hymenoptera: Aphelindae) and the predators Orius laevigatus (Heteroptera: Anthocoridae), Macrolophus caliginosus (Heteroptera: Miridae), Amblyseius californicus (Mesostigmata: Phytoseiidae). “Worst case” initial contact toxicity (mortality) laboratory tests were carried out on the most susceptible stages. For compounds, which proved to be toxic, laboratory persistence tests were carried out. Materials and methods Chemicals The tested chemicals are given in Table 1. The tested rates are given in the results section. Test organisms The tested beneficial organisms and their hosts or prey are given in Table 2. The test insects were collected from a continuous laboratory rearing. Test methods “Worst case” laboratory tests for initial contact toxicity The testing device, hereafter referred to as the test cage, consists of 6 parts: 1 Plexiglas plate (10 x 5 x 0.25 cm) with a round opening in the centre (diameter: 3.5 cm); 1 glass plate (10 x 5 x 0.25 cm), 1 piece of cloth (10 x 5 x 0.2 cm) with a round opening in the centre (diameter: 3.5 cm), the bottom part of a tissue culture dish (1 cm high; diameter: 3.5 cm) and 2 plastic clamps. The sides of the tissue culture dish have 2 ventilation openings (diameter: 6 mm), covered with nylon gauze (mesh size: 140 µm) and one opening to introduce the test organisms. This opening can be connected to a pump to remove pesticide vapours in the cage (Van de Veire et al., 2001).
For O. laevigatus and M. caliginosus nymphs, a plastic tube containing a cotton wick is placed in a 4th opening as a water source. For E. formosa and A. californicus, no water supply is needed. The test cage is finally placed in a holder, with the ends of the cotton wicks in a water reservoir.
To assemble the cage, the adapted tissue culture dish is first inserted into the opening of the Plexiglas plate, after which the different parts are assembled in the following order: the glass plate (without opening) (bottom of the test cage), the cloth and the Plexiglas plate holding the tissue culture dish. The different layers are held together with plastic clamps.
Before assembling the cage, the glass plate and the inner part of the tissue culture dish are sprayed with the pesticides in a spray chamber. A spray fluid of 0.6 ml is homogeneously sprayed (1 bar) onto the glass plate and tissue culture dish to obtain 1.5 mg spray fluid/cm². This way, the entire inner part of the test cage was uniformly sprayed with the pesticide solution. For the untreated control, glass plates and dishes were sprayed with de-ionised water. Three to 5 replicates were used per rate.

43
Table 1. An overview of all tested compounds, their mode of action and the pests they control
Compound Trade name / formulation
Mode of action Used against
Acaricides
Abamectin Vertimec 018 EC
Fermentation product. Chloride channel activator
Thrips, spider mites
Bifenazate Experimental Carbamate. GABA antagonist Spider mites Insecticides
Emamectin Experimental Fermentation product. Chloride channel activator Caterpillars
Spinosad Tracer 480 SC
Fermentation product. Acetyl choline receptor modulator
Thrips, leafminers, caterpillars
Indoxacarb Steward 30 WG
Oxadiazine. Voltage dependent sodium channel blocker Caterpillars
Neonicotinoid insecticides
Imidacloprid Confidor 200 SL Aphids, whiteflies
Thiacloprid Calypso 480 SC Aphids, whiteflies
Acetamiprid Gazelle 200 g/kg Aphids, whiteflies
Thiametoxam Actara 25 WG
chloronicotinyls, acetyl choline receptor agonist
Aphids, whiteflies
Aphicides
Triazamate Aztec 140 EW Triazol. Cholinesterase inhibitor Aphids, whiteflies
Pymetrozine Chess 25 WP
Triazinon pyridine. Selective feeding blocker of unknown mode of action Aphids, whiteflies
Ecdysone agonists Halofenozide Experimental Caterpillars
Methoxyfenozide Runner 240 g/l
MAC (moulting accelerating compounds) Caterpillars
Table 2. Overview of the tested beneficial organisms and their hosts or prey
Organism Used to control Encarsia formosa Greenhouse whitefly (Trialeurodes vaporariorum) Orius laevigatus Western flower thrips (Frankliniella occidentalis) Macrolophus caliginosus Greenhouse whitefly, twospotted spider mite
(Tetranychus urticae), caterpillars, aphids Amblyseius californicus Twospotted spider mite

44
For testing the side effects on E. formosa, 10 adult females (0-1 day old) were put in the test cage using a fine brush. A small droplet of a mixture of pollen and honey was put on the outer side of the nylon gauze in the ventilation hole, as a food source. After 1, 3 and 7 days exposure of the wasps to the pesticide spray deposits, mortality was checked and corrected for control mortality (Abbott, 1925).
For testing the side effects on O. laevigatus, 10 first and second instar nymphs were put in the treated test cage using a fine brush. Every 3 days thawed eggs (15 mg per test cage) of Ephestia kuehniella (Biobest N.V., Belgium) were offered as food. After 4 and 12 days exposure of the bugs to the pesticide spray deposits, mortality was checked.
For testing the side effects on M. caliginosus, 10 second and third instar nymphs were put in the pesticide treated test cage with a fine brush. Every 3 days thawed E. kuehniella eggs (15 mg per test cage) were offered as food. After 1 and 3 days exposure of the bugs to the pesticide spray deposits, mortality of the predatory bugs was checked.
For testing the side effects on A. californicus, the test was modified. As larvae and nymphs of this mite species are very small and vulnerable during handling, eggs of the predatory mite were used instead of larvae or nymphs. Instead of the treated glass plates, sweet pepper leaves were used, in order to be able to provide eggs and nymphs of T. urticae as a food source. To assemble the cage, the different parts are put together in the following order: the glass plate (without opening), a pesticide treated sweet pepper leaf, the cloth (with opening coverd by the leaf), and the Plexiglas plate, holding the tissue culture dish. Ten eggs of A. californicus are introduced into the cage through the opening at the top of the culture dish, using a fine needle. Ten to 15 gravid T. urticae females collected from a continuous culture on sweet pepper were added, in order to provide T. urticae eggs, larvae and nymphs to the larvae and nymphs of the predatory mite. After 3 and 6 days exposure of the predatory mites to the pesticide spray deposits, mortality was checked. After 6 days exposure, adults of A. californicus had already emerged.
For every beneficial, test cages were always placed in a vertical position in a support and kept under controlled conditions in a climatic chamber (temperature: 24 ± 1 °C; RH: 80 %, L/D: 16/8) until the end of the experiment.
For the evaluation of the mortality, the toxicity classes developed for the “worst case” initial contact toxicity laboratory test, were used (Sterk et al., 1999): class 1 (harmless): effect < 30%; class 2 (slightly harmful): 30-79 % effect; class 3 (moderately harmful): 80-99% effect; class 4 (harmful): effect > 99%. “Worst case” laboratory tests for persistence Persistence tests for the study of the duration of harmful effects of pesticides were conducted for the parasitoid E. formosa and the predatory bugs O. laevigatus and M. caliginosus because some pesticides proved to be harmful in the initial contact toxicity test.
For testing the persistence of pesticide effects on E. formosa, tomato plants (S. lycopersicum ‘Bonset’), grown in rock wool, were used. In July 2002 the lower leaf surface of these plants was sprayed with a hand driven knapsack sprayer when the tomato plants were approximately 1.5 m high. Five, 15 and 30 days after treatment (DAT) leaves were collected and inserted in the aforementioned test cages. For each trial, 15 E. formosa wasps (0-1 day old) were exposed to the pesticide residue in the test cage. Mortality was scored after 7 days and corrected for control mortality (Abbott, 1925). Abamectin and spinosad were also sprayed in March 2002 (spring) to compare spring and summer conditions.
For testing the persistence of pesticide effects on O. laevigatus and M. caliginosus sweet pepper plants (C. annuum ‘Mazurka’) grown in rock wool were used. The lower leaf surface was sprayed in July 2002 (summer) as mentioned above when the plants were approximately

45
30-40 cm high. Five, 15 and 30 days after treatment, sweet pepper leaves were collected and inserted in the test cages. For each trial, 10 second stage nymphs of O. laevigatus and M. caliginosus were used. Mortality was scored after 4 days and corrected for control mortality (Abbott, 1925).
For the evaluation of the effect the toxicity classes developed for persistence tests were used (Sterk et al., 1999): class A: short-lived (< 5days); class B: slightly persistent (5-15 days); class C: moderately persistent (15-30 days); class D: persistent (> 30 days).
Persistence effects for the predatory mite A. californicus were not determined. Results Side effect of pesticides on the parasitic wasp E. formosa The initial and persistent toxicity of pesticides on E. formosa is given in Table 3 and Table 4.
The products bifenazate, pymetrozine, methoxyfenozide and halofenozide did not kill the adult wasps. If we assume that surviving insects’ reproductivity is not affected, they can be used for the control of the two-spotted spider mite and caterpillars together with the wasp.
Spinosad, abamectin, indoxacarb, emamectin, the neonicotinoids imidacloprid, acetamiprid, thiamethoxam, thiacloprid and triazamate were highly toxic and needed further testing in a persistence test to evaluate their potential use in IPM in glasshouse vegetables. In contrast to abamectin, emamectin did not show an immediate toxicity. In this persistence test, only triazamate turned out to be short-lived. Short-lived products normally do not cause problems when used at low frequency together with biocontrol agents (e.g. pirimicarb, dichlorvos). Table 3. Initial contact toxicity of pesticides on the parasitic wasp Encarsia formosa.
Corrected mortality (%) (Abbott)
Dose (mg a.i./l)
Rate ug a.i./cm²
Mortality (%)
1 DAT
Mortality (%)
3 DAT
Mortality (%)
7 DAT Abamectin 10 0.015 100 Bifenazate 150 0.225 0 0 37 (±11.5) Emamectin 15 0.025 17 (±5.7) 100 Spinosad 100 0.15 100 Indoxacarb 300 0.45 100 Imidacloprid 100 0.15 80 (±10.0) 100 Thiacloprid 50 0.075 100 Acetamiprid 100 0.15 100 Thiamethoxam 100 0.15 100 Triazamate 180 0.27 100 Pymetrozine 200 0.3 0 0 0 Halofenozide 200 0.3 0 0 0 Methoxyfenozide 200 0.3 0 0 0

46
Table 4. Persistence of pesticide effect on the parasitic wasp Encarsia formosa. Corrected mortality (%) (Abbott)
Mortality (%)
5 DAT Mortality (%)
15 DAT Mortality (%)
30 DAT Abamectin (spring) 100 100 100 Abamectin (summer) 80.0 ( ± 20) 83.3 ( ± 15.2) 45.0 ( ± 49.5) Spinosad 100 100 46.6 ( ± 50.3) Indoxacarb 80.0 ( ± 36.4) 60.0 ( ± 52.9) 33.3 ( ± 20.8) Imidacloprid 100 73.3 ( ± 46.1) 43.3 ( ± 25.1) Thiacloprid 100 43.3 ( ± 15.2) 24.0 ( ± 15.2) Acetamiprid 100 100 20.0 ( ± 20.0) Thiamethoxam 100 100 100 Triazamate 0 – –
When sprayed in spring, abamectin was toxic up to 30 days after treatment, and has to be classified in class D (persistent). The product was less persistent (class C: moderately persistent) when applied in the summer period.
Spinosad and the neonicotinoids imidacloprid, acetamiprid and thiamethoxam are also classified in class C. However, thiacloprid and indoxacarb proved to be somewhat less persistent than the other neonicotinoids. In some cases the standard deviation is very high. In the persistence tests, leaves are sprayed with a knapsack sprayer, which does not give as homogeneous spray deposits as those which are achieved on glass plates in a spray tower, and the fact that only 3 replicates are done (which is part of the standard test for persistence with Encarsia), maybe the reason of these high figures. More replicates could have increased the accuracy of the test. Side effects of pesticides on the predatory bug O. laevigatus The results of the initial and persistence toxicity tests of pesticides on the bug O. laevigatus are summarized in the Table 5 and Table 6.
The products bifenazate, methoxyfenozide and halofenozide can be considered most probably as harmless to the predatory bug O. laevigatus, if we assume that surviving insects’ reproductivity is not affected.
The neonicotinoids, spinosad, abamectin , pymetrozine and triazamate proved to be very toxic to the predator. All these compounds killed the nymphs in a 4 day exposure period.
The neonicotinoids and abamectin were also very persistent (class D). These products cannot be used together with the predatory bug. Indoxacarb and spinosad (spring treatment) killed more than 50% of the insects after 30 days. A higher tier test with these compounds should be done to evaluate their possible risk when used together with Orius laevigatus.
Spinosad was short-lived in the summer, but not in the spring. The use of this compound at low frequency (one or 2 times per season) normally should not pose problems for Orius. It is highly recommended to wait 1 to 2 weeks after spraying of spinosad, before introducing predatory bugs.

47
Table 5. Initial contact toxicity of pesticides on nymphs of the predatory bug Orius laevigatus (L1-L2). Mortality (%).
Dose (mg a.i./l)
Rate ug a.i./cm²
Mortality (%)4 DAT
Mortality (%)12 DAT
Abamectin 10 0.015 100 Bifenazate 150 0.225 0 20 (± 4.6) Spinosad 100 0.15 100 Indoxacarb 300 0.45 34 (±20.8) 100 Imidacloprid 15 0.15 100 Thiacloprid 50 0.075 100 Acetamiprid 100 0.15 100 Thiamethoxam 100 0.15 100 Triazamate 70 0.105 93.3 (±11.5) 96.7 (± 5.8) Pymetrozine 90 0.135 90.0 (± 17.3) 90.5 (±14.2) Halofenozide 150 0.225 15.3 (± 8.6) 46.0 (±28.0) Methoxyfenozide 150 0.225 20.3 ( ±13.2) 22.8 ( ± 8.3) Untreated - 10.1 (± 1.0) 23.3 (± 5.8)
Table 6. Persistence of pesticide effect on nymphs of the predatory bug Orius laevigatus (L2).
Corrected mortality (%) (Abbott).
Mortality (%) 5 DAT
Mortality (%) 15 DAT
Mortality (%) 30 DAT
Abamectin 100 100 90.4 ( ± 6.0) Spinosad (spring) 63.3 ( ± 11.5) 85.0 (± 7.0) 60.0 ( ± 17.3) Spinosad (summer) 10.1 ( ± 4.0) – – Indoxacarb 40.0 ( ± 11.6) 50 ( ± 14.2) 60 (± 13.4) Imidacloprid 100 100 100 Thiacloprid 100 100 100 Acetamiprid 100 100 100 Thiamethoxam 100 100 100 Triazamate 80 ( ± 10.0) 26.6 ( ± 15.3) – Pymetrozine 14 (0.0) 0 –
Side effects of pesticides on the predatory bug M. caliginosus The initial and residual contact toxicity of pesticides on the predatory bug M. caliginosus are given in Table 7 and Table 8.
The toxicity of abamectin, bifenazate, emamectin, indoxacarb, triazamate, methoxy-fenozide, halofenozide, pymetrozine, spinosad and thiacloprid must be considered as low, if compared with the control mortality. Assuming that surviving insect’s reproduction is not affected, these products can thus be classified as harmless to M. caliginosus and can be used for spider mite, aphid, whitefly, caterpillar and thrips control together with the predator.

48
Acetamiprid, imidacloprid and thiamethoxam were highly toxic. They killed the nymphs very rapidly. Contrasting results were obtained with thiacloprid, which turned out to be harmless to the predatory bug.
Imidacloprid, acetamiprid and thiamethoxam were at least moderately persistent (class C). Table 7. Initial contact toxicity of pesticides on the predatory bug M. caliginosus nymphs (L2-
L3). Mortality (%).
Dose (mg a.i./l)
Rate ug a.i./cm²
Mortality (%) 1 DAT
Mortality (%) 3 DAT
Abamectin 10 0.015 10 (± 8.2) 38 (±11.5) Bifenazate 150 0.225 8 (± 8.3) 18 (±16.4) Emamectin 15 0.025 32 (±25.8) 46 (±18.0) Spinosad 100 0.15 12 (± 8.3) 40 (±10.0) Indoxacarb 300 0.45 12 (± 8.9) 52 (±10.9) Imidacloprid 100 0.15 100 Thiacloprid 50 0.075 0 14 (± 5.7) Acetamiprid 100 0.15 100 Thiamethoxam 100 0.15 100 Triazamate 70 0.105 12 (±10.9) 20 (± 7.0) Pymetrozine 90 0.135 38 (±27.7) 68 (±33.4) Halofenozide 150 0.225 17 (±14.8) - Methoxyfenozide 150 0.225 18 (±20.4) - Untreated - 16 (±15.1) 44 (±18.1)
Table 8. Persistence of pesticide effect on the predatory bug Macrolophus caliginosus (L4
stage). Mortality (%).
Mortality (%) 5 DAT
Mortality (%) 15 DAT
Imidacloprid 100 60.0 (± 36.0) Acetamiprid 100 43.3 (± 11.5) Thiamethoxam 100 73.3 (± 46.1) Untreated 2.2 (± 3.9) 0.0
Side effects of pesticides on the predatory mite, A. californicus The initial contact toxicity of pesticides on A. californicus is given in Table 9. The pesticides indoxacarb, thiacloprid, bifenazate, triazamate, pymetrozine and halofenozide did not affect A. californicus and are classified as definitely harmless (class 1), assuming that surviving predatory mites’ reproduction is not affected. They can be used together with the predatory mite for caterpillar, aphid, whitefly, spider mite control.

49
Spinosad and methoxyfenozide were slightly harmful and abamectin was harmful; they should preferably undergo a persistence test or a higher tier test (semi-field or field test) to evaluate their compatibility with the predator.
Acetamiprid and thiamethoxam were toxic and must be classified in class 3 (moderately harmful). As for Macrolophus, thiacloprid is harmless, while its chemically related compounds acetamiprid and thiamethoxam are toxic. Table 9. Initial contact toxicity of pesticides on very young nymphs of the predator
Amblyseius californicus
Compound Dose (mg a.i./l)
Rate ug AI/cm²
Mortality (%) 3 DAT
Mortality (%) 6 DAT
Abamectin 10 0.015 27.5 (±12.6) 100 Bifenazate 150 0.225 12.5 (±12.5) 22.5 (±18.9) Spinosad 250 0.375 22.5 (± 9.6) 40.0 (±22.2) Indoxacarb 300 0.45 7.5 (± 5.0) 15.0 (± 7.1) Thiacloprid 100 0.15 6.7 (± 5.8) 6.7 (± 5.8) Acetamiprid 100 0.15 42.5 (± 9.6) 75.0 (±21.2) Thiamethoxam 100 0.15 35.0 (±10.0) 76.7 (± 5.8) Triazamate 70 0.105 7.5 (± 9.6) 23.7 (± 7.2) Pymetrozine 90 0.135 17.5 (±12.6) 28.0 (±15.1) Halofenozide 150 0.225 20.0 (±14.1) 20.0 (± 8.2) Methoxyfenozide 150 0.225 17.5 (±12.6) 50.0 (±14.1) Untreated - 14.0 (±19.4) 25.0 (±20.8)
Conclusions Bifenazate, halofenozide and methoxyfenozide were the only products which were harmless to the 4 beneficial organisms tested. They can be used in combination with the biocontrol agents for integrated pest control in glasshouses.
Pymetrozine was harmless for 3 beneficials (E. formosa, M. caliginosus and A. californicus) but it was toxic for O. laevigatus. The product can thus be used in combination with the aforementioned 3 beneficials. However, since the product is short-lived, it can be used in IPM but O. laevigatus should best be introduced no sooner than one week after application.
Spinosad, abamectin and triazamate can be used in IPM in glasshouses because they are short-lived. If beneficials are introduced 1 to 4 weeks after treatments, they will not suffer any effect from the products.
The neonicotinoids imidacloprid, acetamiprid and thiamethoxam, and indoxacarb turned out to be toxic, and some of them were persistent. Further testing (higher tier tests, e.g. semi-field, field tests) is necessary to evaluate their potential use in IPM in glasshouse vegetables.
Of the neonicotinoids, thiacloprid was harmless to A. californicus and M. caliginosus but toxic to E. formosa and O. laevigatus. The product can be used for aphid or whitefly control in crops in which E. formosa and O. laevigatus are not used, e.g., in sweet peppers in which western flower thrips, Frankliniella occidentalis is controlled with A cucumeris or A. degenerans instead of O. laevigatus.

50
References Abbott, S.W. 1925: A method of computing the effectiveness of insecticides. J. Econ.
Entomol. 18: 265-267. Sterk, G., S.A. Hassan, M. Baillod, F. Bakker, F. Bigler, S. Blümel, H. Bogenschütz, E.
Boller, B. Bromand, J. Brun, J.N.M. Calis, J. Coremans-Pelseneer, C. Duso, A. Garrido, A. Grove, U. Heimbach, H. Hokkanen, J. Jacas, G. Lewis, L. Moreth, L. Polgar, L. Rovesti, L. Samsoe-Petersen, B. Sauphanor, L. Schaub, A. Stäubli, J.J. Tuset, A. Vainio, M. Van de Veire, G. Viggiani, E. Vinuela & H. Vogt 1999: Results of the seventh joint pesticide testing programme carried out by the IOBC/WPRS-Working Group “Pesticides and Beneficial organisms”. BioControl 44: 99-177.
Van de Veire, M., Cornelis, W. & L. Tirry. 2001: Development of a laboratory test method to determine the duration of pesticide-effects on predatory mites. IOBC/wprs Bulletin 24 (4), 61-66.

Pesticides and Beneficial Organisms IOBC/wprs Bulletin Vol. 26 (5) 2003
pp. 51 - 55
51
Studies on side effects of some insecticides on aphid-feeding Coccinellidae in Emilia-Romagna fruit crops Edison Pasqualini & Stefano Civolani DiSTA (Dipartimento di Scienze e Tecnologie Agroambientali) - University of Bologna, Italy Abstract: The effects of six insecticides on adults of the aphidophagous coccinellids Adalia bipunctata (L.), Coccinella septempunctata (L.) and Oenopia conglobata (L.), were evaluated in field studies in apple, pear and peach orchards. The insecticides (and some of their different formulations) evaluated were the organophosphates (OP) chlorpyrifos, chlorpyrifos-methyl, azinphos-methyl and malathion, the carbamate derived Methomyl and the Nereistoxin analogues Cartap. Azinphos-methyl was consistently toxic to coccinellids with between 76% and 90.5% mortality occurring in four studies. Chlorpyrifos EC resulted in mortality ranging from 40.2% (apples,1999) to 63% (peach,2001) over five studies. Chlorpyrifos WDG mortality ranged from 50.8% to 70% over three studies. Chlorpyrifos-methyl resulted in 31% mortality in apples in 1999 and 86.1% mortality in pears in 1998. Methomyl and cartap were evaluated in a single study in apples and resulted in 66.7 and 10% mortality respectively. Malathion was evaluated in a separate study and caused 43.5% mortality.. Key words: Coccinellidae, side effects, field tests, apple, pear, peach Introduction The coccinellids (Coleoptera Coccinellidae) are very important biological control agents in fruit crops of Emilia-Romagna Region, mainly regulating aphid and mite populations (Cravedi et al., 2000; Pasqualini, 1980). Their predatory activity usually starts at medium-high level of pest density, so the natural control is not quick, but is often effective. Untreated areas (such as edge rows) close to the orchards serve as refugia and play a strategic role in increasing biological control by coccinellids. In this work the side effects (short term/microscale) of several organophosphate and carbamate derived insecticides (commonly used to control tortricids, leafminers or scale pests in Italian orchards) against aphid-feeding coccinellid species were evaluated in fields tests in apple, pear and peach orchards according to the method described by Stäubli et al., 1985. The main species of aphid feeding Coccinellids found were Adalia bipunctata (L.), Coccinella septempunctata (L.) and Oenopia conglobata (L.), in order of population density observed. In this paper only the side effects on the adult instar are reported. Materials and methods Six field trials were carried out in fruit orchards between 1998 to 2001 in the Ferrara District of Northern Italy (Table 1). Only those trials in which a significant number of coccinellids were collected have been reported. Tested products The evaluated products are shown in Table 2.

52
Trials layout Either two or three of the compounds in Table 2 were evaluated in each trial. The compounds used in each study are summarised in Table 3. Table 1. Orchard schedule
Trial Year Variety Age Training system Fruit setting
Timing
1 1999 Mondial Gala 9 Palmette 4 x 2 21 - June 2 1999 Mondial Gala 9 Palmette 4 x 2 6 - July 3 1998 Conference 9 Palmette 4 x 2 28 - June 4 2000 Conference 10 Palmette 4 x 2 12 - July 5 2000 Red Haven 10 Open vase 4,5 x 2,5 17 - August 6 2001 Red Haven 10 Open vase 4,5 x 2,5 22 - August
Table 2. Features and rate of applied products
Active ingredients (formulation)
Product name
% a. i. Formulation Rate g or ml/hl
chlorpyrifos (ME) Pyrinex 23 Microencapsulated 200 chlorpyrifos (EC) Dursban 48 Emuls. concentrate 120 chlorpyrifos (WDG) Dursban 75 WG 75 Wettable microgranule 70 chlorpyrifos-methyl (EC) Reldan 22 22 Emuls. concentrate 200 malathion (EW) Smart 40 Flowable 200 methomyl (EC) Lannate L 19 Emuls. concentrate 200 cartap (WDG) Sanvex 25 SG 25 Wettable microgranule 200 azinphos-methyl (PB) Lathion metil 25 Wettable powder 200
Table 3. Overview of the tested insecticides in 6 trials
Trial n°1 (apple 1998)
Trial n°2 (apple 1998)
Trial n°3 (pear 1998)
control (water) control(water) control (water) chlorpyriphos (ME) methomyl (EC) chlorpyr. (WDG) chlorpyriphos (EC) cartap (WDG) chlorpyrifos. methyl
(EC) malathion (EW) - azinphos methyl (PB)
Trial n°4 (pear 2000)
Trial n°5 (peach 2000)
Trial n°6 (peach 2001)
control (water) control (water) control (water) chlorpyrifos (WDG) chlorpyrifos (WDG) chlorpyrifos. (WDG) chlorpyrifos.(EC) chlorpyrifos (EC) chlorpyrifos (EC) azinphos methyl (PB) azinphos methyl (PB) azinphos methyl (PB)

53
Trial design The trials were carried out using the methodology reported by Stäubli et al. (1985). For sampling treatment effects (S1 and S2) and inventory spray sampling (Sj) two trees in the centre of each plot had a cotton sheet (2 x 1,5 m) pegged beneath them to collect falling specimens. For inventory spray sampling an application of deltamethrin using 2.5-g a. i. hl-1 by back-pack-mounted mist blower was made immediately after the second sampling (I) (48 h after spray treatment (T)). Each tree was treated until the point of insecticide run-off (about 12 hl/ha). Specimens were removed from the collecting sheets either 24 (S1 ) or 48 h (S2) after spraying treatment (T) and 7 h after inventory spray (I). The randomised block (4-5 trees/plot) with four replicates (each one on an alternate row to avoid the drift as much as possible) was the experimental design adopted (Brown, 1989).
The degree of harmfulness (%) was evaluated using the following formula reported by Stäubli et al. (1985):
degree of harmfulness ( )( ) 100)(
21
210
0 ×⎥⎥⎦
⎤
⎢⎢⎣
⎡
+++
=jSSS
SS
where S1 + S2 represent the mean number of individuals killed by a treatment and collected 12 and 24 h respectively and S1 + S2 + Sj is the mean population of the tree, given by the sum of those killed and those which survived. Since the data generated are "percentage values" they were transformed to arcsin squareroot before conducting analysis. Percentage harmfulness was corrected for control mortality using the Schneider-Orelli formula (Reference) and analysed by analysis of variance. An LSD test was used to separate the means. The products were classified into four classes according to the IOBC/wprs WG ”Pesticides and Beneficial Organims”: 0-25% = harmless (1); 25-50% = slightly harmful (2); 50-75% = moderately harmful (3); > 75% = very harmful (4) (Stäubli et al., 1985).
Results
The results of each trial are reported in the following Tables (4-9). As a whole azinphos-methyl seems to be more toxic in comparison to the other tested products to the coccinellid adults. Chlorpyrifos (and chlorpyrifos-methyl one trial only) appears to be less toxic than azinphos-methyl and no significant differences among product and formulation were observed. Methomyl confirms the high value of toxicity, while cartap appears selective. The toxic values obtained for chlorpyrifos in apple orchard were lower than on pear and peach, although further trials would be necessary to confirm these first results. Table 4. Trial 1: results obtained (apple 1999)
Treatments Mean of collected
coccinellids (S1 + S2)
Mean of collected
coccinellids (S1 + S2 + Sj)
% mortality (average
died)
% corrected mortality
Toxicity class
IOBC
control (water) 0.75 ± 0.5 13.5 ± 1 5.6 a chlorpyrifos (ME) 5.75 ± 5.56 16.5 ± 8.06 34.8 b 31.0 2 malathion (EW) 13.75 ± 7.32 29.5 ± 7.23 46.6 c 43.5 2 chlorpyrifos (EC) 14.25 ± 10.59 32.75 ± 11.95 43.5 bc 40.2 2

54
Table 5. Trial 2: results obtained (apple 1999)
Treatments Mean of collected
coccinellids (S1 + S2)
Mean of collected
coccinellids (S1 + S2 + Sj)
% mortality % corrected mortality
Toxicity class
IOBC
control (water) 0 3.0 ± 3.37 0 a – cartap (200) 0.8 ± 1.5 7.5 ± 5.92 10.0 a 10.0 1 methomyl (200) 7.0 ± 5.35 11.0 ± 7.68 66.7 b 66.7 3 Table 6. Trial 3: results obtained (pear 1998).
Treatments Mean of collected
coccinellids (S1 + S2)
Mean of collected
coccinellids (S1 + S2 + Sj)
% mortality % corrected mortality
Toxicity class
IOBC
control (water) 0.38 ± 0.48 0.87 ± 1.44 40.0 a chlorpyr. (ME) 2.63 ± 0.48 2.94 ± 0.13 91.7 b 86.1 4 ch. methyl (EC) 2.19 ± 0.55 2.81 ± 0.38 81.9 b 69.7 3 a. methyl (PB) 1.56 ± 0.52 2.25 ± 1.26 88.9 b 81.5 4
Table 7. Trial 4: results obtained (pear 2000).
Treatments Mean of collected
coccinellids (S1 + S2)
Mean of collected
coccinellids (S1 + S2 + Sj)
% mortality % corrected mortality
Toxicity class
IOBC
control (water) 1.94 ± 1.46 15.0 ± 4.43 12.9 a – chlorpyr. (WDG) 12.00 ± 9.49 24.5 ± 9.98 57.14 b 50.8 3 chlorpyr. (EC) 9.69 ± 5.60 23.5 ± 4.12 50.0 b 42.6 2 a. methyl (PB) 36.4 ± 12.48 45.5 ± 7.42 91.76 c 90.5 4 Table 8. Trial 5: results obtained (peach 2000).
Treatments Mean of collected
coccinellids (S1 + S2)
Mean of collected
coccinellids (S1 + S2 + Sj)
% mortality % corrected mortality
Toxicity class
IOBC
control (water) 0 1.5 ± 0.58 0 a – chlorpyr. (WDG) 1.69 ± 1.03 2.5 ± 1.91 70.0 b 70.0 3 chlorpyrifos (EC) 1.19 ± 0.99 2.0 ± 1.41 62.5 b 62.5 3 a. methyl (PB) 6.5 ± 3.79 7.5 ± 4.65 80.0 b 80.0 4

55
Table 9. Trial 6: results obtained (peach 2001)
Treatments Mean of collected
coccinellids (S1 + S2)
Mean of collected
coccinellids (S1 + S2 + Sj)
% mortality % corrected mortality
Toxicity class
IOBC
control (water) 0.31 ± 0.47 2.5 ± 1.29 10 a chlorpyr. (WDG) 1.44 ± 0.66 3.0 ± 1.41 66.7 b 63 3 chlorpyrifos (EC) 1.81 ± 0.38 3.0 ± 0.82 66.7 b 63 3 a. methyl (PB) 5.38 ± 2.06 7.0 ± 2.16 78.6 b 76 4
Conclusions
Some OP and Carbamate derived compounds commonly used to control pests in Emilia-Romagna (i. e. tortricids, leafminers and scale insects) are toxic or very toxic to the adults of the aphid-feeding Coccinellid species Adalia bipunctata (L.), Coccinella septempunctata (L.) and Oenopia conglobata (L.), which were present in the orchards. In particular Azinphos-methyl showed a very low level of selectivity, lower than OPs based on Chlorpyrifos. Methomyl (one trial) is toxic, while Cartap seems to be selective.
Despite different levels of insect numbers collected in different trials the results obtained (degree of harmfulness) are consistent. However, since the trees sprayed with the most toxic products appeared to have had the largest numbers of coccinellids there is clearly some element of bias due to the relatively small plot size. Adult coccinellids are mobile and would have landed on the treated trees, died and added to their apparent catch size. The extent of this bias can be taken into account by considering the catch size from control trees. Despite this bias the data are meaningful and the results are consistent. References Brown, K.C. 1989: The design of experiments to asses the effects of pesticides on beneficials
arthropods in orchards: replication versus plot size. – In: Jepson, P.C. (Ed.): Pesticides and non-target invertebrates, Intercept: 71-80.
Cravedi, P., Giovannini, D., Molinari, F., Donati, G., Ponti, I. 2000: Confronto tra due pescheti a gestione convenzionale e integrata. – Inf. Agr. 56 (31): 67-70.
Pasqualini, E. 1980: The role of Stethorus punctillum Weise (Coleoptera, Coccinellidae) in the integrated control of the European red mite in apple orchards. IOBC/wprs Bull. 3(6): 23.
Schneider-Orelli, O. (Ed.) 1947: Entomologisches Praktikum. – Verlag H. R. Sauerländer and Co, Aarau, Schweiz.
Stäubli, A., Reboulet, J.N., Blaisinger, P. 1985: Arthropod fauna in apple orchards. – In: Hassan, S.A. (ed.): Standard methods to test the side effects of pesticides on natural enemies of insects and mites”. Bull. OEPP/EPPO 15: 250-255.

56

Pesticides and Beneficial Organisms IOBC/wprs Bulletin Vol. 26 (5) 2003
pp. 57 -65
57
Water trapping winged insects in cereal fields – trap design and edge effects
Dominic Eyre & Garry Pease Ecotox Ltd, P.O. Box 1, Tavistock, Devon, PL19 0YU, England
Abstract: Water traps are one of several methods used to sample flying arthropods in cereal fields. A novel design of water trap, including a plywood cover placed 30 cm above the water was evaluated by comparing the catch to standard open traps. The trap was designed to test the hypothesis that large numbers of non-crop related arthropods land in the traps and obscure treatment effects. Traps were established in three replicates in fields sown with winter barley. The traps were positioned 3m, 15m and 30m away from the field margin in plots (>1 ha) of two treatments: water control and lambda-cyhalothrin applied at 20 g ai ha-1. The traps were set on three occasions for 3-5 days. The covered traps were not found to be better at detecting treatment differences and so the hypothesis that treatment effects are obscured was rejected. Data from both types of trap combined showed that the water traps were able to detect treatment effects one month after the final application.
Key words: cereal field, water traps, Diptera, field margin, flying invertebrates, field sampling
Introduction
Large scale field trials designed to assess treatment effects and subsequent recovery of non-target arthropod fauna within cereal crops rely on the appropriate use of trapping and sampling methods to produce meaningful results. All sampling techniques have advantages and disadvantages with regard to their efficiency and ability to give meaningful results depending upon the circumstances in which they are used. Pitfall trapping is a widely accepted method for sampling populations of epigeal (ground-living) taxa principally the beetle (Coleoptera) families Carabidae and Staphylinidae, the spider (Araneae) family Linyphiidae and springtails (Collembola) (Luff, 1996, Frampton, 2002 and Anon., 1995) and has been described as irreplaceable in studies covering a few habitats or a wide area (Kromp, 1999). In this small scale study we evaluated one method of assessing the effects of treatments upon airborne taxa such as Diptera and Hymenoptera. The study investigated the hypothesis that yellow water traps attract large numbers of non-crop insects from a long way above the crop and that these insects would have the effect of swamping the data and masking effects of treatments on the within-crop fauna. This study investigated to what extent, if any, treatment effects upon flying arthropods could be detected with the use of two kinds of yellow water trap in a barley crop following the application of a chemical treatment and water control. Novel covered traps were used in comparison with conventional open water traps in six large plots and were situated on a transect from the hedgerow boundary towards the centre of the field. The aims of the work were to answer the following questions: i) Can treatment effects be detected one month after application? ii) Do covered traps exclude certain types of taxa and if so which ones? iii) Do the catches differ along a diversity gradient from a field boundary to field centre?

58
Fig. 1: a) exploded view of trap components, as seen above ground, b) standard open yellow
water trap and c) novel covered yellow water trap. Material and methods Study site and experimental design The study was conducted in barley fields used for a larger field study at Shortburn Farm, Milton Abbot, Devon, UK (Grid reference: SX 415780). For the purposes of this study, two treatments were studied in three replicates: water control and lambda-cyhalothrin applied at 20g ai ha-1. Each plot was at least 1 hectare, bounded by a hedgerow and a 6m untreated headland. The treatments were applied in a volume of 400l ha-1 using a dedicated agricultural boom sprayer on three occasions in the spring of 2002: on 3 May, 15 May and 31 May 2002. Six traps were established in each plot (three open and three covered). One of each type of trap was placed 3m from the hedgerow (within the untreated field margin), and also one of each type 15m and 30m from the hedgerow. Trap design Both open and covered traps consisted of a 1.5 metre, 50 x 50mm wooden stake. Holes were drilled through the top half of the stake at approximately 100mm intervals to take an adjustable horizontally mounted wooden arm onto which a 1litre, plastic container was secured. A second identical plastic container was sprayed yellow. This container fitted tightly
c) b)
a)
Removable yellow water
trap
Adjustable arms attach to wooden
stake
Stake hammered into ground
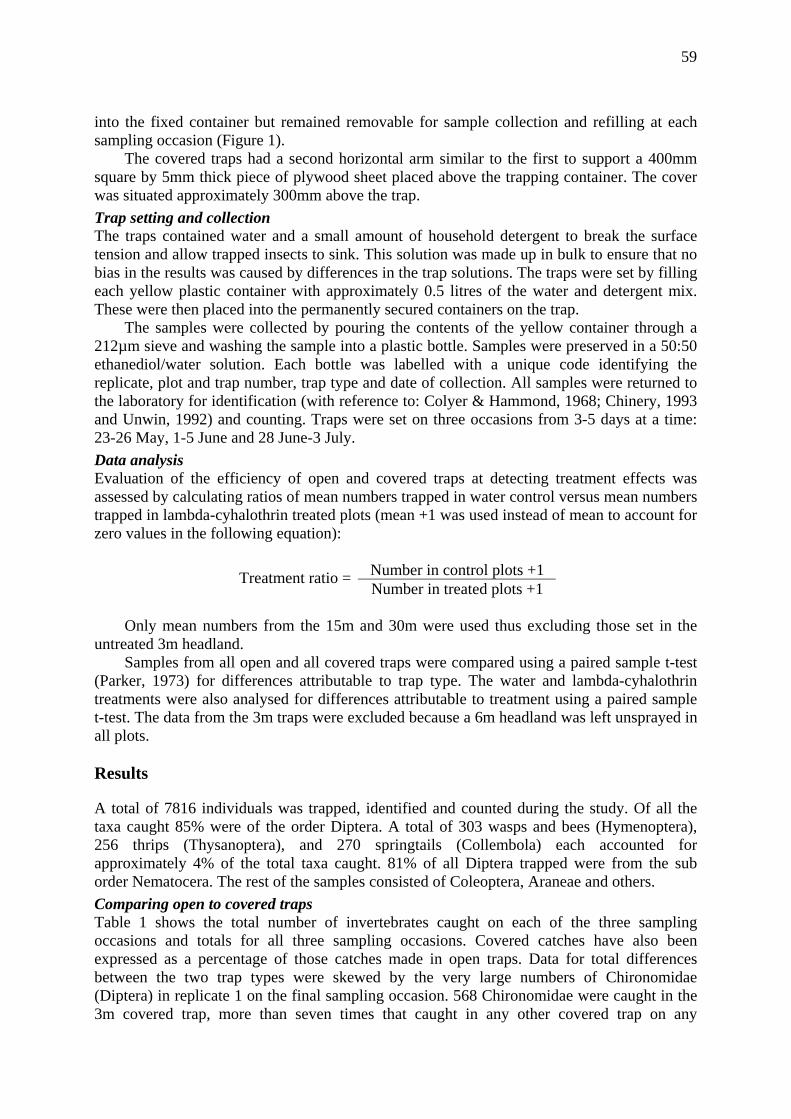
59
into the fixed container but remained removable for sample collection and refilling at each sampling occasion (Figure 1). The covered traps had a second horizontal arm similar to the first to support a 400mm square by 5mm thick piece of plywood sheet placed above the trapping container. The cover was situated approximately 300mm above the trap. Trap setting and collection The traps contained water and a small amount of household detergent to break the surface tension and allow trapped insects to sink. This solution was made up in bulk to ensure that no bias in the results was caused by differences in the trap solutions. The traps were set by filling each yellow plastic container with approximately 0.5 litres of the water and detergent mix. These were then placed into the permanently secured containers on the trap. The samples were collected by pouring the contents of the yellow container through a 212µm sieve and washing the sample into a plastic bottle. Samples were preserved in a 50:50 ethanediol/water solution. Each bottle was labelled with a unique code identifying the replicate, plot and trap number, trap type and date of collection. All samples were returned to the laboratory for identification (with reference to: Colyer & Hammond, 1968; Chinery, 1993 and Unwin, 1992) and counting. Traps were set on three occasions from 3-5 days at a time: 23-26 May, 1-5 June and 28 June-3 July. Data analysis Evaluation of the efficiency of open and covered traps at detecting treatment effects was assessed by calculating ratios of mean numbers trapped in water control versus mean numbers trapped in lambda-cyhalothrin treated plots (mean +1 was used instead of mean to account for zero values in the following equation):
Number in control plots +1 Treatment ratio =Number in treated plots +1
Only mean numbers from the 15m and 30m were used thus excluding those set in the untreated 3m headland. Samples from all open and all covered traps were compared using a paired sample t-test (Parker, 1973) for differences attributable to trap type. The water and lambda-cyhalothrin treatments were also analysed for differences attributable to treatment using a paired sample t-test. The data from the 3m traps were excluded because a 6m headland was left unsprayed in all plots. Results
A total of 7816 individuals was trapped, identified and counted during the study. Of all the taxa caught 85% were of the order Diptera. A total of 303 wasps and bees (Hymenoptera), 256 thrips (Thysanoptera), and 270 springtails (Collembola) each accounted for approximately 4% of the total taxa caught. 81% of all Diptera trapped were from the sub order Nematocera. The rest of the samples consisted of Coleoptera, Araneae and others. Comparing open to covered traps Table 1 shows the total number of invertebrates caught on each of the three sampling occasions and totals for all three sampling occasions. Covered catches have also been expressed as a percentage of those catches made in open traps. Data for total differences between the two trap types were skewed by the very large numbers of Chironomidae (Diptera) in replicate 1 on the final sampling occasion. 568 Chironomidae were caught in the 3m covered trap, more than seven times that caught in any other covered trap on any
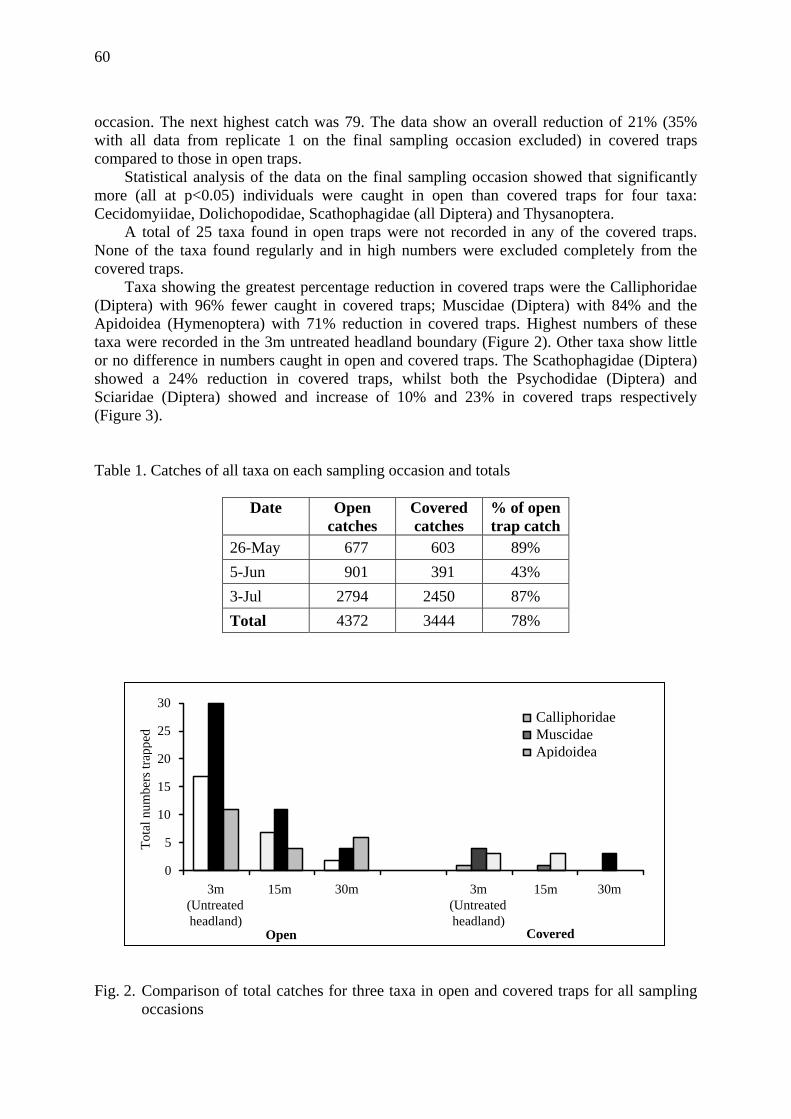
60
occasion. The next highest catch was 79. The data show an overall reduction of 21% (35% with all data from replicate 1 on the final sampling occasion excluded) in covered traps compared to those in open traps. Statistical analysis of the data on the final sampling occasion showed that significantly more (all at p<0.05) individuals were caught in open than covered traps for four taxa: Cecidomyiidae, Dolichopodidae, Scathophagidae (all Diptera) and Thysanoptera. A total of 25 taxa found in open traps were not recorded in any of the covered traps. None of the taxa found regularly and in high numbers were excluded completely from the covered traps. Taxa showing the greatest percentage reduction in covered traps were the Calliphoridae (Diptera) with 96% fewer caught in covered traps; Muscidae (Diptera) with 84% and the Apidoidea (Hymenoptera) with 71% reduction in covered traps. Highest numbers of these taxa were recorded in the 3m untreated headland boundary (Figure 2). Other taxa show little or no difference in numbers caught in open and covered traps. The Scathophagidae (Diptera) showed a 24% reduction in covered traps, whilst both the Psychodidae (Diptera) and Sciaridae (Diptera) showed and increase of 10% and 23% in covered traps respectively (Figure 3). Table 1. Catches of all taxa on each sampling occasion and totals
Date Open catches
Covered catches
% of open trap catch
26-May 677 603 89% 5-Jun 901 391 43% 3-Jul 2794 2450 87% Total 4372 3444 78%
Fig. 2. Comparison of total catches for three taxa in open and covered traps for all sampling
occasions
0
5
10
15
20
25
30
3m(Untreatedheadland)
30m 3m(Untreatedheadland)
30m
CalliphoridaeMuscidaeApidoidea
15m 15m
Open Covered
Tota
l num
bers
trap
ped
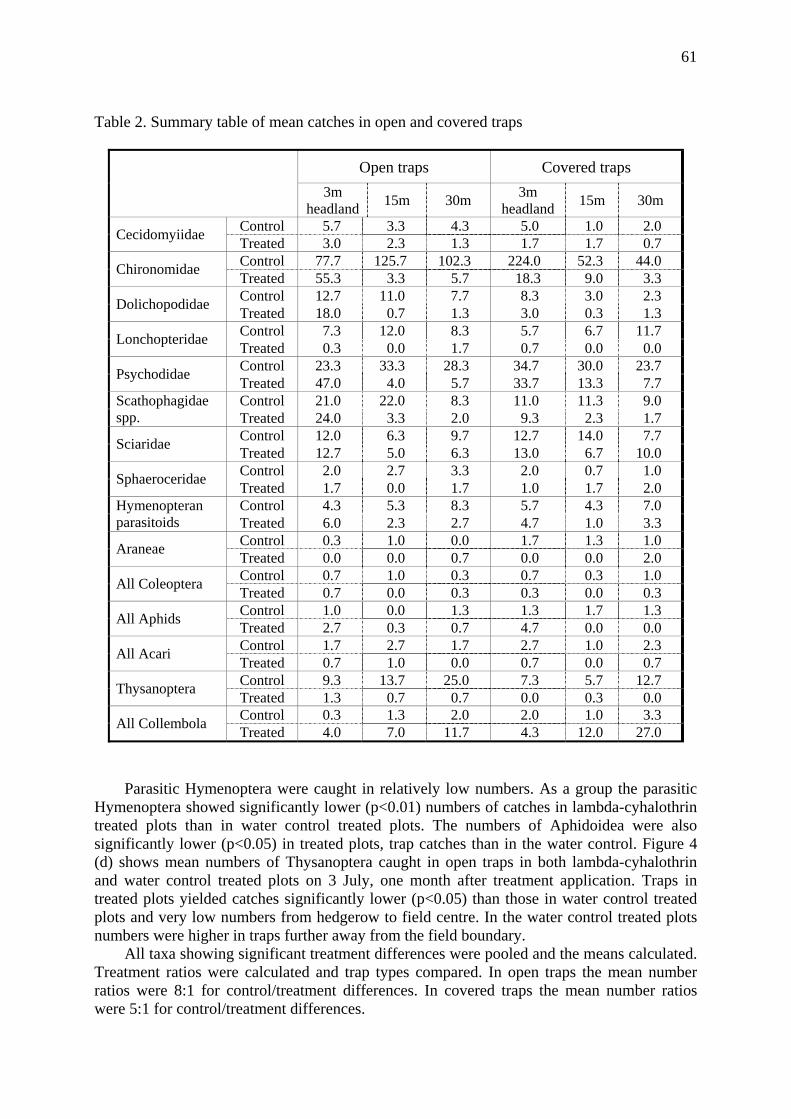
61
Table 2. Summary table of mean catches in open and covered traps
Open traps Covered traps 3m
headland 15m 30m 3m headland 15m 30m
Control 5.7 3.3 4.3 5.0 1.0 2.0 Cecidomyiidae Treated 3.0 2.3 1.3 1.7 1.7 0.7 Control 77.7 125.7 102.3 224.0 52.3 44.0 Chironomidae Treated 55.3 3.3 5.7 18.3 9.0 3.3 Control 12.7 11.0 7.7 8.3 3.0 2.3 Dolichopodidae Treated 18.0 0.7 1.3 3.0 0.3 1.3 Control 7.3 12.0 8.3 5.7 6.7 11.7 Lonchopteridae Treated 0.3 0.0 1.7 0.7 0.0 0.0 Control 23.3 33.3 28.3 34.7 30.0 23.7 Psychodidae Treated 47.0 4.0 5.7 33.7 13.3 7.7 Control 21.0 22.0 8.3 11.0 11.3 9.0 Scathophagidae
spp. Treated 24.0 3.3 2.0 9.3 2.3 1.7 Control 12.0 6.3 9.7 12.7 14.0 7.7 Sciaridae Treated 12.7 5.0 6.3 13.0 6.7 10.0 Control 2.0 2.7 3.3 2.0 0.7 1.0 Sphaeroceridae Treated 1.7 0.0 1.7 1.0 1.7 2.0 Control 4.3 5.3 8.3 5.7 4.3 7.0 Hymenopteran
parasitoids Treated 6.0 2.3 2.7 4.7 1.0 3.3 Control 0.3 1.0 0.0 1.7 1.3 1.0 Araneae Treated 0.0 0.0 0.7 0.0 0.0 2.0 Control 0.7 1.0 0.3 0.7 0.3 1.0 All Coleoptera Treated 0.7 0.0 0.3 0.3 0.0 0.3 Control 1.0 0.0 1.3 1.3 1.7 1.3 All Aphids Treated 2.7 0.3 0.7 4.7 0.0 0.0 Control 1.7 2.7 1.7 2.7 1.0 2.3 All Acari Treated 0.7 1.0 0.0 0.7 0.0 0.7 Control 9.3 13.7 25.0 7.3 5.7 12.7 Thysanoptera Treated 1.3 0.7 0.7 0.0 0.3 0.0 Control 0.3 1.3 2.0 2.0 1.0 3.3 All Collembola Treated 4.0 7.0 11.7 4.3 12.0 27.0
Parasitic Hymenoptera were caught in relatively low numbers. As a group the parasitic Hymenoptera showed significantly lower (p<0.01) numbers of catches in lambda-cyhalothrin treated plots than in water control treated plots. The numbers of Aphidoidea were also significantly lower (p<0.05) in treated plots, trap catches than in the water control. Figure 4 (d) shows mean numbers of Thysanoptera caught in open traps in both lambda-cyhalothrin and water control treated plots on 3 July, one month after treatment application. Traps in treated plots yielded catches significantly lower (p<0.05) than those in water control treated plots and very low numbers from hedgerow to field centre. In the water control treated plots numbers were higher in traps further away from the field boundary. All taxa showing significant treatment differences were pooled and the means calculated. Treatment ratios were calculated and trap types compared. In open traps the mean number ratios were 8:1 for control/treatment differences. In covered traps the mean number ratios were 5:1 for control/treatment differences.

62
Fig. 3. Comparison of total catches for three taxa in open and covered traps for all sampling
occasions Treatment effects Water traps in plots treated with lambda-cyhalothrin yielded catches that were significantly lower than those caught in control treated plots for several taxa at both one day and one month after the final treatment application. Numbers were higher and treatment effects were clearer in open rather than covered traps. Figure 4(a) shows mean numbers of Chironomidae (Diptera) caught in both open and covered traps between 1 and 5 June 2002, 1-5 days after treatment. Samples collected from traps on 3 July 2002, one month after the final treatment showed that numbers were significantly lower in lambda-cyhalothrin treated plots than in water control plots for four Dipteran taxa. Figure 4 (b&c) shows mean numbers of two families of Diptera caught in treated and untreated plots. The graphs show that numbers are similar in both treated and untreated plots in traps set within the 3m untreated headland, but are significantly lower for both Scathophagidae (p<0.001) and Dolichopodidae (p<0.01) in traps set in lambda-cyhalothrin treated plots at distances further into the field. Other families of Diptera show significantly lower mean numbers in treated plots compared to water control plots at one month after treatment were: Lonchopteridae (p<0.001) and Psychodidae (p<0.01 ). Discussion
Water traps rely on flying or ballooning animals to land on the water surface by chance or some attractive property of the trap. In temperate agricultural ecosystems such as those in cereal fields a large percentage of the total taxa collected in yellow water traps are from the order Diptera. In comparison to other taxonomic groups collected in this manner dipteran catches also show great diversity with many families represented (Pollet & Grootaert, 1994). The colour of the trap and its height above the ground are important influences on the species composition of the traps (Pollet & Grootaert, 1994). This selectivity demonstrates that only a proportion of possible flying invertebrates will be caught in water traps of a particular colour. This does not mean that they are unsuitable for studying ecotoxicological effects, but means that where possible they should be used in conjunction with other complimentary sampling methods. One advantage of water trapping over sweep netting is that there is not so much operator error, i.e. two different field workers can expect to find different results by sweep
Total numbers caught in open and covered traps for three taxa
050
100150200250300350
3m(Untreatedheadland)
30m 3m(Untreatedheadland)
30m
PsychodidaeSciaridaeScathophagidae
Open Covered
15m 15m

63
netting, whereas water trapping should reduce differences. Another alternative to water trapping is suction trapping with a device such as a D-vac or updated versions (Stewart & Wright 1995). The results from suction traps are dependent on the manner of their operation (Lott & Eyre 1996) and so can be considered to be less repeatable than water trapping, when a number of workers are involved. The samples from water traps tend to be comparatively clean and require little sorting prior to examination, whereas sweep-net and suction samples tend to contain a lot of vegetation as well as the arthropods.
Fig. 4. Mean numbers of a) Chironomidae (Diptera) caught in open and covered traps at 1-5 days after final treatment and b) Scathophagidae (Diptera), c) Dolichopodidae (Diptera) and d) Thysanoptera in open traps at 28-33 after final treatment.
The extent to which novel traps excluded certain types of taxa varied. The largest differences were observed for three taxa (Figure 2). The Calliphoridae (Diptera), Muscidae (Diptera) and Apidoidea (Hymenoptera) were caught in lower numbers in covered traps. The Scathophagidae (Diptera), Psychodidae (Diptera) and Sciaridae (Diptera) are three taxa showing little or no difference in covered or open traps are shown in Figure 2. Covered traps
0
10
20
30
40
50
60
3m(Untreatedheadland)
15m 30m
Open Covered
0
10
20
30
40
50
60
3m(Untreatedheadland)
15m 30m
Water controlLambda-cyhalothrin
(b)
0
5
10
15
20
25
30
3m(Untreatedheadland)
15m 30m
Open
(c)
0
5
10
15
20
25
30
3m(Untreatedheadland)
15m 30m
Open
(d)
0
5
10
15
20
25
30
3m(Untreatedheadland)
15m 30m
Open

64
were found to exclude some of the larger more transient groups such as the bees (Hymenoptera: Apidoidea), which are less likely to be field residents, due to the limited sources of nectar and could be regarded as a taxon that obscure treatment effects. The use of water traps enabled treatment effects to be detected one month after the final treatment application. Several taxa showed significant differences between trap catches in water control plots and those in lambda-cyhalothrin treated plots. A ratio of the number of taxa caught in control plots versus the number caught in treated plots was calculated for taxa shown to be affected by the treatments one month after the final application. This ratio gives a measure of the effectiveness of the two trap types to detect differences between treatments. Water control to treatment ratios for mean numbers caught were over all higher in open traps than in covered traps. This ratio shows that there was a greater difference in numbers between the two treatments (water and lambda-cyhalothrin) in the open traps than in the covered traps. If the open traps were being swamped by invertebrates unaffected by the treatments or from outside the crop ecosystem, we would expect there to be a smaller difference in numbers between the treated and untreated areas. As this was not the case, we reject the hypothesis that covered traps exclude non-crop related taxa and therefore show clearer treatment effects. Summary Table 2 shows wide variation in response to treatments between different fly families and emphasises the need for taxonomy to be taken to the highest level possible. The Sciaridae and Chironomidae are both nematoceran fly families which show different response patterns to the application of a chemical treatment. Numbers of both families were similar in the 3 m traps within the 6 m untreated headland for treated and untreated plots. Whilst the Sciaridae showed no response to treatment, the Chironomidae numbers were lower in lambda- cyhalothrin plots towards the field centre. Grouping families of the same order would have had the effect of masking treatment differences. On a spatial scale it was also possible to detect changes in community structure from the field boundary to the field centre for many taxa. Numbers were generally higher for most dipteran taxa at the field margin and showed little difference between treatment and water control plots in the untreated headland. Differences between treatments were apparent at distances of 12m from the headland traps for the two predatory flies Scathophagidae and Dolichopodidae in the treated plots whilst showing gradual decline in the control plots (Figure 4) towards the field centre. Conversely mean catches in the water control for Thysanoptera show a gradual increase from field margin to field centre (Figure 4). These trends could be due to differences in feeding strategies and/or predator/prey relationships between these and other taxa. However no statistical analysis for this data were performed and such speculations have been presented here only as discussion points for more detailed work in the future. One drawback of pitfall trapping is that the samples are a function of activity and density rather than a measure of just density as discussed by Lott & Eyre (1996) and Garcia et al. (2000). This drawback also applies to water trapping, because the trapping method is dependent upon invertebrate activity. Some of the problems of activity dependent sampling (e.g. effects of weather or crop density) can be disregarded in replicated field studies if plots are similar and if the results are interpreted in a comparative manner rather than as an absolute measure of toxic effects. In conclusion, water traps can be considered a useful method of sampling flying invertebrates in ecotoxicological field studies. In this small-scale study, some Diptera, Thysanoptera and parasitic Hymenoptera were caught in yellow water traps in numbers sufficient for statistical analysis. In a full field study, with four replicates and several traps per plot, it is anticipated that a wider ranger of taxa (including data for Hymenoptera at the Family or possibly species level) would be caught in numbers sufficient for analysis.

65
Difficulties such as those encountered with the large number of Chironomidae in one trap on the final sampling occasion show that larger scale trials with more traps and additional sampling dates may yield more reliable results. Water traps would not be suitable for detecting direct effects upon highly mobile species which may be expected to travel over distances greater than the plot size in short periods of time. Yellow water traps are selective to certain taxa, but should be used in conjunction with other trap types where possible. The novel covered trap design was not found to be more effective at detecting differences between chemical treatments. Modifications such as extending trapping time and the addition of pre-treatment sampling occasions should be a consideration for future work.
References
Anonymus 1995: Guideline to study the within-season effects of insecticides on non-target terrestrial arthropods in cereals in summer. – Part Three/A3/Appendix 2 of The Registration Handbook (Pesticides Safety Directorate), formerly WD 7/7 in the Data Requirements Book.
Colyer, C.N. & Hammond, C.O. 1968: Flies of the British Isles. Frederick Warne & Co. Limited, London.
Chinery, M. 1993: Collins Field Guide. Insects of Britain and Northern Europe, 3rd Edition. – Harper Collins, London.
Frampton, G.K. 2002: Long-term impacts of an organophosphate-based regime of pesticides on field and field-edge Collembola communities. – Pest Management Science 58: 991-1001 (online 2002).
Garcia, A.F., Griffiths, G.J.K., Thomas, C.F.G. 2000: Density, distribution and dispersal of the carabid beetle Nebria brevicollis in two adjacent cereal fields. – Annals of Applied Biology 137(2): 89-97.
Kromp, B. 1999: Carabid beetles in sustainable agriculture: a review on pest control efficacy, cultivation impacts and enhancement. – Agriculture, ecosystems and environment 74: 187-228.
Lott, D.A. & Eyre, M.D. 1996: Invertebrate sampling methods. – In: Environmental monitoring, surveillance and conservation using invertebrates (ed Eyre, M.D.), EMS publications, Newcastle upon Tyne, England: 9-13.
Luff, M.L. 1996: Environmental assessments using ground beetles (Carabidae) and pitfall traps. – In: Environmental monitoring, surveillance and conservation using invertebrates (ed Eyre, M.D.), EMS publications, Newcastle upon Tyne, England: 42-47.
Parker, R.E. 1973: Introductory statistics for biology. Institute of Biology, Vol. 43, 122 pp., Edward Arnold, London.
Pollet, M. & Grootaert, P. 1994: Optimising the water trap technique to collect Empidoidea (Diptera). – Studia Dipterologica 1: 33-48.
Stewart, A.J.A. & Wright, A.F. 1995: A new suction apparatus for sampling arthropods in grassland. – Ecological Entomology 20: 98-102.
Unwin, D.M. 1992: A key to the families of British Diptera. – Field Studies Council. Preston Montford, Shrewsbury, U.K.

66

Pesticides and Beneficial Organisms IOBC/wprs Bulletin Vol. 26 (5) 2003
pp. 67 -72
67
Sampling methods in orchard trials: A comparison between beating and inventory sampling Jutta Müther & Heidrun Vogt GAB Biotechnologie GmbH, Eutinger Str. 24, 75223 Niefern-Öschelbronn, Germany BBA, Institute for Plant Protection in Fruit Crops, Schwabenheimerstr. 101, 69221 Dossenheim, Germany Abstract: Two methods to assess leaf dwelling arthropods in the tree canopy of orchards were compared. The methods were beating sampling and inventory sampling. Both methods were applied at the same time in the same apple orchard in Southern Germany during 2002. Beside the arthropods collected, supplementary information concerning time, manpower and necessary plot sizes are discussed. Excluding spot wise occurring arthropods the variability between replicates was comparable for both sampling methods. Beating sampling is considered an adequate method for studies, which demand a continuous and/or flexible sampling schedule in trials where arthropods are relatively abundant at the test site. Compared to inventory sampling beating is a low input method concerning time and manpower. Inventory sampling in contrast is of preference for test sites with lower abundance of arthropods and when a comprehensive assessment of the species diversity is demanded. Key words: sampling methods, arthropods, orchards Introduction The arthropod fauna to be investigated in orchards can be divided into three main groups: mites, aerial arthropods and leaf dwelling arthropods.
Two of the main methods to assess leaf dwelling arthropods quantitatively are beating sampling and inventory sampling (Brown, 1989, Brown, 1998, Reboulet, 1994, Sechser, 1985, Sechser & Bathe, 1978). Whereas beating sampling is biased towards species that are easily dislodged but which do not fly when disturbed (Sutherland, 1996), inventory sampling is biased towards the total fauna of one tree (Brown, 1989). Inventory sampling is space intensive, while also smaller orchards can be used for the beating method with a fully replicated design. The quality and suitability of these two methods are often under discussion and there is a lack of information up to which extend the results obtained are comparable. Brown (1989) reports about a comparison of different sampling methods, including inventory and beating sampling. However, with beating only few branches were used per sample resulting in a rather moderate range of taxa and individuals. In order to elaborate more information concerning reproducibility, sample composition and yield, advantages and disadvantages of both methods a field trial was conducted comparing directly both sampling methods. In this publication the results from the pre-treatment-sampling are presented. Material and methods Test site The field trial was performed in July 2002 in an apple orchard belonging to the experimental field of the BBA at Dossenheim. The orchard was planted in 1981 (planting distance 4 m x

68
4 m) with the varieties ‘Golden Delicious’, ‘Jonagold’ and ‘Goldparmäne’. The size of the orchard is approximately 5000 m2, the varieties used for the samplings were ‘Golden Delicious’ and ‘Jonagold’. Beating sampling For this sampling 20 branches per sample were strongly tapped with a stick (3 times per branch), and the dislodged invertebrates were caught in a beating funnel held beneath. The upper opening of the beating funnel had a collection area of 0.25 m2, i.e. the lengths of the borders were 40.5 cm x 62 cm. Only one branch was beaten per tree. The arthropods collected in the collection bag (polyethylene bag) fixed at the bottom of the funnel were transferred immediately to a freezer in order to kill them and for storage until cleaning of the samples. Later the samples were cleaned and the arthropods were transferred to 70 % alcohol until determination.
The number of replicates was five. One apple variety was sampled per replicate. Inventory sampling A description of full inventory sampling is given in Sechser & Bathe (1978) and Sechser (1985) together with a short discussion on the method. The sampling started with the erection of two collection sheets beneath each selected tree. The collection sheets used were made of polyethylene and had a size of 5 m x 2 m. The sheets were attached to the ground with two hooks per sheet and stretched by fixing them to poles at each corner of the sheet as well as in the middle of both long sides of the sheets to avoid removal through wind. The insecticidal active ingredient dichlorvos (at 0.2 %), which has strong contact activity, was applied to the selected trees to run-off with a motorised knapsack sprayer. All specimens that fell into the sheets were collected for a period of two hours. After this waiting period the sheets were fold up and the organisms caught were removed with a water flow into a large dish (4 L). Collected arthropods in the dishes were filtered through a gossamer, transferred to collection boxes, filled up with 70 % alcohol and transported to the laboratory. The samples were cleaned and stored into 70 % alcohol until determination.
The number of replicates was five. Both sampling methods were applied on the same day and started at the same time to
avoid as far as possible the effect of weather on the study. As supplementary data the time needed for the different sampling procedures and number of persons involved were noted. Results and discussion Time and manpower For a beating sampling comprising 20 branches beaten per sample one persons needs 10-12 minutes per sample. Ten samples can be taken in a time of 1h 45min to 2 h.
For the inventory sampling the time calculation has to be split into different parts: 1) the erection of the collection sheets, 2) the application of the insecticide, 3) the waiting period and 4) the transfer of the arthropods from the sheets to the collection boxes. For the handling of an inventory sampling at least 3-4 persons should be available. Four persons can do the sampling of 10 trees in about 6 hours. Beside the pure time needed for the activities mentioned under point nos. 1) to 4), the time needed for the whole sampling also depends on the characteristics of the orchard and the distances that have to be covered for transport of materials used, as sheets, poles, water to wash off the arthropods from the sheets etc..
Concerning the waiting period, i.e. the time between the inventory spray and the collection of the dead arthropods different periods are proposed, ranging from 3 to 8 hours

69
(Sechser & Bathe, 1978, Brown, 1998). As dichlorvos evaporates rather quickly it also loses its activity quickly. According to the results from Sechser & Bathe (1978) dropping of arthropods was already clearly reduced after 3 hours. Based on these results we chose a short waiting period of 2 hours. From the practical point of view, this is important as it enables the running of a large field test within one day and reduces the risk of disadvantageous weather influences as well as loss of samples due to predation (e.g. ants, earwigs, spiders, birds). Necessary plot sizes The minimum plot size for beating samples, comprising 20 branches per sample and one sample taken per plot, should be about 50 to 60 trees as minimum, depending on the characteristics of the orchard. No samples are taken at the border of the plot, which includes at least one row or one to two trees. In the central area there have to be more than 20 trees for the sampling. In case of more than one sample per plot, the plot size has to be enlarged to ensure that not more than one branch per tree has to be used for the sampling. This is a precaution measure because samples on further branches of the same tree might be influenced due to vibrations caused by the tapping. With the beating sampling method the same sampling area can be used various times at different sampling dates.
This is not possible for the inventory sampling method. Trees used once for a sampling as well as their neighbouring trees cannot be used for any further assessment. Therefore the necessary plot size increases with the number of sampling dates demanded. As the inventory sampling is a spot wise sampling, at least 3 trees should be sampled per plot and sampling date. As an example: for 3 sampling dates, using 3 trees per plot at each occasion, the plot size should be at least 60 to 70 trees. For 5 sampling dates already 90 trees per plot are needed as minimum. These plot sizes do not include a reserve for additional samplings. Sample yield The mean numbers of arthropods per sample as well as the corresponding relative standard deviations (RSD) for arthropod groups of certain interest in non-target arthropod field studies are summarised in Table 1. In total 231 arthropods per 1 beating sample, i.e. per 20 branches, and 668 arthropods per 1 inventory sample, i.e. per 1 tree, were assessed. These numbers do not include mites. The corresponding relative standard deviation values, with a RSD of 16.2 % for the beating compared to 39.1 % for the inventory sampling, indicate that the variability is bigger between the inventory samples than between the beating samples. This results from the different distribution of the sampling locations. There is an even distribution of 20 sampling locations for each single sample all over the whole sampling area of the plot with the beating sampling, whereas for the inventory sampling one sample consists of the arthropods of one single tree. Inventory sampling therefore is a spot wise sampling method, and the infestation of single trees e.g. with aphids combined with the presence of ants, as it occurred in the presented study, might result directly in a higher deviation. Excluding ants and aphids from both sampling types, the RSD values change from 16.2 % to 19.8 % for the beating samples and from 39.1 % to 11.0 % for the inventory samples, as it can be seen in Table 1. This indicates that spot wise occurring arthropods in our study had no important impact on beating samples, but clearly increased the variation between inventory samples. For that reason it is strongly recommended to take several samples per plot when using the inventory sampling method, whereas with the beating sampling one sample per plot, comprising the tapping of a number of branches, in our case 20, seems to be sufficient to produce homogenous results. This has to be taken into consideration for the planning of sampling schedules and when calculating effort and costs for the arthropod identification of the samples.

70
For single groups, like spiders, Hymenoptera (excluding ants) and Neuroptera the RSD values for both sampling methods are comparable. It was not possible to assess Diptera of the family Syrphidae with the beating sampling, whereas with the inventory sampling 8.2 individuals per tree were assessed. However, it has to be taken into consideration that the number of Syrphids and Neuroptera assessed in this trial was too low to establish general conclusions.
Table 1. Mean number of arthropods and relative standard deviation (RSD) per sample for beating and inventory sampling for all arthropods and some selected orders and families (see text for further explanations)
n=5 Beating sampling Inventory sampling
All arthropods (except mites)
231.0 RSD = 16.2 %
668.4 RSD = 39.1 %
All arthropods excluding ants and aphids
211.8 RSD = 19.8 %
526.2 RSD = 11.0 %
Araneae 82.8 RSD = 29.3 %
112.0 RSD = 24.9 %
Hymenoptera excluding ants
11.2 RSD = 26.3 %
55.8 RSD = 24.4 %
Syrphidae 0 RSD = --
8.2 RSD = 61.8 %
Neuroptera 3.8 RSD = 22.0 %
7.0 RSD = 31.9 %
Composition of samples The composition of the samples is presented in Fig. 1 and Fig. 2. The predominant groups in the beating samples were the spiders (Araneae) with 38 % and the Coleoptera with 17 %. In the inventory samples Diptera and Araneae dominated with 23 and 22 %, respectively. Comparing Fig. 1 and Fig. 2, it can be noted that highly mobile insects, like Diptera, Hymenoptera as well as Thysanoptera are underrepresented in the beating samples. Conclusion Beating sampling is a method that allows a continuous and flexible sampling schedule. This is of importance when population developments or recovery of populations after the application of plant protection products have to be assessed. As beating sampling evenly covers a complete sampling area, the samples obtained are more homogeneous compared to inventory samples. Arthropods with high mobility, like insects of the orders Diptera or Hymenoptera, might be under-represented in beating samples and difficult to assess.

71
Fig. 1. Composition of beating samples, excluding ants and aphids
Inventory Sampling
Araneae22%
Dermaptera4%
Heteroptera4%
Homoptera12%
Hymenoptera11%
Diptera23%
Coleoptera11%
others3%
Neuroptera1%
Thysanoptera9%
mean = 526 arthropods/tree
Fig. 2. Composition of inventory samples, excluding ants and aphids
Beating sampling
Araneae38%
Homoptera12%
Hymenoptera5%
Diptera10%
Heteroptera6%
Dermaptera6%
Thysanoptera0%
Neuroptera2%
others4%
Coleoptera17%
mean = 212 arthropods/20 branches

72
For the inventory sampling the number of sampling dates is fixed and limited by the available plot size. This might turn out to be a problem when the sampling schedule has to be expanded, e.g. because of lacking recovery or when samplings failed and have to be repeated. Inventory sampling is a labour intensive method compared to the beating sampling. However, the samples are more abundant, which might be important for test sites or crops with relatively low arthropod numbers. Inventory sampling is a spot wise sampling technique, which can result in a high variability between replicates, especially in the case when trees with high populations of e.g. aphids and ants were selected.
Excluding spot wise occurring arthropods ants and aphids, the variability was comparable for both methods in the presented experiment.
It remains to be verified whether these results are reproducible for different dates and locations. Further evaluation of the samples to species level is in process in order to compare the sampling methods in more detail. References Brown, K. 1989: The design of experiments to assess the effects of pesticides on beneficial
arthropods in orchards: Replication versus plot size. – In: Jepson, P.C. (ed.): Pesticides and non-target invertebrates. Intercept, Wimborne, Dorset: 71-80.
Brown, K. 1998: Field studies with pesticides and non-target arthropods in orchards. – In: Haskell, P.T. and P. Mc Ewen (eds.): Ecotoxicology: Pesticides and beneficial organisms. Chapman and Hall, London: 139-147.
Reboulet, J.N. 1994: Impact des produits phytosanitaires sur la faune auxiliaire. Méthodologie d’expérimentation en verger. – Acta Point. Numéro 1, Paris.
Sechser, B. 1985: Acaridas e fauna entomológica dos pomares de citros. – Agroqimica 24: 16-21. Sechser, B. & P.A. Bathe 1978: A new method for testing the selectivity of pesticides against
beneficial insects in orchards. – Zeitschrift für angewandte Entomologie 87: 14-27. Sutherland, W.J. 1996: Ecological Census Techniques – A handbook. – Cambridge University
Press, United Kingdom.

Pesticides and Beneficial Organisms IOBC/wprs Bulletin Vol. 26 (5) 2003
pp. 73 -82
73
Field study on the effects of insecticide drift on non-target arthropods: Residual toxicity, effect on populations and recolonisation processes Maren Langhof1, Achim Gathmann2 & Hans-Michael Poehling1
1 Institute of Plant Diseases and Plant Protection, University of Hannover, Herrenhäuser Str. 2, 30419 Hannover, Germany
2 Biology V, RWTH Aachen, Worringerweg 1, 52056 Aachen, Germany Abstract: The effects of insecticide drift on some functional groups of non-target arthropods in wheat (parasitoids, foliage dwelling predators, ground dwelling predators) will be studied in two successive years (start 2002). The specific questions addressed by this field study are the development of populations prior to and after an insecticide application as well as recolonisation processes of the treated crop from field margin strips. Therefore the spatial changes in arthropod population densities within the strips and within the crop at different distances from the strips are analysed. The residual toxicity of insecticide spray drift deposits on plant surfaces is quantified by an exposure experiment using aphid parasitoids (Aphidius colemani Viereck) as indicator organisms. The study is carried out on three intensively farmed winter wheat fields south of Hannover, Germany. Perpendicular to the main wind direction 3 m broad sown weed strips were laid out right next to the wheat fields. Wheat fields and the adjacent weed strips were divided into plots of 54 m length. During insecticide application (synthetic pyrethroid Trafo® (λ-cyhalothrin)) control weed strips were covered with polythene sheets to prevent contamination due to insecticide drift, whereas drift weed strips were left uncovered. The study comprised sixteen experimental plots, providing eight replicates of each treatment. The fluorescent tracer sodium fluorescein was added to the spray liquid to allow drift deposit measurement. Therefore potted bean plants were arranged within the weed strips at distances of 1, 2 and 3 m from the field edge and directly within the wheat crop. Deposits on leaves from the top of the plants and near the bottom were analysed. First results show that deposits on leaves were highly variable and decreased top down and with increasing distance from the field edge. A. colemani were exposed to spray residues on bean leaf surfaces from top and bottom of the canopy at 1, 2 and 3 m from the treated wheat and within the wheat. On top-leaves, mortality in the field (76 %) was significantly higher than mortality at 3 m from the field edge (26 %). Mortalities in the weed strips at 1, 2 and 3 m distance from the field edge did not differ significantly. On leaves from the bottom of the canopy no differences in mortalities between different distances from the field edge were detected. Insecticide spray drift had an effect on populations of cereal aphids up to a distance of 1 m from the field edge. No drift related effects could be monitored concerning syrphid egg deposition and aphid mummification; however, numbers of specimens were very low. Key words: field study, ecotoxicology, insecticide spray drift, field margin strips, Aphidius colemani. Introduction The use of plant protection products, especially insecticides, in arable fields endangers not only non-target arthropods within treated areas (e.g. Longley et al., 1997; Jansen, 2000; Holland et al., 2000), but also non-target arthropods within terrestrial off-crop habitats adjacent to the treated crop are at risk. During insecticide application the most relevant route of contamination of off-crop areas will be via spray drift. Until now, many studies have focused on technical aspects of spray drift (e.g. Ganzelmeier et al., 1995; Miller & Lane, 1999; Miller et al., 2000, Weisser et al., 2002), but very few field studies have investigated the potential risks of insecticide drift to non-target organisms (Greig-Smith et al., 1992; Davis

74
et al., 1993, 1994; Kühne et al., 2002; Langhof et al., 2002). Risks for off crop areas particularly field boundaries demand attention, since these habitats play an important role in the life cycle of many arthropod species typical of arable land. Off-crop habitats of convenient extension with diverse vegetation structure can offer alternative prey or hosts, can be refuges after harvest or tillage and can be overwintering sites (e.g. Landis et al., 2000) for generalist predators or parasitoids temporarily migrating between crop and off-crop areas. They can also harbour source populations and contribute to the recolonisation of insecticide treated fields (Nachtigall, 1994; Longley et al., 1997).
Insecticide spray drift can affect non-target organisms by contact with airborne particles during application. Furthermore, non-target organisms can be affected if they are exposed to spray deposits on plant or soil surfaces. Risk predictions using toxicity data from laboratory studies in connection with spray drift models exist (e.g. Forster, 1997). These can only give rough estimations of potential risks for non-target arthropod species in off-crop habitats and reflect worst-case situations. The advantage of field studies is that effects on population level can be assessed and results enable to critically validate risk assessments that originate from laboratory data.
The objectives of the running 2-year field study are (1) to assess the population development of relevant functional groups of non-target arthropods in wheat (parasitoids, foliage dwelling predators, ground dwelling predators) both within-field and in the off-crop area prior to and after an insecticide application, (2) to analyse recolonisation processes into the treated crop from field margin strips and (3) to measure the toxicity of spray drift deposits on off-crop plant surfaces using the aphid parasitoid Aphidius colemani Viereck (Braconidae) as indicator organism.
In the following, first results of the field study are presented. Material and methods Site description The study is carried out on three intensively farmed winter wheat fields (3.8, 6.6 and 12 ha) near Pattensen, 25 km south of Hannover, Germany. The study area is characterised by its intensive farming practise due to fertile clay-loess soils. The landscape is flat and structurally “poor”, i.e. well structured and extended field boundaries, large hedges and woodlots are missing. Experimental design Perpendicular to the main wind direction 3 m broad sown weed strips were laid out right next to each of the wheat fields. Therefore a seed mixture containing 22 species of flowering plants attractive to several groups of beneficial arthropods (Nentwig, 1992) was used. The mixture consisted of Achillea millefolium (20 g/ha), Agrostemma githago (600 g/ha), Anthemis tinc-toria (20 g/ha), Centaurea cyanus (500 g/ha), Centaurea jacea (200 g/ha), Chrysanthemum leucanthemum (80 g/ha), Cichorium intybus (120 g/ha), Dipsacus fullonum (2 g/ha), Echium vulgare (200 g/ha), Fagopyrum esculentum (7800 g/ha), Hypericum perforatum (60 g/ha), Legousia speculum-veneris (30 g/ha), Malva moschata (20 g/ha), Malva sylvestris (60 g/ha), Melilotus albus (20 g/ha), Onobrychis viciifolia (600 g/ha), Origanum vulgare (60 g/ha), Pastinacia sativa (80 g/ha), Silene alba (100 g/ha), Tanacetum vulgare (3 g/ha), Verbascum densiflorum (50 g/ha) and Verbascum lychnitis (30 g/ha). In the sown weed strips transects of wheat were established at distances of 1 and 2 m from the field edge. These trap plants ensured the presence of cereal aphids and their natural enemies in the strips. The sown weed strips and wheat areas adjacent to the strips were divided into plots of 54 m length, providing 16 experimental plots (fig. 1).

75
Fig. 1. Experimental design. C: control weed strips and adjacent wheat area; D: drift weed
strips and adjacent wheat area; grey area: sown weed strips.
The insecticide application was done at the end of wheat flowering (growth stage BBCH 69). The synthetic pyrethroid Trafo® (λ-cyhalothrin) was applied at its recommended rate (10 g a.i./ha). In order to achieve “convenient” drift wind should blow perpendicular to the sown weed strips during insecticide application. Therefore two application dates were necessary because of the different orientation of the three fields (fig. 1). Insecticide application on the two smaller fields was done on June 14th 2002 and on the larger field on June 16th (herein after referred to as first and second application date). The insecticide treatment was applied using a conventional tractor mounted boom sprayer with multirange flat spray nozzles (LU 120 03). A volume rate of 200 l/ha was achieved with an operating pressure of 3.6 bar and a speed of 7.2 km/h. Two treatments were performed; these were randomly distributed among the field plots (fig. 1). During insecticide application control weed strips were covered with polythene sheets to prevent contamination due to insecticide drift, whereas drift weed strips were left uncovered. Each treatment was replicated 8 times (fig. 1).
Wind speed and wind direction were recorded at 2 m height at the experimental site. Data on temperature and humidity were received from a nearby (1 km) weather station at the Ruthe field station of the University of Hannover. Spray drift deposit measurement Spray drift deposits on off-crop plant surfaces were quantified using the method of Koch & Spieles (1992). The fluorescent tracer sodium fluorescein was added to the spray liquid at a rate of 50 g/ha. Bean plants (Vicia faba L.) served as spray drift collectors. Therefore they were positioned in the sown weed strips at distances of 1, 2 and 3 m from the field edge and directly within the wheat field (2 m from the field edge). At each distance two bean plants were arranged side by side; one was used for the deposit measurement and the other one for the exposure bioassay (see below). In the drift treatment three replicate sets of plants were used per distance and in the control treatment two replicate sets of plants. Immediately after the application of the insecticide two leaves of each bean plant were cut off at the top of the canopy and at ground level. Leaves were put into brown 100 ml-plastic bottles and stored overnight in a cold storage room. The next day the tracer was washed off the leaves and the emission of the washing liquid was measured in a fluorimeter. After the size of the leaves was
300 m 216 m 230 m
N
C
C
C
C
D
DD
D
C CD D D D CC41
9 m
300
m
120
m
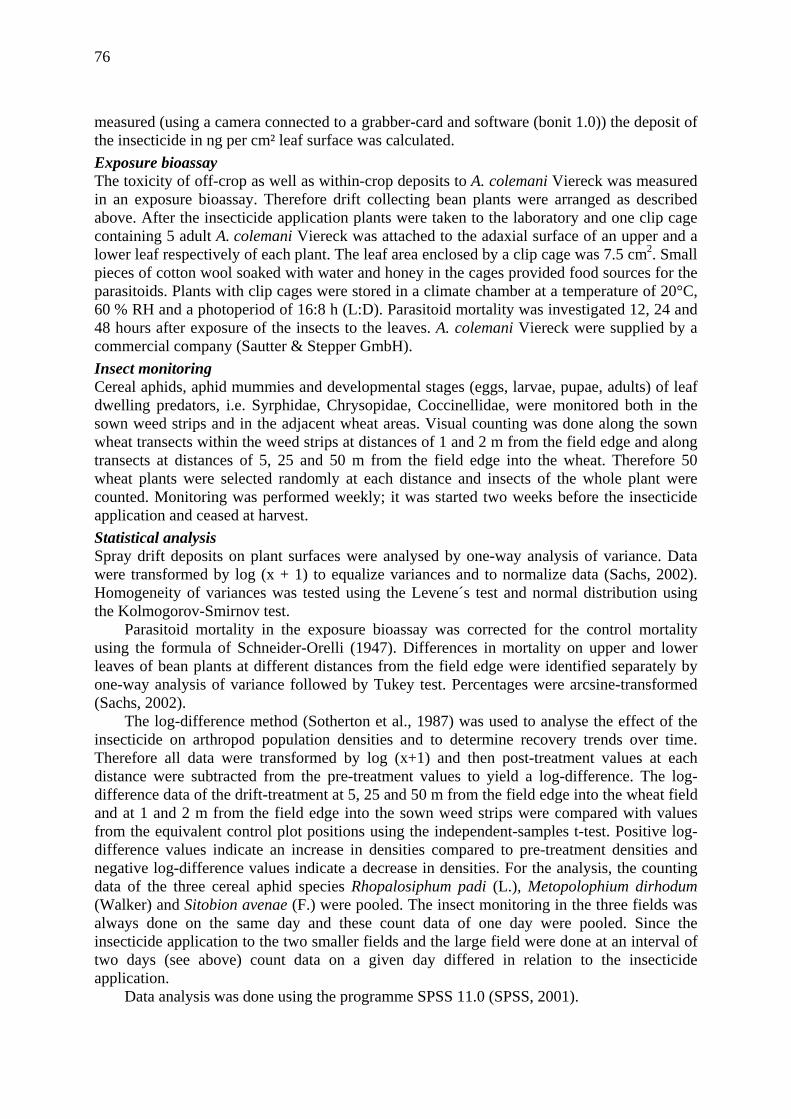
76
measured (using a camera connected to a grabber-card and software (bonit 1.0)) the deposit of the insecticide in ng per cm² leaf surface was calculated. Exposure bioassay The toxicity of off-crop as well as within-crop deposits to A. colemani Viereck was measured in an exposure bioassay. Therefore drift collecting bean plants were arranged as described above. After the insecticide application plants were taken to the laboratory and one clip cage containing 5 adult A. colemani Viereck was attached to the adaxial surface of an upper and a lower leaf respectively of each plant. The leaf area enclosed by a clip cage was 7.5 cm2. Small pieces of cotton wool soaked with water and honey in the cages provided food sources for the parasitoids. Plants with clip cages were stored in a climate chamber at a temperature of 20°C, 60 % RH and a photoperiod of 16:8 h (L:D). Parasitoid mortality was investigated 12, 24 and 48 hours after exposure of the insects to the leaves. A. colemani Viereck were supplied by a commercial company (Sautter & Stepper GmbH). Insect monitoring Cereal aphids, aphid mummies and developmental stages (eggs, larvae, pupae, adults) of leaf dwelling predators, i.e. Syrphidae, Chrysopidae, Coccinellidae, were monitored both in the sown weed strips and in the adjacent wheat areas. Visual counting was done along the sown wheat transects within the weed strips at distances of 1 and 2 m from the field edge and along transects at distances of 5, 25 and 50 m from the field edge into the wheat. Therefore 50 wheat plants were selected randomly at each distance and insects of the whole plant were counted. Monitoring was performed weekly; it was started two weeks before the insecticide application and ceased at harvest. Statistical analysis Spray drift deposits on plant surfaces were analysed by one-way analysis of variance. Data were transformed by log (x + 1) to equalize variances and to normalize data (Sachs, 2002). Homogeneity of variances was tested using the Levene´s test and normal distribution using the Kolmogorov-Smirnov test.
Parasitoid mortality in the exposure bioassay was corrected for the control mortality using the formula of Schneider-Orelli (1947). Differences in mortality on upper and lower leaves of bean plants at different distances from the field edge were identified separately by one-way analysis of variance followed by Tukey test. Percentages were arcsine-transformed (Sachs, 2002).
The log-difference method (Sotherton et al., 1987) was used to analyse the effect of the insecticide on arthropod population densities and to determine recovery trends over time. Therefore all data were transformed by log (x+1) and then post-treatment values at each distance were subtracted from the pre-treatment values to yield a log-difference. The log-difference data of the drift-treatment at 5, 25 and 50 m from the field edge into the wheat field and at 1 and 2 m from the field edge into the sown weed strips were compared with values from the equivalent control plot positions using the independent-samples t-test. Positive log-difference values indicate an increase in densities compared to pre-treatment densities and negative log-difference values indicate a decrease in densities. For the analysis, the counting data of the three cereal aphid species Rhopalosiphum padi (L.), Metopolophium dirhodum (Walker) and Sitobion avenae (F.) were pooled. The insect monitoring in the three fields was always done on the same day and these count data of one day were pooled. Since the insecticide application to the two smaller fields and the large field were done at an interval of two days (see above) count data on a given day differed in relation to the insecticide application.
Data analysis was done using the programme SPSS 11.0 (SPSS, 2001).

77
Results and discussion Spray drift deposits on off-crop plant surfaces During the first application wind speed was low (0.1 - 1 m/s), but during the second application wind speed ranged between 2.7 and 4.4 m/s. At both spray applications wind blew nearly perpendicular to the sown weed strips. Deposits tendentiously decreased with increasing distance from the sprayed wheat crop. The highest levels of spray deposits were measured on within-field plant surfaces at the top of the canopy. At the first application date spray drift deposits on upper leaves at 1, 2 and 3 m from the field edge amounted to 3.1 %, 0.7 % and 0.2 % respectively of deposits on leaves from plants directly treated within the field (fig. 2). At the second application date within-field deposits on upper leaves were 3fold lower compared to deposits at the first application date from the same sample positions. This difference is due to a short rainfall while leaf samples from within-field were collected; at that time leaves at 1, 2 and 3 m distances had already been sampled. Deposits measured at the first application date at 1 m were significantly higher compared to deposits at 2 and 3 m, whereas differences in deposits measured at the second application date were only significant between the 1 m and 3 m distance. Deposits at 2 and 3 m from the field edge did not differ, both at the first and the second application date. As a result of the higher wind speed, spray drift deposits measured on the second application date were tendentiously higher compared to those measured at the first application date (fig. 2). Deposits on plant surfaces at the bottom of the canopy at 1 m and within-field were significantly higher compared to those at 2 and 3 m distance from the field edge. Deposits within-field did not differ from spray drift deposits at 1 m, both at the first and the second application date. In addition, there was no difference in drift deposits between 2 and 3 m, again both at the first and the second application date (fig. 3).
No deposits were measured on leaves from covered control weed strips.
Fig. 2. Drift deposits on plant surfaces at the top of the canopy. Different letters indicate
statistical differences. ANOVA (14.06.): n = 4; F = 76.1; df = 3; p < 0.001. ANOVA (16.06.): n = 4; F = 55.6; df = 3; p < 0.001.
-2
1
2
3 14.06.16.06.
0.01 0.1 1 10 100 1000Dis
tanc
e fr
om fi
eld
edge
[m]
a
b
c
c
A
B
BC
C
Deposit insecticide [ng/cm² leaf surface] (+ SD)
-2
1
2
3 14.06.16.06.
0.01 0.1 1 10 100 1000Dis
tanc
e fr
om fi
eld
edge
[m]
a
b
c
c
A
B
BC
C
-2
1
2
3 14.06.16.06.
0.01 0.1 1 10 100 10000.01 0.1 1 10 100 1000Dis
tanc
e fr
om fi
eld
edge
[m]
a
b
c
c
A
B
BC
C
Deposit insecticide [ng/cm² leaf surface] (+ SD)
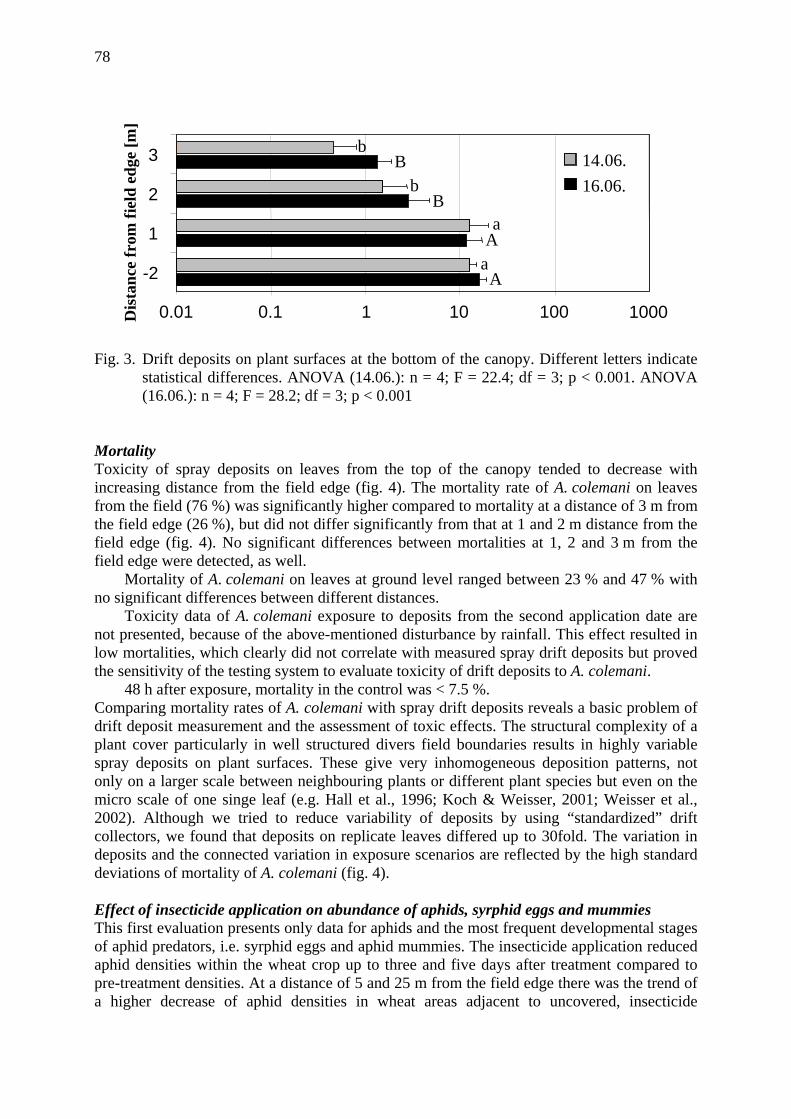
78
Fig. 3. Drift deposits on plant surfaces at the bottom of the canopy. Different letters indicate
statistical differences. ANOVA (14.06.): n = 4; F = 22.4; df = 3; p < 0.001. ANOVA (16.06.): n = 4; F = 28.2; df = 3; p < 0.001
Mortality Toxicity of spray deposits on leaves from the top of the canopy tended to decrease with increasing distance from the field edge (fig. 4). The mortality rate of A. colemani on leaves from the field (76 %) was significantly higher compared to mortality at a distance of 3 m from the field edge (26 %), but did not differ significantly from that at 1 and 2 m distance from the field edge (fig. 4). No significant differences between mortalities at 1, 2 and 3 m from the field edge were detected, as well.
Mortality of A. colemani on leaves at ground level ranged between 23 % and 47 % with no significant differences between different distances.
Toxicity data of A. colemani exposure to deposits from the second application date are not presented, because of the above-mentioned disturbance by rainfall. This effect resulted in low mortalities, which clearly did not correlate with measured spray drift deposits but proved the sensitivity of the testing system to evaluate toxicity of drift deposits to A. colemani.
48 h after exposure, mortality in the control was < 7.5 %. Comparing mortality rates of A. colemani with spray drift deposits reveals a basic problem of drift deposit measurement and the assessment of toxic effects. The structural complexity of a plant cover particularly in well structured divers field boundaries results in highly variable spray deposits on plant surfaces. These give very inhomogeneous deposition patterns, not only on a larger scale between neighbouring plants or different plant species but even on the micro scale of one singe leaf (e.g. Hall et al., 1996; Koch & Weisser, 2001; Weisser et al., 2002). Although we tried to reduce variability of deposits by using “standardized” drift collectors, we found that deposits on replicate leaves differed up to 30fold. The variation in deposits and the connected variation in exposure scenarios are reflected by the high standard deviations of mortality of A. colemani (fig. 4). Effect of insecticide application on abundance of aphids, syrphid eggs and mummies This first evaluation presents only data for aphids and the most frequent developmental stages of aphid predators, i.e. syrphid eggs and aphid mummies. The insecticide application reduced aphid densities within the wheat crop up to three and five days after treatment compared to pre-treatment densities. At a distance of 5 and 25 m from the field edge there was the trend of a higher decrease of aphid densities in wheat areas adjacent to uncovered, insecticide
Dis
tanc
e fr
om fi
eld
edge
[m]
0.01 0.1 1 10 100 1000
-2
1
2
3 14.06.16.06.
A
A
B
B
a
a
b
b
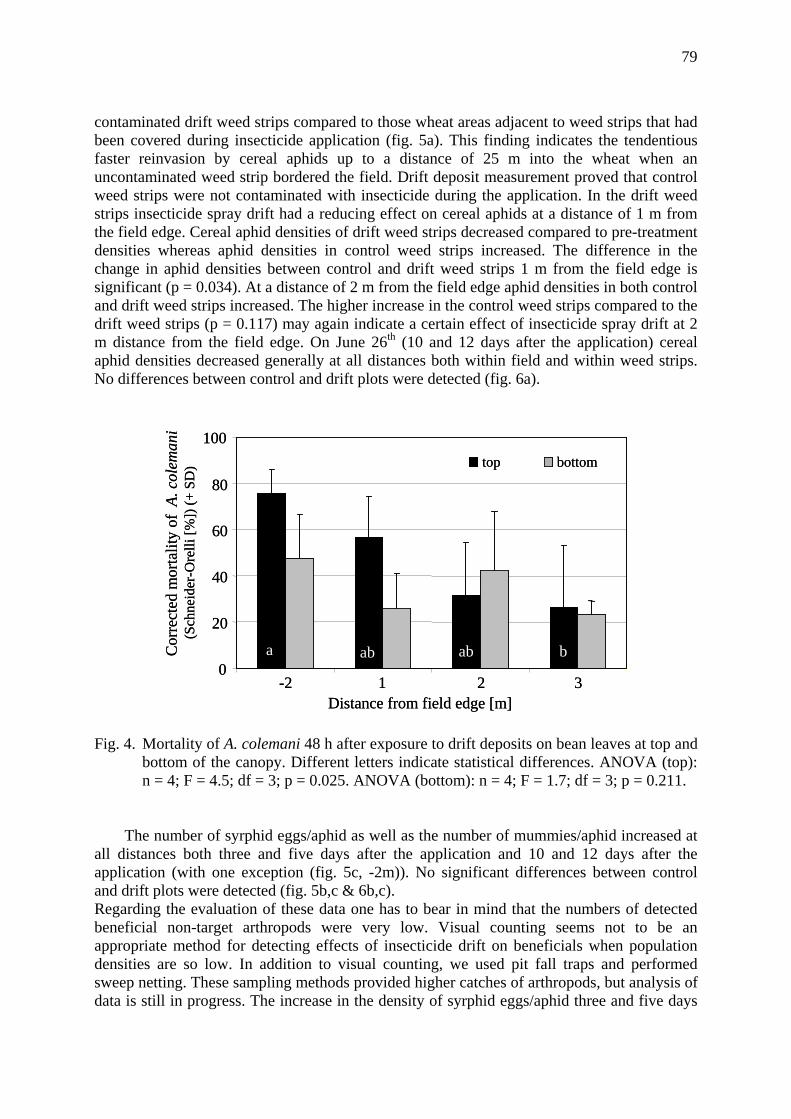
79
contaminated drift weed strips compared to those wheat areas adjacent to weed strips that had been covered during insecticide application (fig. 5a). This finding indicates the tendentious faster reinvasion by cereal aphids up to a distance of 25 m into the wheat when an uncontaminated weed strip bordered the field. Drift deposit measurement proved that control weed strips were not contaminated with insecticide during the application. In the drift weed strips insecticide spray drift had a reducing effect on cereal aphids at a distance of 1 m from the field edge. Cereal aphid densities of drift weed strips decreased compared to pre-treatment densities whereas aphid densities in control weed strips increased. The difference in the change in aphid densities between control and drift weed strips 1 m from the field edge is significant (p = 0.034). At a distance of 2 m from the field edge aphid densities in both control and drift weed strips increased. The higher increase in the control weed strips compared to the drift weed strips (p = 0.117) may again indicate a certain effect of insecticide spray drift at 2 m distance from the field edge. On June 26th (10 and 12 days after the application) cereal aphid densities decreased generally at all distances both within field and within weed strips. No differences between control and drift plots were detected (fig. 6a).
Fig. 4. Mortality of A. colemani 48 h after exposure to drift deposits on bean leaves at top and
bottom of the canopy. Different letters indicate statistical differences. ANOVA (top): n = 4; F = 4.5; df = 3; p = 0.025. ANOVA (bottom): n = 4; F = 1.7; df = 3; p = 0.211.
The number of syrphid eggs/aphid as well as the number of mummies/aphid increased at all distances both three and five days after the application and 10 and 12 days after the application (with one exception (fig. 5c, -2m)). No significant differences between control and drift plots were detected (fig. 5b,c & 6b,c). Regarding the evaluation of these data one has to bear in mind that the numbers of detected beneficial non-target arthropods were very low. Visual counting seems not to be an appropriate method for detecting effects of insecticide drift on beneficials when population densities are so low. In addition to visual counting, we used pit fall traps and performed sweep netting. These sampling methods provided higher catches of arthropods, but analysis of data is still in progress. The increase in the density of syrphid eggs/aphid three and five days
Distance from field edge [m]
0
20
40
60
80
100
-2 1 2 3
top bottom
Cor
rect
ed m
orta
lity
of A
. col
eman
i(S
chne
ider
-Ore
lli[%
])(+
SD
)
a ab ab b
Distance from field edge [m]
0
20
40
60
80
100
-2 1 2 3
top bottom
Cor
rect
ed m
orta
lity
of A
. col
eman
i(S
chne
ider
-Ore
lli[%
])(+
SD
)
a ab ab b

80
after the insecticide application proves the presence of syrphid flies shortly after the treatment both in the wheat field and the sown weed strips. Egg deposition pattern followed aphid numbers available (numerical response) and no drift dependent effects were noticed. The increase in densities of mummies/aphid three and five days after the insecticide treatment lets assume that a certain part of parasitized but not yet mummified aphids survived the insecticide treatment. The increase 10 and 12 days after the treatment proves the presence of adult parasitoids in the field, since the developmental period from oviposition to mummification in parasitoids of cereal aphids ranges approximately between 8 and 10 days (Hofsvang & Hågvar, 1991).
Fig. 5. Change in population densities of cereal aphids (a), syrphid eggs/aphid (b) and
mummies/aphid (c) three and five days after the insecticide application expressed as log-difference values. Log-differences at each distance from the field edge of drift-plots were compared with control log-differences from equivalent control plot distances using the independent-samples t-test. Asterisks indicate statistically significant differences (p < 0.05). a: t-test (-1m): n = 8; t = -2.4; df = 14; p = 0.034.
Fig. 6. Change in population densities of cereal aphids (a), syrphid eggs/aphid (b) and
mummies/aphid (c) 10 and 12 days after the insecticide application expressed as log-difference values. Log-differences at each distance from the field edge of drift-plots were compared with control log-differences from equivalent control plot distances using the independent-samples t-test. Asterisks indicate statistically significant differences (p < 0.05).
-0.6 -0.5 -0.4 -0.3 -0.2 -0.1 0 +0.1
controldrift
-2
-1
5
25
50
-0.1 0 +0.1 -0.1 0 +0.1log-difference (+/- SE)
Dis
tanc
e fr
om fi
eld
edge
[m]
a b c
-0.6 -0.5 -0.4 -0.3 -0.2 -0.1 0 +0.1
controldrift
-2
-1
5
25
50
-2
-1
5
25
50
-0.1 0 +0.1-0.1 0 +0.1 -0.1 0 +0.1log-difference (+/- SE)
Dis
tanc
e fr
om fi
eld
edge
[m]
a b c
Dis
tanc
e fr
om fi
eld
edge
[m]
log-difference (+/- SE)-0.3 -0.1 +0.1 +0.3
controldrift
-2
-1
5
25
50
0
a
-0.1 +0.10
b
-0.1 +0.10
c
Dis
tanc
e fr
om fi
eld
edge
[m]
log-difference (+/- SE)-0.3 -0.1 +0.1 +0.3
controldrift
-2
-1
5
25
50
-2
-1
5
25
50
0
a
-0.1 +0.10
b
-0.1 +0.10
c

81
Acknowledgements We are grateful to Dr. Bernhard Werner for providing the experimental site and for the application of the insecticide. This study is supported by Deutsche Forschungsgemeinschaft. References Davis, B.N.K., Lakhani, K.H., Yates, T.J., Frost, A.J., Plant, R.A. 1993: Insecticide drift from
ground-based, hydraulic spraying of peas and brussels sprouts: bioassays for determining buffer zones. – Agric. Ecosys. Environ. 43: 93-108.
Davis, B.N.K, Brown, M.J., Frost, A.J., Yates, T.J., Plant, R.A. 1994: The effects of hedges on spray deposition and on the biological impact of pesticide spray drift. – Ecotoxicology Environm. Safety 27: 281-293.
Forster, R. 1997: Vergleichende Laboruntersuchungen zur Sensitivität von Nichtziel-arthropoden gegenüber Pflanzenschutzmitteln und Möglichkeiten der expositionsab-hängigen Risikoabschätzung – Resümee. – Mitt. Biol. Bundesanst. Land- Forstwirtsch., Berlin-Dahlem, 333: 90-95.
Ganzelmeier, H., Rautmann, D., Spangenberg, R., Streloke, M., Herrmann, M., Wenzelbur-ger, H.-J., Walter, H.-F., 1995: Untersuchungen zur Abtrift von Pflanzenschutzmitteln. Ergebnisse eines bundesweiten Versuchsprogrammes. – Mitt. Biol. Bundesanst. Land- Forstwirtsch., Berlin-Dahlem, 304: 111 pp.
Greig-Smith, P.W., Eagle, D., Williams, C.T., Brown, P.M. 1992: Distribution and persistence of sprayed pesticides, and residues in drainage water. – In: Pesticides, cereal farming and the environment: the Boxworth project, London, H.M.S.O.: 60-67.
Hall, F.R., Cooper, J., Kirchner, L., Downer, R., Thacker, R. 1996: Assessment of off-target movement of orchard pesticides: Capture efficiencies of synthetic and biological biomarkers. – J. Environ. Sci. Health B31(4): 815-830.
Hofsvang E.B., Hågvar, T. 1991: Aphid parasitoids (Hymenoptera, Aphidiidae): biology, host selection and use in biological control. – Biocontrol News & Information 12(1): 13-41.
Holland, J.M., Winder, L., Perry, J.N. 2000: The impact of dimethoate on the spatial distribution of beneficial arthropods in winter wheat. – Ann. Appl. Biol. 136: 93-105.
Jansen, J.P. 2000: A three-year field study on the short-term effects of insecticides used to control cereal aphids on plant-dwelling predators in winter wheat. – Pest Manag. Sci. 56: 533-539.
Koch, H., Spieles, M. 1992: Verteilung der Belagsmassen von Pflanzenschutzmitteln und Mehltaubefall (Erysiphe graminis f. sp. tritici) in einem Winterweizenbestand. – Z. Pflanzenkrankh. Pflanzenschutz 99: 297-303.
Koch, H., Weisser, P. 2001: Spray deposits of crop protection products on plants – the potential exposure of non-target arthropods. – Chemosphere 44: 307-312.
Kühne, S., Freier, B., Kaul, P., Jüttersonke, B., Schenke, D., Forster, R., Baier, B., Moll, E. 2002: Auswirkung der Abdrift von Insektiziden in einem Saumbiotop. – Agrarökologie 42, Verlag Agrarökologie Bern, Hannover: 121 pp.
Landis, D.A., Wratten, S.D., Gurr, G.M. 2000: Habitat management to conserve natural enemies of arthropod pests in agriculture. – Annu. Rev. Entomol. 45: 175-201.
Langhof, M., Gathmann, A., Poehling, H.-M., Meyhöfer, R. 2002: Impact of insecticide drift on aphids and their parasitoids: residual toxicity, persistence and recolonisation. – Agric. Ecosys. Environ., in press.

82
Longley, M., Jepson, P.C., Izquierdo, J., Sotherton, N. 1997: Temporal and spatial changes in aphid and parasitoid populations following applications of deltamethrin in winter wheat. – Entomol. Exp. Appl. 83: 41-52.
Miller, P.C.H., Lane, A.G. 1999: Relationship between spray characteristics and drift risk into field boundaries of different structure. – Aspects Appl. Biol. 54: 45-51.
Miller, P.C.H., Lane, A.G., Walklate, P.J., Richardson, G.M. 2000: The effect of plant structure on the drift of pesticides at field boundaries. – Aspects Appl. Biol. 57: 75-82.
Nachtigall, G. 1994: Einbindung landschaftsökologischer und naturschützerischer Erforder-nisse in die landwirtschaftliche Produktion: Stand und Perspektiven. – Mitt. Biol. Bundesanst. Land- Forstwirtsch., Berlin-Dahlem 294: 98 pp.
Nentwig, W. 1992: Die nützlingsfördernde Wirkung von Unkräutern in angesäten Unkraut-streifen. – Z. Pflanzenkrankh. Pflanzensch. Suppl. 13: 33-40.
Sachs, L. 2002: Angewandte Statistik: Anwendung statistischer Methoden, 10th ed. – Springer Verlag, Berlin: 889 pp.
Schneider-Orelli, O. 1947: Entomologisches Praktikum. 2nd ed., – Aarau. Sotherton, N.W., Moreby, S.J., Langley, M.G. 1987: The effects of the foliar fungicide
pyrazophos on beneficial arthropods in barley fields. – Ann. Appl. Biol. 111: 75-87. SPSS Inc. 2001: SPSS for windows 11.0. – SPSS Inc. 1989-2001. Weisser, P., Landfried, M., Koch, H. 2002: Off-crop drift sediments on plant surfaces –
exposure of non-target organisms. – Aspects Appl. Biol. 66: 225-230.
Pesticides and Beneficial Organisms IOBC/wprs Bulletin Vol. 26 (5) 2003
pp. 83 -92
83
A field trial to assess effects of spray drift on non-target arthropods when using drift mitigation measures in an orchard Christoph Grimm1, Frank Bakker2 & Marco P. Candolfi1 1 Syngenta Crop Protection AG, Ecological Sciences, Basel, Switzerland 2 MITOX Stichting Bevordering Duurzame Plaagbestrijding, Amsterdam, The Netherlands Abstract: Field trials to assess the effects of spray drift to non-target arthropods are currently carried out by treating in-crop areas with the plant protection product at a low concentration, which is assumed equivalent to the amount of active ingredient that reaches the off-crop habitat. The concentrations used are derived from spray drift measurements, which do not take drift-reducing measures into account. In absence of appropriate exposure values, a field trial was devised which measures the chemical deposit of a real spray drift event and the knockdown effect produced by the spray drift on the arthropod populations. Drift mitigation consisting of spraying the two outermost rows of an apple orchard from one side only was used. This constitutes a drift reduction measure that can be implemented routinely by growers. Three application regimes were used: a water treated control, the test item at the recommended field rate and the test item at a diluted rate corresponding to the spray drift at 3m distance from the orchard. The plots treated at the maximum recommended test item rate included two tree rows on the downwind side, which were treated from the outside of the plot only. Tree rows at four distances downwind from these rows were used as surrogates for the off-crop habitat. At 3m distance from the sprayed area, the chemical deposit on the trees was reduced by 85% when compared to published drift values. Of six arthropod orders significantly affected by the full rate applications (Auchenorrhyncha, Heteroptera, Psocoptera, Neuroptera, Thysanoptera and Hymenoptera), all except the latter were also affected in the plots treated at the drift rate, but only the Auchenorrhyncha and Psocoptera were affected in the first downwind tree row by the drift. The knockdown produced by the real spray drift was 70% lower when compared to the calculated drift concentration in the Auchenorrhyncha and 50% lower in the Psocoptera, confirming the level of risk reduction to non-target organisms achieved by the drift mitigation measure. Key words: drift mitigation, field trial, non-target arthropods, spray drift Introduction Field trials to assess the effects of plant protection products on non-target arthropods outside the crop area are usually carried out using a test design developed for assessing in-crop effects. Thereby the product is applied to the crop area at reduced concentrations of the spray solution in order to simulate the drift deposits at defined distances from the crop (Candolfi et al., 2000). The concentrations used are determined according the spray drift values established by the German BBA (BBA 2000), whereas the volume must be within the limits recommended for the crop type and stage.
This application method will result in a fairly homogeneous spray deposit throughout the foliage as the recommendations for the spray volume are intended to achieve a sufficient coverage with the plant protection product. Real spray-drift events, however, are characterised by a patchy distribution (Koch & Weisser 2001; Weisser et al. 2002). Macro-patchiness is created by variations of the wind conditions that lead to areas into which the spray cloud is transported and areas where no such transport occurs. Micro-patchiness is caused by the structure of the off-crop habitat itself, which consists of areas that are more exposed, like for
84
instance the upper parts of herbaceous plants or the upwind side of hedgerows, and areas which are less exposed, for instance the lower part of herbaceous plants or areas in the windshadow of vegetation structures. Thus, after application the off-crop habitat contains a mosaic of different deposits leading to high variations in exposure even within a small area.
The droplet distribution on the plant surfaces themselves can also not be considered realistic, since in the trials the applications are carried out with a high water volume at a low concentration. Real spray drift is characterised by a low volume with a high concentration. The concentration may even exceed that of the spray tank mixture, as water can evaporate from the droplet while it is suspended in the air.
The method of using in-crop application techniques to simulate off-crop drift is also not suitable to assess effects when drift-mitigating measures are taken, as no relevant drift values are available. One such mitigation measure that can easily be used by the farmers in the field consists in spraying the outermost tree rows from the outside of the orchard only. By doing this the spray drift caused by the pressure of the sprayer itself can be avoided, limiting the drift to the wind induced movement of suspended droplets.
In order to directly assess the chemical deposit and the immediate effect of the spray drift on the arthropod community when using such a drift mitigation measure, areas hit by the real spray drift were sampled in a field trial. The results were compared to within crop applications at the recommended field rate and at a diluted rate. Material and methods Test design The field trial was carried out in an apple orchard (variety Red Chief) in Lerida province, Northern Spain, in September, when the trees had full foliage. The distance between trees was 1.6m within the row and 4m between rows. The trees were 10 years old, 2 to 4m high and homogeneous in architecture.
Within the orchard, plots were established for the direct spray treatment at the full rate, a calculated drift rate and a water control. The set-up was a randomised block design with three replicates. The blocks were lined up in a row (see Fig. 1). The plot sizes varied according to treatments, with the control and drift rate plots having a surface of approximately 420 m2 (65 trees), and the maximum rate plots having a surface of 600 to 1050 m2 (90 to 165 trees).
The full rate plots received a single insecticide treatment at the maximum recommended label rate. The drift rate plots were treated on the same day with a concentration corresponding to 15.7% of the full rate, corresponding to the 90th percentile of the expected spray drift at 3m distance from tall growing fruit crops, late in the season (BBA 2000). The control plots received a water treatment at the same volume as the other plots, 1200 L/ha. Spray treatments were carried out with a tractor mounted air-assisted sprayer.
On the downwind side of each plot two tree rows were treated from one side only with the nozzles of the sprayer opened only towards the centre of the plots. These rows constituted the drift mitigation rows and were not used for sampling of either chemical deposits or arthropod knockdown.
Additionally to within the directly treated plots, sampling was carried out in four treerows downwind from the maximum rate plots, at 4, 8, 12 and 16m distance from the centre of the last treated tree row. These sampling areas were used as surrogate for off-crop habitats, as the uniform vegetation cover of cultivated areas is inhabited by a more homogeneous arthropod community leading to less variability in the samples and higher precision of the statistical analysis of the results.

85
Fig. 1. Plot layout. Horizontal lines represent tree rows. Tree rows 1 to 5 were treated normally,
tree rows 6 and 7 from the outside only.
The entire trial can therefore be considered to consist of seven treatment groups which will be designated in the following as full rate plots, drift rate plots, water control plots, 4m drift rows, 8m drift rows, 12m drift rows and 16m drift rows.
The expected wind direction during the applications was perpendicular to the tree rows, driving the spray drift directly towards the drift rows. The size of the full rate plots was chosen so that the sampling area in all four drift rows would be hit by the spray drift even from the most distant treated row when the wind direction diverged up to 30° from the expected direction (see Fig. 1). This is the same range of wind directions as accepted in the trials described by Ganzelmeier et al. (1995), which established the basis for the drift values given by Rautmann et al. (2001) and published by the BBA (BBA 2000).
Sampling and measurements Sampling of chemical deposits was carried out on two trees within each directly treated plot, and on two trees from each of the four downwind tree rows adjacent to each full rate plot. Twelve filter papers were placed into each sampling tree by wrapping them around individual leaves. The papers were distributed at three different heights, on the inside and outside of the crown and on both sides of each tree before spraying. They were collected immediately after spraying and the twelve papers from one tree were united to one sample. The insecticide deposit in each sample was extracted and determined by chemical analysis in the laboratory. The amount deposited was then expressed as percentage of the deposit found in the maximum rate plots.
The arthropods directly affected by the spray treatments or spray drift were collected in Mylar sheets spread below the trees (Brown 1998). Sheets were placed pairwise on both sides of the tree rows, with each pair covering an area of 2.5 x 2.5m. Four pairs of sheets were used per replicate treatment group. The sheets were left for 24 hours after application before the arthropods were removed by washing them through a sieve. The collected arthropods were then determined taxonomically, mostly to the family level, and counted. Catches were analysed statistically by calculating the average abundance of each taxon per pair of sheets.

86
The log-transformed abundance (log10 (abundance +1)) was used for analysis of variance, followed by a Dunnett’s test (Hsu, 1996). Statistically significant effects are reported at the p ≤ 0.05 level.
During applications, wind speed and wind direction was measured at 10-second intervals at a height of 1m above the tree crowns. The time when the tractor entered and left each plot was taken. Since the tractor travelled a distance of 14m per 10 seconds, the wind data could be associated with the tractor position at each measured time point. Results and discussion Wind conditions The average wind speeds during application in the full rate plots was 2.4 m/s in the first and second replicate and 2.6 m/s in the third replicate. The median wind direction was 50° in the first, 60° in the second and 55° in the third replicate. These deviated slightly more from the 90° direction than expected based on long term wind data for the orchard, but sufficient to cause deposit of spray drift from most of the seven treated rows in the full rate plots. The wind directions were only slightly outside the ±30° range used by Ganzelmeier et al. (1995) for earlier spray drift trials. The wind conditions at each tractor position after 14m travel is shown in Fig. 2. It is clearly visible that both wind direction and speed changed rapidly and widely during the application, leading to an equally rapid change of drift conditions.
Fig. 2. Wind conditions plotted every 14m driving distance during application of the full rate
plots. The direction of the arrows shows the wind direction and the length corresponds to the wind speed.
Chemical deposit The chemical deposit of the insecticide within the treated plots and in the drift rows is shown in Fig. 3. Compared to the full rate plots, the drift rate plots received 15.81% of the maximum rate. This measured value is very close to the target treatment of 15.7%.
The real spray drift in the 4m drift row was 2.38% of the maximum rate, showing the effectiveness of the drift mitigation measure used. As the effective distance of the tree row from the edge of the treated area was roughly 3m, the expected value without drift mitigation would have been equal to the application rate in the drift plots, 15.7%. Therefore the drift mitigation measure led to a measured reduction of spray drift by 85%. Different wind speeds could, of course, lead to different exposure situations than that observed in this specific trial.

87
In the 8m drift row the measured spray drift was 0.92%, in the 12m drift row 0.54% and in the 16m drift row 0.51%. The water control plots had a measured insecticide deposit of 0.65%. This average value in the control was strongly influenced by one plot that had a measured deposit of 1.44%, likely to have resulted from contamination by spray drift due to a freak change of wind direction (compare Fig. 2).
0.65% 2.38% 0.92% 0.54% 0.51%
100.00%
15.81%
Wat
er c
ontro
l
Full
rate
Drif
t rat
e
4m d
rift
8m d
rift
12m
drif
t
16m
drif
t
Fig. 3. Chemical deposit recovered in the treatment areas compared to the full rate treatment
(= 100%). Error bars are standard deviations. Arthropod knockdown The collection of spray drift and the observation of arthropod knockdown on tree rows, as done in this trial, resembles the situation in a hedgerow more than that observed on a flat field margin. The filtering effect of the structure would increase the amount of chemical deposit, particularly in the nearest tree row, whereas the larger leaf area index might lead to a lower concentration relative to the surface area thus reducing the exposure of arthropods.
Arthropods belonging to 19 different orders were collected in the sheets. The most frequent order was the mites, with approximately 1650 individuals per pair of sheets in the full rate plots, from 22 different families. Second most frequent order was the Auchenorrhyncha (Cicadina) with approximately 390 individuals, followed (in order of decreasing abundance) by the Diptera, Heteroptera, Hymenoptera, Thysanoptera, Collembola, Psocoptera, Neuroptera, Sternorrhyncha, Lepidoptera, Coleoptera, Araneae and Dermaptera. Only very few individuals very collected from the orders Blattoptera, Plecoptera, Chilopoda, Diplopoda and Isopoda.
Of the 19 orders found, six were statistically significantly affected in the full rate plots (Tab. 1). Of these six, five were also affected in the drift rate plots, two in the 4m drift rows and one in all drift rows. The most abundant group that was affected in the full rate plots and therefore susceptible to the insecticide, was the Auchenorrhyncha (Fig. 4) with a 671 % increase. Knockdown in the drift rate plots was higher than in the full rate plots, indicating a clumped distribution of the population and showing that the lower application rate was sufficient to achieve a high kill that could not be increased by the higher rate. Significantly affected families were the Delphacidae and Cicadellidae. The effect in the 4m drift row was lower than in either of the insecticide treated plots, but still significant, due to effects on the Cicadellidae and the nymphs of the Delphacidae.

88
Table 1. Percent increase of arthropod knockdown when compared to control plots. Only significant values shown (p ≤ 0.05). All values based on abundance + 1.
Full rate Drift rate 4m drift 8m drift 12m drift 16m drift
Hymenoptera 82 Heteroptera 561 252 Thysanoptera 263 118 Neuroptera 330 157 Auchenorrhyncha 671 753 170 Psocoptera 473 355 139 146 251 203
108 81.274.9138 *
436 *395 *
51.2
Wat
er c
ontro
l
Full
rate
Drif
t rat
e
4m d
rift
8m d
rift
12m
drif
t
16m
drif
t
Fig. 4. Number of Auchenorrhyncha knocked down within 24 hrs after application (geometric
mean + 1 per pair of sheets). The bar above the control column is the minimum significant difference to control. Asterisks mark significant difference (p ≤ 0.05).
Several insect orders showed a high kill in the full rate and an intermediate kill in the drift
rate plots, both statistically significant. In the downwind rows no significant effect could be detected at all. These orders comprised the Heteroptera (Fig. 5), with significant effects on the Miridae and Pentatomidae, the Thysanoptera (Fig. 6), where mainly adults were affected, and the Neuroptera (Fig. 7), where the nymphs were affected.
The Psocoptera showed an atypical result, with high effects in the full and drift plots, and significant effects in all four drift rows, that did not decrease with distance (Fig. 8). Since this result is not consistent with the chemical analysis of the deposit, which was similar to the control plots in the 12m and 16m drift rows, the recovery of an increased number of individuals in the downwind area might be caused either by an edge effect – the downwind rows were all near to the edge of the orchard (compare Fig. 1) – or to a dispersal effect caused by the physical disturbance of insects by the process of spraying. Since the two dominating species, Lachesilla quercus (Kolbe) (Lachesillidae) and Ectopsocus briggsi McLachlan (Ectopsocidae), are not known to fly long distances they might have settled in the adjacent downwind rows. This is supported by the fact, that in the treated plots significantly more nymphs and adults were observed, whereas in the drift rows only the adults were significantly increased.

89
6.04.14.5
28.6 *
6.5
15.3 *
4.3W
ater
con
trol
Full
rate
Drif
t rat
e
4m d
rift
8m d
rift
12m
drif
t
16m
drif
t
Fig. 5. Number of Heteroptera knocked down within 24 hrs after application (explanations see
Figure 4).
6.3
11.8 *
19.6 *
7.06.56.95.4
Wat
er c
ontro
l
Full
rate
Drif
t rat
e
4m d
rift
8m d
rift
12m
drif
t
16m
drif
t
Fig. 6. Number of Thysanoptera knocked down within 24 hrs after application (explanations see
Figure 4).
3.5
15.2 *
3.04.8
9.1 *
3.6 3.8
Wat
er c
ontro
l
Full
rate
Drif
t rat
e
4m d
rift
8m d
rift
12m
drif
t
16m
drif
t
Fig. 7. Number of Neuroptera knocked down within 24 hrs after application (explanations see
Figure 4).

90
9.3 *7.6 *7.4 *
10.8 *14 *
17.6 *
3.1W
ater
con
trol
Full
rate
Drif
t rat
e
4m d
rift
8m d
rift
12m
drif
t
16m
drif
t
Fig. 8. Number of Psocoptera knocked down within 24 hrs after application (explanations see
Figure 4).
Due to effects on the Eulophidae and Mymaridae, the section Chalcidoidea was affected
in both the full and the drift rate, an effect that was no longer visible at the order level, where the Hymenoptera were significantly knocked down in the full rate only (Fig. 9).
21.215.4
15.0
23.7 * 22.019.9
13.0
Wat
er c
ontro
l
Full
rate
Drif
t rat
e
4m d
rift
8m d
rift
12m
drif
t
16m
drif
t
Fig. 9. Number of Hymenoptera knocked down within 24 hrs after application (explanations see
Figure 4).
As the product used was not acaricidal, the mites were not significantly affected in their totality. Of the 22 mite families collected, the Acarididae showed significantly lower knockdown in all the drift rows than in the control. This reduction is likely to be an effect of the water volume that will have washed individuals from the trees in the plots that were directly treated, but did not do so in the areas where only spray drift hit the trees. Lack of visible effect on other arthropod orders may have different causes: no direct toxic effect of the insecticide used (e.g. Araneae), too inhomogeneous distribution before the spraying and therefore no statistically significant results (e.g. Sternorrhyncha), capacity of rapid dispersal before or during the spraying (e.g. Diptera), and low number of individuals not permitting a valid analysis of effects (e.g. Blattoptera).

91
Conclusions A field trial using real spray drift instead of a calculated, surrogate application rate could be performed and evaluated statistically, even though it was difficult to identify a suitable orchard and a long waiting period was necessary to obtain the required wind conditions. Even so, the wind events during spraying were proven to be very inconsistent.
The drift mitigation method, consisting of treating the outermost two tree rows from the side facing outwards from the orchard only, led to only 2.4 % spray drift in the 4m drift row (located at approximately 3m distance from the edge of the last treated tree row) constituting a nearly 85% drift reduction when compared to the published drift value of 15.7 % for this distance. Arthropods on trees were therefore less exposed to the product than the calculated drift values would indicate.
This reduced exposure was confirmed by the collection of individuals knocked down by the application. Of 15 arthropod taxa from six different orders affected in the full rate plots, seven were affected in the drift rate plots as well but only three were significantly affected in the 4m drift row. These were the nymphs of the Miridae, the adult Cicadellidae and the adult Psocoptera. In the affected insect orders, the real spray drift led to a 70% reduction of the knockdown when compared to the calculated drift concentration in the Auchenorrhyncha and a 50% reduction for the Psocoptera.
The results from the chemical recovery and the arthropod knockdown show the possibility for a significant reduction of risk to non-target organisms when using drift mitigation rows. Acknowledgements We would like to thank Roger Tribolet for the chemical analysis, Paul Beuk for the taxonomic determination and Roberta Dark for the statistical analysis. References BBA (Biologische Bundesanstalt für Land- und Forstwirtschaft) 2000: Bekanntmachung über
die Abtrifteckwerte, die bei der Prüfung und Zulassung von Pflanzenschutzmitteln heran-gezogen werden. – Bundesanzeiger 100: 9879-9880.
Brown, K. 1998: Field studies with pesticides and non-target arthropods in orchards. – In: Ecotoxicology – Pesticides and Beneficial Organisms, eds. P.T. Haskell and P. McEwen. Kluwer Academic Publishers, Dordrecht: 139-147.
Candolfi M., Bigler F., Campbell P., Heimbach U., Schmuck R., Angeli G., Bakker F., Brown K., Carli G., Dinter A., Forti D., Forster R., Gathmann A., Hassan S., Mead-Briggs M., Melandri M., Neumann P., Pasqualini E., Powell W., Reboulet J.-N., Romijn K., Sechser B., Thieme T., Ufer A., Vergnet C. & Vogt H. 2000: Principles for regulatory testing and interpretation of semi-field and field studies with non-target arthropods. – Journal of Pest Science 73: 141-147.
Ganzelmeier, H., Rautmann, D., Spangenberg, R., Streloke, M., Herrmann, M., Wenzelbur-ger, H.-J. & Walter, H.-F. 1995. Studies on the spray drift of plant protection products. Results of a test program carried out throughout the Federal Republic of Germany. – Mitteilungen aus der Biologischen Bundesanstalt für Land- und Forstwirtschaft, Berlin-Dahlem, 305: 111 pp.
Hsu, J.C. 1996: Multiple Comparisons, Theory and Methods. – Chapman and Hall, London.

92
Koch, H. & Weisser, P. 2001: Spray deposits of crop protection products on plants – the potential exposure of non-target arthropods. – Chemosphere 44: 307-312.
Rautmann, D., Streloke, M & Winkler, R. 2001. New basic drift values in the authorization procedure for plant protection products. – Mitteilungen aus der Biologischen Bundesanstalt für Land- und Forstwirtschaft 383: 133-141.
Weisser, P., Landfried, M. & Koch, H. 2002: Off-crop drift sediments on plant surfaces – exposure of non-target organisms. – Aspects of Applied Biology 66: 225-230.
Pesticides and Beneficial Organisms IOBC/wprs Bulletin Vol. 26 (5) 2003
pp. 93 - 97
93
New soil invertebrate testing scheme proposed by EPPO with special reference to formulations of plant protection products like granular formulations and seed dressings Rolf Forster & Christine Kula Federal Biological Research Centre for Agriculture and Forestry, Department for Plant Protection Products and Application Technique, Biology Division, Messeweg 11/12, 38104 Braunschweig, Germany Abstract: At the international workshop ESCORT 2 it was recognised, that the Tier I testing proposed (i.e. dose-response tests using Aphidius rhopalosiphi and Typhlodromus pyri on glass plates) is not appropriate for special PPP formulations like granular formulations and seed dressings due to technical reasons. Further to that it had been established that soil dwelling arthropods, such as Poecilus cupreus, Aleochara bilineata and Pardosa spp., did not demonstrate a similar high sensitivity compared to the two indicator species. The new draft of the EPPO subscheme (EPPO Panel on Environmental Risk Assessment, EPPO 2002) follows a tiered approach, giving guidance for additional testing with relevant soil species. If testing of other soil invertebrates is considered appropriate, the collembolan species Folsomia candida or a soil mite such as Hypoaspis aculeifer or other groups (e.g. Enchytraeidae) may be tested. It is suggested to implement the new recommen-dations into the “Guidance Document on Terrestrial Ecotoxicology Under Council Directive 91/414/EEC” in order to provide guidance and to promote consistency and transparency in decision making for the risk assessment of plant protection products in the context of the inclusion of their active substances in Annex I of Directive 91/414/EEC.
Key words: risk assessment, plant protection products, soil dwelling arthropods, Folsomia candida, Hypoaspis aculeifer, Enchytraeus albidus Introduction At the international workshop ESCORT 2, held in march 2000 under the auspices of the European Commission and organised by IOBC, BART and EPPO in Wageningen NL, it was recognised that the Tier I testing proposed (i.e. dose-response tests using Aphidius rhopalosiphi and Typhlodromus pyri on glass plates) is not appropriate for special PPP formulations like granular formulations, seed dressings or insect growth regulators. With respect to granular formulations and seed dressings this is due to technical reasons, because laboratory glass plate tests with the two indicator species can not reasonably be performed with granular formulations or seed dressings.
Further to that it had been established, that soil dwelling arthropods, such as Poecilus cupreus, Aleochara bilineata and Pardosa spp., did not demonstrate a similar high sensitivity compared to the two indicator species.
The recommendations made during the workshop to address these issues have been summarised as follows:
“For granular formulations or seed dressings with no corresponding spray formulation which could be tested with the described Tier I scheme, it was recommended that the testing requirements and associated risk assessment scheme should be developed by the EPPO soil organism group.”

94
The new draft of the EPPO subscheme (EPPO 2002) follows a tiered approach, taking into consideration that earthworms, soil microflora and non-target arthropods are routinely tested if exposure is expected and if this is technically feasible.
This new scheme gives guidance for additional testing with relevant soil species. If testing of other soil invertebrates is considered appropriate, the collembolan Folsomia candida or a soil mite such as Hypoaspis aculeifer could be tested.
If there is a broad spectrum of toxicity, then insects, mites and other groups (e.g. Enchytraeidae) may be tested.
Fig. 1. Subscheme on other soil invertebrates (according to new draft EPPO 2002; flow-chart
by BBA). Note: trigger values currently proposed by EPPO are p = 2, y = 0.2, q = 50 %
PPP incorporateddirectly into
soil?NTA HQ > p?
Continuedor repeatedexposure?
Assess lethal and sublethal effectson at least one soil species
PEC/NOEC < y?
Further testingrequired?
Additional data from higher tier testson relevant groups
Effects > q %?
high risk medium risk low risk
Analysisof
uncertaintyLow risk category
confirmedRisk categorynot confirmed
medium/high risk category confirmedRisk management
no no no
no
no – refine exposureestimates
no
yes yes yes
yes
yes
yes but recovery
yes - no recovery

95
The new EPPO subscheme on other soil invertebrates Whenever soil is contaminated, e.g. by the use of granules and seed treatments or by spray application, directly or indirectly, testing on relevant soil dwelling invertebrates is deemed appropriate (Figure 1). If the in-field HQ for Aphidius rhopalosiphi or Typhlodromus pyri indicates that further testing is required for surface/foliage dwelling species (currently a HQ trigger of 2 is proposed), it is suggested that effects on soil invertebrate species are investigated. In case continued or repeated exposure must be anticipated due to the persistence of the active substance or due to multiple applications of the product, further testing on other soil invertebrates should also be considered. For persistence, a DT90field trigger value of > 100 days in soil is used according to Directive 91/414/EEC.
If testing of other soil invertebrates is deemed necessary, the choice of species to be tested should take into account the effects observed in previous tests (e.g. from screening or non-target arthropod studies): if the product demonstrates mainly insecticidal potential then a test on the collembolan Folsomia candida would be appropriate, if it is mainly acaricidal then a soil mite such as Hypoaspis aculeifer should be tested. If the product shows a broad spectrum of toxicity, then insects, mites and other groups, e.g. Enchytraeids, may be tested. A dose response test should be conducted in order to allow determination of a NOEC (or appropriate ECx).
The decision to be made, whether higher tier tests are required or a refinement of exposure estimates is appropriate, involves expert judgement. The latter should take into account the level and nature of the effects found in basic single species tests as well as the range of species affected and the fate and pattern of use of the product. Higher tier tests may investigate effects using limited community/population studies (e.g. terrestrial model ecosystems, soil mesocosms) or field studies. Timing of applications, levels and routes of exposure should reproduce the intended use of the product, as far as possible. Endpoints should cover changes in community and population structure, species diversity, number and biomass of key species or key groups. When significant effects at any one time point are measured, the potential for recovery needs to be considered. Again, expert judgement should be used to evaluate higher tier studies and to determine ecological relevance. Existing standardized methods Collembola Method: Soil quality – Inhibition of reproduction of Collembola (Folsomia candida) by soil pollutants. ISO 11267, 1999.
F. candida is a blind and unpigmented species of the family Isotomidae of about 1.2 mm in length inhabiting the upper layers of soil. F. candida feeds mainly on organic material and fungi.
The laboratory test ISO 11267 has already been validated using an artificial soil (10 % sphagnum peat, 20 % kaolinite clay and 70 % quartz sand) and covering an exposure of approximately 28 days. Usually the reproduction endpoint is reported as NOEC or ECx. Gamasid mites Method: Tests are currently conducted following the draft of MITOX (Bakker, 2002) based on the SECOFASE “Handbook of soil invertebrate toxicity tests” (Løkke & van Gestel, 1998, eds.) using Hypoaspis aculeifer.
H. aculeifer is a brown coloured mite of about 1 mm in length, inhabiting the top layer of soils and feeds on springtails, nematodes, sciarid fly larvae and others.

96
The laboratory method published by Krogh & Axelsen (in Løkke & van Gestel, 1998), was adapted by Bakker (2002) using a natural soil (e.g. LUFA 2.1, a sandy soil consisting of about 0.5 to 1.0 % peat, app. 15 % clay, app. 85 % sand) and performing a duration of exposure of app. 14 days. Mortality is usually reported as LR50 and reproduction is measured at appropriate rates below LR50. This method is not yet validated.
Enchytraeids Method: Enchytraeidae reproduction test. Guidelines for Testing of Chemicals. Test guideline 220 (Draft March 2000), OECD (Organisation for Economic Co-operation and Development), Paris.
Enchytraeus albidus is a soil dwelling pale-white annelid of app. 10 mm in length (max. about 35 mm). Enchytraeids are found together with earthworms but are often abundant in soils where earthworms are absent.
A laboratory testing method is available based on the OECD Guideline 220 (OECD 2000), which has already been validated. The substrate used is an artificial soil, the duration of exposure is 21 days for the adults and app. 21 days for the juveniles (cocoons, resp.). Adult mortality and reproduction endpoint are usually reported as NOEC or ECx. Further activities It is suggested to implement the new recommendations into the “Guidance Document on Terrestrial Ecotoxicology Under Council Directive 91/414/EEC” in order to provide guidance to rapporteurs, peer reviewing Member States, notifiers and applicants on the use and interpretation of the terrestrial ecotoxicology sections of Annexes II and III and to lay down agreed procedures and criteria for decision making.
The general aim is to promote consistency and transparency in decision making and to describe agreed risk assessment procedures for the assessment of plant protection products in the context of the inclusion of their active substances in Annex I of Directive 91/414/EEC. Open questions „The applied science of eco-toxicology, which asks questions concerning the consequences of toxic chemical exposure for organisms in the real world, is still in its infancy”(Jepson, 1989).
Although a lot of progress has been made in the last decade, the above statement has not lost its relevance nowadays. A number of fundamental scientific aspects which are currently widely disregarded in risk evaluation indicate the need for further improvements in risk assessment and evaluation as well as further ecological research: • knowledge of life tables, • the minimum viable population concept, • the meta-population approach and the role of landscape diversity, • the distribution of chemicals and organisms in space and time and the dimensions of space
and time in which individuals, populations and ecosystems react on pesticidal stressors. Acknowledgements The authors would like to thank all colleagues of the EPPO soil organisms group for the elaboration of the new draft which is deemed to fill an important niche in risk assessment for plant protection products and soil invertebrates.

97
References Bakker, F. 2002: Effects on survival and reproduction of the predacious mite Hypoaspis
aculeifer Canestrini (Acari: Laelapidae) in standard soil (LUFA 2.1). – Test protocol, March 2002: 16 pp.
EPPO, EPPO Panel on Environmental Risk Assessment 2002: Environmental risk assessment scheme for plant protection products - Chapter 8 - Soil organisms and functions. – Draft 02/9282 PP 3/8 (2): 17 pages.
European Commission, Health & Consumer Protection Directorate-General, Directorate E - Food Safety: Plant Health, Animal Health and Welfare, International Questions 2002: Guidance Document on Terrestrial Ecotoxicology Under Council Directive 91/414/EEC (SANCO/10329/2002).
ISO, International Standards Organisation 1999: Soil Quality – Inhibition of reproduction of collembola (Folsomia candida) by soil pollutants. – Geneva, Switzerland. ISO 11267: 1999.
Jepson, P.C. 1989: Pesticides and Non-target Invertebrates. – Intercept, Wimborne, Dorset: 240 pp.
Krogh, P.H. & Axelsen, J.A. 1998: Test on the predatory mite Hypoaspis aculeifer preying on the collembolan Folsomia fimetaria. – In: Løkke, H. & Van Gestel, C.A.M. (1998): Handbook of soil invertebrate toxicity tests. Ecological & Environmental Toxicology Series, Wiley & Sons Ltd., Chichester.
Løkke, H. & Van Gestel, C.A.M. 1998: Handbook of soil invertebrate toxicity tests. – Ecological & Environmental Toxicology Series, Wiley & Sons Ltd., Chichester: 281 pp.
OECD, Organisation for Economic Co-operation and Development 2000: Enchytraeidae reproduction test. – Guidelines for Testing of Chemicals. Test guideline 220 (Draft March 2000), OECD, Paris.

98

Pesticides and Beneficial Organisms IOBC/wprs Bulletin Vol. 26 (5) 2003
pp. 99 - 105
99
Testing Hypoaspis aculeifer (Acari: Laelapidae) on standard soils: notes on testing methodology and species sensitivity Frank Bakker1 & Pam van Stratum2 1 MITOX Trial Management B.V., P.O. Box 92260, 1090 AG Amsterdam, The Netherlands 2 MITOX Laboratories B.V., P.O. Box 92260, 1090 AG Amsterdam, The Netherlands Abstract: The sensitivity of the soil-inhabiting predatory mite Hypoaspis aculeifer was compared to the sensitivity of the plant inhabiting predatory mite Typhlodromus pyri. This was done in a series of experiments that involved the testing on glass substrates, leaf substrates and, for H. aculeifer, the testing on two soil matrices. It was shown that the intrinsic sensitivity of the two mite species for dimethoate was of the same order of magnitude. However, using more realistic matrices, i.e. the leaf for T. pyri and soil for H. aculeifer large differences in sensitivity were observed. Because the intrinsic sensitivities were similar these differences are attributed to the substrate. Key words: Hypoaspis aculeifer, Typhlodromus pyri, sensitivity, test method, exposure, non-target arthropods Introduction The predatory mite Typhlodromus pyri Scheuten (Acari: Phytoseiidae) is a key species in ecotoxicological research addressing the side-effects of pesticides on non-target arthropods. At the level of standardised laboratory testing on inert substrate (Tier 1) T. pyri has been proposed as one of two sensitive indicator species (Candolfi et al., 2001). Testing with this species should continue on more realistic substrates whenever Tier 1 trigger values, such as the proposed Hazard Quotient, are exceeded. However, for certain products such higher tier tests may be problematic. This applies in particular to products with strong phytotoxic effect on dicotyledon leaves, e.g. certain herbicides. Such products are problematic because leaf substrates recommended for such higher tier tests are quickly decomposed, while at the same time testing of the leaf-dwelling T. pyri in a soil environment would be a questionable exercise.
Development, improvement and standardisation of test systems for assessing sub-lethal effects of chemicals on fauna in the soil ecosystem has been the focus of an international expert panel in the EC-funded SECOFASE project. One of the standard species proposed in this programme is the soil inhabiting predatory mite Hypoaspis aculeifer (Acari: Laelapidae) (Løkke & van Gestel, 1996, 1998). This species is a predator of e.g. bulb mites, enchytraeids, nematodes and thrips larvae and is important in the soil ecosystem. Due to these ecological and taxonomical characteristics Hypoaspis was considered in addition to the test species proposed by Candolfi et al. (2001), in particular for soil applied products that result in continued or repeated exposure (EPPO 2002, European Commission 2002). MITOX developed a test with this species in compliance with standard characteristics of extended laboratory trials as formulated in the SETAC-guidance document (Barrett et al. 1994, Candolfi et al., 2001). This test design has been successfully applied to assess the side-effects of pesticides on H. aculeifer in a standardised way and was first presented to the IOBC Working Group “Pesticides and Beneficial Organisms” at the annual meetings in 1998 and 1999 (Bakker 1998, Bakker et al., 1999; both unpublished).

100
The Joint Initiative of IOBC, EPPO and BART has developed and standardised testing methodology for non-target arthropods derived from agricultural habitats (Candolfi et al., 2000). The relative sensitivity of the species included in this programme was investigated by Candolfi et al. (1999). Because H. aculeifer has not been included in the testing program of the Joint Initiative its relative sensitivity has not been documented. The aim of this paper is to provide data that enable comparison of the sensitivity with Typhlodromus pyri. This will be done using published data obtained from the ring testing in the frame of the Joint Initiative (Blümel et al., 2000) and in the SECOFASE project (Løkke & van Gestel, 1996). In addition data, obtained from experiments performed at MITOX, Amsterdam will be presented. Material and methods Test organisms and food used Experiments with Hypoaspis aculeifer were performed with protonymphs of the MITOX strain “Breezand”. The culture was obtained from a rearing of the Section Population Biology from the University of Amsterdam. The founder population was collected from stored lily bulbs, harvested in December 1990 in Breezand (Noord Holland). At MITOX, the mites were cultured using cheese mites, Tyrophagus putrescentiae (Schrank) (Acari: Acaridae) reared on yeast flakes. The same food was used in the different test systems.
The Typhlodromus test strain was the MITOX strain T. pyri “Zeeland”, a susceptible strain that has been reared since 1976. Pollen of broad bean (Vicia faba) was the food source for this predator for culturing and experimentation. Experiments were always initiated with protonymphs. Test methods
Glass substrate tests Testing methodology was according to standard protocols, based on the guideline of Blümel et al. (2000). Mortality was recorded after 3 (H. aculeifer) and after 7 days (both species) of exposure. To confine the test organisms ventilated glass cages (approximate dimensions 10 x 5 cm and 0.3 cm height), as described by Bakker et al. (1992) were used.
Leaf substrate tests For tests on leaf substrate, passively ventilated glass/plexiglass cages (approximate size of the exposure area is 4 cm diameter and 1 cm height), as described in the EPPO Guideline 142 (1989) were used. Active ventilation was not feasible because the soil mites require high ambient humidity and the climate chamber used for testing could not be operated in this high range. The tests were performed with cowpea leaves (Vigna sinensis L.), underside of the leaves facing upwards and after 2 days of exposure mortality was assessed for both species. Due to the high humidity that was required, the hygroscopic pollen used in the T. pyri test deteriorated during the test. A similar problem occurred in the soil mite test where the cheese mites and the yeast medium clumped. Because these problems became apparent from the 3rd day onwards it was decided to use mortality observed on day 2 for comparison among species.
Soil substrate tests For tests on soil substrate, passively ventilated glass/plexiglass cages (approximate size of the exposure area is 4 cm diameter and 1 cm height), as described in Bakker et al. 2003 were used. Sandy soil (LUFA 2.1, organic matter approx. 1%) and loamy sand soil (LUFA 2.2, organic matter approx. 2.2%) at 50% of their Water Holding Capacity were both used as substrate in these tests. These standard test soils were obtained from Lufa, Landwirt-schaftliche Untersuchungs- und Forschungsanstalt, Speyer, Germany). Approximately 4.5 g of moistened soil (approx. 2,5 mm height) was present in each unit. Applications were

101
performed both by spraying the units containing soil at a rate of 200 L water/ha or by mixing solutions through the soil. Mortality was recorded after 14 days of exposure. Cheese mites were used as a food source. The units were checked every 2 or 3 days and food/water were added when needed. Results and discussion Exposure on glass The LR50 of T. pyri on glass was 0.06 g dimethoate/ha (Table 1). Historical data obtained at the test facility with one discriminating dose in the range of 100-300 mg a.i. per ha gave results that were consistent with the dose response relationship found in this test, which indicates the result is robust.
Glass appeared an unsuitable substrate for testing Hypoaspis. During the trial it was observed that the test organisms had difficulties in moving around and, as illustrated in Table 1, control mortality increased to high levels after 3 days of exposure. There was however a clear response to dimethoate, starting shortly after exposure. The result obtained after 7 days is probably an overestimation, due to the weak condition of the test organisms, but the residual LR50 for dimethoate on glass plates is likely to be in the range of 0.6 and 0.3 g a.i./ha. Table 1. Sensitivity of T. pyri and H. aculeifer for dimethoate on glass substrate
H. aculeifer T. pyri After 3 days After 7 days After 7 days Control mortality 16% 54% 17% LR50 0.63 g ai/ha 0.28 g ai/ha 0.06 g ai/ha Confidence limits 0.53 – 0.73 g ai/ha 0.16 – 0.48 g ai/ha 0.05 – 0.08 g ai/ha Slope response curve 8.7 3.4 3.5 Chi-square goodness of fit P=0.111 P=0.359 P=0.011
0%
25%
50%
75%
100%
water 0,375 gai/ha
0,75 g ai/ha 1,5 g ai/ha 3 g ai/ha 6 g ai/ha 12 g ai/ha
H. aculeifer T. pyri
Fig. 1. Abbott’s corrected mortality for dimethoate on leaf substrate for T. pyri and H. aculeifer

102
Exposure on leaves After two days of exposure a clear dose-response relationship was observed for both species (Figure 1). The LR50 for T. pyri was 1.09 g a.i./ha, for H. aculeifer the median lethal rate was 0.57 g a.i./ha. Control mortalities were 10% and 13%, respectively (Table 2). Exposure on soil When dimethoate was sprayed on LUFA 2.2 soil, the LR50 was determined as 96 g ai/ha (Table 2). The same rate applied to LUFA 2.1 soil resulted in 100% mortality (Table 3). With the rates chosen no LR50 could be determined for the LUFA 2.1 soil. Table 2. Mortality of H. aculeifer exposed 14 days to dimethoate applied to LUFA 2.2 by
spraying
Control mortality 15% LR50 96 g ai/ha Confidence limits 87 – 105 g ai/ha Slope response curve 8.1 Chi-square goodness of fit P=0.467
Table 3. Mortality of H. aculeifer exposed to dimethoate on LUFA 2.1 after 14 days
Application Test rate average standard deviation n mixing 11.2 mg a.i./kg soil 100% 0% 3 4.5 mg a.i./kg soil 96% 7% 5 3.6 mg a.i./kg soil 89% 8% 6 spraying 133 g a.i./ha 100% 0% 8 96 g a.i./ha 100% – 1 67 g a.i./ha 92% – 1
Note: an LC50-value of 0.9 mg ai/kg of natural soil was reported by Løkke and van Gestel (1996) Discussion The sensitivity of both predatory mite species tested on glass substrate differed by a factor of 4 to 10. However, exposure to rates equivalent to <0.1% of the field rate (400 g a.i./ha) resulted in more than 50% mortality in both species. For both species the glass plate test resulted in an overestimation of the effects that are to be expected on more natural substrates. In part this is the consequence of changes in the behaviour of the mites when these are exposed on glass, for another part it is the consequence of increased bio-availability of the test substance on glass.
The plant-inhabiting Typhlodromus pyri showed increased activity on glass substrates (personal observations). This contributed probably to the finding that lower toxicity values were found when exposure was on leaves. Generally, at least a 10-fold higher dose has to be applied to leaves to reach effect levels comparable to glass (Bakker unpubl. data). The same was found in this study where the LR50 was 1.09 g ai/ha on leaf versus 0.06 g ai/ha on glass.
During the experiment it was observed that Hypoaspis aculeifer had problems in moving on glass. This was clear from a different posture of the mite and sluggish walking behaviour. These observations were not made on leaf substrates. Although the mites seemed to avoid

103
droplets of condensation their behaviour was otherwise normal. The locomotory problems on glass do not seem to have had an effect on sensitivity as the LR50’s on both substrates were highly comparable (0.63 g ai/ha after 3 days on glass vs 0.57 g ai/ha after 2 days on leaf).
On a substrate of LUFA 2.2 soil, the sensitivity of Hypoaspis aculeifer differed by a factor of 160 from the sensitivity on leaf or glass, as is illustrated by the data presented in Table 2. The LR50 found on LUFA 2.2 after 14 days was 25% of the representative field rate. When the spray test was repeated on LUFA 2.1 it was found that the toxicity increased, as the rate causing 50% mortality on LUFA 2.2 now caused 100% mortality. To convert the spray results into approximate mixing equivalents the approach given by Council Directive 91/414 (1 kg product/ha is equivalent to 1.33 mg product/kg soil for a soil depth of 50 mm) was adapted to the soil layer of 2.5 mm used in our tests by adjusting with a factor 20. With this correction the 67 g ai/ha causing 92% mortality (Table 3) could be recalculated as 1.78 mg ai/kg. This finding indicates that exposure to dimethoate on sprayed soil results in stronger effects than when dimethoate is mixed through the soil as 89% mortality was observed at a rate of 3.6 mg ai/kg in the mixing experiment. This result is in agreement with Heimbach and Soverini (1998), who also tested dimethoate on LUFA 2.1. and LUFA 2.2 by spraying or mixing and found similar results. To what degree this relates to the mobility of the test product used, the bioavailability, the behaviour of the mites or a combination of these factors remains to be tested.
To illustrate the relative sensitivity of Hypoaspis a comparison with other organisms tested on soil substrates could be made. Test protocols for Poecilus, Pardosa and Aleochara have been ringtested and some data on the toxicity of toxic reference products on these species is available. Inspection of these data indicates that the test strain of Hypoaspis is at the more susceptible end of the species spectrum (100% mortality at 33% of the field rate vs. 50-100% mortality at 100% of the field rate for the other species). However, in Heimbach and Soverini (1998) the LD50 for P. cupreus larvae in LUFA 2.2 (sprayed) and LUFA 2.1 (mixed) is slightly lower or in the same range as for H. aculeifer in this paper. In addition ring tests with P. cupreus larvae (Heimbach et al., 2002) showed high sensitivity of these larvae. We conclude that the actual sensitivity of Hypoaspis in soils is higher than the sensitivity of at least the adults of some other, larger, soil dwelling species. Whether the sensitivity of our test strain of Hypoaspis aculeifer is comparable to strains used in other laboratories remains to be tested but the similarity between the finding of Løkke and van Gestel (1996) and our result on LUFA 2.1 (Table 3) suggests a similar degree of sensitivity.
It is concluded that Hypoaspis aculeifer has an intrinsic sensitivity comparable to Typhlodromus pyri. This leads to the conclusion that the much lower toxicity observed on natural soils is related to the test method used, mainly to the properties of the soil and not to the sensitivity of the test species. Acknowledgements The data used for this contribution were obtained during several years of testing. During this period there was intensive interaction with sponsors from industry and with regulatory authorities alike. The identity of the companies, institutes and persons involved must remain confidential, but their input was crucial. We thank Rik Feije, André Grove, Gijs Hoogen-doorn, Gerrit Jacobs and Edwin Loose for technical assistance. Isabella Lesna from the University of Amsterdam kindly provided the mite strains and valuable information.

104
References Bakker, F.M. 1998: Evaluating herbicide side-effects on predatory soil mites in an extended
laboratory design. – Paper presented at IOBC Working Group „Pesticides and Beneficial Organisms“. November 2-6, 1998. Biological Research Center for Agriculture and Forestry. Braunschweig (unpublished).
Bakker, F., Grove, A., Blümel, S., Calis, J. & Oomen, P. 1992: Side-effect tests for phytoseiids and their rearing methods. –IOBC/wprs Bull. 15(3): 61-82.
Bakker, F.M., Grove, A.G., Jacobs, G. and Hoogendoorn, G. 1999: Extended laboratory testing with predatory soil mites. – Paper presented at IOBC Working Group „Pesticides and Beneficial Organisms“. October 27-29, 1999. Centre de Versailles-Grignon (unpublished).
Bakker, F.M., Feije, R., Grove, A.J., Hoogendoorn, G.M., Jacobs, G., Loose, E.D. & van Stratum, P. 2003: A laboratory test to evaluate effects of plant protection products on mortality and reproduction of the predatory mite Hypoaspis aculeifer Canestrini (Acari: Laelapidae) in standard soil. – Journal of Soils and Sediments (in press).
Barrett, K.L., Grandy, N., Harrison, E.G., Hassan, S.A. and Oomen, P.A. (eds) 1994: SETAC Guidance document on regulatory testing procedures for pesticides with non-target arthropods. – Aimprint Saffron Waldon, UK: 51 pp.
Blümel, S., Bakker, F., Baier, B., Brown, K., Candolfi, M.P., Goßmann, A., Grimm, C., Jäckel, B., Nienstedt, K., Schirra, K.J., Ufer, A. and Waltersdorfer, A., 2000: Laboratory residual contact test with the predatory mite Typhlodromus pyri Scheuten (Acari: Phytoseiidae) for regulatory testing of plant protection products. – In: Guidelines to evaluate side-effects of plant protection products to non-target arthropods; IOBC, BART and EPPO Joint Initiative. Candolfi, M.P., Blümel, S., Forster, R. et al. (eds.). IOBC/wprs, Gent: 121-133.
Candolfi, M., Bakker F., Cañez, V., Miles, M., Neumann, C., Pilling, E., Priminani, M., Romijn, K., Schmuck, R., Storck-Weyhermüller, S., Ufer, A. and Waltersdorfer, A. 1999: Sensitivity of non-target arthropods to plant protection products: could Typhlodromus pyri and Aphidius spp. be used as indicator species? – Chemosphere 39: 1357-1370.
Candolfi, M. P., Blümel, S., Forster, R., Bakker, F., Grimm, C., Hassan, S., Heimbach, U., Mead-Briggs, M., Reber, B., Schmuck, R., Vogt, H. (eds.) 2000: Guidelines to evaluate side-effects of plant protection products to non-target arthropods; IOBC, BART and EPPO Joint Initiative. – IOBC/wprs, Gent: 158 pp.
Candolfi, M.P., Barrett, K.L., Campbell, P.J., Forster, R., Grandy, N., Huet, M-C., Lewis, G., Oomen, P.A., Schmuck, R. and Vogt, H. (eds) 2001: Guidance document on regulatory testing and risk assessment procedures for plant protection products with non-target arthropods. – Proceedings from the ESCORT-2 workshop, Wageningen, March 21-23, 2000. SETAC Office, Pensacola, Florida, USA: 46 pp.
EPPO 1989: Guideline for the evaluation of side-effects of plant protection products: Encarsia formosa. Guideline 142. – Bulletin OEPP/EPPO 19: 355-372.
EPPO 2002: Environmental risk assessment scheme for plant protection products. Chapter 8: Soil Organisms and Functions. Revision 2002.
European Commission 2002: Guidance Document on Terrestrial Ecotoxicology under Council Directive 91/414/EEC. – SANCO/10329/2002 rev 2 final (17 October 2002).
Heimbach, U., Baier, B., Barth, M., Blümel, S., Geuijen, I., Jäckel, B., Maus, C., Nienstedt, K.M., Schmitzer, S., Stäbler, P., Ufer, A., Winkelmann, G., 2002: First ring test results of a laboratory method to evaluate effects of plant protection products on larvae of Poecilus cupreus (Coleoptera: Carabidae). – IOBC/wprs Bull. 25 (11): 19-26.

105
Heimbach, U., Soverini, E., 1998: Testing side effects of pesticides on larvae of the carabid beetle Poecilus cupreus (L.) (Coleoptera; Carabidae). – IOBC/wprs Bulletin, 21 (6): 93- 99.
Løkke, H. & van Gestel, C.A.M., 1996: SECOFASE, Final Report. Development, improvement and standardization of test systems for assessing sub lethal effects of chemicals on fauna in the soil ecosystem. – National Environmental Research Institute, Denmark, 300 pp.
Løkke, H. & van Gestel, C.A.M. (eds.) 1998: Handbook of soil invertebrate toxicity tests. – J. Wiley and Sons, 281 pp.

106
Pesticides and Beneficial Organisms IOBC/wprs Bulletin Vol. 26 (5) 2003
pp. 107 -110
107
Pesticides and entomopathogenic nematodes – current status and future work Arne Peters E-nema GmbH, Klausdorfer Str. 28-36, 24223 Raisdorf, Germany Abstract: In the late 80’s intensive work was done to test side effects of pesticides on beneficial nematodes. The results of this work are still heavily relied upon when using nematodes in biological control. Yet, the test methods employed only partly mimic the exposure of nematodes to pesticides in agricultural practice. Modified guidelines for testing the side effects of pesticides to nematodes are presented. The nematodes are exposed to pesticides in water, as if they were tank-mixed with the pesticide, and in quartz-sand, mimicking a poorly absorbing substrate. The lesser mealworm (Tenebrio molitor) is used as a model insect for testing nematode infectivity at a dose around the LC50. In addition to insect mortality, the propagation of the nematode inside the insects is recorded to estimate the pesticide’s effect on nematode fecundity. The data gathered so far tend to overestimate the pesticides effect on nematode survival, and to underestimate their effect on infectivity. Key words : entomopathogenic nematodes, Heterorhabditis, Steinernema, pesticides, compatibility Introduction After an enthusiastic period of research on the side effects of pesticides on entomopathogenic nematodes (EPNs), further investigation has stopped in the early 1990s, probably due to the thoroughness of the work presented in the paper of Rovesti et al. (1990), which also demonstrated minimal side effects. The method applied in this study does not conform to the proposed standard method described by Vainio (1992). Both methods are critically evaluated in this paper and an improved standard method is proposed for testing those chemicals which have been developed in the last 10 years and those which will be developed in the future. The present standard methods An assay should mimic the worst case possible that could occur in nature. Unlike other beneficials, nematodes are mostly applied with conventional spraying equipment and may, therefore, be tank-mixed with pesticides. After the application and when naturally occurring, nematodes are sheltered in the soil from the impact of foliar applied pesticides. We, therefore, are dealing with two levels of exposure. Consequently, the assay should mimic both situations, a short exposure in the spray tank and an infinite exposure in the substrate. According to the standard protocol to assess the initial toxicity as proposed by Vainio (1992), nematodes are incubated together with the pesticide in distilled water in test tubes for 2, 4 and 7 days. Besides the exposure time which is much longer than nematodes will ever stay in a vessel before being sprayed out, under practical conditions they will hardly be sprayed with distilled water. In the test tubes, the nematodes suffer anoxia which might affect their susceptibilty to pesticides. Prior to testing the nematodes’ infectivity, the pesticide is washed off the nematodes, so there is no exposure of nematodes in the substrate included.
A further important feature of an assay system is a low internal variance and a high sensitivity in detecting pesticide effects. This applies for assessing nematode numbers as well as infectivity using a model insect. Whereas Rovesti et al. (1990) used Galleria mellonella as

108
a model insect, Vainio (1992) proposes Tenebrio molitor which is less susceptible to EPNs. In addition, the use of G. mellonella increases the within treatment variation of the infectivity assay (Peters, 2000). This is partly due to the low susceptibility of this insect to most commercially used entomopathogenic nematodes. When testing the infectivity in order to compare nematode production batches, assays using Tenebrio molitor were clearly superior. Furthermore, it was shown that the mealworms need not be separated from each other but can be exposed in a single assay arena to the nematodes. The infectivity assay should include all nematode traits that contribute to their efficacy in the field: host location over a short distance and penetration into the host as well as host death. For some nematode applications like the use of Steinernema feltiae in mushrooms (Fenton et al., 2002) or of Heterorhabditis bacterio-phora in turf (Ehlers and Peters, 1998) establishment and propagation of nematodes are essential for successful pest control. Nematode propagation should therefore be considered in the assay.
Proposed new assay system The outline of an improved assay system is given in figure 1. The improved protocol uses pesticide exposure in two levels, a high exposure level as encountered by the nematodes in the spray tank and a lower level as encountered in the substrate. The protocol is as follows:
Fig. 1: Proposed improved assay scheme for testing side effects of pesticides on beneficial nematodes.
Nematodes exposed to pesticides in tap water
Counting; assessing mortality
Infectivity and propagation
assay Propagation
Nematodes exposed to pesticide treated assay arena
Application of surviving nematodes to assay arena
Control group: Nematodes in tap water applied to quartz sand
Control group: Nematodes in tap water
Counting; assessing mortality

109
N.b.: Nematodes settle down quickly when suspended in water. Remember to shake thoroughly !! 1. Nematodes are suspended in tap water at a concentration of 5000 / ml. The concentration
should be estimated by taking 3 samples of 100 µl in test tubes, diluting it in 900 µl tap water and counting 5 droplets of 100 µl from each test tube at ≥ 20-fold magnification. Count living and dead nematodes.
2. Dilute in test tubes 3 ml of this suspension in: a) 3 ml of the pesticide in 2-fold recommended concentration and b) 3 ml of tap water. Make 4 replicates and fill into 8cm ∅ Petri-dishes. Close but not seal Petri-dishes and incubate for 24 hours at 25°C and >80% relative humidity (use plastic box with water film in the bottom to achieve high rH).
3. After 24 hours count living and dead nematodes in treatment and control. 4. Perform infectivity and propagation assays according to step 4.1 to 4.7 with nematodes
from the control group (see 2.b) and with the nematodes treated with pesticides in tap water (see 2.a). Prepare a third assay arena and treat it with the recommended field rate of the pesticide with an automatic lab sprayer and then add nematodes from the control group (2.b). 4.1. Preparing infectivity assay arena: Prepare quartz-sand (200 to 400 µm core size)
approx. 300 g for testing one batch of nematodes. Adjust to 10% moisture content by adding tap water to dry sand.
4.2. Fill 3 plastic boxes (10 x 10 cm) with moist sand to a height of approx 2 cm. 4.3. Add 800 nematodes (H. bacteriophora) or 400 (S. feltiae; S. carpocapsae) to the
assay arena. Take concentration estimated by counting in step 1 and use adjustable pipette to apply the correct nematode number.
4.4. Add 40 mealworms to each container. Close container, turn it around and knock it on a hard horizontal surface to ensure contact of nematodes and mealworms. Use lid with 10 holes of 1 mm ∅ when incubating at 25°C; >80% rH for 7 days. Use plastic box with water film in the bottom to achieve high rH. Include 2 containers without adding nematodes as an untreated control.
4.5. Count living and dead insects after 7 days incubation 4.6. Select 10 infected mealworms of the treatments record weight and put them on an
inverted petri-dish-lid (3cm ∅) covered with an oversize filter paper and put the lid into a larger Petri-dish filled with tap water (1-2 mm height). The edge of the filter paper should touch the water film. Incubate at 20-23°C for 3 weeks and count the number of emerged nematodes per petri-dish. Rinse nematodes from the petri-dish into a defined volume of water and estimate nematode concentration according to the method described in step 1. Calculate nematode numbers per g of mealworms they emerged from.
5. Compile results from nematode mortality (3.); infectivity (4.5) and fecundity (4.6) according to IOBC-guidelines for laboratory results:
Toxicity level Percent deviation
from control 1 (harmless) < 30 2 (slighlty harmful) 30 - 79 3 (moderately harmful) 80 - 99 4 (harmful) > 99

110
Interpretation of results with old assay The wealth of data which we rely on has been elaborated from Rovesti et al. (1990). Their method tends to overestimate the effect of the pesticides on nematode mortality, since the nematodes were exposed to slight anoxia in the test tubes and they were incubated for a far longer time than they would be in reality. The effect on infectivity was underestimated since high nematode doses were applied to the highly susceptible insect G. mellonella. The LC50 of beneficial nematodes to G. mellonella has been estimated to be in range of 1 to 4 nematodes per insect (Bedding et al., 1983), while Rovesti applied 100 to 200 nematodes to G. mellonella and the old standard protocol (Vainio, 1992) requires 200 to 250 nematodes per mealworm whereas the LC50 ranges from 5 to 30 depending on nematode species (unpublished data). Still, the information given in Rovesti et al. (1990) can be used since effects on nematodes usually were sufficiently clear. For future work the improved protocol is recommended. References Bedding, R.A., Molyneux, A.S. and Akhurst, R.J. 1983: Heterorhabditis spp., Neoaplectana
spp., and Steinernema kraussei: Interspecific and intraspecific differences in infectivity for insects. – Exp. Parasitol. 55: 249-257.
Ehlers, R.U. and Peters, A. 1998: Control of grubs on sports turf. – Rasen Turf Gazon 29: 60-67.
Fenton, A., Gwynn, R.L., Gupta, A., Norman, R., Fairbairn, J.P. and Hudson, P.J. 2002: Optimal application strategies for entomopathogenic nematodes: integrating theoretical and empirical approaches. – Journal of Applied Ecology 39: 481-492.
Peters, A. 2000: Insect based assay for entomopathogenic nematode infectiousness: definitions, guidelines, problems. – IOBC/wprs Bulletin 23(2): 109-114.
Rovesti, L., Fiorini, T., Bettini, G., Heinzpeter, E.W. and Tagliente, F. 1990: Compatibilità di Steinernema spp. e Heterorhabditis spp. con fitofarmaci. – Infomatore fitopatologico 9: 55-61.
Vainio, A. 1992: Guideline for laboratory testing of the side-effects of pesticides on entomo-phagous nematodes Steinernema spp. – IOBC /wprs Bulletin 15(3): 145-147.

Pesticides and Beneficial Organisms IOBC/wprs Bulletin Vol. 26 (5) 2003
pp. 111 -122
111
Susceptibility of Hyposoter didymator (Hymenoptera: Ichneumonidae) adults to several insect growth regulators and spinosad by different exposure methods M.I. Schneider1, G. Smagghe2 & E. Viñuela1 1 Protección de Cultivos, E.T.S I. Agrónomos, 28040 Madrid, Spain 2 Laboratory of Agrozoology, Faculty of Agricultural and Applied Biological Sciences,
9000 Gent, Belgium Abstract: The maximum field recommended concentrations (based on the recommended maximum field rate and a water amount of 1000 l/ha) of spinosad (120 mg a.i./l) and the IGRs tebufenozide (144 mg a.i./l), methoxyfenozide (144 mg a.i./l), diflubenzuron (100 mg a.i./l), azadirachtin (48 mg a.i./l) and pyriproxyfen (75 mg a.i./l) were tested in the laboratory on adults of the parasitoid Hyposoter didymator using different bioassays. Fresh residues of spinosad on glass surfaces were highly toxic to the natural enemy, causing 100% mortality of adults. However, the deleterious effect of the insecticide decreased quickly with the age of the residues, and 10-d-old residues did not cause any mortality or modified longevity. Fresh residues and five-d-old residues of azadirachtin reduced the beneficial capacity of females. In the same assay, tebufenozide, methoxifenozide, diflubenzuron and pyriproxy-fen were nontoxic irrespective of the age of the residue. Spinosad topically applied caused mortalities >95% and azadirachtin decreased the number of attacked hosts per female. The other insecticides did not affect any life parameter of the parasitoid. The IGRs tested had a minimal oral toxicity to adults of H. didymator after 72 h, but spinosad caused more than 80% mortality. Longevity was decreased by spinosad and azadirachtin, and the beneficial capacity lowered by any insecticide but tebufenozide and methoxyfenozide. Key words: Hyposoter didymator, adults, spinosad, tebufenozide, methoxyfenozide, diflubenzuron, azadirachtin, pyriproxyfen, side-effects, laboratory Introduction Nowadays, the implementation of integrated pest management programs (IPM) worldwide, is focused on the knowledge of the activity of pesticides on the important natural enemies present in every crop, with the aim of finding compatible products (Dent, 1995; Boller et al., 1998).
In a great diversity of field, horticultural and forestry crops of several European countries including Spain, it is common the presence of the naturally occurring parasitoid Hyposoter didymator (Thunberg), an ichneumonid endoparasitoid of early larval stages of several lepidopteran pests (Bar et al., 1979; Bahena et al., 1999; Schneider & Viñuela, 1999; Torres-Vila et al., 2000; Figueiredo & Mexía, 2000). The conservation of adults of parasitoids in agricultural habitats, is essential for the survival of the population, but they are considered the most sensitive stage to pesticides (Vogt, 2000), and are in general much more affected by them than other developmental stages (Jacas & Viñuela, 1994a). Therefore, their use together with pesticides, needs the previous and essential step of determining their susceptibility towards pesticides including effects on reproduction.
Candidate pesticides for being used together with natural enemies are the insect growth regulators (IGR) and the naturally derived spinosad, and all of them can control lepidopteran pests. Tebufenozide (TEB) and methoxyfenozide (MET) are moulting accelerating
112
compounds (MAC), which directly interact on the ecdysteroid receptors especially of lepidopteran larvae, inducing a premature and lethal moulting (Chandler et al., 1992; Smagghe & Degheele, 1998; Palli & Retnakaran, 2001). Azadirachtin (AZA), one of the major constituents of neem extracts obtained from Azadirachta indica A. Juss, inhibits the release of prothoracicotropic hormones and allatotropins (Banken & Stark, 1997) interfering with the normal metamorphosis process in insects (Schmutterer, 1995). Diflubenzuron (DFB) is a benzoylphenylurea (BPU), thereby preventing chitin production, resulting in several changes in the elasticity and firmness of the endocuticle (Ishaaya & Horowitz, 1999). Pyriproxyfen (PYR) is a juvenile hormone (JH) analogue that interferes with the hormonal balance of insects, giving strong suppressions of embryogenesis, metamorphosis and adult formation (Koehler & Patterson, 1991; Ishaaya & Horowitz, 1995). Spinosad (SPIN) is a naturalyte obtained from a soil actinomycete, with a new neurotoxic mode of action involving the postsynaptic nicotinic acetylcholine receptors and apparently, the GABA receptors as well (Salgado, 1998).
All the above mentioned pesticides have been reported to be safe for many natural enemies commonly used in IPM, mostly predators, and detailed information can be found for example in Schoonover & Larson (1995), Van de Veire et al. (1996), Darvas & Polgar (1998) or Miles & Dutton (2000). However and comparatively, few information is available on their side-effects on hymenopterans (Bernardo & Viggiani 2000; Viñuela et al., 2000; Vogt, 2000, Willrich & Boethel, 2001).
Previous studies dealing with the effects of these insecticides on immature stages of H. didymator, demonstrated that some of them could cause deleterious effects on this wasp. Applied to concentrations based on the maximum rate for field application, tebufenozide affected eggs and first larval instars of the parasitoid when provided to the host larvae (Schneider & Viñuela, 1999), and spinosad affected the life span of adults and their parasitism capacity when topically applied to the parasitoid pupae (Schneider et al. 2000). At the field recommended rates, when pupae were topically treated, methoxyfenozide and tebufenozide had no effect on H. didymator, diflubenzuron was moderately toxic to the parasitoid, and azadirachtin, pyriproxyfen and spinosad were very toxic, affecting all its life parameters (Schneider et al., 2002).
In this study we report on the impact of these insecticides on adults of H. didymator using different uptake routes, in order to provide a better understanding of the interaction of them with this parasitoid.
Materials and methods Insects Hyposoter didymator was maintained in a controlled environment chamber, at 25 ± 2ºC, 75 ± 5% relative humidity and 16L:8D photoperiod. The parasitoid was routinely reared on Spodoptera littoralis (Boisduval) third instars using a procedure developed in our laboratory (Schneider, unpublished data), and adults were provided with pure honey and water ad libitum. Host larvae were fed a Poitout based artificial diet, adults a 15% solution of honey in water and both were kept under the same environmental conditions described above. Longevity of H. didymator males is lower than that of females (Schneider et al., 2000), so in experiments, a higher number of males was always used in order to have enough couples to study the influence of insecticides on the reproduction of this parasitoid. Insecticides The commercial products Align® (3.2% AZA, non-oil EC, Sipcam Inagra, Valencia, Spain), Dimilin® (25% DFB, WP, AgrEvo, Valencia, Spain), Juvinal® (10% PYR, EC, Kenogard,

113
Barcelona, Spain), Tracer® (48% SPIN, DowAgrosciences, Madrid, Spain) and Mimic® (24% TEB, SC, Rohm and Haas, Barcelona, Spain), and the experimental RH-2485 (24% MET, SC, Rohm and Haas, Spring House, PA), were used in all toxicity assays. Depending on the application technique, aqueous or acetone fresh solutions (in acetone 99.5% Panreac® for topical assays) were prepared prior the experiments. We only studied the maximum field recommended concentrations (based on the recommended maximum field rate and a water amount of 1000 l/ha), as recommended in Spain at the time of the experiments for TEB (144 mg a.i./l), AZA (48 mg a.i./l), DFB (100 mg a.i./l) and PYR (75 mg a.i./l), as well as that used in the United States for SPIN (120 mg a.i./l) and that recommended by the producer for the non registered MET (144 mg a.i./l). Residual treatment Young adults of H. didymator were exposed to residues of different ages of every insecticide on glass surfaces, following the method developed by Jacas & Viñuela (1994b) for the braconid Psyttalia (=Opius) concolor Szèpligeti, using dismountable cages and forced ventilation. Four replicates of 10 females and 20 males per insecticide and control were used. Topical treatment Groups of 3-d-old females and males were topically treated on the pronotum with 1 µl of the insecticide solutions using a Hamilton microsyringe (Hamilton, Switzerland). Controls were treated with acetone alone. Before treatment and to facilitate the insecticide application, insects were anaesthetized with cold temperatures (3 minutes at -20ºC). The weight of males and females differ less than 0.01%, so they were weighed together. The weight of adults averaged 34.0 ± 0.0013 mg, so the concentrations studied were equivalent to doses of 1.41 to 4.23 µ a.i./g adult, depending on the insecticide (1.41 for AZA, 2.20 for PYR, 2.94 for DFB, 3.52 for SPIN and 4.23 µ a.i./g adult for TEB and MET). Every experiment consisted of 4 replicates of 5 females and 10 males per dose level and insecticide.
After treatment, insects were transferred to ventilated plastic round boxes (12 cm diameter by 5 cm height) and provided with food (honey brushstroke in the box lid) and water ad libitum. Ingestion treatment Adults (3-d-old) were fed aqueous solutions of the different insecticides continuously in the drinking water during the life span, in the ventilated plastic boxes previously described. Every experiment consisted of 6 replicates of 4 females and 10 males per insecticide and control. Assessments Evaluation of results was based on lethal (direct mortality) and sublethal effects of the insecticides (longevity and beneficial capacity). The beneficial capacity of the wasps (measured as the percentage of attacked hosts and number of progeny size per female) was studied using isolated females after three days of treatment, following the method of Schneider et al. (2000).
Toxicity data are presented as means ± sd and were analyzed by one way analysis of variance (ANOVA) using Statgraphics (STSC, 1987). The means were separated by the LSD multiple range test (P<0.05). In those cases the F-value from ANOVA was not significant, a Bonferroni test was applied (Milliken and Johnson, 1984). According to the reduction on the investigated parameters, products were classified into the four IOBC standard classes for laboratory tests (Hassan, 1994): 1 = harmless (<30%), 2 = slightly harmful (30-79%), 3 = moderately harmful (80-99%) and 4 = harmful (>99%).

114
Results
Residual treatment The results of our studies indicated that the exposure of adults of H. didymator to TEB, MET, DFB, PYR and AZA, did not cause any significant alteration on mortality or longevity irrespective of the age of the residue (Table 1).
Table 1. Influence of the age of the insecticide residue on some life parameters of H. didymator
% Mortality, 72 h Longevity, days
Insecticides Concentra-
tions mg a.i./l females a males b females c males d
IOBCClass***
Fresh residue Control 0 2.5 ± 2.5 a 15.0 ± 6.5 a 27.0 ± 1.6 a 15.3 ± 3.0 a - Tebufenozide 144 5.0 ± 5.0 a 20.0 ± 4.0 a 27.3 ± 0,9 a 16.2 ± 3.2 a 1 Methoxyfenozide 144 0.0 ± 0.0 a 17.5 ± 5.0 a 26.2 ± 1.3 a 14.4 ± 3.0 a 1 Diflubenzuron 100 0.0 ± 0.0 a 15.0 ± 3.0 a 26.0 ± 1.8 a 16.5 ± 3.0 a 1 Pyriproxyfen 75 0.0 ± 0.0 a 17.5 ± 2.5 a 27.0 ± 2.0 a 15.0 ± 3.3 a 1 Azadirachtin 48 0.0 ± 0.0 a 15.0 ± 3.0 a 27.0 ± 1.5 a 16.3 ± 3.0 a 1 Spinosad* 120 100 b 100 ± 0.0 b 0.9 ± 0.8 b 0.6± 0.2 b 4
5-d-old residues Control 0 5.0 ± 3.0 a 27.5 ± 2.5 a 27.0 ± 2.0 a 16.0 ± 3.5 a - Tebufenozide 144 7.5 ± 5.0 a 25.0 ± 5.0 a 26.3 ± 0.9 a 16.0 ± 3.3 a 1 Methoxyfenozide 144 10.0 ± 3.0 a 22.5 ± 4.5 a 26.0 ± 0.4 a 14.0 ± 3.0 a 1 Diflubenzuron 100 10.0 ± 4.0 a 22.5 ± 5.0 a 26.0 ± 1.8 a 16.0 ± 1.5 a 1 Pyriproxyfen 75 10.0 ± 7.0 a 25.0 ± 3.0 a 27.0 ± 1.6 a 14.3 ± 3.2 a 1 Azadirachtin 48 10.0 ± 4.2 a 17.5 ± 5.0 a 28.0 ± 0.7 a 14.6 ± 2.5 a 1 Spinosad** 120 71.4 ± 3.0 b 69.5 ± 4.0 b - 2
10-d-old residues Control 0 17.5 ± 2.5 a 35.0 ± 3.0 a 26.0 ± 1.7 a 16.1 ± 4.0 a - Tebufenozide 144 17.5 ± 7.5 a 35.0 ± 3.0 a 26.2 ± 1.3 a 16.2 ± 3.4 a 1 Methoxyfenozide 144 17.5 ± 6.2 a 32.5 ± 2.5 a 26.0 ± 0.8 a 14.0 ± 2.5 a 1 Diflubenzuron 100 15.0 ± 3.0 a 32.5 ± 3.0 a 26.5 ± 2.0 a 16.0 ± 1.2 a 1 Pyriproxyfen 75 22.5 ± 5.0 a 32.0 ± 2.5 a 27.0 ± 1.5 a 15.0 ± 3.4 a 1 Azadirachtin 48 20.0 ± 4.0 a 30.0 ± 4.0 a 28.0 ± 1.1 a 14.0 ± 2.6 a 1 Spinosad 120 22.5 ± 2.5 a 35.0 ± 3.0 a 21.4 ± 1.8 a 10.8 ± 3.0 a 1
Within the same column and residue age, data followed by the same letter are not significantly different (P= 0.05; ANOVA and LSD or Bonferroni mean separation). Data are expressed as means ± SD based on four replicates of 20 females and 10 males per insecticide and control. Fresh residues: aF=312.87; df=6,21; P= 0.0005; bF=312.87; df=6,21 P= 0.0001; cF=0.11; df=5,18; P= 0.98; dF=0.09; df=5,18; P= 0.9. Five-d-old residues: aF=22.69; df=6,21; P= 0.0003; bF=17.65; df=6,21; P= 0.0001; cF=0.20; df=5,18; P= 0.95; dF=0.10; df=5,18; P= 0.9. Ten-d-old residues: aF=0.36; df=6,21; P= 0.89; bF=0.41; df=6,21; P= 0.86; cF=1.95; df=6,21; P= 0.11; dF=0.43; df=6,21; P= 0.84. *Adults died within 2 hours after the beginning of the assay. **Adults died within 24 hours after the beginning of the assay. ***Based on lethal effects shown in this table as well as on sub-lethal effects shown in Figure 1.

115
The beneficial capacity of the parasitoid was only slightly lowered by AZA giving significant reductions in the number of attacked hosts by 26 and 16% when adults were exposed to fresh and 5-d-old residues, respectively (Figure 1).
All insecticides but SPIN, could be classified as IOBC classes 1 based both on lethal and sublethal effects (Table 1). Spinosad was highly toxic to the wasp, and fresh residues () caused the death of all adults within 2 h after the onset of the experiment (IOBC class 4). However, the detrimental effect of this insecticide decreased drastically with the age of the residues and 5-d-old residues could be classified as IOBC class 2 (even though about 70% of adults died within 24 h after the beginning of the experiment), and 10-d-old residues were totally harmless to adults of the wasp (IOBC class 1) (Table 1). The naturalyte did not modify the beneficial capacity of the wasp, when it could be studied (Figure 1). Fig. 1. Effects of the insecticides on the beneficial capacity of H. didymator females, after the
exposure of adults to residues of different ages. Within a given residue age and factor, data followed by the same letter are not statistically different (P= 0.05; ANOVA and LSD mean separation). A: Fresh residues (attacked hosts F=55.56; df=5,18; P= 0.0001; progeny size F=5.0; df=5,18; P= 0.004); B: Five-d-old residues (attacked hosts F=18.92; df=5,18; P= 0.0001; progeny size: F=2.68; df=5,18; P= 0.056); C: Ten-d-old residues (attacked hosts F=0.42; df=6,21; P= 0.85; progeny size: F=0.21; df=6,21; P= 0.97).
Topical treatment Acetone seemed to be deleterious to males but not to females of H. didymator (which however have a similar weight as previously stated), because in controls a 40% of mortality was recorded
0
20
40
60
80
100
C TEB MET DFB PYR AZA SPIN
Treatment
(%)
Attacked host (%) Progeny size (%)
a aaaaa a
0
20
40
60
80
100
C TEB MET DFB PYR AZA
Treatment
(%)
a baaaa
0
20
40
60
80
100
C TEB MET DFB PYR AZA
Treatment
(%)
a baaaaA B
C

116
for males 72 h after treatment, in comparison with no mortality at all for females (Table 2). A possible detrimental effect of cold anaesthesia was discarded, because the experiment was repeated using CO2 as anaesthetic, and similar results were obtained.
The results of these assays showed a negligible topical toxicity for all the IGR studied against adults of H. didymator when applied at rates recommended for field use, even though AZA significantly reduced the number of attacked hosts by 19% (Figure 2). All insecticides but SPIN, could be classified as IOBC class 1 (Table 2). Spinosad however, was very effective in suppressing adult survival, and it was classified as IOBC class 4. Table 2. Toxicity of the insecticides to H. didymator adults when topically applied.
% Mortality, 72 h Longevity, days Insecticides
Doses µ a.i./g adult(Concentrations
mg a.i./l) females a males b females c males d IOBCClass*
Control 0 0.0 ± 0.0a 40.0 ± 9.1a 25.0 ± 2.6a 14.1 ± 2.2a Tebufenozide 4.23 (144) 5.0 ± 5.0a 42.5 ± 4.7a 25.5 ± 3.0a 11.8 ± 1.8a 1 Methoxyfenozide 4.23 (144) 5.0 ± 5.0a 40.0 ± 7.0a 23.5 ± 2.2a 13.7 ± 2.5a 1 Diflubenzuron 2.94 (100) 0.0 ± 0.0a 42.5 ± 4.7a 23.6 ± 1.8a 13.0 ± 2.0a 1 Pyriproxyfen 2.20 (75) 0.0 ± 0.0a 37.5 ± 4.8a 24.0 ± 2.0a 12.0 ± 2.0a 1 Azadirachtin 1.41 (48) 0.0 ± 0.0a 45.0 ± 6.5a 24.6 ± 2.5a 13.8 ± 2.0a 1 Spinosad 3.52 (120) 95.0 ± 5.0b 100 ± 0.0b 3.3 ± 0.2b 0.9 ± 0.04b 4
Within the same column, data followed by the same letter are not significantly different (P= 0.05; LSD mean separation). Data are expressed as means ± SD based on four replicates of 5 females and 10 males per insecticide and control. aF=116.67; df=6,21; P= 0.00; bF=14.32; df=6,21 P= 0.0001; cF=12.42; df=6,21; P=0.00; dF=5.5; df=6.21; P= 0.0015. *Based on lethal effects shown in this table as well as on sub-lethal effects shown in Figure 2.
Fig. 2. Effects of the insecticides on the beneficial capacity of H. didymator females, when topically applied. For every factor, data followed by the same letter are not statistically different (P= 0.05; ANOVA and LSD mean separation). Attacked hosts: F=9.38; df=6,35; P= 0.0001; Progeny size: F=1.05; df=6,35; P= 0.40.
0 20 40 60 80 100
C
TEB
MET
DFB
PYR
AZA
Trea
tmen
t
(%)Attacked hosts Progeny Size
a
ba
a
a
aa
aa
a
a
a

117
Ingestion application Our study indicated that the IGR we tested (TEB, MET, DFB, AZA and PYR), had a minimal oral toxicity to adults of H. didymator when they were fed the insecticides continuously from 3-d-old onwards (Figure 3). However, when SPIN was fed orally, mortality of both sexes surpassed 80%.
Even though AZA did not cause mortality of parasitoid adults at three days, a substantial subsequent effect on longevity was observed because this parameter was significantly decreased in both sexes. Life span of treated females and males was only 16.1 and 6.5 days, while control females and males lived an average of 27.0 and 16.8 days, respectively (Figure 4). The effect on longevity was even more drastic for SPIN because females only lived 5.1 days and males 2.5 days.
Fig. 3. Mortality at 72 h of H. didymator adults when they were fed the insecticides continuously in the drinking water. For every sex, data followed by the same letter are not statistically different (P= 0.05; ANOVA and LSD mean separation). Females: F=158.21; df=6,35; P= 0.00; Males: F=47.68; df=6,35; P= 0.003.
Fig. 4. Longevity of H. didymator adults when were fed the insecticides continuously in the drinking water. For every sex, data followed by the same letter are not statistically different (P= 0.05; ANOVA and LSD mean separation). Females: F=58.36; df=6,33; P=0.00; Males: F=62.43; df=6,35; P= 0.00.
0
20
40
60
80
100
C TEB MET DFB AZA PYR SPIN
Treatment
Mor
talit
y (%
)
Females Males
a
b
aaaaa
b
a
0 5 10 15 20 25 30
C
TEB
MET
DFB
AZA
PYR
SPIN
Trea
tmen
t
Longevity (days) Females Males
c
bb
aa
c
a
a
aa
a
a
a
a

118
The beneficial capacity of H. didymator females was also impaired by DFB, AZA and PYR, in that the number of attacked hosts was decreased by 30, 20 and 20%, and the progeny size by 27, 29 and 6%, respectively. The effect of spinosad on the beneficial capacity of the wasp could not be evaluated because of the high mortalities recorded in adults.
Insecticides were classified as IOBC classes: TEB and MET (1), DFB (2), PYR (2), AZA (2) and SPIN (4).
Fig. 5. Beneficial capacity of H. didymator females when were fed the insecticides continuously in the drinking water. For every factor, data followed by the same letter are not statistically different (P= 0.05; ANOVA and LSD mean separation). Attacked hosts: F=35.80; df=5,30; P= 0.002; Progeny Size: F=56.34; df=5,30; P= 0.00.
A comparison of the IOBC classes for the studied pesticides, obtained in the different bioassays, is given on Table 3.
Table 3. Influence of the mode of exposure on the IOBC classification of the studied pesticides
IOBC class Residual contact Ingestion Insecticides
Fresh 5-d-old 10-d-old Topical
application Tebufenozide 1 1 1 1 1 Methoxyfenozide 1 1 1 1 1 Diflubenzuron 1 1 1 1 2 Pyriproxyfen 1 1 1 1 2 Azadirachtin 1 1 1 1 2 Spinosad 4 2 1 4 4
0
20
40
60
80
100
C TEB MET DFB AZA PYR
Treatment
Ben
efic
ial C
apac
ity (%
)
Attacked hosts Progeny size
a
cc
aaa
bbc
aa b
119
Discussion It has been extensively documented by many researchers, that IGR pesticides are much more harmful to immature developmental stages of the enemies than to adults. Accordingly, in our study, TEB, MET, AZA, DFB and PYR were less toxic to H. didymator adults than to pupae (Schneider et al., 2003), even though the protected developmental stages are most often less sensitive to pesticides than the others.
In the literature, TEB and MET have been repeatedly reported to be safe, irrespective of the exposure method, to adults of many parasitoids, such as the ichneumonid Diadegma insulare (Cresson) (Hill & Foster, 2000) or the braconid P. concolor (Viñuela et al., 2001). In agreement with these reports, our studies have shown that both moulting accelerating compounds were harmless to adults of the ichneumonid H. didymator.
PYR and DFB were compatible with adults of H. didymator by residual contact or topical application and they only slightly decreased the beneficial capacity of parasitoid females when the insects were fed continuously the insecticides. This is also in accord with the findings of Haseeb et al. (2000) in the ichneumonid Diadegma semiclausum (Hellén). However, in contrast with our results, topical application of DFB to the predatory Chrysoperla carnea (Stephens) adults, resulted in a total inhibition of egg hatch due to the death of the embryo (Medina et al., 2002).
The botanical AZA is considered less toxic to parasitoids that to pests (Stark et al., 1992; Sipcam Inagra, 1996), but adults of some sensitive species such as P. concolor were affected when they were fed the insecticide (Viñuela et al., 2000) or were exposed to fresh residues (Viñuela et al., 2001). The present study also demonstrated that even though the reproduction of H. didymator could be slightly impared when adults were exposed to fresh and 5-d-old residues, fed continuously the insecticide or topically treated, the insecticide was compatible with the enemy (Table 3).
As it could be expected, because SPIN has a neurotoxic mode of action (Salgado, 1998) and affects parasitoids more than predators (Milles & Dutton, 2000; Willians et al., 2003), which often show sub-lethal effects following exposure including loss of reproductive capacity and reduced longevity (Willians, et al., 2003), this insecticide was the most toxic to H. didymator adults (IOBC class 4 in the different bioassays). This neurotoxic compound was very fast acting in our ichneumonid parasitoid, as it was also observed in D. insulare (Hill & Foster, 2000), but its harmfulness also decreased quickly with the age of the residues, being compatible with adults of the parasitoid, five and ten days after the application (IOBC classes 2 and 1, respectively). Contrary to our results, the encyrtid Leptomastix dactylopii Howard was severely affected in the laboratory by this insecticide even 25 days after application (Bernardo & Viggiani, 2000). One factor that might have account for the different results, is the shorter day-light photoperiod used by these researchers (12 instead of the 16 h used in our bioassays) because the major route of SPIN degradation in the environment, is photolysis (DowElanco, 1994).
As demonstrated by the IOBC working group Pesticides and beneficial organisms in its joint pesticide testing programs (see for example the two last: Hassan et al., 1994; Sterk et al., 1999), for a particular beneficial, pesticides found harmless in laboratory are likely to be of low risk in the field. Moreover, residual contact is the commonest way of contamination of natural enemies in the field (Croft, 1990). So based on these two facts and on our results with TEB, MET, DFB, AZA and PYR (Table 3), we can hypothesize that all these pesticides will be compatible with adults of H. didymator in the field. For SPIN, however, we recommend further testing under more realistic conditions, to totally ascertain their toxic effects in adults of this parasitoid.

120
Acknowledgements This work was supported by the Spanish Ministry of Education and Culture (projects AGF 98-0715 and AGF 99-1135) to E. Viñuela. M. Schneider acknowledges CONICET (Argentine) for a doctoral fellowship. References Banken, J.A.O. & Stark, J. 1997: Stage and age influence on the susceptibility of Coccinella
septempunctata after direct exposure to Neemex, a neem insecticide. – Journal of Economic Entomology 90: 1102-1105.
Bar, D., Gerling, D. & Rossler, Y. 1979: Bionomics of the principal natural enemies attacking Heliothis armigera in cotton fields in Israel. – Environmental Entomology 8: 468–474.
Bahena, F., Budia, F., Adán, A., Del Estal, P. & Viñuela, E. 1999: Scanning electron microscopy of Hyposoter didymator in host Mythimna umbrigera larvae. – Annals of the Entomological Society of America 92: 144-152.
Bernardo, U. & Viggiani, G. 2000: Effects of spinosad, a new insect control agent naturally derived, on the mealybug parasitoid Leptomastix dactylopii Howard (Hymenoptera: Encyrtidae). – IOBC/wprs Bulletin 23(9): 81-84.
Boller, E.F., Avilla, J., Gendrier, J.P., Jörg, E. & Malavolta, C. (eds)1998: Integrated production in Europe: 20 years after the declaration of Ovrannaz. – IOBC/wprs Bulletin 21(1): 41 pp.
Chandler, L.D., Pair, S.D. & Harrison, W.E. 1992: RH-5992, a new insect growth regulator active against corn earworm and fall armyworm (Lepidoptera: Noctuidae). – Journal of Economic Entomology 85: 1099-1103.
Croft, B.A. 1990: Arthropod biological control agents and pesticides. – John Wiley , New York.
Darvas, B. & Polgar, L. A. 1998: Novel type insecticides: specificity and effects on non-target organisms. – In: Insecticides with novel modes of action. Ishaaya, I. & Degheele, D. (eds), Springer, Berlin: 188-259
Dent, D. 1995: Integrated pest management. – Chapman & Hall. London. DowElanco. 1994: Spinosad technical guide. 24 pp. Figueiredo, E. & Mexía, A. 2000: Parasitoid complex associated with Lepidoptera on
horticultural protected crops in the west region of Portugal. – IOBC/wprs Bulletin 23(1): 205-208.
Hassan, S.A. 1994: Activities of the IOBC/WPRS working group “Pesticides and Beneficial Organisms”. – IOBC/wprs Bulletin 17(10): 1-5.
Hassan, S.A.; Bigler, F.; Bogenschütz, H. et al. 1994: Results of the sixth pesticide testing programme by the IOBC/WPRS working group pesticides and beneficial organisms. – Entomophaga. 39: 107-119.
Haseeb, M., Amano, H. & Nemoto, H. 2000: Pesticidal effects on mortality and parasitism rates of Diadegma semiclausum, a parasitoid of the diamondback moth. – BioControl 45: 165-178.
Hill, T.A. & Foster, R.E. 2000: Effect of insecticides on the diamondback moth (Lep., Plutellidae) and its parasitoid Diadegma insulare (Hy., Ichneumonidae). – Journal of Economic Entomology 93: 763-768.
Ishaaya, I. & Horowitz, A.R. 1995: Pyriproxyfen, a novel insect growth regulator for controlling whiteflies: mechanism and resistance management. – Pesticide Science 43: 227-232.

121
Ishaaya, I. & Horowitz, A.R. 1999: Insecticides with novel modes of action: an overview. – In: Insecticides with novel modes of action. Ishaaya, I. & Degheele, D. (eds), Springer, Berlin: 1-24.
Jacas, J. & Viñuela, E. 1994a: Side-effects of pesticides on Opius concolor, a parasitoid of the olive fruit fly. – OILB/wprs Bulletin 17(10): 143-146.
Jacas, J. & Viñuela, E. 1994b: Analysis of a method to test the effects of pesticides on adult females of Opius concolor Szèpl. (Hym., Braconidae), a parasitoid of the olive fruit fly, Bractocera oleae (Gmelin) (Dip., Tephritidae). – Biocontrol Science and Technology 4: 147-174.
Koehler, P.G. & R.S. Patterson 1991: Incorporation of pyriproxyfen in a German cockroach (Dictyoptera: Blattellidae) management program. – Journal of Economic Entomology 84: 917-921.
Medina, P., Smagghe, G., Budia, F., Del Estal, P., Tirry, L. & Viñuela, E. 2002: Significance of penetration, excretion and transovarial uptake to toxicity of three insect growth regulators in predatory lacewings adults. – Archives of Insect Biochemistry and Physiology 51: 91-101.
Milles, M. & Dutton, R. 2000: Spinosad a naturally derived insect control agent with potential for use in glasshouse integrated pest management systems. – Mededelingen Faculteit Landbouwkundige en Toegepaste Biologische Wetenschappen, Universiteit Gent 65/2a: 393-400.
Milliken, G.A. & Johnson, D.E. 1984: Analysis of messy data. Vol. I: Designed experiments. – Van Nostrand Reinhold, New York.
Palli, S.R. & Retnakaran, A. 2001: Ecdysteroid and juvenile hormone recepterors: properties and importance in developing novel insecticides. – In: Biochemical sites of insecticide action and resistance. Ishaaya, I. (ed), Springer-Verlag, Heidelberg: 107-132
Salgado, V.L. 1998: Studies on the mode of action of spinosad: insect symptoms and physio-logical correlates. – Pesticide Biochemistry and Physiology 60: 91-102.
Schoonover, J.R. & Larson, L.L. 1995: Laboratory activity of spinosad on non-target beneficial arthropods. – Arthropod management tests 20: 357.
Schmutterer, H. (ed.) 1995: The Neem tree. Source of unique natural products for integrated pest management, medicine industry and other purposes. –VCH, Weinheim, Germany.
Schneider, M.I., Budia, F., Gobbi, A., de Remes Lenicov, A.M. & Viñuela, E. 2000: Topic toxicity of tebufenozide, spinosad and azadirachtin on pupae of the parasitoid Hyposoter didymator. – Boletín de Sanidad Vegetal Plagas 26:1-9 (In Spanish).
Schneider, M.I., Smagghe, G., Gobbi, A. & Viñuela, E. 2003: Toxicity and pharmacokinetics of insect growth regulators and other novel insecticides on pupae of Hyposoter didymator (Thunberg 1822) (Hym., Ichneumonidae), a parasitoid of early larval instars of noctuid pests. – Journal of Economic Entomology 96(2) (in press)
Schneider, M.I. & Viñuela, E. 1999: Evaluation of tebufenozide on inmature stages of Hyposoter didymator, a parasitoid of noctuid larvae. – Mededelingen Faculteit Landbouwkundige en Toegepaste Biologische Wetenschappen, Universiteit Gent 64/3a: 287-295.
Sipcam Inagra, 1996: Align®. Technical information. Smagghe, G. & Degheele, D. 1998: Ecdysone agonists: mechanism and biological activity. –
In: Insecticides with novel modes of action. Ishaaya, I. & Degheele, D. (eds), Springer, Berlin: 24-38.
Stark, J., Wong, T.T.Y., Vargas, R.I. & Thalman, R.K. 1992: Survival, longevity and reproduction of tephritid fruit fly parasitoids (Hym. Braconidae) reared from fruit flies exposed to azadirachtin. – Journal of Economic Entomology 85: 1125-1129.

122
Sterk, G., Hassan, S.A., Baillod, M. et al. 1999: Results of the seventh joint pesticide testing programme carried out by the IOBC/WPRS working group pesticides and beneficials. – BioControl 44: 99-117.
STSC 1987: Statgraphics User's Guide, Version 5.0. – Graphic software system, STSC, Rockville, MD, USA.
Torres-Vila, L.M., Rodríguez-Molina, M.C., Palo, E., Del Estal, P. & Lacasa, A. 2000: Parasitoid complex of Helicoverpa armigera Hbn. on tomatoe, in Guadiana plain (Extremadura, Spain). – Boletín de Sanidad Vegetal Plagas 26(3): 323-333. (In Spanish).
Van De Veire, M., Smagghe, G. & Degheele, D. 1996: Laboratory test method to evaluate the effect of 31 pesticides on the predatory bug Orius laevigatus (Het.: Anthocoridae). – Entomophaga 41: 235-243.
Viñuela, E., Adán, A., Smagghe, G., González, M., Medina M.P., Budia, F., Vogt, H. & Del Estal, P. 2000: Laboratory effects of ingestion of azadirachtin by two pests (Ceratitis capitata and Spodoptera exigua) and three natural enemies (Chrysoperla carnea,Opius concolor and Podisus maculiventris). – Biocontrol Science and Technology 10: 165-177.
Viñuela, E., Medina, M.P., Schneider, M.I., González, M., Budia, F., Adán, A. & Del Estal, P. 2001: Comparison of side-effects of spinosad, tebufenozide and azadirachtin on the predators Chrysoperla carnea and Podisus maculiventris and the parasitoids Opius concolor and Hyposoter didymator under laboratory conditions. – IOBC/wprs Bulletin 24(4): 25-34.
Vogt, H. 2000: Sensitivity of non-target arthropods species to plant protection products according to laboratory results of the IOBC WG Pesticides and Beneficial Organisms. – IOBC/wprs Bulletin 23(9): 3-15.
Willians, T., Valle, J. & Viñuela, E. 2003: Is the naturally-derived spinosad® compatible with insect natural enemies? – Biocontrol Science & Technology (in press).
Willrich, M. M. & Boethel, D. J. 2001: Effects of diflubenzuron on Pseudoplusia includens (Lepidoptera: Noctuidae) and its parasitoid Copidosoma floridanum (Hymenoptera: Encyrtidae). – Environmental Entomology 30(4): 794-797.

Pesticides and Beneficial Organisms IOBC/wprs Bulletin Vol. 26 (5) 2003
pp 123 - 127
123
Comparison of three extended laboratory tests with Aphidius rhopalosiphi (Hymenoptera: Braconidae) Christine Bruhnke, Gunda Winkelmann & Udo Noack Dr. U. Noack, Laboratorium für angewandte Biologie, Käthe-Paulus-Str.1, 31157 Sarstedt, email: [email protected], www.noack-lab.de Abstract: To improve evaluation of the effects of pesticides on the wasp Aphidius rhopalosiphi (DeStephani-Perez) in extended laboratory tests, three different test designs were compared regarding the contact rate of the wasps with the treated material. All test designs fulfilled the requirements of the recent recommendations of Mead-Briggs et al. (2000, 2001) for the evaluation of pesticide effects on the wasp. We emphasize that whole-plant test designs seemed to be more attractive to the wasps than single leaves. Besides this, the first two hours after insertion of the wasps appeared to be the most important regarding the detection of differences in the contact rates. Key words: extended laboratory test design, Aphidius rhopalosiphi Introduction The aim of extended laboratory tests with the parasitic wasp Aphidius rhopalosiphi (DeStephani-Perez) was to evaluate the potential adverse effects of plant protection products on the survival and the reproductive capacity of the adult parasitoid. The wasp represents a sensitive indicator as well as being a member of an important group of aphid-specific parasitoids with a wide geographic distribution.
Endpoints of the extended laboratory test were mortality and fecundity of the surviving female wasps as well as assessments of the wasps’ susceptibility for possible repellent effects. To confirm repellent effects, observations had to be made at different time intervals. A design consisting of whole barley plants was established for this kind of test (Mead-Briggs et al. 2001). The goal of our investigation was to find out a different but also suitable extended test design that ensured a high degree of contact between the wasps and the treated apple leaves. Subsequent to this we compared two different designs consisting of apple tree leaves with the already existing barley plant test design of Mead-Briggs et al. (2001). The studies were conducted independent of each other and only present practical knowledge. Specific investigations were based purely on knowledge gained from practice. Material and methods Three designs of extended laboratory tests were assessed to evaluate the effects of pesticides on the wasp Aphidius rhopalosiphi.
According to Mead-Briggs (2000), the first type consists of square acrylic glass frames. Glass plates completely covered on one side with treated apple tree leaves were fixed to the top and bottom of the frame with the treated apple leaves facing inside.
The second and third types were in accordance with the draft guideline for extended laboratory testing by Mead-Briggs (2001), the second with the difference that the barley plants were replaced by apple twigs. To exclude any repellent effects, the plant material was
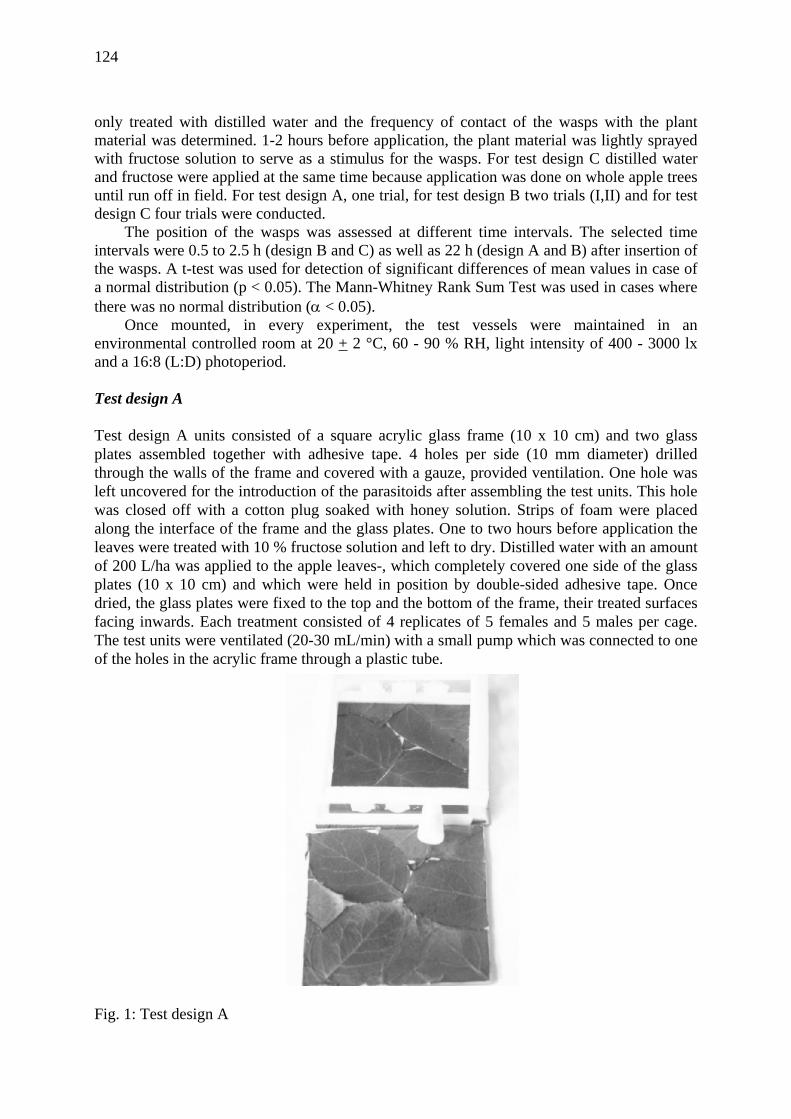
124
only treated with distilled water and the frequency of contact of the wasps with the plant material was determined. 1-2 hours before application, the plant material was lightly sprayed with fructose solution to serve as a stimulus for the wasps. For test design C distilled water and fructose were applied at the same time because application was done on whole apple trees until run off in field. For test design A, one trial, for test design B two trials (I,II) and for test design C four trials were conducted.
The position of the wasps was assessed at different time intervals. The selected time intervals were 0.5 to 2.5 h (design B and C) as well as 22 h (design A and B) after insertion of the wasps. A t-test was used for detection of significant differences of mean values in case of a normal distribution (p < 0.05). The Mann-Whitney Rank Sum Test was used in cases where there was no normal distribution (α < 0.05).
Once mounted, in every experiment, the test vessels were maintained in an environmental controlled room at 20 + 2 °C, 60 - 90 % RH, light intensity of 400 - 3000 lx and a 16:8 (L:D) photoperiod. Test design A Test design A units consisted of a square acrylic glass frame (10 x 10 cm) and two glass plates assembled together with adhesive tape. 4 holes per side (10 mm diameter) drilled through the walls of the frame and covered with a gauze, provided ventilation. One hole was left uncovered for the introduction of the parasitoids after assembling the test units. This hole was closed off with a cotton plug soaked with honey solution. Strips of foam were placed along the interface of the frame and the glass plates. One to two hours before application the leaves were treated with 10 % fructose solution and left to dry. Distilled water with an amount of 200 L/ha was applied to the apple leaves-, which completely covered one side of the glass plates (10 x 10 cm) and which were held in position by double-sided adhesive tape. Once dried, the glass plates were fixed to the top and the bottom of the frame, their treated surfaces facing inwards. Each treatment consisted of 4 replicates of 5 females and 5 males per cage. The test units were ventilated (20-30 mL/min) with a small pump which was connected to one of the holes in the acrylic frame through a plastic tube.
Fig. 1: Test design A

125
Test design B Two bioassays were conducted in accordance with test design B, varying only in the method of application. In trial I (Fig. 4), single apple twigs were fixed with foam material in a glass filled with water (50-100 mL) and treated with a 10 % fructose solution 1-2 h prior to application. The glass was placed in a bellaplast box (internal dimensions 9.5 x 9.5 x 6 cm) and filled with quartz sand. After application of 400 L/ha of distilled water, the apple twigs were enclosed in cylinders of clear acetate sheeting (9 cm in diameter, 25 cm in height), their tops closed with fine-mesh nylon netting to prevent the build-up of pesticide vapours in the test units. Once mounted, wasps were introduced. In trial II (Fig. 5) whole apple trees were treated until the point of run off with a mixture of distilled water and fructose (800 L/ha). Once dried, apple twigs were cut off and the test units were assembled as in trial I.
The height of the twigs was about 15 cm. Each experiment consisted of 6 replicates of 5 females. The test units were kept at the same temperature, humidity and photoperiodic conditions as described above, but lights were fixed at medium height of the test units to create a more homogeneous illumination inside. Test design C Seedlings of barley (10 plants, 8-15 cm in height, at the 1st/2nd leaf growth stage) were slightly sprayed with a 10 % fructose solution 1-2 h prior to application and left to dry. After application of the sugar solution, the soil in the plant pots was covered with dry quartz sand to create a uniform surface. Afterwards, distilled water (400 L/ha) was applied to the plants. Once dried, the plants were enclosed in cylinders similar to those used in design A and also kept in identical environmental conditions. Overhead illumination was used.
Fig. 2: Test design B Fig. 3: Test design C

126
Results and discussion Below, the different test designs are compared, the attractiveness of the particular plant surfaces to the wasps being taken into account.
With respect to the chronological sequence of wasps in design B-, visiting the plant surface, it was observed that, 2.5 hours after introduction significantly fewer wasps were on the plant surface compared to 0.5, 1 and 2 hours. A statistically significant difference was also noted between 0.5 and 2 hours (Fig 4). The fact that the 4 trials of design C also seemed to show a decrease in the overall number of wasps on the leaves after 2.5 h, underlines the finding of a chronological sequence of contacting the leaves (Fig. 4). There must have been a loss in attractiveness of the leaves after about 2 hours. This loss may have been caused by saturation of the wasps 2 hours after their first contact with the 10 % fructose solution.
Statistically significant differences between test design B (trial I) and C (4 trials) were found. In the first 2.5 hours after the start of the test, design B showed a higher rate of wasp contact with the plant material than test design C (Fig. 4).
We also compared observations made at a later stage of the test. Even between 22 and 24 hours after introduction of the insects, the plant material of test design A was distinctly less attractive to the wasps than the apple twigs of test design B (Fig. 5). During this time interval, no chronological sequence could be observed in the appropriate test designs.
The whole-plant test design seemed to be more suitable than a test system with single leaves in ensuring exposure of the wasps. Apart from this, the lower degree of attractiveness of the plant material in test design A was caused by the photosensitivity of the wasps, which preferred to remain on the light-transmissible acrylic frame. Comparing the two whole-plant test designs, the apple tree twigs seemed to be more attractive to the wasps than the barley plants (Fig. 4). This could be explained by the structure of the apple twigs, which offered a larger surface for the wasps than the barley seedlings.
Time after introduction of the wasps [h]0,5 1,0 1,5 2,0 2,5
Expo
sure
on
the
plan
t sur
face
[%]
0
20
40
60
80
100Test design BTest design C 1Test design C 2Test design C 3Test design C 4
* *
**
*
Fig. 4: Comparison between test designs B (trial II) and C. Exposure [%] + RSD1 of wasps on
the plant surface of apple twigs and barley. Statistically significant differences are marked with *.

127
22 22,5 23 23,5 24 24,50
20
40
60
80
100
Test design ATest design B
Time after introduction of the wasps [h]
Expo
sure
on th
e plan
t sur
face
[%]
* **
*
* *
Fig. 5: Comparison between test designs A and B (trial I). Exposure [%] + RSD1 of wasps on the plant surface of apple tree leaves. Statistically significant differences are marked with *. 1 RSD = Relative Standard Deviation
In studies with test substances, possible repellent effects should be assessed by observation of the wasps at different time intervals. Following our results, it seemed to be useful to compare the contact rates of the wasps in the first two to three hours after their insertion. During this time interval, a comparison between control wasps (corresponding to those tested as above) and treatment wasps would lead to clear results. Apart from this, we observed a higher degree of attractiveness of apple tree twigs compared to individual apple leaves and barley plants, even in the later stages of the test. Due to a relatively small number of studies, only tendencies in behavioral changes of the wasps with regard to different test designs could be demonstrated; thus further studies will have to be carried out. References Mead-Briggs, M., Brown, K., Candolfi, M.P., Coulson, M.J.M., Miles, M., Moll, M.,
Nienstedt, K., Schuld, M., Ufer, A. & McIndoe, E. 2000: A laboratory test for evaluating the effects of plant protection products on the parasitic wasp, Aphidius rhopalosiphi (DeStephani-Perez) (Hymenoptera: Braconidae). – In: Candolfi, M.P., Blümel, S., Forster, R., Bakker, F.M., Grimm, C., Hassan, S.A., Heimbach, U., Mead-Briggs, M.A., Reber, B., Schmuck, R. and Vogt, H. (eds.): Guidelines to evaluate side-effects of plant protection products to non-target arthropods. IOBC/wprs, Gent: 13-25.
Mead-Briggs, M.A., Longley, M., Grimm, C., Moll, M., Schuld, M. & Ufer, A. 08/2001: An extended laboratory test for evaluating the effects of plant protection products on the parasitic wasp, Aphidius rhopalosiphi (DeStephani-Perez) (Hymenoptera: Braconidae). – Draft guideline of the ring-test group: 11 pp.