working paper 140 - development aid and access to water ... · pdf fileand sanitation in...
TRANSCRIPT

No
140 – November 2011
Development Aid and Access to Water and Sanitation in sub-Saharan Africa
Adeleke Salami, Marco Stampini
Abdul Kamara, Caroline Sullivan and Regassa Namara

Editorial Committee
Correct citation: Salami, Adeleke; Stampini, Marco; Kamara, Abdul; Sullivan, Caroline; Namara Regassa (2011), Development Aid and Access to Water and Sanitation in sub-Saharan Africa, Working Paper Series N° 140, African Development Bank, Tunis, Tunisia.
Vencatachellum, Désiré (Chair) Anyanwu, John C. Verdier-Chouchane, Audrey Ngaruko, Floribert Faye, Issa Shimeles, Abebe Salami, Adeleke
Coordinator
Working Papers are available online at
http:/www.afdb.org/
Copyright © 2011
African Development Bank
Angle des l’avenue du Ghana et des rues
Pierre de Coubertin et Hédi Nouira
BP 323 -1002 TUNIS Belvédère (Tunisia)
Tel: +216 71 333 511
Fax: +216 71 351 933
E-mail: [email protected]
Salami, Adeleke
Rights and Permissions
All rights reserved.
The text and data in this publication may be
reproduced as long as the source is cited.
Reproduction for commercial purposes is
forbidden.
The Working Paper Series (WPS) is produced
by the Development Research Department
of the African Development Bank. The WPS
disseminates the findings of work in progress,
preliminary research results, and development
experience and lessons, to encourage the
exchange of ideas and innovative thinking
among researchers, development
practitioners, policy makers, and donors. The
findings, interpretations, and conclusions
expressed in the Bank’s WPS are entirely
those of the author(s) and do not necessarily
represent the view of the African Development
Bank, its Board of Directors, or the countries
they represent.

Development Aid and Access to Water and Sanitation in sub-Saharan Africa
Adeleke Salami, Marco Stampini
Abdul Kamara, Caroline Sullivan
Regassa Namara 1
1 Adeleke Salami, (Research Economist, AfDB); Marco Stampini (Principal Research Economist, AfDB); Abdul B.
Kamara (Resident Representative, Sudan Field Office, AfDB); Carolline Sullivan (Associate Professsor of Environmental
Economics and Policy, Southern Cross University, NSW Australia and Director of Research, School of Environmental
Science and Management; and Regassa Namara (Senior Economist at the International Water Management Institute). This
Working Paper was produced out of the study on the Development Aid and Access to Water and Sanitation in Sub-Saharan
Africa. The study was financed from the African Development Bank’s Multi-Donor Water Partnership Program (MDWPP)
which is supported by the Governments of Netherlands, Canada, Denmark and the AfDB. The authors are grateful to Leonce
Ndikumana, Desire Vencatachellum, Sering Jallow, Abebe Shimeles, John Anyanwu, Arthur M. Swatson, Thomas Roberts,
Amhayesus Metaferia, Ejikeme Okonkwo and Aymen Dhib. They are also grateful to the reviewers of the papers and
participants in various African Development Bank seminars for their useful comments.
AFRICAN DEVELOPMENT BANK GROUP
Working Paper No. 140
November 2011
Office of the Chief Economist

Abstract
Providing safe drinking water and basic sanitation to citizens is one of the major challenges facing the African Governments. The issues of access to safe drinking water and improved sanitation is well articulated and prioritized in the various national, continental, and international policy documents, strategy papers, declarations, and conventions. And yet it is not clear if the provision of sustainable access to safe drinking water and basic sanitation has been given the requisite financial and other support by the SSA policy makers and donors. The principal objective of this paper is to compare countries’ performance in the water and sanitation sector and analyze how effectively they used the development aid received for the Water and Sanitation sector (WSS). Much has been written on Development Aid Effectiveness, but the focus of attention has often been on how the donors operate, and how the recipients use the money. In this context, the paper utilised an innovative standardized measurement
framework known as-the Watsan Index of Development Effectiveness (WIDE) - which compares drivers of progress with results achieved, and ranks African countries by the level of outcome obtained per unit of available input. In particular, how effectively they used the development aid received for the water and sanitation sector. The WIDE is made up of two composite information layers, the Resources (input drivers such as aid received, GDP, water resources, and governance level), and the Progress Outcomes (access to water, access to sanitation, and progress in the two). We also performed econometric analyses to explore the linkages between interventions designed to promote development, and the outcomes from that development process, in the water and sanitation sector. These analyses were further validated by presentation of the WSS sector situation of four case study countries namely, Kenya, Madagascar, Burkina Faso and Uganda.
Keywords: Water, Sanitation, Development Aid, Development Effectiveness JEL codes: C18;,F35, O18, Q25

5
1. INTRODUCTION
Providing safe drinking water and basic sanitation to citizens is one of the major challenges
facing the African Governments. The issues of access to safe drinking water and improved
sanitation is well articulated and prioritized in the various national, continental, and international
policy documents, strategy papers, declarations, and conventions. And yet it is not clear if the
provision of sustainable access to safe drinking water and basic sanitation has been given the
requisite financial and other support by the SSA policy makers and donors. An even more
important issue is understanding how the African governments have utilized the limited available
ODA allocated to Water Supply and Sanitation (WSS) sector to guarantee the highest possible
performance and deliverance of WSS services to the citizens.
In the face of heterogeneous performance of different SSA countries, it becomes fundamental to
understand the factors that determined success or failure in increasing access to water and
sanitation, in order to improve the targeting of future interventions, including those funded by
development aid, and avoid the repetition of past errors. The objectives of this paper are to
identify the factors determining countries’ performance in providing access to safe water and
improved sanitation; compare countries’ performance in the water and sanitation sector and
analyze how effectively they used the development aid received for the water and sanitation
sector. In this context, we develop a standardized measurement framework-the Watsan Index of
Development Effectiveness (WIDE), which compares drivers of progress in water access and
sanitation with results achieved, and ranks countries by the level of outcome obtained per unit of
available input.
Thus, the further contents of the paper are as follows. Section 2 presents the analysis of the
relationship between development aid dedicated to policies and projects in the field of water and
sanitation in SSA countries, with progress made in improving access using a standardized
measurement methodology known as the Watsan Index of Development Effectiveness and other
relevant indicators. Section 3 highlights the results of four country case studies (Burkina Faso,
Kenya, Madagascar and Uganda), and reveal more detailed insights, beyond the general trends
analysed in Section 2. The fourth section presents expert and beneficiaries views on key success
factors or failures of WSS sector and specific projects. Finally, section 5 synthesizes the insights
obtained and spells out specific recommendations for enhancing the performance of WSS sector
and development aid effectiveness.
2. DEVELOPMENT AID AND ACCESS TO WATER SUPPLY AND SANITATION
IN SUB SAHARAN AFRICA: AN OVERVIEW OF TRENDS
This section presents the trends in development aid to SSA, focusing in particular on the water
and sanitation sector, reviews progress in access to water supply and sanitation, and analyzes the
relationship between resources, including aid, and results, by applying the innovative WIDE
index methodology.

6
2.1 Official Development Assistance to sub-Saharan Africa
In total, from 1990 to 2006, Official Development Assistance (ODA) 2 accounted for 84.4% of
aid to this region and is vitally important to the development of many of the countries of SSA.
The most important bilateral ODA flows to SSA over the period of our analysis originate from
the 22 countries of the Development Assistance Committee (DAC) of the Organization for
Economic Cooperation and Development (OECD)3. In SSA, between 1990 and 2006, private
flows contributed 15.6% of total aid, and OOFs were virtually zero. We therefore focus in our
analysis on ODA from DAC countries and from the main multilateral organizations4, as reported
by OECD Stat. We use data on gross ODA from OECD’s Creditor Reporting System (CRS),
which contains information on commitments from 1995 and disbursement from 2002.
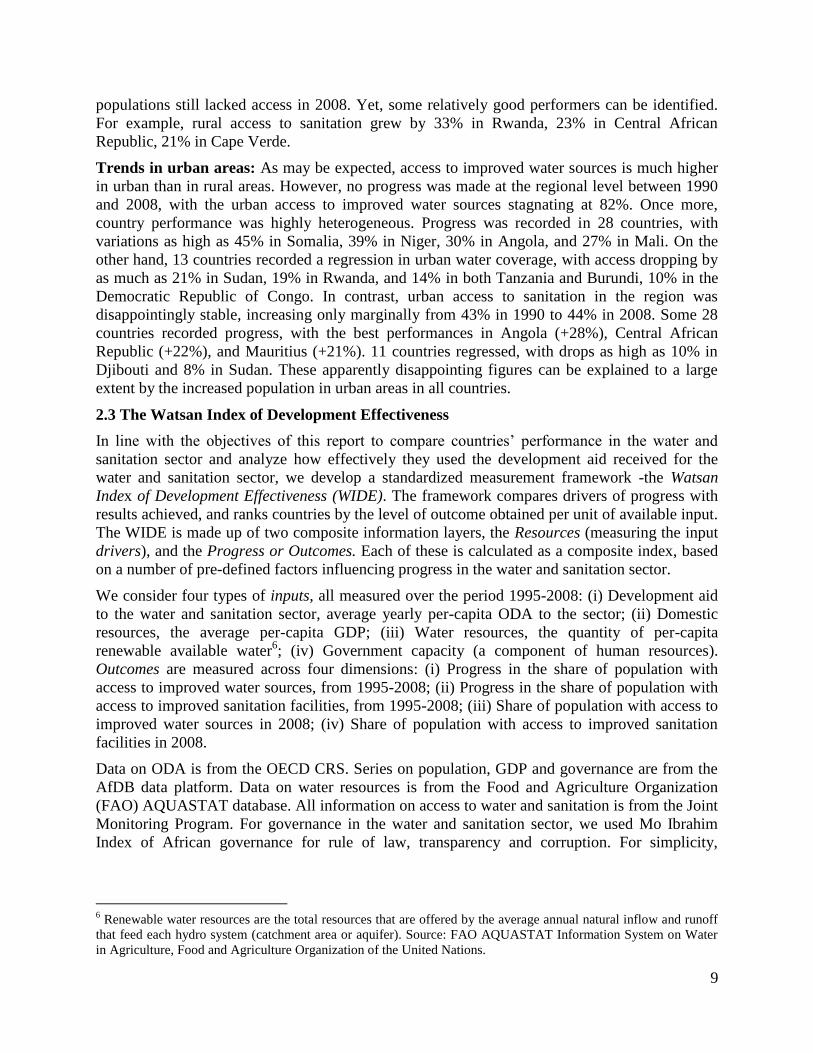
Official Development Assistance to the Water and Sanitation Sector: In spite of its
importance, the share of development aid allocated to water and sanitation has been low.
Between 2001 and 2006, the region received 24% of global aid to the water and sanitation sector.
When the figures are deflated by population, the trend is however less impressive. Per-capita
ODA to the sector grew from USD07 1.28 a year in 1995 to USD07 1.75 in 20085. Furthermore,
in spite of increasing international support, aid provided for WSS projects as a percentage of
overall ODA only reached 4.1% in 2008, rising from just 2.8% of total ODA in 2002 (Figure 1).
Overall this indicates that while the level of aid available to the water and sanitation sector has
been increasing in real terms, it is still the case that the allocation to that sector is just a small
fraction of the total, which may not be sufficient to meet the targets of the MDGs.
The inter-sectoral breakdown presented in Figure 2 provides interesting information on the
allocation of ODA to water and sanitation. This is categorized in the following seven sub-groups:
Water resources policy and administrative management; Water resources protection; Water
supply and sanitation - large systems; Basic drinking water supply and basic sanitation; River
development; Waste management/disposal; and Education and training in water supply and
sanitation. Over the period 2002-2008, large water supply and sanitation systems received the
largest share of ODA (39%), followed by basic systems (31%) and by water resources policy and
administrative management (25%). An analysis of the trends points to widening differentials,
with the flow for basic drinking water and sanitation growing by 235% between 2002 and 2008,
and the flows for education and training increasing by only 19% over the same period.
2 For a definition of ODA, see OECD 2008, “Is it ODA?” (http://www.oecd.org/dataoecd/21/21/34086975.pdf). In
the rest of this report, the terms ODA and aid are used as synonyms. 3 Australia, Austria, Belgium, Canada, Denmark, Finland, France, Germany, Greece, Ireland, Italy, Japan,
Luxembourg, Netherlands, New Zealand, Norway, Portugal, Spain, Sweden, Switzerland, United Kingdom, United
States, European Community. 4 World Bank Group, African Development Bank Group, East African Development Bank (EADB), West African
Development Bank (BOAD), European Commission (EC), European Investment Bank (EIB), International Fund for
Agricultural Development (IFAD), Islamic Development Bank (IDB), Nordic Development Fund (NDF), The
Nordic Investment Bank (NIB), OPEC Fund for International Development (OPEC Fund). 5 Constant 2007 USD.

7
Figure 1: Gross Official Development Assistance
to water and sanitation in SSA
Figure 2: SSA Gross ODA disbursements to WSS
sector over the period 2002-2008, by project
typology
Source: Authors’ calculations based on OECD’s Creditor Reporting System and AfDB Data Platform
Using calculations based on OECD CRS (March 2010), the highest amounts of ODA to WSS
went to Senegal, Ghana, Burkina Faso, Uganda, Tanzania, Mozambique, and Zimbabwe, all
above USD07 500 million over the period 1995-2008. When accounting for population size, the
island states emerge as the main recipients. The highest amounts are recorded in Sao Tome and
Principe, Mauritius, and Seychelles, followed by Gabon, Equatorial Guinea, Senegal, and Cape
Verde, all above USD07 100 per capita over the period 1995-2008 (Annex 1). This is likely to be
due to scale effects, and to the relatively high cost of projects in countries with small
populations. In relative terms, fourteen countries showed greater focus than average on water and
sanitation issues, dedicating more than 5% of total ODA to the sector (Annex 1). These are
Benin (6%), Burkina Faso (9.5%), Botswana (5.7%), Gabon (11.2%), Guinea (8.9%), Equatorial
Guinea (15.2%), Lesotho (6.7%), Mauritius (34.4%), Namibia (5.3%), Niger (6.0%), Senegal
(8.8%), Sao Tome and Principe (6.8%), Swaziland (9.4%), and Seychelles (13.6%).
The contribution of the AfDB to WSS provision: From 1967-2006, the African Development
Bank group (AfDB) has committed more than USD 4 billion (undiscounted nominal value) ODA
to WSS in Africa, about 7.7% of total approvals. More recently, over the period 2005-2008, the
AfDB disbursed USD 495 million for water and sanitation projects in SSA (in constant 2007
USD), equivalent to about 9% of total ODA disbursements to the sector in the region (OECD
CRS). In 2008, the sector accounted for 10.8% of total African Development Fund (AfDF)
disbursements, up from 5.4% in 2005.The Bank has supported the implementation of the Rural
Water Supply and Sanitation Initiative (RWSSI), and ensures funding for projects and studies in
the water sector. The AfDB also serves as a trustee for the African Water Facility (AWF) Special
Fund, provides support to the NEPAD Water and Sanitation Program. The Bank also manages
-
0.01
0.02
0.03
0.04
0.05
0.06
-
0.2
0.4
0.6
0.8
1.0
1.2
1.4
1.6
1.8
2.01
995
199
6
199
7
199
8
199
9
200
0
200
1
200
2
200
3
200
4
200
5
200
6
200
7
200
8
Sh
are o
f OD
A to
the w
ate
r a
nd
san
itatio
n se
cto
r (d
otte
d lin
e)
Per
-ca
pit
a O
DA
to
th
e w
ate
r a
nd
san
itati
on s
ecto
r,
in U
SD
20
07
(s
oli
d l
ine)
Year
0%
100%
200%
300%
400%
500%
600%
700%
800%
0%
5%
10%
15%
20%
25%
30%
35%
40%
45%
Wate
r reso
urc
es polic
y a
nd
ad
min
istrativ
e m
an
agem
en
t
Wate
r reso
urc
es pro
tectio
n
Wate
r sup
ply
an
d sa
nita
tion
-
larg
e system
s
Ba
sic d
rink
ing w
ate
r sup
ply
an
d
basic
san
itatio
n
Riv
er d
evelo
pm
en
t
Waste
man
agem
en
t/disp
osa
l
Ed
uca
tion
an
d tra
inin
g in
wa
ter
sup
ply
an
d sa
nita
tion
Gro
wth
(wh
ite bars)
Sh
are
of
OD
A t
o W
SS
(d
ark
bars
)

8
the Multi-Donor Water Partnership Program (MDWPP) to promote effective water management policies and practices, at regional and country levels and to operationalize the Bank’s Integrated
Water Resources Management (IWRM) Policy in the RMCs.
2.2 Access to water and sanitation
Progress towards target 7C of the MDGs of halving by 2015 the proportion of people without
sustainable access to safe drinking water and improved sanitation facilities remains slow. The
rate of access to improved water sources increased from 49% in 1990 to 60% in 2008, a marginal
increase of less than 1% a year. Over the same period, growth in access to improved sanitation
facilities was even more disappointing, from 27% to 31% (source: JMP). This implies that, in
2008, 328 million people in the region still lived without access to drinking water, 84% of which
in rural areas; and 567 million individuals still lacked access to improved sanitation. These
numbers are significant and a serious cause for concern. In a sub-sample of 21 SSA countries,
only 16% of the poorest quintile of the population was found to have access to improved
sanitation, compared with nearly 80% of the population in the richest quintile. To make matters
worse, the divide between progress in water and sanitation is set to widen (UN MDG Report,
2008 and UNDP 2005).
Although progress is slow on a regional basis, performance is heterogeneous across countries
and it is possible to identify the good performers (Annex 1). The largest improvements were
recorded by Malawi (from 40% in 1990 to 80% in 2008), Burkina Faso (from 41 to 76%),
Namibia (from 64 to 92%), Ghana (from 54 to 82%), Mali (from 29 to 57%), Cameroon (from
50 to 74%), Lesotho (from 61 to 85%), Uganda (from 43 to 67%), and Ethiopia (from 17 to
38%). On the other hand, access regressed in 5 SSA countries. The magnitude of the drop ranges
from 1% in Mauritius and Tanzania to a 8% in Sudan and Sierra Leone, which experienced
conflicts over the period covered by the analysis. In terms of access levels, the best performers
are Botswana, Comoros, Djibouti, Gambia, Mauritius, Namibia, and South Africa, all with rates
above 90% in 2008.
Improvement in sanitation coverage throughout SSA is disappointingly small. The largest
increases were recorded in Angola (from 25% in 1990 to 57% in 2008), Rwanda (from 23 to
54%), Botswana (from 36 to 60%) and Central African Republic (from 11 to 34%). Over the
same period, however, 5 countries showed deterioration rather than an improvement in terms of
access to sanitation, with the drop ranging from 1% for Togo to 10% for Djibouti. In 2008,
access to improved sanitation remains extremely low. Only four countries (Botswana, Gambia,
Mauritius and South Africa) record rates of 60% or higher. In ten countries (Benin, Burkina
Faso, Eritrea, Ethiopia, Ghana, Madagascar, Niger, Sierra Leone, Chad and Togo) access
remains below 15%. Countries performances in the water and sanitation sectors were not
necessarily correlated. For example, Burkina Faso and Ghana achieved remarkable progress in
access to water while at the same time recording minor improvements in access to sanitation.
Trends in rural areas: Since 1990, 36 SSA countries have recorded a positive trend in access to
improved water sources in rural areas. The region as a whole shows an increase of 11%, with
performance varying greatly across countries. Growth in rural access rates to improved water
sources ranged from 1% for the Democratic Republic of Congo to 44% for Malawi. On the other
hand, 8 countries experienced a regression, with drops ranging from 23% in Sierra Leone and
1% in Tanzania. Rural areas face the most serious problems in sanitation coverage. Rural access
in the region increased only by 3% between 1990 and 2008, and over three quarters of SSA rural
9
populations still lacked access in 2008. Yet, some relatively good performers can be identified.
For example, rural access to sanitation grew by 33% in Rwanda, 23% in Central African
Republic, 21% in Cape Verde.
Trends in urban areas: As may be expected, access to improved water sources is much higher
in urban than in rural areas. However, no progress was made at the regional level between 1990
and 2008, with the urban access to improved water sources stagnating at 82%. Once more,
country performance was highly heterogeneous. Progress was recorded in 28 countries, with
variations as high as 45% in Somalia, 39% in Niger, 30% in Angola, and 27% in Mali. On the
other hand, 13 countries recorded a regression in urban water coverage, with access dropping by
as much as 21% in Sudan, 19% in Rwanda, and 14% in both Tanzania and Burundi, 10% in the
Democratic Republic of Congo. In contrast, urban access to sanitation in the region was
disappointingly stable, increasing only marginally from 43% in 1990 to 44% in 2008. Some 28
countries recorded progress, with the best performances in Angola (+28%), Central African
Republic (+22%), and Mauritius (+21%). 11 countries regressed, with drops as high as 10% in
Djibouti and 8% in Sudan. These apparently disappointing figures can be explained to a large
extent by the increased population in urban areas in all countries.
2.3 The Watsan Index of Development Effectiveness
In line with the objectives of this report to compare countries’ performance in the water and
sanitation sector and analyze how effectively they used the development aid received for the
water and sanitation sector, we develop a standardized measurement framework -the Watsan
Index of Development Effectiveness (WIDE). The framework compares drivers of progress with
results achieved, and ranks countries by the level of outcome obtained per unit of available input.
The WIDE is made up of two composite information layers, the Resources (measuring the input
drivers), and the Progress or Outcomes. Each of these is calculated as a composite index, based
on a number of pre-defined factors influencing progress in the water and sanitation sector.
We consider four types of inputs, all measured over the period 1995-2008: (i) Development aid
to the water and sanitation sector, average yearly per-capita ODA to the sector; (ii) Domestic
resources, the average per-capita GDP; (iii) Water resources, the quantity of per-capita
renewable available water6; (iv) Government capacity (a component of human resources).
Outcomes are measured across four dimensions: (i) Progress in the share of population with
access to improved water sources, from 1995-2008; (ii) Progress in the share of population with
access to improved sanitation facilities, from 1995-2008; (iii) Share of population with access to
improved water sources in 2008; (iv) Share of population with access to improved sanitation
facilities in 2008.
Data on ODA is from the OECD CRS. Series on population, GDP and governance are from the
AfDB data platform. Data on water resources is from the Food and Agriculture Organization
(FAO) AQUASTAT database. All information on access to water and sanitation is from the Joint
Monitoring Program. For governance in the water and sanitation sector, we used Mo Ibrahim
Index of African governance for rule of law, transparency and corruption. For simplicity,
6 Renewable water resources are the total resources that are offered by the average annual natural inflow and runoff
that feed each hydro system (catchment area or aquifer). Source: FAO AQUASTAT Information System on Water
in Agriculture, Food and Agriculture Organization of the United Nations.

10
resources and outcomes are aggregated by using an un-weighted average7. This overcomes a
value judgment that would be made by policy makers.
There are a number of assumptions underlying the assessment process presented here:
A country with a high level of either domestic resources or aid receipts should perform
better;
Natural factors affect the effectiveness of aid flowing to the water and sanitation sector;
Human capacity and good governance are a prerequisite for good water management;
A country which has adequate water resources and receives development aid should be
able to exhibit measureable progress in water and sanitation provision, and this progress
is facilitated by effective institutional arrangements.
2.3.1 Structure of the WIDE
Before the estimations, the data is first normalized and converted to an index value that ranges between 1
and 100, with high values indicating positive conditions. This is to ensure that the index is not dominated
by a single variable having large absolute values. The transformation of both input or drivers and outcome
or progress is based on the following expression:
minmax
min
xx
xxx i
i
(1)
Where xmin and xmax are the minimum and the maximum value observed in the sample, and i is
the subscript for each SSA country. The normalized variables are then combined in simple un-
weighted averages. Two indexes are then calculated, for inputs and outcomes, according to the
following formulas:
4
iiiii
nancergoverestwapdgdiaInputs
(2)
4
iiiii
swswOutcomes
(3)
Where swswnancergoverestwapdgdia ,,,,,,, are the input drivers and the outcome
indicators described in the previous section (in the same order), transformed as in expression (1).
The two sub-indexes can be used to rank countries by intensity of inputs and results. These are
then combined to obtain the overall index of performance:
iOutcomesrankiInputsrankiWIDE (4)
A value of 0 indicates that the country has the same ranking for inputs and outcomes, e.g. the
country with most resources achieved the best results. Positive values indicate that a country had
an outcome ranking in excess of what could be expected given its resources. Large negative
values, on the other hand, suggest poor performance. The WIDE enables an assessment to be
7In most cases of index development, additive formulae are used. It is however also possible to develop indices with
multiplicative structure, but this is beyond the scope of this work. For more discussion of the use of Multiplicative
indices for the HDI, see Herrero et al. (2007).

11
made of how effectively each country has used its resources to achieve progress in the water and
sanitation sector.
2.3.2 Empirical Evidence
Gabon and Mauritius are the most endowed countries. Both received more than USD 10 per
capita per year of ODA to the water and sanitation sector, and had a per capita GDP in excess of
USD 5,000 over the period covered in the analysis. Gabon has also the highest endowment of
water resources, with about 131,216 m3 of renewable water per capita per year, which is about
58 times that of Mauritius. On the other hand, Mauritius exhibits the highest performance for the
rule of law and absence of corruption in the region. At the other end of the spectrum, Zimbabwe
and the DRC have the lowest resource endowment, with extremely low values of per-capita aid
to the water and sanitation sector and of the index of rule of law.
The best outcomes are reported for Malawi, Gambia, Botswana, and South Africa. Malawi made
impressive progress in water provision (+28%). Access to sanitation, although still at 56%, also
grew by 9 percentage points. Gambia, Botswana and South Africa report slower progress. Next
to the best performers are Angola, Mauritius, Namibia, Comoros, Cape Verde and Swaziland, all
with scores of above 50 points. At the other end of the distribution, Sierra Leone and Madagascar
recorded the worst results, both displaying slow progress and low access rates.
2.3.3 Country Performance: the WIDE Index
The WIDE index is presented in Annex 2, which ranks the countries according to the difference
between output and input ranking8. Values range between +25 to -35. The six best performers,
all with WI values of 20 or above include Angola (25), Rwanda (23), Zimbabwe (23), Central
African Republic (23), Malawi and Comoros (both with 20). Angola’s performance is
commendable. In spite of ranking 30th
in resource availability, it achieved the 5th
highest
outcomes. This suggests that the scarce inputs were used relatively more effectively than in other
SSA countries.
2.3.4 Caveats to the use of the WIDE
Some variables may have close to uniform distributions that increase the relative weight
(compared to more skewed ones) in the input or outcome sub-index9. We looked into the
possibility of transforming some variables (e.g. by taking their logarithm) to reduce distribution
skewness. We found that this changed the ranking of some countries by a few positions, but did
not alter the overall picture. As a way of overcoming any implicit weighting of component
values influencing overall scores, we recommend that comparisons of inputs and outcomes be
made on the basis of the ranking in the group, rather than on the raw score. The structure of the
WIDE was chosen accordingly (as a difference of rankings, rather than e.g. as a ratio between
outcome and input indexes).
Finally, it is important to notice that the structure of the outcome drivers partly penalizes
countries that had already achieved high percentages of access to water and sanitation in the
baseline year. For example, a country that had reached universal access in 1995, and maintained
8 All rankings refer to the subsample of 45 SSA countries for which all data on input and outcomes is available (all
but Djibouti, Seychelles and Somalia). 9 For a discussion on the issue of scale relating to the use of indices in water management, see Sullivan and Meigh,
2007
12
it in 2008, will have two positive outcome drivers (for end of the period access to water and
sanitation). Another country that had no access in 1995, and recorded progress to reach universal
access in 2008 will have four positive outcome drivers (two for progress, two for access at the
end of the period). The latter will record a higher outcome score.
3. COUNTRY CASE STUDIES10
3.1 Introduction
This Section presents information from four case study countries, namely Madagascar and
Burkina Faso representing Francophone countries, and Uganda and Kenya representing
Anglophone countries. We use the collated data about the case studies to illustrate the
application of the WIDE analytical framework.
3.2 The Madagascar
3.2.1 Outcomes: Status of Access to Water and Sanitation
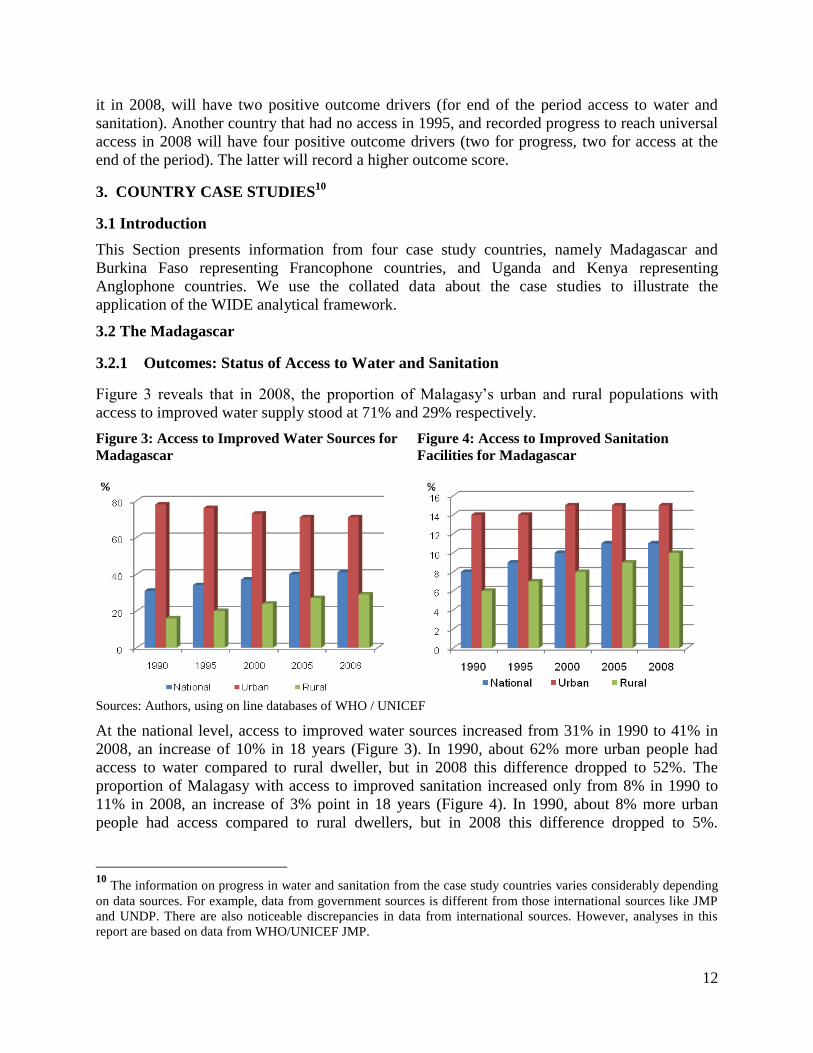
Figure 3 reveals that in 2008, the proportion of Malagasy’s urban and rural populations with
access to improved water supply stood at 71% and 29% respectively.
Figure 3: Access to Improved Water Sources for
Madagascar
Figure 4: Access to Improved Sanitation
Facilities for Madagascar
Sources: Authors, using on line databases of WHO / UNICEF
At the national level, access to improved water sources increased from 31% in 1990 to 41% in
2008, an increase of 10% in 18 years (Figure 3). In 1990, about 62% more urban people had
access to water compared to rural dweller, but in 2008 this difference dropped to 52%. The
proportion of Malagasy with access to improved sanitation increased only from 8% in 1990 to
11% in 2008, an increase of 3% point in 18 years (Figure 4). In 1990, about 8% more urban
people had access compared to rural dwellers, but in 2008 this difference dropped to 5%.
10
The information on progress in water and sanitation from the case study countries varies considerably depending
on data sources. For example, data from government sources is different from those international sources like JMP
and UNDP. There are also noticeable discrepancies in data from international sources. However, analyses in this
report are based on data from WHO/UNICEF JMP.

13
Currently, the proportion of urban and rural population with access to improved sanitation
facilities is 29% and 10% respectively.
Progress towards water and sanitation targets of the MDGs has been very slow in
Madagascar. For the water sector, in 2008, 59% of the population is without improved water
compared to 69 % in 1990. Projections indicate that by 2015, some 13.2 million Malagasy’s will
still be without access to improved water sources. This is about 20% more than the MDG target
of 8.4 million people, a difference of about 4.82 million people. The situation is worse in term of
improved sanitation coverage. The projection for the sanitation sub-sector is 21 million people
lacking access to improved sanitation services in 2015. This is about 10 million people more than
the 11 million targets in the MDG. From these trends therefore, it is difficult for Madagascar to
meet the MDG target.
3.2.2 Drivers of Access to Water and Sanitation Services
According to the FAO Aquastat database the total internal renewable water resources was
estimated at about 33.7 billion m3. The average precipitation in volume is 888.2 billion m
3 per
year. The per capita renewable water resources are about 17,634 m3 per inhabitant per year as at
2008. Madagascar’s total ODA for 2004 represented 28.3% of the GDP (USD1,2 billion,) (IRIN,
2007). Both the AfDB and the World Bank have funded rural water supply and sanitation
projects, under the umbrella of the National Program for Safe Water Supply and Sanitation
(PNAEPA). For major bilateral and multilateral donors in Madagascar, International
Development Association (IDA) led all other donor agencies with an aggregate aid of USD 66
million between 2002 and 2009. IDA support to Madagascar is three times more than the aid
flow from the second largest donor France (USD 19.9 million) during the same period. France
was followed by AfDF (USD 19.7 million) and Japan (USD 15.5 million). Other donors in the
top 10 list are European Union, Germany, UNICEF, Belgium, UNDP, and Switzerland.
The USD 19.7 million ODA disbursed by the AfDF on the water and sanitation sector in
Madagascar between 2002 and 2009 represents 3.1 % of the Bank’s total ODA for that period on
all sectors in the country. This very low amount is one of the reasons why Madagascar today is
poorly served in terms of water and sanitation provision. As presented in Annex 3, the total
investment required per year for the next 5 years in order to achieve the WSS MDG targets by
2015 is USD 119 million per year; water supply (USD 54 million) and sanitation (USD 65
million).
Created in 2008, the Ministry of Energy and Mining’s (MEM) is now responsible for developing
and promulgating water and sanitation policy, assessing water resources, and for other water
supply undertakings. The Ministry of Water, also created in 2008, was established as a general
directorate (i.e. General Water Directorate) and it sits under the authority of the Ministry of
Energy and Mines. The Malagasy NGOs NGOs (Non-Government Organisation) and private
sector are very active in WSS. The NGOs are more visible in water supply projects in rural areas
of Madagascar. The communities especially the users are always carried along and consulted
when decisions are taken. They also contribute towards the preparation of studies and work
implementation and play a significant role in maintenance and management of facilities,
especially through the payment for access charges. Madagascar’s conduct surveys to improve
M&E (UNDP, 2009). However, the country needs to harmonize the different concepts and
definitions used in the various surveys and tools.
14
3.2.3 Relationships between inputs (drivers) and outcome: Application of the WIDE
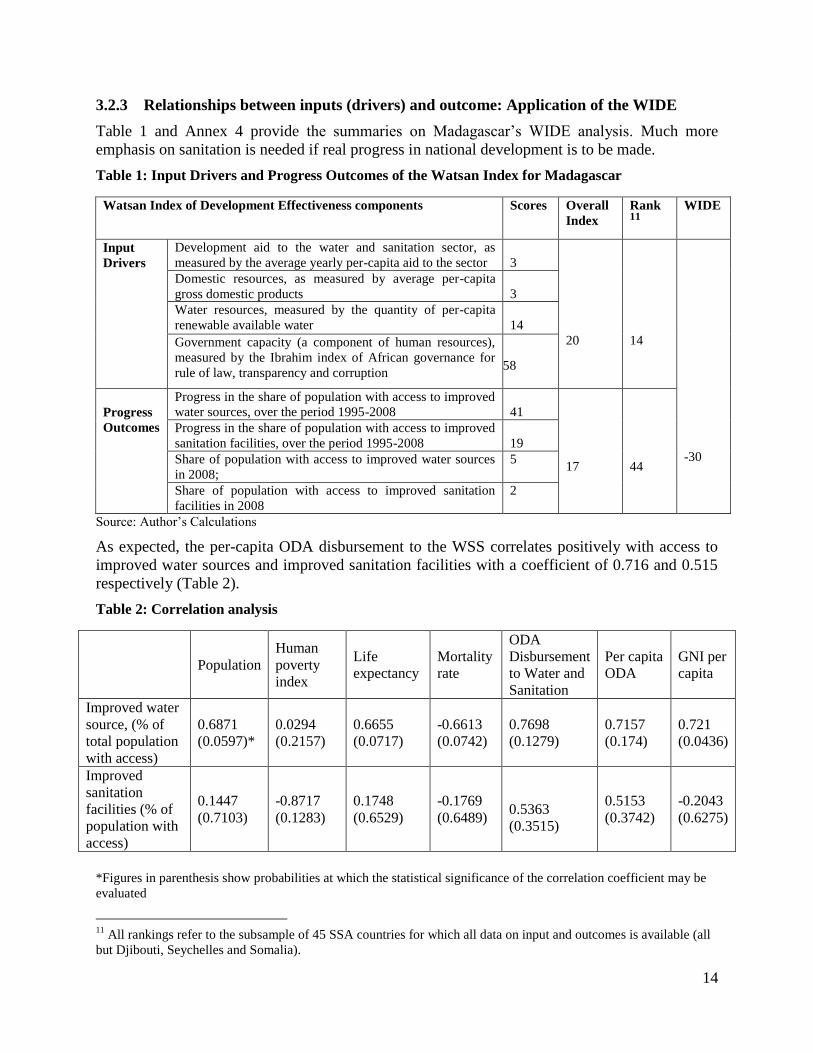
Table 1 and Annex 4 provide the summaries on Madagascar’s WIDE analysis. Much more
emphasis on sanitation is needed if real progress in national development is to be made.
Table 1: Input Drivers and Progress Outcomes of the Watsan Index for Madagascar
Watsan Index of Development Effectiveness components Scores Overall
Index
Rank11
WIDE
Input
Drivers
Development aid to the water and sanitation sector, as
measured by the average yearly per-capita aid to the sector
3
20
14
-30
Domestic resources, as measured by average per-capita
gross domestic products
3
Water resources, measured by the quantity of per-capita
renewable available water
14
Government capacity (a component of human resources),
measured by the Ibrahim index of African governance for
rule of law, transparency and corruption
58
Progress
Outcomes
Progress in the share of population with access to improved
water sources, over the period 1995-2008
41
17
44
Progress in the share of population with access to improved
sanitation facilities, over the period 1995-2008
19
Share of population with access to improved water sources
in 2008;
5
Share of population with access to improved sanitation
facilities in 2008
2
Source: Author’s Calculations
As expected, the per-capita ODA disbursement to the WSS correlates positively with access to
improved water sources and improved sanitation facilities with a coefficient of 0.716 and 0.515
respectively (Table 2).
Table 2: Correlation analysis
Population
Human
poverty
index
Life
expectancy
Mortality
rate
ODA
Disbursement
to Water and
Sanitation
Per capita
ODA
GNI per
capita
Improved water
source, (% of
total population
with access)
0.6871
(0.0597)*
0.0294
(0.2157)
0.6655
(0.0717)
-0.6613
(0.0742)
0.7698
(0.1279)
0.7157
(0.174)
0.721
(0.0436)
Improved
sanitation
facilities (% of
population with
access)
0.1447
(0.7103)
-0.8717
(0.1283)
0.1748
(0.6529)
-0.1769
(0.6489)
0.5363
(0.3515)
0.5153
(0.3742)
-0.2043
(0.6275)
*Figures in parenthesis show probabilities at which the statistical significance of the correlation coefficient may be
evaluated
11
All rankings refer to the subsample of 45 SSA countries for which all data on input and outcomes is available (all
but Djibouti, Seychelles and Somalia).

15
Similarly, there is a positive association between GNI per capita, ODA Disbursement to Water and
Sanitation and the proportion of the population using improve water source. Surprisingly, the
relationship between people using improved sanitation facilities correlates negatively with GNI
per capita, which may reflect the subdued attention that the sanitation sometimes get in
budgetary allocations.
3.2.4 Lessons learned and Conclusion
A key concern for Madagascar is the very low level of access to water and sanitation in both
rural and urban communities. Dogged by poor quality data, the poorly resourced government
achieves low outcomes, reflecting relatively low levels of aid. Added to this, the economy has
suffered from high levels of inflation, and capacity to absorb development aid effectively is
limited. In Madagascar, a major constraint in WSS is inadequate capacity, especially for skilled
manpower. Another major cause for concern is the funding gap, and the ability to absorb and
effectively manage outside donor contributions.
3.3 Kenya
3.3.1 Outcomes: Status of Access to Water and Sanitation
In 2008, the proportion of Kenya’s urban and rural populations with access to improved water
supply stood at 83% and 53% respectively. At the national level, access to improved water
sources has increased significantly, from 43% in 1990 to 59% in 2008, an increase of 16% in 18
years (Figures 5). In 1990, about 59% more urban people had access to water compared to rural
dweller, but in 2008 this difference dropped to 31%.
Figure 5: Access to improved water sources for
Kenya
Figure 6: Access to improved sanitation facilities
for Kenya
Sources: Authors, using on line databases of WHO / UNICEF
One reason for this observation is the rapid growth of urban centres. At the national level, the
proportion of Kenyans with access to improved sanitation increased only from 26% in 1990 to
31% in 2008, an increase of 5% point in 18 years (Figures 6). Nevertheless, unhygienic practices
such as open defecation increased marginally to 15 % in 2008 from 14% in 1990. At current
progress rate of 31%, access to improved sanitation in Kenya is still low. Rural Kenya still lags
behind the urban areas, by a gap that has widened from 8% in 1990 to 25% in 2008. Currently,
the proportion of urban and rural population with access to improved sanitation facilities is 52%

16
and 32% respectively. Generally, coverage in both water and sanitation is highly variable across
the country. National figures suggest in Bondo District in Western Kenya, only 13.5% have
access to safe water. In Wajir, only about 15.3% of its people have access to any form of
improved sanitation.
Projections indicate that by 2015, some 14 million Kenyans will still be without access to
improved water sources. This is about 6 % more than the MDG target of 11.5 million people, a
difference of about 2.4 million people. For the sanitation sector, Kenya has a projected 26.6
million people lacking access to improved sanitation services in 2015. This is about 12 million
people more than the 14.7 million targets in the MDG. From these trends therefore, it is difficult
for Kenya to meet the MDG target by 2015.
3.3.2 Drivers of Access to Water and Sanitation Services
The average precipitation in Kenya is 365.6 billion m3 per year. The country has a low water
endowment currently 534 m3
per capita per year and is projected to fall to 359 m3
by 2020, due to
population growth. The country still has a huge water potential as only 15% of the safe yield of
renewable freshwater resources has been exploited to date. This suggests that there is still huge
room for investment in Kenya’s water sector which should be seen as an opportunity both for the
government and development partners.
From USD 66 million in 2000, government budgetary allocations increased by almost five fold
to USD 294.6 million in 2008. ODA from development partners increased from USD 23.5
million to USD 143.2 million. Consequently, total WSS funds reached a record of about USD
438 in 2008, up from about USD 90 million in 2000. An average of about 70 % of funding for
WSS has originated from Government of Kenya (GoK), while only about 30 % came from the
donors. In per capita terms, 1995 to 2008 recorded a dramatic increase in ODA per capita, from
about USD 0.5 to a peak of USD 2.4. The sanitation sector recorded a similar increase, from
about USD 1.6 to USD 2.8. The water sector recorded its lowest per capita aid allocation of
about USD 0.2 in 1998 while sanitation sector recorded its lowest of about USD 0.4 in 2000.
Germany was the largest (including both Multilateral and Bilateral source) donor to water and
sanitation sector in Kenya cumulatively over the period 2002 to 2009. Germany provided over
USD 123.4 million more than twice as much as IDA the next largest donor with USD 50.6
million. Other donors in the top 5 are Sweden (USD 43.1), France (USD 36.2 million), and
Denmark (USD 31.3 million). The African Development Fund (AfDF) ranked seventh among
the donors to WSS in Kenya, providing a cumulative amount of USD 18.3 million over the
period 2002-2009. This represents 8.8 % of the Bank’s total ODA for that period on all sectors in
the country.
The 2002 Water Act made major reforms to water policy and created a new institutional
framework for the current national water management regime. Through the establishment of the
MWI, the government consolidated the responsibility to develop water resources, policy, and
overall sector monitoring. An independent regulator, the Water Regulatory Services Board
(WSRB) was created for the regulation of water and sewerage services, including licensing,
quality assurance, and issuance of guidelines for rates, fees, and handling service complaints
(USAID, 2007). In an attempt to address this, the Kenyan Government, since 2006, has started to
develop a Sector Wide Approach to Planning (SWAP) for the water supply and sanitation sector.

17
The SWAP increases donor coordination and reduces the likelihood of overlapping initiatives
(UNEP, 2004).
In water and sanitation sector, service provision has been dominated by the public sector. Private
sector participation is largely limited to consultants and executing contracts for the construction
and installation of water systems, and the activities of private water vendors, as well as the
production and retail of bottled drinking water. The civil society is actively involved in
promoting good governance and social economic development in Kenya. However, civil society
organizations need to address the issues of accountability, commitment, capacity and focus on
results, impact results and sustainability (KJAS, 2007). M&E activities are generally limited to
donor funded projects. This situation adversely affects data quality. Presently, the MWI is
responsible for M&E at the national level.
3.3.3 Relationship between inputs and outcomes: Applying the WIDE
The WIDE analysis (Table 3 and Annex 4) shows that given Kenya’s scarce water resources, the
country has utilised these effectively in generating the observed outcomes in access to water and
sanitation.
Table 3: Input Drivers and Progress Outcomes of the Watsan Index for Kenya
Watsan Index of Development Effectiveness components Scores Overall
Index
Rank12
WIDE
Input
Drivers
Development aid to the water and sanitation sector, as
measured by the average yearly per-capita aid to the sector
3
10
38
11
Domestic resources, as measured by average per-capita gross
domestic products
7
Water resources, measured by the quantity of per-capita
renewable available water
0
Government capacity (a component of human resources),
measured by the Ibrahim index of African governance for
rule of law, transparency and corruption
30
Progress
Outcomes
Progress in the share of population with access to improved
water sources, over the period 1995-2008
51
35
27
Progress in the share of population with access to improved
sanitation facilities, over the period 1995-2008
26
Share of population with access to improved water sources in
2008;
34
Share of population with access to improved sanitation
facilities in 2008
27
Source: Author’s Calculations.
While overall coverage is still low, there is room for some optimism given the recent progress,
and given the continued commitments of the international community. The slow pace in the
performance of the sector with regards to attainment of MDG is indicative of the fact that more
funds are required for developments in the sector. The relationships between access to water and
sanitation and some variables, including ODA were explored in a correlation analysis and the
results are presented in Table 4. The negative and significant correlation between life expectancy
at birth and improved water source is unexpected. Similarly, the positive correlation between
12
All rankings refer to the subsample of 45 SSA countries for which all data on input and outcomes is available (all
but Djibouti, Seychelles and Somalia).

18
infant mortality rate and improved access to water source is against the intuition. The unexpected
relationship may signify the importance of access to improved sanitation not just to water source
alone, a view corroborated by the expected association between access to sanitation, life
expectancy at birth and infant mortality rate.
3.3.4 Lessons learned and Conclusion
Strong financial, technical skills and capacity is often insufficient at national and local
levels;
The local communities’ ability and willingness to pay for WSS services is a constraint that
should always be taken into account in project and program planning;
Financing from multiple donors may ensure that all the lessons from previous experience
be taken into account, but it is also essential that excessive bureaucracy is avoided;
Communities’ involvement in projects is fundamental to ensure success and
sustainability;
Tariff-setting and cost-coverage are key to ensure that the project is properly maintained;
this has implications on the choice of the project’s type and size;
Tariffs can often be regressive. Tariffs-setting affects project sustainability and equity
outcomes;
Table 4: Correlation with access to water and improved sanitation facilities
Source: Authors based on data from AfDB and OECD data platform
3.4 Uganda
3.4.1 Outcomes: Access to Water and Sanitation
Between 1980 and 2008 access to improved drinking water supplies and sanitation steadily
increased at the national, urban and rural areas in Uganda. The most marked improvement has
been in access to improved water, which recorded a 24% increase from 43% to 67% over the 18
year period (Figure 7). The increase in access to sanitation services was only at 9% for the entire
population, from 39% to 48% (Figure 8). The rural areas also witnessed a steady increase in
access to improved water sources in the last two decades. This improvement is a great deal due
to the achievement of the national objectives of development of groundwater abstraction sources. The gap between urban and rural areas in access to improved water sources narrowed from 39%
points in 1990 to 27% points in 2008. With regards to sanitation, the gap widened from 5%
points in 1990 to 11% points in 2008.
Population
Human
Poverty
Index
Life
expectancy
Mortality
rate
ODA
Disbursement
to Water &
Sanitation
Per
capita
ODA
GNI per
capita
Improved water
source, (% of total
population with
access)
0.8322
(0.0054)
0.8193
(0.1807)
(-0.8276)
(0.0059)
(0.1820)
( 0.6393)
0.8227
(0.0872)
0.7514
(0.1432)
0.8493
(0.0076)
Improved
sanitation facilities
(% of population
with access)
(-0.2686)
(0.5200)
0.8855
( 0.1145)
0.3283
( 0.4272)
(-0.2747)
(0.5102)
0.4082
(0.4951)
0.4315
( 0.4682)
(-0.5031)
(0.2038)

19
Figure 7: Access to improved water sources for
Uganda
Figure 8: Access to improved sanitation
facilities for Uganda
Source: Authors, using on line databases of WHO / UNICEF
Uganda has undoubtedly made significant progress towards the water related MDG targets. At
the current progress rate, it is probable that Uganda will surpass the MDG target on access to
improved water sources. By 2015, only 23% of the population or 9.44 million Ugandans are
likely to lack access to improved water source, as against an MDG target of 29% or 11.9 million
people. With regards to sanitation, doubts still remain as to whether the country would achieve
the MDG target. It is highly likely that the country will miss the MDG sanitation by about 17%
or 6.98 million by 2015, given current trends.
3.4.2 Drivers of Access to Water and Sanitation Services
The total renewable water resources of Uganda is estimated to be about 39 billion m3 .The
volume of renewable water resources for Uganda from 1988 to 2010 have declined from 2053m³
to 1232 m3 / inhabitant / year, a reduction by 40 percentage points. The average annual rainfall is
1300mm. Overall the total budget has remained fairly constant during 2001/02 to 2008/09 this
period but the relative contributions from external donors and the GoU has changed markedly.
From 2005 to 2009 the contribution of the GoU has steadily increased from 35% to 66% of the
total amount. Unfortunately, this has been matched by a corresponding decline in external funds;
the result is that the overall budget has remained constant. The WSS sub-sector’s share of the
national budget has declined from 7.9% in 2002/03 to 2.4% in 2008/9. WSS ODA declined from
13% in 1995 to about 4% in 2008. Per-capita ODA disbursement has ever remained below USD
4 during the period. The weak appetite of donors support to WSS is not a reflection of total aid
flow to Uganda, primarily provided in other areas.
International Development Association (IDA) led all other donor agencies with an aggregate aid
of USD 203.8 million between 2002 and 2009. IDA support to Uganda is more than double the
aid flow from the second largest donor Germany (USD 100.1 million) during the same period.
Germany was followed by AfDF (USD 86.2 million). The AfDF disbursements represent only
8.6 % of the Bank’s total ODA to Uganda for that period on all sectors. Other donors in the top
10 list are Sweden, European Union, Austria, France, Denmark, Japan and United Kingdom. As
presented in Annex 3, the total investment required per year for the next 5 years to achieve the
WSS MDG targets by 2015 is USD 242 million per year. The combined annual allocated budget
and donors flow cannot meet this requirement based on historical data.

20
In Uganda, the overall responsibility for formulating national water policies rests with the
Ministry of Water, Lands and Environment (MWLE), implemented by the Directorate of Water
Development (DWD) and National Water and Sewerage Corporation (NWSC). In 2001 a sector-
wide approach (SWAP) to planning, implementation, reporting and accountability in the WSS
sector was adopted. Compared with most other SSA countries, Uganda projects are noted for
high level of ownership; a prerequisite for aid effectiveness. Private Sector Participation (PSP) in
Uganda’s WSS has been very complementary. They provide maintenance services to water users
in rural and peri-urban areas, and they manage piped water services in the majority of small
towns that have piped water. The NGOs and CBOs (Community Based Organisation) are also
involved in WSS activities. The M&E system in the various sub-sectors is still disaggregated and
data integration relies on periodic calls from the various subsector players, especially towards
times of joint sector reviews. This is creating problems of data consistency, authenticity, and
verification. Uganda is challenged with the issue of inadequate capacity in the sector. Corruption
remains a critical challenge in Uganda.
3.4.3 Relationships between inputs and outcomes13: Applying the WIDE
As a way of evaluating the WSS situation in Uganda the WIDE has been calculated (see Table 5.
The WIDE revealed a very low Input Drivers; however, significant progress has been made in
terms of Progress Outcomes. This suggests that Uganda utilises the available resources
effectively.
Table 5: Input Drivers and Progress Outcomes of the WIDE for Uganda
Watsan Index of Development Effectiveness components Scores Overall
Index
Rank14 WIDE
Input
Drivers
Development aid to the water and sanitation sector, as measured by
the average yearly per-capita aid to the sector
8
14
26
13
Domestic resources, as measured by average per-capita gross
domestic products
3
Water resources, measured by the quantity of per-capita renewable
available water
1
Government capacity (a component of human resources), measured
by the Ibrahim index of African governance for rule of law,
transparency and corruption
43
Progress
Outcomes
Progress in the share of population with access to improved water
sources, over the period 1995-2008
68
49
13
Progress in the share of population with access to improved sanitation
facilities, over the period 1995-2008
32
Share of population with access to improved water sources in 2008; 48
Share of population with access to improved sanitation facilities in
2008
48
Source: Author’s Calculations.
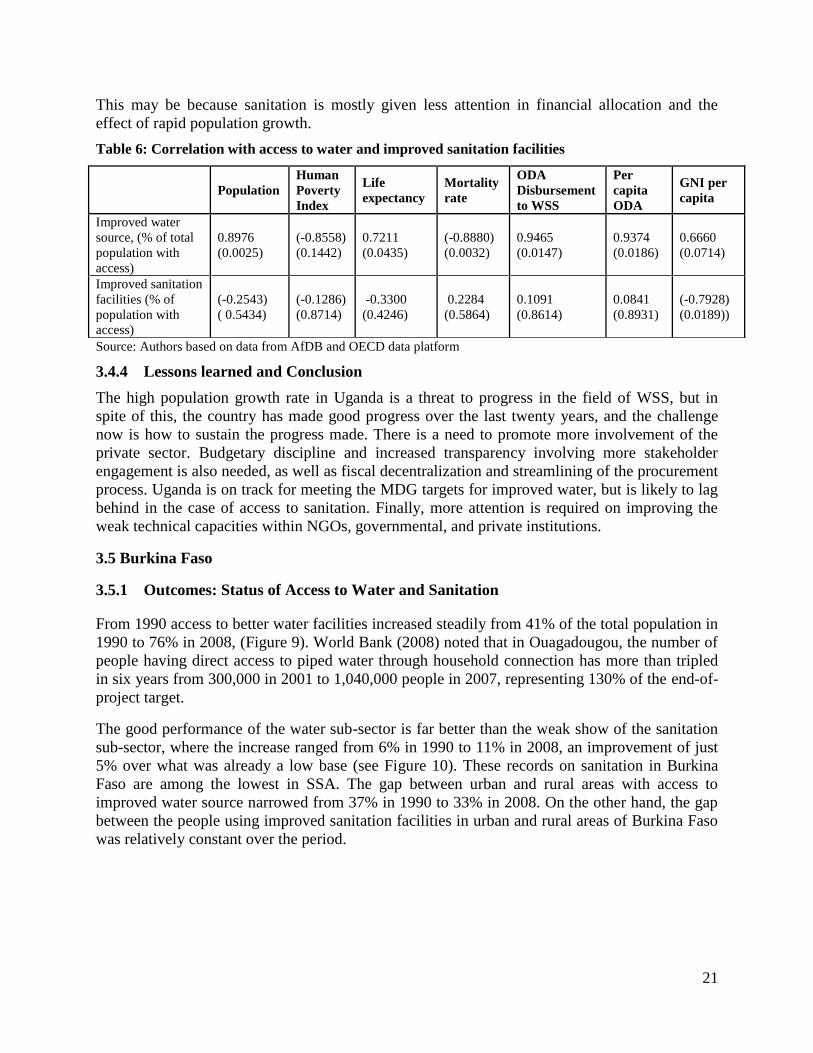
As expected, the per-capital ODA disbursement to the water and sanitation sector correlates
positively with access to improved water sources and improved sanitation facilities but
statistically significant only for access to improved water sources. Similarly, there is a positive
association between GNI per capital and the proportion of the population using improve water
source (Table 6), surprisingly, the relationship between people using improved sanitation
facilities and GNI per capita is negative and statistically significant similar to the case for Kenya.
13
See Section 2.3 for more details 14
All rankings refer to the subsample of 45 SSA countries for which all data on input and outcomes is available (all
but Djibouti, Seychelles and Somalia).
21
This may be because sanitation is mostly given less attention in financial allocation and the
effect of rapid population growth.
Table 6: Correlation with access to water and improved sanitation facilities
Source: Authors based on data from AfDB and OECD data platform
3.4.4 Lessons learned and Conclusion
The high population growth rate in Uganda is a threat to progress in the field of WSS, but in
spite of this, the country has made good progress over the last twenty years, and the challenge
now is how to sustain the progress made. There is a need to promote more involvement of the
private sector. Budgetary discipline and increased transparency involving more stakeholder
engagement is also needed, as well as fiscal decentralization and streamlining of the procurement
process. Uganda is on track for meeting the MDG targets for improved water, but is likely to lag
behind in the case of access to sanitation. Finally, more attention is required on improving the
weak technical capacities within NGOs, governmental, and private institutions.
3.5 Burkina Faso
3.5.1 Outcomes: Status of Access to Water and Sanitation
From 1990 access to better water facilities increased steadily from 41% of the total population in
1990 to 76% in 2008, (Figure 9). World Bank (2008) noted that in Ouagadougou, the number of
people having direct access to piped water through household connection has more than tripled
in six years from 300,000 in 2001 to 1,040,000 people in 2007, representing 130% of the end-of-
project target.
The good performance of the water sub-sector is far better than the weak show of the sanitation
sub-sector, where the increase ranged from 6% in 1990 to 11% in 2008, an improvement of just
5% over what was already a low base (see Figure 10). These records on sanitation in Burkina
Faso are among the lowest in SSA. The gap between urban and rural areas with access to
improved water source narrowed from 37% in 1990 to 33% in 2008. On the other hand, the gap
between the people using improved sanitation facilities in urban and rural areas of Burkina Faso
was relatively constant over the period.
Population
Human
Poverty
Index
Life
expectancy
Mortality
rate
ODA
Disbursement
to WSS
Per
capita
ODA
GNI per
capita
Improved water
source, (% of total
population with
access)
0.8976
(0.0025)
(-0.8558)
(0.1442)
0.7211
(0.0435)
(-0.8880)
(0.0032)
0.9465
(0.0147)
0.9374
(0.0186)
0.6660
(0.0714)
Improved sanitation
facilities (% of
population with
access)
(-0.2543)
( 0.5434)
(-0.1286)
(0.8714)
-0.3300
(0.4246)
0.2284
(0.5864)
0.1091
(0.8614)
0.0841
(0.8931)
(-0.7928)
(0.0189))

22
Figure 9: : Access to improved water sources
for Burkina Faso
Figure 10: Access to improved sanitation
facilities for Burkina Faso
Source: Authors, using WHO / UNICEF online databases
Considering the current progress rate, Burkina Faso is among the few countries in Africa that
will surpass the MDG target on access to improved water source. By 2015, only 10% of the
population or 0.65 million Burkinabe would lack access to improved water source as against
MDG target of 30% or 4.94 million people. However, Burkina Faso will miss access to basic
MDG sanitation target by 40% (6.59 million people) by 2015.
3.5.2 Drivers of Access to Water and Sanitation Services
Every year, Ouagadougou, Burkina Faso’s capital city receives some 700mm of rainfall.
Unfortunately due to local hydro geological-conditions, flat topography, and the intense nature of
rain events much of this rainfall is unavailable for use. Based on OECD data, the total
development aid contribution from all donors has increased from just over USD 300 million in
1990 to USD 1000 million by 2008. Data obtained from a government source (Circuit
informatisé de la dépense) provides some breakdown of the aid spent on the two sectors. The
share of water sub-sector in the WSS aid from 2004 to 2008 on the average is 95%. In contrast
the contribution toward sanitation sub-sector during the same period ranged from 1.7% (2005) to
10.6% (2008). This highlights the contrast in financial commitment between the two sectors and
explains why the figures on improved access to water are so much better than those for
sanitation.
From 1994-2008, the per capita amount of WSS ODA ranges from USD 0.34 in 1996, to 13.49
in 1999 with a 14-year average of 5.4. In terms of the percentage of ODA aid given to the WSS
sector these range from 1.3% in 1996 to 22.7% in 1999 with an average over the 14 year period
of 9.5%. World Bank’s International Development Association is the largest donor to water and
sanitation sector in Burkina Faso, cumulatively over the period 2002 and 2009. The institution
provided over USD 161.2 million more than twice as much as the next largest donor France
(USD 73.2 million). Other donors in the top 5 are Denmark (USD 70.0 million), EU Institutions
(USD 69.5 million) and Germany (USD 65.9 million) respectively. African Development Fund
ranked 6th
among the donors in Burkina Faso providing (USD 41.5 million) cumulatively within
the period 2002-2009. This represents only 5.0 % of the total AfDF funding for that period on all
sectors.

23
As presented in Annex 3, the sum of USD 116.25 million was estimated as the cost of meeting
the MDG water and sanitation goal per year until the year 2015; USD 88 million a year for the
water sector and USD 28.25 million a year for sanitation. Total public investment is estimated at
USD 17.76 million per year: USD 13.3 million for water and USD 3.96 million a year for
sanitation. Therefore, there is an investment gap of USD 96 million a year until 2015 (USD 73
million for water and USD 23 million for sanitation) in Burkina Faso.
In the WSS of Burkina Faso, overall technical supervision is provided by the Ministry of
Hydraulics. The water management department, the DGRE (Direction de Gestion des Ressources
en Eaux) and the national water and sanitation office, the ONEA (Office National de l’Eau et de
l’Assainissement) share responsibility for infrastructure and water and sanitation projects. The
inclusion of the private sector in the Burkina Faso WSS infrastructure has taken place but at a
relatively low level. Community and NGOs participation in Burkina Faso’s WSS increased in
2004 with the creation of Consultation. Monitoring and Evaluation (M&E) activities are an
integral part of WSS programs in Burkina Faso. Inadequate human resources capacity, especially
those with relevant qualification and experiences in the water and sanitation sector remain a
critical challenge
3.5.3 Relationship between inputs and outcomes15: Applying the WIDE index in Burkina
Faso
Table 7 provides the basic information on the Burkina Faso’s WIDE analysis. These figures
suggest considerable progress has been made on access to improved water sources, and a lack of
progress on sanitation provisions. The analysis also suggests available resources are being used
effectively. In particular aid funded water projects were implemented with satisfactory
performance. The projects have been very effective in increasing access to safe water especially
for the urban populace.
Table 7: Input Drivers and Progress Outcomes of the WIDE Index for Burkina Faso
Watsan Index of Development Effectiveness components Scores Overall
Index
Rank16 WIDE
Input
Drivers
Development aid to the water and sanitation sector, as measured by
the average yearly per-capita aid to the sector
21
18
19
3
Domestic resources, as measured by average per-capita gross
domestic products
4
Water resources, measured by the quantity of per-capita renewable
available water
1
Government capacity (a component of human resources), measured
by the Ibrahim index of African governance for rule of law,
transparency and corruption
47
Progress
Outcomes
Progress in the share of population with access to improved water
sources, over the period 1995-2008
95
46
16
Progress in the share of population with access to improved
sanitation facilities, over the period 1995-2008
26
Share of population with access to improved water sources in 2008; 62
Share of population with access to improved sanitation facilities in
2008
2
Source: Author’s Calculations.
15
See 2.3 for more details 16
All rankings refer to the subsample of 45 SSA countries for which all data on input and outcomes is available (all
but Djibouti, Seychelles and Somalia).

24
The relationships between access to water and sanitation and some variables, including ODA
were explored in a correlation analysis and results presented in Table 8. The relationship
between access to improved water source and all of the variables are as expected; however, the
relationship was significant only for ODA disbursement to WSS, per capita ODA, and Human
Poverty Index variables. There is strong association between life expectancy at birth, infant
mortality rate, and access to improved sanitation facilities. ODA disbursement to water and
sanitation, per capita ODA, and GNI per capita variables had unexpected relationship with
access to sanitation facilities indicating the subdued attention that the sanitation sometimes get in
budgetary allocations.
Table 8: Correlation with access to water and improved sanitation facilities
Source: Authors based on data from AfDB and OECD data platform
3.5.4 Lessons learned and Conclusion
There has been a significant rise in funding to Burkina Faso in recent years, but the country
needs to be heavily supported if targets on sanitation are to be met. Although a commitment to
IWRM has been made by the government since 2003, very little has been done in the country to
make this possible. There is a need to set up the right infrastructure to make IWRM a practical
possibility. Burkina Faso will surpass the MDG target on access to improved water source by
2015. However, increased investment in sanitation facilities particularly in rural areas of Burkina
Faso is urgently required if the MDG set for the country are to be achieved. Overall the great
challenge confronting the government in these sectors is to improve its capacity to implement the
various national strategies.
4. EXPERTS, BENEFICIARIES, AND OTHER STAKEHOLDERS’ VIEWPOINTS 4.1 Introduction
Quantitative and qualitative data were collected from a range of stakeholders. The specific
methods involved are as follows. First, structured questionnaire surveys of 36 professionals on
water supply and sanitation issues in SSA were implemented in 22 cuntries17
. Survey
respondents were drawn from as wide geographical area in the continent as possible, and
represented a range of organizations and disciplines. Second, discussions were conducted
through meetings with senior officials from relevant ministries, donor groups, local government,
etc. During the field visits, efforts were made to talk with a wide range of WSS project
17
Burkina Faso, Burundi, DRC, Ethiopia, Ghana, Guinea, Kenya, Malawi, Mali, Mozambique, Niger, Nigeria,
Rwanda, Senegal, Somalia, South Africa, Sudan, Tanzania, Togo, Uganda, Zambia, Zimbabwe.
Population
Human
Poverty
Index
Life
expectancy
Mortality
rate
ODA
Disbursement
to Water &
Sanitation
Per
capita
ODA
GNI per
capita
Improved water
source, (% of total
population with
access)
0.5745
(0.1364)
(-0.9882)
(0.0981)
0.5475
(0.1601)
(-0.5484)
( 0.1593)
0.4418
(0.4563)
0.0329
( 0.9528)
0.4475
(0.2663)
Improved
sanitation facilities
(% of population
with access)
0.9749
(0.0009)
(-0.9222)
( 0.2528)
0.9796
(0.0006)
(-0.9714)
(0.0012)
(-0.6311)
( 0.2536)
(-0.8304)
(0.0817)
(-0.2404)
(0.5663)

25
stakeholders. Third, field visits were made to few AfDB financed water supply and sanitation
related projects18
. Fourth, discussions were made with beneficiaries. Finally, relevant data and
secondary information including reports were gathered.
4.2 A Consultative Survey of Water Professionals: Survey Results
All 36 respondents considered water and sanitation essential (75%) or extremely important
(25%) in terms of its contribution to the development process. Respondents identified the most
important factors for increased access to safe drinking water and improved sanitation to be the
availability of adequate financial and technical resources to carry out the necessary work (33%);
the existence of the political will to implement the changes (15%), and the necessity for capacity
building and reform of existing institutions (14%). The picture is slightly different when only the
first choice factor for each respondent is taken into account. In this case political will (39%)
comes out ahead of capacity building and reform (24%) with adequate financial resources (21%)
being in third place (Tables 9).
Table 9: Which factors are necessary to achieve progress in increasing access to safe drinking water
and improved sanitation?
Factors Three most important
factors (%)
The single most important
Factor (%)
Adequate Financial and Technical Resources 33 21
Government and Political will 15 39
Capacity building and reform 14 24
Awareness raising and Education 11 12
Better maintenance and monitoring 8 3
Flexible and adaptive approach 6
Clear well focused policies 6
Transparency 4
Integrated multidisciplinary approach 1
Agreement and cooperation of external agencies 1
When asked how many past water and sanitation projects are still functioning as they were
designed, based on the SSA countries in which they have experience, 14 (39%) of respondents
said most, 15 (41%) some, 5 (14%) few and 2 don’t know. Significantly none replied that all
projects were working as designed. The reasons given for failure are summarized in Figure 11.
The most common is weakness of managerial and institutional capacity followed closely by
technical failure. Both of these causes may be related to lack of financial resources to provide
the support required to maintain such projects. Respondents were also asked to comment on any
external factors contributing to project failure. The main reason to emerge was the absence of an
adequate operation and maintenance program, often stemming from lack of finance. Other
responses include the perception that many projects are externally driven and as such lack a
sense of community ownership.
18
Rift Valley Water Supply and Sanitation Project, Nakuru ( Kenya); Primary Schools Water Supply and Sanitation
project, Kisumu District ( Kenya); Mityana and Mpigi Water Supply and Sanitation Project (Uganda); Buhesi
Gravity Flow Scheme ( Uganda); Ouagadougou/Ziga Drinking Water Supply Project (Burkina Faso); and AEPA-
FAD Grand South Project ( Madagascar)

26
Figure 11: Major reasons for WSS project failures
Meanwhile, the visits to AEPA-FAD Grand Sud project in Madagascar revealed the importance
of involving the community in the whole project process. The beneficiaries confirmed that the
two main outcomes of the provision of safe drinking water were household time savings, and the
reduction in the incidence of water borne diseases. The former especially benefits women and has
major effects on gender balance and household wellbeing. The latter mostly benefits children, and
potentially leads to human capital accumulation. All respondents but one affirms that institutional
arrangements act as barriers to progress in the provision of water and sanitation in their country
of expertise. By far the most commonly cited constraint is the tendency toward a short term
approach to projects leading to a paucity of post construction support mechanisms. Corruption
and a failure to implement laws and regulations were also put forward as reasons for failure.
5. CONCLUSIONS AND RECOMMENDATIONS
Progress in water and sanitation sector
Over the period of 1990 to 2008, the rate of access to improved water source in SSA increased
from 49% in 1990 to 60% in 2008, a marginal increase of less than 1% per annum. Access to
improved sanitation increased from 27% in 1990 to 37% in 2008. To meet the MDG target on
access to improved water, the rate of improvement or coverage will have to at least double from
14 million to 28 million per annum. For sanitation the coverage rate has to increase four fold
from 7 million per annum to almost 28 million per annum. To add to this, the largest proportion
of those without improved drinking water and sanitation services are poor people. Obviously,
performance is heterogeneous across countries.
5.1 Drivers or determinants of performance
The determinants of performance in the WSS sector in general and WSS ODA effectiveness
adopted in this study includes:
0
5
10
15
20
25
30
35
Institutionalweakness
TechnicalFailure
Lack of waterResources
Other externalfactors
Lack of Demand
% o
f re
spo
nd
en
ts
Major reason

27
Technical/physical Factors: These factors encompass a range of issue including the water
resources endowment of countries; climate change and climate variability posing flood and
drought hazards, the geographic area size of the countries; availability of basic
meteorological and hydrological data, availability and choice of technologies, and
availability of manpower with relevant technical and managerial skills.
Water institutions and policies: The water institutional environment and structure provides
a clearly defined water laws, water policies, and water rights. The water law gives legal
backing to water policy and provides the operational framework and enforces the power of
water administration. Water policies relate to the declared statements as well as the intended
approaches of governments for water-resources planning, development allocation, and
management.
Social milieu and localized institutions: Many elements are recognized under this category
of aid effectiveness and WSS sector performance conditioning factors. The main issues relate
to population size (including growth rate and human settlement pattern), socioeconomic and
behavioral characteristics of the beneficiary communities, and the prevailing local water
institutions. Uncontrolled high population growth rate dwarfs governments, donors and
NGOs current efforts in extending water access coverage in some SSA countries. Particularly
the high rate of rural-urban migration and rapid urbanization pushes the demand for access to
clean drinking water, shelter, and sanitation beyond the capacities of major SSA cities and
towns. Failure to understand the socio-economic and behavioral features of intended
beneficiaries and the indigenous African water institutions will inevitably limit communities’
participation in projects or programs severely constraining the success of the latter.
Economic Factors: Needless to say that the general water supply and sanitation situation of
the country, ceteris paribus, is conditioned by the level of economic development of the
country. Global economic shock may also contribute to the worsening of the WSS sector by
for example affecting the level of bilateral and multi-lateral WSS ODA.
Financial Factors: Since water resource has a public good feature, it is mainly the
governments that are responsible for WSS financing, cost recovery, and management.
Corruption also shrinks the effective amount of financial resources meant for project
implementation. The current level of donor allocations to WSS sector is not at the level
desired. The water tariff setting mechanism often penalizes the poor.
5.2 Key recommendations: redressing past anomalies in WSS sector for greater
performance and development aid effectiveness
The recommendations discussed in the following sections derive from knowledge acquired
during the field missions, through a survey of sector practitioners, country case studies and
comparative analysis of the WIDE results.
Implement Effective Monitoring and Evaluation Systems: Development aid in the water and
sanitation sector is often spent without setting up a proper baseline, and proper monitoring and
evaluation systems. In extreme cases, countries actually missed a baseline for the assessment of
progress towards the MDGs.19
However, the existence of a good monitoring and evaluation
system is bound to increase the effectiveness of development aid. Moreover, the field visits also
19
This was found to be the case for sanitation in Burkina Faso and Madagascar during the field missions undertaken
by the authors of this paper.

28
revealed that data being collected at the local level must be scrutinized before being accepted for
use in publications. What may be recorded in official water master-plans may be far from the
reality of what is actually functioning in practice. It is important to note that there is currently a
real need for greater harmonization in data collection strategies.
Set up Enabling Institutional Frameworks: It is important that aid recipients take specific
action to remove inefficiencies within their own resource management systems. In many
countries, different ministries are given responsibility for different parts of the same job. The
diverse management responsibilities impacting on water and sanitation services must be
streamlined for greater efficiency. Embedding water services within economic planning units is
also worth consideration. Of the 27 SSA countries included in the 2009-2010 CSO (Country
Status Overview) and GLAAS Global Annual Assessment of Sanitation and Drinking-Water
country survey, only eight have policies for both urban and rural water and sanitation, agreed
upon with stakeholders and published. Despite the existence of policies, many countries reported
either lack of clear definition of institutional roles for their implementation, or failure to
operationalize the definition.
Develop Integrated Water Resource Management (IWRM) Policies: It is notable that many
countries on the continent have developed IWRM policies, but some have made little progress in
implementation. IWRM policies aim to ensure that water is used to achieve social and economic
development goals, while guaranteeing sustainable vital ecosystems for future generations to
meet their water needs.
Enhance the soft-side: Invest in Capacity Building, Awareness-Raising and Education: In
some cases water and sanitation departments are understaffed not just in absolute number but
also in the number of people equipped with the required technical qualification. Aid absorption
and effectiveness are affected by countries’ human capacity in both national and local
governments, and in service provision bodies. Donor agencies should continue to ensure that this
type of capacity is built into all future visions and national programs, supporting training
programs within the local training system. Another area that needs attention within the water and
sanitation sector is public awareness-raising, and education. Government staff and members of
the public both need increased understanding of the intricate links between water, sanitation and
health. Sustainable policies can only succeed when people are adequately aware of the problems
they face.
Strengthen Private Sector Participation: Donors and recipient countries should leverage the
contribution of the private sector, which can play an important role both in terms of capital
mobilization and capacity support, as well as through the provision of competitive supply chains
to meet the needs of the WSS programs. Beyond installation, private sector participation is
generally limited in the provision of spare parts, but in most cases this activity is unviable as a
stand-alone private sector venture. At the micro level, the private sector ensures distribution
where networks are missing through water vendors, which creates employment. Therefore the
real issue becomes to create competition among vendors and avoid monopolistic scenarios,
which can be done through effective regulation. The potential of the private sector can be
leveraged through properly designed public-private partnership schemes.
Ensure Sustainability by Expanding Projects’ timelines: Lack of progress in the provision of
water supply and sanitation in SSA is partly due to the non-sustainability of past development
projects. The involvement of the private sector can improve sustainability by setting the
appropriate financial incentives. Water pricing may sound unethical to many, but field evidence
reveals that the poor are already paying high prices for water supply both in urban and rural

29
areas. Although the appropriate cross-subsidies must be put in place, it is important to note that
pricing is an important determinant of sustainability, and that a failed project implies much
higher costs for the poor. The proper consideration of cost-recovery, maintenance and
sustainability requires that the donors extend the timeline of their involvement in the project. A
capital sum should be included right from the project proposal stage, to create a revolving fund
which could then be used as the ‘cash float’ to support the operational maintenance of schemes.
Increase Stakeholder Participation and Coordination: Stakeholder participation is
particularly important to guarantee that the most urgent needs are prioritized, appropriate
solutions are selected, and outcomes are maintained after project completion. The role of NGOs
and Water Users Associations (WUA) are particularly important to ensure project ownership by
the end users and results sustainability. NGOs provide a voice to beneficiary communities by
which service quality assurance can be gauged. Water Users Associations (WUAs) represent
stakeholders who are closest to the main beneficiaries of water and sanitation projects.
Reform Urban Utilities: Countries that have adopted well-designed water utility reform plans
are substantially increasing access to services, financial sustainability, and the quality of services
provided. The types of reform that have been demonstrated to be most successful in fixing
troubled water and sanitation utilities include:
Introduction of incentives for employees that directly tie bonuses to performance;
Introduction of improved commercial systems, including metering and metered billing;
Introduction of knowledge and information systems for monitoring and evaluation;
Services to poor consumers that are financially sustainable and tailored to local needs
Improving Governance and Procurement Rule: Corruption can heavily impact on aid
effectiveness by either reducing the amount of resources actually invested in the projects, or by
distorting design and objectives. Most practitioners acknowledge that corruption occurs widely
in the water sector. One way in which donors tackle corruption is by establishing rigorous
procurement rules. A more systematic approach would involve strengthening the legal
institutions of the recipient countries; increase the share of soft-side investments, foster effective
institutional frameworks and increase capacity and ownership.
Allocate adequate financial resources: There is a need for some of the funds to be ring-fenced,
to ensure adequate representation of water and sanitation in central and local government budget
allocation decisions. There is clear evidence of sanitation neglect, in particular, in each of these
case studies. As a result, the MDG sanitation target is unlikely to be met by 2015, or in some
places, even by 2050. It is important to note however, that even when this MDG target is
reached, there will be millions of people across SSA facing conditions of open defecation. While
this situation remains, the donor community must guarantee that the impetus generated by the
MDGs is maintained, to ensure that all unsanitary conditions remaining will be totally eradicated
during the next period of global development planning.
5.3 Implication for the African Development Bank and other Stakeholders
Given the fact that many facilities are not optimally operating after completion of projects,
involvement of the Bank and other development partners beyond project term is worth
consideration. Especially, continues capacity development activities led by the concerned
governments are crucial for sustainable operation and maintenance. The design of innovative
solution to resolve the issue of operation and maintenance is critical to increase results
sustainability. A capital sum should be included right from the project proposal stage, to create a

30
revolving fund which could then be used as the ‘cash float’ to support the operational
maintenance of schemes. While this would incur a marginal increase in the overall budget, it
would certainly increase the effectiveness of the spending by ensuring operation and
maintenance issues were addressed in a timely manner. The implementation of such a system
would of course require some institutional and human capacity development, but this is
something which should be supported anyway within any overall national development strategy.
The weak technical and administrative capacities call for more donors’ investment in capacity
building for the sector’s operators in both public and private sectors. Donor’s supports are also
required to ensure budgetary discipline and increased transparency, as well as fiscal
decentralization and streamlining of the procurement process. Donors could make important
contribution to regional water development through funding large scale multipurpose integrated
water project rather than individual smaller projects. Donors and recipient countries should
leverage the contribution of the private sector, which can play an important role both in terms of
capital mobilization and capacity support. Greater participation of private sector is required, as
the available resources from user tariffs, government and development aid, has not proven to be
a reliable source of financing.
Discussions in the preceding section showed clearly that the sanitation sector is often neglected
or given less priority in the general government budget allocation. This is reflected in the current
low level of progress in the sub-sector. Hence, increased investment in sanitation facilities
particularly in rural areas is highly recommended. Greater attention should however be given to
adequate public awareness and sensitisation including hygiene education for the correct use of
latrines and cleaning of hand after defecation. With regards to household sanitation,
government and donors can support the households in the construction of pit latrines, with the
provision of the concrete slabs etc. The householder or community will dig the pit and complete
other works on the project. Evidence from Kenya and Uganda revealed that the implementation
of the large scale eco-sanitation systems has been effective. This kind of sanitation provision
should be promoted for adaptation and uptake in other countries.
For the WSS sector to achieve greater performance and increase the effectiveness of
development, the Bank and development partner has a role in the implementation of effective
monitoring and evaluation systems. These would reduce or eliminate the divergence of
information from different data sources in the WSS. The need for cross subsidization to ensure
basic provision must be considered by relevant authorities. While this may reduce the number of
projects that can be done, it will increase their long term viability and increase the effectiveness
of service delivery.

31
References
AfDB, EUWI, WSP and UNDP (2006). Getting Africa on Track to Meet the MDGs on Water
Supply and Sanitation, 2006.
African Development Bank, 2006. African Development Report 2006 - Aid, Debt Relief And
Development in Africa. Oxford University Press, 166pp.
AMCOW, AfDB, EUWI, WSP and UNDP (2006), Getting Africa on Track to Meet the MDGs
on Water Supply and Sanitation: A status Overview of Sixteen African Countries.
http://www.wsp.org/wsp/sites/wsp.org/files/publications/319200725615_312007101903_MDGs
_All_ final3_high.pdf: Accessed: 08/09/2010.
Herrero, C., Martinez, R, Villa, A.(2007). A Multiplicative Human Development Index Research
Report, University of Alicante, Spain.IFRC (2009) International Federation of Red Cross and
Red Crescent Societies 2009 www.ifrc.org.
IRIN. (2007). Madagascar: Humanitarian Country Profile. Available from:
http://www.irinnews.org/country.aspx?CountryCode=MG&RegionCode=SAF, Accessed:
07/08/2009.
KJAS (2007), Joint Assistance Strategy for the Republic of Kenya (2007–2012), June 13, 2007
OECD (2008) Measuring Aid to Water Supply and Sanitation, Organisation for Economic Co-
operation and Development, Paris. 8pp.
OECD (2010). Organisation for Economic Co-operation and Development: Creditor Reporting
System database, Paris.
http://www.oecd.org/document/1/0,3746,en_2649_34447_1948088_1_1_1_1,00.html.
Sullivan C.A. and Meigh, J.R. (2007). Integration of the biophysical and social sciences using an
indicator approach: Addressing water problems at different scales Journal of Water Resources
Management 21:111-128..
USAID. (2007). Kenya Water and Sanitation Profile, Available from
http://pdf.usaid.gov/pdf_docs/PNADO931.pdf., Accessed 10/08/2009.
World Bank (2008) Review of Public expenditure Sector of Water and Sanitation in rural areas
of Burkina Faso AFTU2.

32
Annexes
Annex 1: Access to improved water and Sanitation sources (% of total population). Year Variation (a)
1990 1995 2000 2005 2005
Country Water Sanita Water Sanita Water Sanita Water Sanita Water Sanita Water Sanita
Angola 36 25 36 30 41 40 47 50 50 57 14 32
Burundi 70 44 71 45 72 45 72 46 72 46 2 2
Benin 56 5 61 8 66 9 72 11 75 12 19 7
Burkina Faso 41 6 49 7 60 8 70 11 76 11 35 5
Botswana 93 36 94 44 94 50 95 57 95 60 2 24
Central African
Rep. 58 11 60 15 63 22 65 29 67 34 9 23
Côte d'Ivoire 76 20 77 21 78 22 79 23 80 23 4 3
Cameroon 50 47 57 48 64 47 71 47 74 47 24 0
Congo, Dem. Rep. 45 9 44 12 44 16 45 20 46 23 1 14
Congo, Rep.
70 30 71 30 71 30 1 0
Comoros 87 17 90 22 92 28 95 35 95 36 8 19
Cape Verde
82 40 83 45 84 52 84 54 2 14
Djibouti 77 66 78 66 83 63 89 58 92 56 15 -10
Eritrea 43 9 46 10 54 11 60 13 61 14 18 5
Ethiopia 17 4 22 5 28 8 35 10 38 12 21 8
Gabon
84 36 85 36 86 33 87 33 3 -3
Ghana 54 7 63 8 71 9 78 11 82 13 28 6
Guinea 52 9 58 12 62 15 68 17 71 19 19 10
Gambia 74
79 60 84 63 89 65 92 67 18 7
Guinea-Bissau
52 16 55 18 58 20 60 21 8 5
Equatorial Guinea
43 51 43 51 43 51
0 0
Kenya 43 26 48 27 52 29 56 30 59 31 16 5
Liberia 58 11 61 13 65 14 67 16 68 17 10 6
Lesotho 61 32 64 31 74 29 83 28 85 29 24 -3
Madagascar 31 8 34 9 37 10 40 11 41 11 10 3
Mali 29 26 36 29 44 32 51 35 56 36 27 10
Mozambique 36 11 38 12 42 14 45 15 47 17 11 6
Mauritania 30 16 36 18 40 21 45 24 49 26 19 10
Mauritius 100 91 99 91 99 91 99 91 99 91 -1 0
Malawi 40 42 51 47 63 50 74 54 80 56 40 14
Namibia 64 25 73 27 81 29 88 31 92 33 28 8
Niger 35 5 39 5 42 7 45 9 48 9 13 4
Nigeria 47 37 50 36 53 34 57 32 58 32 11 -5
Rwanda 68 23 67 32 67 40 66 49 65 54 -3 31
Sudan 65 34 63 33 61 34 59 34 57 34 -8 0
Senegal 61 38 63 41 65 45 68 49 69 51 8 13
Sierra Leone
57 10 55 11 51 12 49 13 -8 3
Somalia
21 21 23 22 28 22 30 23 9 2
São Tomé e
Principe
75 20 78 21 85 24 89 26 14 6
Swaziland
53 48 55 49 64 53 69 55 16 7
Seychelles
Chad 39 6 42 6 45 7 49 9 50 9 11 3
Togo 49 13 52 13 55 12 58 12 60 12 11 -1
Tanzania 55 24 54 24 54 24 54 24 54 24 -1 0
Uganda 43 39 50 42 57 44 64 47 67 48 24 9
South Africa 83 69 84 71 86 73 89 75 91 77 8 8
Zambia 49 46 51 47 54 47 58 47 60 49 11 3
Zimbabwe 78 43 79 43 80 44 82 44 82 44 4 1
49 27 52 28 55 29 58 31 60 31 11 4

33
Source: Joint Monitoring Program (http://www.wssinfo.org/en/welcome.html). Note: (a) The variation is calculated
as difference between latest and earliest access rate data.
Annex 2: Watsan Index of Development Effectiveness
Source: Authors’ calculations
Abb. Country Inputs
Inputs
rank Outcomes
Outcomes
rank WIDE
AGO Angola 12.5 30 59.4 5 25
RWA Rwanda 11.2 34 49.8 11 23
ZWE Zimbabwe 3.5 44 40.2 21 23
CAF Central African Rep. 10.5 36 48.2 14 22
MWI Malawi 15.3 21 67.0 1 20
COM Comoros 12.6 28 54.9 8 20
BDI Burundi 5.3 43 35.3 26 17
GMB Gambia 18.4 17 62.9 2 15
UGA Uganda 13.7 26 48.7 13 13
CIV Côte d'Ivoire 7.6 40 33.8 28 12
CMR Cameroon 12.6 29 45.7 18 11
KEN Kenya 10.0 38 34.6 27 11
COD Congo, Dem. Rep. 3.2 45 26.4 34 11
NGA Nigeria 6.6 41 26.0 35 6
GNB Guinea-Bissau 10.1 37 30.7 32 5
ZAF South Africa 33.7 7 60.7 4 3
SWZ Swaziland 19.8 13 51.8 10 3
BFA Burkina Faso 18.2 19 46.3 16 3
GIN Guinea 14.7 24 39.6 22 2
ERI Eritrea 12.3 32 32.9 30 2
BWA Botswana 43.0 4 61.1 3 1
NAM Namibia 32.8 8 55.8 7 1
SDN Sudan 5.8 42 20.8 42 0
TCD Chad 9.1 39 21.4 41 -2
CPV Cape Verde 36.9 6 53.8 9 -3
LSO Lesotho 20.4 12 46.6 15 -3
ETH Ethiopia 11.3 33 26.0 36 -3
MUS Mauritius 54.9 2 58.6 6 -4
MLI Mali 18.4 16 43.4 20 -4
BEN Benin 17.3 20 37.4 24 -4
TGO Togo 10.7 35 23.2 39 -4
STP São Tomé e Principe 42.1 5 49.0 12 -7
SEN Senegal 26.3 9 46.3 17 -8
GHA Ghana 20.5 11 44.8 19 -8
ZMB Zambia 18.8 15 37.5 23 -8
LBR Liberia 14.7 23 31.3 31 -8
NER Niger 12.4 31 22.0 40 -9
MRT Mauritania 18.2 18 33.6 29 -11
MOZ Mozambique 14.0 25 24.9 37 -12
SLE Sierra Leone 13.0 27 11.4 45 -18
TZA Tanzania, United Rep. 14.9 22 19.8 43 -21
COG Congo, Rep. 22.9 10 29.2 33 -23
GAB Gabon 72.1 1 35.6 25 -24
MDG Madagascar 19.7 14 16.8 44 -30
GNQ Equatorial Guinea 48.4 3 23.5 38 -35
DJI Djibouti . . . . .
SYC Seychelles . . . . .
SOM Somalia . . . . .

34
Annex 3: Investment Requirement
Source: Computed using data from AMCOW et al (2006)
Country Water/
Sanitation
Rural/
Urban
Total Investment
Required Public
Invest
Required
Planned
Public
Invest
Surplus
(Fundin
g Gap) New Rehab Total
(m USD/year)
Burkina
Faso
Water Rural 62 8 70 69 11 -58
Urban 1 17 18 18 2 -15
Sub-total 64 24 88 87 13 -73
Sanitation Rural 15 1 17 15 0 -14
Urban 12 – 12 12 4 -8
Sub-total 27 1 28 27 4 -23
Total
Kenya
Water Rural 12 51 63 57 33 -24
Urban 53 22 75 67 77 10
Sub-total 65 73 138 124 110 -14
Sanitation Rural 9 25 34 0 2 2
Urban 51 14 65 59 14 -45
Sub-total 60 39 99 59 16 -43
Total
Madaga
scar
Water Rural 24 7 31 26 52 26
Urban 14 9 23 7 21 14
Sub-total 38 16 54 33 73 40
Sanitation Rural 18 41 59 6 4 -2
Urban 2 4 6 1 15 14
Sub-total 20 44 65 6 19 13
Total
Uganda
Water Rural 29 44 73 69 46 -23
Urban 14 6 20 20 54 34
Sub-total 43 50 95 89 100 11
Sanitation Rural 35 68 103 35 10 -25
Urban 38 10 49 18 9 -9
Sub-total 73 78 147 53 19 -34
Total

35
Annex 4: Country profiles of the Watsan Index of Development Effectiveness
Comparison of each country with the SSA sample median score. When the solid line indicating
the country itself is outside of the dotted line (median), this suggests that the specific country is
either benefitting from relatively high input drivers, or the country is achieving relatively high
progress outcomes. Note in some cases the country score and sample median are so similar that
they are difficult to discern.
Source: Authors’ calculation
0
10
20
30
40
50aid
gdp
watres
governance
Kenya - Inputs
0
10
20
30
40
50
60Δw
Δs
w
s
Outcomes
KEN
SSA median
0
10
20
30
40
50aid
gdp
watres
governance
Uganda - Inputs
0
20
40
60
80Δw
Δs
w
s
Outcomes
UGA
SSA median
0
10
20
30
40
50aid
gdp
watres
governance
Burkina Faso - Inputs
0
20
40
60
80
100Δw
Δs
w
s
Outcomes
BFA
SSA median
0
10
20
30
40
50
60aid
gdp
watres
governance
Madagascar - Inputs
0
10
20
30
40
50Δw
Δs
w
s
Outcomes
MDG
SSA median

36
Recent Publications in the Series
nº Year Author(s) Title
139 2011 Giovanni Caggiano, Pietro Calice The Macroeconomic Impact Of Higher Capital Ratios On
African Economies
138 2011 Cédric Achille MBENG MEZUI Politique Economique Et Facteurs Institutionnels Dans Le Développement Des Marchés Obligataires Domestiques De
La Zone CFA
137 2011 Thierry Kangoye Does Aid Unpredictability Weaken Governance?
New Evidence from Developing Countries
136 2011 John C. Anyanwu Determinants Of Foreign Direct Investment Inflows To
Africa, 1980-2007
135 2011 John C. Anyanwu International Remittances and Income Inequality in Africa
134 2011 Mthuli Ncube, Eliphas Ndou Inflation targeting, exchange rate shocks and output: Evidence from South Africa
133 2011 Mthuli Ncube, Eliphas Ndou Monetary Policy Transmission, House Prices and Consumer
Spending in South Africa: An SVAR Approach
132 2011
Ousman Gajigo, Emelly Mutambatsere
Elvis Adjei
Manganese Industry Analysis: Implications For Project
Finance
131 2011 Basil Jones
Linking Research to Policy: The African Development
Bank as Knowledge Broker
130 2011 Wolassa L.Kumo Growth and Macroeconomic Convergence in Southern
Africa
37