working paper 313 - icrier | indian council for …icrier.org/pdf/working_paper_313.pdf1 working...
TRANSCRIPT

1
Working Paper 313
Technology, Jobs and Inequality
Evidence from India’s Manufacturing Sector
Radhicka Kapoor
February 2016
INDIAN COUNCIL FOR RESEARCH ON INTERNATIONAL ECONOMIC RELATIONS

i
Table of Contents
Abstract ..................................................................................................................................... ii
1. Introduction ........................................................................................................................ 1
2. Key Stylized Facts .............................................................................................................. 3
2.1 Capital intensity of production increased across industries ......................................... 3
2.2 Labour intensive industries grew slower than capital intensive industries ................... 4
2.3 Changes in distribution of income ................................................................................. 6
2.4 Skilled vs Unskilled workers .......................................................................................... 7
3. The Contractualization of the Workforce ....................................................................... 8
4. Data& Econometric Analysis .......................................................................................... 10
4.1 Data........................................................................................................................... 10
4.2 Econometric Framework .......................................................................................... 11
4.3 Results ....................................................................................................................... 13
5. Conclusion ........................................................................................................................ 17
APPENDIX A: First Stage Regression from IV Analysis .................................................. 18
References ............................................................................................................................... 19
List of Tables
Table 1: Trend Growth Rate of Employment Across Industries............................................ 6
Table 2: Instrumental Variable Analysis.............................................................................. 14
List of Figures
Figure 1: Capital Intensity of Production ................................................................................ 4
Figure 2: Trend Growth Rate in Capital Intensity of Production by Industry (NIC 2004) ..... 4
Figure 3: Growth of Value Added in the Manufacturing Sector ............................................. 5
Figure 4: Growth of Employment in the Manufacturing Sector ............................................. 6
Figure 5: Changes in Key Distribution of Value Added ......................................................... 7
Figure 6: Growth in Real Wage Rates across Various Categories of Employees ................... 8
Figure 7: Composition of Employment in Organised Manufacturing Sector ......................... 9

ii
Abstract
Faced with easier access to foreign technology and imported capital goods, firms in India's
organised manufacturing sector adopted advanced techniques of production leading to
increasing automation and a rise in the capital intensity of production. This has raised much
concern about the ability of the manufacturing sector to create jobs for India’s rapidly rising
largely low-skilled and unskilled workforce. However, what has attracted less attention in the
literature is the impact of capital augmenting technological progress on the distribution of
income and wage inequality. This paper attempts to fill this gap using enterprise level data from
the Annual Survey of Industries. We find that with growing capital intensity of production, the
role of labour vis-à-vis capital has declined. The share of total emoluments paid to labour
fell from 28.6% to 17.4% of gross value added (GVA) between 2000-2001 and 2011-12, while,
the share of wages to workers in GVA declined from 22.2% to 14.3%. Importantly, even within
the working class, inequalities have increased. The share of skilled labour (non- production
workers i.e. supervisory and managerial staff) in the wage pie rose from 26.1% to 35.8%, while
that of unskilled labour (production workers) fell from 57.6% to 48.8% of total wage bill.
However, it is not just the growth of capital intensity but another important, though independent
change in the labour market (i.e. the rising share of contract workers) that explains rising
inequality. Our results also underline the existence of capital-skill complementarity: firms with
higher capital intensity employed a higher share of skilled workers and the wage differential
between skilled and unskilled workers was higher in these firms.
_________
Keywords: Technological Change, Inequality, Organised Manufacturing, Employment, Wage
Differentials
JEL classification: E24; E25; J21; J31; L60; O33
Author’s email: [email protected]; [email protected]
_________
Disclaimer: Opinions and recommendations in the paper are exclusively of the author and not
of any other individual and institution including ICRIER.

1
Technology, Jobs and Inequality
Evidence from India’s Manufacturing Sector1
Radhicka Kapoor*
1. Introduction
India’s post reform economic development has seen a sustained increase in the capital intensity
of production in the manufacturing sector. The rising capital intensity of production is indeed
a well-established fact in the literature (Das & Kalita, 2010 and Goldar 2000).The adoption of
labour saving and capital intensive techniques of production in an economy that has a
comparative advantage in unskilled labour is particularly puzzling and has attracted much
attention. In fact, Hasan et al (2013) have shown that India uses more capital intensive
techniques of production in manufacturing than countries at similar level of development and
similar factor endowments.
There exists a vast literature examining the factors that determine the capital intensity of
production across industries in the Indian manufacturing sector. Several of these studies have
highlighted the significance of factor market imperfections in explaining the rising capital
intensity of production (Hasan et al, 2013, Sen & Das, 2010). India’s labour market regulations,
in particular, have attracted much attention in this context. It is believed that the stringencies
and rigidities in labour laws have imposed costs on labour use, thereby pushing firms towards
greater capital intensity. This in turn has reduced labour demand and curtailed gains from trade
based on factor-abundance driven comparative advantage. However, it has been argued in the
literature that labour regulations cannot alone explain the rising capital intensity of production
over time. Sen & Das (2014) attribute the increases in capital intensity to an increase in the
ratio of real wage to rental price of capital which was mostly due to a fall in the relative price
of capital goods. The decrease was driven by trade reforms in capital goods and falling import
tariffs on them in the post reform period. While these factors are pivotal, it is important to
remember that rising capital intensity is also reflective of technological transformation.
Technological progress has been capital-augmenting rather than labour augmenting during the
globalization era. Consequently, Indian firms faced with easier access to foreign technology
adopted more capital intensive techniques of production.
While the factors explaining the increasing capital intensity of production in India are well
documented in the literature, the implications of this phenomenon for the labour market have
attracted relatively less attention. The most immediate concern is the impact of labour saving
techniques of production on job creation. Since the followers of Ned Ludd smashed
mechanized looms in 1811, workers have worried about automation destroying jobs. In both
the industrialized and developing world, there is growing anxiety regarding job prospects for
1 I am grateful to Prof Suresh Aggarwal, Prof Biswanath Goldar and Dr Ajit Ghose for their helpful comments
and suggestions. P.P.Krishnapriya provided excellent research assistance. This paper has been written as a
part of ICRIER’s project on “Jobs for Development” (funded by The World Bank, Washington DC). * Radhicka Kapoor is Fellow at ICRIER.

2
large groups of middle skilled workers on account of automation, computerization and new
technologies. In India, too, given the intensifying demographic pressures, the adoption of
capital intensive methods of production in the manufacturing sector poses a significant
challenge to productive job creation. While, economists have often reassured that new jobs
would be created even as old ones were eliminated, the adoption of capital intensive techniques
will not affect all types of workers (unskilled versus skilled workers) uniformly. It has been
shown in the literature that capital-augmenting technological change has favoured more skilled
(educated) workers, replacing tasks performed by unskilled, and increasing the demand for
skills. This has increased wage inequality between skilled and unskilled workers. For instance,
in the case of the US economy, many commentators see a direct causal relationship between
technological changes and the radical shifts in the distribution of wages between 1979 and
1995. The college premium (the wages of college graduates relative to wages of high school
graduates) increased by over 25% during this period. Overall earnings inequality also soared:
in 1971, a worker at the 90th percentile of the wage distribution earned 266% more than a
worker at the 10th percentile. By 1995, this number had risen to 366% (Acemoglu,
2002).Moreover, capital augmenting technological progress has boosted capital’s return and
its share in the distribution of income. Guscina (2006) has shown that the decline in labour’s
share in national income over the past two decades in OECD countries has largely been an
equilibrium, rather than a cyclical phenomenon, as the distribution of national income between
labour and capital adjusted to capital augmenting technological progress and a more globalized
world economy.
In the Indian context, the literature on impact of the adoption of increasing capital intensive
techniques of production on distribution of wages and income is limited. This paper attempts
to fill this gap by examining the implications of rising capital intensity on wage and income
structure in India’s manufacturing sector. Using data from a sample of manufacturing firms
from the Annual Survey of Industries, this paper presents new empirical evidence on the impact
of adoption of capital intensive techniques of production on inequality at the firm level. It is
important to mention here that India’s manufacturing sector is characterized by dualism, i.e.
the prevalence of a formal/organised sector which coexists with a large “unorganised sector”.
The latter accounts for a disproportionately large share of employment (90%), but a very small
share of value added in manufacturing. The formal sector accounts for over 65% of total output
and it is this sector which is the focus of analysis in our study. This is because it was firms in
this sector which resorted to increasing mechanization and automation, while firms in the
unorganized sector continued to employ relatively more labour intensive techniques of
production. Moreover, India’s labour regulations to which much of the high capital intensity
of production is attributable cover only the organized sector. Though, it would be useful to
study both formal and informal sector firms, given the absence of comparable annual data on
the unorganized sector, it is difficult to study both together2.
This paper organized as follows. We begin by examining some key trends in the organized
manufacturing sector in Section 2. Is it the case that the capital intensity of production has
2 The National Sample Survey Organisation's (NSSO) survey of unorganised (or unregistered) manufacturing
enterprises covers firms in the unorganized sector but data on this is available only quinquennially.

3
increased in industries across the manufacturing sector, or is it just the more capital intensive
industries that have resorted to increasing automation leading to greater disparities in the
capital-labour ratio across the manufacturing sector? Is it the case that share of value added
going to owners of capital have increased as compared to income going to labour? Has the
wage differential between skilled and unskilled workers increased? In Section 3, we discuss an
independent, though important change in India’s labour market during this time i.e. the
contractualization of India’s workforce. This may well have driven some of the stylized facts
we present in Section 2. In Section 4, we outline our empirical strategy to study the impact of
rising capital intensity on inequality. We also describe the data used in the empirical analysis
and present the main results. Section 5 puts forward some concluding remarks.
2. Key Stylized Facts
2.1 Capital intensity of production increased across industries
The increase in the average capital intensity of production in the manufacturing sector is
evident in Figure 1. What is particularly important is that this increase in capital intensity was
witnessed across all industries in the manufacturing sector. The trend growth in capital intensity
of production across industries at the three digit level over the last decade shows that the capital
labour ratio3 has risen for all but eight industries (Figure 2). Classifying industries on the basis
of their capital intensity4, we find that this ratio has increased not just in capital intensive but
also labour intensive industries. Rising capital intensity of production, especially in labour
intensive industries, is a cause of concern as it raises doubts about the capacity of the
manufacturing sector to absorb labour and create jobs.
3 Capital intensity is defined as the ratio of real fixed capital to total persons engaged. Capital is measured by
fixed capital as reported in ASI. This represents the depreciated value of fixed assets owned by the factory
on the closing day of the accounting year. It is deflated using WPI for machinery and equipment. Total persons
engaged include workers (both directly employed and employed through contractors), employees other than
workers (supervisory, managerial and other employees) and unpaid family members/proprietor etc.
4 In order to classify industries as labour or capital intensive, we calculate the capital intensity for all industries
in the organized manufacturing sector for every year from 1999 to 2011. An industry is classified as labour
intensive if its capital intensity is below the median value for the manufacturing sector throughout the decade.
Similarly, an industry is classified as capital intensive if its capital intensity is above the median value for the
manufacturing sector throughout the decade. The remaining industries are classified as ambiguous.

4
Figure 1: Capital Intensity of Production
Figure 2: Trend Growth Rate in Capital Intensity of Production by Industry (NIC 2004)
2.2 Labour intensive industries grew slower than capital intensive industries
The rising capital intensity of production in the manufacturing sector has been accompanied
by another important phenomenon. Capital intensive industries have also grown significantly
faster than labour intensive industries in terms of gross value added (GVA) (Kapoor, 2014).
0
.05
.1.1
5
Avera
ge
K/L
1993-94 1995-96 1997-98 1999-00 2001-02 2003-04 2005-06 2007-08 2009-10 2010-11
Year
All industries Labour intensive industries Capital intensive industries
Source: Author's calculations based on ASI publishes statistics, MOSPI
All India average capital-labour ratio (K/L)
152
153
154
160
172
173181
182
191
192
201
202
222
273
281
289
291
292 311
312
315
331
333
342
351
352
361
369
151155
171
210
221
223
231
232
241
242
243
251
252261
269
271
272
293
300313
314
319
321
322
323
332341
343
353
359
-10
01
02
03
0
Tre
nd g
row
th in
K/L
(%
)
Labour intensive industries Capital intensive industries
Dispersion in growth rate of capital-labour ratio
Source: Author's calculations based on ASI published statistics, MOSPI

5
This is contrary to what one would expect in an economy where labour is a source of
comparative advantage. The rising capital intensity of production, coupled with the fact that
labour intensive industries grew slower than capital intensive industries further makes the task
of creating productive jobs for India’s largely low-skilled and unskilled workforce more
challenging (Figure 3).
Figure 3: Growth of Value Added in the Manufacturing Sector
However, when we look at the performance of industries in terms of employment generation,
we find that despite having lower employment elasticity of output, capital intensive industries
have generated reasonably high rates of employment growth (Figure 4). Perhaps, this is because
output growth in these industries was significantly higher. Table 1 shows that the industry
which generated the highest employment growth over the last decade was in fact the most
capital intensive industry i.e. manufacture of motor-vehicles, trailers and semi-trailers. In fact,
the trend growth of employment in capital intensive industries appears to be as high as in labour
intensive industries. Of course, it is important to mention that the higher growth rates of
employment in capital intensive industries could also be partly a result of the base effect i.e.
lower initial values of employment. The disconnect between growth of employment and gross
value added in the manufacturing sector during this period of rising capital intensity is also
worth noting. Results from ASI show that while employment grew at the rate of about 4.6%
p.a. between 2000 and 2012, real value added in organized manufacturing grew at almost
double the rate (10.2% p.a.).
15
16
17
18
19
ln(G
VA
)
2000 2002 2004 2006 2008 2010 2012
Year
Capital intensive industrieslabour intensive industriesAll industries
Source: Author's calculations based on ASI published statistics, MOSPI
Annual growth in GVA

6
Figure 4: Growth of Employment in the Manufacturing Sector
Table 1: Trend Growth Rate of Employment Across Industries
Industry
Trend growth of
employment(%)
Lab
ou
r In
ten
sive Mf of food products and beverages 2.6
Mf of tobacco products -1.8
Mf of wearing apparels; dressing and dyeing of fur 8.5
Tanning and dressing of leather; Mf of luggage, handbags,
saddlery, harness and footwear 7.6
Mf of wood and products of wood and cork, except
furniture;Mf of articles of straw and plaiting materials 5.1
Ca
pit
al
Inte
nsi
ve
Mf of coke and refined petroleum products and nuclear fuel 6.4
Mf of chemicals and chemical products 0.4
Mf of rubber and plastic products 7.4
Mf of basic metals 5.4
Mf of office, accounting and computing machinery 8.4
Mf of motor vehicles, trailers and semi-trailers 10.7
Source: Author’s calculations based on ASI published data
2.3 Changes in distribution of income
With growing capital intensity and the adoption of labour saving techniques of production, the
importance of labour relative to capital is likely to decline. Consequently, one would expect
the shares of income earned by equipment owners/owners of firms to rise relative to that of
laborers. This is exactly what we observe in the Indian manufacturing sector (Figure 5). The
share of total emoluments paid to workers declined from 28.6% to 17.4% of GVA between
15
15.5
16
16.5
ln(T
ota
l pe
rso
ns e
nga
ge
d)
2000 2002 2004 2006 2008 2010 2012
Year
Capital intensive industriesLabour intensive industriesAll industries
Source: Author's calculations based on ASI published statistics, MOSPI
Annual growth in total persons engaged

7
2000-2001 and 2011-12. Significantly, the share of wages to workers in GVA declined steeply
from 22.2% to 14.3% over the same period. The interest paid out by firms dwindled from about
29% to 19% of GVA5. Importantly, the share of profits in GVA rose from 19.9% in 2000-01
to 46.2% in 2011-12. The declining bargaining power of workers vis-à-vis capitalists reflected
in these figures raises the issue of equity in the distribution of income. However, it needs to be
examined whether these trends were indeed a result of higher capital intensity of production,
or there were some other factors at play.
Figure 5: Changes in Key Distribution of Value Added
2.4 Skilled vs Unskilled workers
While the adoption of capital intensive techniques of production may have diluted the
importance of labour, the impact of mechanisation has been differential across various
categories of workers. Capital augmenting technological progress is not just about introduction
of machines but also about the workers who have developed a set of machine-specific skills.
While machines are generally substitutes for unskilled labour, they are also complements to
skilled labour. Across the world, mechanization has resulted in rising importance of a new
portfolio of occupations i.e. engineers, machine builders, tool makers and a wide range of
skilled machine operators who maintain and manage these machines. The increasing role of
this portfolio of occupations vis-à-vis production workers has led to the former enjoying a
larger share of the total wage pie. The share of wages to production workers has fallen from
57.6% of the total wage bill to 48.8%, while that of supervisory and managerial staff6 increased
from 26.1% to 35.8% between 2000 and 2012. The rising disparity in the wages of supervisory
5 It is beyond the scope of this study to understand the impact of interest rate policy on these estimates. 6 The supervisory and managerial staff reported in the ASI dataset captures the category of skilled workers,
while the production workers capture unskilled workers.
.1.2
.3.4
.5
Ratio
s
2000 2002 2004 2006 2008 2010 2012
Year
Profits/ GVA Total Wages /GVA
Total Emoluments/GVA Interest paid/ GVA
Shares of profits, interest paid, emoluments and wages in GVA
Source: Author's calculations based on ASI published statistics, MOSPI
8
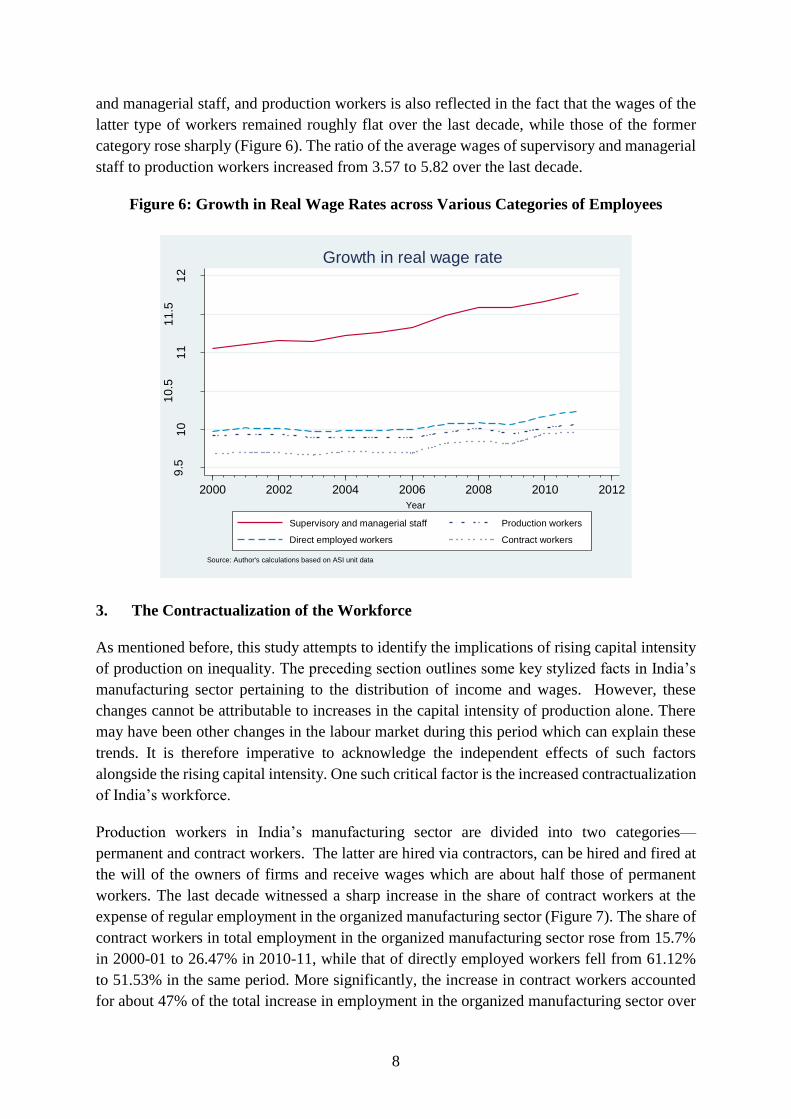
and managerial staff, and production workers is also reflected in the fact that the wages of the
latter type of workers remained roughly flat over the last decade, while those of the former
category rose sharply (Figure 6). The ratio of the average wages of supervisory and managerial
staff to production workers increased from 3.57 to 5.82 over the last decade.
Figure 6: Growth in Real Wage Rates across Various Categories of Employees
3. The Contractualization of the Workforce
As mentioned before, this study attempts to identify the implications of rising capital intensity
of production on inequality. The preceding section outlines some key stylized facts in India’s
manufacturing sector pertaining to the distribution of income and wages. However, these
changes cannot be attributable to increases in the capital intensity of production alone. There
may have been other changes in the labour market during this period which can explain these
trends. It is therefore imperative to acknowledge the independent effects of such factors
alongside the rising capital intensity. One such critical factor is the increased contractualization
of India’s workforce.
Production workers in India’s manufacturing sector are divided into two categories—
permanent and contract workers. The latter are hired via contractors, can be hired and fired at
the will of the owners of firms and receive wages which are about half those of permanent
workers. The last decade witnessed a sharp increase in the share of contract workers at the
expense of regular employment in the organized manufacturing sector (Figure 7). The share of
contract workers in total employment in the organized manufacturing sector rose from 15.7%
in 2000-01 to 26.47% in 2010-11, while that of directly employed workers fell from 61.12%
to 51.53% in the same period. More significantly, the increase in contract workers accounted
for about 47% of the total increase in employment in the organized manufacturing sector over
9.5
10
10.5
11
11.5
12
ln(A
nnu
al w
ag
e r
ate
)
2000 2002 2004 2006 2008 2010 2012
Year
Supervisory and managerial staff Production workers
Direct employed workers Contract workers
Source: Author's calculations based on ASI unit data
Growth in real wage rate

9
the last decade7. Two reasons have been attributed to this increasing informalization. First, the
use of contract workers provides a means of getting around stringent labour regulations,
particularly the Industrial Disputes Act, as contract workers do not come under the purview of
labour laws that are applicable to directly employed workers in labour markets. Second,
increased import competition has led to informalization of industrial labour since the lower
wages of informal workers and the savings made on the expenditure of worker benefits helps
in reducing costs and thus improving competitiveness (Goldar & Aggarwal, 2012).
The contractualization of the workforce though not an implication of the rising capital intensity
of production, may well have affected or driven some of the changes we see in the distribution
of income and wage inequality in the following manner: contract workers are significantly
cheaper, performing the same task as permanent workers. This lowers the average wages paid
to production workers. Furthermore, their presence in the workforce helps the firms’
management diminish the bargaining power of regular workers and exert downward pressure
on their wages. Through these two channels, contract workers help firms lower their wage bill
and improve profitability. By putting downward pressure on the average wages of production
workers, they may also contribute to rising wage inequality between production workers and
the supervisory and managerial staff. Given these effects of contractualization, we need to
control for this phenomenon independently, while studying the effect of rising capital intensity
on distribution of income and wages.
Figure 7: Composition of Employment in Organised Manufacturing Sector
7 The number of contract workers in the organized manufacturing sector increased from 1.17 million in 2000-
01 to 3.04 million in 2010-11, while the number of directly employed workers increased from 4.55 million
to 5.91 million over the same period. The total persons engaged increased from 7.42 million to 11.41 million.
61.12%
15.69%
9.60%
13.59%
50.84%
26.88%
9.85%
12.42%
0
5.0
e+
06
1.0
e+
07
1.5
e+
07
Nu
mb
er
of em
plo
yed
2000-01 2011-12
Source: Author's calculations based on ASI unit data
Number of Employed
Directly employed Employed through contractors
Supervisory and managerial staff Other employees

10
4. Data& Econometric Analysis
4.1 Data
The stylized facts presented above outline the rising capital intensity of production and the
changes observed in the labour market vis-à-vis the distribution of income and wage inequality.
However, the question of whether these changes were indeed the effects of the increasing
mechanization and automation is best answered through an empirical analysis. We address this
issue using factory/plant level data from the Annual Survey of Industries (ASI). The database
covers all factories registered under Sections 2m(i) and 2m(ii) of the Factories Act, 1948 i.e.
those factories employing 10 or more workers using power; and those employing 20 or more
workers without using power. This database provides a wide array of information on each plant.
For each year, firms provide detailed information on aspects such as output, value added, fixed
capital, investment, materials, fuel, total persons engaged, workers and wages and salaries to
all employees (directly employed workers, contract workers, supervisory and managerial staff
and unpaid family workers) It also provides information on the type of ownership, the type of
organization, as well as the start year of each plant. The ASI reports the book value of plant
and machinery both at the beginning and at the end of the fiscal year (net of depreciation).
Our measure of capital in this study is the net value of plant and machinery at the end of the
fiscal year. Employment is measured as the total numbers of persons engaged in a plant. This
is divided into two broad categories: production workers (further subdivided into directly
employed workers and contract workers) and non-production workers (supervisory and
managerial staff). We use these two categories of workers to distinguish between skilled labour
(non production workers) and unskilled labour (production workers). Of course, this
categorization is not ideal as skills are best captured by classifications based either on
educational characteristics or on a much more detailed classification by working tasks.
However, the ASI dataset does not provide us any information on the education or skill level
of workers, therefore the only option we have is to rely on this categorization. The classification
of workers into ‘production’ and ‘non-production’ groups in order to approximate skilled and
unskilled labour respectively is not an uncommon one in the literature.8 International evidence
indicates a close relationship between the production/non-manual status of workers and their
education level (Goldberg and Pavenik 2007). Therefore, in our analysis we use the wage
differential between non-production and production workers as a measure of skill wage gap.
This has been considered a suitable measure for analyzing the impact of globalization on wage
inequality in the literature9.
The time period under consideration in this study is from 2000-01 to 2010-11. There are three
different industrial classifications used in the ASI dataset during this time period. For the
surveys between 1998-99 and 2003-04 the industrial classification used was NIC-1998,
between 2004-05 and 2007-08 it was NIC -2004, and 2008-09 onwards it was NIC-2008. In
8 Meschi, Taymaz & Vivarelli (2011) 9 It may well be the case that this measure is an underestimate of the wage gap since production workers may
include some skilled workers.

11
this study, we undertake a concordance exercise across these different classifications to make
the dataset comparable as per the NIC-1998classification.
The data collected from the ASI are at current prices and any analytical work requires deflating
these variables. An obvious candidate for this is the wholesale price index (WPI) series.
However, we cannot use the WPI as a deflator directly because while ASI follows the NIC
classification of industries, WPI is constructed with a view to capturing price movements based
on nature of commodities and final demand. Therefore, we create a WPI for each of the
industries in the analysis by approximating commodities based on the nature of economic
activities and map NIC activities to WPI commodities10. To deflate wages, however, we use
the Consumer Price Index of Industrial Workers.
The raw data consist of about 384,000 observations over 10 years, with an average of about
38,000 plants surveyed each year. We only study observations corresponding to open plants
and plants with positive values of output, plant and machinery and total persons engaged. A
problem in the ASI dataset is the presence of a large number of outliers. To reduce their
influence in our estimates, we winsorize the data, following Dougherty et al (2013). This
procedure essentially involve top-coding and bottom-coding the 1% tails for each plant-level
variable. In other words, for each year and each variable we replace outliers in the top 1% tail
(bottom 1% tail) with the value of the 99th (1st) percentile of that variable. This procedure was
applied separately to each 2-digit industry.
4.2 Econometric Framework
The proposed empirical specification is as follows:
ln Yfist = i + 1 (K/L)fist + 2 (CW/TW) fist+ 3 (Age) fist +4 (Size Dummy) fist + T + εfist
The outcome variable, Yfist, varies over firm f belonging to industry i in state s at time t. The
dependent variables, which are of interest are the share of profits in GVA; share of wages in
GVA; ratio of skilled (non-production workers) to unskilled (production workers) and the ratio
of their wage rates. We also look at the shares of the wage bill accruing to skilled and unskilled
workers separately. As mentioned previously, the former is the share of the wage bill paid to
managerial and supervisory staff, while the latter is share of the wage bill paid to production
workers. We also control for share of contract workers in total production workers (CW/TW)
in our specification given the discussion in Section 3.T represents the linear time trend, while
i denotes industry fixed effects. We include industry fixed effects to account for any time
invariant industry-specific effects such as industry technology differences, market structure
and degree of competition. In addition to the above, we control for the age of the factory and
its size. We create a dummy variable for the size of the firm and classify factories into three
categories (small, medium and large)11 on the basis of total persons engaged in them. We also
10 Capital is deflated using the WPI created for industry, NIC 29. 11 Small firms are defined as those having less than 50 employees, medium firms have 50-199 employees and
large firms are defined as those having 200 or more workers.

12
introduce a state level time variant infrastructure control (log of tele-density12) in our
specification.
Importantly, this model cannot be estimated using Ordinary Least Squares (OLS). The reason
for this is as follows. The firm’s decision of the technology it adopts for production or its capital
intensity of production is not an exogenous factor. In other words, it is simply not an outside
force but an outcome of decisions made by firms i.e. it is endogenous. Firms may well be
responding to profit incentives while making decisions about technology they choose to
adopt13.That technological change is not an outside force acting on the labour market and wage
inequality, but in fact endogenous has been discussed in the literature (Acemoglu, 2003).For
instance, the spinning and weaving machines of the 19th century were invented because they
were profitable. They were profitable because they replaced the scarce and expensive factors -
- the skilled artisans -- by relatively cheap and abundant factors --unskilled manual labor of
men, women, and children. Similarly, electrical machinery, air-conditioning, large
organizations all were introduced because they presented profit opportunities for entrepreneurs.
Similarly, the share of contract workers may well be endogenous, and a result of firms response
to profit incentives. Reverse causality may arise as firms with low profits maybe incentivized
to hire more contract workers to improve profitability. Similarly, firms with a
disproportionately large labour share in their wage bill might prefer switching to contract
workers to reduce their wage bill.
To address the endogenity problem, we use Instrumental Variable (IV) estimation in our
analysis. We use three instruments in our analysis here—labour market regulations, minimum
wages of the state and the level of financial development. The rationale for using these
instruments is as follows. Given the argument that it is stringencies in labour legislations that
have discouraged firms from hiring workers and instead adopting more capital intensive
techniques of production, we use a measure of the rigidity of labour market regulations of the
state the firm is located in as an instrument. Typically, one would expect the firms which are
located in states with inflexible labour regulations to adopt more capital intensive techniques
of production. Similarly, it has been argued that it is firms in states with more stringent labour
regulation which are incentivized to substitute permanent workers with contract workers (Sen,
Saha, Maiti, 2010). Quantifying differences in LMR across states is a contentious subject in
the existing literature. In our analysis, we use an index of labour market rigidity constructed by
Gupta, Hasan & Kumar (2008b). They create a composite measure of LMR across states by
12 The tele density variable captures the state-wise telephones statistics per 100 population.
13 There are also no compelling theoretical reasons to expect technological change always and everywhere to
be skill-biased. On the contrary, if replacing skilled workers is more profitable, new technologies may attempt
to replace skilled workers, just as interchangeable parts did.

13
combining information from three key studies14. On the basis of this composite index, they
categorize states’ LMR as flexible, neutral and inflexible assigning scores of 1, 0 and -115.
The choice of the level of financial development as an instrument is driven by the fact that
firms located in financially developed states would have increased attractiveness to invest in
capital. Data on index of financial development is obtained from Kumar (2002).Finally, we
include the minimum wage rate of the state as an instrument in our analysis. As is the
requirement of a good instrument, the minimum wage rate16 in a state is highly correlated with
the wages of contract workers. The Contract Labour Act (1970) mandates that wages of
contract workers must not be lower than the prescribed minimum wage, therefore states with
higher minimum wages observe lower share of contract workers in their worforce (Sen at al,
2010). Data on minimum wages is obtained from the Labour Bureau Statistics (various years).
4.3 Results
As explained in the previous section, the reverse causality between the dependent variables on
one hand and capital intensity of production and share of contract workers, on the other hand,
taints the OLS results and provides inconsistent estimates. We therefore estimate the above-
mentioned equation using Instrumental Variables (Table 2). The Wu-Hausman test statistic at
the bottom of the table is statistically significant in each of the specifications confirming that
the endogenous regressors in the model are in fact endogenous and need to be instrumented.
14 They examine state-level indexes of labor regulations developed by Besley and Burgess, Bhattacharjea
(2008), and OECD (2007). The Besley and Burgess measure relies on amendments to the IDA as a whole.
Bhattacharjea’s measure focuses exclusively on Chapter VB of the IDA—i.e, the section that deals with the
requirement for firms to seek government permission for layoffs, retrenchments, and closures. Bhattacharjea
considers not only the content of legislative amendments, but also judicial interpretations to Chapter VB in
assessing the stance of states vis-à-vis labor regulation. The OECD study is based on a survey of experts and
codes progress in introducing changes in recent years to not only regulations dealing with labor issues, but
also the relevant administrative processes and enforcement machinery. The regulations covered by the survey
go well beyond the IDA and include the Factories Act, the Trade Union Act, and Contract Labour Act among
others.
15 Andhra Pradesh, Rajasthan, Tamil Nadu, UP and Karnataka are classified as having flexible labour
regulations. Maharashtra, Orissa and West Bengal are classified as having inflexible labour regulations.
Assam, Bihar, Gujarat, Haryana, Kerala, Madhya Pradesh and Punjab are classified as the neutral states.
16 These wages are determined by respective state governments and vary across states and over time—
background as to how minimum wages are determined.

14
Table 2: Instrumental Variable Analysis
(1) (2) (3) (4) (5) (6)
ln(Profit/
GVA)
ln(All
wages/GVA)
ln(Wage bill to
(NPW)/GVA)
ln(Wage bill
to PW/GVA)
ln(NPW
/PW)
ln(NPW
wage/PW
wage)
ln(K/L) -0.08** -0.25*** 0.23*** -0.30*** 0.21*** 0.10**
(0.04) (0.04) (0.04) (0.03) (0.06) (0.05)
ln(Contract
workers/Total
workers)
1.01***
(0.19)
0.74***
(0.19)
0.43**
(0.20)
-0.15
(0.17)
0.54**
(0.25)
0.74***
(0.22)
ln(Age of firm
in years)
0.04***
(0.02)
0.08***
(0.01)
0.24***
(0.01)
-0.04***
(0.01)
0.19***
(0.01)
0.06***
(0.01)
Size Dummy 0.30*** 0.26*** -0.19*** 0.12** -0.30*** 0.26***
(0.05) (0.06) (0.06) (0.05) (0.08) (0.07)
ln(Tele-
density)
-0.03
(0.02)
0.08***
(0.01)
0.09***
(0.02)
0.03**
(0.01)
0.11***
(0.02)
-0.02
(0.02)
ln(Real
Minimum
Wage)
0.18***
(0.03)
0.11***
(0.03)
-0.09***
(0.03)
Time -0.05*** -0.03*** -0.02*** -0.01 -0.06*** 0.02**
(0.01) (0.01) (0.01) (0.01) (0.01) (0.01)
N 63339 71319 64913 71331 68102 68102
RMSE
Wu-Hausman
Cragg-Donald
statistic
Sargan chi-
square
1.46
24.21***
27.13**
0.14
1.10
28.15***
21.99**
1.26
147.02***
15.95**
0.16
0.97
32.81***
21.91**
0.99
86.41***
8.55**
0.21
0.87
165.23***
8.5**
Robust t statistics are given in brackets. * significant at 10%; ** significant at 5%; *** significant at 1%.
In the first column, the dependent variable is the share of profits in GVA i.e. ln (Profits/GVA).
The coefficient of the capital intensity of production is negative and statistically significant,
suggesting that profitability was in fact lower in firms which witnessed relatively larger
increases in the capital-labour ratio. The coefficient on ln(K/L) suggests that if firms increase
their capital-labour ratio by 1% their profitability will decline by 0.08%. This may well be a
result of the fact that firms require greater financial resources to adopt more capital intensive
techniques of production and this lowers their profits in the short-run. The coefficient on the
share of contract workers in total workforce is positive and significant. This is not surprising
following the discussion on the role of contract workers in improving firm profitability in
Section 3. This result is noteworthy as it seems to suggest that it is the substitution towards
cheaper workers that is driving higher profits and making owners of firms wealthier and not
the substitution towards capital (in the short run). The coefficient on the size dummy is positive
and statistically significant suggesting that larger firms are more profitable. Importantly, we
need to verify if our estimates suffer from a weak instrument problem, meaning that the
explanatory power of the excluded instruments in the first stage regression is too low to provide

15
reliable identification. The Cragg and Donald minimum eigenvalue statistic reported at the
bottom of the table is a test of weak instruments and from this we can reject the null hypothesis
that the set of instruments is weak17. In addition to the requirement that instrumental variables
be correlated with the endogenous regressors, the instruments must also be uncorrelated with
the structural error term. Since our model is overidentified, meaning that the number of
additional instruments exceeds the number of endogenous regressors, we can test whether the
instruments are uncorrelated with the error term. The overidentification test reports Sargan’s
chi-square tests. The insignificant test statistic suggests that our instruments are not invalid.
In the second column, the dependent variable is the share of wage bill to all employees in GVA
i.e. ln(All Wages/GVA). Here, we find that the share of total wage bill in GVA was lower in
firms witnessing relatively larger increase in capital-labour ratio. The coefficient on ln K/L
indicates that as firms increased their capital-labour ratio by 1%, the share of wages in GVA
declined by 0.25%.This suggests that the higher capital intensity of production was squeezing
the share of labour in GVA. It is important to mention that we are unable to use the logarithm
of real minimum wages as an instrument here. Doing so, misspecifies the equation, as this
variable should in fact be included in the structural equation, and not be an excluded exogenous
variable18. This is because firms in states with a higher minimum wage will typically have to
pay higher wages, resulting in the wage bill eating into a larger share of GVA. The coefficient
on the log of real minimum wages is positive and statistically significant, confirming this. The
other two instruments (index of labour market regulations and level of financial development
of the state) are valid. Also, from the Cragg-Donald minimum eigen value statistic, we can
reject the null hypothesis of weak instruments. The coefficients on the age of the firm and the
size dummy are positive and statistically significant suggesting that older and larger firms have
a larger share of wage bill in their GVA.
Next, we disaggregate the wage bill into two components i.e. wage bill accruing to non-
production workers/skilled workers (ln (Wage Bill to NPW/GVA)) and that accruing to
production workers /unskilled workers (ln (Wage Bill to PW/GVA)). Here, we find that the
share of wage bill going to skilled workers is higher in firms witnessing relatively larger
increases in the capital-labour ratio (column 3)19. On the other hand, the share of wage bill
going to unskilled workers was lower in such firms (column 4)20.It is worth noting that the
coefficient on the variable age of the firm, is positive and significant in column 3, but negative
and significant in column 4. This suggests that the share of the wage bill going to supervisors
17 The null hypothesis of each Stock and Yogo’s tests is that the set of instruments is weak. To perform these
tests, we must first choose either the largest relative bias of the 2SLS estimator we are willing to tolerate or
the largest rejection rate of a nominal 5% Wald test we are willing to tolerate. Since the test statistic exceeds
the critical value in each case, we can conclude that our instruments are not weak.
18 The Sargan & Basmann’s chi-square test reports a statistically significant test statistic when we include real
minimum wages as an instrument, suggesting that we either have an invalid instrument or incorrectly
specified structural equation. 19 In this equation, we use the log of real minimum wages as an instrument since the Sargan & Basmann’s chi-
square test report a statistically insignificant test statistic.
20 Here, we cannot use the log of real minimum wages as an excluded exogenous variable as the Sargan &
Basmann’s chi-square test report a statistically significant test statistic. It needs to included in the structural
equation.

16
and managers in older firms is greater than in younger firms. On the other hand, the share of
wage bill going to production workers is higher in younger firms. Also, larger firms have a
bigger share of their wage bill being paid out to production workers as compared to smaller
firms. Not surprisingly, the log of real minimum wage bill is positive and statistically
significant in column 4 as higher minimum wages drive up the wages of production (and not
non-production workers).
In the fifth column, the dependent variable is the ratio of non-production /skilled to production
/unskilled workers (ln(NPW/PW)). Here, we find that firms experiencing relatively larger gains
in capital-labour ratio observed relatively larger increases in proportion of skilled to unskilled
workers. A 1% increase in the capital intensity of production resulted in a 0.21% increase in
the ratio of skilled to unskilled workers. This result underlines the existence of capital-skill
complementarity, which means that ceteris paribus, firms with higher capital intensity also
employ a higher share of skilled workers. We also find that older firms have a higher ratio of
skilled to unskilled workers as compared to younger firms. The coefficient on the size dummy
is negative and statistically significant suggesting that larger firms have a lower ratio of skilled
to unskilled workers21. In this equation, we use all three instruments as they are valid and not
weak.
In the last column, we find that the rising capital intensity of production has also exacerbated
wage inequality and resulted in growing divergence in wages earned between skilled and
unskilled workers. The coefficient on the capital intensity of production is positive and
statistically significant suggesting that firms observing relatively larger increases in the capital-
labour ratio saw relatively larger increases in wage differential between production and
nonproduction workers (ln NPW wage/PW wage). It needs to be noted here that though
statistically significant, the size of the coefficient on the capital labour ratio (0.10) is smaller
than the size of the coefficient on the share of contract workers (0.74). This suggests that hiring
of contract workers accentuates wage inequality between the production workers and
supervisory and managerial staff. This is a result of the fact that greater presence of contract
workers in the firms’ workforce helps reducing the average wages of production workers not
only because this category of workers receives lower wages, but also because they exert a
downward pressure on wages of directly employed workers (Sen at al, 2010 and Saha et al
2013). Importantly, we find that the wage disparity between skilled and unskilled workers is
higher in older and larger firms. Furthermore, in this specification we cannot use the log of real
minimum wages as an excluded exogenous variable. We therefore include it in the structural
equation and find its sign to be negative and significant. This is because a higher minimum
wage put upward pressure on the average wages of production workers, thereby reducing
inequality between production and non-production workers.
The results of the first stage of the IV are reported in the appendix and they are not surprising.
The coefficient on the labour regulation index is negative and statistically significant in both
columns suggesting that firms in states with more inflexible labour regulation are incentivized
21 Firm size is largely driven by the production workers and not non-production workers, as the latter are quite
small as a percentage of total persons engaged.

17
to use more capital intensive techniques of production and have a greater share of contract
workers in their workforce. Also, firms in states where the level of the minimum wage rate is
higher, employ a greater share of contract workers. However, we do not find the coefficient on
the level of the financial development of the state to be statistically significant.
5. Conclusion
That mechanisation and automation of production processes threaten employment for India’s
low-skilled/unskilled workforce is a well-known fact. However, doomsday prediction of the
world in which everything is done by machines is also unrealistic. Nevertheless, such prospects
are hugely worrying in a country such as India looking to create employment for its rapidly
increasingly working age population. Not only has the capital intensity of production been
increasing sharply, but recent economic growth has benefited industries which rely more on
skilled workers and capital as opposed to unskilled/low skilled workers. Given these trends,
the prospects for labour intensive industrialization appear bleak. As technology makes it easier
to substitute capital for labor, an increase in capital intensity of production over time is
inevitable and we can certainly not resist the adoption of new technology only to preserve jobs.
Therefore, the conventional wisdom to focus on labour intensive industries to create more jobs
needs to be re-examined. Unlike China and its neighbours, India may not be able to climb up
the ladder of development simply by recruiting its many unskilled people to manufacture goods
cheaply.
In this paper, we attempt to examine the effects of growing capital intensity (and associated
technological change) on inequality of wages and earnings in organised manufacturing in India.
The theoretical expectation is that growing capital intensity would not only increase the share
of capital in value added, but also skill premium, thus increasing inequality. The increase in
the wage gap between the managerial and supervisory staff (high-skilled) and production
workers (low-skilled), and the reduction in share of aggregate value added going to labour, in
our dataset, is consistent with this expectation. However, the share of managerial and
supervisory staff in total employment seems to have remained stagnant, while the share of
contract workers in production workers has increased sharply over the last decade. Arguably,
had there been no growth of contract workers, the wage-gap between the managerial and
supervisory staff and the production workers would have increased much less. In other words,
it is not just the growth of capital intensity but also the growth of contract workers that explains
the growth of inequality. At the same time, it is also possible that the salaries of the managerial
and supervisory staff were growing not so much because of growing demand from
manufacturing but intensifying competition with the services sector for such staff.
It is important to mention that in India, unlike in the developed world, skill biased technological
change was not accompanied by a large increase in the supply of more educated workers. This
may well have exacerbated wage disparity. The serious supply side constraint is evident from
the fact that only 4% of total workers engaged in the manufacturing sector have any technical
education and only 27% of workers in manufacturing are vocationally trained, of which 86%
are non-formally trained (Mehrotra et al 2013).

18
The government’s ambitious Skill India program, with a target to skill 40 crore workers over
the next five years attempts to address this gap. However, assembly line methods of skill
development which produce large numbers of electricians, machine operators, plumbers,
carpenters, electricians and other such narrowly skilled and certified persons will not address
India’s skills challenge. In an uncertain and dynamic world where new technologies will
disrupt old forms of production and alter processes of production, it is not possible to predict
what the nature of jobs will be in the future and precisely what skills workers will need to
perform these jobs. Consequently, workers may end up being imparted skills they may actually
not put to any use. For skill development systems to be effective, they need to be able to respond
to technological changes in the economy. This requires providing young workers a broad
foundation of basic skills and a minimum level of educational attainment so that they are able
to learn the requisite skills in the enterprises where the jobs are being created. Increasing the
supply of skilled workers in such a manner will help reduce the growing divergence in wages of
skilled and unskilled workers. However, the phenomenon of contractualization poses a serious
threat to the skilling challenge. Workers are discouraged from acquiring skills as they feel that
even though skilling-up may result in improved productivity, it may not translate into higher
wages as firms will prefer to hire them as cheap contract labour.
APPENDIX A: First Stage Regression from IV Analysis
(1) ln (K/L) (2) Ln(CW/TW)
Labour Regulations Index -0.36*** -0.06***
(0.01) (0.00)
Financial Development Index 0.19*** -0.02***
(0.01) (0.01)
ln(Real Minimum Wage) -0.59*** -0.04***
(0.03) (0.02)
ln(Age of firm in years) -0.47*** -0.09***
(0.01) (0.00)
Size Dummy 0.59*** -0.14***
(0.01) (0.00)
ln(Teledensity) 0.27*** -0.01
(0.01) (0.01)
Time -0.01 0.03***
(0.00) (0.00)
N 212851 77545

19
References
Acemoglu, D.2002. “Technical Change, Inequality, and the Labor Market.” Journal of
Economic Literature, V 40: 7-72
Besley, T. and R. Burgess. 2004. “Can regulation hinder economic performance? Evidence
from India.” Quarterly Journal of Economics, 119(1): 91-134.
Bhattacharjea, A. 2008. "How do Indian firms respond to employment protection
legislation?"Mimeo.
Bhattacharjea, A. 2006. “Labour market regulation and industrial performance in India: A
critical review of the empirical evidence.” The Indian Journal of Labour Economics,
49(2): 211-32. Available at http://ssrn.com/abstract=954908.
Dougherty, S & Robles, V and Krishna,K. 2011."Employment Protection Legislation and
Plant-Level Productivity in India." NBER Working Papers 17693, National Bureau of
Economic Research, Inc.
Goldar, B. 2000. “Employment Growth in Organised Manufacturing in India”. Economic and
Political Weekly, Vol 35, No 14, April 1-7.
Goldar, B. 2011. “Growth in Organized Manufacturing Employment in Recent Years”.
Economic and Political Weekly, February 12, 2011.
Goldar,B. 2013. “Sustaining a High Rate of Industrial Growth in India in the Next 10 Years”,
Paper presented at a Workshop on ‘Sustaining High Growth in India’, 25-26 July 2013,
Institute of Economic Growth, Delhi.
Goldar, B and Aggarwal,S. 2012. “Informalization of Industrial Labour in India: Effect of
labour market rigidities and import competition”. Developing Economies, June, pp.
141-69.
Goldar, B. 2013.:“Wages and Wage Share in India During the Post Reform Period.” Indian
Journal of Labour Economics. Vol. 56 (1), 2013
Gupta, P., R. Hasan, and U. Kumar. 2008a. “What constrains Indian manufacturing?”
Working Paper no. 211. Indian Council for Research on International Economic
Relations.
Gupta, P., R. Hasan, and U. Kumar. 2008b. “Big Reforms but Small Payoffs: Explaining
the Weak Record of Growth in Indian Manufacturing”, In S. Bery, B. Bosworth, and
A. Panagariya (eds.), India Policy Forum, vol. 5, Sage, Delhi: 59-108.
Guscina, A. 2006.“Effects of Globalization on Labor’s Share in National Income.” IMF
Working Paper no. 294.
Hasan, R. 2000. “The Impact of Imported and Domestic Technologies on Productivity:
Evidence from Indian Manufacturing Firms”No 6, Economics Study Area Working
Papers from East-West Center, Economics Study Area

20
Hasan, R., D. Mitra, and A. Sundaram 2007. “The Determinants of Capital Intensity in
Manufacturing: The Role of Factor Market Imperfections.” Indian Growth and
Development Review 11/2013;
Hasan, R., K. Robert, and L. Jandoc .2012. “Labor Regulations and the Firm Size
Distribution in Indian Manufacturing”, Columbia Program on Indian Economic
Policies, Working Paper No. 20123.
Hasan, R., S. Lamba, and A. Sen Gupta. 2012. “Growth, Structural Change, and Poverty
Reduction in India”, Working Paper, India Resident Mission, Asian Development
Bank.
Kumar,R. 2002. “The Impact of Regional Infrastructure Investment in India”, Regional
Studies, 36(2).
Meschi, E., E.Taymaz and M.Vivarelli.2011. “Trade, technology and skills: Evidence from
Turkish microdata”Labour Economics 18 (2011) S60–S70.
Mehrotra, S., Gandhi A., Sahoo B.K., and Saha P. 2012. “Creating Employment during the
12th Plan”, Economic and Political Weekly, Vol. XLVII, No. 19, pp. 63-73.
Mehrotra, S, Gandhi A, Sahoo B.K. and Saha P. 2013. “Turnaround in India’s employment
story: Silver Lining amidst joblessness and informalization?” Economic andPolitical
Weekly, Vol XLVIII, No 35.
Mehrotra, S, Gandhi A and Sahoo B.K. 2013.“Estimating the Skill Gap on a Realistic Basis
for 2022.”IAMR Occasional Paper No. 1/2013
Mehrotra,S., Parida J., Sinha.S, and Gandhi, A.2014. “Explaining Employment Trends in
the Indian Economy: 1993-94 to 2011-12” Economic and Political Weekly, Vol XLIX
No. 32.
Sen, K, Saha,B and Maiti,D (2010). “Trade Openness, Labour Institutions and Flexibility:
Theory and Evidence from India” BWPI Working Paperno 123, Brooks World Poverty
Institute, University of Manchester.
Sen, K and Das, D (2014). “Where Have All the Workers Gone? The Puzzle of Declining
Labour Intensity in Organized Indian Manufacturing” DEPP Working Paper No. 36.
Available at
htttp://www.seed.manchester.ac.uk/subjects/idpm/research/publications/wp/depp/depp
-wp36/
Sood, A, Nath, P and Ghosh, S (2014). “Deregulating Capital, Regulating Labour: The
Dynamics in the Manufacturing Sector in India” Economic andPolitical Weekly, Vol
XLVIX, No 26-27.

1
LATEST ICRIER’S WORKING PAPERS
NO. TITLE AUTHOR YEAR
312 DIVERSIFYING INDIA’S
SERVICES EXPORTS
THROUGH SEZS:
STATUS, ISSUES AND THE
WAY FORWARD
ARPITA MUKHERJEE
SAUBHIK DEB
SHREYA DEORA
TANU M. GOYAL
BHAVOOK BHARDWAJ
DECEMBER
2015
311 TRENDS AND ECONOMIC
DYNAMICS OF GUAR IN INDIA
DURGESH K. RAI OCTOBER
2015
310 DRUG QUALITY AND SAFETY
ISSUES IN INDIA
MAULIK CHOKSHI
RAHUL MONGIA
VASUDHA WATTAL
SEPTEMBER
2015
309 ADMINISTRATIVE
STRUCTURE AND FUNCTIONS
OF DRUG REGULATORY
AUTHORITIES IN INDIA
NUPUR CHOWDHURY
PALLAVI JOSHI
ARPITA PATNAIK
BEENA SARASWATHY
SEPTEMBER
2015
308 HUMAN CAPITAL POTENTIAL
OF INDIA’S FUTURE
WORKFORCE
ALI MEHDI
DIVYA CHAUDHRY SEPTEMBER
2015
307 RATIONALISING FERTILISER
SUBSIDY IN INDIA: KEY
ISSUES AND POLICY OPTIONS
ASHOK GULATI
PRITHA BANERJEE
AUGUST
2015
306 REIMAGINING INDIA’S
URBAN FUTURE
A FRAMEWORK FOR
SECURING HIGH-GROWTH,
LOW-CARBON, CLIMATE-
RESILIENT URBAN
DEVELOPMENT IN INDIA
MEENU TEWARI
ZEBA AZIZ
MITCHELL COOK
AMRITA GOLDAR
INDRO RAY
SAON RAY SAHANA
ROYCHOWDHURY
VIDHYA UNNIKRISHNAN
AUGUST
2015
305 LOW CARBON PATHWAYS HIMANSHU GUPTA JUNE 2015
304 IS THE RUPEE OVER-VALUED? JAIMINI BHAGWATI
ABHEEK BARUA
M. SHUHEB KHAN
JUNE 2015
303 CREATING MANUFACTURING
JOBS IN INDIA: HAS
OPENNESS TO TRADE REALLY
HELPED?
PANKAJ VASHISHT JUNE 2015
302 CREDIT POLICY FOR
AGRICULTURE IN INDIA – AN
EVALUATION
SUPPORTING INDIAN FARMS
THE SMART WAY:
RATIONALISING SUBSIDIES
AND INVESTMENTS FOR
FASTER, INCLUSIVE AND
SUSTAINABLE GROWTH
ANWARUL HODA
PRERNA TERWAY
JUNE 2015

0
About ICRIER
Established in August 1981, ICRIER is an autonomous, policy-oriented, not-for-profit,
economic policy think tank. ICRIER's main focus is to enhance the knowledge content of
policy making by undertaking analytical research that is targeted at informing India's policy
makers and also at improving the interface with the global economy. ICRIER's office is located
in the institutional complex of India Habitat Centre, New Delhi.
ICRIER's Board of Governors includes leading academicians, policymakers, and
representatives from the private sector. Dr. Isher Ahluwalia is ICRIER's chairperson. Dr. Rajat
Kathuria is Director and Chief Executive.
ICRIER conducts thematic research in the following seven thrust areas:
Macro-economic Management in an Open Economy
Trade, Openness, Restructuring and Competitiveness
Financial Sector Liberalisation and Regulation
WTO-related Issues
Regional Economic Co-operation with Focus on South Asia
Strategic Aspects of India's International Economic Relations
Environment and Climate Change
To effectively disseminate research findings, ICRIER organises workshops, seminars and
conferences to bring together academicians, policymakers, representatives from industry and
media to create a more informed understanding on issues of major policy interest. ICRIER
routinely invites distinguished scholars and policymakers from around the world to deliver
public lectures and give seminars on economic themes of interest to contemporary India.