working paper 373 burden of disease and climate interactions: an illustrative study of surat … ·...
TRANSCRIPT

Working Paper 373
Burden of Disease and Climate
Interactions: An Illustrative
Study of Surat City, India
Amrita Goldar
Meenu Tewari
Flavy Sen
April 2019
INDIAN COUNCIL FOR RESEARCH ON INTERNATIONAL ECONOMIC RELATIONS
Table of Contents
Acknowledgements ................................................................................................................... i
Abstract ..................................................................................................................................... ii
1. Introduction ........................................................................................................................ 1
2. Climate Adaptation and Vector Borne Disease: A Summary of the Existing
Literature ............................................................................................................................ 2
3. Disease Incidence and Climate Interactions .................................................................... 4
4. Climate Normals and Future Projections ........................................................................ 7
5. Malaria Forecasts for Surat ............................................................................................ 11
6. Cost Effectiveness of Interventions ................................................................................ 13
7. Calculating Cost Effectiveness ........................................................................................ 25
8. Conclusions and Lessons for Surat ................................................................................ 27
References ............................................................................................................................... 28
Annexure ................................................................................................................................. 31
List of Tables
Table 1: Climate Models with Results Available ............................................................... 8
Table 2: Age Distribution of Malaria Cases in Surat ........................................................ 16
Table 3: Industry-wise Distribution of Workforce ........................................................... 16
Table 4: Estimate of Employment by Industry Type in 2011-11, Gujarat ....................... 17
Table 5: Average Wages in Urban Gujarat ....................................................................... 17
Table 6: Economic Value of Workdays Lost to Illness .................................................... 18
Table 7: Estimates of Average Expenditure on Health in Gujarat .................................... 19
Table 8: Value of Treatment Costs for Illness .................................................................. 19
Table 9: Cost Incurred Per year for Bed nets Usage ......................................................... 20
Table 10: Cost and Product Ownership for Bed nets in Surat ............................................ 21
Table 11: Cost and Usage of Mosquito Repellents in Surat ............................................... 21
Table 12: Estimated Population of Surat District- 2006 to 2051 (in Million) .................... 21
Table 13: Microeconomic Disease Prevention Costs in Surat ............................................ 22
List of Figures
Figure 1: Diagrammatic Representation of Malaria Transmission ................................... 5
Figure 2: Malaria Cases in Surat ....................................................................................... 5
Figure 3: History of Malaria Cases in Surat Juxtaposed with Event History .................... 6
Figure 4-7: Surat Temperature Normals and Projections ..................................................... 9
Figure 8-10: Surat Precipitation Normals and Projections ................................................... 10
Figure 11: Scatter Diagram for Surat’s Malaria Cases Reported and VECTRI Model’s
EIR Results ...................................................................................................... 12
Figure 12: Seasonality of Disease Incidence ..................................................................... 13
Figure 13: Methodology for the Estimation Process ......................................................... 15
Figure 14: Organogram of VBDC Department ................................................................. 25
Figure 15: Costs of Malaria Incidence for Surat City ....................................................... 26
i
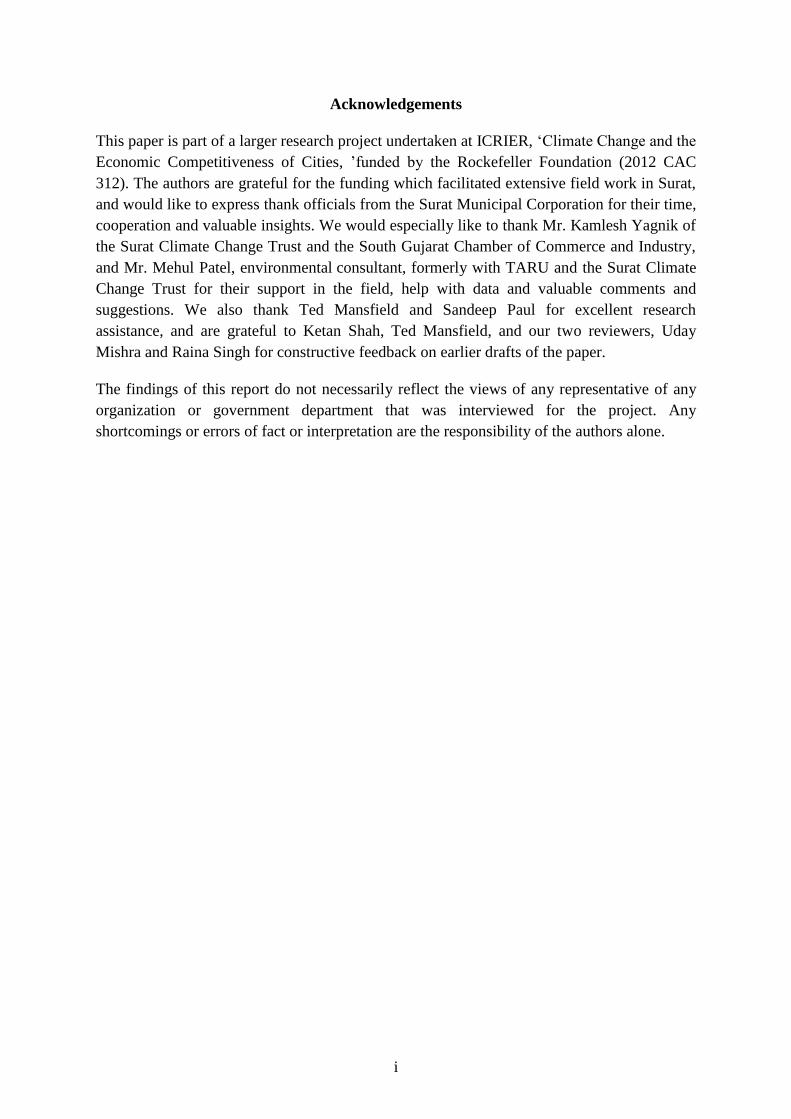
Acknowledgements
This paper is part of a larger research project undertaken at ICRIER, ‘Climate Change and the
Economic Competitiveness of Cities, ’funded by the Rockefeller Foundation (2012 CAC
312). The authors are grateful for the funding which facilitated extensive field work in Surat,
and would like to express thank officials from the Surat Municipal Corporation for their time,
cooperation and valuable insights. We would especially like to thank Mr. Kamlesh Yagnik of
the Surat Climate Change Trust and the South Gujarat Chamber of Commerce and Industry,
and Mr. Mehul Patel, environmental consultant, formerly with TARU and the Surat Climate
Change Trust for their support in the field, help with data and valuable comments and
suggestions. We also thank Ted Mansfield and Sandeep Paul for excellent research
assistance, and are grateful to Ketan Shah, Ted Mansfield, and our two reviewers, Uday
Mishra and Raina Singh for constructive feedback on earlier drafts of the paper.
The findings of this report do not necessarily reflect the views of any representative of any
organization or government department that was interviewed for the project. Any
shortcomings or errors of fact or interpretation are the responsibility of the authors alone.
ii
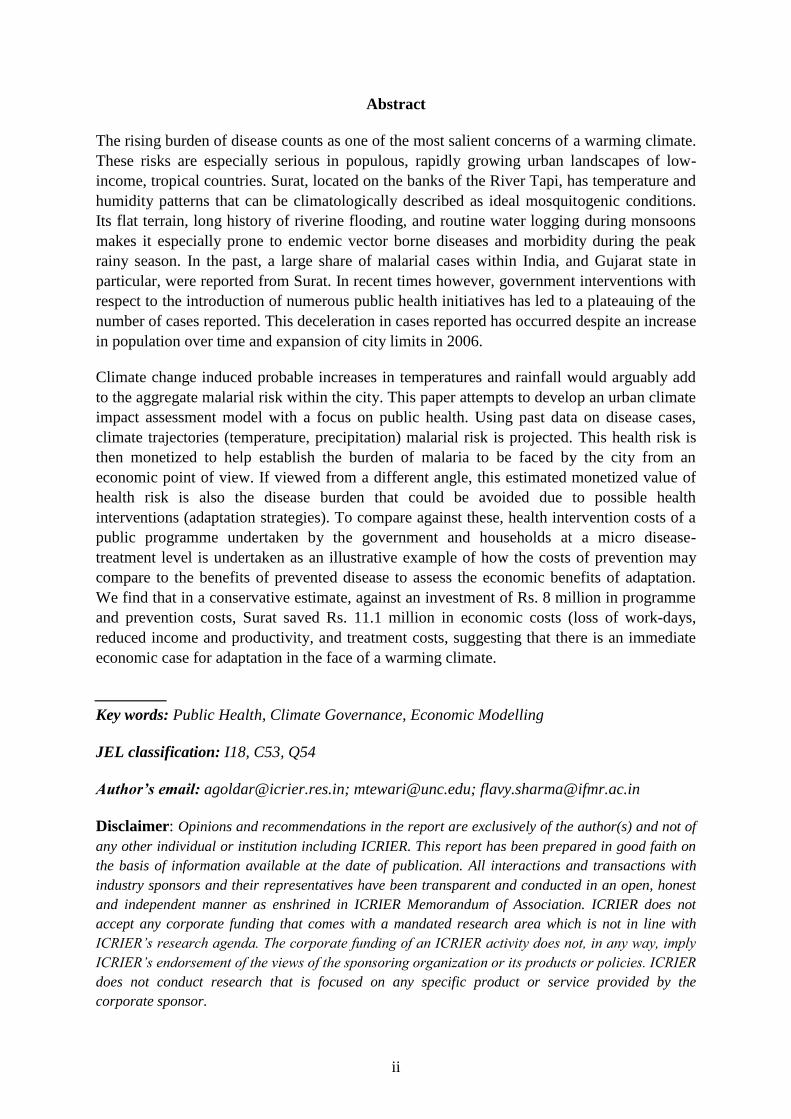
Abstract
The rising burden of disease counts as one of the most salient concerns of a warming climate.
These risks are especially serious in populous, rapidly growing urban landscapes of low-
income, tropical countries. Surat, located on the banks of the River Tapi, has temperature and
humidity patterns that can be climatologically described as ideal mosquitogenic conditions.
Its flat terrain, long history of riverine flooding, and routine water logging during monsoons
makes it especially prone to endemic vector borne diseases and morbidity during the peak
rainy season. In the past, a large share of malarial cases within India, and Gujarat state in
particular, were reported from Surat. In recent times however, government interventions with
respect to the introduction of numerous public health initiatives has led to a plateauing of the
number of cases reported. This deceleration in cases reported has occurred despite an increase
in population over time and expansion of city limits in 2006.
Climate change induced probable increases in temperatures and rainfall would arguably add
to the aggregate malarial risk within the city. This paper attempts to develop an urban climate
impact assessment model with a focus on public health. Using past data on disease cases,
climate trajectories (temperature, precipitation) malarial risk is projected. This health risk is
then monetized to help establish the burden of malaria to be faced by the city from an
economic point of view. If viewed from a different angle, this estimated monetized value of
health risk is also the disease burden that could be avoided due to possible health
interventions (adaptation strategies). To compare against these, health intervention costs of a
public programme undertaken by the government and households at a micro disease-
treatment level is undertaken as an illustrative example of how the costs of prevention may
compare to the benefits of prevented disease to assess the economic benefits of adaptation.
We find that in a conservative estimate, against an investment of Rs. 8 million in programme
and prevention costs, Surat saved Rs. 11.1 million in economic costs (loss of work-days,
reduced income and productivity, and treatment costs, suggesting that there is an immediate
economic case for adaptation in the face of a warming climate.
_________
Key words: Public Health, Climate Governance, Economic Modelling
JEL classification: I18, C53, Q54
Author’s email: [email protected]; [email protected]; [email protected]
Disclaimer: Opinions and recommendations in the report are exclusively of the author(s) and not of
any other individual or institution including ICRIER. This report has been prepared in good faith on
the basis of information available at the date of publication. All interactions and transactions with
industry sponsors and their representatives have been transparent and conducted in an open, honest
and independent manner as enshrined in ICRIER Memorandum of Association. ICRIER does not
accept any corporate funding that comes with a mandated research area which is not in line with
ICRIER’s research agenda. The corporate funding of an ICRIER activity does not, in any way, imply
ICRIER’s endorsement of the views of the sponsoring organization or its products or policies. ICRIER
does not conduct research that is focused on any specific product or service provided by the
corporate sponsor.
1
Burden of Disease and Climate Interactions:
An Illustrative Study of Surat City, India1
Amrita Goldar,2 Meenu Tewari
3 and Flavy Sen
4
1. Introduction
Malaria is a leading source of morbidity and mortality in India. An estimated 1.5 million
confirmed cases are reported annually by the National Vector Borne Disease Control
Programme (NVBDCP), and more than two-thirds of the Indian population lives in malaria-
prone zones, with the highest number of cases reported from the states of Orissa, Gujarat,
Jharkhand, West Bengal, North Eastern States, Chhattisgarh, and Madhya Pradesh (Kumar, et
al., 2007; Sarika and Chugh, 2011).5
Malaria is curable if effective treatment is started early. Delay in treatment may lead to
serious consequences including death. Prompt and effective treatment is also important for
controlling the transmission of malaria. Estimates show that out of 4.2 million disability
adjusted life years lost due to vector borne diseases, malaria alone accounts for an estimated
1.85 million years of loss per annum in India (Peters, 2001; Kumar, et al., 2007; Sarika and
Chugh, 2011). The groups most vulnerable to risk of death due to malaria are children under
five years of age, pregnant women and those with compromised immunity (Sarika and
Chugh, 2011). However the largest risk of mobility and economic loss due to ill health and
lost wages is often borne by low income communities, migrants and others living in flood
prone areas inadequately served by basic sewerage and solid waste management services.
This paper contributes to the available literature on climate adaptation and vector borne
disease by estimating the costs and benefits of action by urban local governments due to
climate induced malaria incidence. Focusing on the case of Surat, we estimate the costs
incurred by households (prevention costs) and government (health department) programme
costs, and weigh them against benefits in terms of avoided morbidity and its valuation.
The rest of the paper is organized as follows. Section 2 presents a summary of the literature
on climate adaptation and vector borne diseases to show how limited the existing work on the
quantification of adaptation interventions still is. Section 3 introduces disease statistics in
Surat. Section 4 presents climate normals and projections for Surat. Section 5 forecasts
1 We are grateful to the Rockefeller Foundation for generous funding for the field work associated with this
study. This study is part of ICRIER’s CAC 312, 2012 grant. We thank Ketan Shah and Ted Mansfield,
both former graduate students at the University of North Carolina at Chapel Hill, for very useful feedback
on an earlier draft of the paper. 2 Fellow, Indian Council for Research on International Economic Relations (ICRIER).
3 Associate Professor, University of North Carolina at Chapel Hill.
4 Former intern, Indian Council for Research on International Economic Relations (ICRIER).
5 In India, the epidemiology of malaria is complex because of geo-ecological diversity, multiethnicity, and
wide distribution of nine anopheline vectors transmitting three Plasmodial species: P. falciparum, P. vivax,
and P. malariae. Of these malaria vectors, An. stephensi is largely responsible for malaria in urban and
industrial areas while An. culicifacies is the vector of rural and peri-urban malaria in peninsular India. An.
culicifacies complex is responsible for 60-70% malaria cases occurring annually in India. In terms of
plasmodial species, a large part of total malaria cases (40–50%) are due to Plasmodium falciparum (Kumar,
et al. 2007; Sarika and Chugh, 2011).
2
malarial incidence in Surat given climate projections. Section 5 estimates the cost
effectiveness of adaptation interventions in Surat, and section 6 concludes.
2. Climate Adaptation and Vector Borne Disease: A Summary of the Existing
Literature6
Previous studies on climate change adaptation and vector-borne disease have largely focused
on the costs imposed by increased disease incidence under a changing climate (mainly
emphasizing treatment costs). Although preventive adaptations, such as vaccine development
and vector surveillance, are noted as possible adaptation strategies in recent reviews, few
quantitative assessments exist of such interventions. For this paper, we were able to identify
only six studies that considered vector-borne disease incidence in the context of climate
change adaptation. Of these, two studies estimate malaria treatment costs using a simple
projection model (Ramakrishnan, 2011; Ebi, 2008); one demonstrates the application of a
more advanced model to provide decision support for a malaria warning system (MacLeod et
al., 2015); one provides a framework for modeling malaria risk at an urban scale (Garg et al.,
2009). Two additional studies apply ecological niche models to model vector distributions
and, in turn, human exposure to disease risk (Gonzalez et al., 2010; Beebe et al., 2009).
Ramakrishnan (2011) and Ebi (2008) use a dose-response relationship linking CO2
concentrations and the relative risk of malaria incidence developed by the World Health
Organization to estimate adaptation costs associated with future incidence of malaria. Using
variations in this relationship associated with different emissions scenarios, both of these
papers project spikes in malarial outcomes in the future using baseline malaria incidence.
Ramakrishnan estimates a 1–2% increase in India by 2030 relative to malaria incidence in
2006, contingent on the assumed emissions scenario. Ebi employs the same method at a
global scale, estimating a 5% increase by 2030 relative to baseline incidence. Ebi and
Ramakrishnan then both estimate the treatment costs associated with excess malaria cases
attributable to climate change. These costs may be considered a reactive adaptation to climate
change (i.e., an effort to remain at “status quo” despite increased malaria incidence in the
future). While these studies provide some perspective on the future costs of malaria in a
changing climate, the relative risk relationship linking CO2 to malaria directly limits this
framework’s ability to consider costs and benefits of disease burden mitigation beyond
emissions reduction scenarios that slow the growth of CO2 concentrations in the future.
Overall, the method employed in Ramakrishnan and Ebi has its limits for assessing the
benefits of climate change adaptation in the context of vector-borne diseases.
To offer improved malaria forecasting models, some researchers, such as MacLeod et al.
(2015) link downscaled climate models (i.e., local future temperature and precipitation
estimates) to malaria models that forecast incidence based on these climate drivers. While
this approach offers a more nuanced method to project future malaria incidence at smaller
scales, this framework is still limited in its ability to consider adaptation actions. Without a
model that first links climate drivers to mosquito populations and then mosquito populations
6 We thank Ted Mansfield for helping us compile this literature.

3
to malaria incidence, it is not possible to directly estimate the impact of adaptive
interventions on disease outcomes such as, say, urban drainage improvements that reduce the
frequency of standing water on malaria incidence. Similarly, the efficacy of interventions that
influence the mosquito to human transmission pathway, such as provision of bednets, will be
difficult to estimate in a future climate when mosquito populations may also be affected by
climate drivers. Still, McLeod’s approach has merits and can be instructive illustrators of
outcomes in given scenarios.
A framework for improving projections of malaria incidence and adaptation benefits is
developed by Garg et al. (2009) in a case study of malaria risk in India . The authors
acknowledge the complexity of vector-borne disease transmission in urban areas and attempt
to include a more nuanced causal understanding of transmission in a straightforward
generalized model. Specifically, Garg et al. (2009) conceptually link changing climactic
conditions at the local scale (e.g., temperature and precipitation) and secondary variables
(e.g., standing water and vegetation growth) and consider potential mediators of risk, such as
economic development and planned adaptation in their projection model to present a
“stylized interaction” of these three variables. They use these interactions to illustrate how
different adaption scenarios (e.g., investing in preventive adaptation measures such as
improved urban drainage or education campaigns) may be compared. However, they do not
attempt to fit the proposed model to any observed data or estimate costs and benefits.
A promising future direction for urban-scale models of vector-borne disease incidence may
be explicit modeling of vector populations based on climate drivers, which could then be
linked to human exposure to estimate disease incidence using a two-stage model. Gonzalez et
al. (2010) develop an ecological niche model that uses a combination of climate variables
(e.g., temperature and precipitation) and physical variables (e.g., elevation and slope) to
estimate the distribution of vector species in North America under a changing climate. The
authors then overlay future population distributions and future vector distribution estimates to
produce a preliminary estimation of human health risks. Similarly, Beebe et al. (2009) use
ecological niche models to analyze how some adaptations may have negative health impacts
by inadvertently increasing vector populations. Most of these models however, are at the
national scales and are not yet downscaled to urban scenarios. Calibration of such a
downscaled model may be difficult, and data availability at the urban scale may present a
barrier. As such, none of them estimate actual economic costs and benefits.
Overall, existing studies of climate change adaptation in the context of vector-borne disease
often employ modeling techniques that lack the specificity required to accurately model the
health benefits of climate change adaptations. While existing studies fall short of effectively
estimating the benefits of climate change adaptation on vector-borne disease incidence,
emerging methodological approaches provide a promising framework for doing so in future
studies.
Keeping in mind the caveats about the limits of data availability and the complications of
downscaling global models to urban scales, we turn to a simpler monetization of Surat’s
efforts to use a number of public health initiatives to successfully control the rise of vector

4
borne diseases, particularly malaria, in the face of a history of flooding and water logging that
has been aggravated by climate changes. Our goal is to assess programme costs and compare
them with benefits accrued to examine whether an immediate economic case for adaptation
exists.
3. Disease Incidence and Climate Interactions
Since Mosquito breeding, survival and their disease transmission efficiency is influenced by
local climate patterns (rain, temperature and humidity), most vector born diseases have a
strong seasonal trend. A similar pattern is observable in Surat’s case as well. It is this
predictability of disease onset with respect to seasonal patterns which provides an opportunity
to researchers to forecast disease incidences and help in building better preparedness for high
disease transmission seasons as well as climate resilience in general.
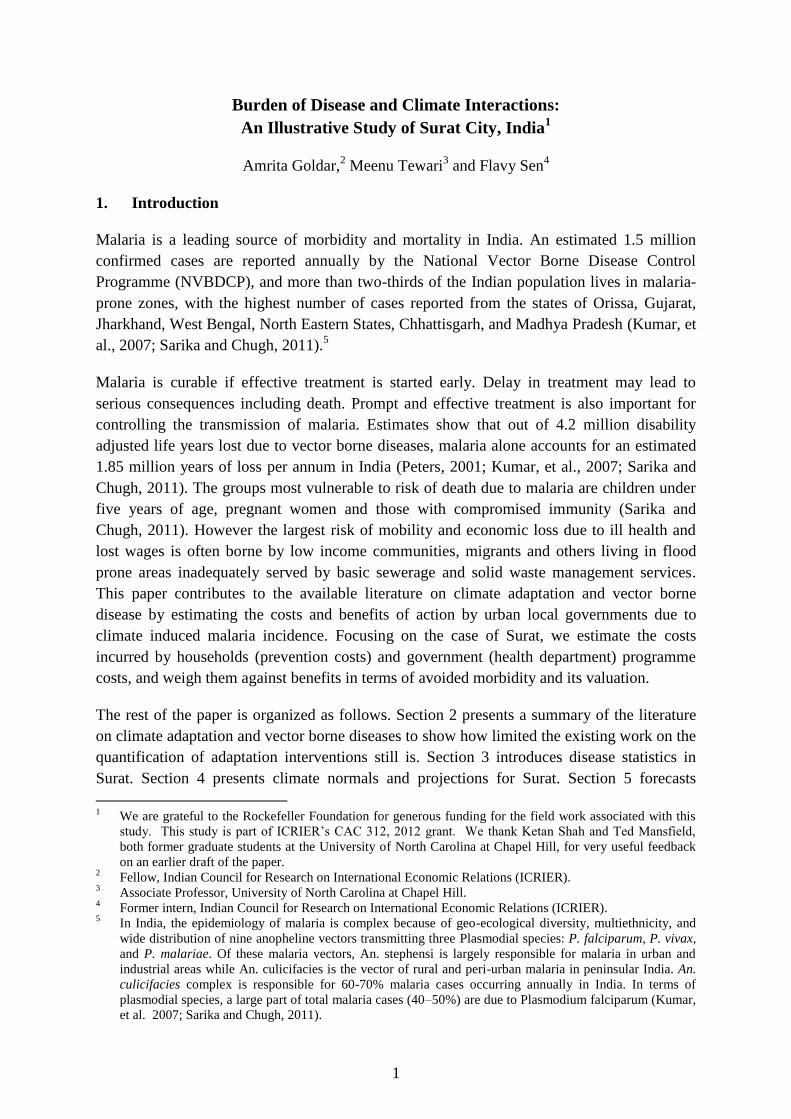
Climate induced changes in temperature and precipitation have large impacts on the rates of
vector and water borne disease incidence. In the case of malaria, temperature drives both the
development rate of the malaria parasite within the mosquito (the sporogonic cycle) and the
biting–laying cycle of the mosquito itself (the gonotrophic cycle). The sporogonic
development rate is arguably the most important of these constraints for rainy season
temperatures and is generally taken to be linearly proportional to the number of ‘‘degree-
days’’ above a threshold temperature. In general, Sporogonic cycles take about 9 to 10 days
at temperatures of 28°C, but note that temperatures higher than 30°C and below 16°C have
negative impact on parasite development. A similar relationship governs the rate of
progression of the gonotrophic cycle. Temperature affects the mosquito bionomics through
decreasing the time taken for the development of parasite eggs in the midgut of the mosquito
(temperature rises from 21°C to 27°C). The interval between mosquitoes’ blood meals
decrease with temperature rise which shortens the incubation periods of the plasmodium
parasites in the mosquitoes and the number of times eggs are laid by the mosquitoes (Craig,
et.al. 1999; Snow, et.al. 1999; Hoshen and Morse, 2004; Jones and Morse 2010; Ermert, et.al.
2011; Ermert, et.al. 2012; Tomkins & Ermert 2013).
Precipitation contributes to the growth of the modeled mosquito population via the
availability of breeding sites. The survival of mosquito larvae also depends on rainfall. It
should however be noted that the development of the disease in the human host population is
not directly climate driven, and infected humans remain in a latent incubation period of 15
days before becoming able to transmit malaria gametocytes to mosquitoes (Ermert, et.al.
2012; Tomkins & Ermert 2013).
5
Figure 1: Diagrammatic Representation of Malaria Transmission
Source: Ermert et al. (2011)
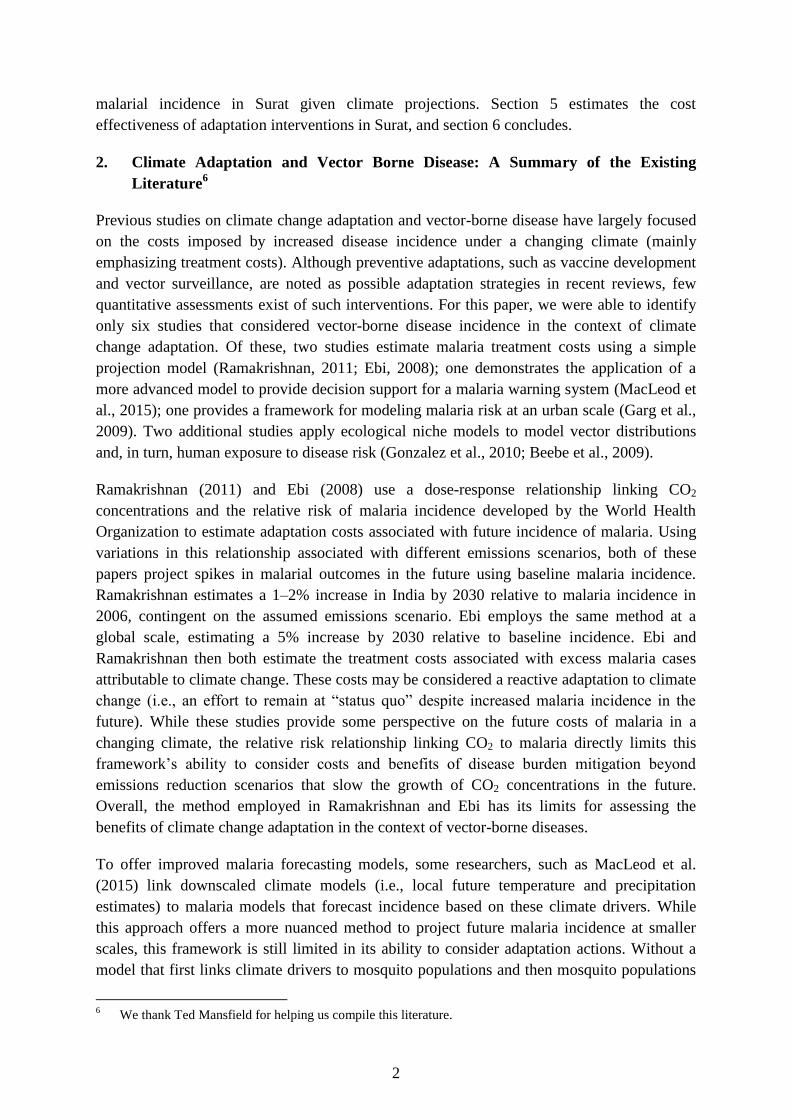
Disease Statistics for Surat
The first step in investigating urban disease patterns is to look at the city’s history of cases
and the seasonality, spatial location, details of disease spread specific to that location. While
looking at disease patterns we found that although Malaria is endemic in Surat city with cases
of malaria, filariasis and leptospirosis related morbidity reported throughout the year, there is
a clear seasonality to the spread of disease during the three-four months of monsoon season
with a peak between August–November reaching base in December. Falciparum malaria
cases show rise from July with a peak October and reach at base from February – June.
(Figures 2 and 3).
Figure 2: Malaria Cases in Surat
Data Source: Disease Statistics, SMC Website
6
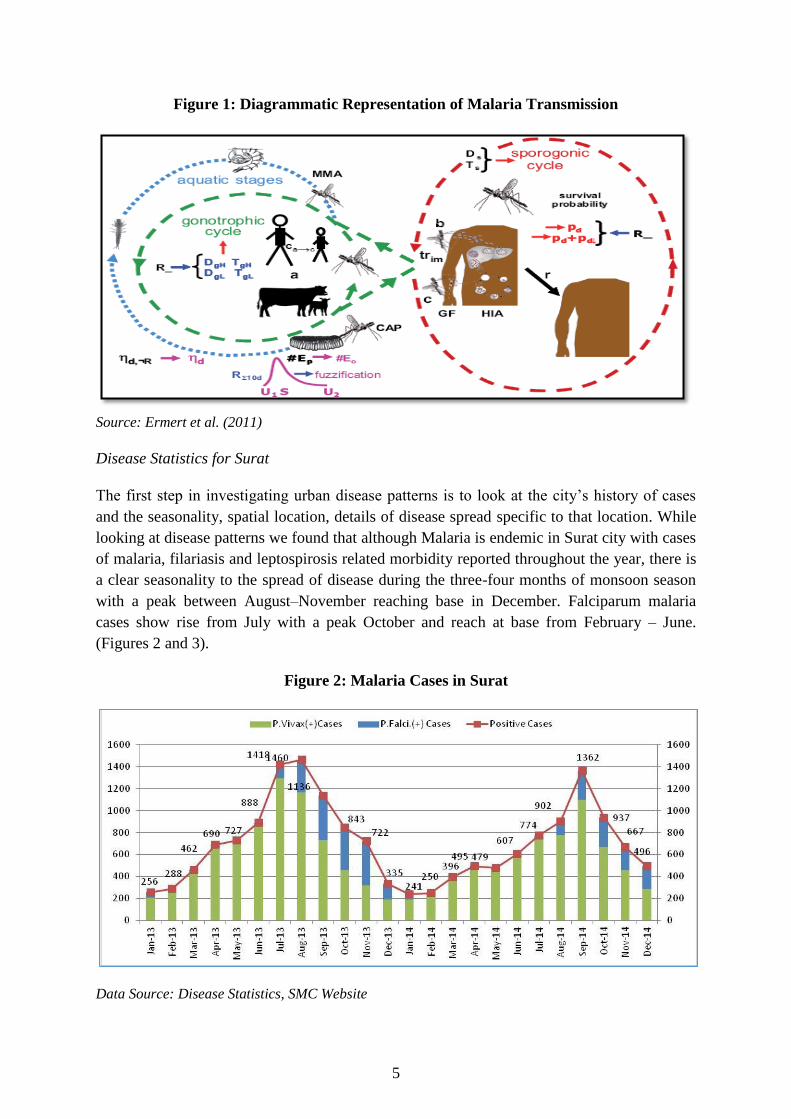
In the past, a large share of malarial cases within India, and Gujarat state in particular, were
reported from Surat. In recent times however, government interventions with respect to
public health programmes has led to a plateauing of the number of cases reported. This
deceleration in cases reported has occurred despite the increase in city limits in 2006. Figure
4 shows the event history for the city with important natural disasters highlighted. Also
shown are the increases in samples taken as well as the number of malaria positive cases
found among those tested.
Figure 3: History of Malaria Cases in Surat Juxtaposed with Event History
Data Source: Disease Statistics, Surat Municipal Corporation Website
Even within city parameters there can be significant geographical variation in malaria cases.
The city’s East zone has the highest number of malaria cases followed by Central, South west
and South East zones. The North and West zones are relatively less prone to malaria.
Location-wise, there are concentrated pockets of cases reported in the South west (Athwa
zone) and Central (Old city zone) areas where reported cases are nearly double their
contribution to the total population. Large slums are located in the East and South east zones
of the city these areas also contribute significantly to the incidence of Malaria in Surat city.
The incidence and spread of disease is influenced by a number of factors: the socio-economic
status of households, migration status, quality of the built and natural environment,
households’ access to basic sanitation and urban services, and the reach and access of health
care services. Nearly half of Surat’s workforce is of migrant status. Many of them especially
those in the construction textile industry are seasonal migrants, and live in congested housing
of poor quality and in locations that are low-lying, prone to flooding and sites at high risk of
mosquito breeding infestation. Comparison of SPR among migrants and overall SPR of the
city in the last decade reveals that the transmission rate remained high among migrants for all
years. Estimates made by the SMC show that the scale of construction activity is one of the
contributing factors to the magnitude of malarial morbidity in various zones.
7
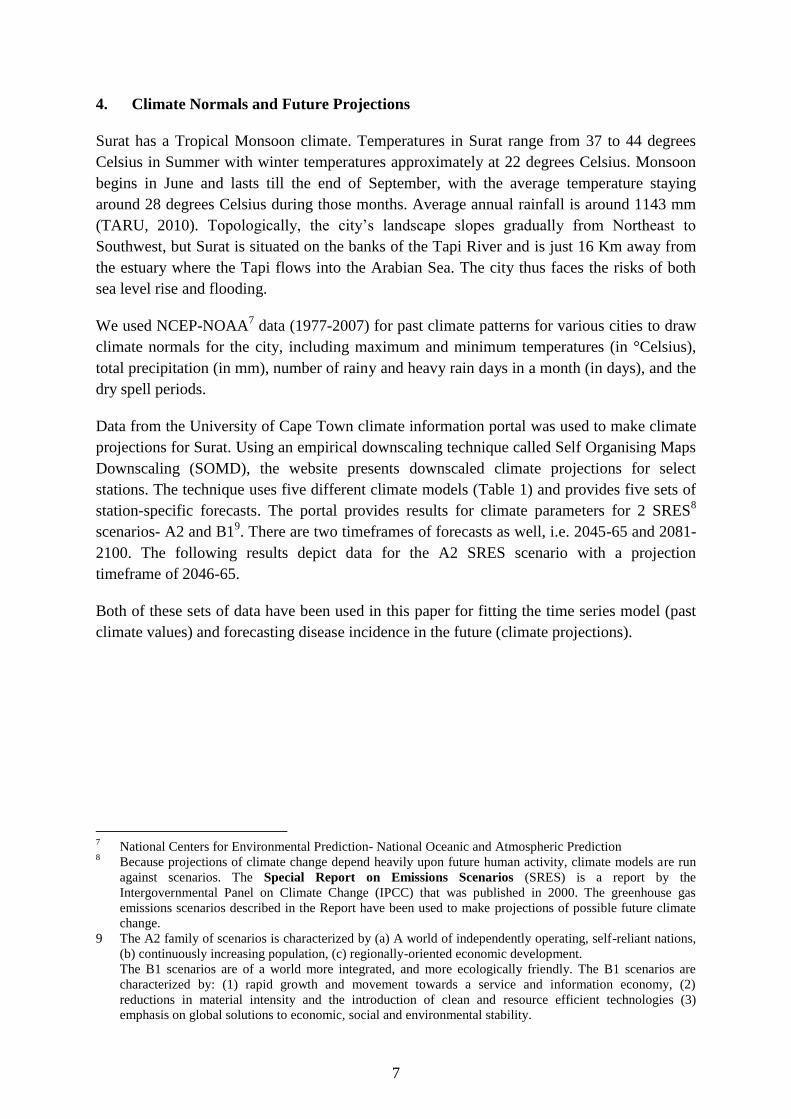
4. Climate Normals and Future Projections
Surat has a Tropical Monsoon climate. Temperatures in Surat range from 37 to 44 degrees
Celsius in Summer with winter temperatures approximately at 22 degrees Celsius. Monsoon
begins in June and lasts till the end of September, with the average temperature staying
around 28 degrees Celsius during those months. Average annual rainfall is around 1143 mm
(TARU, 2010). Topologically, the city’s landscape slopes gradually from Northeast to
Southwest, but Surat is situated on the banks of the Tapi River and is just 16 Km away from
the estuary where the Tapi flows into the Arabian Sea. The city thus faces the risks of both
sea level rise and flooding.
We used NCEP-NOAA7 data (1977-2007) for past climate patterns for various cities to draw
climate normals for the city, including maximum and minimum temperatures (in °Celsius),
total precipitation (in mm), number of rainy and heavy rain days in a month (in days), and the
dry spell periods.
Data from the University of Cape Town climate information portal was used to make climate
projections for Surat. Using an empirical downscaling technique called Self Organising Maps
Downscaling (SOMD), the website presents downscaled climate projections for select
stations. The technique uses five different climate models (Table 1) and provides five sets of
station-specific forecasts. The portal provides results for climate parameters for 2 SRES8
scenarios- A2 and B19. There are two timeframes of forecasts as well, i.e. 2045-65 and 2081-
2100. The following results depict data for the A2 SRES scenario with a projection
timeframe of 2046-65.
Both of these sets of data have been used in this paper for fitting the time series model (past
climate values) and forecasting disease incidence in the future (climate projections).
7 National Centers for Environmental Prediction- National Oceanic and Atmospheric Prediction
8 Because projections of climate change depend heavily upon future human activity, climate models are run
against scenarios. The Special Report on Emissions Scenarios (SRES) is a report by the
Intergovernmental Panel on Climate Change (IPCC) that was published in 2000. The greenhouse gas
emissions scenarios described in the Report have been used to make projections of possible future climate
change.
9 The A2 family of scenarios is characterized by (a) A world of independently operating, self-reliant nations,
(b) continuously increasing population, (c) regionally-oriented economic development.
The B1 scenarios are of a world more integrated, and more ecologically friendly. The B1 scenarios are
characterized by: (1) rapid growth and movement towards a service and information economy, (2)
reductions in material intensity and the introduction of clean and resource efficient technologies (3)
emphasis on global solutions to economic, social and environmental stability.

8
Table 1: Climate Models with Results Available
Acronym Model Source
ECHAM MPI ECHAM5 Max Planck Institut für Meteorologie
CGCM CCCMA CGCM3.1 Canadian Centre for Climate Modelling and Analysis
CNRM CNRM CM3 aMétéo-France/Centre National de Recherches
Météorologiques model
GFDL GFDL CM Geophysical Fluid Dynamics Laboratory
MIUB MIUB ECHO-G Meteorological Institute University of Bonn
Regional climate models (CSAG 2010) show that monthly average maximum temperatures in
Surat are likely to increase by 0.5° C per decade and between 2070-2100 the maximum
temperature may increase by around 4°. Figure 5 illustrates the model predicted maximum
temperature anomalies. Anomalies illustrate the difference between the predicted values
(from various climate models) and the historic observed data. The models predict a possible
increase of around 4 to 5 degrees during the winter months. This implies that there is a
possibility that in the future there could be shorter winters with the average temperature being
well above current normals.
With respect to minimum temperatures, the models predict an increase of around 5 degrees in
the winter months and around 3 to 4 degrees during the monsoon and summer season
(Figures 6-7). An increase in minimum temperature may aid the disease causing pathogens to
survive during winter giving rise to the possibility of increase in the health related issues.
Surat currently receives annual rainfall ranging from 950-1200mm. Figure 7 below shows the
typical monthly precipitation patterns for the city (2001-2010). Precipitation projections for
2046-55 are plotted in Figure 6. Figure 9 depicts the results for total monthly anomalies of
precipitation as shown by various models. There is a wide variance in the precipitation
projections amongst various models. However, a broad average of these 6 models predicts a
fall in total precipitation. A comparison based on monthly variation (Figure 8) shows that a
large part of the fall in precipitation would occur in the months of June and July. Greater,
more intense precipitation levels would be witnessed in the months of September and
October, increasing the risk of flooding, water logging and hence increase in the risk of
spikes in vector borne diseases.
9
Figure 4-7: Surat Temperature Normals and Projections
2
Data Source: Climate Information Portal, Climate Systems Analysis Group (CGAG)

10
Figure 8-10: Surat Precipitation Normals and Projections
Data Source: Climate Information Portal, Climate Systems Analysis Group (CGAG)

11
5. Malaria Forecasts for Surat
Coauthor Goldar used the multiplicative seasonal Auto-regressive Integrated Moving
Average (ARIMA) to forecast plausiable Malaria incidence in Surat going forward. A single
equation ARIMA model states how any value in a single time series is linearly related to its
own past values through combining two processes: the autoregressive (AR) process which
expresses Yt as a function of its past values, and the moving average (MA) process which
expresses Yt as a function of past values of the error term e:
where the φs and θs are the coefficients of the AR and MA processes, respectively, and p and
q are the number of past values of Yt and the error term used, respectively. To incorporate the
role of climate in the forecasting process, three climate variables namely, maximum and
minimum temperature and precipitation patterns are included as explanatory variables as
well.
In earlier versions of this paper, we had used an epidemiological malaria model (VECTRI)
forecasting disease patterns. The model incorporated a malaria transmission model as well as
a dynamic mosquito population growth model. Despite the theoretical merit of this model, the
figures from this model were underestimating disease levels in the city. This was due to the
fact that the VECTRI model is not able to model the role of artificially created pools of water
storage or stagnation. For most Indian cities (including Surat), disease occurrence has strong
linkages with anthropological factors, i.e. pools of stagnant water lying in construction sites,
indoor water storage facilities, and so on, that provide artificially created breeding grounds
for mosquitoes. Shown in Figure 11 are cases where despite having low EIRs10
, the city
reported malaria cases. The usage of past diseases values such as the AR term in the time
series model mentioned above, controls for the existence of these anthropogenic factors and
gives better fits and modeling results.
10
Entomological Inoculation Rate (EIR) is the number of infective bites per person per unit time. This
measure represents the degree of risks of malaria to a person.

12
Figure 11: Scatter Diagram for Surat’s Malaria Cases Reported and VECTRI Model’s
EIR Results11
Source: Authors’ Calculations
Using the time series forecasting methodology, we find ARIMA (2,0,0) to best represent the
Surat Malaria incidence data (see Appendix 1 for more details). The modeling results show a
strong positive relation between precipitation and minimum temperature and malaria
incidence in the time period 1995-2012. The negative impact of maximum temperature on
disease is relatively weaker. Past disease values were found to be strongest explanatory
variables.
Assuming this relation between climate variables to continue in the future and the vagaries
introduced by future climate change (2045-65) to occur immediately; it is possible to
construct a hypothetical worst case scenario. In such a scenario, the existing causational
relationships between climate and disease would continue but the impact would be
heightened because of the assumed heat and precipitation changes occurring sooner. This
scenario thus assumes that future impact of climate change on disease can be immediately
witnessed in the city.
Details about the estimation procedure, results and model fits, diagnostic checks, are in
Annexure 1. Figure 12 below shows the variation in average year disease profile for past
years (actual data) and forecasted values for the future.
11
VECTRI is the vector-borne disease community model of the International Centre for Theoretical Physics
(Trieste)
0
100
02
00
03
00
0
0 .5 1 1.5 2 2.5VECTRI EIR Results (Baseline)
Malaria Cases in Surat Fitted values

13
Figure 12: Seasonality of Disease Incidence
Source: Authors’ Calculations
The seasonality of disease patterns shown in Figure 12 highlights the parallel shift upwards
for certain months in terms of cases due to higher temperature levels, etc. The results show
that while the peaks of disease incidence in the projected period occur during the months of
August and September, there are higher cases reported in the off-peak spring and autumn
months as well. The model results clearly show that public health issues would continue to be
an issue of high concern for the city public health officials and general population in the
future as well.
Following from this exploration of the trajectory of disease incidence as might occur in Surat
in the future, the following section tries to estimate the impact it would have on the city’s
competitiveness. The next few sections of this paper look at the costs and benefits of health
sector interventions in the situation of higher disease incidence.
6. Cost Effectiveness of Interventions
Ill-health can contribute to losses in individual utility or social welfare both directly and
indirectly by reducing the enjoyment or utility associated with the consumption of goods and
services unrelated to health, or by compromising other economic objectives such as
producing income (workdays lost). Illness leads to increased household expenditures on
health services and goods, and may also reduce time spent producing income by caregivers,
which further reduces their capacity to consume goods and services on the market. Since the
consumption of health goods and services in general does not yield utility or welfare directly,
people with low incomes may defer or prefer not to incur these expenses in terms of money
and time lost. Microeconomic impacts of ill-health include the change in income and/or
expenditure which induces households to reduce their consumption of non-health goods and
sevices. It may also induce them to liquidate household savings or assets in the case of
emergencies. In addition to the above, the opportunity cost of illness also includes a reduction
14
in non-market activities such as giving up unpaid housework or leisure time to look after a
sick household member.
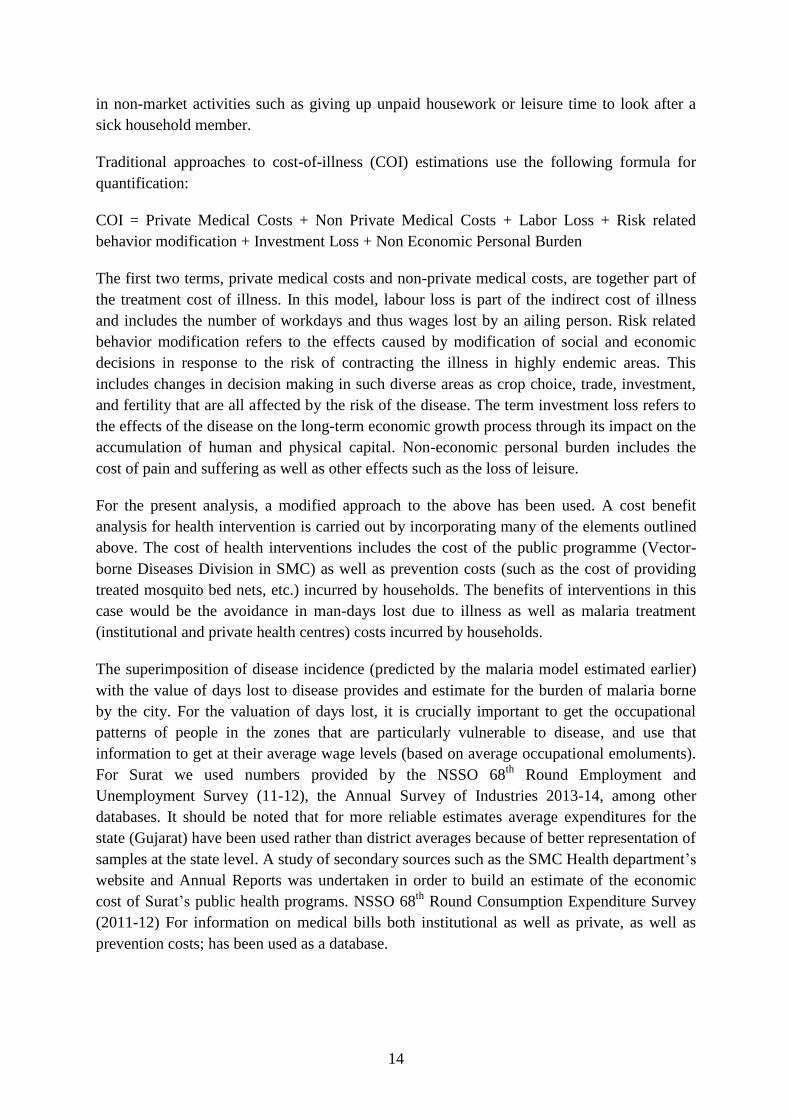
Traditional approaches to cost-of-illness (COI) estimations use the following formula for
quantification:
COI = Private Medical Costs + Non Private Medical Costs + Labor Loss + Risk related
behavior modification + Investment Loss + Non Economic Personal Burden
The first two terms, private medical costs and non-private medical costs, are together part of
the treatment cost of illness. In this model, labour loss is part of the indirect cost of illness
and includes the number of workdays and thus wages lost by an ailing person. Risk related
behavior modification refers to the effects caused by modification of social and economic
decisions in response to the risk of contracting the illness in highly endemic areas. This
includes changes in decision making in such diverse areas as crop choice, trade, investment,
and fertility that are all affected by the risk of the disease. The term investment loss refers to
the effects of the disease on the long-term economic growth process through its impact on the
accumulation of human and physical capital. Non-economic personal burden includes the
cost of pain and suffering as well as other effects such as the loss of leisure.
For the present analysis, a modified approach to the above has been used. A cost benefit
analysis for health intervention is carried out by incorporating many of the elements outlined
above. The cost of health interventions includes the cost of the public programme (Vector-
borne Diseases Division in SMC) as well as prevention costs (such as the cost of providing
treated mosquito bed nets, etc.) incurred by households. The benefits of interventions in this
case would be the avoidance in man-days lost due to illness as well as malaria treatment
(institutional and private health centres) costs incurred by households.
The superimposition of disease incidence (predicted by the malaria model estimated earlier)
with the value of days lost to disease provides and estimate for the burden of malaria borne
by the city. For the valuation of days lost, it is crucially important to get the occupational
patterns of people in the zones that are particularly vulnerable to disease, and use that
information to get at their average wage levels (based on average occupational emoluments).
For Surat we used numbers provided by the NSSO 68th
Round Employment and
Unemployment Survey (11-12), the Annual Survey of Industries 2013-14, among other
databases. It should be noted that for more reliable estimates average expenditures for the
state (Gujarat) have been used rather than district averages because of better representation of
samples at the state level. A study of secondary sources such as the SMC Health department’s
website and Annual Reports was undertaken in order to build an estimate of the economic
cost of Surat’s public health programs. NSSO 68th
Round Consumption Expenditure Survey
(2011-12) For information on medical bills both institutional as well as private, as well as
prevention costs; has been used as a database.

15
a. Estimation of Adaptation Benefits
An important part of the adaptation benefits of health interventions stems from the avoidance
of 'coping strategies' that households employ to mitigate the consequences of illness. This
includes income used to pay for health care (treatment costs) as well as loss in household
income flows due to leaves taken.
b. Avoidance of Workdays Lost to Illness
The second component for economic impact analysis of disease is the valuation of number of
lost days of work. When the monetary value per day lost is attached with the loss of days
estimate, a proxy measure for loss in value of output can be derived. While the lower bound
to the days lost to illness is dependent upon medical prescribed treatment advice (generally
held to be 3 days), some estimates show that the impact can last till 15 days. For the current
analysis, the monetary value of lost days of work has been estimated based on the value of
lost wages/salaries.
Each of the steps of the estimation process (Figure 13) is described in detail below.
Figure 13: Methodology for the Estimation Process
Levels of analysis:
Step 1: Disease Incidence Estimate
Taken from Section 5 above
Step 2: Determining the Age Profile of Malaria Cases
Age distribution of cases has been taken from an article written by Pawar, et. al. (2008)
which estimates the age distribution of malaria cases in Surat from a survey conducted in
Slum areas in 2006 that serve as field research areas of the Surat Municipal Institute of
Medical Education and Research (SMIMER). Based on their survey results, a figure of 71%
1 • Disease Incidence Estimate
2 • Age Profile For Working Age Population
3 • Industry-Wise Disaggregation
4 • Share of Regular v/s Casual Labourers in Industry
5 • Wages/Salaries Earned by Each Category of Worker
6 • Valuation of Workdays Lost to Illness

16
can be derived that refers to population affected by Malaria that is within the working age
group (16-64 years).
Table 2: Age Distribution of Malaria Cases in Surat
Cases Share in Total (%)
children<15 year 36 29.0%
15-25 31 25%
25-35 28 22.6%
35-45 18 14.5%
45-55 10 8.1%
>55 1 0.8%
Total Cases 124
Source: Pawar, et.al (2008)
Step 3: Calculating the Industry-wise Distribution of Workforce
Of the working age population that is affected, the share of labour engaged in each particular
industry is calculated using data from Annual Survey of Industries. The three industries of
textiles, petrochemicals, and diamond cutting account for 82.6% of total labour force in
Surat. Individually, these sectors employ 43% workforce in textiles, a little more than 2% in
petrochemicals and 37% workers in gems and jewelry.
Table 3: Industry-wise Distribution of Workforce
NIC Sector/Industry Number of Workers Share
13 Manufacture of Textile 54606 43.4%
20 Petrochemicals (Part of Chemical and Chemical Products) 2907.9 2.3%
32 Diamond cutting (part of other manufacturing)- regular
salaried worker 46473 36.9%
Total Workers in Above Industries 103987 82.6%
All Workers 125887
Source: Annual Survey of Industries Unit Level Data, 2008-09
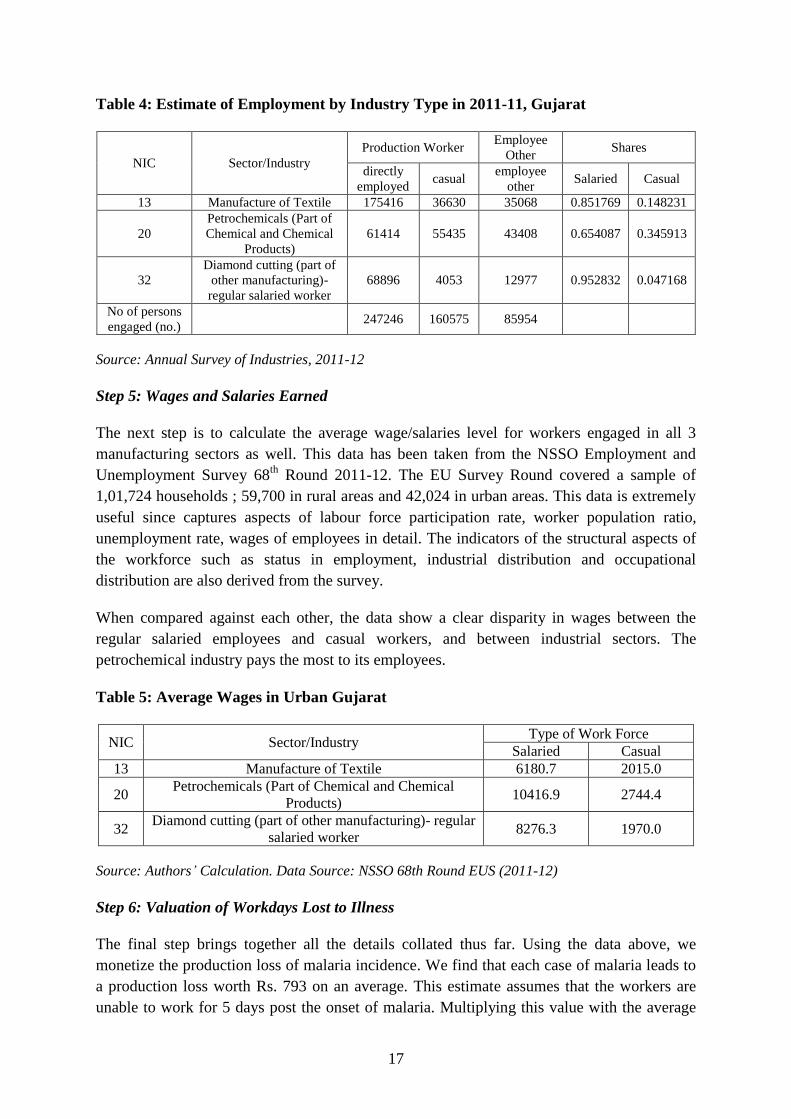
Step 4: Share of Regular versus Casual Workers
For the analysis, workers in each of the sectors were further divided into regular workers and
casual laborers. Note that the heads of employees directly employed and employees in
supervisory and managerial positions are all part of the salaried workforce calculated above.
From Table 4 below, it is easy to see that the largest share of formalized labour force is in the
gems and jewelry sector. It is however surprising to see the high level of formalization in the
textile sector as well. However, it needs mentioning that the ASI includes only registered
enterprises. Given the nature of textile industry, there may be a large number of small scale
textile units that rely primarily on informal contractual labour that are not featured as part of
the survey.
17
Table 4: Estimate of Employment by Industry Type in 2011-11, Gujarat
NIC Sector/Industry
Production Worker Employee
Other Shares
directly
employed casual
employee
other Salaried Casual
13 Manufacture of Textile 175416 36630 35068 0.851769 0.148231
20
Petrochemicals (Part of
Chemical and Chemical
Products)
61414 55435 43408 0.654087 0.345913
32
Diamond cutting (part of
other manufacturing)-
regular salaried worker
68896 4053 12977 0.952832 0.047168
No of persons
engaged (no.) 247246 160575 85954
Source: Annual Survey of Industries, 2011-12
Step 5: Wages and Salaries Earned
The next step is to calculate the average wage/salaries level for workers engaged in all 3
manufacturing sectors as well. This data has been taken from the NSSO Employment and
Unemployment Survey 68th
Round 2011-12. The EU Survey Round covered a sample of
1,01,724 households ; 59,700 in rural areas and 42,024 in urban areas. This data is extremely
useful since captures aspects of labour force participation rate, worker population ratio,
unemployment rate, wages of employees in detail. The indicators of the structural aspects of
the workforce such as status in employment, industrial distribution and occupational
distribution are also derived from the survey.
When compared against each other, the data show a clear disparity in wages between the
regular salaried employees and casual workers, and between industrial sectors. The
petrochemical industry pays the most to its employees.
Table 5: Average Wages in Urban Gujarat
NIC Sector/Industry Type of Work Force
Salaried Casual
13 Manufacture of Textile 6180.7 2015.0
20 Petrochemicals (Part of Chemical and Chemical
Products) 10416.9 2744.4
32 Diamond cutting (part of other manufacturing)- regular
salaried worker 8276.3 1970.0
Source: Authors’ Calculation. Data Source: NSSO 68th Round EUS (2011-12)
Step 6: Valuation of Workdays Lost to Illness
The final step brings together all the details collated thus far. Using the data above, we
monetize the production loss of malaria incidence. We find that each case of malaria leads to
a production loss worth Rs. 793 on an average. This estimate assumes that the workers are
unable to work for 5 days post the onset of malaria. Multiplying this value with the average

18
number of malaria cases that would occur in the future, we estimate that malaria events every
year would lead to a loss of Rs. 85 lakhs (or 8.6 million) annually.
Table 6: Economic Value of Workdays Lost to Illness
Cases Annual Valuation (in Rs. Lakhs)
Actual (Average 1995-2013) 10472 83.0
Projections (Average 2045-65) 10774 85.4
Source: Authors’ Calculation
Healthcare Expenditure Avoided
The absence of social security and other forms of formal/ informal insurance and
compensation mechanisms in India, can have and impoverishing and consumption impact of
disease and injury. Increased health expenditures and lower productivity can cause or
accentuate household poverty and households may be forced to cut back their consumption of
non-health goods and services. To assess this, Table 7 provides estimates of average
expenditures on health in Gujarat and their share in total consumption expenditures of
households.
Average data for the period 2002-2013 shows that of all the cases examined that tested
positive for malaria by the public health system, about 70% were P. Vivax cases and 30%
were P. Falciparum cases. In our analysis we assume that this relative share would continue
in future cases as well, although clearly from our literature review we are aware that this may
not be the case. Given current data limitations and for the sake of a simple economic
assessment, we make this crucial assumption to calculate the treatment cost of each new
malaria case. Equally important is the share of cases that are treated by the public sector
versus the private healthcare system. Based on existing studies that examined the health
aftermaths of Surat’s 2006 floods (Pawar et.al., 2008), we take the share of malaria cases
treated by the public healthcare systems to be 70%. This figure has however reduced to 50%
in recent times specifically in the case of malaria (SMC Personal Communication, 2015). It is
important to emphasize that patients opting for public healthcare systems need to pay only a
very nominal amount for treatment. For the purposes of our study, we assume that each
patient in this case pays Rs. 10 for malaria testing. Other costs such as doctor’s fees as well as
medicines are taken care of by the Vector Borne Disease Control Department’s initiatives of
the SMC as part of the city’s public health expenditures. Doctors are the employees of the
SMC and are paid a non-practicing allowance by the government. In an economic sense,
these costs are “free” for patients opting for the public or public supported system.12
Following the National Drug Policy prescription and widespread Chloroquine resistance
found within Surat district, we assume that P. Vivax Malaria is treated with a combination
dosage of chloroquine (CQ) for three days and primaquine (PQ) for 14 days. Two lines of
12
Clearly, as the consumption of purely private health care services increases, the costs of disease and hence
“savings” from adaptation will also increase.
19
treatment are used for P. falciparum Malaria i.e. Artemisinin based Combination Therapy
(ACT) - SP for three days and PQ for 14 days.
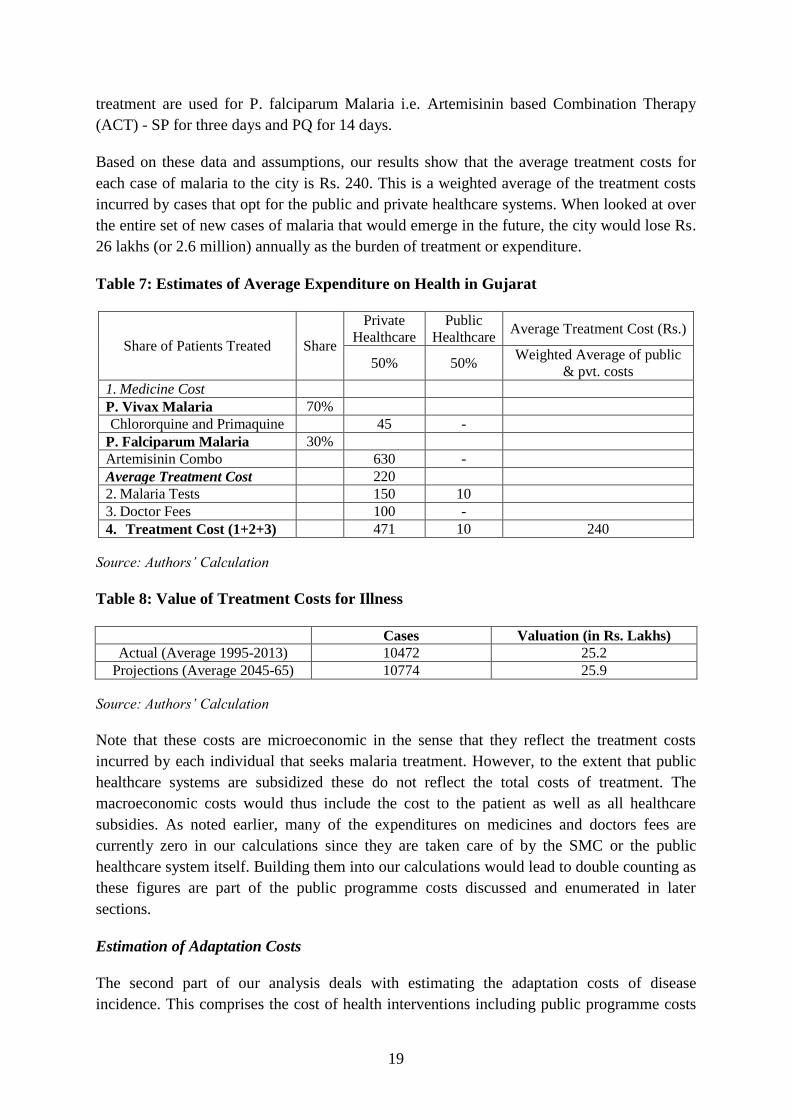
Based on these data and assumptions, our results show that the average treatment costs for
each case of malaria to the city is Rs. 240. This is a weighted average of the treatment costs
incurred by cases that opt for the public and private healthcare systems. When looked at over
the entire set of new cases of malaria that would emerge in the future, the city would lose Rs.
26 lakhs (or 2.6 million) annually as the burden of treatment or expenditure.
Table 7: Estimates of Average Expenditure on Health in Gujarat
Share of Patients Treated Share
Private
Healthcare
Public
Healthcare Average Treatment Cost (Rs.)
50% 50% Weighted Average of public
& pvt. costs
1. Medicine Cost
P. Vivax Malaria 70%
Chlororquine and Primaquine
45 -
P. Falciparum Malaria 30%
Artemisinin Combo
630 -
Average Treatment Cost
220
2. Malaria Tests
150 10
3. Doctor Fees
100 -
4. Treatment Cost (1+2+3)
471 10 240
Source: Authors’ Calculation
Table 8: Value of Treatment Costs for Illness
Cases Valuation (in Rs. Lakhs)
Actual (Average 1995-2013) 10472 25.2
Projections (Average 2045-65) 10774 25.9
Source: Authors’ Calculation
Note that these costs are microeconomic in the sense that they reflect the treatment costs
incurred by each individual that seeks malaria treatment. However, to the extent that public
healthcare systems are subsidized these do not reflect the total costs of treatment. The
macroeconomic costs would thus include the cost to the patient as well as all healthcare
subsidies. As noted earlier, many of the expenditures on medicines and doctors fees are
currently zero in our calculations since they are taken care of by the SMC or the public
healthcare system itself. Building them into our calculations would lead to double counting as
these figures are part of the public programme costs discussed and enumerated in later
sections.
Estimation of Adaptation Costs
The second part of our analysis deals with estimating the adaptation costs of disease
incidence. This comprises the cost of health interventions including public programme costs
20
(Vector-borne Diseases Division in SMC) as well as any prevention costs (such as mosquito
bed net purchases, etc.) incurred by households.
Malaria Prevention Costs Incurred
NSSO data for the 68th
Round on Consumption Expenditure Survey 2011-12 has been used to
estimate the microeconomic prevention costs incurred by households. In the current analysis,
household-level malaria prevention costs have been assumed to relate simply to the cost of
purchasing mosquito nets (NSSO Item. 384) and mosquito repellent (NSSO Item. 472).
The NSSO 68th
Round Consumption Expenditure Survey was conducted from July, 2011 to
June, 2012. The survey covered a sample of 1,01,662 households (59,695 in rural areas and
41,967 in urban areas). The NSS consumer expenditure survey aims at generating estimates
of household monthly per capita consumer expenditure (MPCE) and its distribution for rural
and urban sectors of the country, for States and Union Territories, and for different
socioeconomic groups. The survey collects comprehensive information on consumption items
including 142 items of food, 15 items of energy (fuel, light and household appliances), 28
items of clothing, bedding and footwear, 19 items of educational and medical expenses, 51
items of durable goods, and 89 other items. It also collects details of particulars of each
household member, such as age, sex and educational level. These indicators provide key
measures of the level of living of different segments of the population. The distribution of
MPCE highlights the differences in level of living is an effective tool to study the prevalence
of poverty and inequality. These numbers enable planning and aid the ecision-making process
in allocating the nation’s resources among sectors, regions, and socio-economic groups, and
assess the “inclusiveness” of economic growth.
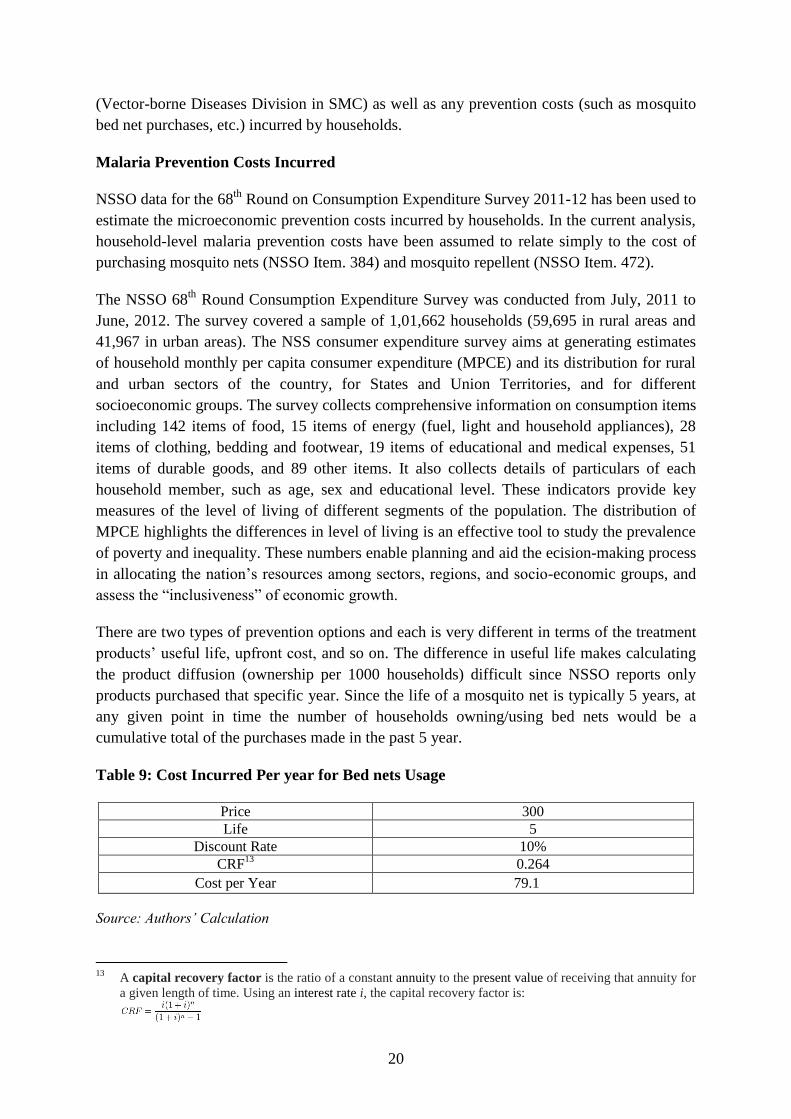
There are two types of prevention options and each is very different in terms of the treatment
products’ useful life, upfront cost, and so on. The difference in useful life makes calculating
the product diffusion (ownership per 1000 households) difficult since NSSO reports only
products purchased that specific year. Since the life of a mosquito net is typically 5 years, at
any given point in time the number of households owning/using bed nets would be a
cumulative total of the purchases made in the past 5 year.
Table 9: Cost Incurred Per year for Bed nets Usage
Price 300
Life 5
Discount Rate 10%
CRF13
0.264
Cost per Year 79.1
Source: Authors’ Calculation
13
A capital recovery factor is the ratio of a constant annuity to the present value of receiving that annuity for
a given length of time. Using an interest rate i, the capital recovery factor is:
21
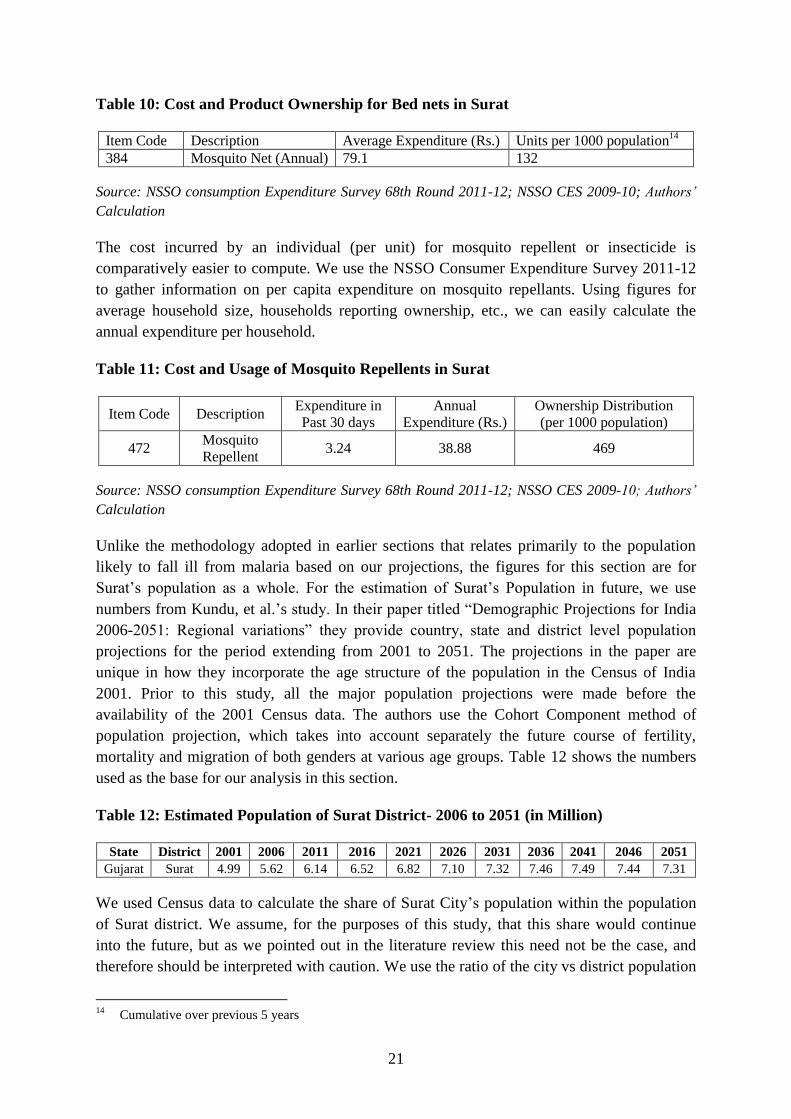
Table 10: Cost and Product Ownership for Bed nets in Surat
Item Code Description Average Expenditure (Rs.) Units per 1000 population14
384 Mosquito Net (Annual) 79.1 132
Source: NSSO consumption Expenditure Survey 68th Round 2011-12; NSSO CES 2009-10; Authors’
Calculation
The cost incurred by an individual (per unit) for mosquito repellent or insecticide is
comparatively easier to compute. We use the NSSO Consumer Expenditure Survey 2011-12
to gather information on per capita expenditure on mosquito repellants. Using figures for
average household size, households reporting ownership, etc., we can easily calculate the
annual expenditure per household.
Table 11: Cost and Usage of Mosquito Repellents in Surat
Item Code Description Expenditure in
Past 30 days
Annual
Expenditure (Rs.)
Ownership Distribution
(per 1000 population)
472 Mosquito
Repellent 3.24 38.88 469
Source: NSSO consumption Expenditure Survey 68th Round 2011-12; NSSO CES 2009-10; Authors’
Calculation
Unlike the methodology adopted in earlier sections that relates primarily to the population
likely to fall ill from malaria based on our projections, the figures for this section are for
Surat’s population as a whole. For the estimation of Surat’s Population in future, we use
numbers from Kundu, et al.’s study. In their paper titled “Demographic Projections for India
2006-2051: Regional variations” they provide country, state and district level population
projections for the period extending from 2001 to 2051. The projections in the paper are
unique in how they incorporate the age structure of the population in the Census of India
2001. Prior to this study, all the major population projections were made before the
availability of the 2001 Census data. The authors use the Cohort Component method of
population projection, which takes into account separately the future course of fertility,
mortality and migration of both genders at various age groups. Table 12 shows the numbers
used as the base for our analysis in this section.
Table 12: Estimated Population of Surat District- 2006 to 2051 (in Million)
State District 2001 2006 2011 2016 2021 2026 2031 2036 2041 2046 2051
Gujarat Surat 4.99 5.62 6.14 6.52 6.82 7.10 7.32 7.46 7.49 7.44 7.31
We used Census data to calculate the share of Surat City’s population within the population
of Surat district. We assume, for the purposes of this study, that this share would continue
into the future, but as we pointed out in the literature review this need not be the case, and
therefore should be interpreted with caution. We use the ratio of the city vs district population
14
Cumulative over previous 5 years

22
to calculate Surat city’s population projection till 2046-51. Also, average household size
figures from the NSSO consumption expenditure survey were used to calculate the number of
households that would exist in the future. Again, these ratios might change in future years.
Pulling all elements of the expenditure estimation together, Table 13 shows the disease
prevention costs incurred by residents of Surat. The data show that the city would incur about
Rs. 40 million as prevention costs at a microeconomic level.
Table 13: Microeconomic Disease Prevention Costs in Surat
Year Population Households
Bed nets Mosquito Repellents
Prevention
Costs (in
millions)
Annual
Expenditure
Per capita
(Rs.)
Ownership
Annual
Expenditure
Per capita
(Rs.)
Ownership
2011 4,462,002 1,174,211
79.1 13.2% 38.88 47%
34
2046-51
Avg. 5,414,319
1,424,821 41
Source: NSSO consumption Expenditure Survey 2011-12; NSSO CES 2009-10; Authors’ Calculation
Public Programme Cost Estimation
The Vector Borne Diseases Control Department of the Surat Municipal Corporation boasts of
a strong surveillance and disease monitoring system which has emanated from Surat’s unique
experience with vector borne diseases and sudden onset flooding events. There is strong
commitment at various levels of the government to prevent and control Vector Borne
Diseases (VBD) in Surat city.
The outbreak of plague in Surat in 1994 jolted the city authorities into action and it was
realized that there was a need for a major revamp of the health administration system. The
following year thus saw a significant turnaround in the state of affairs as the civic
administration initiated a series of health measures to limit the impact of future disease
outbreaks. One such initiative was the Public Health Mapping Exercise carried out by SMC
where authorities undertake continuous spatial documentation of health related data. The
parameters for mapping include quality of drinking water, leakage in water pipes, access to
sanitation and drainage facilities and the occurrence of major diseases.
For the documentation of disease occurrence, Surat Municipal Corporation developed a
network of about 274 surveillance centers, with a major presence in slum areas. The network
includes two municipal hospitals, nineteen urban health centers, seven major private hospitals
and a range of private medical practitioners. By plotting morbidity rates relating to major
diseases on the city map, the city health manager is able to predict trends and focal point of
outbreaks of epidemics. This mapping exercise is crucial for vector borne disease
surveillance and it is of particular importance for Malaria surveillance as it allows
government bodies to gauge the distribution of malaria occurrence in the urban and rural
areas of Surat district. Another mapping exercise in use by the SMC is the Urban Service
Monitoring System (UrSMS), developed under the Rockefeller Foundation’s ACCCRN

23
initiative. The system, through its two interfaces- mobile phone and PC, sends and receives
health data via SMS and provides auto-generated reports, graphs and statistics to SMC
officials and decision makers. These exercises effectively capture the city’s daily, weekly and
monthly disease trends at different levels of aggregation for early action on any epidemic
situation (Bhat et al. 2013, Desai et al. 2015).
The approach of the VBDC department is multipronged, combining an elaborate system of
case detection using smart, digital technology and ground level networking, with prompt
provision of effective health care. Thus, it not only aims to identify the foci and locus of
transmission of the disease, but also seeks to reduce morbidity among already detected cases
by providing rapid treatment to prevent its further spread. Under the SMC’s parasitological
measures, the guidelines of the Urban Malaria Scheme for early detection and complete
treatment (EDCT) require that both active and passive surveillance is carried out on a regular
basis. In 2011, 440 surveillance workers were deployed to undertake these activities. A total
of 1,131,175 blood smears were collected, in which 12,369 smears were positive for malaria.
The P. Vivax and P. Falciparum cases were treated with radical treatment (SMC data).
In terms of passive surveillance, and speedy treatment, such mechanisms have been
strengthened substantially by the involvement of 104 private hospitals as well as sentinel
hospitals. The inclusion of private hospitals in the malaria surveillance programs is extremely
beneficial as a significant portion of the city’s population seek treatment at private
practitioners (71.8% as per a report on 2006 post flood scenario). This networking and
partnership between public and private providers not only allows for better data collection
and disease control, but also widens the reach of health programs to under-served
populations, including migrants. Based on our personal communication with the SMC VBDC
Department, this figure of private healthcare share may have fallen to 50% in recent times
due to enhanced government interventions.
Apart from these surveillance and vector control activities, the Vector Borne Disease Control
department has a very elaborate drug distribution system. Following the guidelines of the
National Drug Policy on Malaria, the department distributes anti-Malarial drugs after
confirmation of the diagnosis in each case. The dosage of treatment is as prescribed by the
National Drug Policy. In each such case, patients were administered anti-malarial drugs in the
presence of a primary health worker and each positive case was followed up by another
domiciliary visit.
As part of its anti-larval measures, the SMC undertook both intra-domestic and peri-domestic
entomological surveillance of each positive case along with indoor space spraying of around
50 houses in the vicinity of a positive case. Intra-domestic survey activities are carried out in
breeding sites of buildings within both residential areas and commercial complexes. All sites
that test positive are treated with appropriate insecticides. In 2011, around 14,971,336
residential houses were inspected. Peri-domestic activities were carried out throughout the
year at weekly intervals in outdoor spaces by health workers. These health workers inspected
ongoing construction sites, outdoor water bodies, underground tanks, overhead tanks, ground
tanks, permanent water bodies and seepages of the canals and the identified breeding spots
24
were treated with appropriate insecticides such as MLO, Biolarvicides and Temephose 50%
EC.
Apart from anti-larval measures, the SMC adopted a range of biological measures to prevent
malaria transmission. These include the release of larvivorous fish in permanent water bodies,
spraying of appropriate larvicides or fumigation of potential vector borne sites such as in and
around city slums, or congested, low lying neighborhoods. Additionally, SMC and its VBDC
department has organized various community health education initiatives to increase public
awareness about Malaria. These awareness programmes were carried out through circulation
of information via vernacular newspapers, television, leafletting, FM, puppet shows,
streetplays and so on.
In addition to the above, The Bombay Provincial Municipal Corporation (BPMC) Act, 1949,
which applies to all of Gujarat and Maharashtra, empowers the civic administration in Surat
to initiate action in the interest of public health. Surat Municipal Corporation is extremely
vigilant in the inspection of breeding sites. Under the BPMC Act, legal action can be pursued
against anyone for negligence over mosquito breeding activity in or around their place of
residence. A health worker can issue a notice to the resident of such a site. If the resident fails
to comply with the notice, a fine is imposed. If there are multiple cases against an errant
individual or organization for harboring mosquito breeding sites, a case may be filed in the
courts on grounds of public nuisance. In 2011, a total of 2,005 complaints were filed and
penalties of Rs. 1,98,800 were imposed as fine. Around 48,814 notices were issued and
administrative charges of Rs. 4,851,049 were collected from defaulters.
Further details of vector control measure, biological measures and implementation of the
BMPC Act are all shown in Annexure 3. The organogram of the Vector Borne Disease
Control Department in SMC is shown in Figure 19 that reflects the roles and responsibility of
key personnel engaged in the programme.
The annual cost incurred by the health programs of the department are cited to range from Rs.
4 - Rs. 5 million, all of which is borne by the Surat Municipal Corporation.
25
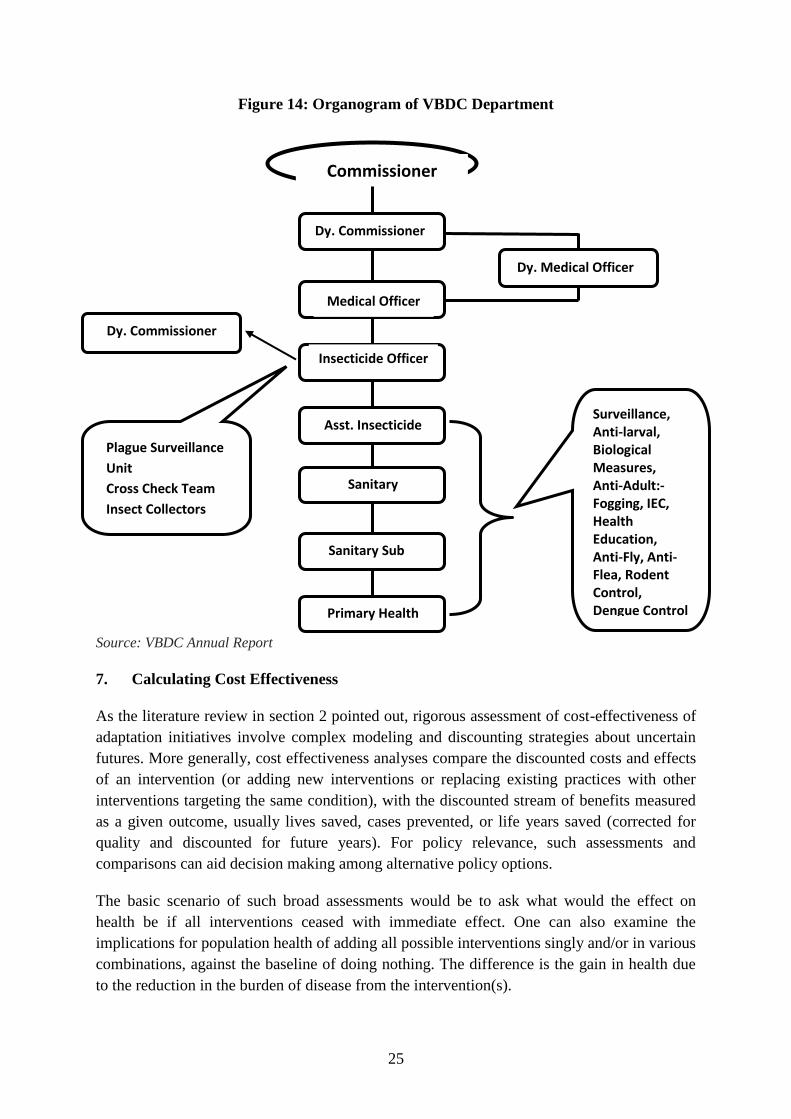
Figure 14: Organogram of VBDC Department
Source: VBDC Annual Report
7. Calculating Cost Effectiveness
As the literature review in section 2 pointed out, rigorous assessment of cost-effectiveness of
adaptation initiatives involve complex modeling and discounting strategies about uncertain
futures. More generally, cost effectiveness analyses compare the discounted costs and effects
of an intervention (or adding new interventions or replacing existing practices with other
interventions targeting the same condition), with the discounted stream of benefits measured
as a given outcome, usually lives saved, cases prevented, or life years saved (corrected for
quality and discounted for future years). For policy relevance, such assessments and
comparisons can aid decision making among alternative policy options.
The basic scenario of such broad assessments would be to ask what would the effect on
health be if all interventions ceased with immediate effect. One can also examine the
implications for population health of adding all possible interventions singly and/or in various
combinations, against the baseline of doing nothing. The difference is the gain in health due
to the reduction in the burden of disease from the intervention(s).
Commissioner
Dy. Medical Officer
of Health (Zone)
Dy. Commissioner
(Health &
Hospital)
Medical Officer
of Health
Insecticide Officer
Asst. Insecticide
Officer (Zone)
Sanitary Sub
Inspector
Primary Health
Worker
Dy. Commissioner
Spl. (Procurement)
Plague Surveillance
Unit
Cross Check Team
Insect Collectors
Lab. Tech.
(Epidemiological)
(Entomological)
Surveillance, Anti-larval, Biological Measures, Anti-Adult:-Fogging, IEC, Health Education, Anti-Fly, Anti-Flea, Rodent Control, Dengue Control Activity.
Filaria:- Night Survey, MDA, Bylaws Implementation, Inter Sectoral Coordination
Sanitary
Inspector
26
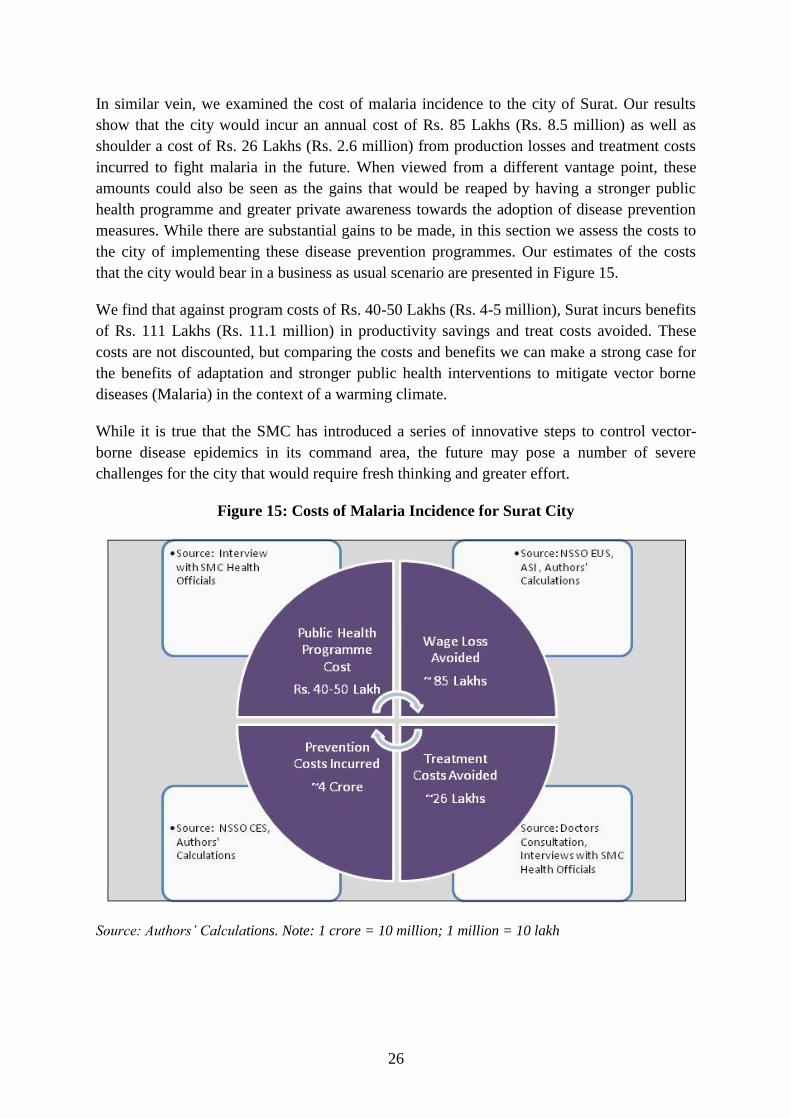
In similar vein, we examined the cost of malaria incidence to the city of Surat. Our results
show that the city would incur an annual cost of Rs. 85 Lakhs (Rs. 8.5 million) as well as
shoulder a cost of Rs. 26 Lakhs (Rs. 2.6 million) from production losses and treatment costs
incurred to fight malaria in the future. When viewed from a different vantage point, these
amounts could also be seen as the gains that would be reaped by having a stronger public
health programme and greater private awareness towards the adoption of disease prevention
measures. While there are substantial gains to be made, in this section we assess the costs to
the city of implementing these disease prevention programmes. Our estimates of the costs
that the city would bear in a business as usual scenario are presented in Figure 15.
We find that against program costs of Rs. 40-50 Lakhs (Rs. 4-5 million), Surat incurs benefits
of Rs. 111 Lakhs (Rs. 11.1 million) in productivity savings and treat costs avoided. These
costs are not discounted, but comparing the costs and benefits we can make a strong case for
the benefits of adaptation and stronger public health interventions to mitigate vector borne
diseases (Malaria) in the context of a warming climate.
While it is true that the SMC has introduced a series of innovative steps to control vector-
borne disease epidemics in its command area, the future may pose a number of severe
challenges for the city that would require fresh thinking and greater effort.
Figure 15: Costs of Malaria Incidence for Surat City
Source: Authors’ Calculations. Note: 1 crore = 10 million; 1 million = 10 lakh

27
8. Conclusions and Lessons for Surat
Studies show that in 1997, Surat city, with a population of 3.7% of Gujarat state, was
contributing 16% of total malaria cases and 28.8% of total Falciparum malaria cases in the
state. This number has fallen since then and despite the increase in city boundaries in 2006
the number of malaria cases reported has stayed stable. Regular surveillance of residential,
commercial, institutional and construction sites for mosquito breeding and putting street level
workers on the ground for early detection and prompt treatment of malaria has been an
important factor in the reduction of the disease burden and mosquito density in Surat (Desai
et al. 2015).
ARIMAX modeling for malaria incidence for Surat shows some interesting results. Using
temperature and precipitation patterns for the city, as well as incidence figures that existed
historically, the model shows that the prevalence of malaria would increase for the city in the
future and the number of malaria cases would grow significantly, including malaria cases
reported in the winter months as well. In addition to natural causes, checking or curbing
anthropogenic causes could prove to be a very challenging for the city’s government in
absence of innovative adaptation and mitigation efforts.
In this paper, we make an attempt to estimate the costs of public health interventions for
malaria in Surat city using a simple cost-benefit approach. In the estimation procedure, the
cost of health interventions include programme costs (Vector-borne Diseases Division in
SMC) as well as prevention costs (such as resident’s purchase of mosquito bed nets, etc.)
incurred by households. The benefits of interventions in this case are the avoidance of work-
days and income lost due to illness as well as malaria treatment (institutional and private
health centres) costs incurred by households.
We found that against a cost of Rs. 4 or 5 million in program costs, the city saves Rs. 11.1
million through income and productivity losses and treatment costs prevented. This suggests
that there are real economic benefits from investing in climate adaptation to control vector
borne diseases in rapidly growing urban areas. In future work more sophisticated modeling of
projections as well the discounted stream of costs and benefits would be useful in taking
these ideas forward.

28
References
Anvikar, A. R., Arora, U., Sonal, G.S., Mishra N., Shahi, B., Savargaonkar, D., Kumar
N., Shah N.K., Valecha, N. (2014), Antimalarial Drug Policy in India: Past, Present
& Future, Indian J Med Res 139, pp.205-215
Ashwani Kumar, Neena Valecha, Tanu Jain, and Aditya P. Dash (2007) “Burden of
Malaria in India: Retrospective and Prospective View “Am. J. Trop. Med. Hyg.,
77(Suppl 6), 2007, pp. 69–78 Copyright © 2007 by The American Society of Tropical
Medicine and Hygiene.
Beebe, N. W., Cooper, R. D., Mottram, P., & Sweeney, A. W. (2009). Australia’s dengue
risk driven by human adaptation to climate change. PLoS Neglected Tropical
Diseases, 3(5), e429. doi:10.1371/journal.pntd.0000429
BPMC Act, Vadodara Mahanagar Seva Sadan Website, Downloadable at
https://vmc.gov.in/Pdfuvmc/bpmcact.pdf.
Craig, M.H., Snow, R.W., and le Sueur, D. (1999) A climate-based distribution model of
malaria transmission in sub-Saharan Africa, Parasitology Today 15(3):105–111
Ebi, K. L. (2008). Adaptation costs for climate change-related cases of diarrhoeal disease,
malnutrition, and malaria in 2030. Globalization and Health, 4, 9. doi:10.1186/1744-
8603-4-9.
Ermert, V., Fink, A. H., Jones, A.E. & Morse, A. P. (2011), Development of a new version
of the Liverpool Malaria Model. I. Refining the parameter settings and mathematical
formulation of basic processes based on literature review, Malaria Journal, Volume
10, Pp. 1-17.
Ermert V., Fink A.H., Morse A.P., and Paeth H. (2012) The impact of regional climate
change on malaria risk due to greenhouse forcing and land-use changes in tropical
Africa. Environmental Health Perspectives, 120(1):77–84
Garg, A., Dhiman, R. C., Bhattacharya, S., & Shukla, P. R. (2009). Development, malaria
and adaptation to climate change: a case study from India. Environmental
Management, 43(5), 779–89. doi:10.1007/s00267-008-9242-z
González, C., Wang, O., Strutz, S. E., González-Salazar, C., Sánchez-Cordero, V., &
Sarkar, S. (2010). Climate change and risk of leishmaniasis in north america:
predictions from ecological niche models of vector and reservoir species. PLoS
Neglected Tropical Diseases, 4(1), e585. doi:10.1371/journal.pntd.0000585
Hewitson, B. C. & Crane, R. G. (2006). Consensus between GCM climate change
projections with empirical downscaling: precipitation downscaling over South Africa.
International Journal of Climatology, Volume 26, Pp 1315-1337.

29
Hoshen,. M.B., and Morse, A.P. (2004), A weather-driven model of malaria transmission,
Malaria Journal, 3:32-46
IPCC ( 2000). Emissions Scenarios. Cambridge University Press, UK. pp 570.
Jones, A. E., and Morse, A.P. (2010) Application and Validation of a Seasonal Ensemble
Prediction System Using a Dynamic Malaria Model, Journal of Climate 23:4202–
4215.
MacLeod, D. A., Jones, A., Di Giuseppe, F., Caminade, C., & Morse, A. P. (2015).
Demonstration of successful malaria forecasts for Botswana using an operational
seasonal climate model. Environmental Research Letters, 10(4), 044005.
doi:10.1088/1748-9326/10/4/044005
MOEF (2012). India: Second National Communication to the United Nations Framework
Convention on Climate Change, Ministry of Environment and Forests, Government of
India. Downloadable from-http://moef.nic.in/downloads/public-information/India%20
Second%20National%20Communication%20to%20UNFCCC.pdf
NSSO (2011) Consumer Expenditure Survey, 66th
Round July 2009-June 2010, National
Sample Survey Organisation, Ministry of Statistics and Programme Implementation,
Government of India.
NSSO (2012) Employment and Unemployment Survey, 66th
Round, July 2009-June 2010,
National Sample Survey Organisation, Ministry of Statistics and Programme
Implementation, Government of India.
Pawar, A. B., Bansal R. K., Kumar M., Jain N. C., and Vaishnav K. G. (2008), A Rapid
Assessment of Mosquito Breeding, Vector Control Measures and Treatment Seeking
Behavior in Selected Slums of Surat, Gujarat, India, During Post-Flood Period, J
Vector Borne Dis 45, pp.325-327
Peters, D., Yazbeck, A., Ramana, G., Sharma, R., Pritchett, L., Wagstaff, A., et al. 2001
Raising the sights: Better health systems for India’s poor (Washington, DC; The
World Bank).
Ramakrishnan, S. K. (2011). Adaptation cost of diarrhea and malaria in 2030 for India.
Indian Journal of Occupational and Environmental Medicine, 15(2), 64–7.
doi:10.4103/0019-5278.90376
Sarika Jain, and T. D. Chugh (2011). An overview of malaria burden in India and road-
blocks in its control. Journal of Clinical and Diagnostic Research, 5:915-916.
Available from
http://www.jcdr.net/back_issues.asp?issn=0973709x&year=2011&month=October&v
olume=5&issue=5&page=915-916&id=1578

30
Shivanand Swamy, H.M., Vyas A., Narang, S., (2009), Transformation of Surat, Gujarat, to
Second Cleanest city in India, Urban Management Programme for Asia & the Pacific
SMC (2013), Disease Statistics, Surat Municipal Corporation Website, Downloadable at
http://www.suratmunicipal.gov.in/e-Gov_DiseaseStatastics/DiseaseReport_Main.aspx
Snow, R. W., Craig, M., Deichmann, U. and Marsh, K.(1999) Estimating mortality,
morbidity and disability due to malaria among Africa’s non-pregnant
population. Bulletin of the World Health Organization. 77, 624–640.
Tompkins, A.M., & Ermert, V., (2013) A regional-scale, high resolution dynamical malaria
model that accounts for population density, climate and surface hydrology, Malaria
Journal, Volume 2, No. 65, Pp. 1-24.
WHO (2003), Making Choices in Health: WHO Guide to Cost-Effectiveness Analysis, World
Health Organisation, Geneva.

31
Annexure
Annexure 1: Malaria Forecasting
Amrita Goldar and Flavy Sen
Malaria Forecasting Model
The exact model and best fit for the current paper was derived using the Box and Jenkins
methodology. Box and Jenkins (1970) proposed an iterative approach to time series modeling
with three steps:
1. Identification – determination of the order of the ARIMA model
2. Estimation: Once the model has been identified, the objective is to minimize the sum of
square of errors
3. Diagnostic Checking – Model validation and adequacy checks using tests.
Forecasting of future disease incidence was done using the best fit framework derived
following the above methodology.
Identification
The dependent variable i.e. the number of malaria cases was non-stationary however it was
found that by taking first difference, the data series became stationary (Annexure 1). Dickey-
Fuller test for testing unit roots were done for both actual and differentiated series. The
scatter diagram of the differentiated series shows no evidence of increased variance over
time.
Plausible models were identified from the autocorrelation functions (ACF) and partial
autocorrelation functions (PACF). The model diagnostic was performed using Bayesian
Information Criteria (BIC) and p-values. These helped identify the autoregressive and
moving average processes of the dependent variable.
Note that the standard ARIMA framework uses past data for its model fits which may not be
able to fully incorporate future shocks arising from unprecedented changes such as that of
climate. Thus, to bring in the climate variability aspect, we use the ARIMAX model, to
predict the malaria cases using data for both climatic factors and past cases as explanatory
variables. The predictors in the model included the number of cases in the previous months,
maximum and minimum temperature, and monthly cumulative precipitation levels. The
climate covariates have been lagged by one month to model the time taken on an average for
gonotrophic and sporogonic cycles to complete15
. These climatic covariates were lagged at
one month to allow for sufficient time to complete life cycle of vector which takes around
two weeks and subsequently complete the generation of parasites in the new host for two
weeks.
15
These climatic covariates were lagged at one month because Anopheles vector takes two weeks to complete
their life cycle and additional two more weeks for the generation of parasites in the new host
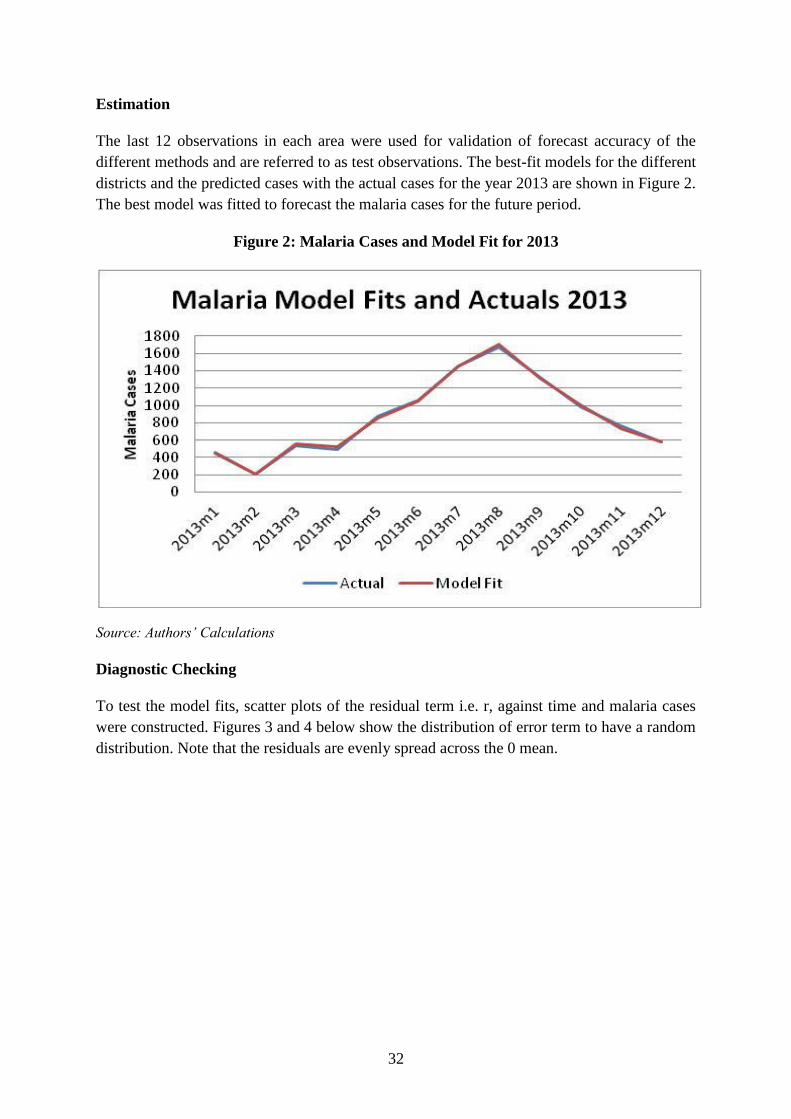
32
Estimation
The last 12 observations in each area were used for validation of forecast accuracy of the
different methods and are referred to as test observations. The best-fit models for the different
districts and the predicted cases with the actual cases for the year 2013 are shown in Figure 2.
The best model was fitted to forecast the malaria cases for the future period.
Figure 2: Malaria Cases and Model Fit for 2013
Source: Authors’ Calculations
Diagnostic Checking
To test the model fits, scatter plots of the residual term i.e. r, against time and malaria cases
were constructed. Figures 3 and 4 below show the distribution of error term to have a random
distribution. Note that the residuals are evenly spread across the 0 mean.
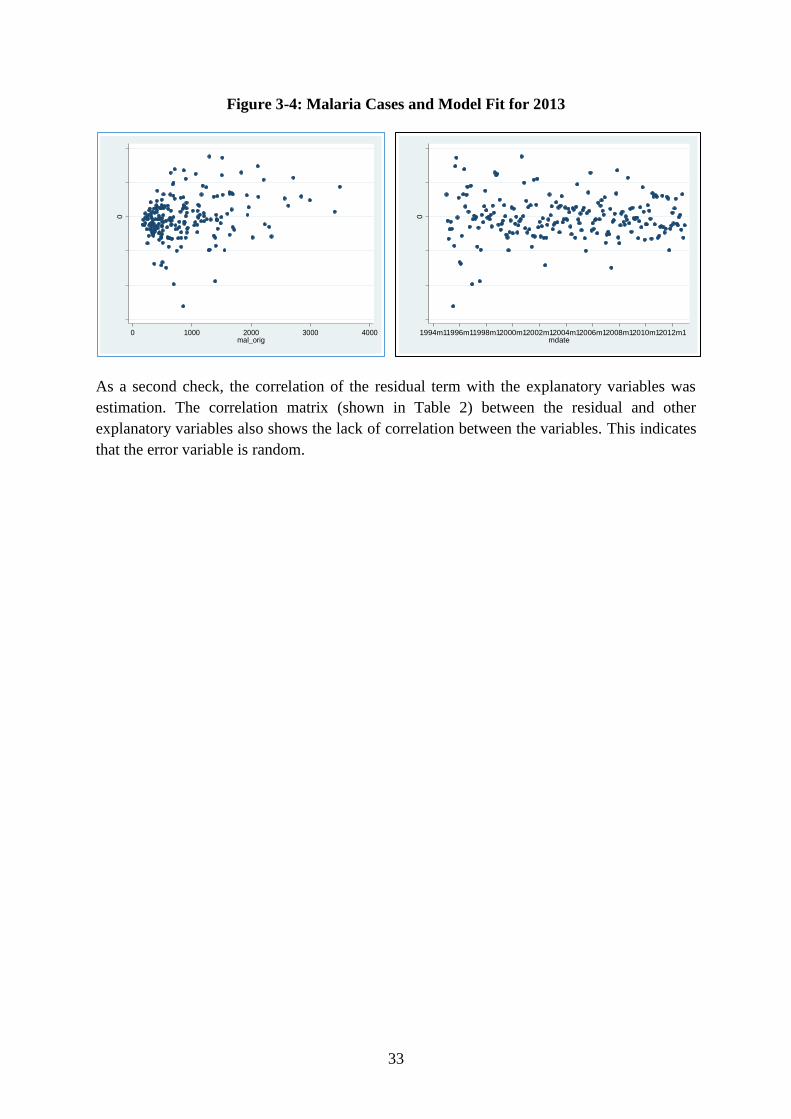
33
-600
00
00
-400
00
00
-200
00
00
0
200
00
00
400
00
00
resid
ua
l, o
ne
-ste
p
0 1000 2000 3000 4000mal_orig
-600
00
00
-400
00
00
-200
00
00
0
200
00
00
400
00
00
resid
ua
l, o
ne
-ste
p1994m11996m11998m12000m12002m12004m12006m12008m12010m12012m1
mdate
Figure 3-4: Malaria Cases and Model Fit for 2013
As a second check, the correlation of the residual term with the explanatory variables was
estimation. The correlation matrix (shown in Table 2) between the residual and other
explanatory variables also shows the lack of correlation between the variables. This indicates
that the error variable is random.

34
Table 2: Correlation Matrix between Residual and other Explanatory Variables
Residual Max. Temp (with 1 lag) Min. Temp. (with 1 lag) Precipitation (with 1 lag)
Residual 1.0000
Max. Temp (with 1 lag) 0.0094 1.0000
Min. Temp. (with 1 lag) 0.0567 0.2734 1.0000
Precipitation (with 1 lag) 0.0939 -0.4001 0.4327 1.0000
Annexure 2: SMC Vector Borne Disease Control Programme- Information of Activities
Intra Domestic Survey Peri Domestic Survey
Fish
Released Notice
Adm.
Charge
Source
Reduction
Fogging
Machine
No. of
Houses
checked
Breeding
Spot Anoph. Aedes Culex Mix Total
Checked
Construction
Breeding
Spot Anoph. Aedes Culex Mix Total
Jeep
Mounted
Handy
Sets
2003 8381430 21438736 27917 58882 2617 6548 95964 36844 1086779 14466 2220 23076 10042 49804 12879 21569 1054300 0 2137 45335
2004 9345558 21888292 39974 59795 2278 11387 113434 48865 1249733 12677 2624 23889 10822 50012 10444 17207 980095 104161 2282 38626
2005 9491873 23272999 28605 52719 1626 6590 89540 45991 1244955 10026 1521 23818 8830 44195 11288 17125 945165 69903 2375 42129
2006 12032015 25418621 48882 61364 1685 10791 122722 44597 1423301 12081 2099 28157 12676 55013 12395 18692 1089741 95442 3241 42222
2007 12745881 28857567 41760 51712 1579 7743 102794 67395 1628437 10285 2512 26343 9890 49030 12675 23133 1886250 114449 1883 27973
2008 12239012 26780569 34063 42747 1571 7270 85651 62335 1751910 14081 3037 26604 11342 55064 13525 30405 2716600 77079 1949 30328
2009 15388463 29724560 49052 71526 808 9019 130417 55565 1573692 13381 2887 28560 11345 56173 12430 33122 2475410 72454 1234 30314
2010 19612589 39630246 54644 90599 1032 12493 158768 67574 1899497 21805 3501 33428 15112 73846 14047 41060 3986675 102214 1453 31967
2011 14971336 30197652 48888 64969 782 11216 125855 70609 2038143 20995 3368 31893 14875 71131 13044 48814 4851049 165933 1470 31513
2012 17373742 35093904 41859 66509 615 10670 119653 86082 2274208 17708 3930 27747 12565 61950 9181 45263 4476925 120792 2249 38180
2013 8227123 17785370 14132 21468 228 3527 39355 41954 1084035 5811 1220 12104 4471 23606 4056 20313 2699850 66867 1027 17513
Source: Surat Municipal Corporation

35
LATEST ICRIER’S WORKING PAPERS
NO. TITLE AUTHOR YEAR
372 TRADE EFFECTS OF
STANDARDS
HARMONIZATION IN THE EU:
IMPROVED ACCESS FOR
NON-EU PARTNERS
ANIRUDH SHINGAL
MALTE EHRICH
APRIL 2019
371 CLIMBING UP INDIA’S
MANUFACTURING EXPORT
LADDER: HOW COMPETITIVE
ARE INTERMEDIATE GOODS?
DEB KUSUM DAS
NEHA GUPTA
APRIL 2019
370 THE PROBABILITY OF
GETTING A LOAN: EVIDENCE
FROM INDIAN CITIES
SAON RAY
SMITA MIGLANI
SANDEEP PAUL
FEBRUARY 2019
369 EXPLAINING THE
CONTRACTUALISATION OF
INDIA’S WORKFORCE
RADHICKA KAPOOR
P. P. KRISHNAPRIYA
JANUARY 2019
368 THE ANOMALY OF WOMEN’S
WORK AND EDUCATION IN
INDIA
SURBHI GHAI DECEMBER 2018
367 THE GROWING IMPORTANCE
OF CONSUMER FINANCE FOR
FINANCIAL INCLUSION IN
INDIA
SAON RAY
SMITA MIGLANI
SANDEEP PAUL
DECEMBER 2018
366 INNOVATION, EFFICIENCY
AND INCLUSION:
INTEGRATION OF DIGITAL
TECHNOLOGIES IN THE
INDIAN MICROFINANCE
SECTOR
SAON RAY
SANDEEP PAUL
SMITA MIGLANI
OCTOBER 2018
365 TRADE, TRADE
AGREEMENTS AND
SUBSIDIES: THE CASE OF THE
INDIAN APPAREL INDUSTRY
ARPITA MUKHERJEE
ANUSREE PAUL
ANGANA PARASHAR SARMA
SOHAM SINHA
OCTOBER 2018
364 SKILL MISMATCH AND
RETURNS TO EDUCATION IN
MANUFACTURING: A CASE
OF INDIA’S TEXTILE AND
CLOTHING INDUSTRY
PRATEEK KUKREJA SEPTEMBER 2018
363 EMERGING TRENDS IN
INDIA-PAKISTAN TRADE
NISHA TANEJA
SAMRIDHI BIMAL
VARSHA SIVARAM
AUGUST 2018
362 HIGH-SKILLED LABOUR
MOBILITY IN AN ERA OF
PROTECTIONISM: FOREIGN
STARTUPS AND INDIA
ARPITA MUKHERJEE
AVANTIKA KAPOOR
ANGANA PARASHAR SARMA
JULY 2018

36
About ICRIER
ICRIER, one of India’s leading think tanks, was established in August 1981 as a not-for-
profit research organisation to provide a strong economic basis for policy making. Under the
current Chairperson, Dr. Isher Judge Ahluwalia, ICRIER has continued and reinforced the
pursuit of its original vision and in the process significantly expanded the scope of its
research activities.
ICRIER is ably supported by a Board of Governors, which includes leading policy makers,
academicians, opinion makers and well-known representatives of the corporate world.
ICRIER’s success lies in the quality of its human capital. Led by Dr. Rajat Kathuria, Director
& Chief Executive, ICRIER’s research team consists of highly qualified professors, senior
fellows, fellows, research associates and assistants and consultants.
ICRIER conducts thematic research in the following eight thrust areas:
1. Macroeconomic Management, Financial Liberalisation and Regulation
2. Global Competitiveness of the Indian Economy – Agriculture, Manufacturing and Services
3. Challenges and Opportunities of Urbanisation
4. Climate Change and Sustainable Development
5. Physical and Social Infrastructure including Telecom, Transport, Energy and Health
6. Skill Development, Entrepreneurship and Jobs
7. Asian Economic Integration with focus on South Asia
8. Multilateral Trade Negotiations and FTAs
International conferences, seminars, public policy workshops, public lectures and
publications form an integral part of ICRIER’s outreach activities. ICRIER maintains a wide
network of resource persons from India and abroad. It strives to attract well-qualified
researchers, provides them a stimulating and scholarly work environment and encourages
researchers to work in teams. ICRIER’s research is widely cited by both academia and the
popular press, and has over the years provided critical inputs for policy making.