working paper 5 - international initiative for impact ... · 3ie working paper series covers both...
TRANSCRIPT

About 3ie The International Initiative for Impact Evaluation (3ie) works to improve the lives of people in the developing world by supporting the production and use of evidence on what works, when, why and for how much. 3ie is a new initiative that responds to demands for better evidence, and will enhance development effectiveness by promoting better informed policies. 3ie finances high-quality impact evaluations and campaigns to inform better program and policy design in developing countries. 3ie Working Paper series covers both conceptual issues related to impact evaluation and findings from specific studies or systematic reviews. The views in the paper are those of the authors, and cannot be taken to represent the views of 3ie, its members or any of its funders. This Working Paper was edited by Dr. Howard White, 3ie Executive Director. Photograph: Rong Shoujun / Xinhua Press / Corbis3ie Working Paper Series Production Team: Christelle Chapoy, Radhika Menon and Mukul Soni © 3ie, 2009
Acknowledgment I thank Howard White for launching this study and providing crucial advice and support . Significant assistance was provided by Ron Bose, Rizwana Siddiqui, and Katie Hsih. Several humanitarian and development experts generously shared their time and insights, inc luding Tony Beck, John Cosgrave, Angus Deaton, Jodi Nelson, and Karen Proudlock . Jishnu Das and Tahir Andrabi provided details on the World Bank evaluation study. The study would not have been possible without the cooperation and enthusiasm of several key officials of the Pakistan Earthquake Reconstruction and Rehabilitation Authority, including the Deputy Chairman, Lt. General Sajjad Akram; Dr. Ghulam Mustafa; and Ahmed Sheikh of DFID’s Technical Assistance team. I am grateful for their collaboration on the case study and hope that it contributes to ERRA’s extraordinary efforts on behalf of the earthquake-affected communities in northern Pakistan. The study was funded by the International Initiative for Impact Evaluation. The views (and any errors) expre ssed here are mine and cannot be taken as those of 3ie of its members or supporters.
1
IMPACT EVALUATION IN THE POST-DISASTER SETTING: A CONCEPTUAL DISCUSSION IN THE CONTEXT OF THE 2005 PAKISTAN EARTHQUAKE Alison Buttenheim Robert Wood Johnson Health & Society Scholar Program University of Pennsylvania Email: [email protected]
Abstract There is growing interest in impact evaluation in both the humanitarian and the development sectors. Several recent reports have identified post -disaster impact evaluation (PDIE) as a particular challenge and have galvanized interest in pushing the field forward. This study reviews existing work, synthesizes a set of guiding principles and anal ytic frameworks for PDIE, and applies those to a design for the evaluation of relief and recovery programs following the 2005 Pakistan earthquake. The study contributes to ongoing discussions of impact assessment within the humanitarian sector while also introducing impact evaluation practitioners to the specific issues related to conducting quality impact evaluations in post -disaster settings.
2

1. Introduction Natural disasters befall human settlements every year. Disasters are particularly destructive to vulnerable populations, and can contribute to cycles of poverty and poor health that are extremely difficult to break. In response to disasters, the humanitarian and development communities invest billions of dollars each year in relief and recovery efforts. For example, in October 2009, as this study was being completed, two natural disasters struck in rapid succession: an earthquake in Sumatra, Indonesia, and a tsunami in Samoa. The humanitarian community responded quickly, bringing needed resources and relief to affected communities. Flash appeals were issued, and funded. In the months and years ahead, considerable additional resources will be needed to rebuild lives and livelihoods . As humanitarian and development practitioners, we would like to say with confidence, “Here’s what works. We have learned from prior disasters.” We would like to help affected communities leverage their existing expertise and capital in pursuit of a successful recovery. Of course, we would also like to look back on these sizable investments in relief and recovery and be able to tell funders, “These investments were well spent. Positive, measurable change occurred. Here’s how we know, and here’s what we n eed to do differently next time.” Our ability to make such statements in Sumatra and Samoa is, unfortunately, probably quite limited, as it is in most disaster settings. As with many sectors in development, to date there have been very few impact evaluatio ns of post-disaster relief and recovery programs to draw upon as the basis for such conclusions. However, there is growing interest in impact evaluation in both the humanitarian and the development sectors. Several recent reports have identified post-disaster impact evaluation (PDIE) as a particular challenge and have galvanized interest in pushing the field forward (ALNAP, 2006; Beck, 2003; Hofmann, Roberts, Shoham, et al., 2004; Proudlock, Ramalingam & Sandison, 2009; World Bank, 2006) . Reflecting debates in development evaluation, and evaluation more widely, there have been discussions over the meaning of impact and the appropriate means for its assessment. This debate has concerned the appropriate balance between, and mix of, quantitative and qualitative methods, and within the former whether randomized control trials are either the only credible form of impact analysis or wholly inapplicable in a humanitarian set ting. However, there is broad consensus that a more rigorous and systematic approach to PDIE is needed. Reflecting this awareness, the recently-established International Initiative for Impact Evaluation (3ie) has commissioned this study to review existing work in the field, synthesize a set of guiding principles and analytic frameworks for PDIE, and apply those to a design for the evaluation of the experience of the 2005 Pakistan earthquake. This paper is primarily aimed at two audiences. First, the paper is a contribution to on-going discussions of impact assessment of post-disaster interventions amongst those working in the field, especially those responsible for monitoring and evaluation. Second, the paper introduces those in the field of impact evaluation to specific issues related to conducting quality impact evaluations of post-disaster interventions. Four questions at the center of debate and discussion about PDIE. First, in what ways do natural disasters create a distinct context and unique set of challenges for post-disaster impact evaluation? Second, how has PDIE been approached in the development and humanitarian sectors in the past, and what lessons can be dra wn from these previous experiences? Third, can I identify a useful framework for rigorous PDIE that can shape future evaluation efforts in the humanitarian sector? And finally, how might such a
3

framework be applied in case study of the 2005 Pakistan Earthquake?
2. Disasters: Natural events, human consequences, institutional responses
Natural disasters are extreme natural events that can shatter lives, ravage communities and undo years of economic development in the space of hours or even minutes. The Center for Research on the Epidemiology of Disasters (CRED) defines a natural disaster as “a situation or event which overwhelms the local capacity, necessitating a request to a national or international level for external assistance; an unforeseen and often sudden event that causes great damage, destruction, and human suffering” (Below, Guha-Sapir, le Polain de Waroux, et al., 2008, p. 2). Natural disasters include biological (epidemics, insect infestations, animal attacks), geophysical (earthquakes, volcanoes, dry mass movements), climatological (droughts, extreme temperatures, wildfires), hydrological (floods, wet mass movements), and meteorological (storms) events. CRED labels an event a disaster if at least of the following criteria are met: 10 or more people reported killed, 100 or more people reported affected, a declaration of state of emergency, or a call for international assistance. In 2007 there were 414 natural disasters affecting more than 211 million people, with 16,847 lives lost and more than USD 100 billion in da mages (Below, et al., 2008). The number and severity of natural disasters, and specifically of hydro - meteorological events (floods and storms), have increased across the globe in recent decades. The number of floods increased by more than 8% per year from 2000 -2007, with notably steep increases in the frequency of tropical cyclones. There is mounting evidence that global climate change may be contributing to more frequent and severe tropical storms and attendant flooding (Few, Ahern, Matthiers, et al., 2004). The economic impact of these disasters is large. Disaster impact is also concentrated in several ways. First, most disasters occur in a relatively small number of countries. Second, “mega-disasters” are usually responsible for a large proportion of total l osses each year. Third, disaster impact is particularly destructive in vulnerable communities in developing regions that may have limited capacity to mitigate disaster impact, or to respond and recover. Loss of housing, productive assets, and other critica l forms of capital and infrastructure severely undermine ongoing efforts to achieve sustainable growth. Finally, the impact of disasters and the burden of post -disaster recovery may be borne disproportionately by women (Enarson, 1998; Enarson & Morrow, 1998) . While the impacts of natural disasters v ary by disaster type, geographical location, and economic status of the affected region—but all require significant emergency relief in addition to long-term recovery and reconstruction assistance. Disaster relief and recovery progresses through recognized phases from immediate rescue efforts through provision of emergency relief supplies such as food, water, shelter and clothing to longer term recovery and rehabilitation efforts that rebuild permanent housing, schools, and other infrastructure and assist disaster victims with long-term health and livelihoods interventions. Responsibility for disaster relief and recovery is shared by local communities, local and national governments, international humanitarian agencies, and the development community. Each institution has its own policies and procedures for the provision of relief and recovery programs, and coordination among the various institutions is usually critical to the success of post-disaster efforts.
4

Approximately USD 10.4 billion went to post -disaster relief and recovery programs from 2004-2008, with the bulk of this funding coming in 2005 after the Indian Ocean tsunami (ReliefWeb, 2009). While this figure is dwarfed by the estimated damage caused by natural disasters during the same period (and does not include support provided by local affected communities on behalf of neighbors and family), it still represents a sizable investment of public and private dollars. The size of this investment necessitates careful and rigorous evaluation of the impact of relief and recovery programs, so that the humanitarian and development communities can answer the important questions: “Could we have done better?” and “How mi ght we do better in the future?” The rest of this study addresses how to undertake impact evaluation in the post-disaster context.
3. Impact Evaluation
Defining impact evaluation Definitions of impact evaluation and the characteristics of “good” or “rigoro us” impact evaluations have been discussed extensively elsewhere (e.g., Bamberger, Rugh & Mabry, 2006; Savedoff, Levine, Birdsall, et al., 2006; White, 2005; White, 2007) . The founding document of 3ie defines rigorous impact evaluation studies as “analyses that measure the net change in outcomes for particular group of people that can be attributed to a specific program using the best methodology available, feasible, and appropriate to the evaluation question that is being investigated and to the specific context.” (3ie, 2008, p. 2) . Three important features of impact evaluation are highlighted here to frame the discussion of post-disaster impact evaluation. First, impact evaluation is distinc t from process evaluation, meaning that it is concerned explicitly with the final welfare outcomes of project beneficiaries, and not only with the set of project inputs, activities and outputs that comprise the intervention. This is not to say that an impact evaluation will not contain elements of a process evaluation, it should do so, but the focus on final welfare outcomes is a key element that has to be present. The second important feature of sound impact evaluation is that the analysis of outcomes is explicitly linked to inputs, activities and outputs through a logical framework (logframe) or similar theory-driven model; hence the statement in the preceding paragraph that a quality impact evaluation will encompass a process evaluation (though the conv erse need not be true). This reliance on a theory -based approach means that a quality impact evaluation will adopt a mixed methods approach. The final key feature of impact evaluation of relevance for this study is its use of some form of (explicit or implicit) counterfactual analysis—an analysis that tackles the attribution question. The counterfactual simply refers to what would have happened , on average, to beneficiaries in the absence of the intervention. Such a counterfactual is most typically constructed by comparing outcomes for a sample of the beneficiary population (the treatment group(s)) with outcomes for a sample of those not receiving the treatment (the comparison group).1 In combination, a theory-driven logframe and a valid counterfactual
1 The expression control group is often used. The term control group is restricted here to the comparison group in randomized control trials when there is, indeed, control over who enters the treatment and comparison groups.
5

allow evaluators to attribute observed differences in welfare outcomes (across groups or over time) to the specific intervention or set of interventions being evaluated.
Impact evaluation ABCs: Attribution, bias, and the counterfactual In practice, identifying an appropriate counterfactual – that is, answering the attribution question - is challenging for at least two reasons. First, selection bias is exceedingly common—programs and other interventions are not typically assigned randomly to communities, and individuals often have some degree of choice about participation. That is selection bias can arise from program placement, self -selection or both. Therefore, program beneficiaries are likely to differ from non -beneficiaries, and any observed differences in outcomes could be due to these underlying differences and not to the intervention of difference. Examples of this kind of selection bias are rampant in the humanitarian sector and in post -disaster settings. For example, households that receive a housing reconstruction grant (the treatment group) might be shown after the intervention to have worse sanitation facilities than households that received no such grant (the comparison group). Does this mean that housing grants were not effect ive? If poorer households were targeted for housing grants, then this question is impossible to answer, as they likely had worse sanitation facilities prior to the disaster. A second challenge to establishing a counterfactual, particularly in post -disaster settings, is contamination from spillover effects. Contamination refers to the ‘ comparison’ community receiving an intervention which affects the outcomes of interest – thus violating the requirement that the control be like the ‘treatment’ group in all respects other than the presence of the treatment. Spillover effects occur when the intervention affects those outside the treatment group. If an intervention is implemented in one community, but not in a neighboring community, residents from the neighboring community may travel to take advantage of the intervention. The neighboring community will thus make a poor comparison group for purposes of evaluation. In contexts like post -disaster relief and relief programs, where several institutions may be implem enting multiple programs, it is also difficult to attribute any observed welfare changes to one specific program. There are two problems. First, the ‘comparison group’ where we are not carrying out the intervention may receive a similar intervention (or any intervention which affects the same outcomes as we hope to affect), thus ‘contaminating’ the comparison group. Second, benefits may ‘spillover’ outside the area in which we are measuring benefits. When these spillovers affect the comparison group, then this is a special case of contamination. These problems underlie one of the most common evaluation approaches used in the development and humanitarian fields: a before -vs.-after or pretest-posttest comparison of outcome indicators for program beneficiaries—tracking outcomes in the treatment group with no reference to a comparison group. Of course, this method requires a baseline or pre -intervention observation of beneficiaries, which is not always available. In the absence of a true baseline, retrospectiv e data can be used in various ways to construct a baseline after the fact (Bamberger, 2009; White, 2007). With no baseline, an evaluator must focus on one of the most common evaluation designs—the cross-sectional, ex-post evaluation. A stronger design will, as mentioned above, use a comparison group of non -beneficiaries (or program participants who received a different intervention or at a different time). If only
6

post-intervention data are available, a single -difference design is possible, comparing outcomes in treatment vs. comparison groups. If baseline data are also available, a double difference or difference-in-difference design is possible. Recently, other quasi -experimental techniques such as propensity score matching, regression discontinuity designs, an d instrumental variable approaches have also been promoted as ways to address selection problems by ensuring a good quality match between the treatment and comparison g roups. Statistically sophisticated and requiring strong assumptions about treatments and beneficiaries, these methods can be very useful but are by no means magic bullets (Bertrand, Duflo & Mullainathan, 2004; Deaton, 200 9; Diaz & Handa, 2006; White, 2007) . A recent innovation in the development of program evaluation methodologies has been the use of randomized control trials. RCTs w ere first developed for agricultural and medical applications, where the random assignment of treatments or interventions is fairly straightforward. Their use in the social sciences and in the development and humanitarian sectors is potentially more difficult and controversial. It is argued that randomizing interventions is unethical for at least two reasons: First, because it withholds needed resources from eligible recipients, and second, because it undermines the full participation of beneficiaries. In reality, most programs are not immediately available all potential beneficiaries, implying that an untreated population is usually present which RCTs can leverage for the benefit of evaluation design. If resource constraints are made explicit, beneficiaries can in fact participate in the randomization process, particularly for staged or factorial designs. In this way, randomization can actually increase the transparency and perceived equity of aid. Analytically, RCTs have been argued to be less effective in evaluating complex or dynamic programs. Fortunately, a rich if sometimes contentious literature is emerging on how and whether randomized impact evaluations can be used effectively in the development and humanitarian fields, and on alternatives to randomized designs (see, e.g., Chambers, Karlan, Ravallion, et al., 2009; Deaton, 2009; Nelson, 2008; Proudlock, et al., 2009; Stern, 2008; West, Duan, Pequegnat, et al., 2008). As with any evaluation method, randomized designs must suit the evaluation question at hand as well as the program context. Where a randomized design is feasible and appropriate, it can go a long way towards establishing a causal link between intervention and outcome. When a randomized interventio n is not feasible or appropriate, another identification strategy must be used to establish the counterfactual.
4. Are disasters any different? This study presupposes that the post -disaster setting creates unique challenges for impact evaluation. “Post-disaster” means the period following a rapid -onset natural disaster, from the relief phase through the recovery and rehabilitation phases. “Post-disaster impact evaluation” (PDIE) means impact evaluation that is focused on the relief and recovery efforts as implemented by national and local governments, international humanitarian agencies, multilateral and bilateral aid agencies, and community -based and international NGOs. This definition suggests that PDIE is one subset or type of evaluation of humanitarian action, as defined by ALNAP :2
2 ALNAP (Active Learning Network for Accountability and Performance in Humanitarian Action) is an influential organization in the evaluation field, established in 1997 to improve communication and sharing among aid agencies and humanitarian organizations as they undertook performance reviews and evaluations of complex humanitarian
7

Evaluation of humanitarian action (EHA) is a systematic and impartial examination of humanitarian action intended to draw lessons to improve policy and enhance accountability. EHA:
• is commissioned by or in cooperation with the organisation(s) whose performance is being evaluated;
• is undertaken either by a team of non -employees (external) or by a mixed team of non-employees (external) and employees (internal) from the commissioning organisation and/or the organisation be ing evaluated;
• assesses policy and/or practice against recognized criteria (e.g., the DAC criteria); • articulates findings, draws conclusions and makes recommendations (ALNAP, 2006)
In what ways is the post-disaster context unique in the broader evaluation field? While there is considerable disagreement among evaluation and disaster experts on this issue, I propose the following distinct characteristics:
Rapid onset, highly covariant. Unlike many development interventions that may also be subject to impact evaluation, post -disaster relief is implemented very quickly in response to an unpredictable, rapid -onset event. While this is certainly less true for longer-term recovery programs that may follow a disaster, the crisis nature of immediate relief programs means that careful planning of the intervention (including targeting, establishing a logframe, setting specific objectives and indicators) may not be possible. Disasters are also a c ovariant shock, affecting most or all residents in the disaster region. This may limit the ability to target interventions or to rely on local institutions or communities for program management or evaluation support. Life-saving measures take priority. Related to the rapid-onset nature of disasters is the often life-or-death situation in the immediate post -disaster setting. When shelter, food, medical care and disease prevention take highest priority, impact evaluation is considered an impractical luxury. It could be argued that the components of emergency relief are also standard enough and well-enough understood that impact evaluation (as opposed to process evaluation) is not necessary in this context.3 Disordered/disrupted communities. Post -disaster re lief and recovery programs are by definition implemented in communities that have experienced severe disruption and disorder—circumstances that may persist for many months after the disaster. ALNAP cites several challenges to evaluating humanitarian action that stem from this level of disruption at the community level: lack of informants, difficulty in obtaining administrative data, communication challenges, and lack of clarity about the “normal” or “baseline” conditions in the community (ALNAP, 2006). Mismatch between resources and need. Some disasters generate enormous amounts of international attention and attendant resources, donations, and volunteers. Affected communities may be ill-equipped to take advantage of assistance, and the assistance offered may not best suit local needs. A rapid influx of large amounts of aid can lead to fragmentation, volatility, and poor targeting , as was seen in the Indian Ocean communities in the wake of the 2004 tsunami (Masyrafah & McKeon, 2008). All of these factors will complicate impact evaluation.
emergencies. ALNAP develops training materials and expert reports on evaluations, maintains the online Evaluative Reports Database (ERD), and publishes the annual Review of Humanitarian Action.
8

Absence of baseline data. Rarely does a disaster-affected area have an appropriate pre-disaster population-representative household sample to serve as a baseline to compare to post -relief or post -recovery outcomes. More commonly, some form of immediate post-disaster data collection has been unde rtaken as part of a needs assessment, but again, the sampling strategy for such needs assessments is usually not a good match for impact evaluation. Thus, baseline data must be reconstru cted through beneficiary recall, a controversial practice which need b e used with care. Choice of counterfactual. The appropriate counterfactual is usually easily identified in traditional development interventions – practitioners are interested in the outcomes of beneficiaries compared to the outcomes in the absence of the intervention. In the post-disaster context, several potential counterfactuals are of interest: The welfare of disaster-affected populations receiving relief and recovery assistance could in theory be compared to the welfare of non -affected populations, of affected populations prior to the disaster, to the affected population immediately post-disaster, or to similarly-affected populations who received no assistance. All of these comparisons may be of interest, and all of course present distinct threats to the validity of the evaluation.
Despite these important differences, impact evaluation in the post -disaster context shares many of the same challenges and constraints of other development contexts. These include:
Nonrandom impact of event. While the timing of a particular disaster is difficult to predict, the impact of the disaster is rarely distributed randomly in the population. Certain populations will be more vulnerable to disasters based on the location and condition of housing, household assets and resilience, household structure, social status, etc. As noted above, this makes the identification of a comparison group very difficult. Nonrandom allocation of interventions. While randomized control trials are increasing in popularity (and will be discussed in more detail below), very few intervent ions in the post-disaster context, at either the relief or recovery phase, are randomly allocated at either the household or the community level. As is the case with non -disaster interventions, there is understandable reluctance to use a randomized design in the disaster context, where withholding an intervention from one group appears impractical, or even unethical. Fragile states and vulnerable populations. Regions of the world that are particularly susceptible to natural disasters are often politically unstable, or have a high proportion of vulnerable or exceedingly poor people. This is of course also true of many development interventions. The political and socioeconomic context can create evaluation challenges by constraining local capacity for or commitment to evaluation, or by limiting the acceptability of evaluations that find little effect of popular programs or mismanagement of programs by governments or other institutions. Multiple concurrent interventions. In a post-disaster context, many institutions may be implementing multiple interventions for the same population. This can make program-specific attribution very difficult, although it may still be possible to evaluate general welfare outcomes for the population. However, this is not unique t o the post-disaster context. Many impact evaluations of development interventions also must account for possible contamination from other programs.
9

Inadequate population and administrative data. Lack of data with which to conduct rigorous impact evaluatio n is certainly not unique to the post-disaster setting. Sadly, investments in administrative data, vital statistics, and regular socioeconomic household surveys are inadequate in many countries. This can challenge the most basic evaluation functions, such as establishing a sampling frame, in both disaster and non-disaster settings.
PDIE presents all the “regular” difficulties of impact evaluation, plus the unique constraints of a large-scale, unexpected and disruptive event that further challenges evaluation attempts.
Impact evaluation and the humanitarian community Humanitarian aid agencies have a long -standing interest in evaluating the effectiveness of their assistance and interventions. The Development Assistance Committee of the OECD adapted their core set of principles or criteria for the evaluation of development initiatives specifically for complex emergency settings. These criteria, reviewed in detail in an ALNAP guide (ALNAP, 2006), include:
• Relevance/appropriateness • Connectedness • Coherence • Coverage • Efficiency • Effectiveness • Impact
In this context, “impact” is, in accordance with the DAC definition (OECD/DAC, 2002), defined as the broader, longer-term effect of a project, and is distinguished from “effectiveness”, which considers more short -term, intermediate objectives and outcomes. The ALNAP guide argues that impact evaluation may not be relevant in all contexts, “particularly those carried out during or immediate after an intervention” (ALNAP, 2006, p. 56), and advocates undertaking impact evaluation only when impact evaluation specialists are involved, a longitudinal analysis is possible, and adequate data are available. The attribution challenge is discussed briefly —how is it possible to attribute observed change to specific interventions as time progresses? The discussion assumes that quasi -experimental designs are rarely feasible in this contex t, and encourages the use of “informal” control groups where possible. Impact evaluation is identified as the “most challenging” aspect of humanitarian action evaluation. This understandable note of caution has typified discussions of impact evaluation throughout the humanitarian community. Interest in PDIE is, however, on the rise. In ALNAP’s 8th Review of Humanitarian Action, a full third of the report was devoted to the theory and practice of impact assessment (which I here consider to be synonymous with impact evaluation) in the humanitarian context (Proudlock, et al., 2009). The report traces the evolution of a more evidence-based, outcomes-oriented approach to the provision of humanitarian relief over the past two decades, and cites the many initiatives around impact evaluation currently underway across the sector and through the wide a id and development communities, including a randomized study of a community-driven reconstruction program in Liberia; a participatory impact assessment in drought -affected communities in Niger; impact assessment of FAO’s
10
emergency programs in DRC; and the Tsunami Recovery Impact Assessment and Monitoring System (TRIAMS) (discussed below in Appendix A). The report includes an eye-opening list of constraints to impact assessment in the humanitarian sector, including 1) the complexity of terminology surrounding impact assessment; 2) lack of skills and capacity for impact assessment within most humanitarian agencies; 3) the unique timing of project and budget cycles; and 4) an absence of an impact orientation at the institutional level (Proudlock, et al., 2009). Proudlock et al. also cite cultural biases against impact evaluation in humanitarian agencies, including the tendency to value action over analysis and risk aversion in the light of severely constrained resources. These constraints and biases have slowed progress towards establishing shared definitions of and methodologies for impact assessment. The report is careful to draw an important distinction between approaches to impact evaluations (“comparative vs. “theory-based”) and data collection and analysis methods (quantitative vs. qualitative). Comparative approaches are described as quantitative, counterfactual methods while theory -based approaches are look at underlying causal models or program theories to identify the links from program activities through outcomes. While the humanitarian community has often conflated these different aspects of evaluation (e.g., assuming that all counterfactual analyses must be quantitative, or that all case study or theory of change models must be qualitative), this report and other recent discussions should help clarify the distinction (Karlan, 2009; White, 2009b) . A third important message from the Proudlock et al. report is the importance of choosing evaluation methods to suit the evaluation task at hand, a common theme in discussions of evaluation in the humanitarian sector. A notable backlash against experimental methods (or at least against anointing experimental approaches as the “gold standard” in evaluation) has prompted several different algorithms or frameworks for matching evaluation methods to intervention characteristics or evaluation goals. Here Proudlock et al. cite Stern’s (2008) rubric:
• Standardized interventions in identical settings with common beneficiaries are best suited to experimental designs.
• Standardized interventions in diverse settings, possibly with diverse beneficiaries, are better suited to quasi-experiments and comparative approaches.
• Customized interventions in diverse settings with diverse beneficiaries are better suited to case studies, narratives, and qualitative approaches.
Another important recent study from the humanitarian community examines motivations and opportunities and options for joint humanitarian impact evaluation (Beck, 2009) commissioned by UNOCHA. The study outlines in detail the many questions and issues that would have to agreed upon before undertaking successfu l joint evaluation of humanitarian interventions. These include the purpose and use of joint evaluation, the conceptual framework to be used, the evaluation focus and scale (institutional vs. population), and methods. A set of pilot studies may emerge from the study, further evidence of the humanitarian community’s growing interest in impact evaluation.
5. Post-disaster impact evaluation: In theory In this section I lay out a framework for post -disaster impact evaluation. The framework is not a novel approach to evaluation, but rather a compilation of several evaluation principles,
11
tailored to the post -disaster setting, that can guide evaluators at any stage in the evaluation process. It is particularly useful in the planning stages of analysis when the goals of evaluation, resources available , and preferred methodology are still open for debate. The evaluation framework is informed b y a set of six key principles for theory-based impact evaluation (White, 2009b)3:
1. Map out the causal chain: Identify the program theory or theory of change that links inputs to outcomes and impacts. As discussed above, this may be very straightforward for emergency programs: Emergency food reduces hunger. Clean water prevents disease. For more complicated and long term recovery programs, a logframe or similar capture of program theory must be explicit about how resources will translate to positive change for beneficiaries.
2. Understand context: What is the social, political, economic and cultural environment in which the intervention is taking place? How will this environment shape program design and potentially condition program impact? The post -disaster setting is a unique and crucial context to consider, but it also varies from disaster to disaster.
3. Anticipate heterogeneity. It is very likely that interventions will have different impacts across groups and over time. This heterogeneity will shape sample size calculations and other study design questions.
4. Rigorous evaluation of impact with a credible counterfactual. The importance of a counterfactual has been discussed above—it is the base on which a compelling evaluation is built. It can be challenging to identify a counterfactual in post -disaster settings due to all of the factors discussed above .
5. Rigorous factual analysis. In addition to the counterfactual analysis, factual analysis is needed to confirm each step of the causal chain (e.g., are program reaching the targeted groups? Are partic ipants learning from training programs? Does new knowledge lead to changed behaviors?). In the post-disaster setting, correct targeting is of particular importance.
6. Use mixed methods. Qualitative and quantitative methods are extraordinarily complementary. In the context of a primarily quantitative evaluation, qualitative methods including interviews, observation, document review, and action research can and should be used throughout the evaluation: to form hypotheses, inform the log frame, develop questionnaires, and explore irregularities or anomalies in quantitative data. Conversely, impact evaluations that are primarily qualitative can also be enriched with quantitative analysis.
Selecting outcomes of interest As discussed above and elsewhere in the eva luation literature, the selection of outcomes to evaluate and the related outcome indicators is a critical step in the impact evaluation process. While I do not focus on that selection here, I reiterate what others have argued (Proudlock, et al., 2009): indicators should reflect the impact of the program on the people it serves, rather than capture the inputs, processes or outputs of the program or intervention being evaluated. While program indicators may be an important component of program evaluation, the emphasis should be on real, measurable changes in the lives of
3 White’s (2009b) paper discusses these principles in greater detail and illustrates theory-based impact evaluation in detail using the Bangladesh Integrated Nutrition Project as a case study. I merely summarize the principles here. See also the impact evaluation principles from a humanitarian aid perspective outlined in Proudlock et al. (2009).
12

beneficiaries.
Compared to what? I next outline the multiple comparisons (over time and across subgroups) that may be of interest in PDIE. The comparisons are presented in Figure 1. The first two columns of the top panel define, through formulae and through descriptions, the time periods of interest in PDIE. I define t-1 as the “baseline” or status of households prior to the disaster. Immediately after the disaster has struck, I define t0 as the “emergency” observation. After an initial set of interventions such as food transfers, housing reconstruction grants or livelihood supports have been implemented, households are observ ed at t1 (called the “relief/reconstruction” observation), which is the first post-intervention observation. Some time later, after the end of the intervention but still within the broad recovery time frame, we observe households again at t2 , the second post-intervention observation. In the second panel, I combine these four time periods into six single differences. The change from baseline to emergency reflects disaster-related losses. The difference in household outcomes between relief/reconstruction and the baseline shows whether the level of household welfare (whether it is housing, livestock assets, income, or health) has been restored to its baseline condition. This is probably the most common measure applied in PDIE, often relying on self -reports from beneficiaries at t1 for t-1 baseline measures. However, it is potentially also of interest how much welfare has improved related to the emergency (immediate post -disaster) time period, which is captured by t1-t0, and labeled “recovery from disaster”. If we can observe the household after some time has passed since the relief or recovery intervention, we can also assess the sustainability or persistence of the intervention through three different measures. First, t 2-t-1 reflects the sustained restoration of the household to its baseline status – in other words, has the household been able to maintain the restoration of assets, housing, income, etc. after the intervention has ended. Similarly, t2-t0 captures whether the recovery from the post -disaster nadir has been sustained. Finally, t2-t1 captures the short -term persistence of welfare outcomes after a program has ended or has been in operation for a period of time. The measures just discussed, shown in the second panel of Figure 1, are changes in the levels of outcomes over time. In the third panel, these changes are expressed as proportionate changes, which can reveal a slightly different aspect of welfare change for affected populations. The first metric is proportionate disaster losses, defined as
1
10
t
tt
−
−− . This
expression places the disaster-related losses (defined above) in the numerator, and divides by the baseline welfare measure. For example, two affected households may each have lost three water buffalo in a disaster. It is helpful to know, however, whether these three water-buffaloes represented all of a farmer’s large livestock ((3 -0)/3, or 100% loss), or a much smaller fraction, say (10-7)/10, or 30% loss. A rich literature in household vulnerability, asset traps and shocks re fers to this measure as “vulnerability to exposure to uninsured risk”; it can also be considered a measure of resilience to the disaster (Carter & Barrett, 2004; Carter, Little, Mogues, et al., 2007; Hoddinott & Quisumbing, 2003) . This measure is particularly useful to assess the impac t of pre-disaster interventions such as flood-proofing or livelihood diversity. The second proportionate measure is percentage of disaster losses that have been recovered. In the example above, the first farmer who lost all three of his water buffaloes may have received one new replacement water buffalo through a livestock grant program.
13

This farmer has thus recovered (1-0)/(3-0) or 33% of his losses. A transfer of one water buffalo to the second farmer will also restore (8-7)/(10-7) = 33% of his losses. B y this measure, the farmers have equally recovered their losses. The third measure is the proportionate restoration to baseline, calculated by dividing t 1 (post-intervention measure) by t-1 (the baseline). Following the farmer example, this measure would b e 33% for the first farmer (1/3) and 80% (8/10) for the second farmer. Taken together, the three proportionate measures give a dynamic portrait of the relative welfare of these two farmers.
14

Figure 1. (1) (2) (3) (4) (5)
Time Description Disaster-affected
households Unaffected households
Affected treated -Affected comparison
Affected treated- Unaffected
“Treated”
“Comparison”
“Unaffected ”
SINGLE DIFFERENCES (OVER TREATMENT GROUPS)
t-1 Baseline (pre-disaster) A-1 B-1 C-1 A-1-B-1 A-1-C-1 t0 Emergency (immediate post-disaster) A0 B0 C0 A0-B0 A0-C0 t1 Relief/Reconstruction (post-intervention #1) A1 B1 C1 A1-B1 A1-C1 t2 Recovery (post-intervention #2) A2 B2 C2 A2-B2 A2-C2 SINGLE DIFFERENCES (OVER TIME) DOUBLE DIFFERENCES IN LEVELS t0-t-1 t1-t-1
Disaster-related losses Restoration to baseline
A0-A-1 A1-A-1
B0-B-1 B1-B-1
C0-C-1 C1-C-1
(A0-A-1) – (B0-B-1 ) (A1-A-1) – (B1-B-1 )
(A0-A-1) – (C0-C-1 ) (A1-A-1) – (C1-C-1 )
t1-t0 t2-t-1 t2-t0 t2-t1
Recovery from disaster Sustained restoration to baseline Sustained recovery from disaster Persistence of recovery
A1-A0 A2-A-1 A2-A0 A2-A1
B1-B0 B2-B-1 B2-B0 B2-B1
C1-C0 C2-C-1 C2-C0 C2-C1
(A1-A0) – (B1-B0 ) (A2-A-1) – (B2-B-1 ) (A2-A0) – (B2-B0 ) (A2-A1) – (B2-B1 )
(A1-A0) – (C1-C0 ) (A2-A-1) – (C2-C-1
) (A2-A0) – (C2-C0 ) (A2-A1) – (C2-C1 )
PROPORTIONATE CHANGES
DOUBLE DIFFERENCES IN PROPORTIONATE CHANGES
1
01
t
tt
−
− −
Proportionate disaster losses (vulnerability/resilience)
1
10
?
??
−
−−
1
10
BBB
−
−−
1
10
BCC
−
−−
1
10
?
??
−
−−
– 1
10
BBB
−
−−
1
10
?
??
−
−−
– 1
10
CCC
−
−−
01
01
tt
tt
−−
−
Proportionate recovery of losses 10
01
−Α−ΑΑ−Α
10
01
−−−
BBBB
10
01
−−−
CCCC
10
01
−Α−ΑΑ−Α
– 10
01
−−−
BBBB
10
01
−Α−ΑΑ−Α
– 10
01
−−−
CCCC
1
1
t
t
−
Proportionate restoration to baseline
1
1
−ΑΑ
1
1
−BB
1
1
−CC
1
1
−ΑΑ
– 1
1
−BB
1
1
−ΑΑ
– 1
1
−CC
15

The next set of columns defines three different comparison groups of interest. The “A” group consists of households that have been affected by the disaster, and have received some form of intervention or program. Following the epidemiological convention, we label these the “treated” households, although there is no requirement that the intervention be randomly assigned or experimental in any way. The A households are observed at the four points in time. The second column displays a second group of households, “B” households, that are similarly affected by the disaster as the A households, but receive no treatment or intervention (or, alternatively, receive a different type of intervention or receive it later than the A households.) These are “ comparison” households (or, as discussed above, “control” households in an experimental context). Finally, the “C” households are not affected by the disaster, and are thus assumed to receive no program intervention or other assistance. We call these the “unaffected” households. Evaluation designs can, at least theoretically, sample and observe treatment, comparison, and unaffected groups at different points in time over the course of the disaster. The final two columns of the top panel show a set of first differences, but these are differences across groups rather than over time. At each time period, A -B represents the difference between treated and comparison households, while A -C captures the treated vs. unaffected difference. These differences include single differences in the top panel, double differences in levels in the second panel, and double differences in proportionate changes in the bottom panel.
Identifying the counterfactual of interest and attributing causality The framework in Figure 1 identifies multiple possible comparisons that can be made in an impact evaluation. Which comparison is chosen for a particular impact evaluation depends on the evaluation goals and the goals and logframe of the intervention. For example, A 1-A-1 and A2-A-1 , would show the short -term and medium-term impact of the intervention compared to a pre -disaster baseline. These would be of interest if the goal of a relief or recovery program was to restore households to their pre -disaster status. The difference in these two comparisons, (A2-A-1)-(A1-A-1), which simplifies to A2-A1 , shows the persistence of the impact after the completion of the intervention. This comparison might fulfill an evaluation goal of measuring program sustainability. However, these comparisons are still not able to attribute the outcomes we observe at A 1 and A2 to the interventions, because we do not know what would have happened to this group of households in the absence of the intervention. For this, we would ideally compare the A households to a different group, the B households, who also experienced the disaster but who received no recovery funds or programs. If we have access to pre -disaster data for both the treatment and the comparison groups, we can combine the two approaches above in a double -difference framework. This compares the change in outcome s for beneficiaries from pre- earthquake to post-intervention to the change in outcomes for a similarly affected group over the same time period. (These comparisons are identified in Figure 1 in Column (4), “affected treated-affected comparison.”) There is a strong consensus in the humanitarian sector that this sort of design is rarely feasible or ethical in the post -disaster context, because post-disaster interventions should never be withheld from affected groups. We argue that this may certainly be the case in the emergency response or relief phase of the disaster. However, it is not necessarily true for reconstruction or recovery projects. As argued elsewhere there are often opportunities based on the different timing or roll -out of projects, different targeting criteria, or different
16

organizations that may be implementing programs, to find an appropriate comparison group (Chambers, et al., 2009; White, 2005, 2007, 2009a). Another approach is to compare the “treated” groups (those affected by the disaster who received some intervention) to similar households who were not affected by the disaster. With post-intervention data only, the appropriate differences are A1-C1 or A2-C2. The double difference versions again reveal the success of the intervention over time, compared to an unaffected group receiving no intervention. Recall that multiple double -differences may be of interest: restoration to baseline, recovery from disaster, sustained recovery, etc. For all of these comparisons, however, how can we be sure that the differences across groups can be attributed to the intervention being evaluated? One way, of course, is for the intervention to have been randomly assigned to A and B households, and for A households and B households to be similar in terms of both pre -disaster measures (t -1) and exposure to the disaster (t0). In this case, B households would be true “controls”. To date, this approach has been rare. Instead, evaluators have relied on natural experiments; phased roll -outs or “pipeline” approaches; or quasi-experimental approaches such as propensity score matching or regression discontinuity designs (for more details on these desig ns see, e.g., White, 2007). Quasi-experimental or natural experimental approaches require stronger assumptions about the comparability of the two groups and about the lack of selection bias. For example, in order for A1-C1 to be a valid cross -sectional comparison, we must assume that A-1 = C-1 (the groups were similar prior to the disaster, including their risk of exposure to the disaster) and that C0-C-1 = 0 (C did not experience the disaster). Some of these assumptions can be tested or addressed with longitudinal data. Figure 4 is an admittedly stylized and idealized framework for impact evaluation. It is rare for all of these comparisons to be possible. The decision to collect data from “treated”, comparison and unaffected groups across multiple poi nts in time should be driven by evaluation goals and by a keen understanding of the programs being evaluated. In the design of both interventions and evaluations, however, it can serve as a useful reference for the specific comparisons that are possible and that will permit causal claims about the impact of post-disaster interventions.
6. Post-disaster impact evaluation: In practice The discussion above focused on the theoretical underpinnings of impact evaluation as they might be applied in a post -disaster setting. We now turn to the practice of impact evaluation. Several recent disasters have yielded informative lessons about impact evaluation of humanitarian relief and recovery investments. Appendix A provides examples of post-disaster impact evaluations, focusing specifically on sampling challenges, for the 1998 Bangladesh floods, the Indian Ocean tsunami (2004), and Hurricane Katrina (2005). Here we discuss in depth the impact evaluation experience of the 2005 Pakistan earthquake.
The 2005 Pakistan Earthquake A devastating 7.6 earthquake struck northern Pakistan on October 8, 2005. The damage was heavily concentrated in nine districts spanning two provinces: North West Frontier Province (NWFP) and Pakistan-administered Jammu and Kashmir (AJK). The immediate toll
17

on life and property was enormous: more than 73,000 deaths, 128,000 injured and 600,000 houses destroyed. Schools, hospitals, government buildings, roads, power supplies, and telecommunication facilities also suffered massive damage. Total e stimated damages from the earthquake were US$5.8 billion (Cosgrave & Herson, 2008) . The loss of roads, hospitals, power, and telecom services, in addition to the deaths of many government officials, hindered the ability of local governments and aid agencies to respond in the wake of the earthquake. Bad weather and continuing aftershocks also hampered relief efforts. Detailed discussions of the extent of damages and casualties are available elsewhere (ERRA 2006; 2007; 2008; Cosgrave & Henderson; Amin 2008; Thornton 2006; EBP Ruins to Recovery 2008). Relief efforts started immediately with the establishment of the Federal Relief Commission (FRC) and with a rapid needs and damage assessment, completed by the Asian Development Bank and the World Bank at the request of the Government of Pakistan (GoP). The needs assessment report was issued on November 12, 2005. Data were collected and compiled from several sources, including sector-specific field assessments, desk reviews, aerial reconnaissance, site visits, and interviews. The needs assessment did not include a household level survey. Data were time -normalized in order to create as accurate a portrait as possible of the pre -earthquake "as was" conditions in f all 2005 before the earthquake struck. Three data points were of interest for each outcome: direct damage, indirect losses, and reconstruction costs. Direct costs include the monetary value of the completely or partially destroyed assets, recorded in "as was" or book condition. Indirect losses were lost wages, income losses, increased expenses, curtailed production, and lost revenue. Reconstruction costs measured the cost of rebuilding assets and restoring lost services (at replacement cost). One important output of this needs assessment was a very detailed pre-earthquake profile of the affected areas. Much of the later reconstruction work was based on this initial needs assessment, and it is from this report that the much-cited damages figures come: 135,146 Rs milli on in direct damage, 34,187 million Rs in indirect losses, and 208,091 million Rs in reconstruction costs.
ERRA The Government of Pakistan established the Earthquake Reconstruction and Rehabilitation Authority (ERRA) within weeks of the earthquake. The official mission of ERRA was to coordinate reconstruction and recovery efforts in the affected areas and across the multitude of local, national and international government agencies and NGOs that were operating in the areas. ERRA was to operate from April 2006 (the official end of the relief phase) until at least April 2009. ERRA’s motto of “Build Back Better” captures the explicit goal of ERRA and the GoP to undertake recovery and rehabilitation projects that will leave the affected residents of NWFP and AJK better off in terms of livelihoods, housing, and facilities such as schools and hospitals, than they were before the earthquake. As we will discuss below, this goal has implications for impact evaluation of relief and recovery efforts. The Government of Pakistan assigned ERRA the primary responsibility for the allocation of reconstruction funds. Funding for relief and recovery efforts came from several sources. It should be remembered that the Pakistan earthquake occurred less than 10 months after the Indian Ocean tsunami of December 2004, which prompted a massive outpouring of humanitarian assistance from around the world (Cosgrave & Herson). Approximately US$6.9 billion was pledged for earthquake recovery (compared to $13.5 billion for the tsunami ), with smaller proportions coming from private donations. The UN Flash appeal was approximately two-thirds funded by March 2005, and was eventually funded up to 98%
18

19
(Cosgrave & Herson). Much of the funding went directly to ERRA. Cosgrave and Herson also point out the importance of “unofficial” funding sources, such as the money spent by GoP, funds raised by local agencies and NGOs, and the assistance provided in the form of remittances to affected households and shelter and food provided by the least affected to the most affected households and communities in AJK and NWFP. These unofficial funds are almost invisible in the humanitarian system and are therefore very difficult to track and evaluate, also introducing contamination problems. Also relevant is t he fact the Pakistan earthquake was the disaster in which the new “cluster approach” to providing humanitarian assistance had been implemented by the UN, as a result of the 2005 Humanitarian Response Review. The cluster approach assigned the role of “clust er lead” to different coordinating agencies, which were then accountable for sector -wide performance. ERRA set up two coordinating agencies: the Provincial Earthquake Reconstruction and Rehabilitation Agency (PERRA) in NWFP, and the State Earthquake Reconstruction and Rehabilitation Agency (SERRA) in AJK. The intended functions of PERRA/SERRA were to guide and manage the implementation of district reconstruction plans; prepare and manage budgets; establish monitoring and evaluation systems; and issue pro gress reports. In each earthquake-affected area, a District Reconstruction Unit (DRU), overseen by a District Reconstruction Advisory Committee (DRAC), was also established. DRUs were given responsibility for developing work plans and budgets for recovery and reconstruction programs in the districts, implementing the plans once approved, monitoring and evaluate progress, and serving as the primary liaison for NGOs and civil society organizations (ERRA, 2008a). ERRA quickly established a sectoral framework for the organization of relief and reconstruction efforts. The 11 original sectors plus the later addition of the cross -cutting themes of gender mainstreaming and disaster risk reduction were eventually clustered into four groups, as shown in Bo x 1.
ERRA monitoring and evaluation activities. Each ERRA sector developed a sectoral strategy in spring 2006 to guide reconstruction efforts from June 2006- June 2009 (ERRA, 2006a, 2006b, 2006c, 2006d, 2006e, 2006f, 2006g, 2006h, 2007).Each strategy included damage overview, needs assessment, and a vision, objectives, scope and guiding principles for undertaking reconstruction. For example, the WATSAN strategy (ERRA, 2006h) identified 3,880 water supply schemes (wells, pumps, etc.) and 50,000 household latrines that had be en damaged by the earthquake and were in need of repair or replacement. The vision of the WATSAN sector was to “improve the quality of life of people of the earthquake-affected areas by reducing risks to the public health through provision of equitable, sustainable and reliable supply of
Box 1. ERRA Sectoral Organization Direct outreach to households and individuals:
1. Rural housing 2. Livelihood and cash grants 3. Social protection
Social Services:
1. Education 2. Health 3. Water & sanitation (WATSAN)
Public infrastructure:
1. Governance 2. Transport 3. Power 4. Telecommunications 5. Tourism
Cross-cutting themes:
1. Disaster risk reduction 2. Environmental safeguards 3. Gender mainstreaming
Source: ERRA (2009a)
19

20
sufficient quantity of safe water and appropriate sanitation services.” Specific objectives were ambitious: in addition to rehabilitating/reconstructing all damaged water supply, sanitation and solid waste management systems, ERRA set goals for improving the disaster preparedness of existing and rebuilt systems, expanding service to previously unserviced areas, build capacity in the “relevant” government institutions, NGOs and CBOs, and bring about safer hygiene practices. All sectors identified similarly broad-ranging and comprehensive objectives, the degree to which these objectives were accompanied by specific, measurable indicators varied by sector. The health sector strategy (ERRA, 2006d), for example, identified a set of “process and outputs” indicators as well as a set of “intermediate health outcomes” indicators, some of which could be considered “impacts” in an impact assessment framework: child immunization coverage, prenatal care and tetanus toxoid coverage rates for pregnant women, and TB case detection and cure rates. Other “intermediate health outcomes” are actually measures of health services availability: percent of health facilities providing an essential package of health services, and percent of health facilities offering at least three contraceptive methods. Some sectors, such as education, adopted objectives and monitoring indicators from existing projects, credits, or loans. Other sectors (gender, transport, governance) had less emphasis on specific outcome or impact indicators. Since 2006, ERRA has maintained an extensive website and linked database containing a rich set of reports, tracking documents, progress updates and other documents chronicling the disbursement of reconstruction funds (inputs) and the use of the funds (outputs) (ERRA, 2009b). Regular progress reports indicate, for example, the number of damaged houses for which construction is completed, underway, or no work started. Other key outputs include number of households receiving livelihood cash grants; number of schools and health facilities constructed; and number of water, sanitation, and transportation schemes completed. A comprehensive monitoring and evaluation report published in April 2008 compiles results from all sectors through the end of 2007 (ERRA, 2008b). For each sector, “targets and achievements” are outlined in a detailed annex, though these emphas ize process/output indicators. The approach to impact assessment is discussed in a chapter devoted to the methodology for performance and impact analyses. The discussion draws a distinction between the assessment of performance (as measured by relevance, efficiency, and effectiveness) and the assessment of impact and sustainability. Several “impact domains” are identified that can be assessed across sectors (see Box 2). For each group of sectors (direct outreach, social services, and public infrastructure), a broader “performance and impact” review evaluates (1) relevance of objectives and program components, (2)
Box 2: ERRA Impact Domains Impact at individual and household levels:
o Physical assets o Financial assets o Human assets o Income o Food security
Impact at community level:
o Physical assets o Natural resource base o Social capital
Higher-level impact
o on institutions o on policies and regulations
Source: ERRA Monitoring and Evaluation Report, 2007.
20

efficiency, (3) effectiveness, (4) impact, and (5) sustainability of relief and recovery programs. (These criteria are based on the original DAC p rinciples for the evaluation of development programs.) Impact and sustainability are primarily addressed in narrative form in these summary chapters. The ERRA Social Impact Assessment Following the Monitoring and Evaluation Report of 2007, the Monitori ng & Evaluation wing (M&E) of ERRA also undertook an extensive evaluation of ERRA’s interventions at the household level (ERRA 2008). This evaluation is based on the Earthquake Monitoring and Evaluation Framework (EMEF) which follows a standard program log ic model linking inputs, outputs, activities and outcomes for ERRA interventions. This effort is referred to as the “social impact assessment” to distinguish it from the technical assessment of new housing and construction that is undertaken by construction monitoring teams. The sampling framework and methodology are discussed in detail elsewhere (ERRA 2008) but summarized here. The unit of analysis is the household, and an initial sample size of 1,350 was chosen in order to detect changes at the 90% confidence level. A two-stage cluster sample was drawn by first sampling 30 rural villages (with PPS) from each of nine heavily affected districts in NWFP and AJK. Within each sampled village, five households were chosen at random from one randomly selected sub-division or neighborhood. The M&E wing of ERRA, with DfID support, devised a survey questionnaire covering all the ERRA sector priorities. “Baseline” or Round 1 data were collected between April and September 2008, or approximately 2.5 -3.0 years after the earthquake. The survey instrument is available in its ent irety in the ERRA report (2008). The instrument has sections on the health/mortality of household members, housing, income and expenditures, access to educational and healthcare institutions, and water and sanitation provision pre - and post-earthquake. In addition, detailed information is collected about the household’s experience of the various ERRA recovery programs, including housing reconstruction, cash grants, agricultural and livestock rehabilitation, and public infrastructure improvements. The households’ reports of pre -earthquake measures are, of course, based on recall. A second round of data was collected in August -September 2009 (four years after the earthquake), with the same expanded to 16 households per village to urban blocks. This round did not use the same survey instrument as the first round. Instead, the second round instrument was based very closely on the Pakistan Social and Living Standards Measurement Survey (PSLM). The PSLM was developed to assist the Government of Pakistan in tra cking a broad range of poverty reduction measures and is based on the World Bank’s living standards measurement surveys. First fielded in 2004 -05, the PSLM survey has been conducted annually on a repeated cross -section of more than 76,000 households. Because of the survey’s intended use as a tracking mechanism for Pakistan’s poverty reduction strategy, the outcome indicators are closely tied to broad socioeconomic development targets and the Millennium Development Goals. The key indicators from PSLM are inc luded in Box 3. The ERRA evaluation team reports that it adopted the PSLM questionnaire format so that the ERRA impact assessment can be compared to welfare trends from the annual PSLM. ERRA’s list of indicators for the social impact assessment is shown in Box 4. The PSLM and ERRA outcomes/indicators lists do have some overlap but are not completely aligned. ERRA has requested PSLM microdata for the earthquake -affected districts and surrounding areas from the Pakistan Federal Bureau of Statistics in ord er to conduct such comparisons (A.S. Shaikh, personal communication, October 13, 2009).
21
The repeated surveying of respondents in 2009 is a strength of the study. While the inference about results is limited to those who 1) experienced the earthquake; 2) were available for sampling in 2008; and 3) were available for resurveying in 2009, the longitudinal design does allow ERRA to measure the sustainability of any achieved impacts from Year 3 to Year 4 of the post-earthquake period. With the addition of PSLM data from affected and non-affected areas, single -differenced village- or district-level comparisons may also be possible. Village-level comparisons will only be possible if the PSLM village sample and the ERRA village sample overlap. Notwithstanding the possible availability of PSLM data, the design of the social impact assessment is intended to be a pre-test/post-test treatment-only design (Bamberger, et al., 2006). Using the framework in Figure 1, the design allows, at least in theory, for the
Box 3. Pakistan Social & Living Standards Measurement Survey Key Indicators Education:
• % ever attended school • % completing primary school • Net and gross enrollment rates at primary, middle and matric levels • Child and adult literacy rates
Health:
• Illness/injury incidence, last 2 weeks (total and under 5 years old) • % of ill/injured population who consulted health provider • Infant/child immunization coverage • Diarrheal prevalence, last 30 days, children under 5 • Provider consultation and treatment rates for diarrheal disease • % of women with recent birth receiving 1+ prenatal visit • % of women with recent birth receiving tetanus toxoid injection • Skilled attendance and loc ation of childbirth • % of women with recent birth receiving postpartum checkup
Housing, water supply and sanitation:
• Housing tenure • Roof and wall materials • Number of rooms • Fuel used for lighting and cooking • Source of drinking water • Type of toilet
Household perception of economic situation and satisfaction with facilities and service use:
• Perception of economic situation of household compared to one year ago • Perception of economic situation of community compared to one year ago • Satisfaction with basic health unit, family planning services, school,
veterinary hospital, agricultural extension, and police Source: Pakistan Social and Living Standards Measurement Survey (2004-05), 2005.
22
following comparisons: A1-A-1; A2-A-1; A2-A1, and the related proportionate change measures. Tied to the ERRA motto of “Build Back Better”, the st udy design explicitly compares households’ post-intervention outcomes (in 2008 and again in 2009) to their outcomes prior to the October 2005 earthquake, rather than to their outcomes in the immediate aftermath of the earthquake. It is important to note that there is no true baseline data in this design. Instead, households reported their baseline (pre -earthquake) status at the same time as they were asked to report on their current (post -intervention) status. There is also no comparison group. We can expect several potential sources of bias in the social impact assessment:
• Selection bias: This sampling strategy cannot account for households that were in the affected area prior to and during the earthquake, but then were not available for sampling during the post-intervention periods. These households may not have be available either because the entire household died, or because they have left the region. In either case, this missing group is likely to be different from the groups of households that were available to be sampled.
• Information bias: Respondents may not accurately remember the details about their housing, livelihoods, or schooling prior to earthquake. If interviewed by officials associated with the recovery effort, respondents may report more or less favorable conditions (for either time period) depending on perceived interviewer expectations or future benefits. We can assume that the degree of misreporting is probably correlated with the severity of earthquake exposure or damages incurred.
• Contamination bias: The ERRA social impact assessment study assumes that changes experienced by earthquake -affected households from baseline to post -intervention follow-up are attributable to the ERRA interventions. Without a comparison group, the assumption is a very strong one.
The World Bank evaluation study In parallel with the ERRA Social Impact Assessment, another notable PDIE study is underway, designed and conducted by the World Bank’s Development Econ omics Research Group and SASPR in partnership with Lahore University of Management Sciences (Pakistan) and Pomona College (US). The study was motivated both by the general lack of routine and rigorous assessment of the impact of the Bank’s considerable investments in post -disaster relief and recovery programs, and by a desire for specific impact assessment related to the housing and livelihood support grant programs that the Bank funded in Pakistan after the earthquake (Vishwanath, Das, Andrabi, et al., 2008) . This evaluation effort leverages the experiences of the evaluation team members in setting up RISEPAK, a data collection and communications initiative set up immediately after the earthquake . The World Bank team also has direct experience administering the Bank’s cash support programs, and in ongoing evaluations of education initiatives in the earthquake -affected region. The World Bank evaluation focuses on three topics:
1. Extent of recovery from earthquake for households and for educational facilities 2. Access to and quality of schooling post-earthquake 3. Effects of Livelihood Support Cash Grants and Housing Recon struction Grants on
earthquake recovery from the earthquake in affected areas.
23
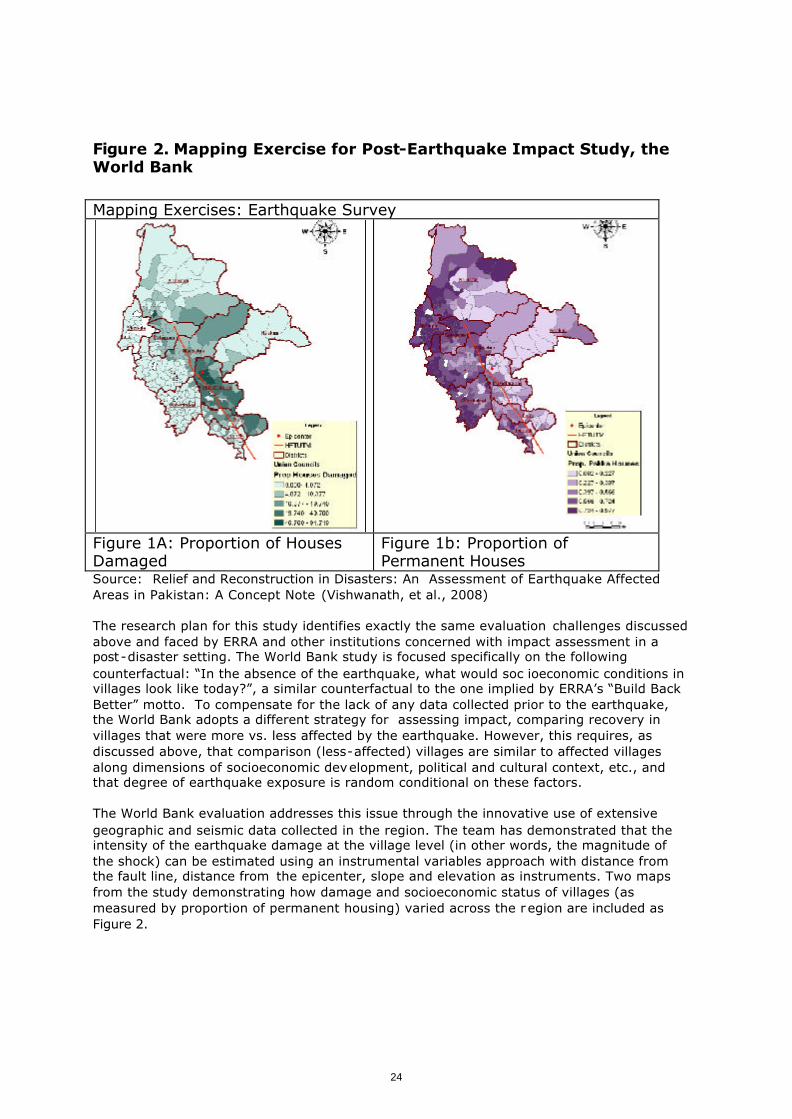
Figure 2. Mapping Exercise for Post-Earthquake Impact Study, the World Bank Mapping Exercises: Earthquake Survey
Figure 1A: Proportion of Houses Damaged
Figure 1b: Proportion of Permanent Houses
Source: Relief and Reconstruction in Disasters: An Assessment of Earthquake Affected Areas in Pakistan: A Concept Note (Vishwanath, et al., 2008) The research plan for this study identifies exactly the same evaluation challenges discussed above and faced by ERRA and other institutions concerned with impact assessment in a post -disaster setting. The World Bank study is focused specifically on the following counterfactual: “In the absence of the earthquake, what would soc ioeconomic conditions in villages look like today?”, a similar counterfactual to the one implied by ERRA’s “Build Back Better” motto. To compensate for the lack of any data collected prior to the earthquake, the World Bank adopts a different strategy for assessing impact, comparing recovery in villages that were more vs. less affected by the earthquake. However, this requires, as discussed above, that comparison (less-affected) villages are similar to affected villages along dimensions of socioeconomic development, political and cultural context, etc., and that degree of earthquake exposure is random conditional on these factors. The World Bank evaluation addresses this issue through the innovative use of extensive geographic and seismic data collected in the region. The team has demonstrated that the intensity of the earthquake damage at the village level (in other words, the magnitude of the shock) can be estimated using an instrumental variables approach with distance from the fault line, distance from the epicenter, slope and elevation as instruments. Two maps from the study demonstrating how damage and socioeconomic status of villages (as measured by proportion of permanent housing) varied across the r egion are included as Figure 2.
24
The World Bank study also relies on two other sources of variation in the implementation of post -disaster reconstruction efforts to improve the possibility of attribution of differences in housing and educational facilities to the World Bank investments. For the Livelihood Support Cash Grant, the study uses the targeting criteria of five or more dependents in a regression discontinuity design framework exploiting the differences in outcomes for households with four vs. five dependents to identify the marginal impact of the l ivelihoods support cash grant on recovery-related outcomes such as health, assets, and education. Evaluation of the housing grant will follow a different identification strategy. Here, variation in the agency implementing the housing grants will be used, as well as differences in size and timing of receipt of the housing grant. Specifically, the Pakistan Poverty Alleviation Fund (PPAF) used Social Mobilization Teams in a subset of villages, in some cases contiguous to villages that did not have Social Mob ilization Teams. While not designed as an experimental intervention, this quasi-experimental design should assist with attribution of specific recovery outcomes to different models of housing grant implementation. The evaluation sample consists of 126 vi llages randomly drawn from the 1998 population census list of villages in four earthquake -affected districts. Outcomes of interest at the household level include employment, consumption, nutrition, education status of children, mental health, and asset rec overy. The study also hopes to link household data to administrative and bank records of cash transfers. At the school level, post -earthquake staffing, infrastructure, enrollment and test -scores will be evaluated in both private and public schools. The World Bank undertook a detailed household and facility census of 28,000 households in sampled villages is spring 2009, with a more extensive questionnaire administered to 25% of households. A second round of data, including a detailed household survey of 2,50 0 randomly sele cted households was fielded in f all 2009. School-based survey modules collect data on school facilities, enrollment, and child outcomes including cognitive and achievement testing. The team is now preparing a set of briefs based on the censu s round of data on the topics of aid organizations, education, reconstruction, compensation, mortality, mental health, and political economy. Preliminary results on education, for example, indicate that school interruption was significant: almost four mont hs for young children and more than five months for older children. Proportion of schools destroyed by the earthquake increased sharply as distance the fault line decreased, but when distance to fault line is controlled, private schools appeared to sustain fewer damages than public schools. Consequently, public schools witnessed a decrease in school enrollment from pre - to post-earthquake periods, while private schools increased their enrollments. This evaluation is a very different approach from the ERRA social impact assessment, which assumes homogeneity in earthquake impact across the region. The World Bank design is not without its limitations. It will offer little insight into the design of optimal reconstruction programs. It is not clear how relevant or generalizable the estimation strategy will be beyond the Pakistan situation, and therefore how applicable the findings will be to other post -disaster settings. The study is intended to complement two other World Bank evaluations in Pakistan: a process review of housing reconstruction, and a technical due diligence effort to verify that new houses followed structural protocols. The study could also prove to be an important complement to ERRA’s Social Impact Assessment.
Other post-earthquake evaluation studies Many INGOs and aid agencies undertook process evaluations of relief, recovery and reconstruction efforts. Immediately after the earthquake, concerned researchers at the Lahore University of Management Sciences (LUMS) and in the US established RISEPAK, a
25

web-based portal to collect and disseminate real-time information on the post-earthquake situation (Amin, 2008). RISEPAK also partnered with LUMS students on a small -scale evaluation of relief efforts in two districts in January 2006 (Zaidi, Asjad, Kamal, et al., 2006). The post-earthquake evaluation experience through 2007 is summarized in Cosgrave and Herson’s (2008) very helpful review, which includes a thorough list of the major evaluations completed by that time. As the authors note, no evaluation of the overall humanitarian response has been completed. The evaluations included in the review are primarily agency -, donor-, or topic-specific. In 2008, The Lahore LUMS Earthquake Budget Project published a set of sectoral evaluations of ERRA’s initiatives based on ERRA’s published reports and the Development Assistance Database (Ishaque, Kamal & Zaidi, 2008; Sehgol, Kamal & Zaidi, 2008; Zaidi, Kamal, Faraz, et al., 2008; S. Zaidi, A. Kamal, A. Ishaque, et al., 2008; S. Zaidi, A. Kamal, M. A. Ishaque, et al., 2008) . A summary table of post -earthquake evaluation studies is provided in Appendix B.
7. Post-disaster impact evaluation: In future, in hindsight The ERRA Social Impact Assessment and the World Bank study will both provide valuable information about the welfare of households four to five years after the earthquake. To a lesser extent, both studies should contribute to an understanding of how well or how much the various recovery programs contributed to the rebuilding of lives and livelihoods in affected areas. ERRA’s impact assessment approach is driven by the motto of “Build Back Better”: it compares a sample of earthquake -affected households that received ERRA interventions to those same households prior to the October 2005 earthquake (based on the households retrospective report of pre -earthquake conditions), and includes two post -intervention assessments to track the sustainability of program results. However, another important counterfactual question is overlooked in this approach: how did ERRA interventions assist affected households compared to what would have happened in the absence of the intervention, or with a different set of interventions? The World Bank study partially addresses this latter question by comparing two different approaches to housing rehabilitation, and by instrumenting the earthquake damage severity to confront selection problems.
26
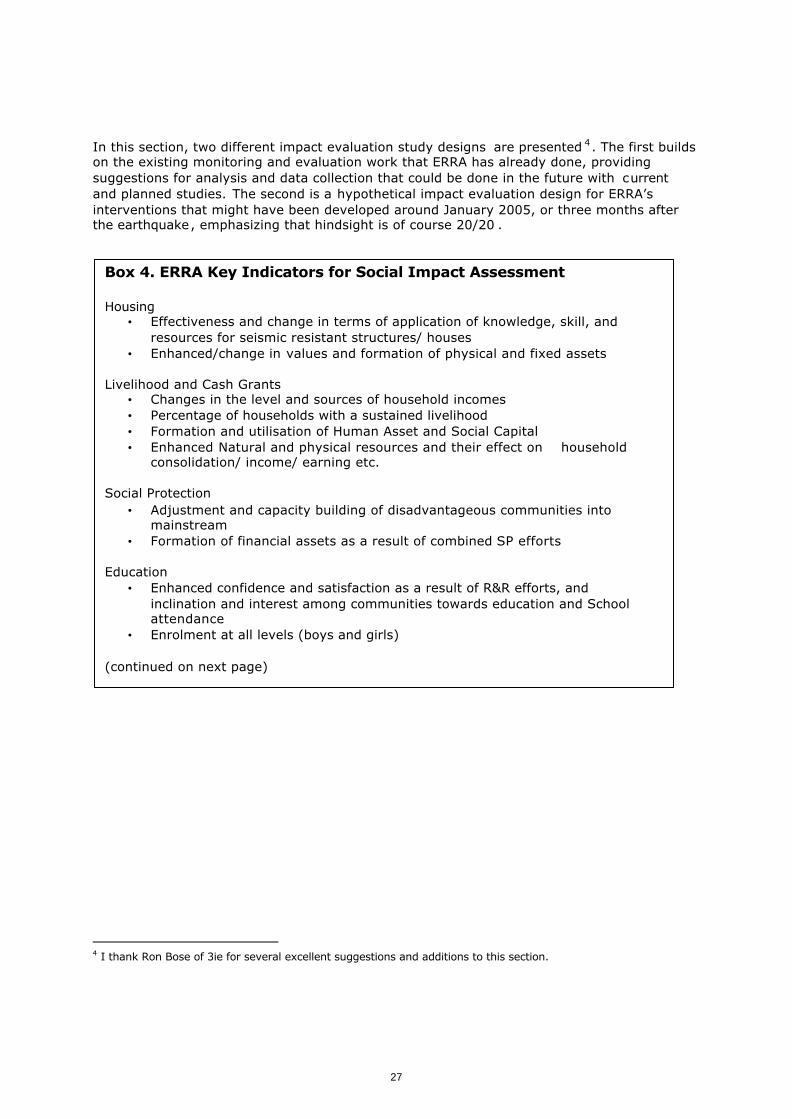
In this section, two different impact evaluation study designs are presented 4 . The first builds on the existing monitoring and evaluation work that ERRA has already done, providing suggestions for analysis and data collection that could be done in the future with current and planned studies. The second is a hypothetical impact evaluation design for ERRA’s interventions that might have been developed around January 2005, or three months after the earthquake, emphasizing that hindsight is of course 20/20 .
4 I thank Ron Bose of 3ie for several excellent suggestions and additions to this section.
Box 4. ERRA Key Indicators for Social Impact Assessment Housing
• Effectiveness and change in terms of application of knowledge, skill, and resources for seismic resistant structures/ houses
• Enhanced/change in values and formation of physical and fixed assets Livelihood and Cash Grants
• Changes in the level and sources of household incomes • Percentage of households with a sustained livelihood • Formation and utilisation of Human Asset and Social Capital • Enhanced Natural and physical resources and their effect on household
consolidation/ income/ earning etc. Social Protection
• Adjustment and capacity building of disadvantageous communities into mainstream
• Formation of financial assets as a result of combined SP efforts Education
• Enhanced confidence and satisfaction as a result of R&R efforts, and inclination and interest among communities towards education and School attendance
• Enrolment at all levels (boys and girls) (continued on next page)
27
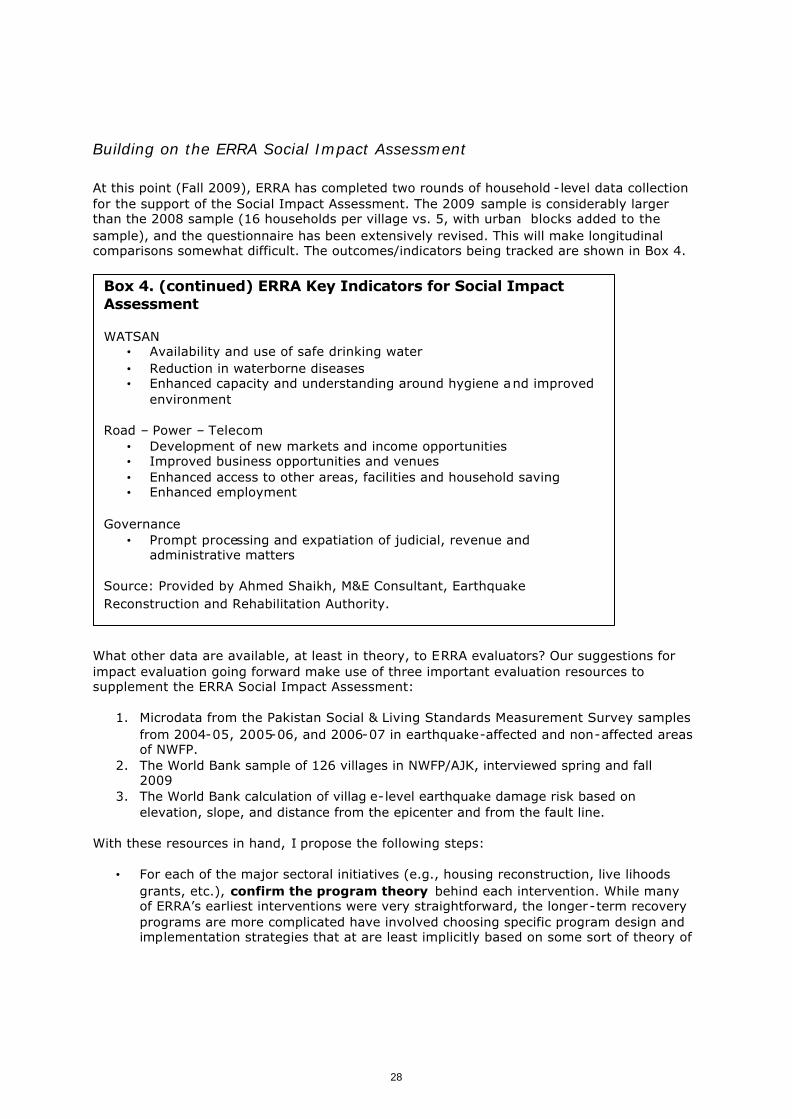
Building on the ERRA Social Impact Assessment At this point (Fall 2009), ERRA has completed two rounds of household -level data collection for the support of the Social Impact Assessment. The 2009 sample is considerably larger than the 2008 sample (16 households per village vs. 5, with urban blocks added to the sample), and the questionnaire has been extensively revised. This will make longitudinal comparisons somewhat difficult. The outcomes/indicators being tracked are shown in Box 4.
What other data are available, at least in theory, to ERRA evaluators? Our suggestions for impact evaluation going forward make use of three important evaluation resources to supplement the ERRA Social Impact Assessment:
1. Microdata from the Pakistan Social & Living Standards Measurement Survey samples from 2004-05, 2005-06, and 2006-07 in earthquake-affected and non-affected areas of NWFP.
2. The World Bank sample of 126 villages in NWFP/AJK, interviewed spring and fall 2009
3. The World Bank calculation of villag e-level earthquake damage risk based on elevation, slope, and distance from the epicenter and from the fault line.
With these resources in hand, I propose the following steps:
• For each of the major sectoral initiatives (e.g., housing reconstruction, live lihoods grants, etc.), confirm the program theory behind each intervention. While many of ERRA’s earliest interventions were very straightforward, the longer-term recovery programs are more complicated have involved choosing specific program design and implementation strategies that at are least implicitly based on some sort of theory of
Box 4. (continued) ERRA Key Indicators for Social Impact Assessment WATSAN
• Availability and use of safe drinking water • Reduction in waterborne diseases • Enhanced capacity and understanding around hygiene and improved
environment Road – Power – Telecom
• Development of new markets and income opportunities • Improved business opportunities and venues • Enhanced access to other areas, facilities and household saving • Enhanced employment
Governance
• Prompt processing and expatiation of judicial, revenue and administrative matters
Source: Provided by Ahmed Shaikh, M&E Consultant, Earthquake Reconstruction and Rehabilitation Authority.
28

change. Making these theories as explicit as possible will strengthen impact evaluation even at this date.
• Leverage existing process and output data. ERRA has been able to amass an impressive amount of detailed data on inputs and outputs of the various sectoral programs: kilometers of roads built, number of water schemes reconstructed, money and housing materials distributed. Sophisticated mining of these data could highli ght logistical problems, beneficiary dissatisfaction, heterogeneous impact, and other important information that can help shape and prioritize evaluation hypotheses. Ensuring data sharing and coordination across ERRA sectors is vital.
• Conduct a comprehensive, retrospective impact evaluation:
o Pool the household-level data from the PSLM, the ERRA SIA and the World
Bank study. This will essentially be a pooled cross-sectional sample of households from villages throughout NWFP and, to a lesser extent, in AJK. The World Bank study and ERRA the ERRA Social Impact Assessment both include only a small subset of panel households.
o Select a short but meaningful list of individual- and household-level
welfare outcomes and indicators that can be assessed in the full pooled sample and are of interest given the program theory review and process data analysis discussed above. A suggested list is included as Box 5, and is a subset of the PSLM key indicators. The list focuses on MDG -related outcomes. Other outcomes that may be of particular interest to ERRA include community engagement and mobilization; links between the formal and informal financial sectors (e.g., exposure to debit cards); and gender and intrahousehold resource allocation.
o Use the World Bank model of pre -earthquake socioeconomic status to
classify all villages in the pooled sample as low vs. high SES (or low vs. medium vs. high – the dichotomous categorization is shown here) using slope, elevation, and distance from earthquake epicenter. Similarly, use distance from the fault line risk to classify all villages as minimal vs. extensive earthquake damage (again, this could also be minimal vs. intermediate vs. extensive). Note that all villages in the pooled sample are categorized by SES and by earthquake damage regardless of the survey year. So, villages that appear in the 2004 -05 PSLM sample are rated for earthquake damage even if those villages are not observed again in the pooled sample. Likewise, villages that are sampled only in the 2006-07 PSLM or the World Bank or ERRA samples are categorized by pre-earthquake SES using the World Bank algorithm. All villages will therefore end up in one of four cells in Table 1 below: Each village observation in the pooled dataset will also be time -demeaned.
29

Table 1.
Pre-earthquake SES
(based on slope, elevation, and distance from earthquake epicenter)
Low SES
High SES
Earthquake damage (based on distance from fault line)
Heavy
A
A'
Minimal/None C C'
Box 5. Impact Evaluation: Outcome indicators for hypothetical evaluation design Education:
• Net and gross enrollment rates at primary, middle and matric levels Health:
• Infant/child immunization coverage • Diarrheal prevalence, last 30 days, children under 5 • Provider consultation and treatment rates for recent illness/injury • % of women with recent birth receiving tetanus toxoid injection • Skilled attendance and location of childbirth
Housing, water supply and sanitation:
• Roof and wall materia ls • Number of rooms • Source of drinking water • Type of toilet
Household perception of economic situation and satisfaction with facilities and service use:
• Perception of economic situation of household compared to one year ago
• Perception of economic situation of community compared to one year ago
• Satisfaction with local services basic health unit, family planning services, school, veterinary hospital, agricultural extension, and police
Source: Based on Pakistan Social and Living Standards Measurement Survey (2004-05), 2005 an d ERRA Social Impact Assessment , 2009.
30

o In a regression framework, estimate the outcomes of interest (health,
education, housing) as a function of year, instrumented village-level SES, instrumented village-level earthquake damage, and a full set of interactions: SES* damage, SES*year, damage*year, and the three -way SES*damage*year interactions. Formally, the model is:
Y = ß0+ ß1SES + ß2DAMAGE + ß 3TIME + ß 4SES*DAMAGE + ß
5SES*TIME + ß6DAMAGE*TIME + ß 7SES*DAMAGE*TIME + e
where SES is an indicator for low-SES village, DAMAGE in an indicator for heavy earthquake damage, and TIME is a set of indicator variables for each survey year in the pooled sample. Y is the individual - or household-level outcomes of interest, ß0-ß7 are parame ters to be estimated, and e is the error term. Alternatively, in a difference-in-difference framework, C-A and C'-A' are the single differences of interest, and can be compared over time in a double difference framework. Propensity-score matching could also be used to match similar households in affected and unaffected areas.
o Field the Social Impact Assessment again in fall 2010 with the
existing 2009 sample plus additional households in areas with minimal or no earthquake damage. This would add an addit ional set of observations to the pooled sample, increase the longitudinal component of the sample, and add additional unaffected households for comparison.
• Complement quantitative work with integrated qualitative work at each
step. Many of the evaluation steps described above will be both easier and more rigorous if qualitative methods are employed to complement quantitative work. Several INGOs have already undertaken qualitative work that should be integrated with ERRA impact asse ssment. Methods including proportional piling, most significant change, and participatory rural appraisal would all be useful in the Pakistan context. Qualitative work could particularly contribute to the confirmation of program theory, the development of impact assessment questionnaires, and the identification of outcomes and interest and impact heterogeneity.
Looking back: A hypothetical evaluation design I now go back in time to construct an impact evaluation study design that might have been implemented in 2006. For the purposes of this hypothetical study design, I assume that the immediate post-disaster period (2-3 months) was devoted almost exclusively to rescue and relief efforts, with minimal attention paid or resources allocated to longer-term recovery efforts or to evaluation concerns. This design, therefore, picks up after rescue efforts are completed. Relief provision is well underway and recovery programs are being planned. Four important tasks must be accomplished fairly simultaneously:
1. Identify the long-term household-level outcomes of interest . As discussed above, it is important to clarify exactly what questions an impact evaluation is designed to answer. It was evident immediately after the earthquake that housing, health facilities, school facilities, government buildings, and infrastructure for WATSAN, power, telecom, and transit were all seriously compromised. ERRA’s sectoral approach to the design, delivery and evaluation of recovery programs reflects this,
31

as does the list of househo ld and community outcomes developed by ERRA and reproduced above. While ERRA’s list served process outcomes and monitoring well, a focused list of household-level outcomes and indicators similar to Table 5 will guide the impact evaluation process.
2. Obtain a pre-earthquake area-representative household sample. An obvious
shortcoming of both the ERRA Social Impact Assessment and the World Bank evaluation is the lack of a pre -disaster, population-representative sample. An evaluation design that compares post -intervention welfare to a pre -disaster point in time requires a pre-disaster observation, preferably collected pre -disaster rather than retroactively. The identification and immediate availability of a pre -disaster sample was crucial to the design of the Sumatra Tsunami Aftermath and Recovery (STAR) study, discussed in more detail in Appendix A. In the case of Pakistan, the 2004-05 PSLM is a good candidate for such a sample. Interviews took place between September 2004 and March 2005, or 7-13 months prior to the earthquake). The sample includes 1080 households in Mansehra and Abbotabad districts, some of which were affected by the earthquake and some of which were not. (The sample also includes 1,322 households in AJ&K, but it is not clear how many, if any, of these households were located in earthquake -affected areas.). In our hypothetical study, this sample becomes the baseline observation for affected and unaffected areas, or A1, B1, and C1 in Figure 1.
3. Collect data on the pre-earthquake sample immediately post-earthquake. Needs
assessments of affected populations are often undertaken in the immediate aftermath of a disaster. In Pakistan, several needs assessments were done, including a wide-ranging village level needs assessment by the GoP and W orld Bank. Of course, the focus of these needs assessment was the correct targeting and provision of relief. For long-term impact evaluation purposes, observing the sample immediately after the disaster is also very helpful. In our hypothetical design, th e PSLM sample identified in Step 2 is located and briefly re -interviewed in January-March 2006. If necessary, the sample is expanded to provide sufficient power for evaluation analyses. Because the sample includes households in affected and unaffected areas, this post-disaster surveying will also include unaffected areas. This round of data collection can serve multiple purposes in addition to serving as a second “baseline” of sorts for impact evaluation of future recovery efforts: it can provide accurate estimates of disaster-related mortality and morbidity and post -disaster outmigration; assess the adequacy of relief efforts; identify priorities for recovery programs; and reveal intentional and natural variations in recovery interventions that can be explo ited for evaluation purposes. For example, the World Bank Study above leverages the household size eligibility requirement for livelihood grants, and the variation in the agency providing housing reconstruction grants.
4. Design interventions for staged roll out or other variations. As discussed above,
experimental designs are a controversial aspect of humanitarian aid provision, and may not be appropriate in the emergency or relief phase of post -disaster aid provision. However, recovery programs that unfold over many months or years are better suited to an experimental design. They are particularly useful when there is a lack of consensus about the best way to deliver an intervention (e.g., how large should livelihood cash grants be and when should they be d istributed? How much sweat equity should be required of homeowners during housing reconstruction? Should school reconstruction prioritize the rebuilding of primary or secondary schools?). Testing competing interventions in an experimental design can provid e
32

strong evidence about best practices in humanitarian aid that can guide future post -disaster interventions in other settings. In the examples above, beneficiaries are not deprived of life-saving resource, but instead may receive a different form of a ben efit than beneficiaries in a neighboring village or district. In our hypothetical study design, ERRA identifies a set of outstanding debates about intervention theory, design or delivery, and plans sectoral programming to include experimental conditions. Where practical and feasible, a staged roll -out of interventions also allows for counterfactual analysis.
As experimental and non-experimental interventions roll out, ERRA then follows the sample established in steps #2 and #3 above over time. An annual survey is appropriate given the extent of earthquake damage and the rapid pace of recovery and reconstruction. In the first post -earthquake year, a more frequent tracking survey to capture the mobility of the affected population would also be informative. A series of annual surveys of the full sample will yield data for all of the populations and time points shown in Figure 1, and allow for double-difference analyses of all counterfactuals of interest. Household questionnaires can be supplemented by community, facility, and organization interviews to capture elements of program sustainability, cost effectiveness and cost recovery, and the complementarity or heterogeneity of program impact. As in the study design described above, the use of qualitative data collection methods at all stages in the evaluation is vital. I recognize that many of the suggestions above would have been difficult to implement in the wake of a disaster of the magnitude and scale of the Pakistan earthquake. However, I also want to emphasize the fact that the stressful and difficult conditions of a post -disaster setting are predictably so – it will always be difficult to divert resources from immediate relief and take a longer-term view towards evaluation and tracking. As mentioned earlier, one of our goals in this study is to emphasize and promote the idea that evaluation preparedness must accompany disaster preparedness.
8. Conclusions and next steps Natural disasters will continue to disrupt lives and livelihoods throughout the world in coming years. Global climate change and population growth, particularly in dense urban areas in the developing world, may intensify the scale and impact of severe climatological and meteorological events. Resources for humanitarian relief, particularly in times of economic downturn like the current period, will always be constrained. It is more important than ever for the humanitarian and development sectors to deliver the most efficient and effective programs to disaster-affected communities. Rigorous impact evaluation, as described above, is crucial to meeting that commitment. This study has reviewed the theoretical underpinnings of impact evaluation and applied it to the case of 2004 Pakistan earthquake. The relief and recovery programs undertaken by the Government of Pakistan through the Earthquake Reconstruction and Rehabilitation Authority have been remarkable, particularly given the geography and political situation in the earthquake-affected districts. Efforts to monitor and evaluate the considerable investments in reconstruction have also been impressive, and yet have been constrained by many factors typical to post-disaster impact evaluation: the absence of a pre -disaster population representative sample; an understandable short -term focus on emergency and relief efforts in the early post -disaster periods; limited expertise on impact evaluation w ithin the government bureaucracy; strict attention to input, process and output monitoring at the expense of impact evaluation; and a reluctance to withhold any needed recovery and
33

reconstruction services or programs from potential beneficiaries in support of a randomized evaluation design. As in many disaster settings, ERRA was assisted by many other humanitarian and bilateral and multilateral agencies, all of whom pursued their own forms of monitoring and evaluation as well. As was the case with the India n Ocean tsunami in 2004 and Hurricane Katrina in 2005, it may be many years, if ever, before practitioners and evaluators can make substantive claims about the impact of post -disaster investment.
Using the Pakistan situation as a case study, two alternative impact evaluation designs have been discussed. First, how might ERRA build on its current resources and data from other agencies to address some important impact evaluation questions retroactively? This design relies on several waves of the Pakistan Soc ial & Living Standards Measurement (PSLM) survey, an existing, annual socioeconomic survey, as well as a current World Bank study of housing, livelihoods, and school infrastructure recovery and reconstruction programs.
The second alternative evaluation study design is a thought experiment, but one that could serve as a model for future disasters. The design comprises a longitudinal analysis of a short list of core household welfare measures (health, education, housing, economic situation, and serve provision) implemented in the early stages of the recovery phase in 2006. It relies not on pooling data from different evaluation surveys as in the retroactive design discussed above, but instead leverages the pre -disaster PSLM survey as a baseline against which post -disaster periods can be compared in both earthquake -affected and –unaffected areas. Clearly a large dose of wishful thinking has been stirred into this second design, but note that a similar design was successfully implemented in Sumatra, Indonesia after the equally devastating 2004 tsunami. Hopefully the impact evaluation designs presented here will motivate discussions in disaster -prone regions about “evaluation preparedness” activities that can be undertaken now, in advance of a disaster, to pave th e way for rapid evaluation planning once a disaster strikes.
Post-disaster impact evaluation is a rich topic, and many aspects not addressed here warrant further research. One such topic is the difficulty of assessing the impact of actions taken prior to disasters to mitigate harm. In the Pakistan example, the curre nt ERRA assessments evaluate the impact of programs and interventions implemented by ERRA in the wake of the earthquake. Assessments may reveal, for example, that the houses in one cluster of villages suffered less severe damage and were easier to rebuild due to residents’ existing skills in seismically-safe building. If the houses were already more earthquake -proof and residents had been trained in seismic retrofitting prior to the earthquake, it is unlikely that these improvements in welfare (relative vil lages with similar earthquake severity but more housing damage and fewer building skills) would be attributed to the pre -earthquake program. A recent paper (Kenny, 2009) on cost-benefit analyses for engineering solutions to reduce deaths from building collapse highlights just some of the difficulties in attributing the absence of disaster-related damage to mitigation effects. More generally, risk reduction and disaster m itigation efforts are unfortunately often invisible or overlooked in PDIE (Christoplos, Mitchell & Liljelund, 2001).
In their excellent chapter in the ALNAP 8th Annual Humanitarian Revie w, Proudlock et al. (Proudlock, et al., 2009) identify several recommendations for promoting impact assessment in the humanitarian sector.
34

I echo here several of these recommendations related to methodologies and approaches here. They call for:
• Partnerships between the humanitarian sector, academic researchers and evaluation experts to develop impact assessment toolkits for humanitarian aid.
• Partnership with 3ie to promote the ethical and creative used of randomized designs in the humanitarian sector.
• The development of a database of impact assessment indicators that could be adopted across the sector.
• Including impact assessment in sector initiatives on data collection and information provision.
• Continuing research into the most appropriate mix of methods for each phase of post-emergency programming.
The humanitarian and evaluation communities should be encouraged by the high level of interest in and activity around impact evaluation in post -disaster settings. There are many resources that practitioners can consult to learn more about impact evaluation more generally and in the disaster context; I provide a list of such resources in Appendix C. As the field of PDIE grows, it will be important to c ollect, synthesize and learn from individual evaluations from the field and from joint evaluations and larger PDIE projects. While it is common to complain about the lack of expertise in and capacity for impact evaluation in the humanitarian sector, we must ensure that existing evaluations and evaluation methods are widely disseminated. The evolving practice of impact evaluation in disaster settings can certainly be advanced and strengthened by improved coordination and shared principles and methods between the humanitarian, development, and academic communities. We can look forward with confidence and commitment to employing the best evaluation methods to support high-quality, high-impact assistance to communities in need.
35

References 3ie. (2008). Founding Document for Establishing the International Initiative for Impact
Evaluation. Retrieved December 9, 2009 from http://www.3ieimpact.org/doc/3ieFoundingDocument30June2008.pdf
ALNAP. (2006). Evaluating humanitarian action using the OECD-DAC criteria: An ALNAP guide for humanitarian agencies. London: Overseas Development Institute.
Amin, S. (2008). Data Management Systems after the Earthquake in Pakistan: The Lessons of Risepak. In S. Amin & M. Goldstein (Eds.), Data against natural disasters : establishing effective systems for relief, recovery, and reconstruction (pp. 233-272). Washington, DC: World Bank.
Bamberger, M. (2009). Strengthening the evaluation of programme effectiveness through reconstructing baseline data. Journal of Development Effectiveness, 1(1), 37-59.
Bamberger, M., Rugh, J., & Mabry, L. (2006). RealWorld evaluation : working under budget, time, data, and political constraints. Thousand Oaks: Sage Publications.
Beck, T. (2003). Learning Lessons from Recovery Efforts After Major Natural Disasters: Synthesis Report: ProVention Consortium.
Beck, T. (2005). Learning Lessons from Disaster Recovery: The Case of Bangladesh (Disaster Risk Management Working Paper Series No. 11). Washington, DC: The World Bank.
Beck, T. (2009). Joint humanitarian impact evaluation: options paper. Retrieved December 9., 2009 from http://www.alnap.org/pool/files/day-2-ocha-paper.pdf
Below, R., Guha-Sapir, D., le Polain de Waroux, O., Ponserre, S., & Scheuren, J.-M. (2008). Annual disaster st atistical review: numbers and trends 2007: Centre for Research on the Epidemiology of Disasters (CRED).
Bertrand, M., Duflo, E., & Mullainathan, S. (2004). How Much Should We Trust Difference in Differences Estimates? Quarterly Journal of Economics, 119(1), 249-275.
Buttenheim, A. M. (2009). From Relief to Recovery: Child Health in a Post-Flood Period in Bangladesh (CCPR-024-07): California Center for Population Research, University of California, Los Angeles.
Carter, M. R., & Barrett, C. B. (2004). The Economics of Poverty Traps and Persistent Poverty: An Asset-Based Approach (BASIS Report): Collaborative Research Support Program.
Carter, M. R., Little, P. D., Mogues, T., & Negatu, W. (2007). Poverty Traps and Natural Disasters in Ethiopia and Honduras. World Development, 35(5), 835-856.
Chambers, R., Karlan, D., Ravallion, M., & Rogers, P. (2009). Designing impact evaluations: different perspectives (Working Paper #4). New Delhi: International Initiative for Impact Evaluation.
36

Christoplos, I., Mitchell, J., & Liljelund, A. (2001). Re-framing Risk: The Changing Context of Disaster Mitigation and Preparedness. Disasters, 25(3), 185-198.
Cosgrave, J., & Herson, M. (2008). Perceptions of crisis and response: A synthesis of evaluations of the response to the 2005 Pakistan earthquake. In M. Herson, J. Mitchell & B. Ramalingam (Eds.), ALNAP Seventh Reivew of Humanitarian Action (pp. 177-224). London: Overseas Development Institute.
Cosgrave, J., & Nam, S. (2007). Evaluation of DG ECHO’s Actions in response to the Pakistan Earthquake of 2005. Brussels: ECHO.
Deaton, A. (2009). Instruments of development: Randomization in the tropics, and the search for the elusive keys to economic develeopment. Princeton: Research Program in Development Studies and Center for Health and Wellbeing, Princeton University.
del Ninno, C. (2001). Coping Strategies in Bangladesh (November 1998-December 1999): Survey Documentation (FMRSP Data Documentation Report No. 1). Washington, DC: Food Management and Research Support Project (FMRSP) Bangladesh and International Food Policy Research Institute (IFPRI).
del Ninno, C., & Dorosh, P. A. (2001). Averting a food crisis: private imports and public targeted distribution in Bangladesh after the 1998 flood. Agricultural Economics, 25(2-3), 337-346.
del Ninno, C., & Dorosh, P. A. (2003a). Impacts of in-kind transfers on household food consumption: Evidence from targeted food programmes in Bangladesh. Journal of Development Studies, 40(1), 48 - 78.
del Ninno, C., & Dorosh, P. A. (2003b). Public Policy, Markets and Household Coping Strategies in Bangladesh: Avoiding a Food Security Crisis Following the 1998 Floods. World Development, 31(7), 1221-1238.
del Ninno, C., Dorosh, P. A., & Islam, N. (2002). Reducing Vulnerability to Natural Disasters: Lessons from the 1998 Floods in Bangladesh. IDS Bulletin, 33(4), 98-107.
del Ninno, C., Dorosh, P. A., Smith, L. C., & Roy, D. K. (2001). The 1998 Floods in Bangladesh: Disaster Impacts, Household Coping Strategies and Responses (No. 122). Washington, DC: International Food Policy Research Institute.
del Ninno, C., & Lundberg, M. (2005). Treading water: The long-term impact of the 1998 flood on nutrition in Bangladesh. Economics and Human Biology, 3, 67-96.
Diaz, J. J., & Handa, S. (2006). An Assessment of Propensity Score Matching as a Nonexperimental Impact Estimator: Evidence from Mexico’s PROGRESA Program. Journal of Human Resources, 41(2), 319 -345.
Enarson, E. (1998). Through women's eyes: A gendered research agenda for disaster social science. Disasters, 22(2), 157-173.
Enarson, E., & Morrow, B. (1998). The gendered terrain of disaster: Praeger.
ERRA. (2006a). Reconstruction and Rehabilitation Strategy: Education Sector.
37

ERRA. (2006b). Reconstruction and Rehabilitation Strategy: Environmental Sector.
ERRA. (2006c). Reconstruction and Rehabilitation Strategy: Governance Sector: ERRA.
ERRA. (2006d). Reconstruction and Rehabilitation Strategy: Health Sector.
ERRA. (2006e). Reconstruction and Rehabilitation Strategy: Livelihood Rehabilitation Sector.
ERRA. (2006f). Reconstruction and Rehabilitation Strategy: Social Protection
ERRA. (2006g). Reconstruction and Rehabilitation Strategy: Transport (Roads & Bridges) Sector.
ERRA. (2006h). Reconstruction and Rehabilitation Strategy: Water and Sanitation Sector.
ERRA. (2007). Gender Policy for Earthquake Affected Areas.
ERRA. (2008a). Annual Review 2007-2008: Marching on Together: Building Back Better: Earthquale Reconstruction and Rehabilitation Authority, Government of Pakistan.
ERRA. (2008b). ERRA Monitoring and Evaluation Report 2007. Islamabad: Government of Pakistan Earthqualke Reconstruction and Rehabilitation Authority.
ERRA. (2009a). Earthquake Reconstruction and Rehabilitation Authority. Retrieved February 8, 2009, from http://www.erra.pk
ERRA. (2009b). Earthquake Reconstruction and Rehabilitation Authority. Retrieved August 9, 2008, from http://www.erra.gov.pk/WebForms/Home.aspx
Few, R., Ahern, M., Matthiers, F., & Kovats, S. (2004). Floods, health and climate change: a strategic review (Working Paper #63): Tyndall Centre for Climate Change Research.
Frankenberg, E., Friedman, J., Gillespie, T., Ingwersen, N., Pynoos, R., Rifai, I., et al. (2008). Mental healt h in Sumatra after the tsunami. American Journal of Public Health, 98(9), 1671.
Frankenberg, E., Friedman, J., Saadeh, F., Sikoki, B., Suriastini, W., Sumantri, C., et al. (2008). Assessment of Health and Education Services in the Aftermath of a Disaster. In S. Amin, J. Das & M. Goldstein (Eds.), Are you being served? : new tools for measuring service delivery (pp. 233-250). Washington, D.C.: The World Bank.
Henderson, T. L., Sirois, M., Chen, A. C.-C., Airriess, C., Swanson, D. A., & Banks, D. (2009). After a Disaster: Lessons in Survey Methodology from Hurrican Katrina. Population Research and Policy Review, 28, 67-92.
Hoddinott, J., & Quisumbing, A. R. (2003). Methods for Microeconometric Risk and Vulnerability Assessments (Social Protection Discussion Paper Series No. 0324). Washington DC: Social Protection Unit, Human Development Network, The World Bank.
Hofmann, C. A., Roberts, L., Shoham, J., & Harvey, P. (2004). Measuring the impact of humanitarian aid: A review of current practice: Humanitarian Polic y Group.
38
Hossain, S. M. M., & Kolsteren, P. (2003). The 1998 Flood in Bangladesh: Is Different Targeting Needed During Emergencies and Recovery to Tackle Malnutrition? Disasters, 27(2), 172-184.
Ishaque, A., Kamal, A., & Zaidi, S. (2008). Housing Reconstruction after the October 2005 Earthquake: LUMS - Earthquake Budget Project.
Karlan, D. (2009). Thoughts on randomised trials for evaluation of development: presentation to the Cairo evaluation clinic. Journal of Development Effectiveness, 1(3), 237-242.
Kenny, C. (2009). Why do people die in earthquakes? The costs, benefits, and institutions of disaster risk reduction in developing countries (Policy Research Working Paper #4823). Washington DC: The World Bank Sustainable Development Network.
Khalid, N., & Haider, M. N. (2006). Pakistan Earthquake Emergency Response in Azad Jammu and Kashmir, 2005-2006. External Evaluation Report: Save the Children - UK.
Kirkby, J., Anita, C., & Jadoon, W. A. (2007). Emergency Response to Earthquake. Batagram District, Pakistan.: Save the Children USA.
Kirkby, J., Saeed, A., & Zogopoulos, A. (2006). Independent Evaluation of CARE International’s Earthquake Response in Northern Pakistan: Brussels: CARE.
Masyrafah, H., & McKeon, J. (2008). Post-tsunami aid effectiveness in Aceh: Proliferation and Coordination in Reconstruction. 2009. Retrieved December 12, 2009 from http://www.brookings.edu/~/media/Files/rc/papers/2008/11_aceh_aid_masyrafah/11_aceh_aid_masyrafah.pdf
Nelson, J. (2008). Program Evaluation: Are We Ready for RCTs? InterAction Monday Developments, March 2008, 28-29.
OECD/DAC. (2002). Glossary of key terms in evaluation and results-based management. Retrieved December 10, 2009 from http://www.oecd.org/dataoecd/29/21/2754804.pdf
Proudlock, K., Ramalingam, B., & Sandison, P. (2009). Improving humanitarian impact assessment: Bridging theory and practice 8th Review of Humanitarian Action: Performance, Impact and Innovation. London: ALNAP/ODI.
ReliefWeb. (2009). Financial Tracking System. Retrieved August 18: http://ocha.unog.ch/fts/pageloader.aspx
Savedoff, W. D., Levine, R., Birdsall, N., & Evaluation Gap Working Group. (2006). When will we ever learn? Improving lives through impact evaluation. Washington, D.C.: Center for Global Development.
Sehgol, A. Z., Kamal, A., & Zaidi, S. (2008). Challenges in Monitoring Post-Earthquake Livelihood Rehabilitation: LUMS - Earthquake Budget Project.
39

Shoji, M. (2004). The impact of productive asset loss on coping strategies: Evidence from rural Bangladesh (Unpublished manuscript): University of Tokyo.
Shoji, M. (2006). Limitation of Quasi-Credit as Mutual Insurance: Coping Strategies for Covariate Shocks in Bangladesh.
Stern, E. (2008). Current Thinking about Impact Assessment. PowerPoint presentation delivered at the ALNAP 24th Biannual meeting. Retrieved November 12, 2009 from http://www.alnap.org/meetings/24.htm
Thompson, F., Crawford, P., Bysouth, K., & Nichols, D. (2006). CAER Cluster Evaluation: Pakistan Earthquake. Canberra: AusAid.
Vishwanath, T., Das, J., Andrabi, T., & Cheema, A. (2008). Relief and reconstruction in disasters: An assessment of earthquale affected areas in Pakistan: A concept note. Washington: The World Bank.
West, S. G., Duan, N., Pequegnat, W., Gaist, P., Des Jarlais, D. C., Holtgrave, D., et al. (2008). Alternatives to the randomized controlled trial. American Journal of Public Health, 98(8), 1359-1366.
White, H. (2005). Challenges in evaluating development effectiveness. Brighton, UK: Institute of Development Studies.
White, H. (2007). Evaluating Aid Impact: World Institute for Development Economics Research.
White, H. (2009a). Some Reflections on Current Debates in Impact Evaluation (Working Paper #1). New Delhi: International Initiative for Impact Evaluation.
White, H. (2009b). Theory-based impact evaluation: Principles and practice. Journal of Development Effectiveness, 1(3), 271 - 284.
World Bank. (2006). Hazards of nature, risks to development: an IEG evaluation of World Bank assistance for natural disasters. Washington: Wo rld Bank, Independent Evaluation Group.
Yamauchi, F., Yohannes, Y., & Quisumbing, A. R. (2009). Natural Disaster, Self-Insurance, and Human Capital Investment (Policy Research Working Paper 4910). Washington: The World Bank Sustainable Development Network, Global Facility for Disaster Reduction and Recovery Unit.
Zaidi, S., Asjad, A., Kamal, A., & Qadir, S. (2006). Results of the RISEPAK-LUMS January Household Survey in the Earthquake Affected Areas of Mansehra and Muzaffarabad: RISEPAK.
Zaidi, S., Kamal, A., Faraz, S., Nauman, Q., Tariq, N., & Ahmed, S. (2008). An Evaluation of ERRA-WB Livelihood Support Cash Grant: LUMS - Earthquake Budget Project.
Zaidi, S., Kamal, A., Ishaque, A., Khalil, H., Shafi, N., & Sharif, Z. (2008). Public Sector Reconstruction: Education, Health, and Public Infrastructure: LUMS - Earthquake Budget Project.
40

Zaidi, S., Kamal, A., Ishaque, M. A., Khalil, H., Sehgol, A. Z., Shafi, N., et al. (2008). Ruins to Recovery: LUMS - Earthquake Budget Project.
41
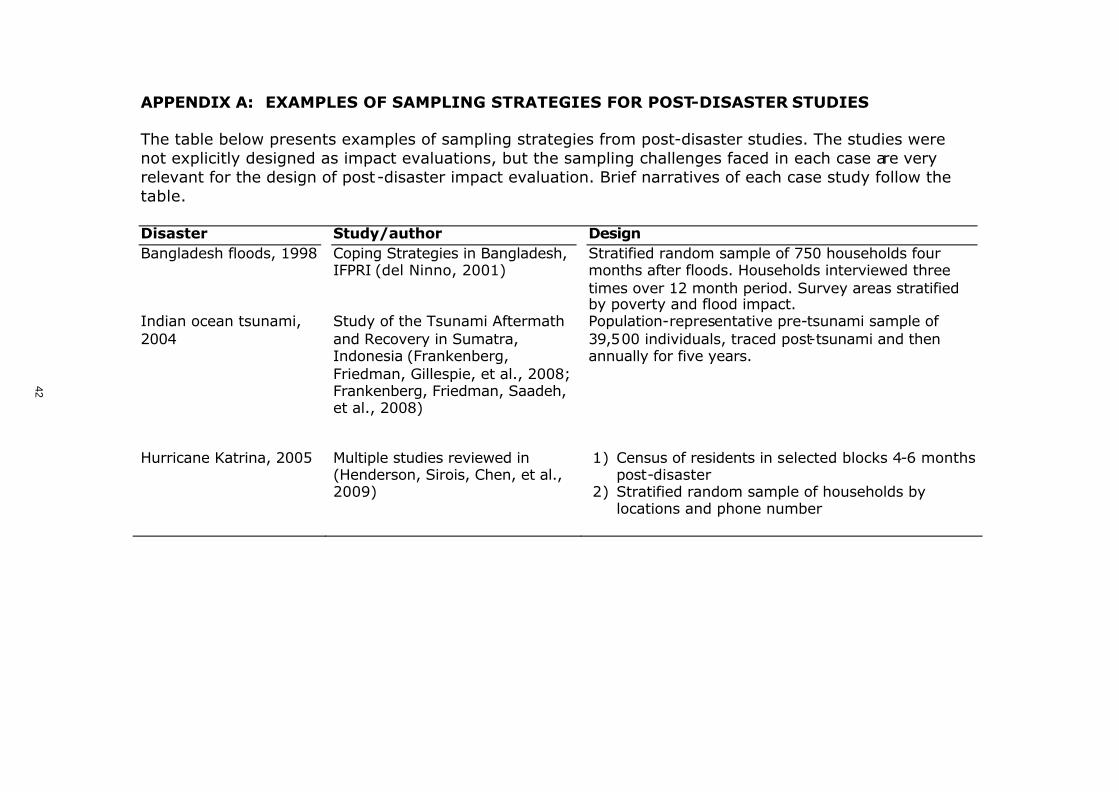
APPENDIX A: EXAMPLES OF SAMPLING STRATEGIES FOR POST-DISASTER STUDIES The table below presents examples of sampling strategies from post-disaster studies. The studies were not explicitly designed as impact evaluations, but the sampling challenges faced in each case are very relevant for the design of post-disaster impact evaluation. Brief narratives of each case study follow the table. Disaster Study/author Design Bangladesh floods, 1998 Coping Strategies in Bangladesh,
IFPRI (del Ninno, 2001) Stratified random sample of 750 households four months after floods. Households interviewed three times over 12 month period. Survey areas stratified by poverty and flood impact.
Indian ocean tsunami, 2004
Study of the Tsunami Aftermath and Recovery in Sumatra, Indonesia (Frankenberg, Friedman, Gillespie, et al., 2008; Frankenberg, Friedman, Saadeh, et al., 2008)
Population-representative pre-tsunami sample of 39,500 individuals, traced post-tsunami and then annually for five years.
Hurricane Katrina, 2005 Multiple studies reviewed in (Henderson, Sirois, Chen, et al., 2009)
1) Census of residents in selected blocks 4-6 months post-disaster
2) Stratified random sample of households by locations and phone number
42

APPENDIX A: (Continued)
Coping Strategies in Bangladesh (1998 floods)
Bangladesh experiences regular, annual flooding of its major river basins, an important and welcomed part of it agricultural cycle. However, in recent decades extraordinary “century” flood levels have occurred more than once per decade due to heavy monsoon rains. The most recent extreme flooding years were 1988, 1998, and 2004, and 2007 (when Cyclone Sidr also struck). The frequency of extreme flooding in Bangladesh creates both the necessity and the opportunity to learn from previous disaster relief and r ecovery efforts and apply them in future situations. Evaluating the impact of aid is an important component of that learning process. The 1998 flooding was particularly extensive, but remarkably, had less immediate and long -term negative impact on the affected population than had the 1988 flood (Beck, 2005) This was attributed to several factors: a more transparent and accountable government; strong economic growth and development since 1988, including the expansion of the garment industry; investments in emergency preparedness and flood mitigation; and, notably, a Government of Bangladesh policy to allow private sector rice imports in the post -disaster period, which kept rice prices stable. Rice price instability had been a major concern in the 1988 post-flood period, and the policy change in 1998 was seen as a positive “lesson learned” from the 1988 experience. During the next major flood year, 2004, it was again asked whether any lessons had been learned from the 1998 experience that could improve the relief and recovery processes implemented by a wide range of NGO and government relief agencies. One opportunity for detailed impact evaluation came in the form of the Coping Strategies in Bangladesh (CSB) survey conducted by the International Food Policy Research Institute and CARE Bangladesh (del Ninno, 2001; del Ninno, Dorosh, Smith, et al., 2001) . The CSB survey attempted to monitor 757 households in the post -flood period, conducting three rounds of data collection after the summer 1998 floods in November 1998, April 1999, and November 1999. The household questionnaire collected detailed information about assets owned before and after the floods, livelihood and employment opportunities, income, and cash and food relief received from several different sources. Several studies based on these data have been published by the original investigators or other researches (del Ninno & Dorosh, 2001; del Ninno & Dorosh, 2003a, 2003b; del Ninno, Dorosh & Islam, 2002 ; del Ninno & Lundberg, 2005; Hossain & Kolsteren, 2003) and other studies are in working paper form (Buttenheim, 2009; Shoji, 2004, 2006; Yamauchi, Yohannes & Quisumbing, 2009) . Much of the published research using the CSB dataset evaluates the effect of food aid on household welfare, a crucial component of post -disaster relief and an important focus for impact evaluation. For example, Del Ninno and Dorosh (2003) find that the marginal propensity to consume wheat obtained through wheat transfers is much higher than for wheat purchased with income, suggesting that in -kind transfers of wheat in the post -flood period led to higher wheat consumption than equivalent cash transfers would have —an important and policy-relevant finding for post-disaster programs. A closer look at the CSB dataset, however, raises questions about how to interpret these results, given the composition of the sample. The sampling methodology for CSB (described in detail in del Ninno et al. (2001)) involved first selecting seven thanas (sub-districts) to “give a fair representation of the parts of the country affected by flooding” (del Ninno, et al.,
43

2001, p.10). To do this, the IFPRI team first categorized thanas by flooding severity, based on criteria set by the Bangladesh Water Development Board. Only moderately affected and severely affected thanas were included for purposes of the data collection effort. Thanas were then also categorized by poverty level using the 1998 Bangladesh Household Expenditure Survey. A “poor” thana was one in which more than 70 percent of the population lived below the poverty li ne. From this dual classification, seven thanas were selected that had been included in other IFPRI studies and that would represent a wide range of geographical regions across the country. A comparison of post -flood household-level outcomes in these seven thanas suggests serious selection problems. For example, CSB-sampled households in the four “severely affected” thanas (as designated by the Bangladesh Water Development Board) were less likely to report being affected by the floods and had a lower mean flood exposure index than sampled households in the moderately -affected thanas. In Saturia thana, a severely-affected region, only 17 percent of households meet the criteria for flood exposur e used in this study, while 97 percent of households in Madaripur, a moderately affected thana, meet these criteria. One explanation for this finding is that many households in severely affected thanas were displaced from their homes during the flooding and had not returned to their original (pre-flood) residence by the time of the first round of the survey in November 1998, and were therefore not available to be sampled. In moderately affected areas, the overwhelming majority of households report flood exp osure, but may not have been so severely affected that they were still displaced by fall 1998. Therefore, households most affected by flooding may not even appear in the CSB dataset. The CSB sample is representative of households in the seven selected thanas who were still residing in the area five months after the floods; it is reasonable to assume that this group differs from the population that had left the region in important ways. This case is presented to illustrate the more general problem of sampling and data quality for impact evaluation in a post -disaster setting. While selection bias and attrition are problematic in any longitudinal study, the disaster-specific context in the case was particularly challenging. Results from studies using this dataset should probably be interpreted with caution in light of the potential biases.
44

Study of the Tsunami Aftermath and Recovery (Indian Ocean tsunami, 2004)
One particularly notable study design was the Study of the Tsunami Aftermath and Recovery (STAR) study (Frankenberg, Friedman, Gillespie, et al., 2008; Frankenberg, Friedman, Saadeh, et al., 2008). The unique feature of the STAR design was the availability of a pre-tsunami population representative sample of households and individuals in northern Sumatra, Indonesia, including in the most heavily -affected areas of Aceh province. The STAR investigators had strong and long -standing research relationships with the Indonesian government, and were able to procure the household sample from the February 2004 SUSENAS, Indonesia’s annual socioeconomic survey. The STAR study tracked this sample of 39,500 individuals in the post-tsunami period and then annually for five years. The SUSENAS sample offered many advantages: Fi rst, it enabled very accurate mortality and migration estimates. Second, it provided a pre-disaster baseline of household welfare, including housing, employment, and assets that could be tracked post -tsunami. Third, because the February 2004 SUSENAS sample was representative of the regional population, the STAR sample includes households with varying degrees of exposure to the tsunami and varying exposure to relief, recovery, and reconstruction programs. The longitudinal design and detailed household survey modules on health, housing, assets, labor, and program participation makes the STAR study a rich data source for impact evaluations, many of which are currently underway.
45

Hurricane Katrina, 2005. A recent study (Henderson et al 2009) reviews different sampling strategies that were used by researchers after Katrina to assess disaster impact and evaluate relief and recovery programs. These examples capture many of the sampling challenges inherent in post -disaster evaluation efforts. Short- and long-form census. The first design sampled a number of census tracts in hard-hit areas of the Mississippi Gulf Coast, completing both "long form" surveys (similar to census forms) for a random sample of households in the selected tracts in January 2006 (four months after Hurricane Katrina), and a "short form" survey to all residents of selected tracts in March 2006. These data provided an accurate count of the number of households and residents remaining in the areas 4-6 months after the disaster, as well as assessments of housing conditions. The data could in theory be useful for targeting and implementation of recovery programs. However, the large number of displaced households makes the data less useful for determining pre/post measures of welfare for al l pre-disaster residents of the areas. Stratified random sample. A second study used a stratified random sample of pre -Katrina residents of New Orleans in order to study the determinants of pre -hurricane evacuation. The sample was selected in three modes . The first mode was in -person interviews of residents of housing units close to randomly selected geographic points in sampled census tracts. The interviews were conducted in January 2006. The sampling of census tracts was initially meant to be stratified by both income and elevation, although further research revealed that income and elevation were very highly correlated. This yielded just one stratification based on degree of flooding. Response rates for occupied housing units were quite high (77%). A second sample of landlines from New Orleans and Baton Rouge exchanges were intended to capture residents who remained in New Orleans and those who had been displaced to Baton Route. A third sample of cell phone numbers issued in New Orleans was also intended to capture displaced residents. Response rates for landline and cell phone surveys were under 40%. This innovative tri - modal survey certainly had the potential to capture both pre -Katrina New Orleans residents who had returned to the city by the time of the survey and those who had not. There were concerns about the representativeness of all three samples. For example, older women comprised a larger proportion of the in-person interviews than would be expected. It was not clear from the survey results whether this reflected their reluctance or inability to leave New Orleans during the evacuation, their persistence in returning to the city soon after the disaster, or merely their availability during the day when interviewers arrived. Concerns about socioeconomic differences in landlines and cell phone usage also apply.
46

APPENDIX B: OTHER POST-DISASTER IMPACT EVALUATION EXAMPLES Organization/author Evaluation focus AusAid (Thompson, Crawford, Bysouth, et al., 2006)
Response of cluster of five agencies (capacity, quality of response, efficiency)
CARE (Kirkby, Saeed & Zogopoulos, 2006)
Agency-specific response (timeliness, impact, efficiency, appropriateness)
Earthquake Budget Project (Zaidi, Kamal, Ishaque, Khalil, Sehgol, et al., 2008)
Process and output evaluation of ERRA sectoral investments and cash disbursement.
ECHO (Cosgrave & Nam, 2007)
Donor-specific effectiveness (appropriateness, coverage, effectiveness, impact, sustainability).
LUMS/RISEPAK (Zaidi, et al., 2006)
Population-level needs assessment, mental health evaluation, program impact
Save the Children UK(Khalid & Haider, 2006)
Agency-specific response (relevance, efficiency, effectiveness, impact, sustainability)
Save the Children US (Kirkby, Anita & Jadoon, 2007)
Process evaluation, single agency
Source: Much of this table is reproduced from Table 4A.1 of Cosgrave and Herson (2008).
47

APPENDIX C: IMPACT EVALUATION RESOURCES FOR PRACTITIONERS AND RESEARCHERS International Initiative for Impact Evaluation (3ie) http://www.3ieimpact.org/
o Database of impact evaluations o Working paper and synthetic reviews o Grants program for impact evaluation studies
World Bank Development Impact Evaluation Initiative http://www.worldbank.org/dime
o Doing Impact Evaluation series o Impact Evaluation Working paper Series
ALNAP http://www.alnap.org/
o Evaluative Reports Database o Lessons papers
NONIE (Network of Networks on Impact Evaluation) http://www.worldbank.org/ieg/nonie/index.html
o Working Papers o Database of Impact Evaluations
Cochrane Collaboration http://www.cochrane.org/
o Evidence Aid project: resources for natural disasters and other healthcare emergencies
48

Publications in the 3ie Working Paper series
Behind the scenes: managing and conducting large scale impact evaluations in Colombia by Bertha Briceño, Laura Cuesta and Orazio Attanasio, Working Paper 14, December 2011 Can we obtain the required rigour without randomisation? by Karl Hughes and Claire Hutchings, Working Paper 13, August 2011 Sound expectations: from impact evaluations to policy change by Vanessa Weyrauch and Gala Díaz Langou, 3ie Working Paper 12, April 2011 A can of worms? Implications of rigorous impact evaluations for development agencies by Eric Roetman, 3ie Working Paper 11, March 2011 Conducting influential impact evaluations in China: the experience of the Rural Education Action Project by Mathew Boswell, Scott Rozelle, Linxiu Zhang, Chengfang Liu, Renfu Luo, Yaojiang Shi, 3ie Working Paper 10, February 2011 An introduction to the use of randomized control trials to evaluate development interventions by Howard White, 3ie Working Paper 9, February 2011 Institutionalisation of government evaluation: balancing trade-Offs by Marie Gaarder and Bertha Briceno, 3ie Working Paper 8, July 2010 Impact Evaluation and interventions to address climate change: a scoping study by Martin Prowse and Birte Snilstveit, 3ie Working Paper 7, March 2010 A checklist for the reporting of randomized control trials of social and economic policy interventions in developing countries by Ron Bose, 3ie working paper 6, January 2010 Impact evaluation in the post-disaster setting by Alison Buttenheim, 3ie Working Paper 5, December 2009 Designing impact evaluations: different perspectives, contributions from Robert Chambers, Dean Karlan, Martin Ravallion, and Patricia Rogers, 3ie Working Paper 4, July 2009. Also available in Spanish, French and Chinese Theory-based impact evaluation by Howard White, 3ie Working Paper 3, June 2009. Also available in French and Chinese. Better evidence for a better world edited by Mark W. Lipsey University and Eamonn Noonan, 3ie & The Campbell Collaboration, 3ie Working Paper 2, April 2009 Some reflections on current debates in impact evaluation by Howard White, 3ie Working Paper 1, April 2009 For the latest 3ie working papers visit: http://www.3ieimpact.org/3ie_working_papers.html
49

Notes
____________________________________________________________________________ ____________________________________________________________________________ ____________________________________________________________________________ ____________________________________________________________________________ ____________________________________________________________________________ ____________________________________________________________________________ ____________________________________________________________________________ ____________________________________________________________________________ ____________________________________________________________________________ ____________________________________________________________________________ ____________________________________________________________________________ ____________________________________________________________________________ ____________________________________________________________________________ ____________________________________________________________________________ ____________________________________________________________________________ ____________________________________________________________________________ ____________________________________________________________________________ ____________________________________________________________________________ ____________________________________________________________________________ ____________________________________________________________________________ ____________________________________________________________________________ ____________________________________________________________________________ ____________________________________________________________________________ ____________________________________________________________________________ ____________________________________________________________________________ ____________________________________________________________________________ ____________________________________________________________________________ ____________________________________________________________________________ ____________________________________________________________________________ ____________________________________________________________________________ ____________________________________________________________________________ ____________________________________________________________________________ ____________________________________________________________________________ ____________________________________________________________________________ ____________________________________________________________________________ ____________________________________________________________________________ ____________________________________________________________________________ ____________________________________________________________________________ ____________________________________________________________________________ ____________________________________________________________________________ ____________________________________________________________________________ ____________________________________________________________________________ ____________________________________________________________________________ ____________________________________________________________________________ ____________________________________________________________________________ ____________________________________________________________________________ ____________________________________________________________________________ ____________________________________________________________________________ ____________________________________________________________________________ ____________________________________________________________________________ ____________________________________________________________________________ ____________________________________________________________________________ ____________________________________________________________________________ ____________________________________________________________________________