working paper 79 is there a difference between solicited and
TRANSCRIPT
Working paper research n° 79 February 2006
Is there a difference between solicited and unsolicited bank ratings and if so, why ? Patrick Van Roy

NBB WORKING PAPER No. 79 FEBRUARY 2006
NATIONAL BANK OF BELGIUM
WORKING PAPERS RESEARCH SERIES
IS THERE A DIFFERENCE BETWEEN SOLICITED ANDUNSOLICITED BANK RATINGS AND IF SO, WHY?
___________________
Patrick Van Roy (*)
The views and findings expressed in this paper are those of the authors and do not necessarily
reflect the views of the National Bank of Belgium.
I thank Mathias Dewatripont, Stefano Federico, Philipp Hartmann, Janet Mitchell, Peter Praet,
Vincenzo Verardi and David Veredas for helpful comments and suggestions. The assistance of
Bureau Van Dijk in providing some of the data used in this study is also gratefully acknowledged. All
remaining errors are mine.
__________________________________(*) NBB, Department of International Cooperation and Financial Stability (email: [email protected]).

NBB WORKING PAPER No. 79 FEBRUARY 2006
Editorial Director
Jan Smets, Member of the Board of Directors of the National Bank of Belgium
Statement of purpose:
The purpose of these working papers is to promote the circulation of research results (Research Series) and analyticalstudies (Documents Series) made within the National Bank of Belgium or presented by external economists in seminars,conferences and conventions organised by the Bank. The aim is therefore to provide a platform for discussion. The opinionsexpressed are strictly those of the authors and do not necessarily reflect the views of the National Bank of Belgium.
The Working Papers are available on the website of the Bank:http://www.nbb.be
Individual copies are also available on request to:NATIONAL BANK OF BELGIUMDocumentation Serviceboulevard de Berlaimont 14BE 1000 Brussels
Imprint: Responsibility according to the Belgian law: Jean Hilgers, Member of the Board of Directors, National Bank of Belgium.Copyright © fotostockdirect goodshoot
gettyimages digitalvisiongettyimages photodiscNational Bank of Belgium
Reproduction for educational and noncommercial purposes is permitted provided that the source is acknowledged.ISSN: 1375680X

NBB WORKING PAPER No. 79 FEBRUARY 2006
Abstract
This paper analyses the effect of soliciting a rating on the rating outcome of banks. Using a sample
of Asian banks rated by Fitch Ratings ("Fitch"), I find evidence that unsolicited ratings tend to be
lower than solicited ones, after accounting for differences in observed bank characteristics. This
downward bias does not seem to be explained by the fact that betterquality banks selfselect into
the solicited group. Rather, unsolicited ratings appear to be lower because they are based on public
information. As a result, they tend to be more conservative than solicited ratings, which incorporate
both public and nonpublic information.
JELcode : G15, G18, G21
Keywords: Credit rating agencies, Unsolicited ratings, Selfselection, Public disclosure,
Accounting transparency
NBB WORKING PAPER No. 79 FEBRUARY 2006
TABLE OF CONTENTS
1. Introduction .................................................................................................................................. 1
2. Background on unsolicited ratings............................................................................................... 5
3. Data.............................................................................................................................................. 9
4. Methodology............................................................................................................................... 12
4.1. Ordinary least squares ....................................................................................................... 12
4.2. Treatment effect model ...................................................................................................... 13
4.3. Endogenous switching regression model .......................................................................... 15
5. Results ....................................................................................................................................... 17
5.1. Ordinary least squares ....................................................................................................... 17
5.2. Treatment effect model ...................................................................................................... 19
5.3. Endogenous switching regression model .......................................................................... 20
5.4. Test of the public disclosure hypothesis ............................................................................ 22
6. Conclusion ................................................................................................................................. 24
References ....................................................................................................................................... 27
Tables............................................................................................................................................... 30
National Bank of Belgium Working paper series............................................................................ 41

NBB WORKING PAPER No. 79 FEBRUARY 2006

1
1. Introduction
Several facts have recently drawn public attention to the work and functioning of
credit rating agencies. First and foremost was their failure to predict the Asian crisis and
a wave of corporate scandals such as Enron, WorldCom, or Parmalat. Second was the
potential procyclicality of their assessments and their increasing role in the regulatory
mechanism of financial markets (Basel Committee, 2004). Third have been a number of
issues related to the transparency and integrity of the rating process (Securities and
Exchange Commission, 2003; European Commission, 2004). Among these issues, the
practice of unsolicited ratings has prompted controversy among issuers, credit rating
agencies, and regulators alike. Unsolicited ratings are formally defined as “ratings that
credit rating agencies conduct without being formally engaged to do so by the issuer”
(International Organization of Securities Commissions, 2003). As such, and contrary to
solicited ratings, unsolicited ratings do not imply the payment of a rating fee and do not
involve any formal meetings between the credit rating agency and the entity being
rated.1 These meetings typically provide an opportunity for credit rating agencies to get
an overview of a company’s activities and to obtain more information than what is
disclosed in its published annual reports.2
The main concern surrounding unsolicited ratings is the fact that they “do not
appear to be empirically as favorable as solicited ratings” (Securities and Exchange
Commission, 2005). Even though this could be interpreted as evidence that unsolicited
ratings are assigned to “blackmail” issuers into paying for a solicited rating, it could also
simply indicate that betterquality issuers request a rating or that credit rating agencies
issue more conservative ratings in the absence of nonpublic information.
This paper contributes to the literature on unsolicited ratings by investigating
whether there is a difference between Fitch’s solicited and unsolicited bank ratings and,
if so, why. The analysis makes use of bank ratings assigned in Asia, i.e., the only region
for which a significant portion of Fitch’s bank ratings are unsolicited. After confirming a
systematic difference between unsolicited and solicited ratings for similar banks, the
paper tests two hypotheses. The first is the “selfselection hypothesis”, which states that
1 Golin (2001) insists that credit rating agencies conducting unsolicited ratings neverthelessattempt to invite the participation of the rated entity, either through submission ofquestionnaires, informal visits, or informal reviews of the draft report.2 Fight (2001) reports excerpts of a survey conducted by Cantwell & Company which indicatethat more than 90% of companies release either selected or substantial nonpublic information totheir rating agency during these meetings.

2
solicited ratings tend to be higher than unsolicited ones because they are the result of
selfselection, i.e., betterquality issuers selfselect into the solicited group by choosing to
obtain rating services. This hypothesis is tested using a treatment effect model and an
endogenous switching regression model, both of which extend the standard model of
sample selection due to Heckman (1979).
A rejection of the selfselection hypothesis is consistent with at least two different
interpretations: unsolicited ratings are lower to “punish” issuers who otherwise would
not purchase ratings coverage; alternatively, unsolicited ratings are lower because they
are based only on public information and, as a result, tend to be more conservative than
solicited ratings. The latter gives rise to the second hypothesis tested by the paper: the
“public disclosure hypothesis”, which states that issuers who choose not to request a
rating and who disclose a low amount of information receive a lower rating than do
similar issuers who have solicited a rating. However, a high enough amount of
information disclosure may eliminate the difference between solicited and unsolicited
ratings.3 In this paper, information disclosure is measured by an index capturing the level
of accounting information released by issuers.
Interestingly, the importance of information disclosure for nonfinancial firms has
recently become the focus of several empirical papers. Milton (2002) and Baek et al.
(2002) find that East Asian firms which had indicators of higher disclosure quality
(American depository receipt and/or auditors from one of the Big Six accounting firms)
experienced better stock price performance during the financial crisis of 199798. Jorion
et al. (2005) find for the U.S. that the stock price effect of rating changes has been larger
since the implementation of Regulation Fair Disclosure, which prohibits public
companies from disclosing nonpublic information to favoured investment professionals,
except to credit rating agencies. Finally, Yu (2005) shows that U.S. firms with higher
perceived accounting transparency tend to have lower credit spreads. In addition, Yu
(2005) also finds that firms improve their credit rating by 0.5 notches on a 1 to 20 rating
scale by elevating their disclosure quality above the median disclosure index.
Given the importance of information disclosure for nonfinancial firms, one should
expect disclosure to play at least as important a role for banks. Indeed, several studies
suggest that banks are inherently more opaque than nonfinancial firms. For instance,
3 Thus, the public disclosure hypothesis assumes that credit rating agencies view public and nonpublic information as partial substitutes for each other. This is not unrealistic. For instance,Heflin et al. (2003) and Bailey et al. (2003) find that Regulation Fair Disclosure had little effecton the forecast accuracy of equity analysts. They interpret this result as evidence that analystsoffset the loss of nonpublic information by relying on improved public information.
3
Morgan (2002) reports that Moody’s Investors Service Inc. (Moody’s) and Standard and
Poor’s (S&P) disagree more often over banks’ and insurance companies’ ratings than
over other types of firms’ ratings and that Moody’s is systematically more conservative
than S&P in its ratings, and relatively more so for banks. The latter finding can be
explained by the fact that the opacity of banks’ assets makes the conservative rating
agency (Moody’s) err even more on the side of caution.4 Berger et al. (2000) and
Deyoung et al. (2001) provide additional evidence of the importance of bank information
disclosure by showing that supervisory and bond market ratings assigned to U.S. banks
produce valuerelevant information that affects the market.
In addition to the recent interest in firms’ information disclosure, several papers have
been devoted to the question of differences in solicited versus unsolicited ratings. The
existing literature on this topic can be divided into two groups of papers.
The first group of papers (Poon, 2003a; Poon, 2003b; Poon and Firth, 2005) focuses
on ratings assigned by S&P and Fitch to banks and insurance companies and finds that
unsolicited ratings are lower than solicited ones.5 While these studies attempt to control
for sample selection, their incomplete and conflicting results make it difficult to infer
whether sample selection in credit ratings does exist and, if so, whether it is responsible
for the lower unsolicited ratings.
The second group of papers (Butler and Rodgers, 2003; Gan, 2004) relies on
estimated rating fees to identify solicited and unsolicited ratings among ratings assigned
by Moody’s and S&P to U.S. companies. Butler and Rodgers (2003) find that solicited
ratings are not higher than solicited ones and that the marginal effect of soliciting a
rating is to decrease the impact that most financial variables have on credit ratings. Gan
(2004) finds a statistically significant difference between solicited and unsolicited ratings
but no statistically significant difference between the issuers’'performance after a rating
has been assigned. These results lead Gan (2004) to reject the idea that issuers with
unsolicited ratings are discriminated against.
In light of the abovementioned studies, the main contributions of this paper are the
following. First, this paper investigates whether there is a difference in treatment
4 Morgan and Stiroh (2001) reach a similar conclusion when they evaluate the impact of bankbalance sheet composition on an institution’s new subordinated debentures. However, acontribution by Flannery et al. (2004) contradicts these findings and suggests that banking assetsmay not be unusually opaque.5 Poon (2003a) uses S&P’s ratings of 265 insurance companies in 15 mostly developing countries;Poon (2003b) considers S&P’s ratings of 171 banks in 20 mostly developing countries; Poon andFirth (2005) use Fitch’s ratings of 935 banks in 82 countries. The latter paper is based on asample which includes nonAsian banks. However, Fitch does not assign unsolicited bank ratingsoutside Asia (see Section 3).

4
between solicited and unsolicited bank ratings using a sample where both types of
ratings are identified as such. This represents an advantage over Butler and Rodgers
(2003) and Gan (2004), who are unable to distinguish clearly between solicited and
unsolicited ratings in their analysis. Second, this paper addresses the issue of self
selection through both the use of a treatment effect model and an endogenous switching
regression model (selfselection hypothesis). The abovementioned studies do not, or only
imperfectly, control for sample selection. Third, this study tests whether the difference
between solicited and unsolicited ratings disappears when banks with unsolicited ratings
release a high enough amount of public information (public disclosure hypothesis). As far
as I am aware, this hypothesis has not yet been tested in the literature.
Several results emerge from the analysis. First, I find no evidence that, in
determining ratings, Fitch assigns different weights to observable bank characteristics in
the solicited and unsolicited groups. However, I do find that unsolicited bank ratings are
lower than solicited ones after controlling for observable bank characteristics. The
estimated difference between the two types of ratings is also economically significant, as
it averages 0.9 notches on a 1 to 9 rating scale.
On the one hand, these findings appear to give some credence to Fitch’s claim that
the methodology for its unsolicited bank ratings is “nearly the same” as for its solicited
bank ratings (Fitch, 2001). On the other hand, they seemingly contradict Fitch’s
assertion that there is no difference in its credit judgement of firms with unsolicited
ratings (Fitch, 2005a). In addition, they call into question the desirability of a recent
decision by Fitch to give up disclosing whether its ratings are solicited or not.
A second result is that there is no strong evidence of a sample selection problem in
bank ratings. Hence the selfselection hypothesis is rejected. Third, the results provide
support for the public disclosure hypothesis. Banks which disclose a high amount of
information receive better unsolicited ratings than do similar banks with unsolicited
ratings but low levels of information disclosure. Banks which do not request a rating but
which disclose a high amount of information receive ratings which are not statistically
different from the solicited ratings of similar banks.
The latter finding is important in light of the fact that the theoretical impact of
public disclosure on the relation between soliciting a rating and the actual rating
outcome is ambiguous. On the one hand, the impact of public disclosure might be
positive if issuers who do not request a rating and who disclose a high enough amount of
public information receive the benefit of the doubt. On the other hand, the impact of
public disclosure might be negative if it adds to negative perceptions or intuitions about

5
issuers who choose not to be rated. This study suggests that the first effect dominates
the second.
The results of the test of the public disclosure hypothesis are also of interest in the
particular case of Fitch’s ratings. A former official of Fitch’s BankWatch6 has
acknowledged that “It is true that unsolicited ratings are often more conservative than
solicited ratings. The reason is not that agencies are attempting to punish companies
that decline to pay for a rating, but that where there is doubt, the agencies will tend to
err on the side of caution. Correspondingly, the more information provided to the
agencies, the more transparent the disclosure process, the more comfort agency analysts
will feel in giving the company the benefit of the doubt (...) In the same manner, where
in the case of an unsolicited rating, the issuer has not been very forthcoming with
information, or places the burden of extracting that information on the agency analyst, it
is not surprising that the agency analyst will tend to err on the side of conservatism, and
properly so. As a matter of practice, less disclosure tends to be associated with higher
risk. In the context of risk assessment, disclosure is not only the means by which the
assessment is performed, it is also arguably a positive credit consideration in itself”.
(Golin, 2001, pp. 534535).
Many market participants also appear to believe that low public disclosure explains
the downward bias in unsolicited ratings. For example, the investment bank Merrill
Lynch noted that the low unsolicited ratings assigned to four major Egyptian banks by
Moody’s in 1997 were mainly due to “lack of cooperation regarding nonpublic
information” along with “poor transparency of financial accounts” (Egypt State
Information Service, 1997).
The remainder of the paper is organised as follows. Section 2 reviews the background
on unsolicited ratings. Section 3 presents the data used in the analysis. The research
methodology is described in Section 4 and the results are presented in Section 5. Section
6 concludes and offers some relevant policy implications.
2. Background on unsolicited ratings
Over recent years, there have been many instances in which credit rating agencies
have been accused of assigning lower unsolicited ratings in order to “blackmail” issuers
6 BankWach is the credit rating agency which initiated the practice of unsolicited bank ratings inAsia prior to its absorption by Fitch.
6
into paying for and participating in a rating process. A recent example cited as an
alleged abuse of power is the series of successive downgrades of Hannover Re, one of the
world’s largest reinsurance companies, by Moody’s.7 Hannover Re was initially
approached by Moody’s in 1998 to subscribe to its rating services, but declined the offer
since it was already paying fees to S&P and A.M. Best Company (A.M.) – a smaller
credit rating agency – for this purpose. Despite being turned down, Moody’s decided to
go ahead and rate Hannover Re at no charge. Although Moody’s initial unsolicited rating
was Aa2, only one notch below that given by S&P, it was subsequently lowered to Aa3
(January 2001) and then to A2 (November 2001). In March 2003, Moody’s further
downgraded Hannover to Baa1 while S&P and A.M. continued to give the insurance
company a rating four notches and two notches higher, respectively. Moody’s final
downgrade sparked a 10% drop in the insurer’s stock and surprised many analysts given
that there was no new information in the public domain justifying this. Hannover Re’s
comments were that Moody’s decisions were “pure blackmail” and that company’s
officials had been told on many occasions that if they paid for a rating, it “could have a
positive impact” on the grade. Hannover Re further pointed out that, since S&P was
already making headway in Germany and throughout Europe in rating the insurance
business, Moody’s decision to assign an unsolicited rating may have represented a fast
way to play catchup (Wall Street Journal, 2004).
In spite of the huge controversy surrounding unsolicited ratings, credit rating
agencies insist on defending this practice. Their main argument is that they do not issue
higher solicited ratings to keep existing customers or lower unsolicited ratings to attract
new customers, as this would imply that they are willing to jeopardise their reputation in
order to benefit from a temporary increase in revenues (Golin, 2001). In addition, credit
rating agencies point out the following benefits of unsolicited ratings. First, unsolicited
ratings should be seen as a service to investors and market participants who frequently
make requests for coverage of institutions that are unwilling to undergo the rating
process or pay a rating fee (Basel Committee, 2003; Fitch, 2005a). Second, unsolicited
ratings prevent firms from “rating shopping”, a practice whereby firms only request an
additional rating when they expect an improvement on their existing rating (Securities
and Exchange Commission, 2004). Third, unsolicited ratings contribute to opening up
competition among credit rating agencies as they allow smaller agencies to compete with
Moody’s, S&P and Fitch (Basel Committee, 2001).
7 For a review of other alleged abuses of power, see Hill (2001).
7
In fact, even the Big Three credit rating agencies originally relied on unsolicited
ratings to develop their activities. Prior to the 1970s, they used to charge bondholders a
fee for obtaining rating information and thereby provided unsolicited rather than
solicited ratings. The shift to a business model that charged issuers for the privilege of
obtaining a rating occurred mainly because of the spread of lowcost photocopying and
the desire of issuers to reassure investors of the quality of their issuances (White, 2001).
However, in 1991, Moody’s reintroduced the practice of unsolicited ratings and other
rating agencies quickly followed in the mid1990s.
Even though the vast majority of credit ratings are still assigned on a solicited basis,
unsolicited ratings currently account for a sizeable portion of the total number of credit
ratings. According to the Cantwell survey (Fight, 2001), unsolicited ratings represented
between 6% (S&P) and 26.6% (Fitch) of the total number of credit ratings assigned in
industrial countries in 2000. In another survey conducted by Baker and Mansi (2002),
U.S. firms with unsolicited ratings averaged 10.6% of the total number of firms with a
credit rating in 1999. In Europe, the phenomenon of unsolicited ratings is believed to be
substantially smaller (Basel Committee, 2000). In fact, issuers located in developing
countries appear to be the main targets of unsolicited ratings. Evidence from Bankscope
for instance indicates that almost 80% of S&P’s unsolicited bank ratings were assigned in
Africa, South America, and Asia (excluding Japan) in February 2005.
Interestingly, credit rating agencies do not talk about solicited versus unsolicited
ratings but use a softer terminology. In 1996, S&P started issuing unsolicited ratings
under the name “public information ratings”, mainly to companies in the insurance and
banking sectors. These ratings, which appear with a “pi” subscript in its publications,
are assigned by broad numerical categories without a + or – modifier, i.e., AAA, AA...
Contrary to S&P, Moody’s policy has long refused to disclose whether a rating was
solicited or not. Due to market pressure, however, it finally announced in 1999 that it
would identify, in its initial rating assignment announcements only the unsolicited
ratings for which the issuer had declined its invitation to participate in the assignment
process (Moody’s, 1999). Since January 2000, the following statement appears in the first
press release accompanying the assignment of an unsolicited rating by Moody’s: “This
rating was initiated by Moody’s. The issuer did not participate in the assignment
process”. Since October 2004, Moody’s has begun identifying on its website and in
selected research reports any issuer that has declined its invitation to participate in the
rating process.
8
Fitch, the third largest player in the credit rating industry, issues unsolicited ratings
under the name “initiated” (or “shadow”) ratings. The majority of these ratings are
assigned in Asia and have been introduced to bring into Fitch’s coverage the large
number of banks previously rated by BankWatch (see Section 3). Although Fitch’s
policy had long been to disclose, both in its initial and subsequent publications
concerning a rating, whether this rating was paid or not, it announced in June 2005 that
it would henceforth only identify unsolicited ratings as such in its initial rating
assignment announcements and that it would not continue to disclose the solicitation
status of ratings afterwards (Fitch, 2005a). Consequently, Fitch dropped the initiated (or
shadow) subscript from all its unsolicited ratings in its publications.
Over the last three years, unsolicited ratings have come under the attention of
several regulatory bodies as part of wider investigations into the role and function of
credit rating agencies.
In 2003, the U.S. Securities and Exchange Commission (SEC) issued a report where
it expressed its concerns about credit rating agencies engaging in specified practices with
respect to unsolicited ratings (e.g., sending a bill for an unsolicited rating, sending a fee
schedule and “encouraging” payment, indicating that a rating might be improved with
the cooperation of the issuer). The SEC also mentioned that it would explore whether
only credit rating agencies that issue clearly labelled unsolicited ratings should be
granted the status of Nationally Recognized Statistical Rating Organizations (SEC,
2003).
In 2004, the International Organization of Securities Commissions (IOSCO)
published a code of conduct for credit rating agencies that sets out a series of measures
that agencies should incorporate into their own codes of conduct. In particular, the code
asks credit rating agencies to “disclose whether the issuer participated in the rating
process” and to identify each rating not initiated at the request of an issuer as such
(IOSCO, 2004a). Interestingly, Fitch’s reply was that it did “not believe that it is
necessary or appropriate to require the disclosure of whether a rating is initiated or
whether the issuer has cooperated in the rating process” and that such requirements
“interfere in the editorial process of the rating agencies” (IOSCO, 2004b).
Finally, the Committee of European Securities Regulators (CESR) also recently
recommended that credit rating agencies disclose whether they initiate their credit
ratings and whether the issuer participates in the rating assessment process (CESR,
2005).

9
3. Data
The sample used in this study consists of solicited and unsolicited bank ratings
assigned by Fitch in Asia. Fitch started to issue unsolicited bank ratings in this part of
the world after its acquisition of BankWatch – a credit rating agency specialised in the
banking sector – in October 2000. Prior to its absorption by Fitch, BankWatch used two
types of rating scales in emerging markets, the socalled “intracountry issuer rating”
and “credit evaluation rating” scales. The latter scale mainly applied to unsolicited
ratings of smaller institutions or banks in Asia. However, BankWatch did not
systematically disclose whether its ratings were paid for or not (Golin, 2001). Following
the integration of BankWatch’s ratings into its own rating system, Fitch announced that
ratings that were part of the credit rating evaluation scale and that were largely based
on public information would be appended with an “s” (shadow) in its publications. Fitch
nevertheless insisted that the methodology behind these shadow (unsolicited) ratings and
the more traditional full due diligence (solicited) ratings was almost the same and that
their definition and scale were identical (Fitch, 2001).
Fitch’s solicited and unsolicited bank ratings belong to a specific class of credit
ratings known as “individual ratings”.8 These ratings, which are used primarily by
interbank lenders, focus on the ability of issuers to satisfy their obligations in general,
irrespective of the terms of any particular debt obligation. They thus differ from the
more wellknown debt ratings, which attempt to assess the risk that an issuer will not
repay a specific security or class of securities, e.g., longterm debt. In addition, individual
ratings do not take into account external support that an issuer might receive from its
country of origin, which means in practice that they are not determined by the rating of
the issuer’s country.
The bank individual ratings and the corresponding financial information used in the
analysis were obtained from Bankscope and Fitch Research. Specifically, in the
remainder of the paper, I use crosssectional regressions where the dependent variable is
the bank individual rating on January 31, 2004. As Fitch asks for a minimum of three
years’ annual data and a maximum of five years’ when assigning a bank rating, I use the
fiveyear average (1999 to 2003) of bank variables if available and their threeyear
average (2001 to 2003) if not.
8 Individual ratings are called “financial strength ratings” at Moody’s and Capital Intelligence, asmaller credit rating agency specialised in emerging market financial institutions. S&P does notassign this type of ratings to banks. The complete definition of individual ratings can be found inAppendix A.
10
Table 1 illustrates the distribution of 169 sample bank ratings sorted by country.
Only those countries that have both solicited and unsolicited bank ratings are included
in the analysis. Among the sample countries, Taiwan, India, and Hong Kong are the
countries with the highest number of bank ratings, with respectively 39 banks (23.1% of
observations), 32 banks (18.9% of observations) and 18 banks (10.7% of observations).
Unsolicited ratings constitute the majority of bank ratings in the sample countries with
95 banks (56.2% of observations). Solicited ratings account for the remainder of the
sample with 74 banks (43.8% of observations). The number of solicited and unsolicited
bank ratings is roughly equal in two countries (Hong Kong and Taiwan) while the other
sample countries have a majority of solicited ratings (Indonesia, Macau, Malaysia, the
Philippines, and South Korea) or unsolicited ratings (Bangladesh, China, India, and
Vietnam). Obviously, a plausible explanation for this imbalance is that banks located in
countries with weakly developed banking markets hardly borrow in the international
interbank market and, as a consequence, do not require an individual rating. Another
possible explanation is that banks located in countries with very different regulatory
systems and/or accounting standards prefer to be rated by local credit rating agencies
(Poon, 2003a).
Table 2 shows the sample distribution of solicited and unsolicited bank ratings by
rating level. Note that, contrary to Fitch’s debt ratings, which use the standard AAA to
D rating scale, Fitch’s individual ratings are based on an A to E classification with
intermediate categories, i.e., A/B, B/C, C/D, and D/E. The rating category with the
highest number of sample banks is the D category (40 banks or 23.7% of observations)
while no sample bank falls in the A category. Less than a third of the sample banks (49
banks or 29% of observations) obtain C ratings or above, meaning that their overall
creditworthiness is adequate to (very) strong. The remaining sample banks (120 banks or
71% of observations) are classified below C, meaning that their overall creditworthiness
is somewhat weak to very weak. Solicited ratings mostly fall into the B/C to D
categories whereas unsolicited ratings are concentrated in the C to E categories. The fact
that unsolicited ratings are more concentrated across the rating scale tends to confirm
the perception of many issuers that these ratings are less accurate than solicited ones
(Baker and Mansi, 2002).
In Table 3, I present summary statistics for the entire sample of 169 bank individual
ratings. The variables in the table were selected according to Fitch’s bank rating
methodology (Fitch, 2004a), which indicates that Fitch’s bank ratings are determined by
a number of quantitative and qualitative factors that can be classified into nine

11
categories: risk management, funding and liquidity, capitalisation, securitisation,
earnings and performance, market environment, diversification of business and franchise,
management and strategy, and corporate governance. Based on this classification, the
variables which exhibit the strongest correlation with Fitch’s bank individual ratings are
reported in Table 3.
In addition, Fitch also emphasises its need for a detailed breakdown of banks’
balance sheet and income statement when assigning a rating. This requirement is
captured by a disclosure index, which can be found at the bottom of Table 3. The
disclosure index is based on Baumann and Nier (2004) and records whether banks
disclose information on 17 key balancesheet categories in Bankscope. The 17 key
categories include 7 asset categories, 4 liabilities categories, 4 memo lines categories and
2 income statement categories. The disclosure index thus measures the level of detail
that banks provide on 17 key dimensions of accounting information in their published
accounts. Note that since Bankscope is a product of Fitch, it seems reasonable to assume
that the disclosure index accurately reflects all the accounting information publicly
available to this credit rating agency.
Table 4 compares the mean and standard deviation of some bank characteristics in
the solicited and unsolicited groups (the tstatistic for mean equality is given in the last
column). Banks with unsolicited ratings have better asset quality (i.e., lower impaired
loans/gross loans) but are less liquid and less capitalised than banks with solicited
ratings. The difference between the performance of the solicited and unsolicited groups
(as measured by the return on assets and the cost to income ratio) is not found to be
statistically significant,9 while no variable related to the securitisation category was
found in Bankscope. Banks which request a rating are more likely to have a financial
statement which is consolidated (62.2% in the solicited group vs. 44.2% in the unsolicited
group) and which has been approved by the auditors without qualification (88.3% in the
solicited group vs. 77.2% in the unsolicited group). There are more commercial banks in
the unsolicited group (94.7%) than in the solicited one (77.0%). Interestingly, the
sovereign credit rating and the diversification/franchise variables do not differ
significantly across solicited status. However, banks which choose not to be rated are
more likely to be located in communist countries, i.e., countries characterised by very
different banking systems, than banks which choose to obtain rating services (2.7% in
the solicited group vs. 22.1% in the unsolicited group). Corporate governance variables
9 Throughout the paper, significance refers to a level of confidence of 95% and marginalsignificance to a level of confidence of 90%.
12
also show that banks requesting a rating have a statistically higher degree of
involvement of individuals and families in their ownership (4.3% of equity owned by this
type of shareholders in the solicited group vs. 0.4% in the unsolicited group), while banks
which choose not to be rated have stronger ties to the State (28.3% of equity owned by
this type of shareholders in the unsolicited group vs. 9.1% in the solicited group). In
addition, banks rated on a solicited basis have significantly more subsidiaries (7.0) than
banks rated on an unsolicited basis (3.2). This result does not seem to proxy for a size
effect since the difference between the means of the “total deposits” variable in the
solicited and unsolicited groups was not significant. Finally, the last row of Table 4
indicates that there is no statistically significant difference between the level of disclosure
of banks with solicited ratings and the level of disclosure of banks with unsolicited
ratings.
Overall, Table 2 suggests that unsolicited ratings tend to be more frequently assigned
at the lower end of the rating scale than solicited ones, while Table 4 shows some
differences in the characteristics of the solicited and unsolicited groups. In order to
answer the question of whether there is a difference in treatment between solicited and
unsolicited bank ratings and, if so, to explain why, I now turn to the econometric
analysis.
4. Methodology
This section outlines the methodology used to test whether banks with solicited
ratings and those with unsolicited ratings obtain the same rating ceteris paribus.
4.1. Ordinary least squares
I first use a simple ordinary least squares regression of the form:
i i i iRating X Solicited ,= + + (1)
where Ratingi corresponds to the individual rating of bank i coded on a 9 (A) to 1 (E)
scale, Xi is a matrix of financial and nonfinancial characteristics that explain the
individual rating of bank i and Solicitedi is a dummy variable that equals one if bank i
has requested an individual rating and zero otherwise. Although Ratingi takes nine
different discrete values, it is treated as a continuous variable in the remainder of the
13
analysis. Aside from simplifying the estimation of the regression models, this choice is
made for two reasons. First, researchers often treat discrete variables as continuous when
the range of values that they take is large enough and when the gaps between successive
values are equivalent (Abrevaya and Hausman, 1999). Both conditions are met in this
case since individual ratings are split into nine different categories and much of the
empirical literature assumes that credit ratings can be interpreted as cardinal values.
Second, the existing studies on the determinants of credit ratings show that this type of
analysis is not very sensitive to the choice between ordinary least squares and ordered
probit, a statistical model for discrete random variables (see, e.g., Cantor and Packer,
1997; Pottier and Sommer, 1999).10
Looking at equation (1), the coefficient of Solicitedi, , measures the socalled
treatment effect. In this context, the treatment is whether or not banks have requested
an individual rating from Fitch. The null hypothesis to be tested is whether = 0 , i.e.,
whether soliciting a rating has no effect on the rating itself once controlling for relevant
bank characteristics. One issue that arises in this setup is the potential endogeneity of
the variable Solicitedi i.e., the possibility that corr (Solicitedi, i) 0, yielding biased and
inconsistent least squares estimates. For instance, if the typical bank which chooses to
request a rating would have a relatively high rating whether or not it asked to be rated,
there will be a positive correlation between Solicitedi and i . In this case, the least
squares estimates of will actually overestimate the treatment effect. Therefore, I use
two extensions of the standard model of sample selection due to Heckman (1979) to
account for potential selfselection into solicited status.11
4.2. Treatment effect model
The treatment effect model complements the outcome equation (1) with the following
latent model:
*i i iSolicited W u ,= + (2)
*i iSolicited Solicited1 if 0, 0 otherwise,= > (3)
10 As a robustness check, I also estimated equation (1) using an ordered probit model. The results,which are shown in Table 9 (Appendix B), are very similar to those of ordinary least squares.11 Poon (2003a) and Poon (2003b) use Heckman’s standard model of sample selection and aretherefore unable to estimate the impact of soliciting a rating while simultaneously controlling forthe selection bias. Butler and Rodgers (2003) and Gan (2004) do not control for sample selection.

14
where W collects all variables in X plus any other variables that affect the decision to
request an individual rating but not the rating itself. The model further assumes that X
and W are exogenous and that and u follow a bivariate normal distribution with mean
vector zero and symmetric covariance matrix equal to:
=.
2
2,
é ùê úê úë û
u
u
(4)
where 2 is the variance of the error term in the outcome equation, u2 is the variance of
the error term in the selection equation and u is the covariance between both error
terms. Since can be estimated only up to a scale factor, it is assumed that u =2 1 hence
u = where is the coefficient of correlation between and u.
Using equation (1), one can show that the expected rating conditional on having
requested one is given by:
ii i i i i
i
WRating Solicited ,X ,W X
W( )
E( 1 ) ,( )
é ù= = + + ê ú
ë û
f(5)
where f denotes the normal density function and the normal cumulative function. For
banks with unsolicited ratings, the counterpart to (5) is:
ii i i i i
i
WRating Solicited ,X ,W X
W( )
E( 0 ) .1 ( )
é ù-= = + ê ú-ë û
f(6)
The difference in expected rating between banks which request a rating and those
which do not is given by the difference between equations (5) and (6):
[ ]
i i i i i i i i
i
i i
Rating Solicited ,X ,W Rating Solicited ,X ,W
WW W
E( 1 ) E( 0 )
( ),
( ) 1 ( )
= - = =
é ù+ ê ú
-ê úë û
f(7)
where the first term on the righthand side, , measures the treatment effect and the
second term in brackets is the hazard rate. If the latter term is omitted from equation
(1), the above difference is what is estimated by the least squares coefficient of the
dummy variable Solicitedi. For instance, in the presence of positive selfselection ( > 0 ),
the second term in (7) is positive hence the least squares estimator of overestimates the
treatment effect.
The treatment effect model can be consistently estimated by a standard instrumental
variable approach or by a twostep approach in the spirit of Heckman (1979). The latter
method, which is used in this study, consists in estimating a probit equation for the

15
probability of soliciting a rating, before estimating equation (1) augmented with the
hazard rate obtained from the probit equation (the standard errors of the least squares
estimates must be corrected). A test for 0= is a test of selection based on
unobservable rating determinants. If is not significantly different from zero, one can
reasonably decide that selectivity is not a problem and proceed to use ordinary least
squares as usual (Davidson and MacKinnon, 1993).
4.3. Endogenous switching regression model
All methods examined so far are based on equation (1), which assumes that soliciting
a rating has only an intercept effect on individual ratings. However, soliciting a rating
may also have a slope effect, i.e., the coefficients of the Xs may differ according to the
solicited status. In addition, the above models assume that the variance of the
unobserved component of individual ratings is the same for banks with solicited ratings
and for banks with unsolicited ratings. A more general version of the outcome equation,
which allows for treatment heterogeneity and for error terms with different variances, is
given by:
i i iRating X= +1 1 1 if Solicitedi = 0, (8)
i i iRating X= +2 2 2 if Solicitedi = 1, (9)
where it is assumed that X is exogenous and that 1, 2 and u follow a trivariate normal
distribution with mean vector zero and symmetric covariance matrix equal to:
.
.
. .
21 1
22 2
2
,
é ùê ú
= ê úê úê úë û
u
u
u
(10)
where 21 and 2
2 are the variances of the error terms in the outcome equations, u2 is the
variance of the error term in the selection equation and u1 and u2 are the covariances
between 1 and u and 2 and u, respectively (the covariance between the error terms in
the outcome equations is not defined since Rating1i and Rating2i are never observed
simultaneously). Since can be estimated only up to a scale factor, it is assumed that
u =2 1 hence 1 1 1=u u and 2 2 2=u u where 1u and 2u are the coefficients of
correlation between 1 and u and 2 and u, respectively.
16
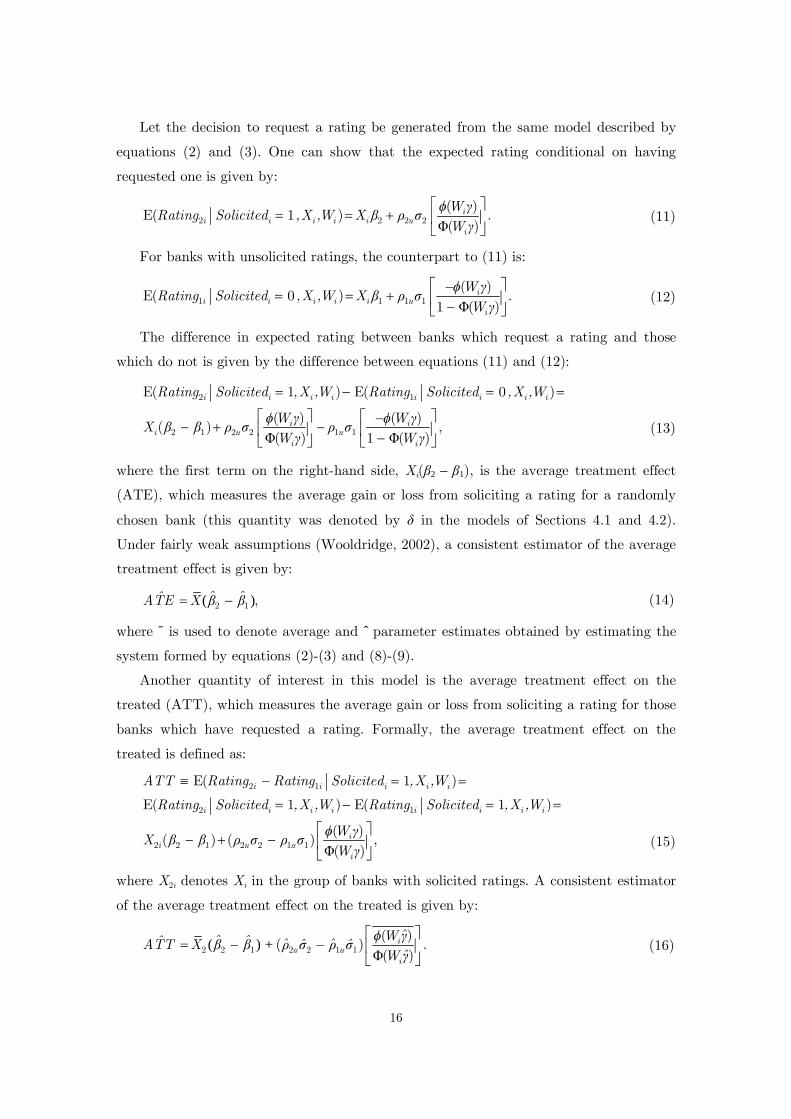
Let the decision to request a rating be generated from the same model described by
equations (2) and (3). One can show that the expected rating conditional on having
requested one is given by:
ii i i i i
i
WRating Solicited ,X ,W X
W2 2 2 2( )
E( 1 ) .( )
é ù= = + ê ú
ë ûu
f(11)
For banks with unsolicited ratings, the counterpart to (11) is:
ii i i i i
i
WRating Solicited ,X ,W X
W1 1 1 1( )
E( 0 ) .1 ( )
é ù-= = + ê ú-ë û
uf
(12)
The difference in expected rating between banks which request a rating and those
which do not is given by the difference between equations (11) and (12):
i i i i i i i i
i ii
i i
Rating Solicited ,X ,W Rating Solicited ,X ,W
W WX
W W
2 1
2 1 2 2 1 1
E( 1 ) E( 0 )
( ) ( )( ) ,
( ) 1 ( )
= - = =
é ù é ù-- + -ê ú ê ú-ë û ë û
u uf f
(13)
where the first term on the righthand side, Xi( 2 – 1), is the average treatment effect
(ATE), which measures the average gain or loss from soliciting a rating for a randomly
chosen bank (this quantity was denoted by in the models of Sections 4.1 and 4.2).
Under fairly weak assumptions (Wooldridge, 2002), a consistent estimator of the average
treatment effect is given by:
( )ˆ ˆˆATE X 2 1 ,= - (14)
where is used to denote average and p̂arameter estimates obtained by estimating the
system formed by equations (2)(3) and (8)(9).
Another quantity of interest in this model is the average treatment effect on the
treated (ATT), which measures the average gain or loss from soliciting a rating for those
banks which have requested a rating. Formally, the average treatment effect on the
treated is defined as:
i i i i i
i i i i i i i i
ii
i
ATT Rating Rating Solicited ,X ,W
Rating Solicited ,X ,W Rating Solicited ,X ,W
WX
W
2 1
2 1
2 2 1 2 2 1 1
E( 1 )
E( 1 ) E( 1 )
( )( ) ( ) ,
( )
º - = =
= - = =
é ù- + - ê ú
ë ûu u
f(15)
where X2i denotes Xi in the group of banks with solicited ratings. A consistent estimator
of the average treatment effect on the treated is given by:
( ) + i
i
ˆWˆ ˆˆ ˆ ˆˆ ˆATT XˆW2 2 1 2 2 1 1
( )( )
( )
é ù= - - ê ú
ë ûu u
f. (16)

17
In this setup, a test for 2 2 1 1 0= =u u is a test of selection based on unobservable
rating determinants. If the test fails to reject that both parameters are jointly equal to
zero, we cannot reject the null hypothesis of no selectivity bias in the solicited and
unsolicited groups and we have no argument against using ordinary least squares. A
Chow test can also be used to test whether the s are identical in the solicited and
unsolicited groups. If they are, the treatment effect model is more efficient than the
endogenous switching regression model.
The endogenous switching regression model is estimated by maximum likelihood
using the procedure outlined in Greene (1995).
5. Results
In this section, I discuss the results of the estimation procedures described above.
5.1. Ordinary least squares
Two basic specifications of equation (1) are reported in Table 5. To avoid
multicollinearity problems, the first specification only includes five financial variables
and four nonfinancial variables in addition to a solicited individual rating dummy. These
variables cover the different areas of Fitch’s bank rating methodology: risk management
(loan loss provisions/net interest revenue), liquidity (net loans/total assets),
capitalisation (equity/total assets), earnings and performance (cost to income ratio),
market environment (consolidated statement dummy, communist country dummy),
diversification/franchise (log of total deposits), corporate governance (bank ownership
dummy – one if the bank is majorityowned by another bank and zero otherwise), and
public disclosure (disclosure index). The second specification adds two variables that
control for additional aspects of market environment (unqualified statement dummy)
and corporate governance (state ownership dummy – one if the bank is majorityowned
by the State and zero otherwise). In addition, the second specification also interacts the
solicited individual rating dummy with an other individual rating dummy, which is equal
to one if the bank had an individual rating from a competitor agency – Moody’s or
Capital Intelligence – before it obtained an individual rating from Fitch and zero
otherwise. The resulting variable captures whether there is a rating difference between
banks which request an individual rating without being rated by a competitor of Fitch
18
and banks which request an individual rating while being rated by a competitor agency.
Such a difference may exist if banks which are already rated by Moody’s or Capital
Intelligence engage in rating shopping and only request an individual rating from Fitch
when they are a confident that it will be higher than their existing individual rating.12
The two specifications are estimated by ordinary least squares (OLS) and by two
stage least squares (2SLS) to account for the potential endogeneity of equity/total assets
and the disclosure index, i.e., the two variables that are most likely to suffer from an
endogeneity bias (Bauman and Nier, 2004). The set of instruments for both variables
consists of the other exogenous explanatory variables in the regression. In addition to
these variables, I exploit the crosscountry dimension of the data set by including
country dummies which reflect the average level of the intrumented variables in each
sample country. I also carried out a DurbinWuHausman test, the null hypothesis for
which states that OLS delivers consistent estimates, i.e., that instrumental variables
techniques (2SLS) are not required. The value of the DurbinWuHausman statistic in
specifications (1) and (2) is 2.37 and 2.67, respectively, with associated probabilities of
0.31 and 0.26, meaning that one cannot reject the null hypothesis that OLS delivers
consistent estimates in both specifications. The discussion of Table 5 is therefore based
on the OLS results.
The coefficient of the solicited individual rating dummy in specifications (1) and (2)
is equal to 0.866 and 1.181, respectively, and is highly significant. This means that there
is an important premium for banks which request an individual rating once controlling
for other rating determinants. For other variables, the results appear to be standard. For
example, loan loss provisions/net interest revenue, the cost to income ratio, and the
communist country dummy negatively impact individual ratings, while higher values of
equity/total assets, the consolidated statement dummy, the bank ownership dummy, and
the disclosure index are associated with higher individual ratings. Other variables
common to both specifications as well as the variables added in the second specification
are not significant at the 95% level. In particular, the marginal effect that the other
individual rating dummy has on how individual ratings are affected by the solicited
individual rating dummy is zero. The statistics at the bottom of the table also indicate
that the two specifications have similar prediction rates and classify about onethird of
banks in the correct rating category and about onehalf in the rating category
12 Note that no bank with unsolicited ratings from Fitch is rated by Moody’s or CapitalIntelligence, which prevents analyzing whether there is a difference in the way Fitch treats banksnot soliciting a rating but having a rating from a competitor agency versus banks which have noother rating.

19
immediately above or below the actual rating. Since the variables added in specification
(2) are not or only marginally significant, I work with specification (1) from now on.13
5.2. Treatment effect model
The coefficient of the solicited individual rating dummy in Table 5 suggests that
there is an important difference in treatment between banks which ask for a rating and
those which do not. This result confirms the findings of the studies reviewed in the
introduction. However, as noted earlier, ordinary least squares may overestimate the
impact of the treatment if banks which request a rating are positively selfselected. For
this reason, I proceed to use the methods described in Section 4.2 and 4.3 to correct for
the potential sample selection bias.
Table 6 reports the results of the treatment effect model. The first two columns
report twostep estimates (Heckman, 1979) which treat equity/total assets and the
disclosure index as exogenous. The last two columns report twostep estimates obtained
by instrumenting equity/total assets and the disclosure index before applying the two
step method.14 For each method (twostep and twostep + IV), Table 6 reports the
results of the selection and of the outcome equations. The dependent variable in the
selection equation is the solicited individual rating dummy. The dependent variable in
the outcome equation is the bank individual rating.
For identification purposes, the selection equation must include at least one variable
that affects the decision to ask for a rating but not the rating itself. The variable which
enters the selection equation but not the outcome equation is a solicited longterm debt
rating dummy (one if the bank had a solicited longterm debt rating from Fitch before it
obtained an individual rating and zero otherwise).15 This variable is used as an exclusion
restriction because Fitch started to issue longterm debt ratings in the 1980s, long before
individual ratings. Therefore, banks which initially requested a longterm debt rating
from Fitch should be more likely to have subsequently asked for an individual rating. At
the same time, it is unlikely that paying for a longterm debt rating influenced the
13 I also interacted the solicited individual rating dummy with the other explanatory variables andfound that it has an intercept but no slope effect on individual ratings.14 The instruments for equity/total assets and the disclosure index are the same as in Table 5.Robust tstatistics are in parentheses for the twostep estimates and bootstrapped tstatistics arein parentheses for the twostep + IV estimates.15 For the minority of banks which obtained both types of ratings at the same time, the solicitedlongterm debt rating dummy is thus equal to zero. Setting the solicited longterm debt ratingdummy to one if the bank had a solicited longterm debt rating before or at the same time itobtained an individual rating and zero otherwise does not affect the results.
20
individual rating. Since I view the decision to request an individual rating as a sequential
process (i.e., banks’ decision to buy an individual rating was influenced by their decision
for the longterm debt rating), I treat the solicited longterm debt rating dummy as a
lagged endogenous variable which does not have to be instrumented.
The results of the twostep and twostep + IV methods are relatively similar.
Therefore, I focus on the twostep results. Looking at the selection equation, the signs of
the estimates suggest that banks which are located in a noncommunist country, which
publish a consolidated financial statement and which are already subscribing to Fitch’s
longterm rating services are more likely to request an individual rating than other
banks. Interestingly, financial variables do not seem to play a significant role in the
decision to ask for an individual rating. The statistics at the bottom of the selection
equation further indicate that the model correctly predicts the decision to request an
individual rating for slightly more than twothirds of the sample banks. Looking at the
outcome equation, the estimates and their significance are in line with those reported in
Table 6 except for equity/total assets and the solicited individual rating dummy, which
are now only marginally significant. However, the coefficient of the hazard rate does not
differ significantly from zero, implying that there is no evidence that there is a selectivity
problem in the outcome equation. Finally, the statistics at the bottom of the outcome
equation show that the classification accuracy of the treatment effect model is
comparable to that of ordinary least squares.
5.3. Endogenous switching regression model
The results so far could be due to the fact that the above models are misspecified or
too restrictive. For this reason, I consider a more general framework which allows the
parameters of the outcome equation to differ according to whether or not banks have
solicited a rating, while simultaneously controlling for sample selection.
Table 7 reports the results of the endogenous switching regression model. For clarity,
I only report the results of the outcome equations, i.e., equations (8) and (9), and the
results of the selection equation are omitted. The first two columns report maximum
likelihood estimates (Greene, 1995) which treat equity/total assets and the disclosure
index as exogenous. The last two columns report maximumlikelihood estimates obtained
by instrumenting equity/total assets and the disclosure index before performing the

21
maximumlikelihood estimation.16 The dependent variable in each outcome equation is
the bank individual rating.
Looking at Table 7, three variables are significant in the first two outcome equations
and only two in the last two outcome equations. These variables have the expected sign,
i.e., higher values of loan loss provisions/net interest revenue, the cost to income ratio,
and the communist country dummy are negatively related to Fitch’s assessment of
banks’ financial strength. The statistics at the bottom of the table indicate that the
classification accuracy of the model is slightly better in the unsolicited than in the
solicited group. For clarity, I focus on the maximumlikelihood estimates to further
discuss the results of the endogenous switching regression model (the maximum
likelihood + IV estimates offer similar results).
First, the average treatment effect and the average treatment effect on the treated,
which measure respectively the average gain from soliciting a rating for a randomly
chosen bank and the average gain from soliciting a rating for those banks which have
requested one, are obtained by estimating equations (14) and (16). The average
treatment effect (ATE) is equal to 2.177 while the average treatment effect on the
treated (ATT) is equal to 0.631. Biascorrected confidence intervals based on bootstrap
replications indicate that both effects are significantly different from zero (the confidence
intervals are [2.146; 3.281] for ATE and [0.314; 1.042] for ATT).
Second, a Chow test of the null hypothesis that the coefficients of individual rating
determinants are the same in the solicited and unsolicited groups was carried out. The
value of the test statistic is 1.52 with an associated probability of 0.14, meaning that one
cannot reject the null hypothesis that the coefficients of individual rating determinants
are identical in both groups and that the endogenous switching regression model is less
efficient than the treatment effect model. This result contrasts with Butler and Rodgers
(2003), who find that soliciting a rating induces Moody’s and S&P to place less weight
on rating determinants reflecting public information.
Third, an Ftest of the null hypothesis that the correlation coefficients between the
error term in the selection equation and the error terms in the outcome equations are
jointly insignificant was performed. The value of the test statistic is 0.60 with an
associated probability of 0.55, meaning that one cannot reject the null hypothesis that
1 2andu u are both equal to zero and that there is no selection bias in individual
16 The instruments for equity/total assets and the disclosure index are the same as in Tables 5and 6. Robust tstatistics are in parentheses for the maximumlikelihood estimates andbootstrapped tstatistics are in parentheses for the maximum likelihood + IV estimates.
22
ratings. Thus, the results in Table 7 (like the results in Table 6) do not support the self
selection hypothesis and contrast with Poon (2003a), Poon (2003b), and Poon and Firth
(2005) who find evidence of sample selection in S&P’s and Fitch’s ratings. However, as
noted earlier, these papers use Heckman’s standard model of sample selection and/or
different sample of credit ratings hence their results are not necessarily comparable with
those of this paper.
To sum up, the ordinary least squares regression, the treatment effect model, and the
endogenous switching regression model all find a positive and significant difference
between solicited and unsolicited ratings.17 However, the treatment effect model and the
endogenous switching regression model both fail to provide evidence for a sample
selection problem in individual ratings. There is thus no evidence that that these models
are more appropriate than ordinary least squares to study the determinants of bank
individual ratings. For this reason, I rely on OLS and 2SLS regressions to test the public
disclosure hypothesis, the results of which are presented in Table 8.
5.4. Test of the public disclosure hypothesis
According to the public disclosure hypothesis, banks which choose not to request a
rating and which disclose a low amount of public information receive a lower rating than
similar banks which have solicited a rating. However, banks which choose not to request
a rating and which disclose a high enough amount of public information do not receive a
lower rating than similar banks which have solicited a rating. The public disclosure
hypothesis is tested using a regression of the form:
i i i i
i i i
Rating X Unsolicited Highdisclosure
Unsolicited High disclosure1
2
( )
( (1 ))
= + ´+ ´ +
(17)
where Unsolicitedi is a dummy variable equal to one if bank i has not requested a rating
and zero otherwise, and High disclosurei is a dummy variable equal to one if bank i is a
high disclosure bank and zero otherwise (the comparison group is thus the banks with
solicited ratings). In the following, high disclosure banks are defined as those having a
disclosure index equal to or higher than the 50th percentile of the sample distribution of
disclosure indexes, but the results also hold if higher percentiles are chosen.18
17 This difference is only marginally significant in the case of the treatment effect model.18 The results also hold if High disclosure is defined using the percentiles of the world distributionof bank disclosure indexes instead of their sample distribution. The world distribution of bankdisclosure indexes was obtained by calculating the disclosure index of 10,577 banks fromBankscope.
23
Equation (17) is estimated by ordinary least squares and by twostage least squares
to account for the potential endogeneity of equity/total assets, Unsolicited interacted
with High disclosure, and Unsolicited interacted with (1 High disclosure). As in
previous regressions, the instruments consist of the exogenous variables in equation (17)
and country dummies. Since a DurbinWuHausman test rejects the null hypothesis that
OLS delivers consistent parameter estimates (the value of the test statistic is 12.6 with
an associated probability of 0.01), the discussion of Table 8 is based on the 2SLS results.
Looking at Table 8, the estimated coefficients of the first seven explanatory variables
(loan loss provisions/net interest revenue to log of total deposits) are close to those
shown in Table 5, which is not surprising given that equations (1) and (17) are relatively
similar. More interesting are the results for the coefficient of Unsolicited interacted with
High disclosure and Unsolicited interacted with (1 High disclosure). I find that the
coefficient of the former variable is insignificant while the coefficient of the latter
variable is significant and equal to 2.351. These results imply that banks which choose
not to request a rating and which disclose a high amount of public information do not
receive a lower rating than similar banks which have solicited a rating, while banks
which choose not to request a rating and which disclose a low amount of public
information receive a rating which is lower than the rating of banks which have asked to
be rated. This finding is consistent with the public disclosure hypothesis.
Even though credit rating agencies generally do not distinguish between solicited and
unsolicited ratings in developed countries, an interesting question is whether the above
results are transferable to European banks. Indeed, Fitch has recently started to develop
internal ratings for Central and Eastern European banks (Fitch, 2005b).
Interestingly, evidence from Bankscope suggests that rated EU25 banks have a level
of disclosure comparable to that of rated Asian banks (the disclosure index averages 64.3
for rated EU25 banks compared to 62.9 for rated Asian banks).19 Moreover, the
disclosure level of rated EU25 banks appears to less homogenous than that of rated
Asian banks (the standard deviation of the disclosure index is equal to 17.0 for rated
EU25 banks compared to 14.7 for rated Asian banks). Thus, there may be reason to
believe that a lack of public disclosure might also explain any potentially lower
unsolicited ratings of European banks.
19 These figures are for banks rated by Moody's, S&P, or Fitch.
24
6. Conclusion
This paper investigates whether there is a difference between Fitch’s solicited and
unsolicited bank ratings and, if so, why. Using ratings assigned to Asian banks, I find no
evidence that, in determining bank ratings, Fitch assigns different weights across
solicited and unsolicited groups to observable bank characteristics. This result gives some
credence to Fitch’s claim that the methodology for its unsolicited bank ratings is “nearly
the same” as for its solicited bank ratings (Fitch, 2001). However, I do find that
unsolicited bank ratings tend to be lower than solicited ones after controlling for
observable bank characteristics. The difference between both types of ratings is
economically significant, as it averages 0.9 notches on a 1 to 9 rating scale.
The existence of a difference between solicited and unsolicited ratings has already
been documented for other credit rating agencies. Several explanations are consistent
with such a difference, including the fact that betterquality issuers may request a rating
or that unsolicited ratings do not involve the disclosure of nonpublic information and, as
a result, may be more conservative than solicited ones. In addition, many issuers also
believe that credit rating agencies assign a lower unsolicited rating to persuade them to
pay for a solicited rating.
In contrast to previous research on the differences in solicited and unsolicited ratings,
the analysis of this paper explicitly controls for potential sample selection by using a
treatment effect model and an endogenous switching regression model to test whether
betterquality banks selfselect into the solicited group (selfselection hypothesis).
Although the analysis does find a significant difference between solicited and unsolicited
ratings, no evidence is found in favour of the sample selection hypothesis. The analysis
also tests whether the difference between solicited and unsolicited ratings disappears for
banks with unsolicited ratings but which disclose a high enough amount of information
(public disclosure hypothesis). Support is found for this hypothesis: banks with
unsolicited ratings but a high amount of disclosure receive ratings that are not
significantly different from the ratings of similar banks which have solicited a rating.
The abovementioned findings are interesting for several reasons. First, possible
measures concerning the use of unsolicited ratings are currently being discussed at the
European and U.S. levels (SEC, 2003; European Commission, 2004). Although the
results of this study find no evidence of wrongdoing by Fitch, they support additional
measures designed to clarify the differences between solicited and unsolicited ratings. For
instance, it should be required that credit rating agencies clearly label unsolicited ratings
25
as such in their publications and that they make the specific characteristics and the
limitations of this type of ratings, inclusive of the conservative bias documented in this
paper, completely transparent to the public. In this respect, Fitch’s recent decision to
give up disclosing whether a rating is solicited or not in its regular publications does not
represent a step toward more transparency in the credit rating industry. It also
contradicts the new IOSCO code of conduct for credit rating agencies, which clearly
states that “each rating not initiated at the request of issuer should be identified as
such” (IOSCO, 2004).
Second, the New Basel Accord, which is due to be implemented by G10 banks at the
beginning of 2007, aims at increasing public disclosure by banks in order to ensure that
market participants can better understand banks’ risk profiles and the adequacy of their
capital positions (Basel Committee, 2004). It is therefore necessary that financial
institution managers understand the need for more disclosure and move in this direction
on their own. This paper provides an incentive for bank managers to disclose information
as it documents the impact of public disclosure on credit ratings and on the relation
between soliciting a rating and the actual rating outcome. Public disclosure not only
appears to have a positive effect on credit ratings, but it also seems to eliminate the
downward bias of unsolicited ratings.
Third, Fitch recently announced that it was about to assign unsolicited ratings to
European and U.S. insurance companies “in order to provide more comprehensive
coverage” in the European and U.S. insurance sectors “to meet the growing demand” for
its ratings. In contrast to traditional solicited insurance ratings, these ratings would be
“generated solely using a statistical model that utilizes financial statement information”
(Fitch, 2004b; Fitch, 2005c). Fitch’s announcement triggered an immediate reaction from
the German Insurance Industry Association (GDV), which expressed its deepest concerns
and urged Fitch to refrain from publishing any unsolicited ratings unless the new rating
methodology had been “fully disclosed and widely discussed with the German insurance
industry and the general public” (GDV, 2004). Fitch replied by clarifying some points
underlying its methodology for unsolicited insurance ratings but decided to press ahead
with the publication of these ratings (Fitch, 2005d). The results of this paper, which
indicate the existence of a conservative bias in unsolicited ratings of low disclosure
banks, suggest that insurance industry associations should be more worried about the
level of public disclosure of their members than by the issuance of unsolicited ratings per
se.

26
Finally, it is worth stressing once again that the credit ratings used in this study are
assigned to banks located in Asia. To some extent, this may limit the relevance of the
results of this paper for other contexts. Although this caveat implies that the policy
recommendations should be interpreted with care, the fact that European banks exhibit
a comparable and more dispersed level of public disclosure than Asian banks suggests
that the results could well carry over.
27
References
Abrevaya, J., Hausman, J.A., 1999. Semiparametric estimation with mismeasureddependent variables: an application to duration models for unemployment spells.Annales d’Economie et de Statistique 5556, 243275.
Baek, J.S., Kang, J.K., Park, K.S., 2004. Corporate governance and firm value:evidence from the Korean financial crisis. Journal of Financial Economics 71, 265313.
Bailey, W., Li, H., Mao, C.X., Zhong, R., 2003. Regulation fair disclosure and earninginformation: market, analyst, and corporate responses. Journal of Finance 58, 24872514.
Baker, H.K., Mansi, S.A., 2002. Assessing credit rating agencies by bond issuers andinstitutional investors. Journal of Business Finance & Accounting 29, 13671398.
Basel Committee on Banking Supervision, 2000. Credit ratings and complementarysources of credit quality information. Working paper # 3, Bank for InternationalSettlements, Basel.
Basel Committee on Banking Supervision, 2001. The Dominion Bond Rating response tothe January 2001 Basel Committee on Banking Supervision draft. Bank forInternational Settlements, Basel.
Basel Committee on Banking Supervision, 2003. Standard and Poor’s comments on thethird consultation paper of the Basel Committee on Banking Supervision. Bank forInternational Settlements, Basel.
Basel Committee on Banking Supervision, 2004. International convergence of capitalmeasurement and capital standards. Bank for International Settlements, Basel.
Baumann, U., Nier, E., 2004. Disclosure, volatility, and transparency: an empiricalinvestigation into the value of bank disclosure. Economic Policy Review 10, 3145.Federal Reserve Bank of New York, New York, NY.
Berger, A.N., Davies, S.M., Flannery, M.J., Boyd, J., 2000. Comparing market andsupervisory assessments of bank performance: who knows what when? Journal ofMoney, Credit, and Banking 32, 641667.
Butler, A.W., Rodgers, K.J., 2003. Relationship rating: how do bond rating agenciesprocess information? Unpublished working paper, Pennsylvania State University.
Cantor, R., Packer, F., 1997. Differences of opinion and selection bias in the credit ratingindustry. Journal of Banking and Finance 21, 13951417.
Committee of European Securities Regulators (CESR), 2005. CESR’s technical advice tothe European Commission on possible measures concerning credit rating agencies.CESR, Paris.
Davidson, R., MacKinnon, J.G., 1993. Estimation and inference in econometrics. OxfordUniversity Press, New York, NY.
Deyoung, R., Flannery, M.J., Lang, W.W., Sorescu, S.M., 2001. The information contentof bank exam ratings and subordinated debt prices. Journal of Money, Credit, andBanking 33, 900925.
Egypt State Information Service (SIS), 1997. Information on Egypt: bank and corporatedebt market. SIS, Cairo.
28
European Commission (EC), 2004. Call to CESR for technical advice on possiblemeasures concerning credit rating agencies. EC, Internal Market DG, Brussels.
Fight, A., 2001. The ratings game, John Wiley & Sons, England.
Fitch Ratings (Fitch), 2001. Fitch introduces shadow individual ratings. Financialinstitutions special report. Fitch, London.
Fitch Ratings (Fitch), 2004a. Bank rating methodology. Criteria report. Fitch, London.
Fitch Ratings (Fitch), 2004b. Exposure draft of quantitative insurer financial strengthratings methodology: European insurers. Criteria report. Fitch, London.
Fitch Ratings (Fitch), 2005a. Rating initiation and participation disclosure. Credit policyspecial report. Fitch, London.
Fitch Ratings (Fitch), 2005b. Financial stability in emerging Europe. Unpublishedworking paper presented at the Second Annual DG ECFIN Research Conference, 6th
and 7th October, Brussels.
Fitch Ratings (Fitch), 2005c. Quantitative insurer financial strength ratingsmethodology: U.S. life insurers. Criteria report. Fitch, London.
Fitch Ratings (Fitch), 2005d. Quantitative insurer financial strength ratingsmethodology: letter from Fitch to the GDV. Fitch, London.
Flannery, M.J., Kwan, S.H., Nimalendran, M., 2004. Market evidence on the opaquenessof banking firms’ assets. Journal of Financial Economics 71, 419460.
Gan, Y., 2004. Why do firms pay for bond ratings when they can get them for free?Unpublished working paper, The Wharton School, University of Pennsylvania.
German Insurance Association (GDV), 2004. QRatings for German insurancecompanies – For immediate attention! GDV, Berlin.
Golin, J., 2001. The bank credit analysis handbook: a guide for analysts, bankers andinvestors. John Wiley & Sons (Asia) Pte Ltd.
Greene, W., 1995. Limdep user’s manual (version 7.0). Econometric Software Inc, NewYork, NY.
Heckman, J., 1979. Sample selection as a specification error. Econometrica 47, 153162.
Heflin, F., Subramanyam, K.R., Zhang, Y., 2003. Regulation FD and the financialinformation environment: early evidence. Accounting Review 78, 137.
Hill, C.A., 2004. Regulating the rating agencies. Unpublished working paper, GeorgetownUniversity Law Center.
International Organization of Securities Commissions (IOSCO), 2003. Report on theactivities of credit rating agencies. IOSCO, Madrid.
International Organization of Securities Commissions (IOSCO), 2004a. Code of conductfundamentals for credit rating agencies. IOSCO, Madrid.
International Organization of Securities Commissions (IOSCO), 2004b. Fitch’s commentson the draft code of conduct fundamentals for credit rating agencies. IOSCO,Madrid.
Jorion, P., Liu, Z., Shi, C., 2005. Informational effects of regulation FD: evidence fromrating agencies. Journal of Financial Economics 76, 309330.

29
Mitton, T., 2002. A crossfirm analysis of the impact of corporate governance on theEast Asian financial crisis. Journal of Financial Economics 64, 215241.
Moody’s Investors Service (Moody’s), 1999. Designation of unsolicited ratings in whichthe issuer has not participated. Product of the standing committee on ratingsprocess and documentation. Moody’s, New York, NY.
Morgan, D., 2002. Rating banks: risk and uncertainty in an opaque industry. AmericanEconomic Review 92, 874888.
Morgan, D., Stiroh, K.J., 2001. Market discipline of banks: the asset test. Journal ofFinancial Services Research 20, 195208.
Poon, W., 2003a. Are unsolicited credit ratings biased downward? Journal of Bankingand Finance 27, 593614.
Poon, W., 2003b. Are unsolicited bank ratings lower after controlling for financial andsovereign risk? Unpublished working paper, Lingnan University, Hong Kong.
Poon, W., Firth, M., 2005. Are unsolicited credit ratings lower? International evidencefrom bank ratings. Journal of Business Finance & Accounting 32, 17411761.
Pottier, S.W., Sommer, D.W., 1999. Propertyliability insurer financial strength ratings:differences across rating agencies. Journal of Risk and Insurance 66, 621642.
Securities and Exchange Commission (SEC), 2003. Report on the role and function ofcredit rating agencies in the operation of the securities markets. SEC, Washington,DC.
Securities and Exchange Commission (SEC), 2004. Moody’s comments on the Securitiesand Exchange Commission proposed set of rules on the registration, disclosure andreporting requirements for assetbacked securities. SEC, Washington, DC.
Securities and Exchange Commission (SEC), 2005. Regulatory issues and economicprinciples. SEC, Washington, DC.
Wall Street Journal, 2004. Credit raters’ tactics in pursuing new work frustratecompanies. November 25, 2004.
White, L.J., 2001. The credit rating industry: an industrial organization analysis.Unpublished working paper, Stern School of Business, New York University.
Wooldridge, J.M., 2002. Econometric analysis of cross section and panel data. The MITPress, Cambridge, MA.
Yu, F., 2005. Accounting transparency and the term structure of credit spreads. Journalof Financial Economics 75, 5384.

30
Table 1Distribution of sample bank individual ratings by country
Country Solicited Unsolicited Total
# % # % # %
Bangladesh 1 0.6 5 3.0 6 3.6China 1 0.6 15 8.9 16 9.5Hong Kong 8 4.7 10 5.9 18 10.7India 4 2.4 28 16.6 32 18.9Indonesia 10 5.9 2 1.2 12 7.1Macau 2 1.2 1 0.6 3 1.8Malaysia 7 4.1 4 2.4 11 6.5Philippines 11 6.5 2 1.2 13 7.7South Korea 9 5.3 3 1.8 12 7.1Taiwan 20 11.8 19 11.2 39 23.1Vietnam 1 0.6 6 3.6 7 4.1Total 74 43.8 95 56.2 169 100
The whole sample consists of 169 bank individual ratings assigned by Fitch. Ratings are as of January 31,2004, and come from Bankscope and Fitch Research. Only those countries that have both solicited andunsolicited bank individual ratings are included in the sample.
Table 2Distribution of sample bank individual ratings by rating level
Interpretation Solicited Unsolicited TotalIndividualrating
# % # % # %
A A very strong bank A / B 1 0.6 1 0.6 2 1.2 B A strong bank 2 1.2 0 0.0 2 1.2 B / C 11 6.5 3 1.8 14 8.3 C An adequate bank 17 10.1 14 8.3 31 18.3 C / D 14 8.3 11 6.5 25 14.8 D A bank with weaknesses 20 11.8 20 11.8 40 23.7 D / E 5 3.0 23 13.6 28 16.6 E A bank with serious problems 4 2.4 23 13.6 27 16.0 Total 74 43.8 95 56.2 169 100
The whole sample consists of 169 bank individual ratings assigned by Fitch. Ratings are as of January 31,2004, and come from Bankscope and Fitch Research. See Appendix A for a detailed interpretation of eachrating category.
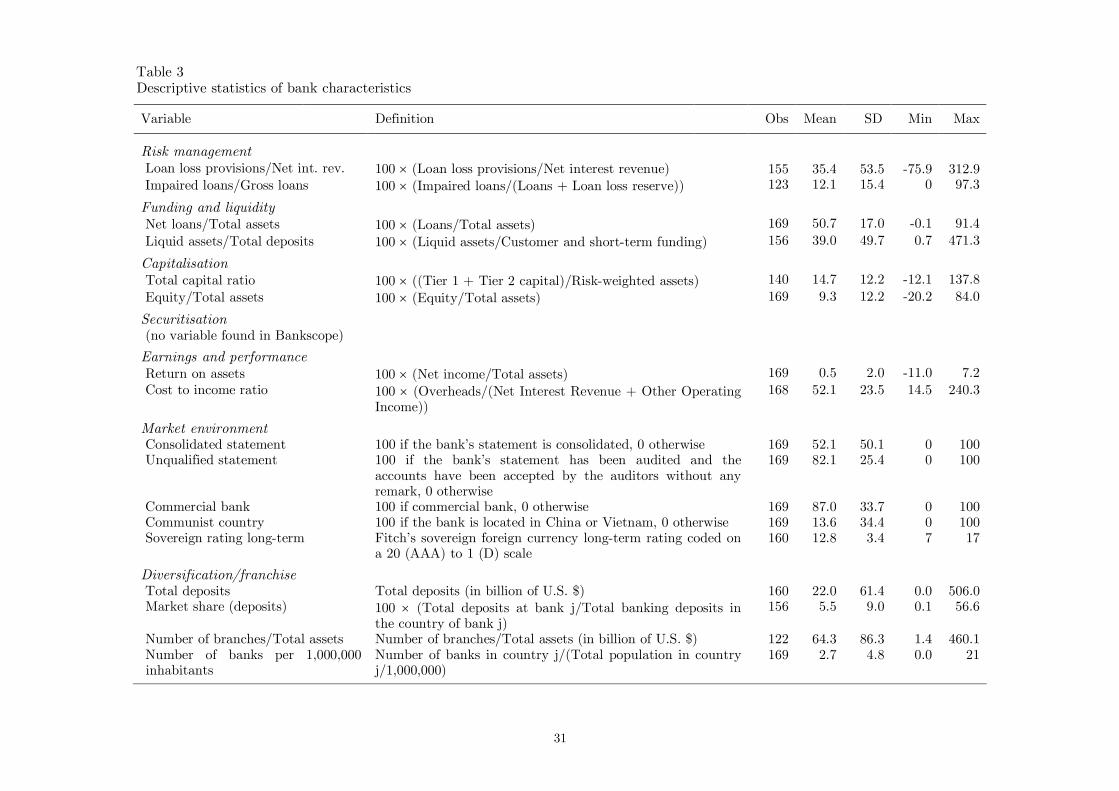
31
Table 3Descriptive statistics of bank characteristics
Variable Definition Obs Mean SD Min Max
Risk management Loan loss provisions/Net int. rev. 100 ´ (Loan loss provisions/Net interest revenue) 155 35.4 53.5 75.9 312.9 Impaired loans/Gross loans 100 ´ (Impaired loans/(Loans + Loan loss reserve)) 123 12.1 15.4 0 97.3
Funding and liquidity Net loans/Total assets 100 ´ (Loans/Total assets) 169 50.7 17.0 0.1 91.4 Liquid assets/Total deposits 100 ´ (Liquid assets/Customer and shortterm funding) 156 39.0 49.7 0.7 471.3
Capitalisation Total capital ratio 100 ´ ((Tier 1 + Tier 2 capital)/Riskweighted assets) 140 14.7 12.2 12.1 137.8 Equity/Total assets 100 ´ (Equity/Total assets) 169 9.3 12.2 20.2 84.0
Securitisation (no variable found in Bankscope)
Earnings and performance Return on assets 100 ´ (Net income/Total assets) 169 0.5 2.0 11.0 7.2 Cost to income ratio 100 ´ (Overheads/(Net Interest Revenue + Other Operating
Income))168 52.1 23.5 14.5 240.3
Market environment Consolidated statement 100 if the bank’s statement is consolidated, 0 otherwise 169 52.1 50.1 0 100 Unqualified statement 100 if the bank’s statement has been audited and the
accounts have been accepted by the auditors without anyremark, 0 otherwise
169 82.1 25.4 0 100
Commercial bank 100 if commercial bank, 0 otherwise 169 87.0 33.7 0 100 Communist country 100 if the bank is located in China or Vietnam, 0 otherwise 169 13.6 34.4 0 100 Sovereign rating longterm Fitch’s sovereign foreign currency longterm rating coded on
a 20 (AAA) to 1 (D) scale160 12.8 3.4 7 17
Diversification/franchise Total deposits Total deposits (in billion of U.S. $) 160 22.0 61.4 0.0 506.0 Market share (deposits) 100 ´ (Total deposits at bank j/Total banking deposits in
the country of bank j)156 5.5 9.0 0.1 56.6
Number of branches/Total assets Number of branches/Total assets (in billion of U.S. $) 122 64.3 86.3 1.4 460.1 Number of banks per 1,000,000inhabitants
Number of banks in country j/(Total population in countryj/1,000,000)
169 2.7 4.8 0.0 21

32
Table 3. (Continued)
Variable Definition Obs Mean SD Min Max
Management and strategy Number of directors and managers Number of directors and managers who are members of the
supervisory board, the board of managing directors, theexecutive committee, and/or the audit committee
131 20.8 12.0 1 70
Corporate governance Domestic shareholders 100 if all bank shareholders are from the bank’s country,
0 otherwise158 75.9 42.9 0 100
Percentage of shares owned by: Percentage of bank shares owned by: Banks 163 28.1 40.0 0 100 Individuals/Families 163 2.1 9.8 0 92 Industrial companies 163 10.4 22.2 0 100 State/Public authority
other banks (0 100) individuals and families (0 100) industrial companies (0 100) State and public authority (0 100) 163 19.7 35.3 0 100
Number of subsidiaries majorityowned
Number of bank and non bank subsidiaries majority ownedby the bank
137 4.8 6.1 0 42
Public disclosure Disclosure index
Disclosure index =17
1=iicategory
21
1,
where categoryi is equal to 0 if there is no entry in any of thecorresponding subcategories in Bankscope and 100 otherwise(some categories receive an extraweight see Baumann andNier, 2004).The 17 categories include asset categories (loans bymaturity, loans by type, loans by counterparty, problemloans, problem loans by type, securities by type, securitiesby holding purpose), liabilities categories (deposits bymaturity, deposits by type of customer, money marketfunding, longterm funding), memo lines categories (reserves,capital, contingent liabilities, offbalancesheet items) andincome statement categories (noninterest income, loan lossprovision).
169 64.8 12.4 23.8 93.3
The whole sample consists of 169 bank individual ratings assigned by Fitch. Ratings are as of January 31, 2004, and come from Bankscope and Fitch Research.Variables in the table were selected according to Fitch’s bank rating methodology (Fitch, 2004a). Statistics include number of observations (Obs), mean (Mean),standard deviation (SD), minimum (Min) and maximum (Max) of each variable. Following Fitch’s bank rating methodology, the 5year average of variables (1999to 2003) is used if available, the 3year average (2001 to 2003) if not.
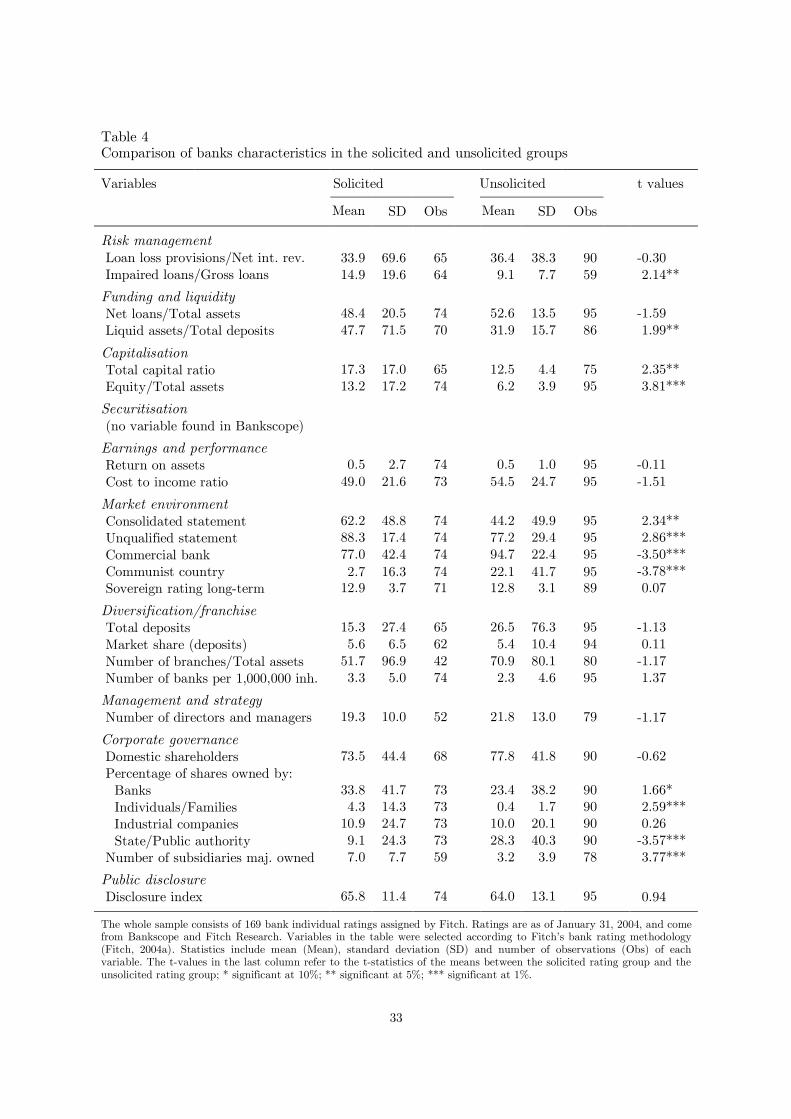
33
Table 4Comparison of banks characteristics in the solicited and unsolicited groups
Variables Solicited Unsolicited t values
Mean SD Obs Mean SD Obs
Risk management Loan loss provisions/Net int. rev. 33.9 69.6 65 36.4 38.3 90 0.30 Impaired loans/Gross loans 14.9 19.6 64 9.1 7.7 59 2.14**
Funding and liquidity Net loans/Total assets 48.4 20.5 74 52.6 13.5 95 1.59 Liquid assets/Total deposits 47.7 71.5 70 31.9 15.7 86 1.99**
Capitalisation Total capital ratio 17.3 17.0 65 12.5 4.4 75 2.35** Equity/Total assets 13.2 17.2 74 6.2 3.9 95 3.81***
Securitisation (no variable found in Bankscope)
Earnings and performance Return on assets 0.5 2.7 74 0.5 1.0 95 0.11 Cost to income ratio 49.0 21.6 73 54.5 24.7 95 1.51
Market environment Consolidated statement 62.2 48.8 74 44.2 49.9 95 2.34** Unqualified statement 88.3 17.4 74 77.2 29.4 95 2.86*** Commercial bank 77.0 42.4 74 94.7 22.4 95 3.50*** Communist country 2.7 16.3 74 22.1 41.7 95 3.78*** Sovereign rating longterm 12.9 3.7 71 12.8 3.1 89 0.07
Diversification/franchise Total deposits 15.3 27.4 65 26.5 76.3 95 1.13 Market share (deposits) 5.6 6.5 62 5.4 10.4 94 0.11 Number of branches/Total assets 51.7 96.9 42 70.9 80.1 80 1.17 Number of banks per 1,000,000 inh. 3.3 5.0 74 2.3 4.6 95 1.37
Management and strategy Number of directors and managers 19.3 10.0 52 21.8 13.0 79 1.17
Corporate governance Domestic shareholders 73.5 44.4 68 77.8 41.8 90 0.62 Percentage of shares owned by: Banks 33.8 41.7 73 23.4 38.2 90 1.66* Individuals/Families 4.3 14.3 73 0.4 1.7 90 2.59*** Industrial companies 10.9 24.7 73 10.0 20.1 90 0.26 State/Public authority 9.1 24.3 73 28.3 40.3 90 3.57*** Number of subsidiaries maj. owned 7.0 7.7 59 3.2 3.9 78 3.77***
Public disclosure Disclosure index 65.8 11.4 74 64.0 13.1 95 0.94
The whole sample consists of 169 bank individual ratings assigned by Fitch. Ratings are as of January 31, 2004, and comefrom Bankscope and Fitch Research. Variables in the table were selected according to Fitch’s bank rating methodology(Fitch, 2004a). Statistics include mean (Mean), standard deviation (SD) and number of observations (Obs) of eachvariable. The tvalues in the last column refer to the tstatistics of the means between the solicited rating group and theunsolicited rating group; * significant at 10%; ** significant at 5%; *** significant at 1%.
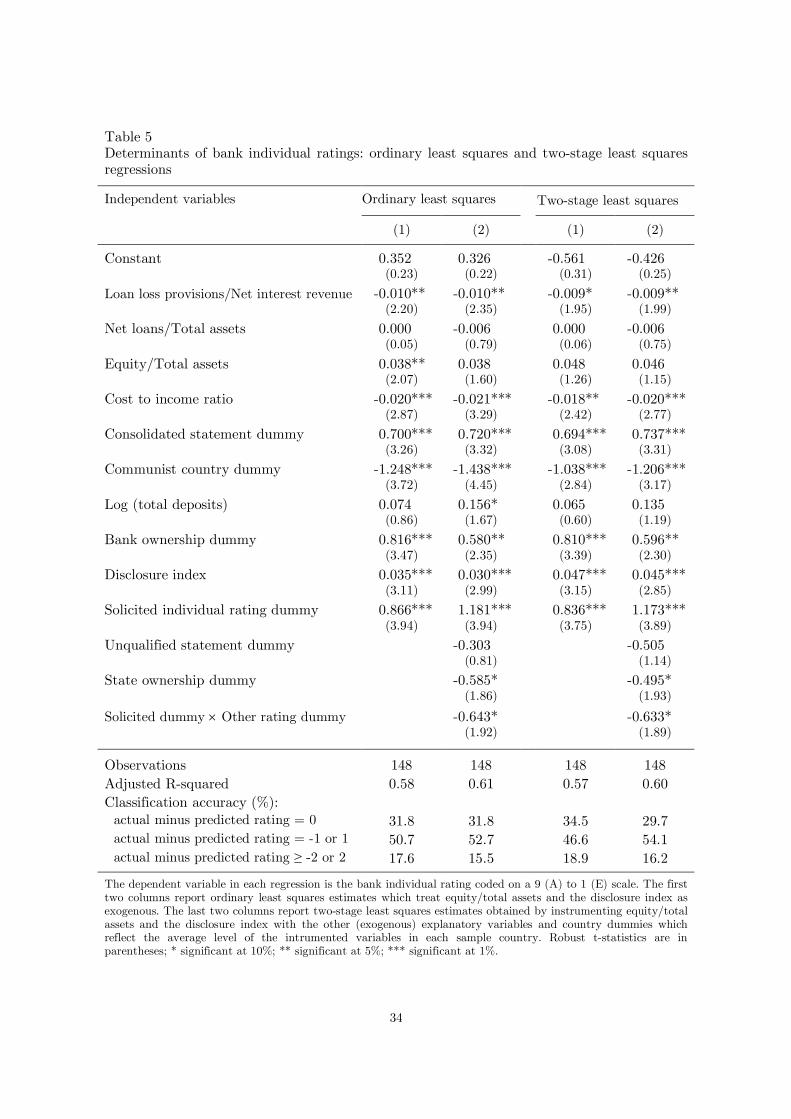
34
Table 5Determinants of bank individual ratings: ordinary least squares and twostage least squaresregressions
Independent variables Ordinary least squares Twostage least squares
(1) (2) (1) (2)
Constant 0.352 0.326 0.561 0.426(0.23) (0.22) (0.31) (0.25)
Loan loss provisions/Net interest revenue 0.010** 0.010** 0.009* 0.009**(2.20) (2.35) (1.95) (1.99)
Net loans/Total assets 0.000 0.006 0.000 0.006(0.05) (0.79) (0.06) (0.75)
Equity/Total assets 0.038** 0.038 0.048 0.046(2.07) (1.60) (1.26) (1.15)
Cost to income ratio 0.020*** 0.021*** 0.018** 0.020***(2.87) (3.29) (2.42) (2.77)
Consolidated statement dummy 0.700*** 0.720*** 0.694*** 0.737***(3.26) (3.32) (3.08) (3.31)
Communist country dummy 1.248*** 1.438*** 1.038*** 1.206***(3.72) (4.45) (2.84) (3.17)
Log (total deposits) 0.074 0.156* 0.065 0.135(0.86) (1.67) (0.60) (1.19)
Bank ownership dummy 0.816*** 0.580** 0.810*** 0.596**(3.47) (2.35) (3.39) (2.30)
Disclosure index 0.035*** 0.030*** 0.047*** 0.045***(3.11) (2.99) (3.15) (2.85)
Solicited individual rating dummy 0.866*** 1.181*** 0.836*** 1.173***(3.94) (3.94) (3.75) (3.89)
Unqualified statement dummy 0.303 0.505(0.81) (1.14)
State ownership dummy 0.585* 0.495*(1.86) (1.93)
Solicited dummy ´ Other rating dummy 0.643* 0.633*(1.92) (1.89)
Observations 148 148 148 148Adjusted Rsquared 0.58 0.61 0.57 0.60Classification accuracy (%): actual minus predicted rating = 0 31.8 31.8 34.5 29.7 actual minus predicted rating = 1 or 1 50.7 52.7 46.6 54.1 actual minus predicted rating 2 or 2 17.6 15.5 18.9 16.2
The dependent variable in each regression is the bank individual rating coded on a 9 (A) to 1 (E) scale. The firsttwo columns report ordinary least squares estimates which treat equity/total assets and the disclosure index asexogenous. The last two columns report twostage least squares estimates obtained by instrumenting equity/totalassets and the disclosure index with the other (exogenous) explanatory variables and country dummies whichreflect the average level of the intrumented variables in each sample country. Robust tstatistics are inparentheses; * significant at 10%; ** significant at 5%; *** significant at 1%.
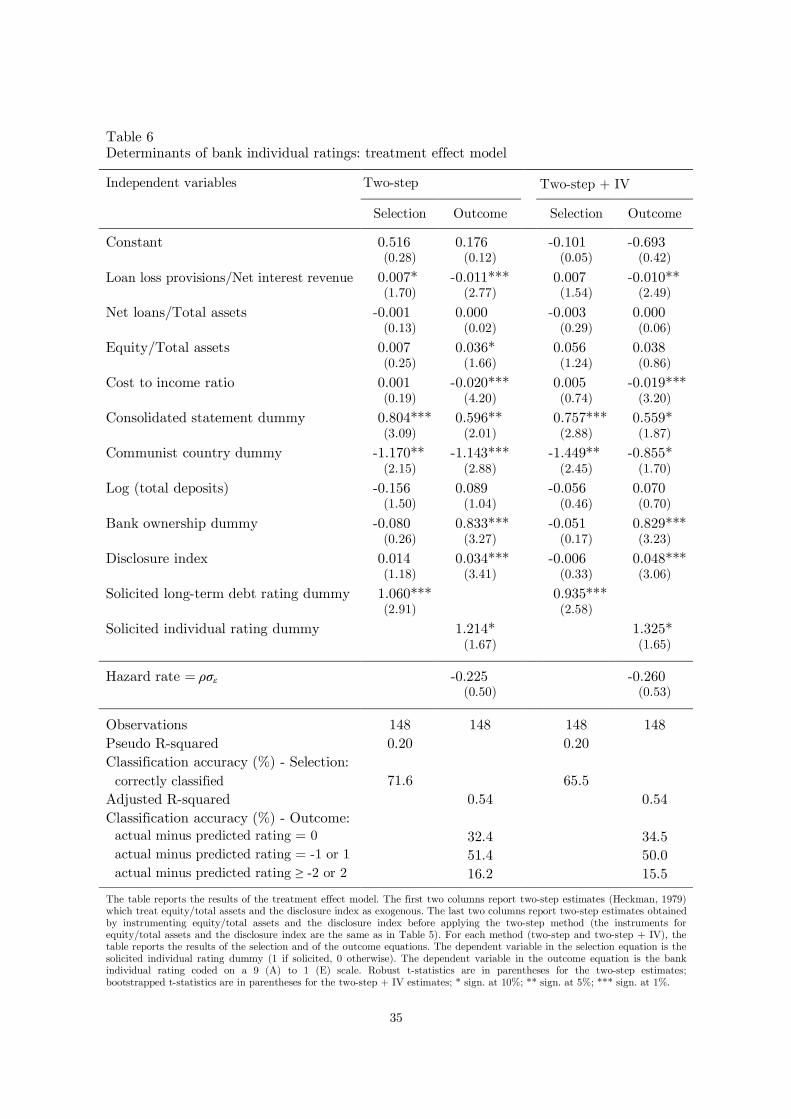
35
Table 6Determinants of bank individual ratings: treatment effect model
Independent variables Twostep Twostep + IV
Selection Outcome Selection Outcome
Constant 0.516 0.176 0.101 0.693(0.28) (0.12) (0.05) (0.42)
Loan loss provisions/Net interest revenue 0.007* 0.011*** 0.007 0.010**(1.70) (2.77) (1.54) (2.49)
Net loans/Total assets 0.001 0.000 0.003 0.000(0.13) (0.02) (0.29) (0.06)
Equity/Total assets 0.007 0.036* 0.056 0.038(0.25) (1.66) (1.24) (0.86)
Cost to income ratio 0.001 0.020*** 0.005 0.019***(0.19) (4.20) (0.74) (3.20)
Consolidated statement dummy 0.804*** 0.596** 0.757*** 0.559*(3.09) (2.01) (2.88) (1.87)
Communist country dummy 1.170** 1.143*** 1.449** 0.855*(2.15) (2.88) (2.45) (1.70)
Log (total deposits) 0.156 0.089 0.056 0.070(1.50) (1.04) (0.46) (0.70)
Bank ownership dummy 0.080 0.833*** 0.051 0.829***(0.26) (3.27) (0.17) (3.23)
Disclosure index 0.014 0.034*** 0.006 0.048***(1.18) (3.41) (0.33) (3.06)
Solicited longterm debt rating dummy 1.060*** 0.935***(2.91) (2.58)
Solicited individual rating dummy 1.214* 1.325*(1.67) (1.65)
Hazard rate = e 0.225 0.260(0.50) (0.53)
Observations 148 148 148 148Pseudo Rsquared 0.20 0.20Classification accuracy (%) Selection: correctly classified 71.6 65.5Adjusted Rsquared 0.54 0.54Classification accuracy (%) Outcome: actual minus predicted rating = 0 32.4 34.5 actual minus predicted rating = 1 or 1 51.4 50.0 actual minus predicted rating 2 or 2 16.2 15.5
The table reports the results of the treatment effect model. The first two columns report twostep estimates (Heckman, 1979)which treat equity/total assets and the disclosure index as exogenous. The last two columns report twostep estimates obtainedby instrumenting equity/total assets and the disclosure index before applying the twostep method (the instruments forequity/total assets and the disclosure index are the same as in Table 5). For each method (twostep and twostep + IV), thetable reports the results of the selection and of the outcome equations. The dependent variable in the selection equation is thesolicited individual rating dummy (1 if solicited, 0 otherwise). The dependent variable in the outcome equation is the bankindividual rating coded on a 9 (A) to 1 (E) scale. Robust tstatistics are in parentheses for the twostep estimates;bootstrapped tstatistics are in parentheses for the twostep + IV estimates; * sign. at 10%; ** sign. at 5%; *** sign. at 1%.
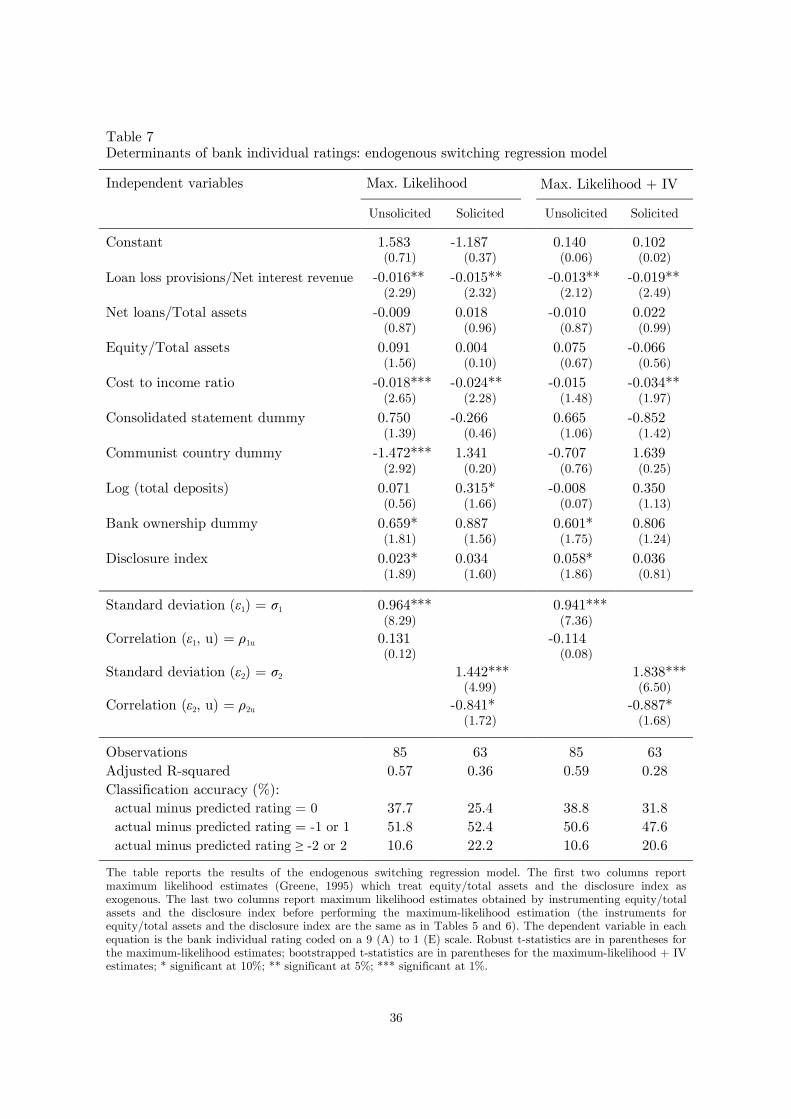
36
Table 7Determinants of bank individual ratings: endogenous switching regression model
Independent variables Max. Likelihood Max. Likelihood + IV
Unsolicited Solicited Unsolicited Solicited
Constant 1.583 1.187 0.140 0.102(0.71) (0.37) (0.06) (0.02)
Loan loss provisions/Net interest revenue 0.016** 0.015** 0.013** 0.019**(2.29) (2.32) (2.12) (2.49)
Net loans/Total assets 0.009 0.018 0.010 0.022(0.87) (0.96) (0.87) (0.99)
Equity/Total assets 0.091 0.004 0.075 0.066(1.56) (0.10) (0.67) (0.56)
Cost to income ratio 0.018*** 0.024** 0.015 0.034**(2.65) (2.28) (1.48) (1.97)
Consolidated statement dummy 0.750 0.266 0.665 0.852(1.39) (0.46) (1.06) (1.42)
Communist country dummy 1.472*** 1.341 0.707 1.639(2.92) (0.20) (0.76) (0.25)
Log (total deposits) 0.071 0.315* 0.008 0.350(0.56) (1.66) (0.07) (1.13)
Bank ownership dummy 0.659* 0.887 0.601* 0.806(1.81) (1.56) (1.75) (1.24)
Disclosure index 0.023* 0.034 0.058* 0.036(1.89) (1.60) (1.86) (0.81)
Standard deviation ( 1) = 1 0.964*** 0.941***(8.29) (7.36)
Correlation ( 1, u) = 1u 0.131 0.114(0.12) (0.08)
Standard deviation ( 2) = 2 1.442*** 1.838***(4.99) (6.50)
Correlation ( 2, u) = 2u 0.841* 0.887*(1.72) (1.68)
Observations 85 63 85 63Adjusted Rsquared 0.57 0.36 0.59 0.28Classification accuracy (%): actual minus predicted rating = 0 37.7 25.4 38.8 31.8 actual minus predicted rating = 1 or 1 51.8 52.4 50.6 47.6 actual minus predicted rating 2 or 2 10.6 22.2 10.6 20.6
The table reports the results of the endogenous switching regression model. The first two columns reportmaximum likelihood estimates (Greene, 1995) which treat equity/total assets and the disclosure index asexogenous. The last two columns report maximum likelihood estimates obtained by instrumenting equity/totalassets and the disclosure index before performing the maximumlikelihood estimation (the instruments forequity/total assets and the disclosure index are the same as in Tables 5 and 6). The dependent variable in eachequation is the bank individual rating coded on a 9 (A) to 1 (E) scale. Robust tstatistics are in parentheses forthe maximumlikelihood estimates; bootstrapped tstatistics are in parentheses for the maximumlikelihood + IVestimates; * significant at 10%; ** significant at 5%; *** significant at 1%.
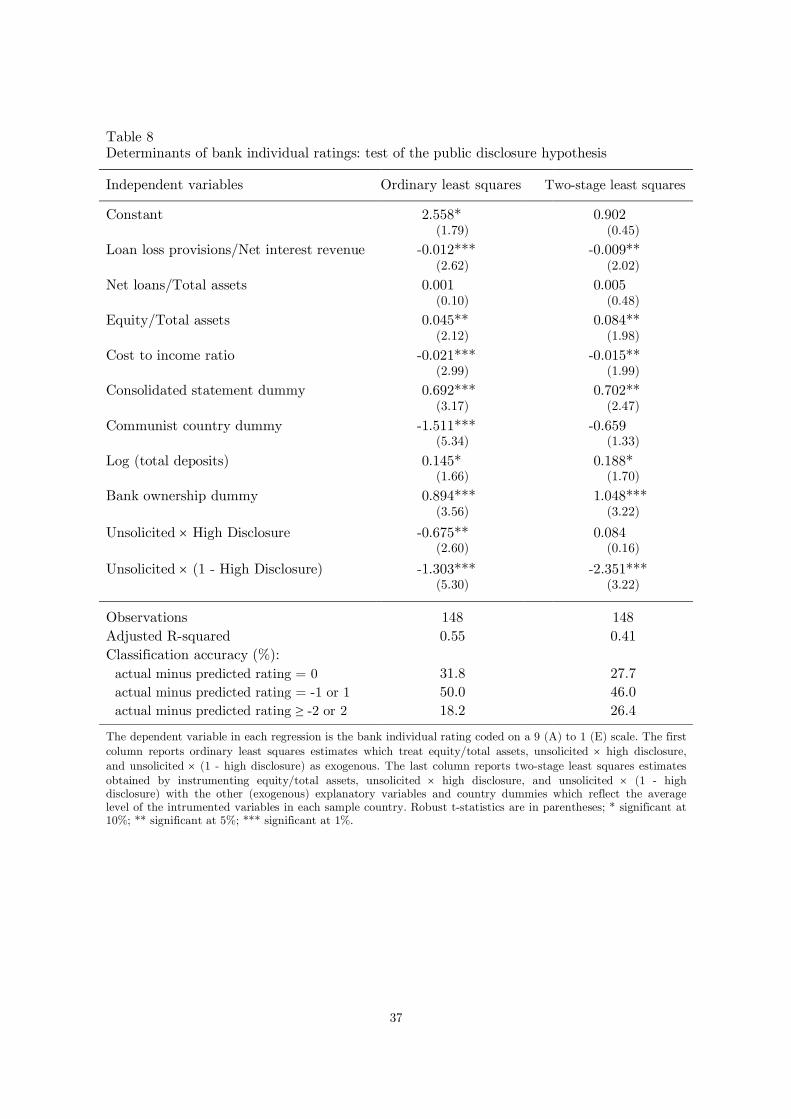
37
Table 8Determinants of bank individual ratings: test of the public disclosure hypothesis
Independent variables Ordinary least squares Twostage least squares
Constant 2.558* 0.902(1.79) (0.45)
Loan loss provisions/Net interest revenue 0.012*** 0.009**(2.62) (2.02)
Net loans/Total assets 0.001 0.005(0.10) (0.48)
Equity/Total assets 0.045** 0.084**(2.12) (1.98)
Cost to income ratio 0.021*** 0.015**(2.99) (1.99)
Consolidated statement dummy 0.692*** 0.702**(3.17) (2.47)
Communist country dummy 1.511*** 0.659(5.34) (1.33)
Log (total deposits) 0.145* 0.188*(1.66) (1.70)
Bank ownership dummy 0.894*** 1.048***(3.56) (3.22)
Unsolicited ´ High Disclosure 0.675** 0.084(2.60) (0.16)
Unsolicited ´ (1 High Disclosure) 1.303*** 2.351***(5.30) (3.22)
Observations 148 148Adjusted Rsquared 0.55 0.41Classification accuracy (%): actual minus predicted rating = 0 31.8 27.7 actual minus predicted rating = 1 or 1 50.0 46.0 actual minus predicted rating 2 or 2 18.2 26.4
The dependent variable in each regression is the bank individual rating coded on a 9 (A) to 1 (E) scale. The firstcolumn reports ordinary least squares estimates which treat equity/total assets, unsolicited ´ high disclosure,and unsolicited ´ (1 high disclosure) as exogenous. The last column reports twostage least squares estimatesobtained by instrumenting equity/total assets, unsolicited ´ high disclosure, and unsolicited ´ (1 highdisclosure) with the other (exogenous) explanatory variables and country dummies which reflect the averagelevel of the intrumented variables in each sample country. Robust tstatistics are in parentheses; * significant at10%; ** significant at 5%; *** significant at 1%.

38
Appendix A. Fitch’s individual ratings: definition and scale
Definition:
Individual Ratings are assigned only to banks. These ratings, which are internationallycomparable, attempt to assess how a bank would be viewed if it were entirely independentand could not rely on external support. These ratings are designed to assess a bank’sexposure to, appetite for, and management of risk, and thus represent our view on thelikelihood that it would run into significant difficulties such that it would require support.The principal factors we analyze to evaluate the bank and determine these ratings includeprofitability and balance sheet integrity (including capitalization), franchise, management,operating environment, and prospects. Finally, consistency is an important consideration, asis a bank’s size (in terms of equity capital) and diversification (in terms of involvement in avariety of activities in different economic and geographical sectors).
Scale:
A A very strong bank. Characteristics may include outstanding profitability and balancesheet integrity, franchise, management, operating environment or prospects.
B A strong bank. There are no major concerns regarding the bank. Characteristics mayinclude strong profitability and balance sheet integrity, franchise, management,operating environment or prospects.
C An adequate bank, which, however, possesses one or more troublesome aspects. Theremay be some concerns regarding its profitability and balance sheet integrity, franchise,management, operating environment or prospects.
D A bank, which has weaknesses of internal and/or external origin. There are concernsregarding its profitability and balance sheet integrity, franchise, management,operating environment or prospects. Banks in emerging markets are necessarily facedwith a greater number of potential deficiencies of external origin.
E A bank with very serious problems, which either requires or is likely to require externalsupport.
Intermediate categories, i.e., A/B, B/C, C/D, and D/E, are also used.
Source: http://www.fitchratings.com/
Appendix B.
Table 9 compares ordinary least squares and ordered probit estimates of equation (1).
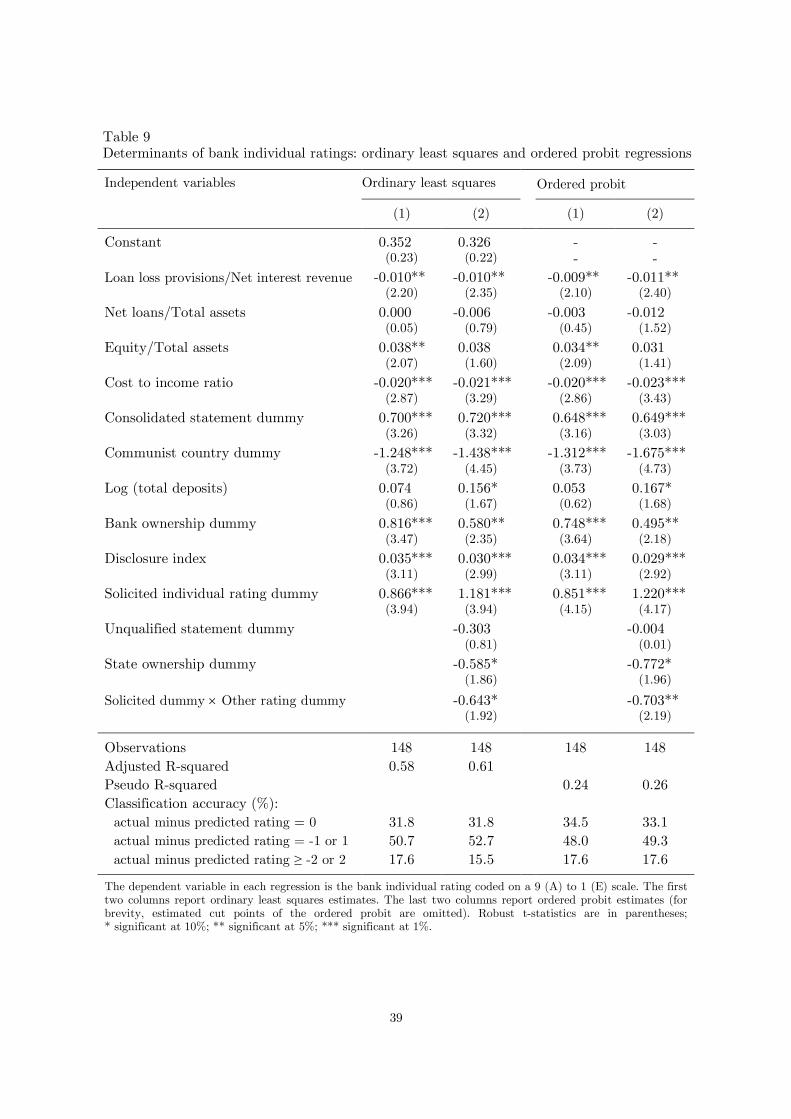
39
Table 9 Determinants of bank individual ratings: ordinary least squares and ordered probit regressions
Independent variables Ordinary least squares Ordered probit
(1) (2) (1) (2)
Constant 0.352 0.326 (0.23) (0.22)
Loan loss provisions/Net interest revenue 0.010** 0.010** 0.009** 0.011**(2.20) (2.35) (2.10) (2.40)
Net loans/Total assets 0.000 0.006 0.003 0.012(0.05) (0.79) (0.45) (1.52)
Equity/Total assets 0.038** 0.038 0.034** 0.031(2.07) (1.60) (2.09) (1.41)
Cost to income ratio 0.020*** 0.021*** 0.020*** 0.023***(2.87) (3.29) (2.86) (3.43)
Consolidated statement dummy 0.700*** 0.720*** 0.648*** 0.649***(3.26) (3.32) (3.16) (3.03)
Communist country dummy 1.248*** 1.438*** 1.312*** 1.675***(3.72) (4.45) (3.73) (4.73)
Log (total deposits) 0.074 0.156* 0.053 0.167*(0.86) (1.67) (0.62) (1.68)
Bank ownership dummy 0.816*** 0.580** 0.748*** 0.495**(3.47) (2.35) (3.64) (2.18)
Disclosure index 0.035*** 0.030*** 0.034*** 0.029***(3.11) (2.99) (3.11) (2.92)
Solicited individual rating dummy 0.866*** 1.181*** 0.851*** 1.220***(3.94) (3.94) (4.15) (4.17)
Unqualified statement dummy 0.303 0.004(0.81) (0.01)
State ownership dummy 0.585* 0.772*(1.86) (1.96)
Solicited dummy ´ Other rating dummy 0.643* 0.703**(1.92) (2.19)
Observations 148 148 148 148Adjusted Rsquared 0.58 0.61Pseudo Rsquared 0.24 0.26Classification accuracy (%): actual minus predicted rating = 0 31.8 31.8 34.5 33.1 actual minus predicted rating = 1 or 1 50.7 52.7 48.0 49.3 actual minus predicted rating 2 or 2 17.6 15.5 17.6 17.6
The dependent variable in each regression is the bank individual rating coded on a 9 (A) to 1 (E) scale. The firsttwo columns report ordinary least squares estimates. The last two columns report ordered probit estimates (forbrevity, estimated cut points of the ordered probit are omitted). Robust tstatistics are in parentheses;* significant at 10%; ** significant at 5%; *** significant at 1%.


NBB WORKING PAPER No. 79 - FEBRUARY 2006 41
NATIONAL BANK OF BELGIUM - WORKING PAPERS SERIES
1. "Model-based inflation forecasts and monetary policy rules" by M. Dombrecht and R. Wouters, Research Series, February 2000.
2. "The use of robust estimators as measures of core inflation" by L. Aucremanne, Research Series, February 2000.
3. "Performances économiques des Etats-Unis dans les années nonante" by A. Nyssens, P. Butzen, P. Bisciari, Document Series, March 2000.
4. "A model with explicit expectations for Belgium" by P. Jeanfils, Research Series, March 2000. 5. "Growth in an open economy: some recent developments" by S. Turnovsky, Research Series, May 2000. 6. "Knowledge, technology and economic growth: an OECD perspective" by I. Visco, A. Bassanini,
S. Scarpetta, Research Series, May 2000. 7. "Fiscal policy and growth in the context of European integration" by P. Masson, Research Series, May
2000. 8. "Economic growth and the labour market: Europe's challenge" by C. Wyplosz, Research Series, May
2000. 9. "The role of the exchange rate in economic growth: a euro-zone perspective" by R. MacDonald,
Research Series, May 2000. 10. "Monetary union and economic growth" by J. Vickers, Research Series, May 2000. 11. "Politique monétaire et prix des actifs: le cas des Etats-Unis" by Q. Wibaut, Document Series, August
2000. 12. "The Belgian industrial confidence indicator: leading indicator of economic activity in the euro area?" by
J.J. Vanhaelen, L. Dresse, J. De Mulder, Document Series, November 2000. 13. "Le financement des entreprises par capital-risque" by C. Rigo, Document Series, February 2001. 14. "La nouvelle économie" by P. Bisciari, Document Series, March 2001. 15. "De kostprijs van bankkredieten" by A. Bruggeman and R. Wouters, Document Series, April 2001. 16. "A guided tour of the world of rational expectations models and optimal policies" by Ph. Jeanfils,
Research Series, May 2001. 17. "Attractive Prices and Euro - Rounding effects on inflation" by L. Aucremanne and D. Cornille,
Documents Series, November 2001. 18. "The interest rate and credit channels in Belgium: an investigation with micro-level firm data" by
P. Butzen, C. Fuss and Ph. Vermeulen, Research series, December 2001. 19 "Openness, imperfect exchange rate pass-through and monetary policy" by F. Smets and R. Wouters,
Research series, March 2002. 20. "Inflation, relative prices and nominal rigidities" by L. Aucremanne, G. Brys, M. Hubert, P. J. Rousseeuw
and A. Struyf, Research series, April 2002. 21. "Lifting the burden: fundamental tax reform and economic growth" by D. Jorgenson, Research series,
May 2002. 22. "What do we know about investment under uncertainty?" by L. Trigeorgis, Research series, May 2002. 23. "Investment, uncertainty and irreversibility: evidence from Belgian accounting data" by D. Cassimon,
P.-J. Engelen, H. Meersman, M. Van Wouwe, Research series, May 2002. 24. "The impact of uncertainty on investment plans" by P. Butzen, C. Fuss, Ph. Vermeulen, Research series,
May 2002. 25. "Investment, protection, ownership, and the cost of capital" by Ch. P. Himmelberg, R. G. Hubbard,
I. Love, Research series, May 2002. 26. "Finance, uncertainty and investment: assessing the gains and losses of a generalised non-linear
structural approach using Belgian panel data", by M. Gérard, F. Verschueren, Research series, May 2002.
27. "Capital structure, firm liquidity and growth" by R. Anderson, Research series, May 2002. 28. "Structural modelling of investment and financial constraints: where do we stand?" by J.- B. Chatelain,
Research series, May 2002. 29. "Financing and investment interdependencies in unquoted Belgian companies: the role of venture
capital" by S. Manigart, K. Baeyens, I. Verschueren, Research series, May 2002. 30. "Development path and capital structure of Belgian biotechnology firms" by V. Bastin, A. Corhay,
G. Hübner, P.-A. Michel, Research series, May 2002.
42 NBB WORKING PAPER No. 79 - FEBRUARY 2006
31. "Governance as a source of managerial discipline" by J. Franks, Research series, May 2002. 32. "Financing constraints, fixed capital and R&D investment decisions of Belgian firms" by M. Cincera,
Research series, May 2002. 33. "Investment, R&D and liquidity constraints: a corporate governance approach to the Belgian evidence"
by P. Van Cayseele, Research series, May 2002. 34. "On the Origins of the Franco-German EMU Controversies" by I. Maes, Research series, July 2002. 35. "An estimated dynamic stochastic general equilibrium model of the Euro Area", by F. Smets and
R. Wouters, Research series, October 2002. 36. "The labour market and fiscal impact of labour tax reductions: The case of reduction of employers' social
security contributions under a wage norm regime with automatic price indexing of wages", by K. Burggraeve and Ph. Du Caju, Research series, March 2003.
37. "Scope of asymmetries in the Euro Area", by S. Ide and Ph. Moës, Document series, March 2003. 38. "De autonijverheid in België: Het belang van het toeleveringsnetwerk rond de assemblage van
personenauto's", by F. Coppens and G. van Gastel, Document series, June 2003. 39. "La consommation privée en Belgique", by B. Eugène, Ph. Jeanfils and B. Robert, Document series,
June 2003. 40. "The process of European monetary integration: a comparison of the Belgian and Italian approaches", by
I. Maes and L. Quaglia, Research series, August 2003. 41. "Stock market valuation in the United States", by P. Bisciari, A. Durré and A. Nyssens, Document series,
November 2003. 42. "Modeling the Term Structure of Interest Rates: Where Do We Stand?, by K. Maes, Research series,
February 2004. 43. Interbank Exposures: An Empirical Examination of System Risk in the Belgian Banking System, by
H. Degryse and G. Nguyen, Research series, March 2004. 44. "How Frequently do Prices change? Evidence Based on the Micro Data Underlying the Belgian CPI", by
L. Aucremanne and E. Dhyne, Research series, April 2004. 45. "Firms' investment decisions in response to demand and price uncertainty", by C. Fuss and
Ph. Vermeulen, Research series, April 2004. 46. "SMEs and Bank Lending Relationships: the Impact of Mergers", by H. Degryse, N. Masschelein and
J. Mitchell, Research series, May 2004. 47. "The Determinants of Pass-Through of Market Conditions to Bank Retail Interest Rates in Belgium", by
F. De Graeve, O. De Jonghe and R. Vander Vennet, Research series, May 2004. 48. "Sectoral vs. country diversification benefits and downside risk", by M. Emiris, Research series,
May 2004. 49. "How does liquidity react to stress periods in a limit order market?", by H. Beltran, A. Durré and P. Giot,
Research series, May 2004. 50. "Financial consolidation and liquidity: prudential regulation and/or competition policy?", by
P. Van Cayseele, Research series, May 2004. 51. "Basel II and Operational Risk: Implications for risk measurement and management in the financial
sector", by A. Chapelle, Y. Crama, G. Hübner and J.-P. Peters, Research series, May 2004. 52. "The Efficiency and Stability of Banks and Markets", by F. Allen, Research series, May 2004. 53. "Does Financial Liberalization Spur Growth?" by G. Bekaert, C.R. Harvey and C. Lundblad, Research
series, May 2004. 54. "Regulating Financial Conglomerates", by X. Freixas, G. Lóránth, A.D. Morrison and H.S. Shin, Research
series, May 2004. 55. "Liquidity and Financial Market Stability", by M. O'Hara, Research series, May 2004. 56. "Economisch belang van de Vlaamse zeehavens: verslag 2002", by F. Lagneaux, Document series,
June 2004. 57. "Determinants of Euro Term Structure of Credit Spreads", by A. Van Landschoot, Research series,
July 2004. 58. "Macroeconomic and Monetary Policy-Making at the European Commission, from the Rome Treaties to
the Hague Summit", by I. Maes, Research series, July 2004. 59. "Liberalisation of Network Industries: Is Electricity an Exception to the Rule?", by F. Coppens and
D. Vivet, Document series, September 2004. 60. "Forecasting with a Bayesian DSGE model: an application to the euro area", by F. Smets and
R. Wouters, Research series, September 2004.

NBB WORKING PAPER No. 79 - FEBRUARY 2006 43
61. "Comparing shocks and frictions in US and Euro Area Business Cycle: a Bayesian DSGE approach", by F. Smets and R. Wouters, Research series, October 2004.
62. "Voting on Pensions: A Survey", by G. de Walque, Research series, October 2004. 63. "Asymmetric Growth and Inflation Developments in the Acceding Countries: A New Assessment", by
S. Ide and P. Moës, Research series, October 2004. 64. "Importance économique du Port Autonome de Liège: rapport 2002", by F. Langeaux, Document series,
November 2004. 65. "Price-setting behaviour in Belgium: what can be learned from an ad hoc survey", by L. Aucremanne and
M. Druant, Research series, March 2005. 66. "Time-dependent versus State-dependent Pricing: A Panel Data Approach to the Determinants of
Belgian Consumer Price Changes", by L. Aucremanne and E. Dhyne, Research series, April 2005. 67. "Indirect effects – A formal definition and degrees of dependency as an alternative to technical
coefficients", by F. Coppens, Research series, May 2005. 68. "Noname – A new quarterly model for Belgium", by Ph. Jeanfils and K. Burggraeve, Research series,
May 2005. 69. "Economic importance of the Flemish martime ports: report 2003", F. Lagneaux, Document series, May
2005. 70. "Measuring inflation persistence: a structural time series approach", M. Dossche and G. Everaert,
Research series, June 2005. 71. "Financial intermediation theory and implications for the sources of value in structured finance markets",
J. Mitchell, Document series, July 2005. 72. "Liquidity risk in securities settlement", J. Devriese and J. Mitchell, Research series, July 2005. 73. "An international analysis of earnings, stock prices and bond yields", A. Durré and P. Giot, Research
series, September 2005. 74. "Price setting in the euro area: Some stylized facts from Individual Consumer Price Data", E. Dhyne,
L. J. Álvarez, H. Le Bihan, G. Veronese, D. Dias, J. Hoffmann, N. Jonker, P. Lünnemann, F. Rumler and J. Vilmunen, Research series, September 2005.
75. "Importance économique du Port Autonome de Liège: rapport 2003", by F. Lagneaux, Document series, October 2005.
76. "The pricing behaviour of firms in the euro area: new survey evidence, by S. Fabiani, M. Druant, I. Hernando, C. Kwapil, B. Landau, C. Loupias, F. Martins, T. Mathä, R. Sabbatini, H. Stahl and A. Stokman, Research series, November 2005.
77. "Income uncertainty and aggregate consumption, by L. Pozzi, Research series, November 2005. 78. "Crédits aux particuliers - Analyse des données de la Centrale des Crédits aux Particuliers", by
H. De Doncker, Document series, January 2006. 79. "Is there a difference between solicited and unsolicited bank ratings and, if so, why?" by P. Van Roy,
Research series, February 2006.