working paper development of a methodology for land cover
TRANSCRIPT

The project is co-funded by European Union
WORKING PAPER
Development of a Methodology for Land Cover
Classification in Dar es Salaam using SPOT
Imagery
Rome, 18 May 2012
Grant Contract Beneficiary: Sapienza University of Rome
Contact Person: Silvia Macchi
Partner in the Action: Ardhi University Dar es Salaam
Associate in the Action: Dar City Council
Project title: Adapting to Climate Change in Coastal Dar es Salaam
Project acronym: ACC Dar
Contract number: 2010/254-773
Project duration: 01/02/2011 – 31/01/2014
Author(s): Congedo, Luca (Sapienza University of Rome)
Munafò, Michele (ISPRA - Italian National Institute for Environmental Protection and Research)
How to quote: Congedo, L. and Munafò, M. (2012) Development of a Methodology for Land Cover Classification in Dar es Salaam using SPOT Imagery. [pdf] Rome: Sapienza University. Available at: <http://www.planning4adaptation.eu/>

Adapting to Climate Change in Coastal Dar es Salaam Project
Ref. EC Grant Contract No 2010/254-773
Working paper: Development of a Methodology for Land Cover Classification in Dar es Salaam using SPOT Imagery
18 May 2012
Congedo Luca, Munafò Michele Page 2
Table of contents
ACRONYMS AND ABBREVIATIONS 5
GLOSSARY 6
ACKNOWLEDGEMENTS 7
FOREWORD 7
EXECUTIVE SUMMARY 8
1. INTRODUCTION, SCOPE, AND MOTIVATION 10
1.1 Background 11
1.2 Goals and Scope 12
1.3 Motivation 12
2. APPROACH AND METHODS 12
2.1 Overall Approach 13
2.2 Data Collection and Analysis Methodology 15
3. FINDINGS 15
3.1 Image Selection 17
3.2 Preprocessing 17 3.2.1 Georeferencing Images 17 3.2.2 Cloud Cover and Clouds’ Shadow Mask 17 3.2.3 Reflectance Conversion and Atmospheric Correction 19 3.2.4 Image Mosaic 23
3.3 Processing 24 3.3.1 Classification Algorithm 24 3.3.2 Spectral Vegetation Indices 25 3.3.3 Knowledge-Base Classification 25
3.4 Results 26 3.4.1 Land Cover Classifications 26
4. CONCLUSIONS AND RECOMMENDATIONS 28
4.1 Conclusions 28
Adapting to Climate Change in Coastal Dar es Salaam Project
Ref. EC Grant Contract No 2010/254-773
Working paper: Development of a Methodology for Land Cover Classification in Dar es Salaam using SPOT Imagery
18 May 2012
Congedo Luca, Munafò Michele Page 3
4.2 Recommendations 30
REFERENCES 31
APPENDIX 1 – SPOT SATELLITES 33
SPOT 4 Sensor 33
SPOT 5 Sensor 34
Spectral Bands in SPOT Products 34
SPOT Colour Composites 35
ESA SPOT Catalogue 35
SPOT Preprocessing Levels 38
APPENDIX 2 – LAND COVER CLASSIFICATION 39
APPENDIX 3 – LANDSAT SATELLITE CHARACTERISTICS 41
Adapting to Climate Change in Coastal Dar es Salaam Project
Ref. EC Grant Contract No 2010/254-773
Working paper: Development of a Methodology for Land Cover Classification in Dar es Salaam using SPOT Imagery
18 May 2012
Congedo Luca, Munafò Michele Page 4
Figures
Figure 1: Dar es Salaam’s Districts 11 Figure 2: Developed methodologies of Activity 2.1; LC classification using SPOT imagery 13 Figure 3: Vulnerability to CC and LCC relation framework 14 Figure 4: Methodology workflow 16 Figure 5: Graph of Urban and Cloud spectral profiles, in a SPOT image 18 Figure 6: Example of clouds and clouds’ shadows masking process: (left) original SPOT image,
(centre) clouds and shadows mask; (right) masked image. 19 Figure 7: LC classification of SPOT mosaic, referred to 2011 26 Figure 8: Chart of the LC classification of 2011 27 Figure 9: Schematic of the HRVIR oblique viewing capability 33 Figure 10: LC classification of SPOT mosaic referred to 2011 40
Tables
Table 1: SPOT Solar Spectral Irradiance (from Soudani et al., 2006) 20 Table 2: Earth-Sun distance (d) in astronomical units for Day of the Year (DOY) 21 Table 3: Statistics of LC classification of 2011 27 Table 4: Comparison of the SPOT and Landsat characteristics of images acquired over Dar 29 Table 5: HRVIR sensor spectral bands and resolutions 33 Table 6: HRG sensor spectral bands and resolutions 34 Table 7: SPOT spectral bands order in the .TIF file 34 Table 8: SPOT images of Dar, available in ESA catalogue 35 Table 9: Landsat 4-5 Thematic Mapper (TM) sensor (NASA, 2011) 41 Table 10: Landsat 7 ETM+ sensor (NASA, 2011) 41

Adapting to Climate Change in Coastal Dar es Salaam Project
Ref. EC Grant Contract No 2010/254-773
Working paper: Development of a Methodology for Land Cover Classification in Dar es Salaam using SPOT Imagery
18 May 2012
Congedo Luca, Munafò Michele Page 5
Acronyms and Abbreviations
ACC Dar – Adapting to Climate Change in Coastal Dar es Salaam
CC – Climate Change
CNES – Centre National d'Études Spatiales
DN – Digital Number
DOS – Dark Object Subtraction
ESA – European Space Agency
ETM+ – Enhanced Thematic Mapper Plus
FTP – File Transfer Protocol
GCP – Ground Control Points
GIS – Geographic Information System
GPS – Global Positioning System
HRG – High Resolution Geometric
HRVIR – High-Resolution Visible and Infrared
LC – Land Cover
LCC – Land Cover Change
LMI – Landscape Metrics Indices
LU – Land Use
ML – Maximum Likelihood
NDVI – Normalized Difference Vegetation Index
NASA – National Aeronautics and Space Administration
NIR – Near Infrared
SPOT – Satellite Pour l’Observation de la Terre
TM – Thematic Mapper
UDEM – Urban Development and Environment Management
USGS – United States Geological Survey

Adapting to Climate Change in Coastal Dar es Salaam Project
Ref. EC Grant Contract No 2010/254-773
Working paper: Development of a Methodology for Land Cover Classification in Dar es Salaam using SPOT Imagery
18 May 2012
Congedo Luca, Munafò Michele Page 6
Glossary
Georeferencing – The process of image registration to a map coordinate system, in order to have every pixel addressable in terms of east and north, or latitude and longitude (Richards & Jia, 2006).
Land Cover – The “physical material at the surface of the earth. It is the material that we see and which directly interacts with electromagnetic radiation and causes the level of reflected energy that we observe as the tone or the digital number at a location in an aerial photograph or satellite image. Land covers include grass, asphalt, trees, bare ground, water, etc.” (Fisher, et al., 2005, p. 89).
Land Cover Change – The detection of changes in Land Cover, usually analysing multitemporal data; in remote sensing, Land Cover Change will result in changes in reflectance values (Lu, et al., 2011).
Land Use – The “description of how people use the land. Urban and agricultural land uses are two of the most commonly recognised high-level classes of use. Institutional land, sports grounds, residential land, etc. are also all land uses” (Fisher, et al., 2005, p. 89).
Radiance – The “flux of energy (primarily irradiant or incident energy) per solid angle leaving a unit surface area in a given direction”, “Radiance is what is measured at the sensor and is somewhat dependent on reflectance” (NASA, 2011, p. 47).
Reflectance – The “ratio of reflected versus total power energy” (NASA, 2011, p. 47).
Remote Sensing – The measurement of the energy emanating from the earth’s surface, using a sensor mounted on an aircraft or spacecraft platform, in order to obtain an image of the landscape beneath the platform (Richards & Jia, 2006).
Urban Sprawl – The unplanned, low-density urban expansion, characterized by a mix of land uses on the urban fringe (EEA, 2006).
Vulnerability – The “degree to which a system is susceptible to, or unable to cope with, adverse effects of climate change, including climate variability and extremes” (IPCC, 2001, p. 21).

Adapting to Climate Change in Coastal Dar es Salaam Project
Ref. EC Grant Contract No 2010/254-773
Working paper: Development of a Methodology for Land Cover Classification in Dar es Salaam using SPOT Imagery
18 May 2012
Congedo Luca, Munafò Michele Page 7
Acknowledgements
Eng. Luca Congedo and Eng. Michele Munafò were the main authors of this study.
SPOT imagery was provided by the European Space Agency.
Thanks go to the DCC for providing the set of GIS data and remote sensing imagery related to Dar Municipality, and thanks go to Eng. Liana Ricci who collected that data.
Thanks go to Eng. Dionis Rugai for his collaboration and photointerpretation of images of Dar.
Foreword
This working paper presents a Land Cover (LC) classification methodology developed for assessing Land Cover Changes (LCC) contribution to urban vulnerability to Climate Change (CC), in coastal Dar es Salaam (Tanzania).
The built-up area of Dar es Salaam rapidly grew over the last decades, as consequence of its population growth. Informal peri-urban settlements are continuously growing especially at the fringe. That urban development causes several impacts on the environment, and consequently affects people vulnerability.
This study is part of the “Adapting to Climate Change in Coastal Dar es Salaam” (ACC Dar) project. The study consist of the development of methodologies for monitoring spatial changes through Remote sensing and Geographic Information System (GIS) techniques, which should be tailored to the needs and resources of Dar City Council’s planning services.
The main objective of the developed methodology is to monitor LCC in Dar’s peri-urban interface, in order to increase the knowledge about peri-urban dynamics. The very fast LCC are related to CC effects, in terms of sensitivity and exposure of people living in Dar, whose livelihood relies on natural resources.
The developed methodology aims to increase adaptive capacity, in particular of Dar’s municipalities, and therefore to reduce vulnerability to CC. LCC monitoring methodology has to be very affordable and easily updatable by municipalities. Dar’s municipalities, using this methodology, could adjust their plans according to the changes of LC. Particularly, implementing the methodology in a flexible planning framework could make spatial planning more effective in reducing vulnerability, and facilitating autonomous adaptation of people.
LCC monitoring can be performed through several techniques. In this study, remote sensing is used because it allows for mapping and assessing LCC, in a very rapid way. Particularly, SPOT imagery was used, because of the spatial resolution and the cost effectiveness. In fact SPOT imagery is provided for free by the European Space Agency (ESA).
This study provides a methodology of semi-automatic supervised classification for the production of LC maps of Dar es Salaam. A workflow was developed for the preprocessing and processing of SPOT images. Moreover, this ACC Dar Activity developed a methodology for LC mapping through Landsat images (provided for free by the United States Geological Survey), which is described in another working paper.
The workflows of the two developed methodology are very similar, in order to provide flexible tools for LC classifications, and not to rely on individual satellite imagery, which is useful considering the advent of new satellites in the near future.
In particular, the workflow steps comprise the preprocessing of SPOT images (atmospheric effects correction, cloud cover removal, and image mosaic), and the processing of mosaics (vegetation index calculation, supervised classification, and Knowledge-Base classification).
This ACC Dar Activity also developed a methodology for the analysis of spatial patterns, through the use of Landscape Metrics Indices, which is described in another working paper.

Adapting to Climate Change in Coastal Dar es Salaam Project
Ref. EC Grant Contract No 2010/254-773
Working paper: Development of a Methodology for Land Cover Classification in Dar es Salaam using SPOT Imagery
18 May 2012
Congedo Luca, Munafò Michele Page 8
Executive Summary
This study is part of 2.1 activity of the “Adapting to Climate Change in Coastal Dar es Salaam” (ACC Dar) project. This study aims to develop a LC classification methodology, using remote sensing imagery and GIS techniques, for monitoring urban sprawl and LCC of Dar es Salaam over the years.
The Municipality of Dar es Salaam, is located in the east of Tanzania, covering an area of 1 800km2
on the coast of the Indian Ocean.
Dar’s population is rapidly growing since the 1980’s, and consequently also the built-up area of the city is expanding. Particularly, informal peri-urban settlements growing at the fringe cause the sprawl phenomenon. Urban sprawl is defined as the unplanned, low-density expansion characterized by a mix of land uses (EEA, 2006).
That informal urbanization is partially caused by the type of regulatory framework, whose administrative procedures lengthen the time to make land available to people (Kironde, 2006).
LCC is caused by the interactions of many drivers. Particularly, in East Africa there are several driving forces related to LCC, which can be demographic (e.g. birth rate, migration, etc.); social (e.g. cooperation); cultural (e.g. land tenure system); economic (e.g. agricultural costs); and environmental (climate, rainfall variability, soil and groundwater degradation, etc.) (Olson, et al., 2004).
The relationship between CC and local LCC thereof is very complex and uncertain (e.g. sequestration of carbon in vegetation and soil) (Lioubimtseva, et al., 2005), especially considering that CC is affected by many variables related to environmental resources and socio-political situation which can increase people vulnerability (Lioubimtseva & Henebry, 2009).
Vulnerability to CC is a function of the sensitivity, the exposure to climatic hazards and the adaptive capacity (IPCC, 2001).
Unplanned settlements and the LCC thereof, have environmental consequences that can increase vulnerability to CC effects, especially for people who rely on natural resources for their livelihood (Paavola, 2008). People tend to autonomously adapt to environmental changes for example with social organization in local informal institutions (Rodima-Taylor, 2012), migrating, or changing their livelihood determining the patterns and dynamics of LC (Olson, et al., 2008), but that autonomous adaptation can in turn have severe consequences on the ecosystem (Metzger, et al., 2006).
Therefore, LC monitoring is a fundamental source of information for improving knowledge of various drivers related to people vulnerability. Particularly, LC monitoring can provide effective tools to Dar’s administrations, for flexible and participatory planning processes (Halla, 2005; Sales Jr., 2009).
LC monitoring could improve spatial planning in adopting short-term decisions for reducing vulnerability, especially if the planning framework is adequately flexible and consider uncertainty in long-term decisions (Hallegatte, 2009). Therefore, it could be possible to coordinate all levels of institutions, especially for coastal areas, and create policies of adaptation to CC, which could be structural (e.g. seawalls, levees), and non-structural (e.g. land use planning, insurance) (Levina, et al., 2007).
This study aims to reduce people vulnerability to CC, by developing a LC monitoring methodology, which should increase adaptive capacity of Dar’s administrations. This methodology should facilitate the integration of adaptation activities into strategies and plans for Urban Development and Environment Management (UDEM), in coastal unplanned and underserviced settlements.
The developed methodology must be suitable to needs and resources of Dar’s municipalities, and consequently must be very affordable. It must be easy and quick to update, according to the pace of growth of the city.
LCC can be monitored in several fashions, using ground measurements (e.g. field surveys using GPS) or remote sensing data (Weng, 2012).
Remote sensing and Geographic Information System (GIS) are useful tools for understanding and monitoring spatial changes (Campagna, 2006; Chen, 2008). Particularly, considering the methodology requirements, LCC mapping can be performed through semi-automatic classification of multispectral satellite images (Fan, et al., 2007).
Semi-automatic classification of remote sensing images is a method of features identification, through the ability of categorizing pixels, based upon their numerical properties (spectral characteristics) (Richards & Jia, 2006). That classification technique has lower effort than photo-interpretation, and can be applied to large areas, like the Dar Region.
Adapting to Climate Change in Coastal Dar es Salaam Project
Ref. EC Grant Contract No 2010/254-773
Working paper: Development of a Methodology for Land Cover Classification in Dar es Salaam using SPOT Imagery
18 May 2012
Congedo Luca, Munafò Michele Page 9
This Activity developed two similar methodologies for semi-automatic LC classification, using two different satellite sources (Landsat and SPOT), with different resolutions. Moreover, another methodology was developed in order to assess LC classification accuracy. Another methodology was developed for assessing LC fragmentation and measure landscape patterns. Those methodologies are described in as many working papers.
This paper presents a methodology for semi-automatic classification performed using SPOT images, provided for free by the European Space Agency (ESA). The main advantage of SPOT images is spatial resolution (i.e. 10m), which allows for the identification of finer LC patterns than Landsat images.
A workflow has been designed, in order to perform LC classification, which includes the following steps:
Image selection;
Preprocessing;
Processing.
This workflow is analogue to the one developed for LC classification using Landsat imagery, in order to provide quite similar tools to Dar’s administration, which could easily interchange between the two LC classification methodologies.
The first phase of the workflow is image selection, for creating a set of images that can be used for LC classification, excluding images that have high cloud cover.
The preprocessing phase prepares selected images to the classification process, through the georeferencing process and the conversion of pixels from Digital Number (DN) to reflectance.
Atmospheric correction is required for reducing atmospheric disturbance affecting the images. The atmospheric effects correction is performed with a Dark Object Subtraction (DOS) model; therefore, no in situ measurements are needed. At that phase several images are mosaicked in order to cover the whole extent of Dar es Salaam.
Although images with high cloud cover are excluded from classification process, the particular climatic condition of Dar cause the presence of clouds almost in every image. Clouds affect LC classification results; therefore, a step for masking clouds and their shadows is included in the preprocessing phase. The developed methodology includes a semi-automatic and GIS based approach for clouds masking, which relies on semi-automatic image classification and buffer distance from clouds’ shadows.
The processing phase produces LC classification maps. Particularly, classification is performed through a semi-automatic algorithm (Maximum Likelihood) and a Knowledge-Base classification. Semi-automatic LC classification has the main advantages to reduce time and cost of LC maps production.
The Maximum Likelihood (ML) algorithm allows for the identification of LC classes through the collection of training areas, which define spectral characteristics of classes (class signatures) (Richards & Jia, 2006). ML is based upon the Gaussian threshold stored in each class signature, and therefore assigns a class to every pixels of the image, according to its statistics (Huang, et al., 2009).
A Knowledge-Base classification is included in the processing phase, for the purpose of improving classification results, especially for vegetation, including the layers of: ML classification; NDVI; and Dar boundary shapefile. The end of the processing phase is the creation of a thematic LC map.
The aim of this study is to increase adaptive capacity of Dar es Salaam’s municipalities, by improving their knowledge about LCC. LC maps, produced using the developed methodology, could be integrated in GIS of Dar’s municipalities.
A city with rapid urbanization, like is Dar es Salaam, needs LC monitoring to be affordable, rapid, and easy to update. Moreover, updated information about LC could help the regulatory framework to consider environmental issues, in order to make land available to seekers, and avoiding particularly vulnerable areas.
Remote sensing techniques are very useful for assessing landscape patterns, without in situ measurements. This study developed a methodology for LC classification, based on SPOT images. The higher spatial resolution of SPOT, compared to Landsat, implies a higher amount of pixels to be classified for the same area, increasing processing time. Higher spatial resolution allows for finer LC classification that, considering the limited image availability, is convenient for local studies.

Adapting to Climate Change in Coastal Dar es Salaam Project
Ref. EC Grant Contract No 2010/254-773
Working paper: Development of a Methodology for Land Cover Classification in Dar es Salaam using SPOT Imagery
18 May 2012
Congedo Luca, Munafò Michele Page 10
The major problem of the methodology is spectral similarity between white soil and white impervious surfaces, which often can lead to misclassification errors. The spectral resolution of SPOT (4 bands) is very effective for photointerpretation, but is limited for semi-automatic classifications, because it is complicated to distinguish spectrally similar features.
SPOT images, as Landsat ones, are heavily affected by cloud presence, because of meteorological condition of Dar es Salaam. That is probably the main constraint of remote sensing applications in the Dar Region; therefore, future development of this methodology should improve the automatic process for masking clouds, and mosaic several images.
In order to improve affordability of LC classification, this Activity considered only images provided for free (like Landsat and SPOT). Therefore, the only cost of the methodology, excluding the operator work, is the purchase of software for image processing.
Future methodology development could replace the use of commercial software with free open-source alternatives, further reducing map production cost.
The methodology could be adapted, in the near future, to use images of new satellites, which are about to be launched by the ESA and the NASA.
This Activity also developed a methodology for the assessment of Landscape patterns and urban fragmentation (described in another working paper), which should enhance the knowledge of local administrations about environmental issues related to soil sealing and urban sprawl.
The integration of these methodologies could provide effective tools to planning processes for the purpose of timely adapting to environmental changes, thus reducing people vulnerability to CC.
1. Introduction, Scope, and Motivation
The study area is the Municipality of Dar es Salaam, which covers an area of 1 800 km2. Dar is
located in the east of Tanzania (Figure 1), on the coast of the Indian Ocean, between longitudes 39°0’ - 33°33’ East and latitudes 6°36’ - 7°0’ South.
The city was established in 1862 as a port and trading centre, and it was the national capital from 1891 to the 1970s. Dar achieved municipal status in 1949, city status in 1961, and is still the centre for the permanent central government bureaucracy of Tanzania (UN-HABITAT, 2009).
Dar has three Districts: Ilala, Temeke and Kinondoni; those Districts, at lower administrative levels, are divided into Divisions and in turn Divisions are divided into Wards (United_Republic_of_Tanzania, 2004).

Adapting to Climate Change in Coastal Dar es Salaam Project
Ref. EC Grant Contract No 2010/254-773
Working paper: Development of a Methodology for Land Cover Classification in Dar es Salaam using SPOT Imagery
18 May 2012
Congedo Luca, Munafò Michele Page 11
Figure 1: Dar es Salaam’s Districts
1.1 Background
During the last 20 years, Dar es Salaam’s population has grown rapidly, as well as the built-up area of the city. Informal peri-urban settlements are continuously growing, especially at the fringe. That unplanned low-density expansion, characterized by a mix of land uses, is defined as urban sprawl (EEA, 2006).
Since 1967, and particularly during the 1980s, Dar experienced a great development and expansion along arterial roads, because of people’s need to reduce travel time to the city centre (Briggs & Mwamfupe, 2000).
During the 1990s, improvements in public and private transportation caused an irregular city expansion, also far from the arterial roads. From 1986 to 2002, Dar’s population increased from 1.36 million to 2.5 million (Kironde, 2006).
That population growth is partially due to migration from upcountry. People are attracted by job opportunities in Dar, and therefore they acquire land and build houses in poverty, bypassing formal urban land management. Intra-urban and rural-urban migration is facilitated by the creation of informal social networks, supported by cultural norms (Kombe, 2005). The land regulatory framework is often bypassed, because administrative procedures take too long to seekers (Kironde, 2006).
Those poor settlements lack of services like: electricity; transportation networks (Olvera, et al., 2003); potable water (Kyessi, 2005). Moreover unplanned urbanization causes public health threats, and environmental issues, like soil sealing (impermeabilization of soil surface), which can increase flooding risk (Swan, 2010). Particularly, unplanned LCC and the environmental consequences thereof can increase vulnerability to CC effects, especially for those inhabitants who depend on natural resources for their livelihood (Paavola, 2008).

Adapting to Climate Change in Coastal Dar es Salaam Project
Ref. EC Grant Contract No 2010/254-773
Working paper: Development of a Methodology for Land Cover Classification in Dar es Salaam using SPOT Imagery
18 May 2012
Congedo Luca, Munafò Michele Page 12
1.2 Goals and Scope
The overall objective of this study is within the ACC Dar project, to enhance the capacity of Dar's municipalities in understanding CC issues specific to coastal areas, and in assessing their impacts on the livelihood of those urban dwellers partially or totally depending on natural resources.
This study aims to improve the knowledge about LC patterns, for the City Council’s planning services, through the development of methodologies for monitoring changes in peri-urban settlements. Those methodologies should facilitate the integration of adaptation activities into strategies and plans for Urban Development and Environment Management (UDEM), in coastal unplanned and underserviced settlements.
The main goal of this study is to develop a methodology for monitoring LC, based on remote sensing and GIS techniques, which must be quick and easy to update, according to the pace of growth of the city. The developed methodology must be suitable to needs and resources of Dar’s municipalities, and consequently must be very affordable.
1.3 Motivation
LCC is the result of several driving forces that, especially in East Africa, are: demographic (e.g. birth rate, migration, etc.); social (e.g. cooperation); cultural (e.g. land tenure system); economic (e.g. agricultural costs); and environmental (climate, rainfall variability, soil and groundwater degradation, etc.) (Olson, et al., 2004).
LCC monitoring is a fundamental activity for urban planners and decision-makers, but it is often affected by lack of financial (Kironde, 2006).
Dar’s inhabitants living in unplanned areas (without services), and whose livelihood relies mainly on natural resources, are the most affected by CC impacts. People tend to autonomously adapt to environmental changes for example with social organization in local informal institutions (Rodima-Taylor, 2012), migrating, or changing their livelihood; therefore, they determine the patterns and dynamics of LC (Olson, et al., 2008), but that autonomous adaptation can in turn have severe consequences on the ecosystem (Metzger, et al., 2006).
The main motivation of this study is to improve the capacity building of Dar’s municipalities, providing an affordable methodology for LCC monitoring, which should be tailored to the equipment already available among municipalities, or in any case should require very little effort to upgrade the equipment.
The developed methodology should increase the knowledge about LC, providing effective tools for flexible and participatory planning processes (Halla, 2005; Sales Jr., 2009). Dar’s municipalities could adjust their plans according to observed LCC, therefore increasing their adaptive capacity.
Final beneficiaries of the applied methodology will be Dar’s inhabitants, especially who live in unplanned areas, reducing their vulnerability to CC. For example, CC related issue of flooding is aggravated by pit-latrines in peri-urban settlements, which can pollute groundwater when flooding occurs, causing epidemics (Paavola, 2003). Monitoring peri-urban settlements provides effective spatial information to planning processes, which consequently can increase adaptive capacity of people to CC.
2. Approach and Methods
LCC can be monitored in several ways, using ground measurements (e.g. field surveys using GPS) or remote sensing data (Weng, 2012).
This study aims to develop a methodology for semi-automatic LC classification, using remote sensing imagery. The methodology allows for the monitoring of LCC over the years, providing useful

Adapting to Climate Change in Coastal Dar es Salaam Project
Ref. EC Grant Contract No 2010/254-773
Working paper: Development of a Methodology for Land Cover Classification in Dar es Salaam using SPOT Imagery
18 May 2012
Congedo Luca, Munafò Michele Page 13
information for assessing urban sprawl.
This study is part of the Activity 2.1 of the ACC Dar project. This Activity developed two similar methodologies for semi-automatic LC classification, using two different satellite sources (Landsat and SPOT), with different resolutions. Moreover, another methodology was developed in order to assess LC classification accuracy. Another methodology was developed for assessing LC fragmentation and measure landscape patterns. Those methodologies are described in as many working papers.
This paper presents a methodology for semi-automatic LC classification, which is performed using SPOT images (Figure 2).
Figure 2: Developed methodologies of Activity 2.1; LC classification using SPOT imagery
2.1 Overall Approach
LCC can alter the properties of ecosystems and particularly their vulnerability to CC (IPCC, 2001); as stated by IPCC (2001), Vulnerability is defined as a function of:
the sensitivity, namely “the degree to which a system will respond to a given change in climate, including beneficial and harmful effects”;
the exposure to climatic hazards;
the adaptive capacity, namely “the degree to which adjustments in practices, processes, or structures can moderate or offset the potential for damage or take advantage of opportunities created by a given change in climate”.
Relations between vulnerability to CC and LCC are shown in Figure 3.

Adapting to Climate Change in Coastal Dar es Salaam Project
Ref. EC Grant Contract No 2010/254-773
Working paper: Development of a Methodology for Land Cover Classification in Dar es Salaam using SPOT Imagery
18 May 2012
Congedo Luca, Munafò Michele Page 14
Figure 3: Vulnerability to CC and LCC relation framework
The main aim of this study is to develop a very affordable methodology for LCC monitoring, which should increase adaptive capacity of Dar’s municipalities and therefore reduce people vulnerability to CC.
Remote sensing and GIS techniques are very useful for LCC monitoring (Campagna, 2006; Chen, 2008), especially through the semi-automatic classification of multispectral satellite images (Fan, et al., 2007).
The semi-automatic classification of remote sensing images is a method of features identification, through the ability of categorizing pixels, based upon their numerical properties (spectral characteristics). Classification algorithm labels image pixels, depending on their spectral characteristics, allowing for the creation of thematic maps (Richards & Jia, 2006).
The main choice of this study is to use images acquired by SPOT satellites. SPOT system is designed and developed by the French space agency Centre National d'Études Spatiales (CNES) and comprises SPOT 4 and SPOT 5 satellites, both operational (see Appendix 1).
SPOT 5 has the same orbit characteristics of SPOT 4. The imaging swath of each instrument has a width of 60 km (from http://earth.esa.int/pub/ESA_DOC/SPOT/Annex-5-1-2SPOTtechnicaldata.pdf , accessed 18/05/2012).
SPOT 4 and 5 are multispectral satellites; therefore, it is possible to perform supervised classifications in order to identify materials by their spectral response. They both acquire 4 spectral bands in the ranges of Green, Red, Near-Infrared (NIR) and Short-Wave Infrared (SWIR), with 10m spatial resolution.
The ESA delivers SPOT images for free (some images require an extra-cost) to research studies (see Appendix 1, ESA SPOT Catalogue section). Therefore, SPOT is a valid source for supervised LC classification, considering the spatial and spectral resolution, and especially the affordability of data. However, the low number of spectral bands limits the amount and variety of LC classes that can be identified through supervised classification.
The climatic conditions of Dar es Salaam pose a challenge to usability of remote sensing images. In fact, clouds are present almost the whole year, hiding portions of ground to satellite sensors. That

Adapting to Climate Change in Coastal Dar es Salaam Project
Ref. EC Grant Contract No 2010/254-773
Working paper: Development of a Methodology for Land Cover Classification in Dar es Salaam using SPOT Imagery
18 May 2012
Congedo Luca, Munafò Michele Page 15
atmospheric disturbance required a cloud-masking process to be included in the methodology, in order to obtain a cloud-free scene of Dar.
Each LC classification requires three different SPOT images acquired at the same time, because of the spatial extent of Dar es Salaam compared to SPOT swath. Therefore, a mosaic process needed to be included in the methodology.
In order to simplify the LC classification process, and provide flexible tools to Dar’s administrations, this study presents a methodology workflow similar to the one described in another working paper of this Activity: “Development of a Methodology for Land Cover Classification in Dar es Salaam using Landsat Imagery”.
The classification process produces a LC map, which allows for the assessment of urban patterns, for example through the use of Landscape Metrics Indices, or other spatial analysis.
2.2 Data Collection and Analysis Methodology
SPOT 4 and 5 images are available in the catalogues of ESA’s Earth Observation data products.
Images are delivered free of charge to registered users, for research purposes. However, some SPOT images have an extra cost of 400 Euro for data repatriation. The ESA’s catalogues are freely accessible via web (see Appendix 1, ESA SPOT Catalogue).
Image request is performed through free software, and imagery is generally available to download within a week, upon email notification.
Images acquired by SPOT 4 or SPOT 5 consist of .TIF files, already georeferenced in the map projection: UTM WGS 84. Each file contains 4 layers (one for each spectral band), having a spatial resolution of 10m.
Analysis methodology is based on the same workflow developed in the ACC Dar project, for LC classification using Landsat imagery.
The workflow includes a preprocessing phase, where images are prepared to the classification process, through the georeferencing and the conversion of DN to reflectance. The need to mosaic several images required for covering the whole extent of Dar es Salaam, is problematic because of the presence of clouds. Moreover, clouds affect LC classification results; therefore, a step for masking clouds and their shadows is included in the preprocessing phase.
The next workflow phase is image processing, particularly through semi-automatic classification (Maximum Likelihood algorithm). It allows for the identification of LC classes through the collection of training areas, which define the spectral characteristics of classes. For improving classification results, a Knowledge-Base classification is included in the processing phase.
3. Findings
The developed methodology requires the following steps:
a) Image selection; b) Preprocessing:
1. Georeferencing images in order to assign spatial coordinates to pixels; 2. Creating masks of clouds and shadows, and applying those mask to the SPOT bands in order
to exclude pixels belonging to clouds or shadows from LC classification; 3. Converting the multispectral bands from DN to reflectance, applying atmospheric correction; 4. Mosaicking temporally different images, in order to obtain a cloud-free and gap-free image;
c) Processing: 1. Classifying the image mosaic with Maximum Likelihood (ML) algorithm; 2. Elaborating vegetation indices, which are useful for the classification of vegetation; 3. Classifying the ML classification and the vegetation indices through a Knowledge-Base
classification.
Figure 4 shows the developed methodology workflow.

Adapting to Climate Change in Coastal Dar es Salaam Project
Ref. EC Grant Contract No 2010/254-773
Working paper: Development of a Methodology for Land Cover Classification in Dar es Salaam using SPOT Imagery
18 May 2012
Congedo Luca, Munafò Michele Page 16
Figure 4: Methodology workflow

Adapting to Climate Change in Coastal Dar es Salaam Project
Ref. EC Grant Contract No 2010/254-773
Working paper: Development of a Methodology for Land Cover Classification in Dar es Salaam using SPOT Imagery
18 May 2012
Congedo Luca, Munafò Michele Page 17
3.1 Image Selection
The first step of the workflow is selection of SPOT images, performed using the “EOLI-SA” software, which is developed by the ESA (see Appendix 1, ESA SPOT Catalogue). Considering the spatial extent of Dar es Salaam, at least three SPOT images, which have to be acquired very close together in time, are required.
The meteorological conditions of Dar es Salaam cause the presence of clouds during the whole year; therefore, it is important to select remote sensing images that have the lowest cloud coverage.
The temporal resolution of SPOT satellites offers limited availability of images with low cloud coverage, especially considering the large spatial extent of the Dar Region.
3.2 Preprocessing
The preprocessing phase involves several required steps before the classification process. It consists of various operations for eliminating, or at least reducing, any possible source of spatial errors (due to coarse georeferencing), and radiometric errors (due to clouds and atmospheric effects).
3.2.1 Georeferencing Images
Although SPOT images, when delivered, are already georeferenced, their spatial accuracy may be inadequate for mosaic purposes (see Appendix 1, SPOT Preprocessing Levels). Moreover, images need to be spatially coherent with the other GIS layers with higher resolution, produced by Dar’s administrations.
Georeferencing is performed using the shape file of the road net and other images as reference layers. The process requires the identification of pairs of Ground Control Points (GCPs), both in the image and in the reference layers, which have to be spatially distributed over the body of the image (Fisher & Unwin, 2005). The spatial accuracy obtained should be less than 1 pixel (i.e. 10m).
3.2.2 Cloud Cover and Clouds’ Shadow Mask
SPOT images have four bands only. Differently from Landsat images, the Blue band and the Thermal Infrared band are not present; therefore, it is not possible to identify clouds using the method described in the working paper: “Development of a Methodology for Land Cover Classification in Dar es Salaam using Landsat Imagery”.
As shown in Figure 5, there is high spectral similarity between clouds and urban surfaces, causing the discrimination of those two classes to be very difficult, using automatic classification processes. Clouds’ shadows are also problematic, because they affect pixel radiance.
Therefore, for the above reasons, a workflow step is needed for masking clouds and their shadows in the image.

Adapting to Climate Change in Coastal Dar es Salaam Project
Ref. EC Grant Contract No 2010/254-773
Working paper: Development of a Methodology for Land Cover Classification in Dar es Salaam using SPOT Imagery
18 May 2012
Congedo Luca, Munafò Michele Page 18
Figure 5: Graph of Urban and Cloud spectral profiles, in a SPOT image
It is possible to create clouds’ masks by manually drawing polygons with GIS software, but it is quite a long process, especially considering the amount of clouds generally present over Dar.
In this study, the masking process is performed through a ML classification of clouds and clouds’ shadows (see paragraph “3.3.1 Classification Algorithm” for further details about ML classification). Particularly, shadows are well identified in the scene by ML; therefore, while clouds are often misclassified as urban surfaces, clouds’ shadows are used to filter real clouds from urban surfaces.
The software programs ERDAS IMAGINE and Esri ArcGIS are used for mask creation, which requires the following steps:
In IMAGINE: o Perform an ML classification, selecting several training areas over clouds’ shadows
(class 1), and setting a chi-square threshold = 10; o Perform an ML classification, selecting several training areas over clouds (class 2),
and setting a chi-square threshold = 10;
In ArcGIS: o Import the two ML classifications; o Convert the classifications from raster to polygon; o Delete the polygons with maximum area from both classifications, which should be
the unclassified features (should have “class” field = null), obtaining a “Clouds” layer and a “Shadows” layer;
o Dissolve the “Shadows” layer, for merging adjacent polygons of the same class (uncheck "create multipart feature"), obtaining a “Shadows dissolved” layer;
o Dissolve the “Clouds” layer (uncheck "create multipart feature"), obtaining a “Clouds dissolved” layer;
o Select features with area greater than 5 000m2 from the “Shadows dissolved” layer
(features with lower area should not be clouds’ shadows), and save the selection as a new “Shadows mask” layer;
o Select features with area greater than 5 000m2 from the “Clouds dissolved” layer, and
save the selection as a new layer “Clouds dissolved gt5000”; o Select features from the “Clouds dissolved gt5000” layer that are within a distance of
1 000m from the “Shadows mask” layer (the distance may vary depending on clouds altitude and topographic relief), and save the selection as a new “Clouds mask” layer;
o Visually check for residual polygons due to evident clouds misclassifications, and in that case manually delete them;
o Merge “Clouds mask” layer and “Shadows mask” layer, obtaining the “Merged masks” layer;
Adapting to Climate Change in Coastal Dar es Salaam Project
Ref. EC Grant Contract No 2010/254-773
Working paper: Development of a Methodology for Land Cover Classification in Dar es Salaam using SPOT Imagery
18 May 2012
Congedo Luca, Munafò Michele Page 19
o Create a 10m buffer of the “Merged masks” layer, obtaining the “Final mask” layer (10m is the pixel dimension, therefore the buffer fills single pixel gaps in the mask);
In IMAGINE: o Convert the “Final mask” layer to raster, obtaining an .img file, where masked pixels
have value = 0, while elsewhere have value = 1; o Apply the mask to every band of the SPOT image, performing for each band a
multiplication with the raster mask.
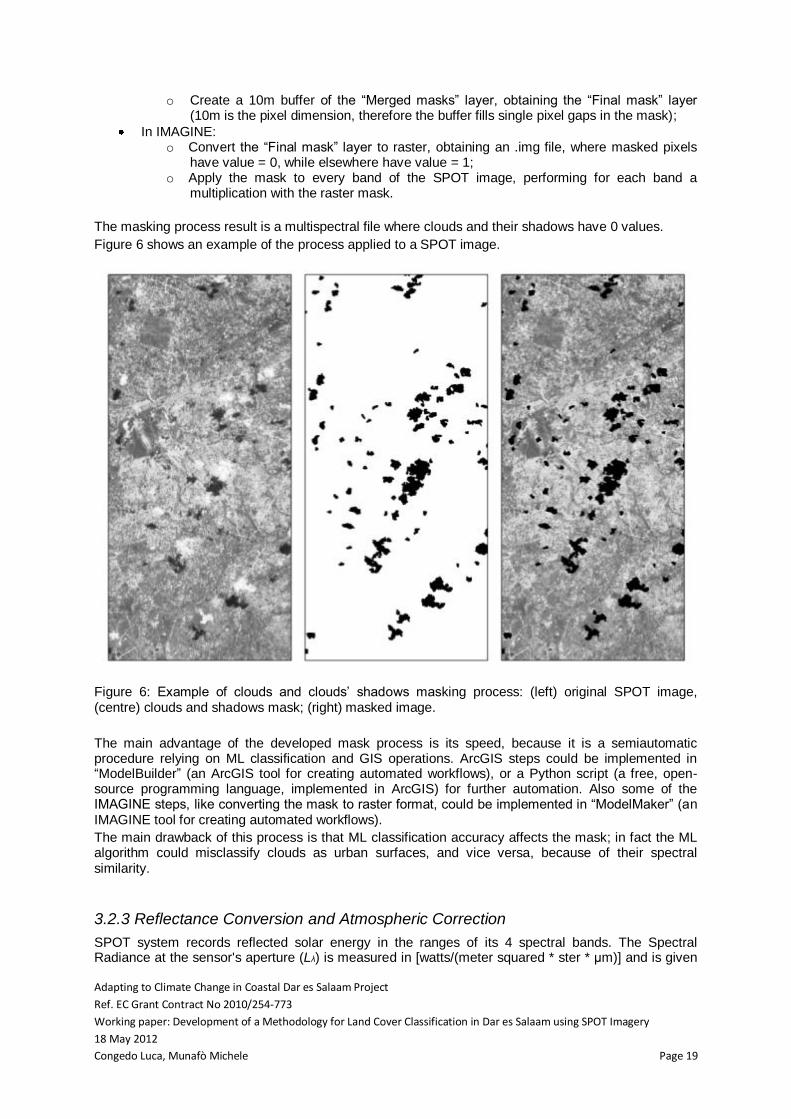
The masking process result is a multispectral file where clouds and their shadows have 0 values.
Figure 6 shows an example of the process applied to a SPOT image.
Figure 6: Example of clouds and clouds’ shadows masking process: (left) original SPOT image, (centre) clouds and shadows mask; (right) masked image.
The main advantage of the developed mask process is its speed, because it is a semiautomatic procedure relying on ML classification and GIS operations. ArcGIS steps could be implemented in “ModelBuilder” (an ArcGIS tool for creating automated workflows), or a Python script (a free, open-source programming language, implemented in ArcGIS) for further automation. Also some of the IMAGINE steps, like converting the mask to raster format, could be implemented in “ModelMaker” (an IMAGINE tool for creating automated workflows).
The main drawback of this process is that ML classification accuracy affects the mask; in fact the ML algorithm could misclassify clouds as urban surfaces, and vice versa, because of their spectral similarity.
3.2.3 Reflectance Conversion and Atmospheric Correction
SPOT system records reflected solar energy in the ranges of its 4 spectral bands. The Spectral Radiance at the sensor's aperture (Lλ) is measured in [watts/(meter squared * ster * μm)] and is given
Adapting to Climate Change in Coastal Dar es Salaam Project
Ref. EC Grant Contract No 2010/254-773
Working paper: Development of a Methodology for Land Cover Classification in Dar es Salaam using SPOT Imagery
18 May 2012
Congedo Luca, Munafò Michele Page 20
by (from http://www.astrium-geo.com/en/40-faq , accessed 2012/05/18):
Lλ = DN /G + B (1)
where G is the Gain and B is the Bias (offset) for each band, provided in the header file of each image.
Spectral Radiance can be converted to planetary reflectance (ρp), through the normalization for solar irradiance (NASA, 2011):
ρp = (π * Lλ * d2 )/ (ESUNλ *cosθs) (2)
where:
ρp = Unitless planetary reflectance;
Lλ = Spectral radiance at the sensor's aperture;
d = Earth-Sun distance in astronomical units from a spreadsheet file;
ESUNλ = Mean solar exo-atmospheric irradiances;
θs = Solar zenith angle in degrees, which is the reciprocal of the sun elevation angle.
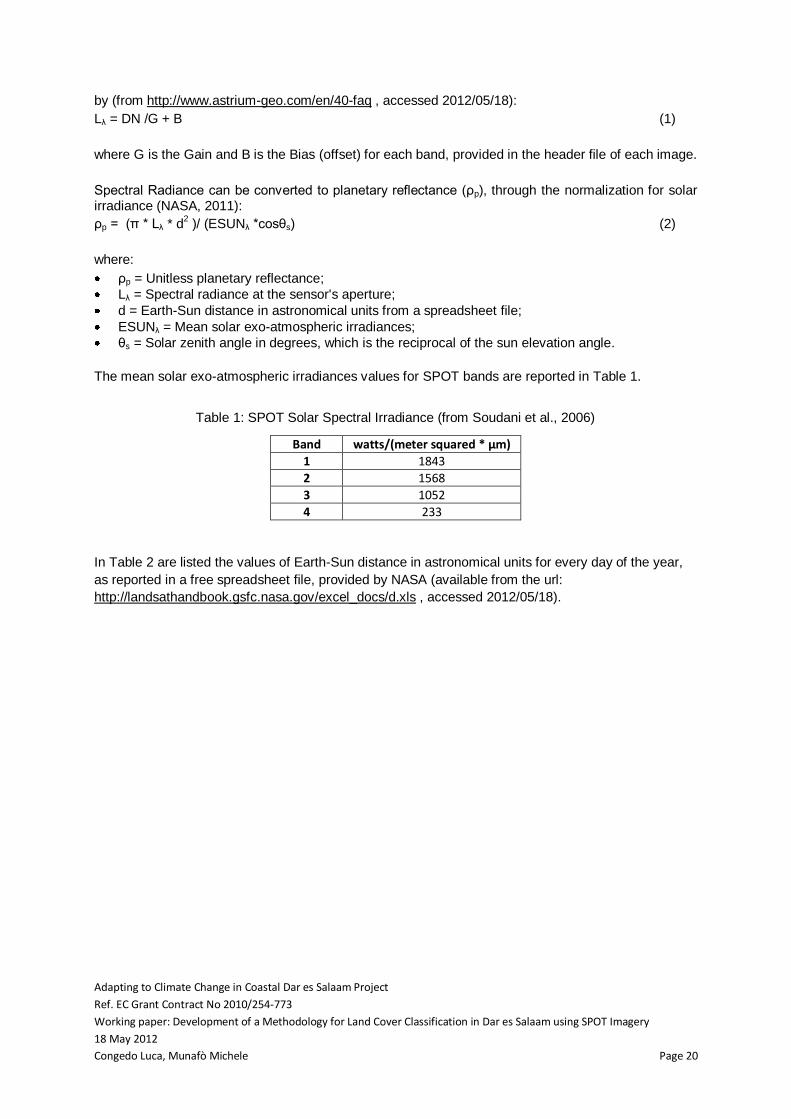
The mean solar exo-atmospheric irradiances values for SPOT bands are reported in Table 1.
Table 1: SPOT Solar Spectral Irradiance (from Soudani et al., 2006)
Band watts/(meter squared * μm)
1 1843
2 1568
3 1052
4 233
In Table 2 are listed the values of Earth-Sun distance in astronomical units for every day of the year,
as reported in a free spreadsheet file, provided by NASA (available from the url:
http://landsathandbook.gsfc.nasa.gov/excel_docs/d.xls , accessed 2012/05/18).

Adapting to Climate Change in Coastal Dar es Salaam Project
Ref. EC Grant Contract No 2010/254-773
Working paper: Development of a Methodology for Land Cover Classification in Dar es Salaam using SPOT Imagery
18 May 2012
Congedo Luca, Munafò Michele Page 21
Table 2: Earth-Sun distance (d) in astronomical units for Day of the Year (DOY)
DOY d DOY d DOY d DOY d DOY d DOY d DOY
1 0.98331 61 0.99108 121 1.00756 181 1.01665 241 1.00992 301 0.99359 361
2 0.9833 62 0.99133 122 1.00781 182 1.01667 242 1.00969 302 0.99332 362
3 0.9833 63 0.99158 123 1.00806 183 1.01668 243 1.00946 303 0.99306 363
4 0.9833 64 0.99183 124 1.00831 184 1.0167 244 1.00922 304 0.99279 364
5 0.9833 65 0.99208 125 1.00856 185 1.0167 245 1.00898 305 0.99253 365
6 0.98332 66 0.99234 126 1.0088 186 1.0167 246 1.00874 306 0.99228 366
7 0.98333 67 0.9926 127 1.00904 187 1.0167 247 1.0085 307 0.99202
8 0.98335 68 0.99286 128 1.00928 188 1.01669 248 1.00825 308 0.99177
9 0.98338 69 0.99312 129 1.00952 189 1.01668 249 1.008 309 0.99152
10 0.98341 70 0.99339 130 1.00975 190 1.01666 250 1.00775 310 0.99127
11 0.98345 71 0.99365 131 1.00998 191 1.01664 251 1.0075 311 0.99102
12 0.98349 72 0.99392 132 1.0102 192 1.01661 252 1.00724 312 0.99078
13 0.98354 73 0.99419 133 1.01043 193 1.01658 253 1.00698 313 0.99054
14 0.98359 74 0.99446 134 1.01065 194 1.01655 254 1.00672 314 0.9903
15 0.98365 75 0.99474 135 1.01087 195 1.0165 255 1.00646 315 0.99007
16 0.98371 76 0.99501 136 1.01108 196 1.01646 256 1.0062 316 0.98983
17 0.98378 77 0.99529 137 1.01129 197 1.01641 257 1.00593 317 0.98961
18 0.98385 78 0.99556 138 1.0115 198 1.01635 258 1.00566 318 0.98938
19 0.98393 79 0.99584 139 1.0117 199 1.01629 259 1.00539 319 0.98916
20 0.98401 80 0.99612 140 1.01191 200 1.01623 260 1.00512 320 0.98894
21 0.9841 81 0.9964 141 1.0121 201 1.01616 261 1.00485 321 0.98872
22 0.98419 82 0.99669 142 1.0123 202 1.01609 262 1.00457 322 0.98851
23 0.98428 83 0.99697 143 1.01249 203 1.01601 263 1.0043 323 0.9883
24 0.98439 84 0.99725 144 1.01267 204 1.01592 264 1.00402 324 0.98809
25 0.98449 85 0.99754 145 1.01286 205 1.01584 265 1.00374 325 0.98789
26 0.9846 86 0.99782 146 1.01304 206 1.01575 266 1.00346 326 0.98769
27 0.98472 87 0.99811 147 1.01321 207 1.01565 267 1.00318 327 0.9875
28 0.98484 88 0.9984 148 1.01338 208 1.01555 268 1.0029 328 0.98731
29 0.98496 89 0.99868 149 1.01355 209 1.01544 269 1.00262 329 0.98712
30 0.98509 90 0.99897 150 1.01371 210 1.01533 270 1.00234 330 0.98694
31 0.98523 91 0.99926 151 1.01387 211 1.01522 271 1.00205 331 0.98676
32 0.98536 92 0.99954 152 1.01403 212 1.0151 272 1.00177 332 0.98658
33 0.98551 93 0.99983 153 1.01418 213 1.01497 273 1.00148 333 0.98641
34 0.98565 94 1.00012 154 1.01433 214 1.01485 274 1.00119 334 0.98624
35 0.9858 95 1.00041 155 1.01447 215 1.01471 275 1.00091 335 0.98608
36 0.98596 96 1.00069 156 1.01461 216 1.01458 276 1.00062 336 0.98592
37 0.98612 97 1.00098 157 1.01475 217 1.01444 277 1.00033 337 0.98577
38 0.98628 98 1.00127 158 1.01488 218 1.01429 278 1.00005 338 0.98562
39 0.98645 99 1.00155 159 1.015 219 1.01414 279 0.99976 339 0.98547
40 0.98662 100 1.00184 160 1.01513 220 1.01399 280 0.99947 340 0.98533
41 0.9868 101 1.00212 161 1.01524 221 1.01383 281 0.99918 341 0.98519
42 0.98698 102 1.0024 162 1.01536 222 1.01367 282 0.9989 342 0.98506
43 0.98717 103 1.00269 163 1.01547 223 1.01351 283 0.99861 343 0.98493
44 0.98735 104 1.00297 164 1.01557 224 1.01334 284 0.99832 344 0.98481
45 0.98755 105 1.00325 165 1.01567 225 1.01317 285 0.99804 345 0.98469
46 0.98774 106 1.00353 166 1.01577 226 1.01299 286 0.99775 346 0.98457
47 0.98794 107 1.00381 167 1.01586 227 1.01281 287 0.99747 347 0.98446
48 0.98814 108 1.00409 168 1.01595 228 1.01263 288 0.99718 348 0.98436
49 0.98835 109 1.00437 169 1.01603 229 1.01244 289 0.9969 349 0.98426
50 0.98856 110 1.00464 170 1.0161 230 1.01225 290 0.99662 350 0.98416
51 0.98877 111 1.00492 171 1.01618 231 1.01205 291 0.99634 351 0.98407
52 0.98899 112 1.00519 172 1.01625 232 1.01186 292 0.99605 352 0.98399
53 0.98921 113 1.00546 173 1.01631 233 1.01165 293 0.99577 353 0.98391
54 0.98944 114 1.00573 174 1.01637 234 1.01145 294 0.9955 354 0.98383
55 0.98966 115 1.006 175 1.01642 235 1.01124 295 0.99522 355 0.98376
56 0.98989 116 1.00626 176 1.01647 236 1.01103 296 0.99494 356 0.9837
57 0.99012 117 1.00653 177 1.01652 237 1.01081 297 0.99467 357 0.98363
58 0.99036 118 1.00679 178 1.01656 238 1.0106 298 0.9944 358 0.98358
59 0.9906 119 1.00705 179 1.01659 239 1.01037 299 0.99412 359 0.98353
60 0.99084 120 1.00731 180 1.01662 240 1.01015 300 0.99385 360 0.98348
Adapting to Climate Change in Coastal Dar es Salaam Project
Ref. EC Grant Contract No 2010/254-773
Working paper: Development of a Methodology for Land Cover Classification in Dar es Salaam using SPOT Imagery
18 May 2012
Congedo Luca, Munafò Michele Page 22
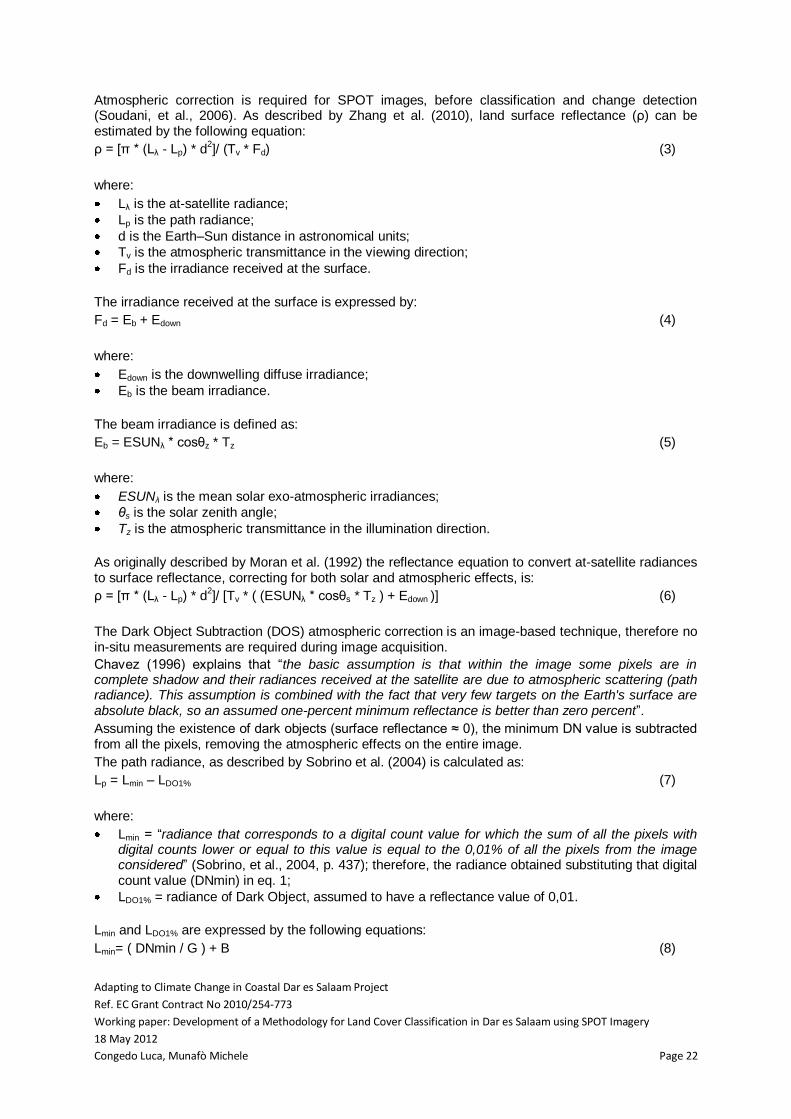
Atmospheric correction is required for SPOT images, before classification and change detection (Soudani, et al., 2006). As described by Zhang et al. (2010), land surface reflectance (ρ) can be estimated by the following equation:
ρ = [π * (Lλ - Lp) * d2]/ (Tv * Fd) (3)
where:
Lλ is the at-satellite radiance;
Lp is the path radiance;
d is the Earth–Sun distance in astronomical units;
Tv is the atmospheric transmittance in the viewing direction;
Fd is the irradiance received at the surface.
The irradiance received at the surface is expressed by:
Fd = Eb + Edown (4)
where:
Edown is the downwelling diffuse irradiance;
Eb is the beam irradiance.
The beam irradiance is defined as:
Eb = ESUNλ * cosθz * Tz (5)
where:
ESUNλ is the mean solar exo-atmospheric irradiances;
θs is the solar zenith angle;
Tz is the atmospheric transmittance in the illumination direction.
As originally described by Moran et al. (1992) the reflectance equation to convert at-satellite radiances to surface reflectance, correcting for both solar and atmospheric effects, is:
ρ = [π * (Lλ - Lp) * d2]/ [Tv * ( (ESUNλ * cosθs * Tz ) + Edown )] (6)
The Dark Object Subtraction (DOS) atmospheric correction is an image-based technique, therefore no in-situ measurements are required during image acquisition.
Chavez (1996) explains that “the basic assumption is that within the image some pixels are in complete shadow and their radiances received at the satellite are due to atmospheric scattering (path radiance). This assumption is combined with the fact that very few targets on the Earth's surface are absolute black, so an assumed one-percent minimum reflectance is better than zero percent”.
Assuming the existence of dark objects (surface reflectance ≈ 0), the minimum DN value is subtracted from all the pixels, removing the atmospheric effects on the entire image.
The path radiance, as described by Sobrino et al. (2004) is calculated as:
Lp = Lmin – LDO1% (7)
where:
Lmin = “radiance that corresponds to a digital count value for which the sum of all the pixels with digital counts lower or equal to this value is equal to the 0,01% of all the pixels from the image considered” (Sobrino, et al., 2004, p. 437); therefore, the radiance obtained substituting that digital count value (DNmin) in eq. 1;
LDO1% = radiance of Dark Object, assumed to have a reflectance value of 0,01.
Lmin and LDO1% are expressed by the following equations:
Lmin= ( DNmin / G ) + B (8)

Adapting to Climate Change in Coastal Dar es Salaam Project
Ref. EC Grant Contract No 2010/254-773
Working paper: Development of a Methodology for Land Cover Classification in Dar es Salaam using SPOT Imagery
18 May 2012
Congedo Luca, Munafò Michele Page 23
LDO1% = 0,01* [(ESUNλ * cosθs * Tz ) + Edown] * Tv / (π * d2) (9)
The path radiance is obtained substituting eq. 8 and eq. 9 in eq. 7, resulting in the following equation:
Lp = ( DNmin / G ) + B – 0,01 * [(ESUNλ * cosθs * Tz ) + Edown] * Tv / (π * d2) (10)
There are many ways to calculate the variables: Tv, Tz and Edown; Song et al. (2001) compared various correction methods like DOS1, DOS2, DOS3 and DOS4, concluding that the best correction is provided by DOS3, but very similar result are performed by DOS1 model.
Because of DOS3 is a more complex correction method than DOS1, as it requires an atmospheric radiative transfer model in order to calculate the variables Tv, Tz and Edown (Zhang, et al., 2010), in this study the DOS1 model (Chavez, 1996) is used.
DOS1 model assumes no atmospheric transmittance loss, and corrects for spectral band solar irradiance and solar zenith angle, resulting in:
Tv = 1;
Tz = 1;
Edown = 0.
Substituting these values of Tv, Tz and Edown in eq.10, the path radiance results:
Lp = ( DNmin / G ) + B – 0,01 * ESUNλ * cosθs / (π * d2) (11)
Therefore, substituting also in eq. 6 the values of Tv, Tz and Edown, it results that the land surface reflectance for a SPOT image is:
ρ = [π * (Lλ - Lp) * d2]/ (ESUNλ * cosθs) (12)
where Lλ is defined by eq.1, Lp is defined by eq.11, d is calculated from Table 2, ESUNλ is found from Table 1 and cosθs is the cosine of the solar zenith angle θs, which is reported in the image metafile.
Reflectance values should range from 0 to 1, while values above or below this range (due to anomalies in the image) should be corrected using the following thresholds:
If ρ < 0 than ρ = 0 ;
If ρ > 1 than ρ = 1 .
3.2.4 Image Mosaic
The mosaic of SPOT images is a required step, in order to obtain a classification of the whole area of Dar es Salaam. In fact at least three SPOT images, acquired at the same time, are required because of the spatial extension of Dar es Salaam. Moreover, because of the cloud cover issue, it is necessary to mask clouds and their shadows, and therefore to mosaic several images for the purpose of obtaining a cloud free scene.
It is preferable, for radiometric compatibility, to mosaic images acquired very close together in time, or at least during the same season. In fact, the phenological state of vegetation varies considerably during the year, thereby changing the spectral response of vegetation. Image availability often does not allow for the mosaic of images acquired during the same month or even the same year.
If image availability constraints the mosaic of images acquired during several years, than it is preferable to choose images of the same month of those years.
If it is necessary to mosaic images acquired in several months, than a radiometric normalization is useful for adapting the histograms of each image in the mosaic, in order to reduce the differences caused by the state of vegetation phenology and atmospheric effects (Helmer & Ruefenacht, 2007).
One of the drawback of image mosaic is to induce and a higher spectral variability than single images, thereby affecting the classification process.
Adapting to Climate Change in Coastal Dar es Salaam Project
Ref. EC Grant Contract No 2010/254-773
Working paper: Development of a Methodology for Land Cover Classification in Dar es Salaam using SPOT Imagery
18 May 2012
Congedo Luca, Munafò Michele Page 24
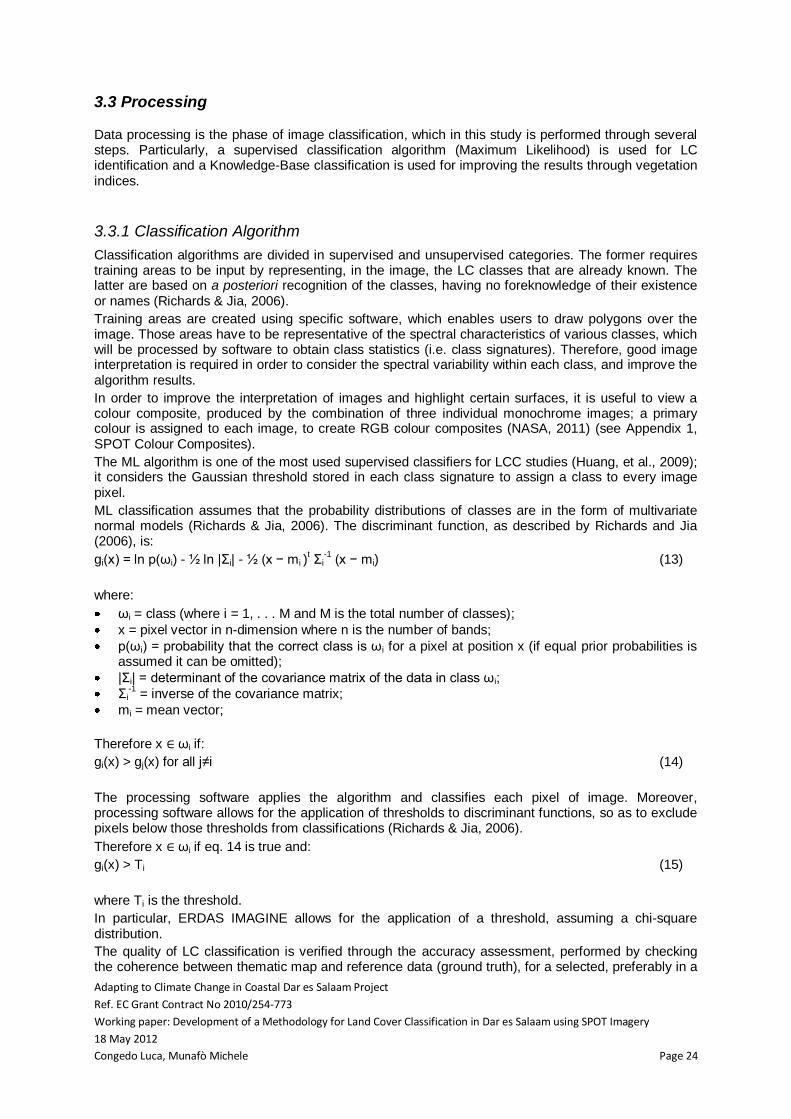
3.3 Processing
Data processing is the phase of image classification, which in this study is performed through several steps. Particularly, a supervised classification algorithm (Maximum Likelihood) is used for LC identification and a Knowledge-Base classification is used for improving the results through vegetation indices.
3.3.1 Classification Algorithm
Classification algorithms are divided in supervised and unsupervised categories. The former requires training areas to be input by representing, in the image, the LC classes that are already known. The latter are based on a posteriori recognition of the classes, having no foreknowledge of their existence or names (Richards & Jia, 2006).
Training areas are created using specific software, which enables users to draw polygons over the image. Those areas have to be representative of the spectral characteristics of various classes, which will be processed by software to obtain class statistics (i.e. class signatures). Therefore, good image interpretation is required in order to consider the spectral variability within each class, and improve the algorithm results.
In order to improve the interpretation of images and highlight certain surfaces, it is useful to view a colour composite, produced by the combination of three individual monochrome images; a primary colour is assigned to each image, to create RGB colour composites (NASA, 2011) (see Appendix 1, SPOT Colour Composites).
The ML algorithm is one of the most used supervised classifiers for LCC studies (Huang, et al., 2009); it considers the Gaussian threshold stored in each class signature to assign a class to every image pixel.
ML classification assumes that the probability distributions of classes are in the form of multivariate normal models (Richards & Jia, 2006). The discriminant function, as described by Richards and Jia (2006), is:
gi(x) = ln p(ωi) - ½ ln |Σi| - ½ (x − mi )t Σi
-1 (x − mi) (13)
where:
ωi = class (where i = 1, . . . M and M is the total number of classes);
x = pixel vector in n-dimension where n is the number of bands;
p(ωi) = probability that the correct class is ωi for a pixel at position x (if equal prior probabilities is assumed it can be omitted);
|Σi| = determinant of the covariance matrix of the data in class ωi;
Σi-1
= inverse of the covariance matrix;
mi = mean vector;
Therefore x ∈ ωi if:
gi(x) > gj(x) for all j≠i (14)
The processing software applies the algorithm and classifies each pixel of image. Moreover, processing software allows for the application of thresholds to discriminant functions, so as to exclude pixels below those thresholds from classifications (Richards & Jia, 2006).
Therefore x ∈ ωi if eq. 14 is true and:
gi(x) > Ti (15)
where Ti is the threshold.
In particular, ERDAS IMAGINE allows for the application of a threshold, assuming a chi-square distribution.
The quality of LC classification is verified through the accuracy assessment, performed by checking the coherence between thematic map and reference data (ground truth), for a selected, preferably in a

Adapting to Climate Change in Coastal Dar es Salaam Project
Ref. EC Grant Contract No 2010/254-773
Working paper: Development of a Methodology for Land Cover Classification in Dar es Salaam using SPOT Imagery
18 May 2012
Congedo Luca, Munafò Michele Page 25
random fashion, sample of pixels (i.e. test pixels).
Classification accuracy is affected by many variables, concerning the preprocessing and processing steps. Particularly, for LC classifications, it has to be considered that urban landscapes are composite combinations of buildings, roads, grass, trees, soil, water, and so on (Lu, et al., 2011). Landscape heterogeneity, due to the diversity of materials or cover types, affects the spectral distinction of endmembers. Depending on the spatial resolution of data, isolated urban patches placed within vegetated landscape, as for peri-urban development, can be spectrally mixed in only one pixel (Shrestha & Conway, 2011). Therefore, it creates a mixed spectral signature, dependent on what percentage and type of materials are at ground (Brook & Davila, 2000). Moreover, a major difficulty due to spectral similarity is the identification of impervious surfaces. For example, the spectral distinction between white soil and white roofs, or bare soil and asphalted roads, can rely on soil type and materials used for construction, especially in urban areas (Weng, 2012).
3.3.2 Spectral Vegetation Indices
Vegetation Indices are standardized methods based on band ratios that highlight vegetation dynamics (Song, et al., 2001).
One of the most used indexes is the Normalized Difference Vegetation Index (NDVI) that is a combination of the reflectance of Red and Near Infrared (NIR) wavelengths (Walthall, et al., 2004), and is defined as:
NDVI = (ρNIR – ρRED) / (ρNIR + ρRED) (15)
NDVI is unitless and ranges from −1.0 to 1.0. Healthy vegetation has NDVI values near to 1, while clouds or snow have values near 0 (Huang, et al., 2009); usually impervious surfaces range between 0.2 and 0.5.
In this study, NDVI is used to enhance classification process, particularly for vegetation, through the Knowledge-Base classification, as described in the following paragraph.
3.3.3 Knowledge-Base Classification
Knowledge-Base systems are tools for image classification and pattern recognition, which identify classes “through the explicit representation of prior knowledge about their spectral, morphological or topological characteristics. Such knowledge, acquired from a human specialist, can reduce significantly the demand for training patterns” (Costa, et al., 2010).
In this study, inputs of the Knowledge-Base classifications are: ML classification, NDVI, and Dar boundary shapefile. NDVI is used to enhance the classification of vegetation. Dar boundary is used to limit the LC classification to the administrative area.
The LC classification, focused on urban patterns, identifies 6 classes in the scene:
“Continuous Urban”, a very dense urbanization class, identified by ML classification;
“Discontinuous Urban”, a low density urbanization class characterized by mixed pixels of urban and vegetation or soil, and identified by ML classification;
“Full Vegetation”, a vegetation class with: o NDVI ≥ NDVImax ; o where NDVImax is a threshold value identified in each scene, ranging between 0.6 and 0.7
(this range may vary depending on the season of image acquisition);
“Most Vegetation”, a vegetation class, identified by ML classification or with: o NDVImin ≥ NDVI > NDVImax ; o where NDVImin is a threshold value identified in each scene, ranging between 0.5 and 0.6
(this range may vary depending on the season of image acquisition);
“Soil”, identified by ML classification;
“Water”, identified by ML classification.

Adapting to Climate Change in Coastal Dar es Salaam Project
Ref. EC Grant Contract No 2010/254-773
Working paper: Development of a Methodology for Land Cover Classification in Dar es Salaam using SPOT Imagery
18 May 2012
Congedo Luca, Munafò Michele Page 26
3.4 Results
The following paragraph shows the results of LC classification. LC classification was performed for the year 2011. Image availability did not allow for the LC classification of the whole Dar es Salaam surface: Temeke District was only partially classified. Moreover, cloud cover affecting most SPOT images, further limited the availability of usable images.
3.4.1 Land Cover Classifications
The developed methodology allows for a very affordable and semi-automatic LC classification.
In this study, a LC map of Dar es Salaam (Ilala, Kinondoni, and only partially Temeke Districts) was performed for year 2011 (Figure 7), classifying two SPOT images acquired on 06/07/2011 (for better resolution see Appendix 2 – Land Cover Classification).
Figure 7: LC classification of SPOT mosaic, referred to 2011
The LC map shows that most “Continuous Urban” is located at the centre of the city, while most “Discontinuous Urban” has sprawled from the main roads.
The LC classification results are listed in Table 3 (offshore islands were not considered in this statistics) and Figure 8 shows a chart of LC classification.

Adapting to Climate Change in Coastal Dar es Salaam Project
Ref. EC Grant Contract No 2010/254-773
Working paper: Development of a Methodology for Land Cover Classification in Dar es Salaam using SPOT Imagery
18 May 2012
Congedo Luca, Munafò Michele Page 27
Table 3: Statistics of LC classification of 2011
Area[ha] Area[%]
Continuous Urban 12212,8 11,80
Discontinuous Urban 17962,58 17,35
Soil 21242,84 20,52
Water 136,24 0,13
Full Vegetation 7099,74 6,86
Most Vegetation 44885,19 43,35
Figure 8: Chart of the LC classification of 2011
The clouds in the images were masked, but it was not possible to mosaic and fill cloud gaps, because of the limited availability of 2011 images (see Appendix 1, ESA SPOT Catalogue).
“Continuous Urban” is almost 12% and “Discontinuous Urban” is nearly 17%. It is relevant that urban (continuous and discontinuous) is almost 29% of the classified area, especially considering that LC classification does not cover the all Dar Region.
“Full Vegetation” and “Most Vegetation” cover almost a half of the classified area, and soil is almost 20%. It has to be considered that the phenological state of vegetation could affect the percentage of soil or vegetation during the year.
A comparison of SPOT classification with Landsat classification is described in another working paper: “Development of a Methodology for Assessing Land Cover Fragmentation". However, considering the different spatial resolution, the results of LC classifications using Landsat and SPOT are quite similar.

Adapting to Climate Change in Coastal Dar es Salaam Project
Ref. EC Grant Contract No 2010/254-773
Working paper: Development of a Methodology for Land Cover Classification in Dar es Salaam using SPOT Imagery
18 May 2012
Congedo Luca, Munafò Michele Page 28
4. Conclusions and Recommendations
The following sections describe the conclusions derived from this study and recommendations about future steps of the project implementation.
4.1 Conclusions
Dar es Salaam is affected by rapid unplanned urban expansion, especially on the coastal plane, due to population growth and migration (Kombe, 2005). Unplanned settlements are underserviced and have environmental consequences that can increase vulnerability to CC effects (Paavola, 2008).
The objective of ACC Dar project is to enhance the capacity of Dar's municipalities in understanding CC issues specific to coastal areas, particularly to increase knowledge on autonomous adaptive capacity, and to develop methodologies for integrating adaptation activities into strategies and plans for UDEM.
LCC is caused by the interactions of various driving forces. Some of those forces are directly related to anthropogenic cause, like urbanization, migration, or land tenure systems. Other forces that influence LCC are related to environment, like climate, rainfall variability, soil and groundwater degradation, etc. (Olson, et al., 2004). The relationship between CC and changes in local LU/LC caused thereby is very complex (Lioubimtseva, et al., 2005), especially considering that CC is affected by many variables related to natural resources and socio-political situations (Lioubimtseva & Henebry, 2009). Therefore, assessing LCC is fundamental for improving knowledge about those complicated relationships.
Monitoring activities need to be affordable, quick and easy to update, especially for cities like Dar es Salaam, where LCC is very rapid.
The developed methodology aims to reduce vulnerability to CC by increasing adaptive capacity of Dar es Salaam’s municipalities. In particular, municipalities using this methodology should be able to monitor LCC at a very low cost, and therefore adjust their plans according to those changes. This methodology, if implemented in a flexible planning framework, could help administrations in providing needed infrastructure and services to Dar’s inhabitants. Moreover, constant monitoring of LC could aid the regulatory framework in considering environmental issues and avoiding areas particularly exposed to climatic hazards, when making land available to people.
Remote sensing techniques are very useful for assessing landscape patterns without in situ measurements. This study developed a methodology for LC classification, based on SPOT images. This methodology is similar to another one, developed by this ACC Dar project activity for LC classification based on Landsat images, which is described in the working paper “Development of a Methodology for Land Cover Classification in Dar es Salaam using Landsat Imagery”.
One of the main goals of this methodology is to be affordable; therefore, only free images were used. SPOT images are delivered for free by the ESA (although some of them entail an extra cost), just as Landsat’s are provided for free by the USGS. The choice to use only free images meant that the methodology costs were limited to the purchase of the commercial software for processing images.
Table 4 shows a comparison of SPOT and Landsat image characteristics (see Appendix 1 – SPOT Satellites and Appendix 3 – Landsat Satellite Characteristics).

Adapting to Climate Change in Coastal Dar es Salaam Project
Ref. EC Grant Contract No 2010/254-773
Working paper: Development of a Methodology for Land Cover Classification in Dar es Salaam using SPOT Imagery
18 May 2012
Congedo Luca, Munafò Michele Page 29
Table 4: Comparison of the SPOT and Landsat characteristics of images acquired over Dar
Characteristics SPOT Landsat
Image availability SPOT 4, 5 Archive (images acquired since 1998)
Landsat 4, 5, 7 Archive (images acquired since 1984)
Cost Mostly free from ESA
(some images have an extra cost of 400 Euro for data repatriation)
Free from USGS
Image size 60km x 60km 185km x 185km
Image per classification 3 1
Spatial resolution 10m 30m
Spectral resolution 4 multispectral + panchromatic 7 multispectral + panchromatic
Cloud cover High for most of images High for most of images
The main advantage of SPOT images is their spatial resolution, which allows for the identification of finer LC patterns than those identified by Landsat images. Obviously, the higher spatial resolution implies a higher amount of pixels to be classified for the same area, increasing processing time as compared to Landsat.
About 3 SPOT images, acquired at the same time, are required for each classification, because of image size and satellite orbit; therefore, SPOT has a higher number of images per classification than Landsat.
That number of required images can be a constraint for classifying the whole Dar area, because of the lack of availability (or usability, in terms of cloud cover) of images. Therefore, that constraint makes SPOT classification more difficult than Landsat one, and consequently LCC assessment could not be performed regularly.
The higher spatial resolution allows for finer LC classifications that, considering the limited image availability, are convenient for local studies.
Spectral resolution of SPOT images (4 bands) is lower than Landsat (7 bands). Particularly, SPOT bands quasi correspond to bands 2, 3, 4 and 5 of Landsat. Limited spectral resolution is one of the main constraints of LC classification, in terms of the number of classes that can be identified.
Cloud cover is high for most SPOT and Landsat images. However, the cloud masking process could not be the same for SPOT and Landsat, because of their different spectral resolutions. In particular, as SPOT images lack the thermal infrared band, an alternative approach was developed for cloud masking.
The developed methodology includes a semi-automatic and GIS based approach for clouds masking, which relies on ML classification and buffer distance from clouds’ shadows.
A DOS model, which does not require in situ measurements, is used for reducing atmospheric effects on images, as a requirement before the mosaic step.
Another goal of this methodology, which is related to its affordability, is that it be quick and easy to update. For that reason, LC classification is semi-automatically performed in order to reduce the time and cost of LC map production, especially for a large area like the Dar es Salaam region.
The major problem of this LC classification is spectral similarity between white soil and white impervious surfaces, which can often lead to misclassification errors. The spectral resolution of SPOT (4 bands) is very good for photointerpretation, but is limited for semi-automatic classifications, because it is complicated to distinguish spectrally similar features.
The methodology for assessing the accuracy of LC classifications is described in the working paper “Development of a Methodology for Land Cover Classification Validation”. The assessment of LC fragmentation was performed using LMI, and is described in the working paper “Development of a Methodology for Assessing Land Cover Fragmentation”.
The ACC Dar project has planned training activities, to be held in Dar, about remote sensing and the use of the developed methodologies for LC monitoring. That should require little effort and it is expected to improve planning activities of Dar’s municipalities. Those municipalities could update and integrate LC maps in GIS, combining the advantages of remote sensing and spatial analysis functions of GIS, in order to assess environmental priorities and plan needed infrastructure for inhabitants.

Adapting to Climate Change in Coastal Dar es Salaam Project
Ref. EC Grant Contract No 2010/254-773
Working paper: Development of a Methodology for Land Cover Classification in Dar es Salaam using SPOT Imagery
18 May 2012
Congedo Luca, Munafò Michele Page 30
4.2 Recommendations
The main goal of this LC monitoring methodology is to be affordable, in order to allow local government to frequently update LC data. Dar es Salaam has considerable importance in the Tanzanian economy and politics; therefore, people from all over the Country, searching for a job, are attracted by the opportunities it has to offer.
The developed methodology could also be useful to other Tanzanian administrations, for creating urban scenarios and coordinating all level policies of adaptation to CC, which could be structural (e.g. seawalls, levees), and non-structural (e.g. land use planning, insurance) (Levina, et al., 2007). LC monitoring could improve spatial planning in adopting short-term decisions for reducing vulnerability, especially if the planning framework is adequately flexible and consider uncertainty in long-term decisions (Hallegatte, 2009).
The developed methodology focused on urban sprawl patterns. According to remote sensing instruments, it could be possible to monitor other landscape features, for example crops or urban vegetation, which are very important for assessing urban vulnerability, and could help autonomous adaptation.
The methodology workflow could be updated in the near future, according to any feedback that may come from the training activities held in Dar. Moreover, after assessing LC classification accuracy, it will be possible to refine the methodology steps, redefine LC classes, and correct surfacing weakness of the workflow.
In order to improve identification of LC features, it would be useful to collect in field data about several LC typologies. That data could increase classification accuracy, by improving the processing step of training area collection.
This methodology should be updated according to forthcoming technologies, in order to increase affordability and accuracy level.
A general constraint of remote sensing applications applied to Dar es Salaam, is the cloud cover, because of the local climatic conditions. Therefore, any future development of this methodology should find the best automatic method for masking clouds from images.
One of the motivations to choose SPOT images is their free cost. Therefore, the only cost of the methodology, excluding work of operators, is the purchase of software for image processing. That cost could be further reduced, by replacing commercial software with free open-source alternatives. For instance, the methodology could be adapted to use GRASS GIS (http://grass.osgeo.org/ , accessed 18/05/2012) and Quantum GIS (http://www.qgis.org/ , accessed 18/05/2012) software for preprocessing and processing images, and InterIMAGE (http://www.lvc.ele.puc-rio.br/projects/interimage/ , accessed 18/05/2012) for Knowledge-Base classification.
The methodology could be adapted, in the near future, to use new satellites’ images. The ESA is going to launch two new Sentinel-2 satellites (the second of five missions called Sentinels) in 2013, which will provide “enhanced continuity of SPOT- and Landsat-type data” (from
http://www.esa.int/esaLP/SEMM4T4KXMF_LPgmes_0.html , accessed 18/05/2012).
Because of their spatial resolution, Landsat images are mainly suitable for regional monitoring (scale 1:100 000), while SPOT images are suitable for more local studies (scale 1:35 000), especially considering the limited image availability.
Recent advances in technologies showed the use of hyperspectral sensors (very high spectral resolution) on board of airplanes or Unmanned Aerial Vehicles, which can fly at low altitude and therefore acquire high spatial resolution images. That remote sensing technology has higher cost than satellite one (for the same surface acquired), but could be a valid alternative for local studies on specific areas (scale 1:10 000 or greater).

Adapting to Climate Change in Coastal Dar es Salaam Project
Ref. EC Grant Contract No 2010/254-773
Working paper: Development of a Methodology for Land Cover Classification in Dar es Salaam using SPOT Imagery
18 May 2012
Congedo Luca, Munafò Michele Page 31
References
Briggs, J. & Mwamfupe, D., 2000. Peri-urban Development in an Era of Structural Adjustment in Africa: The City of Dar es Salaam, Tanzania. Urban Studies, 37(4), pp. 797-809.
Brook, R. M. & Davila, J., 2000. The Peri-urban Interface: A Tale of Two Cities. Gwynedd, Wales: School of Agricultural and Forest Sciences, University of Wales and Development Planning Unit, University College London.
Campagna, M., 2006. Gis For Sustainable Development. Boca Raton, FL: Crc Press.
Chavez, P. S., 1996. Image-Based Atmospheric Corrections - Revisited and Improved. Photogrammetric Engineering and Remote Sensing, 62(9), pp. 1025-1036.
Chen, C., 2008. Image Processing for Remote Sensing. Boca Raton, FL: CRC Press/Taylor \& Francis
Group.
Costa, G. et al., 2010. Knowledge-Based Interpretation of Remote Sensing Data with the Interimage System: Major Characteristics and Recent Developments. /, The International Archives of the
Photogrammetry, Remote Sensing and Spatial Information Sciences, p. 6.
EEA, 2006. Urban sprawl in Europe - The ignored challenge, Copenhagen: EEA/OPOCE.
Fan, F., Weng, Q. & Wang, Y., 2007. Land Use and Land Cover Change in Guangzhou, China, from 1998 to 2003, Based on Landsat TM /ETM+ Imagery. Sensors, Volume 7, pp. 1323-1342.
Fisher, P., Comber, A. J. & Wadsworth, R., 2005. Land Use and Land Cover: Contradiction or Complement. In: P. F. Fisher & D. J. Unwin, eds. Representing GIS. Chichester, England: John Wiley
\& Sons, pp. 85-98.
Fisher, P. & Unwin, D., 2005. Re-Presenting Gis. Chichester, England: John Wiley \& Sons.
Halla, F., 2005. Critical elements in sustaining participatory planning: Bagamoyo strategic urban development planning framework in Tanzania. Habitat International, 29(1), pp. 137-161.
Hallegatte, S., 2009. Strategies to adapt to an uncertain climate change. Global Environmental Change, 19(2), pp. 240-247.
Helmer, E. H. & Ruefenacht, B., 2007. A comparison of radiometric normalization methods when filling cloud gaps in Landsat imagery. Canadian Journal of Remote Sensing, 33(4), pp. 325-340.
Huang, S.-L., Wang, S.-H. & Budd, W. W., 2009. Sprawl in Taipei’s peri-urban zone: Responses to spatial planning and implications for adapting global environmental change. Landscape and Urban Planning, 90(1-2), pp. 20-32.
IPCC, 2001. Climate Change 2001: Impacts, Adaptation, and Vulnerability: Contribution of Working Group II to the Third Assessment Report of the IPCC. Cambridge: Cambridge University Press.
Kironde, J., 2006. The regulatory framework, unplanned development and urban poverty: Findings from Dar es Salaam, Tanzania. Land Use Policy, 23(4), pp. 460-472.
Kombe, W., 2005. Land use dynamics in peri-urban areas and their implications on the urban growth and form: the case of Dar es Salaam, Tanzania. Habitat International, 29(1), pp. 113-135.
Kyessi, A., 2005. Community-based urban water management in fringe neighbourhoods: the case of Dar es Salaam, Tanzania. Habitat International, 29(1), pp. 1-25.
Levina, E., Jacob, J., Ramos, L. E. & Ortiz, I., 2007. Policy Frameworks for Adaptation to Climate Change in Coastal Zones: The Case of the Gulf of Mexico. OECD Papers, 7(1), p. 68.
Lioubimtseva, E., Cole, R., Adams, J. & Kapustin, G., 2005. Impacts of climate and land-cover changes in arid lands of Central Asia. Journal of Arid Environments, 62(2), pp. 285-308.
Lioubimtseva, E. & Henebry, G. M., 2009. Climate and environmental change in arid Central Asia: Impacts, vulnerability, and adaptations. Journal of Arid Environments, 73(11), pp. 963-977.
Lu, D., Moran, E. & Hetrick, S., 2011. Detection of impervious surface change with multitemporal Landsat images in an urban–rural frontier. ISPRS Journal of Photogrammetry and Remote Sensing,
66(3), pp. 298-306.
Metzger, M. et al., 2006. The vulnerability of ecosystem services to land use change. Agriculture, Ecosystems \& Environment, 114(1), pp. 69-85.
Moran, M., Jackson, R., Slater, P. & Teillet, P., 1992. Evaluation of simplified procedures for retrieval of land surface reflectance factors from satellite sensor output. Remote Sensing of Environment, 41(2-
3), pp. 169-184.

Adapting to Climate Change in Coastal Dar es Salaam Project
Ref. EC Grant Contract No 2010/254-773
Working paper: Development of a Methodology for Land Cover Classification in Dar es Salaam using SPOT Imagery
18 May 2012
Congedo Luca, Munafò Michele Page 32
NASA, 2011. Landsat 7 Science Data Users Handbook. Maryland: Landsat Project Science Office at
NASA's Goddard Space Flight Center in Greenbelt.
Olson, J. M. et al., 2008. Integrating diverse methods to understand climate–land interactions in East Africa. Geoforum, 39(2), pp. 898-911.
Olson, J. M. et al., 2004. The Spatial Patterns and Root Causes of Land Use Change in East Africa. /:
Land Use Change, Impacts and Dynamics (LUCID).
Olvera, L. D., Plat, D. & Pochet, P., 2003. Transportation conditions and access to services in a context of urban sprawl and deregulation. The case of Dar es Salaam. Transport Policy, 10(4), pp.
287-298.
Paavola, J., 2003. Vulnerability to Climate Change in Tanzania: Sources, Substance and Solutions. /: A paper presented at the inaugural workshop of Southern Africa Vulnerability Initiative (SAVI) in Maputo, Mozambique June 19-21, 2003.
Paavola, J., 2008. Livelihoods, vulnerability and adaptation to climate change in Morogoro, Tanzania. Environmental Science Policy, 11(7), pp. 642-654.
Richards, J. A. & Jia, X., 2006. Remote Sensing Digital Image Analysis: An Introduction. Berlin,
Germany: Springer.
Rodima-Taylor, D., 2012. Social innovation and climate adaptation: Local collective action in diversifying Tanzania. Applied Geography, 33(0), pp. 128-134.
Sales_Jr., R., 2009. Vulnerability and adaptation of coastal communities to climate variability and sea-level rise: Their implications for integrated coastal management in Cavite City, Philippines. Ocean Coastal Management, 52(7), pp. 395-404.
Shrestha, N. & Conway, T. M., 2011. Delineating an exurban development footprint using SPOT imagery and ancillary data. Applied Geography, 31(1), pp. 171-180.
Sobrino, J., Jiménez-Muñoz, J. C. & Paolini", L., 2004. Land surface temperature retrieval from LANDSAT TM 5. Remote Sensing of Environment, 90(4), pp. 434-440.
Song, C. et al., 2001. Classification and Change Detection Using Landsat TM Data When and How to Correct Atmospheric Effects?. Remote Sensing of Environment, 75(2), pp. 230-244.
Soudani, K. et al., 2006. Comparative analysis of IKONOS, SPOT, and ETM+ data for leaf area index estimation in temperate coniferous and deciduous forest stands. Remote Sensing of Environment,
102(1-2), pp. 161-175.
Swan, A., 2010. How increased urbanisation has induced flooding problems in the UK: A lesson for African cities?. Physics and Chemistry of the Earth Parts ABC, 35(13-14), pp. 643-647.
UN-HABITAT, 2009. Tanzania: Dar es Salaam City Profile. /: The United Nations Human Settlements
Programme UN-HABITAT.
United_Republic_of_Tanzania, 2004. Dar es Salaam City Profile. /: Prepared by the City Council, with
advice from Cities and Health Programme, WHO Centre for Development, Kobe, Japan.
Walthall, C. et al., 2004. A comparison of empirical and neural network approaches for estimating corn and soybean leaf area index from Landsat ETM+ imagery. Remote Sensing of Environment, 92(4), pp. 465-474.
Weng, Q., 2012. Remote sensing of impervious surfaces in the urban areas: Requirements, methods, and trends. Remote Sensing of Environment, 117(0), pp. 34-49.
Zhang, Z., He, G. & Wang, X., 2010. A practical DOS model-based atmospheric correction algorithm. International Journal of Remote Sensing, Volume 31, p. 2837–2852.

Adapting to Climate Change in Coastal Dar es Salaam Project
Ref. EC Grant Contract No 2010/254-773
Working paper: Development of a Methodology for Land Cover Classification in Dar es Salaam using SPOT Imagery
18 May 2012
Congedo Luca, Munafò Michele Page 33
Appendix 1 – SPOT Satellites
SPOT satellites are designed and developed by the French space agency (CNES), and particularly SPOT 4 and SPOT 5 are still operational.
SPOT 4 was launched on March 1998, and it has a polar, circular, sun-synchronous orbit; it flies at an altitude of 822km at equator, and has a cycle of 26-day. The satellite acquires any given point of the Earth at the same local time (descending node at 10:30 a.m.) (from http://www.astrium-geo.com/files/pmedia/public/r330_9_spot_orbit.pdf , accessed 18/05/2012).
SPOT 5 was launched on May 2002, and it has the same orbit characteristics as SPOT 4.
SPOT 4 Sensor
The SPOT 4 sensor is called High-Resolution Visible and Infrared (HRVIR) and consists of two identical instruments; it has 3 VNIR bands and 1 SWIR band, with spatial resolution of 20m. Moreover it has a panchromatic (monospectral) band with spatial resolution of 10m (Table 5) (from http://earth.esa.int/pub/ESA_DOC/SPOT/Annex-5-1-2SPOTtechnicaldata.pdf , accessed 18/05/2012).
Table 5: HRVIR sensor spectral bands and resolutions
Electromagnetic spectrum Pixel size
[m]
Spectral bands
[µm]
Monospectral 10 0.61 – 0.68
B1 : Green 20 0.50 – 0.59
B2 : Red 20 0.61 – 0.68
B3 : Near-Infrared (NIR) 20 0.78 – 0.89
B4 : Short-Wave Infrared (SWIR) 20 1.58 – 1.75
The swath width is 60km with 1 instrument, or 117km with 2 instruments. The sensor has oblique viewing capability of ± 27º from the vertical viewing (from http://www.eoportal.org/directory/pres_SPOT4.html , accessed 18/05/2012).
Figure 9: Schematic of the HRVIR oblique viewing capability
(from http://www.eoportal.org/directory/pres_SPOT4.html , accessed 18/05/2012)

Adapting to Climate Change in Coastal Dar es Salaam Project
Ref. EC Grant Contract No 2010/254-773
Working paper: Development of a Methodology for Land Cover Classification in Dar es Salaam using SPOT Imagery
18 May 2012
Congedo Luca, Munafò Michele Page 34
“10-metre color products are obtained by overlaying two separate images acquired simultaneously by the HRVIR instrument, one in panchromatic mode at 10 m resolution and the other in multispectral mode at 20 m resolution. Because the camera is designed so that the two images register directly, generating a 10 m color image is relatively easy. The single image thus obtained is like a four-band, 10 m color product” (from http://earth.esa.int/pub/ESA_DOC/SPOT/Annex-5-1-4Resolution-mode.pdf , accessed 18/05/2012).
SPOT 5 Sensor
The SPOT 5 sensor is called High Resolution Geometric (HRG) and consists of two identical instruments; as shown in Table 6, it has 3 VNIR bands with spatial resolution of 10m and 1 SWIR band with spatial resolution of 20m. Moreover it has a panchromatic band with spatial resolution of 5m (or 2.5m if acquired in “Supermode”, which is a process for obtaining a 2.5m resolution image from two 5m resolution panchromatic images, acquired simultaneously) (from http://earth.esa.int/pub/ESA_DOC/SPOT/Annex-5-1-2SPOTtechnicaldata.pdf , accessed 18/05/2012).
Table 6: HRG sensor spectral bands and resolutions
Electromagnetic spectrum Pixel size
[m]
Spectral bands
[µm]
Panchromatic 2.5 or 5 0.48 – 0.71
B1 : Green 10 0.50 – 0.59
B2 : Red 10 0.61 – 0.68
B3 : Near-Infrared (NIR) 10 0.78 – 0.89
B4 : Short-Wave Infrared (SWIR) 20 1.58 – 1.75
As for SPOT 4, the swath width is 60km with 1 instrument, or 117km with 2 instruments. The sensor has oblique viewing capability of ± 27º from the vertical viewing (from http://www.eoportal.org/directory/pres_SPOT4.html , accessed 18/05/2012).
“10-metre color products are derived from multispectral images acquired simultaneously in the same four spectral bands as Spot 4. Bands B1, B2 and B3 yield images at a resolution of 10 m; the SWIR band yields 20 m images, which are then resampled to obtain a 10 m image. Only one image therefore needs to be acquired” (from http://earth.esa.int/pub/ESA_DOC/SPOT/Annex-5-1-4Resolution-mode.pdf , accessed 18/05/2012).
Spectral Bands in SPOT Products
The spectral bands of SPOT images are (from http://www.astrium-geo.com/en/40-faq , accessed 18/05/2012):
XS1 = Green;
XS2 = Red;
XS3 = Near-Infrared;
XS4 = Short-Wave Infrared.
The SPOT images delivered by ESA are generally .TIF files, where the bands are ordered as shown in Table 7.
Table 7: SPOT spectral bands order in the .TIF file
Spectral band Band number in .TIF file
XS1 (Green) 3
XS2 (Red) 2
XS3 (NIR) 1

Adapting to Climate Change in Coastal Dar es Salaam Project
Ref. EC Grant Contract No 2010/254-773
Working paper: Development of a Methodology for Land Cover Classification in Dar es Salaam using SPOT Imagery
18 May 2012
Congedo Luca, Munafò Michele Page 35
XS4 (SWIR) 4
Therefore, a generic colour composite for displaying the NIR, Red and Green bands is RGB = 123.
SPOT Colour Composites
Colour composite is the association of three of the available multispectral bands, with the three additive primary colours (Richards & Jia, 2006), which are: Red (R), Green (G), and Blue (B). Colour composites allow for the creation of colour images that are useful for image interpretation.
SPOT images do not have the blue band, and therefore it is not possible to create a natural colour composite. It is possible to reproduce a sort of natural colour composite through the combination of spectral bands (from http://www.crisp.nus.edu.sg/~research/tutorial/opt_int.htm , accessed 18/05/2012):
R = XS2;
G = (3 XS1 + XS3) / 4;
B = (3 XS1 - XS3) / 4.
Some of the possible colour composites, in RGB order, are (adapted from http://grass.osgeo.org/gdp/html_grass64/i.oif.html , accessed 18/05/2012):
XS3 XS2 XS1: composite very sensitive to green vegetation, which is depicted in red in the image, and coniferous are darker red than deciduous forests;
XS4 XS3 XS2: green vegetation is depicted in green and the shortwave band shows vegetation stress.
ESA SPOT Catalogue
Archived SPOT 4 and 5 images are available in the catalogues of ESA’s Earth Observation data products; data are delivered free of charge to registered Category 1 users.
Category 1 is defined as:
Research and applications development use of data in support of the mission objectives, including research on long term issues of Earth System science, research and development in preparation for future operational use and ESA internal use. Data for Category 1 use are directly provided by ESA at cost of reproduction (unless waived by ESA Member States in an Announcement of Opportunity)” (from http://earth.esa.int/TPMDAG/data_policy.html , accessed 18/05/2012).
The delivery is via ftp pickup, and some SPOT images have an extra cost of 400 Euro for data repatriation.
ESA’s Earth Observation catalogues can be explored using “EOLI-SA”, a free standalone multi-platform program (Windows, Linux, MacOS X; it requires the Java Runtime Environment), which is available at http://earth.esa.int/EOLi/EOLi.html (accessed 18/05/2012). Images are downloadable via FTP, upon e-mail notification.
Table 8 shows a subset of SPOT images acquired over Dar es Salaam, which are available in the ESA’s Earth Observation catalogues.
Table 8: SPOT images of Dar, available in ESA catalogue
Mission Sensor Acquisition date Cloud cover Extra cost SPOT-4 HRVIR 29/05/1998 7.38 low no SPOT-4 HRVIR 29/05/1998 7.38 low no SPOT-4 HRVIR 29/05/1998 7.38 low no SPOT-4 HRVIR 29/05/1998 7.38 low no SPOT-4 HRVIR 17/07/2000 7.38 high yes SPOT-4 HRVIR 17/07/2000 7.38 high yes SPOT-4 HRVIR 17/07/2000 7.39 high yes SPOT-4 HRVIR 12/08/2000 7.38 high yes SPOT-4 HRVIR 12/08/2000 7.38 high yes

Adapting to Climate Change in Coastal Dar es Salaam Project
Ref. EC Grant Contract No 2010/254-773
Working paper: Development of a Methodology for Land Cover Classification in Dar es Salaam using SPOT Imagery
18 May 2012
Congedo Luca, Munafò Michele Page 36
SPOT-4 HRVIR 12/08/2000 7.39 high yes SPOT-4 HRVIR 24/10/2000 7.34 high yes SPOT-4 HRVIR 24/10/2000 7.34 high yes SPOT-4 HRVIR 24/10/2000 7.35 high yes SPOT-4 HRVIR 29/03/2001 7.34 high yes SPOT-4 HRVIR 22/11/2001 7.56 high yes SPOT-4 HRVIR 22/11/2001 7.57 high yes SPOT-4 HRVIR 23/11/2001 7.37 high yes SPOT-4 HRVIR 23/11/2001 7.37 high yes SPOT-4 HRVIR 02/05/2002 7.59 high yes SPOT-4 HRVIR 02/05/2002 8.00 high yes SPOT-4 HRVIR 02/05/2002 8.00 high yes SPOT-4 HRVIR 18/06/2002 7.56 high yes SPOT-4 HRVIR 18/06/2002 7.56 high yes SPOT-4 HRVIR 23/06/2002 8.00 low yes SPOT-4 HRVIR 23/06/2002 8.00 low yes SPOT-4 HRVIR 13/06/2003 7.34 low no SPOT-4 HRVIR 13/06/2003 7.34 low no SPOT-4 HRVIR 30/08/2003 7.34 high no SPOT-4 HRVIR 30/08/2003 7.34 high no SPOT-4 HRVIR 30/08/2003 7.35 high no SPOT-4 HRVIR 25/09/2003 7.34 high no SPOT-4 HRVIR 25/09/2003 7.35 high no SPOT-4 HRVIR 25/09/2003 7.35 high no SPOT-4 HRVIR 04/03/2004 7.38 high no SPOT-4 HRVIR 25/03/2004 7.34 high no SPOT-4 HRVIR 25/03/2004 7.34 high no SPOT-4 HRVIR 25/03/2004 7.34 high no SPOT-4 HRVIR 29/04/2004 8.01 low yes SPOT-4 HRVIR 29/04/2004 8.01 low yes SPOT-4 HRVIR 29/04/2004 8.01 low yes SPOT-5 HRG 31/07/2004 7.46 low no SPOT-5 HRG 31/07/2004 7.46 low no SPOT-4 HRVIR 06/08/2004 7.58 low yes SPOT-4 HRVIR 06/08/2004 7.58 low yes SPOT-5 HRG 16/09/2004 7.42 high no SPOT-5 HRG 16/09/2004 7.42 high no SPOT-5 HRG 16/09/2004 7.42 high no SPOT-5 HRG 16/09/2004 7.42 high no SPOT-4 HRVIR 24/10/2004 7.39 high no SPOT-5 HRG 23/11/2004 7.35 high no SPOT-5 HRG 23/11/2004 7.35 high no SPOT-4 HRVIR 23/11/2004 8.03 high yes SPOT-5 HRG 27/11/2004 7.58 high no SPOT-5 HRG 27/11/2004 7.58 high no SPOT-4 HRVIR 10/06/2005 7.35 high no SPOT-4 HRVIR 10/06/2005 7.35 high no SPOT-4 HRVIR 10/06/2005 7.35 high no SPOT-4 HRVIR 15/07/2005 8.02 high yes SPOT-4 HRVIR 15/07/2005 8.02 high yes SPOT-4 HRVIR 15/07/2005 8.02 high yes SPOT-4 HRVIR 25/02/2006 7.33 high no SPOT-4 HRVIR 25/02/2006 7.33 high no SPOT-4 HRVIR 05/09/2006 7.42 high yes SPOT-4 HRVIR 05/09/2006 7.42 high yes SPOT-5 HRG 22/01/2007 7.38 high no SPOT-5 HRG 22/01/2007 7.38 high no SPOT-5 HRG 22/01/2007 7.39 high no SPOT-4 HRVIR 23/01/2007 7.50 high yes SPOT-4 HRVIR 23/01/2007 7.50 high yes SPOT-4 HRVIR 23/01/2007 7.50 high yes SPOT-4 HRVIR 01/03/2007 7.38 high yes SPOT-5 HRG 05/03/2007 7.30 high no SPOT-5 HRG 05/03/2007 7.30 high no SPOT-5 HRG 05/03/2007 7.31 high no SPOT-5 HRG 10/03/2007 7.34 high no SPOT-5 HRG 20/03/2007 7.42 high no SPOT-5 HRG 20/03/2007 7.42 high no SPOT-5 HRG 20/03/2007 7.42 high no SPOT-5 HRG 31/03/2007 7.30 high no SPOT-5 HRG 31/03/2007 7.30 high no SPOT-5 HRG 31/03/2007 7.30 high no SPOT-5 HRG 05/04/2007 7.34 high no SPOT-5 HRG 17/06/2007 7.29 low no SPOT-5 HRG 17/06/2007 7.29 low no SPOT-5 HRG 17/06/2007 7.29 low no SPOT-4 HRVIR 22/06/2007 8.04 low yes SPOT-4 HRVIR 22/06/2007 8.04 low yes
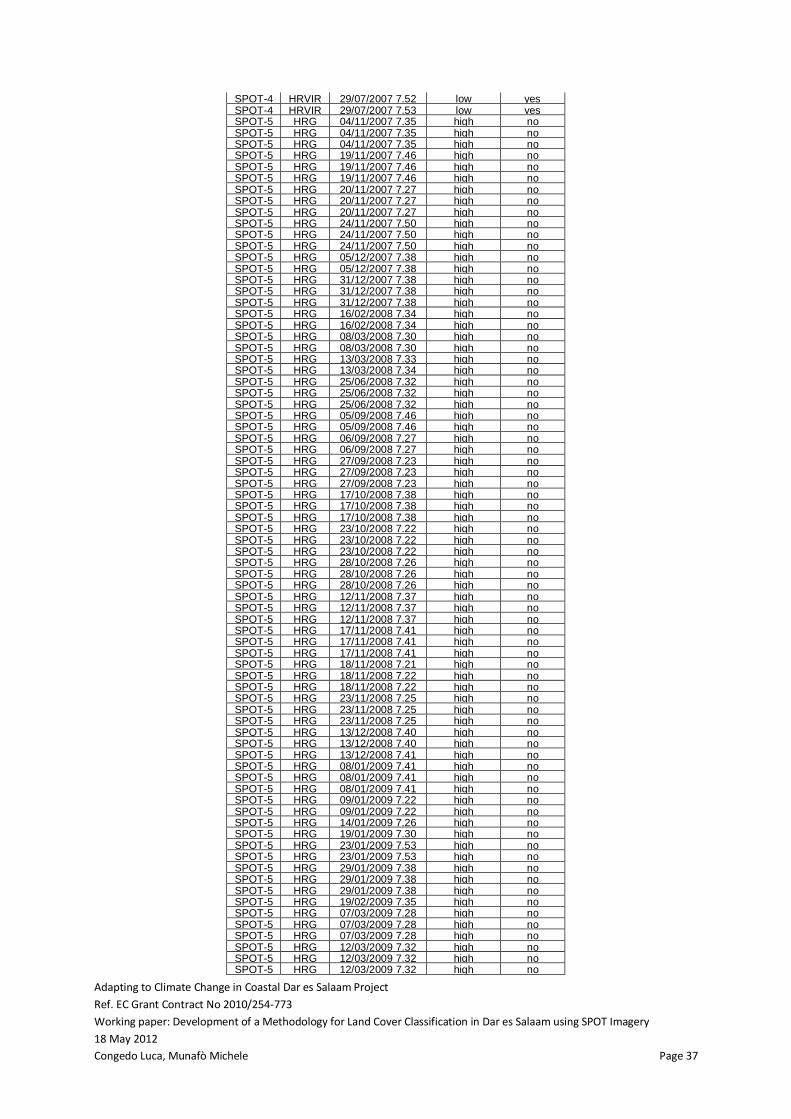
Adapting to Climate Change in Coastal Dar es Salaam Project
Ref. EC Grant Contract No 2010/254-773
Working paper: Development of a Methodology for Land Cover Classification in Dar es Salaam using SPOT Imagery
18 May 2012
Congedo Luca, Munafò Michele Page 37
SPOT-4 HRVIR 29/07/2007 7.52 low yes SPOT-4 HRVIR 29/07/2007 7.53 low yes SPOT-5 HRG 04/11/2007 7.35 high no SPOT-5 HRG 04/11/2007 7.35 high no SPOT-5 HRG 04/11/2007 7.35 high no SPOT-5 HRG 19/11/2007 7.46 high no SPOT-5 HRG 19/11/2007 7.46 high no SPOT-5 HRG 19/11/2007 7.46 high no SPOT-5 HRG 20/11/2007 7.27 high no SPOT-5 HRG 20/11/2007 7.27 high no SPOT-5 HRG 20/11/2007 7.27 high no SPOT-5 HRG 24/11/2007 7.50 high no SPOT-5 HRG 24/11/2007 7.50 high no SPOT-5 HRG 24/11/2007 7.50 high no SPOT-5 HRG 05/12/2007 7.38 high no SPOT-5 HRG 05/12/2007 7.38 high no SPOT-5 HRG 31/12/2007 7.38 high no SPOT-5 HRG 31/12/2007 7.38 high no SPOT-5 HRG 31/12/2007 7.38 high no SPOT-5 HRG 16/02/2008 7.34 high no SPOT-5 HRG 16/02/2008 7.34 high no SPOT-5 HRG 08/03/2008 7.30 high no SPOT-5 HRG 08/03/2008 7.30 high no SPOT-5 HRG 13/03/2008 7.33 high no SPOT-5 HRG 13/03/2008 7.34 high no SPOT-5 HRG 25/06/2008 7.32 high no SPOT-5 HRG 25/06/2008 7.32 high no SPOT-5 HRG 25/06/2008 7.32 high no SPOT-5 HRG 05/09/2008 7.46 high no SPOT-5 HRG 05/09/2008 7.46 high no SPOT-5 HRG 06/09/2008 7.27 high no SPOT-5 HRG 06/09/2008 7.27 high no SPOT-5 HRG 27/09/2008 7.23 high no SPOT-5 HRG 27/09/2008 7.23 high no SPOT-5 HRG 27/09/2008 7.23 high no SPOT-5 HRG 17/10/2008 7.38 high no SPOT-5 HRG 17/10/2008 7.38 high no SPOT-5 HRG 17/10/2008 7.38 high no SPOT-5 HRG 23/10/2008 7.22 high no SPOT-5 HRG 23/10/2008 7.22 high no SPOT-5 HRG 23/10/2008 7.22 high no SPOT-5 HRG 28/10/2008 7.26 high no SPOT-5 HRG 28/10/2008 7.26 high no SPOT-5 HRG 28/10/2008 7.26 high no SPOT-5 HRG 12/11/2008 7.37 high no SPOT-5 HRG 12/11/2008 7.37 high no SPOT-5 HRG 12/11/2008 7.37 high no SPOT-5 HRG 17/11/2008 7.41 high no SPOT-5 HRG 17/11/2008 7.41 high no SPOT-5 HRG 17/11/2008 7.41 high no SPOT-5 HRG 18/11/2008 7.21 high no SPOT-5 HRG 18/11/2008 7.22 high no SPOT-5 HRG 18/11/2008 7.22 high no SPOT-5 HRG 23/11/2008 7.25 high no SPOT-5 HRG 23/11/2008 7.25 high no SPOT-5 HRG 23/11/2008 7.25 high no SPOT-5 HRG 13/12/2008 7.40 high no SPOT-5 HRG 13/12/2008 7.40 high no SPOT-5 HRG 13/12/2008 7.41 high no SPOT-5 HRG 08/01/2009 7.41 high no SPOT-5 HRG 08/01/2009 7.41 high no SPOT-5 HRG 08/01/2009 7.41 high no SPOT-5 HRG 09/01/2009 7.22 high no SPOT-5 HRG 09/01/2009 7.22 high no SPOT-5 HRG 14/01/2009 7.26 high no SPOT-5 HRG 19/01/2009 7.30 high no SPOT-5 HRG 23/01/2009 7.53 high no SPOT-5 HRG 23/01/2009 7.53 high no SPOT-5 HRG 29/01/2009 7.38 high no SPOT-5 HRG 29/01/2009 7.38 high no SPOT-5 HRG 29/01/2009 7.38 high no SPOT-5 HRG 19/02/2009 7.35 high no SPOT-5 HRG 07/03/2009 7.28 high no SPOT-5 HRG 07/03/2009 7.28 high no SPOT-5 HRG 07/03/2009 7.28 high no SPOT-5 HRG 12/03/2009 7.32 high no SPOT-5 HRG 12/03/2009 7.32 high no SPOT-5 HRG 12/03/2009 7.32 high no

Adapting to Climate Change in Coastal Dar es Salaam Project
Ref. EC Grant Contract No 2010/254-773
Working paper: Development of a Methodology for Land Cover Classification in Dar es Salaam using SPOT Imagery
18 May 2012
Congedo Luca, Munafò Michele Page 38
SPOT-5 HRG 12/03/2009 7.32 high no SPOT-5 HRG 24/06/2009 7.34 low no SPOT-5 HRG 24/06/2009 7.34 low no SPOT-5 HRG 24/06/2009 7.34 low no SPOT-5 HRG 29/06/2009 7.38 high no SPOT-5 HRG 29/06/2009 7.38 high no SPOT-5 HRG 29/06/2009 7.38 high no SPOT-5 HRG 09/08/2009 7.51 high no SPOT-5 HRG 09/08/2009 7.51 high no SPOT-5 HRG 09/08/2009 7.51 high no SPOT-5 HRG 10/09/2009 7.36 high no SPOT-5 HRG 10/09/2009 7.36 high no SPOT-5 HRG 20/09/2009 7.44 high no SPOT-5 HRG 20/09/2009 7.44 high no SPOT-5 HRG 20/09/2009 7.44 high no SPOT-5 HRG 26/09/2009 7.28 high no SPOT-5 HRG 26/09/2009 7.29 high no SPOT-5 HRG 26/09/2009 7.29 high no SPOT-5 HRG 17/11/2009 7.29 low no SPOT-5 HRG 06/03/2010 7.35 high no SPOT-5 HRG 06/03/2010 7.35 high no SPOT-5 HRG 06/03/2010 7.35 high no SPOT-4 HRVIR 06/07/2011 7.08 low no SPOT-4 HRVIR 06/07/2011 7.08 low no SPOT-4 HRVIR 26/08/2011 7.24 high no SPOT-4 HRVIR 26/08/2011 7.25 high no SPOT-4 HRVIR 26/08/2011 7.25 high no
SPOT Preprocessing Levels
ESA delivers three SPOT preprocessing levels:
Level 1A;
Level 1B;
Level 2A.
In this study, were used images processed with Level 2 A; particularly, for that level the characteristics are: (from http://earth.esa.int/pub/ESA_DOC/SPOT/Annex-51-4Preprocessinglevels.PDF , accessed 18/05/2012):
“Level 2A scenes are rectified to match a standard map projection (UTM WGS 84), without using ground control points. Level 2A is the entry-level map product. For Spot 1 through Spot 4, the mean rectification elevation is constant across the scene. For Spot 5, a global DEM with a post spacing of one kilometre is used. Geometric corrections use a resampling model that compensates for systematic distortion effects and performs transformations needed to project the image in a standard map projection (UTM WGS 84). This model is based on known viewing parameters (satellite ephemeris data and attitude, etc.) and does not use external measurements. Other map projections or mean rectification elevations are available on request”; “For a scene with constant elevation, location accuracy is the same as level 1B, i.e., better than 350 metres (1 σ) for Spot 1 through Spot 4 and better than 50 metres (1 σ) for Spot 5”.

Adapting to Climate Change in Coastal Dar es Salaam Project
Ref. EC Grant Contract No 2010/254-773
Working paper: Development of a Methodology for Land Cover Classification in Dar es Salaam using SPOT Imagery
18 May 2012
Congedo Luca, Munafò Michele Page 39
Appendix 2 – Land Cover Classification
This Appendix contains the figure representing the LC classification for year 2011.
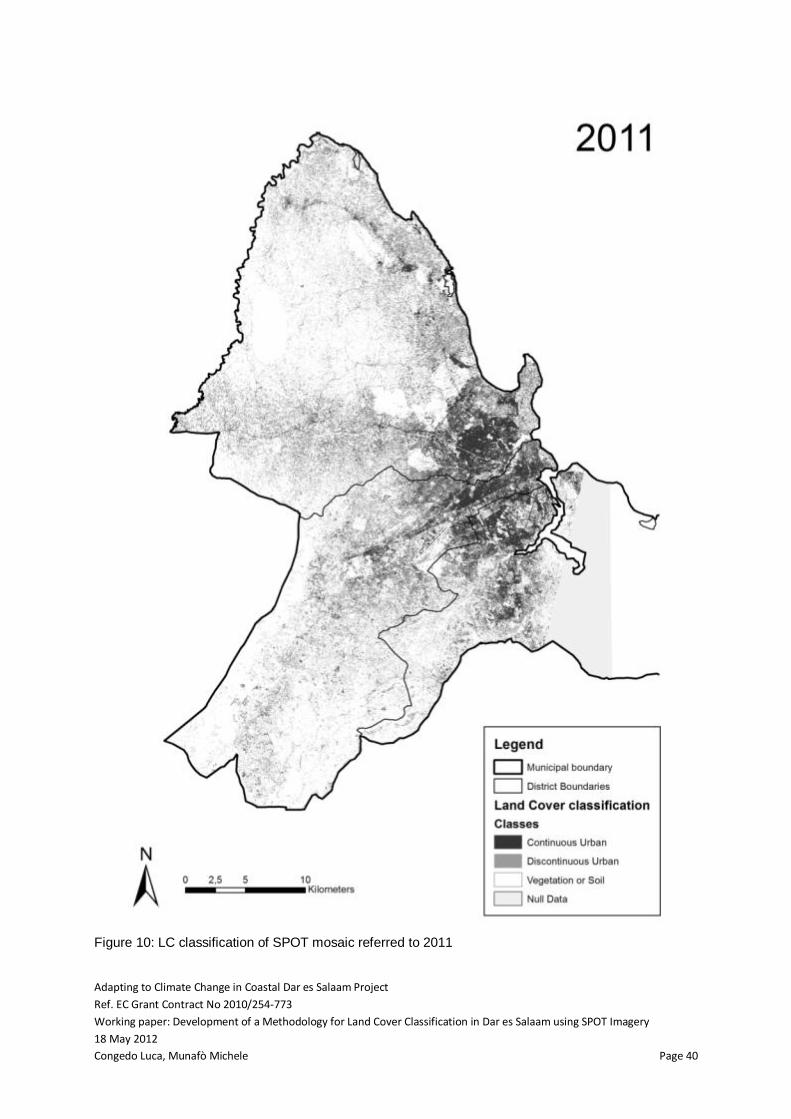
Adapting to Climate Change in Coastal Dar es Salaam Project
Ref. EC Grant Contract No 2010/254-773
Working paper: Development of a Methodology for Land Cover Classification in Dar es Salaam using SPOT Imagery
18 May 2012
Congedo Luca, Munafò Michele Page 40
Figure 10: LC classification of SPOT mosaic referred to 2011

Adapting to Climate Change in Coastal Dar es Salaam Project
Ref. EC Grant Contract No 2010/254-773
Working paper: Development of a Methodology for Land Cover Classification in Dar es Salaam using SPOT Imagery
18 May 2012
Congedo Luca, Munafò Michele Page 41
Appendix 3 – Landsat Satellite Characteristics
Landsat is a family of satellites launched by the National Aeronautics and Space Administration (NASA) of USA, during the last 40 years.
Following are listed the spectral and spatial characteristics of Landsat images.
Landsat 4 and 5 were launched in 1984, and had the same sensor called the Thematic Mapper (TM). The sensor characteristics thereof are listed in Table 9.
Table 9: Landsat 4-5 Thematic Mapper (TM) sensor (NASA, 2011)
* TM Band 6 is acquired at 120-meter resolution. Products processed after February 25, 2010 are resampled to 30-meter pixels.
Wavelength [micrometres]
Resolution [meters]
Band 1 0.45-0.52 30
Band 2 0.52-0.60 30
Band 3 0.63-0.69 30
Band 4 0.76-0.90 30
Band 5 1.55-1.75 30
Band 6 10.40-12.50 120* (30)
Band 7 2.08-2.35 30
Landsat 7 was launched in 1999 and has a sensor called Enhanced Thematic Mapper Plus (ETM+). Its sensor characteristics are displayed in Table 10.
Table 10: Landsat 7 ETM+ sensor (NASA, 2011)
* ETM+ Band 6 is acquired at 60-meter resolution. Products processed after February 25, 2010 are resampled to 30-meter pixels.
Spectral Response Wavelength
[micrometres]
Resolution
[meters]
Band 1 Blue-Green 0.45-0.52 30
Band 2 Green 0.52-0.60 30
Band 3 Red 0.63-0.69 30
Band 4 Near IR 0.77-0.90 30
Band 5 Mid-IR 1.55-1.75 30
Band 6 Thermal IR 10.40-12.50 60* (30)
Band 7 Mid-IR 2.09-2.35 30
Band 8 Pan 0.52-0.90 15