working paper - ipc ig - international policy centre for ... · 4 working paper which placed the...
TRANSCRIPT

W O R K I N GP A P E Rworking paper number 160august, 2017
ISSN 1812-108x
Brazilian fiscal policy in perspective: from expansion to austerity
Rodrigo Octávio Orair, Institute for Applied Economic Research (Ipea) and International Policy Centre for Inclusive Growth (IPC-IG)
Sergio Wulff Gobetti, Institute for Applied Economic Research (Ipea)

Copyright© 2017International Policy Centre for Inclusive Growth
International Policy Centre for Inclusive Growth (IPC-IG)
SBS, Quadra 1, Bloco J, Ed. BNDES, 13º andar70076-900 Brasília, DF - BrazilTelephone: +55 61 2105 5000
[email protected] ■ www.ipcig.org
The International Policy Centre for Inclusive Growth is jointly supported by theUnited Nations Development Programme and the Government of Brazil.
Rights and Permissions
All rights reserved.
The text and data in this publication may be reproduced as long as the source is cited.Reproductions for commercial purposes are forbidden.
The International Policy Centre for Inclusive Growth disseminates the findings of its workin progress to encourage the exchange of ideas about development issues. The papers aresigned by the authors and should be cited accordingly. The findings, interpretations, andconclusions that they express are those of the authors and not necessarily those of theUnited Nations Development Programme or the Government of Brazil.
Working Papers are available online at www.ipcig.org andsubscriptions can be requested by email to [email protected].
Print ISSN: 1812-108X

BRAZILIAN FISCAL POLICY IN PERSPECTIVE: FROM EXPANSION TO AUSTERITY
Rodrigo Octávio Orair1 and Sergio Wulff Gobetti2
ABSTRACT
This paper analyses the changes in orientation and composition of Brazilian fiscal policy, focusing on three recent periods and seeking to explore their relationship with economic performance. The first period (2005–2010) was characterised by fiscal expansion, with public investment and redistributive transfers as its main drivers. Economic performance was extraordinary. During the second period of fiscal expansion (2011–2014), the fiscal space was reoriented towards tax cuts and subsidies to private investment, while public investment stagnated. This new fiscal policy mix proved ineffective in preventing the economy from entering a downturn. The third period (from 2015 onwards) has been characterised by a shift to fiscal austerity and by the worst recession ever recorded in the country’s history. Finally, the paper presents some concluding remarks on challenges and socio-economic risks resulting from the recent and radical shift towards fiscal austerity.
1 INTRODUCTION
Brazil, in the period after the Great Financial Crisis (GFC) of 2007–2008, presents—for many reasons—a compelling case study of the interactions between fiscal policy and business and political cycles in a developing economy.
The country is noteworthy not only for being one of the very few that dealt relatively well with the most acute stage of the GFC, maintaining its dynamism throughout most of 2007–2010, but also for the speed of its economic and fiscal deterioration during the 2011–2014 economic slowdown, and the subsequent 2015–2016 recession. The contrast in performance is stark when one observes the decrease in growth of the country’s gross domestic product (GDP), which halved from 4.6 per cent per year between 2007 and 2010—which placed Brazil close to the top third of countries with the best global performance—to 2.3 per cent per year between 2011 and 2014,
1. Researcher at the Brazilian Institute for Applied Economic Research (Instituto de Pesquisa Econômica Aplicada—Ipea). Research Associate at the International Policy Centre for Inclusive Growth (IPC-IG). E-mail: [email protected].
2. Researcher at the Brazilian Institute for Applied Economic Research (Instituto de Pesquisa Econômica Aplicada—Ipea). E-mail: [email protected].

Working Paper4
which placed the country among the bottom third, and finally culminating in an accumulated collapse of -7.2 per cent of GDP during 2015–2016, the worst recession in the country’s history.3
How to explain both the extraordinary performance of the 2007–2010 period and the gravity of its subsequent deterioration? It is obviously not a simple phenomenon, and to properly understand it, one must consider the interactions between multiple determinants, from internal factors such as the loss of the dynamism of the domestic consumption and credit boom, to the country’s grave political crisis, and even external factors linked to the repercussions of the GFC. It is outside the scope of this chapter to explore all these interactions in depth; therefore, its focus will be restricted to fiscal policy. Even so, our central hypothesis is that the inflexions in the composition and orientation of fiscal policy are crucial elements for the performance of the post-GFC Brazilian economy.
Therefore, the chapter presents a general overview of fiscal policy in Brazil, highlighting two distinct points of inflexion. The first was a shift from a sub-period of fiscal expansion, driven mainly by public capital investment and redistributive transfers, to another sub-period characterised by increased tax cuts and subsidies to the private sector. The second inflexion was the radical shift in fiscal policy with the advent of a period of austerity (starting in 2015), after a decade of fiscal expansion (2005–2014). Sections 2 and 4 are dedicated to detailing the basic distinguishing traits of each of these periods, and to exploring their relationship with the performance of the Brazilian economy.
Another important issue in the post-GFC Brazilian experience is how fast the public debt deteriorated. Brazil managed, despite its rising public expenditures, to produce significant and continuous primary budget surpluses for over a decade and to reduce its public debt by nearly half (from 60 per cent of GDP in 2002 to 31 per cent of GDP in 2013). The level of Brazilian public debt, five years after the advent of the GFC, was low for the country’s historical standards and median according to international comparisons, indicating an apparently comfortable financial position. Brazil was even classified as investment-grade by international rating agencies. Since then, the situation has changed dramatically. Half of the decrease in the public debt (around 15 per cent of GDP) was reversed over only three years, from 2014 to 2016, and the country’s risk rating was downgraded to speculative. How to explain such a quick fiscal deterioration?
We will attempt to answer this question in Section 3, which will require an analysis of the relationships between the dynamics of public debt and the macroeconomic management of the country, far from the simplistic analyses that limit themselves to the most immediate aspects of fiscal policy, often offering a biased view of the issue. We intend, therefore, to better understand the factors that are responsible for the escalation of public debt since 2014, and which have led to significant pressure for fiscal policy to change towards fiscal austerity.
The chapter closes with some considerations regarding the challenges and socio-economic risks imposed by this recent and radical policy shift.
2 FISCAL POLICY IN PERSPECTIVE: THE EXPANSIONARY PERIOD
To understand the post-GFC fiscal policy in Brazil, we must go back to the first term of Luis Inácio Lula da Silva (2003–2006), the first president belonging to a left-wing party (the Workers’ Party—PT) to be elected since the period of military dictatorship in the country. The turbulent 2002 electoral process coincided with a troublesome time in the financial market, and, due
International Policy Centre for Inclusive Growth 5
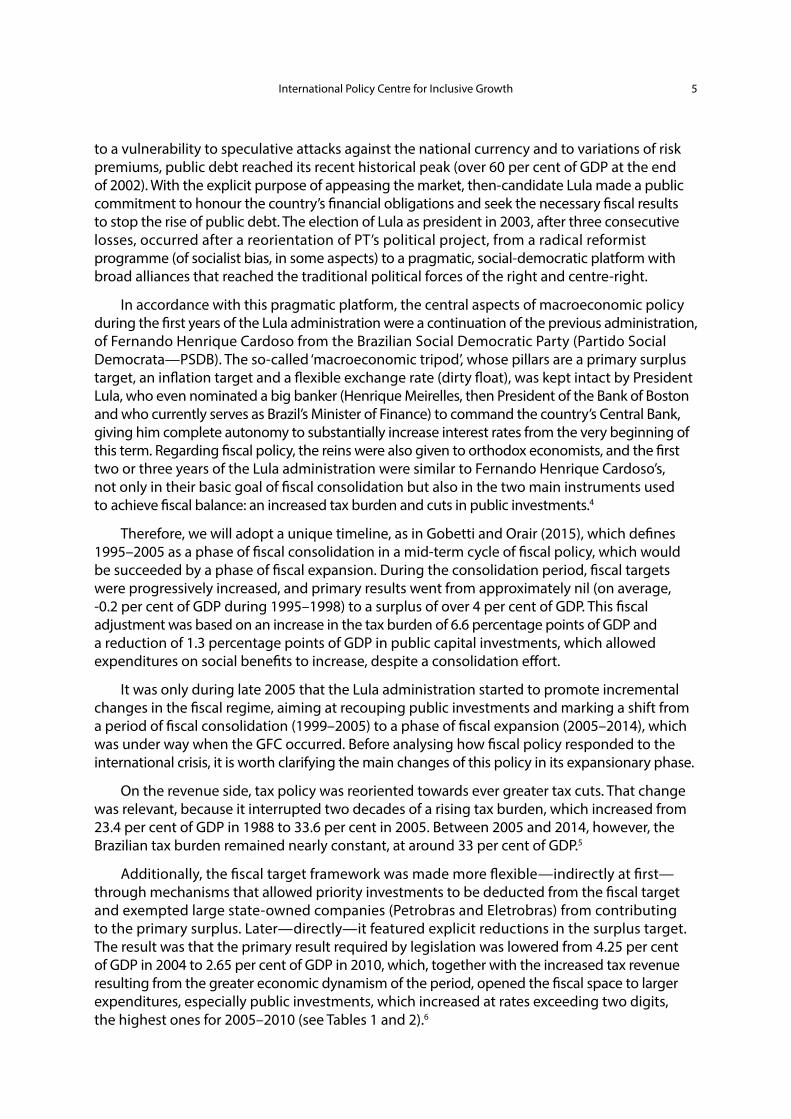
to a vulnerability to speculative attacks against the national currency and to variations of risk premiums, public debt reached its recent historical peak (over 60 per cent of GDP at the end of 2002). With the explicit purpose of appeasing the market, then-candidate Lula made a public commitment to honour the country’s financial obligations and seek the necessary fiscal results to stop the rise of public debt. The election of Lula as president in 2003, after three consecutive losses, occurred after a reorientation of PT’s political project, from a radical reformist programme (of socialist bias, in some aspects) to a pragmatic, social-democratic platform with broad alliances that reached the traditional political forces of the right and centre-right.
In accordance with this pragmatic platform, the central aspects of macroeconomic policy during the first years of the Lula administration were a continuation of the previous administration, of Fernando Henrique Cardoso from the Brazilian Social Democratic Party (Partido Social Democrata—PSDB). The so-called ‘macroeconomic tripod’, whose pillars are a primary surplus target, an inflation target and a flexible exchange rate (dirty float), was kept intact by President Lula, who even nominated a big banker (Henrique Meirelles, then President of the Bank of Boston and who currently serves as Brazil’s Minister of Finance) to command the country’s Central Bank, giving him complete autonomy to substantially increase interest rates from the very beginning of this term. Regarding fiscal policy, the reins were also given to orthodox economists, and the first two or three years of the Lula administration were similar to Fernando Henrique Cardoso’s, not only in their basic goal of fiscal consolidation but also in the two main instruments used to achieve fiscal balance: an increased tax burden and cuts in public investments.4
Therefore, we will adopt a unique timeline, as in Gobetti and Orair (2015), which defines 1995–2005 as a phase of fiscal consolidation in a mid-term cycle of fiscal policy, which would be succeeded by a phase of fiscal expansion. During the consolidation period, fiscal targets were progressively increased, and primary results went from approximately nil (on average, -0.2 per cent of GDP during 1995–1998) to a surplus of over 4 per cent of GDP. This fiscal adjustment was based on an increase in the tax burden of 6.6 percentage points of GDP and a reduction of 1.3 percentage points of GDP in public capital investments, which allowed expenditures on social benefits to increase, despite a consolidation effort.
It was only during late 2005 that the Lula administration started to promote incremental changes in the fiscal regime, aiming at recouping public investments and marking a shift from a period of fiscal consolidation (1999–2005) to a phase of fiscal expansion (2005–2014), which was under way when the GFC occurred. Before analysing how fiscal policy responded to the international crisis, it is worth clarifying the main changes of this policy in its expansionary phase.
On the revenue side, tax policy was reoriented towards ever greater tax cuts. That change was relevant, because it interrupted two decades of a rising tax burden, which increased from 23.4 per cent of GDP in 1988 to 33.6 per cent in 2005. Between 2005 and 2014, however, the Brazilian tax burden remained nearly constant, at around 33 per cent of GDP.5
Additionally, the fiscal target framework was made more flexible—indirectly at first—through mechanisms that allowed priority investments to be deducted from the fiscal target and exempted large state-owned companies (Petrobras and Eletrobras) from contributing to the primary surplus. Later—directly—it featured explicit reductions in the surplus target. The result was that the primary result required by legislation was lowered from 4.25 per cent of GDP in 2004 to 2.65 per cent of GDP in 2010, which, together with the increased tax revenue resulting from the greater economic dynamism of the period, opened the fiscal space to larger expenditures, especially public investments, which increased at rates exceeding two digits, the highest ones for 2005–2010 (see Tables 1 and 2).6

Working Paper6
Between 2005 and 2010, the general government’s primary surplus fell from 3.7 per cent to 2.6 per cent of GDP, its investment rate increased by a similar amount—1.1 percentage points of GDP—and the investment rate of federal state-owned companies exempted from fiscal targets increased by another 0.9 per cent of GDP.7 In other words, during this brief period the rate of public investment in Brazil went from one of the lowest levels in its history (2.6 per cent of GDP in 2005) to 4.6 per cent in 2010, which dates back to levels recorded in the early 1990s.8
TABLE 1Targets and values of public primary surpluses (2003–2015), as a percentage of GDP
YearSurplus target
(A)
Deduction margin Surplus floor
(C = A – B)
Surplus achieved
(D)
Non-recurring measures
(E)
Recurring surplus
(F = D – E) Priority
investments Other priority expenditures
Margin expansion
Total (B)
2003 4.25 - - - - 4.25 4.37 0.07 4.30
2004 4.25 - - - - 4.25 4.58 0.08 4.50
2005 4.25 0.06 - - 0.06 4.19 4.83 0.06 4.77
2006 4.25 0.14 0.01 - 0.14 4.11 4.37 0.18 4.19
2007 4.25 0.19 0.03 - 0.23 4.02 4.50 0.02 4.48
2008 3.80 0.26 0.01 - 0.27 3.53 4.07 -0.03 4.10
2009 2.50 0.43 0.08 - 0.51 1.99 2.05 1.35 0.70
2010 3.30 0.59 0.07 - 0.65 2.65 3.01 1.15 1.86
2011 3.30 0.50 0.23 - 0.74 2.56 3.38 0.42 2.96
2012 3.10 0.59 0.28 - 0.87 2.23 2.33 0.59 1.73
2013 3.10 0.53 0.36 0.42 1.31 1.79 1.82 1.09 0.73
2014 3.10 0.68 0.39 No limit No limit No limit -0.60 0.69 -1.30
2015 -0.85 - - 1.18 1.18 -2.03 -1.93 -0.54 -1.39
2016 -2.64 - - - - -2.64 -2.51 0.62 -3.13
2017 -2.10 - - - - -2.10 n/a. n/a. n/a.
Notes: 1. We consider the estimates of GDP values in the budget laws that are references for achieving targets, and not the updated GDPs.
2. Expenses from the Pilot Investment Project (Projeto Piloto de Investimentos—PPI) up to 2008 and from the Growth Acceleration Programme (Programa de Aceleração do Crescimento—PAC) from 2009 were subdivided among investments (acquisition of fixed public assets, including transfers to subnational governments) and other priority expenditures. The margin expansion of deductions refers to tax cuts, unrealised revenues and settlement of liabilities with public funds and banks.
Source: Authors’ elaboration with updated data from Orair (2016) and non-recurrent measures from Gobetti and Orair (2017).
The upturn in public investments reflects not only the increased flexibility of the fiscal regime, which temporarily removed budgetary constraints, but also a change in the government’s position regarding its role in strategic planning, which materialised in the formulation of large programmes and investment projects.
The fact that Brazil’s fiscal space was mainly geared towards public investments between 2005 and 2010 does not mean that these expenses were the only ones that increased during the period—indeed, they were not even the ones that increased the most, in absolute terms. On the contrary, the main reason that explains the increase in primary expenditures is social spending; and this did not start during Lula’s administration—although, as will be detailed, the PT deepened existing social policies.
In fact, structural pressures for the consolidation of a social welfare State—either through redistributive transfers to households or through the construction of a social protection

International Policy Centre for Inclusive Growth 7
network, including universal public services in areas such as health and basic education—have been in place since at least the 1980s, dating back to the renewal of the social contract by the Constitution of 1988, after the country’s return to democracy.
Such pressures impose a certain rigidity on the dynamics of social spending, over which the discretionary power of fiscal authorities is very limited. The amount of social benefits, as well as the supply of social services, initially expands as the population gains access to rights enshrined in the Constitution or as a result of factors such as the demographic tendency towards an aging population and the formalisation of the labour market, which expands the potential audience of contributory benefits.
At the federal level alone, social spending increased from 9.1 per cent of GDP to 13.7 per cent of GDP between 1991 and 2015, representing an annual growth rate of 4.5 per year. During the same period, social spending increased by 5.2 per cent per year.9 It is evident that there is an implicit scale effect that overestimates the analysis of social spending growth rates, because it stems from repressed demand and relatively low expenditure levels that were inherited from the years of the military dictatorship, which considered social issues of secondary importance. However, even during recent times, social benefits kept increasing at rates above 4 per cent per year, including during the fiscal consolidation phase, which explains why they went from 5.9 per cent of GDP in 1998 to 9.2 per cent of GDP in 2015.10
This increase in social spending, driven by structural pressures, must take centre stage in any serious analysis of Brazilian fiscal policy, not only for its remarkable impact on the well-being of the population but also for being mainly responsible for the increase in primary spending over the last three decades.11
To acknowledge the existence of structural pressures does not imply the denial of the existence of discretionary instruments, under government control, which may influence the dynamics of social spending. The main instrument is the readjustment of the minimum wage, since most social benefits are indexed to this value.12 In 2006, President Lula signed a deal with trade unions, defining a rule for annual readjustments of the value of the minimum wage based on the sum of the rates of inflation and real GDP growth. This mechanism systematised and accelerated the policy of valuation of the minimum wage, which began in the mid-1990s, providing real gains to the baseline of social benefits of 4.1 per cent between 2005 and 2010, while there was better performance in the growth of GDP (see Table 2).13
In addition, the Lula administration restructured and significantly expanded the conditional cash transfer programmes, unifying them under the internationally recognised Bolsa Família programme. Therefore, between 2005 and 2010 there was a marked change in the profile of redistributive transfers in favour of those that tend to benefit the families at the base of the income distribution, influenced by the valuation of the minimum wage, although during the same period no structural measures were put in place to curb the concentration of income at the top of the income distribution through tax measures.14
In short, it is possible to describe Brazil’s fiscal policy between 2005 and 2014 as an expansionary period, during which targets and primary results were gradually reduced and the tax burden was kept relatively stable. However, during the first sub-period of fiscal expansion (2005–2010), tax revenue kept up with the accelerated pace of GDP growth, not only absorbing the pressures of social spending but also expanding the degrees of freedom in fiscal policy. This allowed for the fiscal space, which was crafted by the gradual reduction in primary surpluses, to be channelled into public investments, at the same time as a change in the profiles of redistributive transfers was taking place, favouring those that tend to benefit poorer households.

Working Paper8
TABLE 2Increases in primary revenues and expenses of the federal government by selected periods— real rate of growth per year (as a percentage)
Fiscal consolidation
Fiscal expansion
Fiscal consolidation
1999–2004 2005–2010 2011–2014 2015 2016
Revenue 5.4 4.5 1.2 -5.9 -2.1
Primary expenses 3.6 6.1 3.5 -2.9 4.6
Personnel 2.2 4.3 -0.7 1.9 -2.7
Social benefits 7.1 5.8 4.1 0.4 7.0
Pensions 6.5 4.6 3.4 2.5 7.5
LOAS/RMV 9.2 11.7 6.0 2.2 6.3
Unemployment insurance 4.2 12.5 6.1 -14.2 8.9
Bolsa Família n/a 8.4 9.2 -6.3 -3.8
Subsidies 5.0 13.2 23.8 -6.3 -8.5
Current and capital expenses -0.8 8.2 2.9 -12.5 10.5
Investments -7.7 21.2 -1.4 -36.7 13.5
Others 0.6 5.2 4.3 -5.6 9.9
Memo: GDP 2.7 4.3 2.3 -3.8 -3.6
Memo: Minimum wage 3.1 4.1 1.2 0.9 3.1
Memo: Instituted tax cuts n/a n/a 29.1 -3.6 -22.3Note: Values adjusted by the GDP implicit deflator.
Source: Authors’ elaboration with updated data from Gobetti and Orair (2017).
It was under this scenario that the GFC hit the country. The government opted to maintain an expansionary fiscal policy through public investments, redistributive transfers and an emergency package of tax and credit stimuli. The Brazilian economy reacted positively to these anticyclical measures and, after a brief slip in 2009, grew 7.5 per cent in 2010, its best performance in 25 years.15
There are many factors behind the greater economic dynamism of 2005–2010, including the international liquidity and commodities boom until the onset of the GFC, which helped to overcome some of the external growth constraints of the Brazilian economy, and the domestic consumption and credit boom. However, we must not neglect the impact of the change in fiscal policy on economic performance—it became more open to public investments and redistributive transfers.
The study by Orair, Gobetti and Siqueira (2016) provides evidence in this direction, by showing that the fiscal multipliers for the Brazilian economy vary according to the stage of the economic cycle and the type of expenditure. The authors’ main findings suggest that multipliers can be significant, persistent and even superior to the unit for specific components of expenditures (except in very strong expansions), as in the case of investments and social benefits, which are above 1.5 during strong recessions. In other words, the fiscal expansion of 2005–2010 favoured the expenditure categories associated with higher multipliers, which helps explain both Brazil’s extraordinary economic performance during the period and the quick recovery in 2010 after the outbreak of the GFC.
Therefore, 2010 can be considered the zenith of the Lula administration. Its fiscal policy was hailed internationally as successful because it managed to beat the global crisis, foster

International Policy Centre for Inclusive Growth 9
economic growth and, through redistributive transfers, contribute to a decrease in poverty rates and income concentration in one of the most unequal countries in the world. Not by accident, Lula reached the end of his second term (2007–2010) with record popularity ratings, managing to promote the election of his successor, Dilma Rousseff, then Presidential Chief of Staff and nicknamed ‘mother of the Economic Acceleration Plan’ (Programa de Aceleração Econômica—PAC).
During most of her first term, President Rousseff kept the expansionary orientation of fiscal policy; however, not much through public investment, but rather through tax cuts and credit subsidies, which points to an overhaul in government strategy that heavily hedged its bets on the role of the private sector as the main driver for investment. To understand the reasons behind these changes in government strategy and in the composition of fiscal policy is not a simple task. First and foremost, the recognition of the need for changes in the growth pattern of the Brazilian economy had gained ground among the economic staff of the Rousseff administration. This was due to an understanding that the economy was relying too much on household consumption and that private investments were constrained by the overvalued currency and high interest rates. Moreover, an interpretation prevailed that the expansionary fiscal policy was largely responsible for the two macroeconomic prices being ‘out of place’—that is, exchange and interest rates. In addition, many of the large public investment projects had severe flaws and were subject to excessive delays.16
In this context, it is necessary to remember that, in early 2011, the recently elected President Rousseff decided to provide room for Brazil’s Central Bank (BCB) to lower the interest rate. To that end, according to her economic staff, there would be due compensation from the fiscal policy side, raising the primary result to keep inflation under control. This is one of the main reasons why the primary surplus grew in 2011 (see Table 1, page 6), even though the interest rate only decreased during the second half of that year, when new signs of economic downturn appeared.
Under these circumstances, in 2012 the government decided to reinforce the anticyclical policy, through the expansion of tax cuts and subsidised credit, in addition to a reduction in electricity tariffs and a plan for concessions in infrastructure, preventing a larger involvement of the private sector. The basic presupposition of this strategy was that private investments would react more quickly than public investments. However, this shift can also be explained by a pragmatic tactic of favouring fiscal stimuli that were supposed to put less pressure on inflation, such as tax cuts, or on the primary surplus, such as credit subsidies operated outside the budget.17 In addition, the remarkable increase in subsidies was also driven by programmes that had high electoral visibility (for instance, student financing for private universities and popular housing), which, even though relevant in their own way, increased exponentially and not very judiciously.
The fiscal cost of tax and credit incentives was high. Tax cuts went from BRL43 billion in 2010 to BRL122 billion in 2014, while subsidies went from BRL31.3 billion to BRL73.5 billion.18 This time, however, the reaction of the private sector to these stimuli was limited to specific sectors of the economy, especially to those that were directly affected, and the aggregate rate of private investment did not respond to expectations.
The anticyclical policy was not able to keep the Brazilian economy from suffering a downturn during 2011–2014. Tax revenue slowed down in tandem with the economic activity and as a result of rising tax cuts, showing growth rates systematically below GDP for the first time in decades. The rigidities of social spending became explicit, and, despite lower minimum

Working Paper10
wage gains due to low economic growth, social benefits continued to increase at rates higher than 4 per cent per year, only slightly lower than in previous periods (see Table 2).
Under this scenario, with lower revenue growth, while a significant portion of expenditures maintained their previous rate of growth (social benefits) or were even extraordinarily accelerated (subsidies), fiscal policy reached a crossroads. The fiscal space was brutally reduced, while the government was reluctant to change its fiscal target, kept above 3 per cent of GDP during 2011–2014 (Table 1). How to solve this dilemma? The solution that was found was a mixture of two paths: i) stronger budget ‘locks’ (budget contingency) on a small portion of discretionary expenses, liable to be compressed in the short term; and ii) the use of non-recurring measures to artificially inflate fiscal results (one-off revenues, creative accounting, fiscal gimmicks such as the rollover of payments to public banks—known as ‘fiscal pedalling’ etc.) and increase the deduction margin of the target.19
In 2011, as mentioned earlier, the government prioritised the first of these paths and interrupted the process of renewing public investments. In 2012–2014, the fiscal target was formally achieved, through successive alterations in legislation, and a mixture of the two paths mentioned above. The non-recurring measures reached vast amounts, and the deduction margin, which was composed initially of a select portfolio of investments, was expanded and in time moved away from strictly public investments, with increased flexibility in their criteria to such a degree as to even include tax benefits (see Table 1).
The use of artificial measures to reach the fiscal target was a questionable way to make the rigid fiscal regime more flexible and preserve the fiscal space, but it was not enough to avoid more significant budget constraints on other discretionary expenditures. In fact, when comparing the rates of increase in expenditures for 2005–2010 and 2011–2014 in Table 2, we see that nearly all components slowed down, but investments were hit hardest, and subsidies were the main exception to the rule, having grown substantially.20
Therefore, a change in the composition of fiscal policy was consolidated with the shift from a first, expansionary sub-period, whose fiscal space was channelled mainly towards public investment (2006–2010), to a second sub-period when subsidies and tax cuts played a central role in the fiscal expansion and public investment was practically stagnant (2011–2014). These findings are important, because they afford us some perspective of the conventional wisdom that the government had been especially irresponsible during 2011–2014 with its expansionary policy through public expenditure.21 On the contrary, the total primary expenses during the second sub-period of fiscal expansion (2011–2014) increased at a similar rate to the period of fiscal consolidation (1999–2004) and slowed down compared to the first expansionist sub-period (2005–2010), although not enough to compensate for the slowdown in revenue and to prevent the deterioration of the fiscal results (Table 2).
What can be categorically stated, however, is that subsidies played a central role in the post-2011 fiscal expansion, together with tax cuts on the revenue side. Therefore, a more reasonable criticism can be levied, based on theoretical and empirical foundations, at the inefficiency of this new mix of fiscal policies in regaining economic growth. The empirical estimates of Orair, Gobetti and Siqueira (2016), for example, support this conclusion by indicating that the multipliers for subsidies are not significant or not persistent—unlike the multipliers for public investments, which can be over 1.5 during strong recessions.
From a theoretical standpoint, Kalecki (1943) introduced the discussion of business cycles into economic theory by showing how during recessions, when opposition to an expenditure

International Policy Centre for Inclusive Growth 11
policy based on public debt by the ‘market interest group’ is reduced, a view that the intervention must preferably occur through stimuli to the private sector is also consolidated. However, the author argues that this is not the best way to reactivate the economy, compared to an alternative of accelerating public investments and stimulating mass consumption. Additionally, it faces a practical difficulty due to the uncertain reaction of entrepreneurs. If the recession is profound, entrepreneurs can be pessimistic about the future, and measures tend to have a small effect (or even none at all) on investment.
Analysing the recent Brazilian experience in light of these theoretical arguments, it is possible to identify a series of factors that contributed to the construction of an uncertain and pessimistic scenario, which restricted the potential effects of subsidies and tax cuts on private investments. The debt crises of the euro area in 2011, as well as the renewed slowdown in China, are just a few of the events post-GFC that reinforced a vision that the global economy was facing a long-lasting great recession that would not spare emerging economies, thereby resulting in the reconsideration of investment projects on a global scale and in increased competition for the few domestic markets that remained dynamic.
In the Brazilian domestic arena, 2013 served as the backdrop to a series of street protests and a political crisis that culminated in the impeachment of President Rousseff in 2016. The inconsistencies of the government strategy to reinforce anticyclical policies by stimulating the private sector also led to widespread doubt, such as when the administration reversed its decision to reduce the basic interest rate in 2013. In short, given this uncertain and pessimistic scenario that tends to discourage private investment decisions, one may conclude that the shift in the fiscal policy mix to a greater prevalence of subsidies and tax cuts (during 2011–2014), when public investments remained practically stagnant, was a poor choice. So too could be considered the choice to cut public investment by 36.7 per cent during the 2015 recession. However, before tackling this issue, it is important to better understand what might have caused the change in Brazilian fiscal policy during the transition to Rousseff’s second presidential term, which is what we will do in the next section.
3 ESCALATION OF THE PUBLIC DEBT AND THE MACROECONOMIC MANAGEMENT PUZZLE
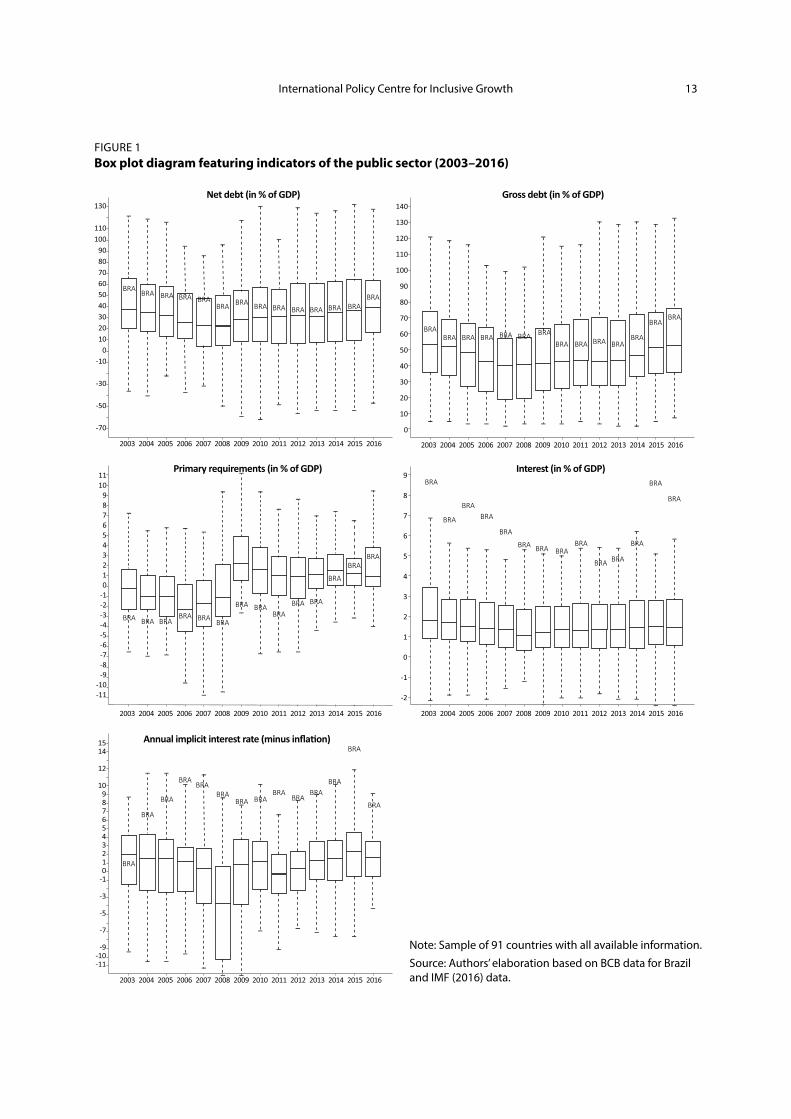
The speed with which indicators of indebtedness escalated after 2014 is an additional aspect that warrants attention in the post-GFC Brazilian experience. To illustrate it, Figure 1 features box plot diagrams with fiscal indicators that allow for an analysis of the evolution of the Brazilian fiscal situation in comparative terms. What can we conclude from this?
y The trajectory of net debt in Brazil is ‘V’-shaped: it decreased substantially after 2004, when it converged to a value close to the global median, reaching 30.5 per cent of GDP in 2013. Then it began a steep upward march, reaching a level close to that of 2007 in just three years, and towards the upper quarter of the most indebted economies in the world.
y The trajectory of gross debt is different both in shape and intensity. The period between 2004 and 2013 was characterised by a certain stability. What followed was a more accelerated rise, which put the country closer to the top quarter of the most indebted countries.

Working Paper12
y Brazil produced primary surpluses that were superior to most countries between 2004 and 2013 and was often placed below the lower quartile that sets apart the countries with the lowest primary public-sector borrowing requirements. This situation changed with the shift into primary deficits of upwards of 2 per cent of GDP during the 2015–2016 recession. This was nonetheless not that distant from global standards, given that primary deficits are still prevalent in most countries after the GFC.
y The situation is completely different when analysing nominal interest: Brazil is an outlier, before and after the GFC. While the median level of interest expenditures in the rest of the world hovers around 1.5 per cent of GDP, in Brazil the average has been close to 6 per cent of GDP.
y This outlier position in interest expenditures is partially explained by the relatively high inflation rates that are prevalent in the country. The analysis of the real implicit interest rate—which is simply the average interest rate over the net debt, minus the inflation rate—permits to control this effect and, again, highlights Brazil’s position. The real rate of 9 per cent per year has changed little over the years and has very few parallels worldwide.
y Such findings lead us to question the Brazilian idiosyncrasies: what explains the blinding speed of the recent deterioration of public indebtedness? Why is there such a large difference between gross and net debts? How is it possible for a government with a median level of debt to be an outlier when it comes to interest paid?
These are not simple questions to answer. The dynamics of public debt depend on a complex interaction between the major macroeconomic policies (monetary, credit, exchange and fiscal policies). Therefore, it will be necessary to present a few concepts and interaction mechanisms regarding these policies to answer these questions, at least partially.
Gross debt is the total of government liabilities, mainly government bonds issued by the National Treasury (Tesouro Nacional—TN). Net debt corresponds to the difference between liabilities and assets—the main ones being international reserves under the control of the BCB and TN credits with public banks, such as loans to the Brazilian Development Bank (Banco Nacional de Desenvolvimento Econômico e Social—BNDES)
When the government goes to the foreign exchange market and trades its national currency for US dollars, which will be invested in the international market and incorporated as reserves, or when it lends to the BNDES under subsidised interest rates to finance private investments, as it largely did over the fiscal expansionary period (2005–2014), it increases the liquidity of the national economy. Therefore, the BCB sells TN bonds in exchange for this additional currency to mop up liquidity, an operation called ‘sterilisation’. This is because the monetary policy in Brazil, under the inflation target regime, is very focused on liquidity control through the repo and reverse repos of short-term bonds by the BCB, the so-called ‘repurchase agreements’.
Another alternative would be for the TN to issue longer-term government bonds and finance the purchase of assets; in keeping ahead, it avoids repo operations. Under both alternatives, the result of the government’s decision to expand its international reserves or capitalise public banks will yield simultaneous increases in the gross debt. Therein lies the explanation to the paradox: between 2005 and 2013 the government produced successive primary surpluses and substantially reduced its net debt but simultaneously accumulated assets, which resulted in a larger gross debt.
International Policy Centre for Inclusive Growth 13
FIGURE 1Box plot diagram featuring indicators of the public sector (2003–2016)
130
110100
908070605040302010
0-10
-30
-50
-70
140
130
120
110
100
90
80
70
60
50
40
30
20
10
0
1110
9876543210
-1-2-3-4-5-6-7-8-9
-10-11
9
8
7
6
5
4
3
2
1
0
-1
-2
1514
12
109876543210
-1
-3
-5
-7
-9-10-11
BRA BRA
BRA
BRA
BRA
BRA
BRABRA
BRABRA BRA
BRABRA
BRABRA
BRA
BRA
BRA BRABRA BRA BRA
BRA BRABRA
BRA BRA
BRA
BRABRA
BRA BRA BRABRA BRA BRA BRA BRA BRA BRA BRA
BRA
BRABRA BRA BRA BRA BRA
BRA BRA BRA BRABRA
BRABRA
BRA
BRA
BRA BRA
BRA
BRA BRA BRABRA
BRA BRA
BRA
BRA
BRA
BRA
2003 2004 2005 2006 2007 2008 2009 2010 2011 2012 2013 2014 2015 2016
2003 2004 2005 2006 2007 2008 2009 2010 2011 2012 2013 2014 2015 2016
2003 2004 2005 2006 2007 2008 2009 2010 2011 2012 2013 2014 2015 2016
2003 2004 2005 2006 2007 2008 2009 2010 2011 2012 2013 2014 2015 2016
2003 2004 2005 2006 2007 2008 2009 2010 2011 2012 2013 2014 2015 2016
Net debt (in % of GDP) Gross debt (in % of GDP)
Primary requirements (in % of GDP) Interest (in % of GDP)
Annual implicit interest rate (minus infla�on)
Note: Sample of 91 countries with all available information.
Source: Authors’ elaboration based on BCB data for Brazil and IMF (2016) data.

Working Paper14
A comparison between the composition of public debt in 2004 and 2014 can help clarify this paradox. The Brazilian net debt reached 50.2 per cent of GDP in 2004. Due to the low volume of international reserves and of credit with the BNDES (3.7 per cent and 0.9 per cent of GDP, respectively), it was only slightly lower than the gross debt, of 56.2 per cent of GDP. In addition to the high net indebtedness, around two thirds of the assets were directly linked to exchange rates or short-term interest rates, which resulted in a very vulnerable financial position for the public sector.
To deal with these issues and taking advantage of a bonanza period in its balance of payments current and financial accounts, the government undertook an aggressive strategy of paying off external debts, avoiding issuing foreign exchange-linked bonds and, especially, accumulating international reserves, which reached the significant amount of USD363.3 billion (BRL982 billion), or 17 per cent of GDP in 2014, becoming a net creditor of foreign currency. This public debt management policy, despite its excesses and high cost, which we will address further, was nonetheless successful in reducing the financial vulnerability of the public sector. It was also central to the post-GFC fiscal policy, because it established more favourable conditions for the government to engage in an anticyclical policy to mitigate the effects of the crisis.
However, the operationalisation of the anticyclical policy was hindered by two structural obstacles to the growth of the Brazilian economy: i) the high interest rates in the domestic financial market; and ii) the weakness of the mechanisms of long-term investment financing. This second obstacle worsened during the unfavourable scenario of the GFC, when traditional sources of funding for the BNDES, the main provider of long-term credit in the country, proved insufficient to meet the challenge of occupying the space left behind by the withdrawal of private sources of financing. The solution to overcome both obstacles was to inject funds into the BNDES so that the bank could expand its credit lines with subsidised interest. The TN performed a first capitalisation in 2008 and, with the extension of the anticyclical policy, repeated this operation numerous times, which drove its credits with the public banks to total USD180.7 billion (BRL487.9 billion), or 8.4 per cent of GDP in 2014. Therefore, the country arrived in 2014 with a vastly different composition of its public debt compared to the previous decade: net debt decreased to 32.6 per cent of GDP, while the gross debt of 56.3 per cent of GDP changed very little due to the accumulation of assets in the form of international reserves and BNDES credit.22
Therefore, another characteristic of the period of fiscal expansion (2005–2014) was the configuration of an asymmetric profile of public indebtedness, with a large volume of assets and liabilities and a significant differential of rates of return between them, with the macroeconomic management being unable to push domestic interest rates to values more in line with international standards. The non-financial public sector accumulated around 25 per cent of GDP in low-return assets, including BNDES credits that paid the TN at rates close to domestic inflation, and international reserves that did not manage to even cover inflation rates. At the same time, liabilities were kept between 50 and 60 per cent of GDP and were repaying creditors at real rates over 5 per cent per year, with little change over the entire period.23
It is difficult to explain the reasons behind the high interest rates and the resistance against decreasing them in Brazil. These include the oligopolistic structure of the financial market; the short-term culture that had formed since the period of hyperinflation; and the modus operandi of monetary policy, which uses the basic interest rate as the main (and even only) tool for controlling inflation.24 However, for purposes of this chapter, we would like to point out the consequences of this enigma—such as the high burden on the public debt and the significant pressure on fiscal policy to produce high primary surpluses.

International Policy Centre for Inclusive Growth 15
In short, the management of the public debt during the period of fiscal expansion (2005–2014) had some merit—for instance, the reduction of the external vulnerability of the public sector and the facilitation of financing investment projects during a time when the private financial market was retracting. However, it also created another problem of a dynamic nature, as a result of the asymmetric profile of public indebtedness consolidated during this period, featuring a large volume of financial assets and liabilities, and a high differential rate of return among them. This maintained the need to generate very high primary results to contain the rise of the public debt whenever the economy did not manage to perform well in terms of GDP growth.
While the differential between the real interest rate and GDP growth was small and the government was producing primary surpluses, it was possible to reduce the net debt, as seen between 2005 and 2013. With the persistence of high interest rates in an economy in recession, it became necessary to produce primary surpluses above 4 per cent of GDP during 2015–2016 just to contain the mounting public debt.25 It was precisely during this period that the primary result indicator deteriorated: the average primary surpluses of 2.8 per cent of GDP between 2005 and 2013 transformed into a 2.5 GDP deficit in 2016, under the influence of the fiscal effects of the economic crisis. Herein lies the main explanation for the rapid rise of net debt in Brazil, which between 2014 and 2016 increased by 13.3 percentage points as a proportion of GDP (from 32.6 per cent to 45.9 per cent), more than triple the primary deficit accumulated during this brief period.
What it is important to keep in mind is that the current problem with the Brazilian public debt is not so much its amount but, rather, its dynamics. The level of indebtedness is still within both international and Brazilian historical standards, and has a much less vulnerable structure than in the recent past. However, it would be difficult to contain the rise in public debt over the next few years, as long as high differentials between real interest rates and GDP growth exist—even if the fiscal policy manages to yield primary surpluses.
A second important aspect is that the pressure for fiscal adjustments tends to grow disproportionately during the episodes of escalation of the public debt. It is clear that this phenomenon goes beyond economic analysis and the purpose of this paper, requiring the consideration of political factors, power relations and the central role that the enlarged Brazilian market of government bonds plays in the preservation of private wealth in the country. However, it is helpful to explain the shift in the orientation of fiscal policy soon after the 2014 elections, interrupting its expansionary period and making way for a new period of fiscal austerity. That phenomenon was similar to what occurred during the 1998–1999 and 2002–2003 currency crises, when pro-cyclical fiscal adjustments were driven by shocks in public indebtedness, but its start was delayed until after the presidential election.
4 FISCAL POLICY IN PERSPECTIVE: THE SHIFT TOWARDS AUSTERITY
Between 2011 and 2014 the expansionary fiscal policy of the PT administrations, which had previously been considered successful, became a target of fierce criticism, at times focused on its supposed fiscal irresponsibility, and at others on the inefficiency of anticyclical policies in recovering economic growth.26 These criticisms grew, influenced in no small part by the political polarisation of the country at the time, as the economic situation deteriorated and the government made extensive use of artificial measures (creative accounting, fiscal gimmicks etc.) to meet the primary result targets—to no avail, as the fiscal indicators kept deteriorating.

Working Paper16
2014 was a landmark year: criticisms reached their peak when the economy became stagnant (with GDP growth of 0.5 per cent), the primary result saw its first deficit in 16 years and public indebtedness started to rise after more than a decade of almost constant decreases.
Paradoxically, the downturn in the Brazilian economy between 2011 and 2014 occurred without significant tensions in the labour market. The tax cuts and credit subsidies in place did not achieve the expected result in terms of promoting new investments, but at least they enabled entrepreneurs to recalculate their profit margins and restructure their debts without having to resort to major lay-offs. At the same time, redistributive transfers continued to provide real gains to the households at the bottom of the income distribution. The period of fiscal expansion (2005–2014) was generally characterised by a process of simultaneous decreases in the indicators of unemployment, poverty and inequality.27 In short, the income of the poorest population grew more than that of the average strata, which might have deepened the distributive conflict, thereby leading to popular support for the government.28 Given this scenario, was such a radical shift in fiscal policy really necessary?
This question was a source of controversy during the electoral debates of 2014. Rousseff managed a very narrow victory (with a margin of only 3.5 million votes) over opposition candidate Aécio Neves. Within the opposition, the conventional narrative of simplistically attributing the roots of the country’s economic and fiscal problems to the economic policy mistakes of previous PT administrations gained ground—especially regarding fiscal irresponsibility, which undermined the credibility of economic agents. This conventional narrative echoed within influential sectors of society (market analysts, mass media channels, the justice department, audit offices, opposition politicians etc.). It also underpinned a defence of the theory of expansionist fiscal austerity, according to which the belief in austere fiscal policy and the commitment towards ensuring the sustainability of the public debt generates beneficial effects on the expectations of economic agents and, therefore, boosts investments and economic growth.
The conventional narrative was then countered by the official discourse of the ruling political establishment, and particularly Rousseff—who was contending for a second presidential term—which defended the country’s fiscal situation, the success of its economic policy faced with a dire international scenario and the need for a mere ‘fine-tuning’ of fiscal policy, which would not compromise the legacy and the economic and social achievements of the PT administrations.
However, a good portion of these rhetorical disagreements were restricted to electoral debate. Soon after the elections, the re-elected President Rousseff was seduced by the ‘political power’ of the austerity thesis (Dellepiane-Avellaneda 2015). She announced a change in the government’s economic team, which would be led by the economist Joaquim Levy, former Secretary of the Treasury and who by then held a directorship with the largest Brazilian private bank (Bradesco). The goal was for Levy to serve the same function as Meirelles had in 2003 and, through stricter fiscal rigour, to recover the credibility that had been lost. The government’s fiscal strategy for 2015 was then guided by the hypothesis of expansionist austerity and materialised in a proposal that combined a fiscal adjustment of 1.7 percentage points of GDP within a short one-year period and a sudden realignment of macroeconomic prices (exchange rate devaluation and price increases for electrical energy and fuel).29
The result of this fiscal adjustment was far below expectations. First, because most of the legislative measures of raising taxes and revising rules for the concession of social benefits met with resistance in Congress, and the government was forced by audit offices to pay off massive liabilities from previous years to public funds and banks. At the same time, it promoted a real contraction of 2.9 per cent in other expenses, 36.7 per cent of which in public investment
International Policy Centre for Inclusive Growth 17
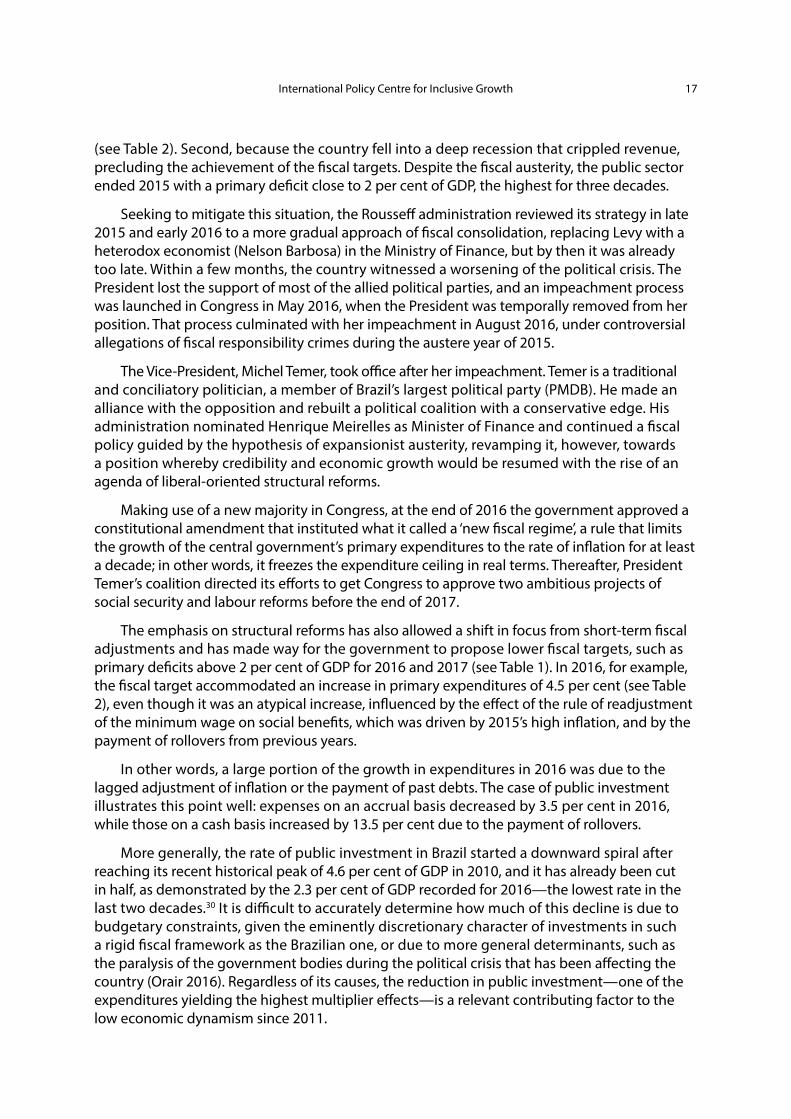
(see Table 2). Second, because the country fell into a deep recession that crippled revenue, precluding the achievement of the fiscal targets. Despite the fiscal austerity, the public sector ended 2015 with a primary deficit close to 2 per cent of GDP, the highest for three decades.
Seeking to mitigate this situation, the Rousseff administration reviewed its strategy in late 2015 and early 2016 to a more gradual approach of fiscal consolidation, replacing Levy with a heterodox economist (Nelson Barbosa) in the Ministry of Finance, but by then it was already too late. Within a few months, the country witnessed a worsening of the political crisis. The President lost the support of most of the allied political parties, and an impeachment process was launched in Congress in May 2016, when the President was temporally removed from her position. That process culminated with her impeachment in August 2016, under controversial allegations of fiscal responsibility crimes during the austere year of 2015.
The Vice-President, Michel Temer, took office after her impeachment. Temer is a traditional and conciliatory politician, a member of Brazil’s largest political party (PMDB). He made an alliance with the opposition and rebuilt a political coalition with a conservative edge. His administration nominated Henrique Meirelles as Minister of Finance and continued a fiscal policy guided by the hypothesis of expansionist austerity, revamping it, however, towards a position whereby credibility and economic growth would be resumed with the rise of an agenda of liberal-oriented structural reforms.
Making use of a new majority in Congress, at the end of 2016 the government approved a constitutional amendment that instituted what it called a ‘new fiscal regime’, a rule that limits the growth of the central government’s primary expenditures to the rate of inflation for at least a decade; in other words, it freezes the expenditure ceiling in real terms. Thereafter, President Temer’s coalition directed its efforts to get Congress to approve two ambitious projects of social security and labour reforms before the end of 2017.
The emphasis on structural reforms has also allowed a shift in focus from short-term fiscal adjustments and has made way for the government to propose lower fiscal targets, such as primary deficits above 2 per cent of GDP for 2016 and 2017 (see Table 1). In 2016, for example, the fiscal target accommodated an increase in primary expenditures of 4.5 per cent (see Table 2), even though it was an atypical increase, influenced by the effect of the rule of readjustment of the minimum wage on social benefits, which was driven by 2015’s high inflation, and by the payment of rollovers from previous years.
In other words, a large portion of the growth in expenditures in 2016 was due to the lagged adjustment of inflation or the payment of past debts. The case of public investment illustrates this point well: expenses on an accrual basis decreased by 3.5 per cent in 2016, while those on a cash basis increased by 13.5 per cent due to the payment of rollovers.
More generally, the rate of public investment in Brazil started a downward spiral after reaching its recent historical peak of 4.6 per cent of GDP in 2010, and it has already been cut in half, as demonstrated by the 2.3 per cent of GDP recorded for 2016—the lowest rate in the last two decades.30 It is difficult to accurately determine how much of this decline is due to budgetary constraints, given the eminently discretionary character of investments in such a rigid fiscal framework as the Brazilian one, or due to more general determinants, such as the paralysis of the government bodies during the political crisis that has been affecting the country (Orair 2016). Regardless of its causes, the reduction in public investment—one of the expenditures yielding the highest multiplier effects—is a relevant contributing factor to the low economic dynamism since 2011.

Working Paper18
Finally, it is worth highlighting that the fiscal policy of the Temer administration, even having made the short-term fiscal targets more flexible, continues the strategy of promoting tight fiscal consolidation in the medium and long terms. The new constitutional ceiling for government expenses implies that it will contract at around 4 percentage points of GDP within the decade if GDP resumes its growth of around 2.5 per cent per year. It is a very bold target, if we consider the history and the rigid structure of public expenditure in Brazil. For that very reason, the government is employing a wide set of legislative and constitutional reforms that, if not approved by Congress, will make it unlikely to achieve its targets. In short, the current scenario points towards a long-lasting period of fiscal austerity, and not merely a temporary shift.
5 FINAL REMARKS
This chapter analyses the changes in orientation and composition of Brazilian fiscal policy, focusing on three recent periods and seeking to explore their relationship with economic performance. The first was a sub-period characterised by fiscal expansion (2005–2010), whose fiscal space was channelled mainly towards public investment, in addition to redistributive transfers. Economic performance was extraordinary. During the second sub-period (2011–2014), subsidies played a central role in the fiscal expansion, along with tax cuts on the revenue side. This new fiscal policy mix proved ineffective in preventing the economy from entering a downturn.
The third sub-period (from 2015 onwards) has been characterised by the radical shift in fiscal policy, now driven by the hypothesis of expansionist austerity, and by the worst recession ever recorded in the country’s history. This shift towards austerity started with the fiscal adjustment of 2015, which was coupled in the following year with an expectation that investors’ confidence and economic growth would be regained by furthering liberal structural reforms.
On the one hand, the focus on medium-term structural reforms made way for the government to accommodate more modest fiscal targets in the short term. Indeed, the outcome of the 2015 fiscal adjustment has proved counterproductive, in the sense that fiscal indicators kept deteriorating and the country remained in recession.
On the other hand, the agenda of structural reforms is associated with a set of legislative and constitutional changes that cannot be easily reversed, which implicitly tend to lead to a long-lasting period of fiscal austerity. The main example is the target of the ‘new fiscal regime’, instituted in 2016 through a constitutional amendment to freeze public expenditure ceilings, in real terms, for at least 10 years.
There is no question that the mounting public debt and control over expenditures are real problems that Brazil must face head-on. However, the concrete manifestation of fiscal austerity defended by the current government might introduce unnecessary economic and social risks. First, because there is great uncertainty about the capacity of fiscal austerity, by itself, to promote growth, as has been shown by international debate.31 There are few cases of fiscal consolidations that have apparently led to growth, and even fewer whose starting point was a recession as deep as Brazil’s.32 In most successful experiences, exchange and/or monetary policy helped to compensate for the fiscal contraction, enabling economic growth driven by internal or external demand.33
In the Brazilian case, fiscal austerity is being implemented during the worst recession in its history, coinciding with a period of dire political crisis and social polarisation. This scenario is

International Policy Centre for Inclusive Growth 19
compounded by high credit leveraging by enterprises and consumers after the credit boom of the previous decade, and the expected prolonged international recession, all of which hinder economic recovery driven by private demand.
Given this situation, it does not seem wise to adopt a fiscal regime that greatly restricts fiscal policy, instead of prioritising mid-term fiscal consolidation and supporting short-term demand. It is reasonable to permit, as in the main foreign experiences, some real increase in expenditure, periodic reviews of the expenditure legislation (during every administration, for example) and special treatment for public investment or other social expenses.34
Second, the success of the target of freezing public expenditure in real terms for at least a decade will depend on the approval of a set of structural reforms, interrupting the trajectory of growth of social expenditure—which implies a series of social risks. The new fiscal regime contains changes to the constitutional minimum expenditure on health care and education, and, soon after its approval, an ambitious project for reforming social security was submitted to Congress. These draconian proposals of revisions are not likely to end there, given the target of not allowing any increase in primary expenditure in a country undergoing a rapid demographic transition. This implies pressures on expenditures on pension benefits, and soon it will be necessary to supplement them with new measures such as the detachment of social benefits from the minimum wage or at least the review of the rule that drives the readjustment of the minimum wage.
Therefore, there is a real risk that these reforms will interrupt the late consolidation of a social welfare State in Brazil. This consolidation has been accomplished through a systematic increase in social spending over three decades, and, despite a series of inefficiencies and distortions, it has enabled the construction of a wide range of social benefits and services that have an enormous impact on the well-being of the population, especially the most vulnerable people, in one of the most unequal countries in the world.35
It is no coincidence that Brazil has one of the largest levels of public expenditure among developing countries, with primary expenses at the rate of 34 per cent of GDP, as well as some of the largest levels of coverage of social security and assistance benefits, and of public health and education services. The structural pressure of social expenditure, as we have seen, is mainly responsible for the inertial and rigid behaviour of Brazilian public expenditures, which increased at an average real rate of 4.2 per cent per year at the federal level alone over the past two decades.
Of course, it is unreasonable to expect that these same rates of expansion could be maintained indefinitely, but this does not imply the need to abruptly tether it to the rate of inflation. There are many alternatives for the gradual control of expenditures, while the government gains time to promote wider discussions and evaluations about the budget and its financing structure. As it is now, the new fiscal regime signals a rupture with the social welfare State, instead of making it financially sustainable.
Finally, it is necessary to realise that the current set of proposals for structural adjustment has given the general impression of excessively penalising the poorest population, by refusing to review some fiscal benefits of the richest. An example is the absence of any official proposal to change the structure of income tax to make it more progressive, or of additional measures in the pension reform that would seek to impose additional surcharges on pensions that exceed the maximum wage of civil servants. These measures would help confer greater social legitimacy to the fiscal adjustment and mitigate the distributive conflict.

AN
NEX
TABL
E A
.1Pr
imar
y re
sult
of t
he fe
dera
l gov
ernm
ent—
nom
inal
val
ues
(in B
RL b
illio
ns)
1997
1998
1999
2000
2001
2002
2003
2004
2005
2006
2007
2008
2009
2010
2011
2012
2013
2014
2015
2016
Reve
nue
159.
018
3.5
209.
423
5.1
270.
432
0.1
356.
141
9.0
487.
854
2.8
618.
471
5.6
738.
184
3.7
988.
31.
055.
71.
166.
31.
199.
41.
217.
61.
291.
7
Reve
nue
shar
ing
23.3
26.3
29.8
36.0
42.0
51.8
56.0
62.8
78.7
88.1
99.7
124.
711
6.8
130.
115
9.3
167.
117
7.3
193.
919
8.6
219.
3
Prim
ary
expe
nse
133.
914
9.7
159.
417
8.1
207.
123
7.1
262.
530
7.6
357.
740
6.4
461.
150
7.9
592.
267
9.2
749.
883
0.9
937.
31.
056.
81.
107.
71.
255.
8
Pers
onne
l40
.144
.748
.354
.563
.271
.976
.684
.693
.210
6.6
117.
613
2.4
153.
416
8.4
181.
418
8.4
205.
222
2.4
244.
625
7.9
Soci
al b
enefi
ts52
.159
.064
.972
.484
.110
0.9
123.
014
8.2
173.
119
9.4
226.
224
6.5
282.
532
0.7
357.
540
6.0
461.
151
0.2
552.
564
0.4
Pens
ions
45.5
51.9
57.1
64.3
73.7
86.4
105.
512
5.8
146.
016
5.6
185.
319
9.6
224.
925
4.9
281.
431
6.6
357.
039
4.2
436.
150
7.9
L
OAS
/RM
V2.
32.
73.
03.
54.
35.
16.
17.
59.
311
.614
.216
.018
.922
.525
.229
.533
.938
.642
.549
.0
U
nem
ploy
men
t
ins
uran
ce4.
34.
54.
84.
65.
67.
28.
39.
511
.514
.818
.020
.426
.929
.834
.239
.446
.251
.347
.556
.0
Bol
sa F
amíli
a-
--
-0.
52.
33.
25.
46.
47.
48.
710
.511
.713
.616
.620
.524
.026
.126
.427
.5
Subs
idie
s2.
73.
02.
63.
75.
03.
07.
46.
612
.610
.710
.78.
218
.521
.432
.638
.451
.568
.168
.968
.3
Curr
ent a
nd
capi
tal e
xpen
ses
38.9
43.1
43.6
47.5
54.7
61.4
55.4
68.2
78.8
89.6
106.
612
0.8
137.
816
8.6
178.
319
8.0
219.
625
6.1
241.
728
9.3
I
nves
tmen
ts6.
48.
95.
47.
910
.012
.35.
29.
110
.415
.419
.226
.132
.244
.741
.946
.947
.357
.239
.148
.1
Oth
ers
32.5
34.2
38.2
39.6
44.7
49.1
50.2
59.1
68.4
74.3
87.4
94.6
105.
712
4.0
136.
315
1.1
172.
319
8.9
202.
624
1.2
Prim
ary
resu
lt1.
87.
620
.221
.021
.431
.237
.648
.651
.448
.357
.683
.129
.134
.479
.257
.751
.7(5
1.3)
(88.
7)(1
83.4
)
Mem
o: G
DP95
2.1
1002
.410
87.7
1199
.113
15.8
1488
.817
18.0
1957
.821
70.6
2409
.427
20.3
3109
.833
33.0
3885
.843
76.4
4814
.853
31.6
5779
.060
00.6
6266
.9
Mem
o:
Insti
tute
d ta
x cu
tsn.
d.n.
d.n.
d.n.
d.n.
d.n.
d.n.
d.n.
d.n.
d.9.
07.
153
.634
.127
.723
.461
.876
.310
4.4
108.
691
.4
Mem
o:
Min
imum
wag
e12
0.0
130.
013
6.0
151.
018
0.0
200.
024
0.0
260.
030
0.0
350.
038
0.0
415.
046
5.0
510.
054
5.0
622.
067
8.0
724.
078
8.0
880.
0
Sour
ce: A
utho
rs’ e
labo
ratio
n w
ith u
pdat
ed d
ata
from
Gob
etti
and
Ora
ir (2
017)
.

TABL
E A
.2Pr
imar
y re
sult
of t
he fe
dera
l gov
ernm
ent—
as a
per
cent
age
of G
DP
1997
1998
1999
2000
2001
2002
2003
2004
2005
2006
2007
2008
2009
2010
2011
2012
2013
2014
2015
2016
Reve
nue
16.7
018
.31
19.2
519
.60
20.5
521
.50
20.7
321
.40
22.4
722
.53
22.7
323
.01
22.1
521
.71
22.5
821
.93
21.8
820
.75
20.2
920
.61
Reve
nue
shar
ing
2.45
2.62
2.74
3.00
3.19
3.48
3.26
3.21
3.63
3.66
3.67
4.01
3.51
3.35
3.64
3.47
3.32
3.36
3.31
3.50
Prim
ary
expe
nse
14.0
614
.93
14.6
514
.85
15.7
415
.93
15.2
815
.71
16.4
816
.87
16.9
516
.33
17.7
717
.48
17.1
317
.26
17.5
818
.29
18.4
620
.04
Pers
onne
l4.
224.
464.
444.
554.
804.
834.
464.
324.
294.
434.
324.
264.
604.
334.
153.
913.
853.
854.
084.
11
Soci
al b
enefi
ts5.
485.
885.
976.
046.
406.
787.
167.
577.
988.
288.
327.
938.
488.
258.
178.
438.
658.
839.
2110
.22
Pens
ions
4.78
5.17
5.25
5.36
5.60
5.80
6.14
6.42
6.73
6.87
6.81
6.42
6.75
6.56
6.43
6.58
6.70
6.82
7.27
8.10
LOAS
/RM
V0.
240.
260.
280.
290.
330.
340.
360.
380.
430.
480.
520.
520.
570.
580.
580.
610.
640.
670.
710.
78
Une
mpl
oym
ent i
nsur
ance
0.45
0.44
0.45
0.39
0.43
0.48
0.48
0.49
0.53
0.61
0.66
0.66
0.81
0.77
0.78
0.82
0.87
0.89
0.79
0.89
Bolsa
Fam
ília
0.00
0.00
0.00
0.00
0.04
0.15
0.19
0.28
0.29
0.31
0.32
0.34
0.35
0.35
0.38
0.43
0.45
0.45
0.44
0.44
Subs
idie
s0.
280.
290.
240.
300.
380.
200.
430.
340.
580.
440.
390.
260.
550.
550.
750.
800.
971.
181.
151.
09
Curr
ent a
nd c
apita
l exp
ense
s4.
094.
304.
013.
964.
164.
123.
233.
483.
633.
723.
923.
884.
144.
344.
074.
114.
124.
434.
034.
62
Inve
stm
ents
0.67
0.88
0.50
0.66
0.76
0.82
0.30
0.47
0.48
0.64
0.70
0.84
0.96
1.15
0.96
0.97
0.89
0.99
0.65
0.77
Oth
ers
3.41
3.41
3.51
3.30
3.40
3.30
2.92
3.02
3.15
3.08
3.21
3.04
3.17
3.19
3.12
3.14
3.23
3.44
3.38
3.85
Prim
ary
resu
lt0.
190.
761.
851.
751.
622.
092.
192.
482.
372.
002.
122.
670.
870.
891.
811.
200.
97-0
.89
-1.4
8-2
.93
Sour
ce: A
utho
rs’ e
labo
ratio
n w
ith u
pdat
ed d
ata
from
Gob
etti
and
Ora
ir (2
017)
.

Working Paper22
REFERENCES
Alesina, A., O. Barbiero, C. Favero, F. Giavazzi, and M. Paradisi. 2017. “The Effects of Fiscal Consolidations: Theory and Evidence.” NBER Working Paper No. 23385. Cambridge, MA: National Bureau for Economic Research.
Appy, B., M. Lisboa, M. Mendes, and S. Lazzarini. 2015. “A Rigidez do Gasto Público: Problemas e Soluções.” Interesse Nacional 8(31), Oct–Dec. <http://interessenacional.com/index.php/edicoes-revista/a-rigidez-do-gasto-publico-problemase-solucoes/>. Accessed 20 June 2017.
Barbosa, N. 2013. “Dez anos de política econômica.” In 10 anos de governos pós-neoliberais no Brasil: Lula e Dilma, edited by E. Sader. São Paulo: Boitempo.
Barbosa Filho, F.H. 2017. “A crise econômica de 2014/2017.” Estudos Avançados 31(89): 51–60.
Barbosa Filho, F.H., and S.P. Pessoa. 2014. “Desaceleração recente da economia.” Coletânea de capítulos da agenda Sob a Luz do Sol. São Paulo: Centro de Debates de Políticas Públicas.
Boyer, R. 2012. “The four fallacies of contemporary austerity policies: the lost Keynesian legacy.” Cambridge Journal of Economics 36(1): 283–312.
Castro, J.A., J.A.C. Ribeiro, J.V. Chaves, and B.C. Duarte. 2012. “Gasto Social Federal: prioridade macroeconômica no período 1995–2010.” Nota Técnica No. 9. Brasília: Ipea. <http://www.ipea.gov.br/agencia/images/stories/PDFs/nota_tecnica/120904_notatecnicadisoc09.pdf>. Accessed 20 June 2017.
Dellepiane-Avellaneda, S. 2015. “The Political Power of Economic Ideas: The Case of ‘Expansionary Fiscal Contractions’.” The British Journal of Politics & International Relations 17(3): 391–418.
Dweck, E., and A.R. Teixeira. 2017. “A política fiscal do governo Dilma e a crise econômica.” Texto para Discussão No. 303. Campinas: IE/Unicamp.
Giambiagi, F. 2018. “18 anos de política fiscal no Brasil: 1991/2008.” Economia aplicada 12(4): 535–580.
Giuberti, A.C. 2012. “Instituições orçamentárias e política fiscal no Brasil: governo federal-1965 a 2010.” Doctoral Thesis. São Paulo: Universidade de São Paulo.
Gobetti, S.W. 2014. “Regras fiscais no Brasil e na Europa: um estudo comparativo e propositivo.” Texto para Discussão No. 2018. Rio de Janeiro: Ipea. <http://www.ipea.gov.br/portal/images/stories/PDFs/TDs/td_2018_web.pdf>. Accessed 20 June 2017.
Gobetti, S.W., and B. Schettini. 2010. “Dívida Líquida e Dívida Bruta: uma abordagem integrada para analisar a trajetória eo custo do endividamento brasileiro.” Texto para Discussão No. 1514. Brasília: Ipea. <http://www.ipea.gov.br/portal/images/stories/PDFs/TDs/td_1514.pdf>. Accessed 20 June 2017.
Gobetti, S.W., and R.O. Orair. 2015. “Política fiscal em perspectiva: o ciclo de 16 anos (1999–2014).” Revista de Economia Contemporânea 19(3): 417–447. <http://www.scielo.br/pdf/rec/v19n3/1415-9848-rec-19-03-00417.pdf>. Accessed 20 June 2017.
Gobetti, S.W., and R.O. Orair. 2017. “Resultado Primário e Contabilidade Criativa: reconstruindo as estatísticas fiscais “acima da linha” do governo geral.” Texto para Discussão No. 2218. Brasília: Ipea. <http://www.ipea.gov.br/portal/images/stories/PDFs/TDs/td_2288.pdf>. Accessed 20 June 2017.
Guajardo, J., D. Leigh, and A. Pescatori. 2011. “Expansionary Austerity: New International Evidence.” IMF Working Paper No. 11/158. Washington, DC: International Monetary Fund.

International Policy Centre for Inclusive Growth 23
Hanni, R., M. Martner, and A. Podestá. 2015. “El potencial redistributivo de la fiscalidad en América Latina.” Revista Cepal 116, August.
IBRE. 2005. “Carta do IBRE – Juros reais altos: um enigma repleto de explicações.” Revista Conjuntura Econômica 59(9): 8–10.
IMF. 2016. “World Economic Outlook Database – October.” International Monetary Fund website. <https://www.imf.org/external/pubs/ft/weo/2016/02/weodata/index.aspx>. Accessed 20 June 2017
Ipea. 2009. “PNAD 2008: primeiras análises.” Comunicado da Presidência No. 30. Brasília: Ipea.
Ipea. 2015. “PNAD 2014: breves análises.” Nota Técnica No. 22. Brasília: Ipea.
Jayadev, A., and M. Konczal. 2010. “The Boom Not The Slump: The Right Time For Austerity.” Economics Faculty Publication Series, Paper 26. Boston, MA: University of Massachusetts Boston. <http://scholarworks.umb.edu/econ_faculty_pubs/26>. Accessed 20 June 2017.
Kalecki, M. 1943. “Political Aspects of Full Employment.” The Political Quarterly 14(4): 322–330.
Medeiros, M., P.H. Souza, and F.A. Castro. 2015. “O Topo da Distribuição de Renda no Brasil: primeiras estimativas com dados tributários e comparação com pesquisas domiciliares (2006–2012).” Dados—Revista de Ciências Sociais 58(1): 7–36.
Mesquita, M. 2014. “A política econômica do governo Dilma: a volta do experimentalismo.” Coletânea de capítulos da agenda Sob a Luz do Sol. São Paulo: Centro de Debates de Políticas Públicas.
Ministério da Fazenda. 2015. Reequilíbrio Fiscal e Retomada da Economia. Brasília: Ministério da Fazenda. <http://www.fazenda.gov.br/centrais-de-conteudos/notas-tecnicas/2015/reequilibrio-fiscal-e-retomada-da-economia-1/RETOMADADAECONOMIA_Out2015MF4.pdf>. Accessed 20 June 2017.
Modenesi, A., and R.L. Modenesi. 2012. “Quinze anos de rigidez monetária no Brasil pós-Plano Real: uma agenda de pesquisa.” Revista de Economia Política 32(3): 389–411.
Nóbrega, M. 2016. “Construção e Desmonte das Instituições Fiscais.” In Finanças Públicas: da contabilidade criativa ao resgate da credibilidade, edited by F. Salto and M. Almeida. Rio de Janeiro: Record.
Orair, R.O. 2015. “Desonerações em alta com rigidez da carga tributária: o que explica o paradoxo do decênio 2005-2014?” Texto para Discussão No. 2117. Brasília: Ipea. <http://www.ipea.gov.br/portal/images/stories/PDFs/TDs/td_m2117.pdf>. Accessed 20 June 2017.
Orair, R.O. 2016. “Investimento Público no Brasil: trajetória e relações com o regime fiscal.” Texto para Discussão No. 2215. Brasília: Ipea. <http://www.ipea.gov.br/portal/images/stories/PDFs/TDs/td_2215.pdf>. Accessed 20 June 2017.
Orair, R., and S.W. Gobetti. 2010. “Governo gastador ou transferidor?: um macrodiagnóstico das despesas federais no período de 2002 a 2010.” Brasil em Desenvolvimento: Estado, planejamento e políticas públicas. Brasília: Ipea. <http://www.ipea.gov.br/portal/images/stories/PDFs/livros/livro_bd_vol1.pdf>. Accessed 20 June 2017.
Orair, R.O., S.W. Gobetti, and F.F. Siqueira. 2016. “Política Fiscal e Ciclo Econômico: uma análise baseada em multiplicadores de gasto público.” XXI Prêmio Tesouro Nacional de

Working Paper24
Monografias 2016. Brasília: Secretaria Do Tesouro Nacional. <http://www.esaf.fazenda.gov.br/assuntos/premios/premios-1/premios-viviane-2016/xxi-premio-tesouro-nacional-2016/2o-lugar-rodrigo-octavio-orair-086.pdf>. Accessed 20 June 2017.
Paula, L.F., A.M. Modenesi, and M.C. Pires. 2015. “The tale of the contagion of two crises and policy responses in Brazil: A case of (Keynesian) policy coordination?” Journal of Post Keynesian Economics 37(3): 408–435.
Pellegrini, J.A. 2011. “Dívida Bruta e Ativo do Setor Público: o que a queda da dívida líquida não mostra?” Texto para Discussão No. 95. Brasília: Núcleo de Estudos e Pesquisas do Senado.
Perotti, R. 2011. “The ‘austerity myth’: gain without pain?” NBER Working Paper No. 17571. Cambridge, MA: National Bureau for Economic Research.
Rezende, F., F. Oliveira, and E. Araújo. 2007. O dilema fiscal: remendar ou reformar? Rio de Janeiro: FGV Editora.
Schaechter, A., T. Kinda, N. Budina, and A. Weber. 2012. “Fiscal Rules in Response to the Crisis—Toward the ‘Next Generation’ Rules: A New Dataset.” IMF Working Paper No. 12/187. Washington: International Monetary Fund.
Schettini, B.P., R.R. Gouvea, R. Orair, and S.W. Gobetti. 2011. “Resultado Estrutural e Impulso Fiscal: uma aplicação para as administrações públicas no Brasil – 1997–2010.” Pesquisa e Planejamento Econômico 41: 233–285.
Secretaria do Tesouro Nacional. 2016. “Gasto Social do Governo Central.” Mimeo. Brasília: Secretaria do Tesouro Nacional. <http://www.tesouro.fazenda.gov.br/documents/10180/318974/Gasto+Social+Governo+Central/c4c3d5b6-8791-46fb-b5e9-57a016db24ec>. Accessed 20 June 2017.
Serrano, F., and R. Summa. 2016. “Aggregate demand and the slowdown of Brazilian economic growth in 2011–2014.” Nova Economia 25.
Singer, A. 2012. Os Sentidos do Lulismo: reforma gradual e pacto conservador. São Paulo: Companhia das Letras.
Singer, A. 2015. “Cutucando onças com varas curtas O ensaio desenvolvimentista no primeiro mandato de Dilma Rousseff (2011–2014).” Novos Estudos 102, July.
International Policy Centre for Inclusive Growth 25
NOTES3. The comparisons of international statistics in this text are based on estimates from the IMF database (2016), considering all countries with available data.
4. The period 2003–2005 was named by Barbosa (2013) as the ‘macroeconomic adjustment’, when the initial priority of the Lula administration was to regain fiscal and monetary stability through a series of restrictive measures.
5. Orair (2015) presents a detailed description of these tax cuts and analyses the paradox of a stable tax burden under a preponderance of tax cuts.
6. The growth rates in Table 2 were calculated based on updated data from Gobetti and Orair (2017), who worked meticulously to construct consistent series of the federal government’s revenues and expenditures (for example, adjustments to purge the effects of non-recurring measures). The primary data are presented in Tables A.1 and A.2, in the Annex.
7. Considering updated GDP values.
8. See Orair (2016) for an overview of historical trends in public investment in Brazil.
9. In addition to social benefits, another important pathway of expansion for federal social spending are inter-governmental transfers for complementary financing of basic social policies (mainly education, health care and social assistance), which are executed in a decentralised manner by states and municipalities, as discussed in Orair and Gobetti (2010). At the subnational level, there is greater pressure regarding funding for social services and, especially, personnel costs, because they are labour-intensive services (Gobetti and Orair 2015). Due to the scope of this subject, this chapter’s focus will be restricted to the federal level.
10. According to the data presented in Table A.2 in the Annex. Castro et al. (2012) and Secretaria do Tesouro Nacional (2016) are good references for a more detailed analysis of the evolution of social expenditures in Brazil, and Giuberti (2012) for a longer-term historical perspective.
11. For instance, Resende, Araújo and Oliveira (2007), Giambiagi (2008), Orair and Gobetti (2010), Barbosa Filho and Pessoa (2014), Appy et al. (2015) and Gobetti and Orair (2015) place special emphasis on social spending in their analysis of Brazilian public finances.
12. In 2014, the minimum wage value (BRL724 per month, or roughly USD268) was paid to nearly all 14.3 million beneficiaries of rural pensions and as salary bonuses for low-income labourers and assistance for people with disabilities and poor elderly people, in addition to 43 per cent of the 18.7 million benefits paid by urban social security and a considerable portion of the 8.2 million beneficiaries of unemployment insurance. The main exception is the Bolsa Família conditional cash transfer programme, with an average benefit of BRL170 (USD63) granted to 13.7 million households.
13. Note, therefore, that expenditures increased substantially through two mechanisms—the amount of benefits and the average value of the benefit—totalling a rate of expansion that was quite above GDP. According to Orair and Gobetti (2010), the direct effect of the minimum wage is responsible for 40 per cent of the growth in total expenditure on social benefits between 2004 and 2010, while the effect of the Bolsa Família is close to 10 per cent. In terms of the impacts on inequality, Ipea (2009) presents analysis showing that almost half of the fall in the Gini Index between 2001 and 2008 was due to the effects of the indexation of the minimum wage on the labour market and on pensions (28 per cent) and assistance benefits (18 per cent, including Bolsa Família).
14. As Singer (2012) well put it, Lula’s policy was always to ‘appease both sides’, promoting a very slow process of social inclusion and reforms which would allow for the redistribution of income without exacerbating class conflict—a ‘weak reformism’, in his own words.
15. Barbosa (2013) and Paula et al. (2015) go into the details of these anticyclical policies.
16. It is important to note that the macroeconomic strategy and interpretations of Dilma’s staff mix orthodox and heterodox theoretical assumptions in a unique and controversial way. For further details and a critical assessment of these theoretical assumptions, see Serrano and Summa (2016). Paula, Modenesi and Pires (2015) and Dweck and Teixeira (2017) also explore the motivations and dilemmas of the macroeconomic strategy, and Singer (2015) deals with it from a political science point of view.
17. Basically, the National Treasury would issue government bonds and transfer the funds to the Brazilian Development Bank (BNDES) so that the bank could loan them to the private sector. As the interest rates paid by the National Treasury on these bonds were higher than the interest rates received by the BNDES, there was an implicit subsidy, which did not affect the primary surplus but, instead, affected the net nominal interest. We will return to this theme in the next section.
18. See Table A.1 in the Annex.
19. Schettini et al. (2011), Orair (2016) and Gobetti and Orair (2017) present the concept and a more detailed analysis of the non-recurring measures and of the changes in deduction margins.
20. Orair (2016) explores the causes behind the stagnation of public investments, which, in addition to the reorientation of the government’s strategy and the stricter budget restrictions, must be considered. These include institutional bottlenecks and government stalling due to political instability since 2013, and allegations of irregularities.

Working Paper26
21. This common criticism of the fiscal policy will be further addressed in Section 4.
22. For a deeper view of the management of the public debt, see Gobetti and Schettini (2010) and Pellegrini (2011).
23. The implicit average interest rates for public liabilities between 2004 and 2014 were 10.7 per cent per year, which is almost double that of the average inflation rate per year (5.5 per cent), and considerably higher than the 5.9 per cent and 1.8 per cent interest for credit from public banks and international reserves, respectively.
24. For instance, IBRE (2005) and Modenesi and Modenesi (2012) attempt to list a wide range of explanations for the high interest rates in Brazil and to assess the adequacy of each one of them through, respectively, an orthodox and a heterodox lens.
25. Using some simplified hypotheses not too dissimilar to the Brazilian situation, one can demonstrate that the primary surplus required to stabilise the net debt as a proportion of GDP will be: , with being the difference between the real implicit rate of interest for the gross debt and the rate of GDP growth, and representing the level of gross debt in the previous period.
26. See Barbosa Filho and Pessoa (2014), Mesquita (2014), Nóbrega (2016) and Barbosa Filho (2017) for orthodox critiques of the fiscal policy. Serrano and Summa (2016) present a divergent thesis but also provide criticisms from a heterodox standpoint.
27. The indicators of poverty and inequality based on household surveys have shown a decreasing tendency over the decade between 2005 and 2014, due to the more accelerated growth of income at the bottom of the income distribution, as demonstrated by Ipea (2015). However, recent studies such as Medeiros et al. (2015), based on personal income tax declarations, which incorporate more accurate information about the income of the richest population, show that the income concentration at the top of the distribution has changed little since 2006.
28. Singer (2015) and Dweck and Teixeira (2017) discuss the political basis, the elite’s resistance and the popular support for the PT administrations.
29. The official document from the Ministry of Finance (2015) details the fiscal diagnostic and strategy pursued.
30. Considering the total amounts invested by the central and subnational governments, and by federal state companies.
31. See Jayadev and Konczal (2010) and Boyer (2012) for criticism of the ‘austerity myth’. Recently, Alesina et al. (2017) recognised that fiscal consolidations have recessionary effects that might be mitigated depending on the profile and persistence of fiscal adjustments.
32. Ireland in 1987 is probably the best-known case reported by the literature of a country in a soft recession before consolidation (-0.5 per cent GDP growth) that has had economic growth after it, driven mainly by exports.
33. Even though endogeneity problems, besides difficulties in isolating discretionary efforts, avoid precise estimations of the fiscal multipliers, as shown by Guajardo et al. (2011) and by Perotti (2011).
34. European Union countries usually limit the evolution of expenditure by the mid-term growth of potential GDP and allow for deviations from fiscal targets (cyclically adjusted) during recessions (Schaechter et al. 2012; Gobetti 2014).
35. According to Hanni, Martner and Podestá (2015), the redistributive impact of the fiscal policy in Brazil is the highest among Latin American countries, reducing the Gini coefficient by 7.1 percentage points, mainly due to the effect of public transfers.


International Policy Centre for Inclusive Growth (IPC-IG)
SBS, Quadra 1, Bloco J, Ed. BNDES, 13º andar70076-900 Brasília, DF - BrazilTelephone: +55 61 2105 5000
[email protected] ■ www.ipcig.org