working paper - ipc-ig
TRANSCRIPT

working paper number 134october, 2015
ISSN 1812-108x
W O R K I N GP A P E R
Scale of Institutional Public Procurementof Food in Brazil
Rovane Battaglin Schwengber, International Policy Centre for Inclusive Growth (IPC-IG/UNDP)
Eduardo Pontual Ribeiro, Federal University of Rio de Janeiro (UFRJ)
Fábio Veras Soares, International Policy Centre for Inclusive Growth (IPC-IG/UNDP)
Rodrigo Octávio Orair, Institute for Applied Economic Research (Ipea)

Copyright© 2015International Policy Centre for Inclusive Growth United Nations Development Programme
The International Policy Centre for Inclusive Growth is jointly supported by theUnited Nations Development Programme and the Government of Brazil.
Rights and Permissions
All rights reserved.
The text and data in this publication may be reproduced as long as the source is cited.Reproductions for commercial purposes are forbidden.
International Policy Centre for Inclusive Growth (IPC - IG)United Nations Development Programme
SBS, Quadra 1, Bloco J, Ed. BNDES, 13º andar70076-900 Brasilia, DF - BrazilTelephone: +55 61 21055000
[email protected] www.ipc-undp.org
The International Policy Centre for Inclusive Growth disseminates the �ndings of its workin progress to encourage the exchange of ideas about development issues. The papers aresigned by the authors and should be cited accordingly. The �ndings, interpretations, andconclusions that they express are those of the authors and not necessarily those of theUnited Nations Development Programme or the Government of Brazil.
Working Papers are available online at www.ipc-undp.org and subscriptions can be requestedby email to [email protected]
Print ISSN: 1812-108X


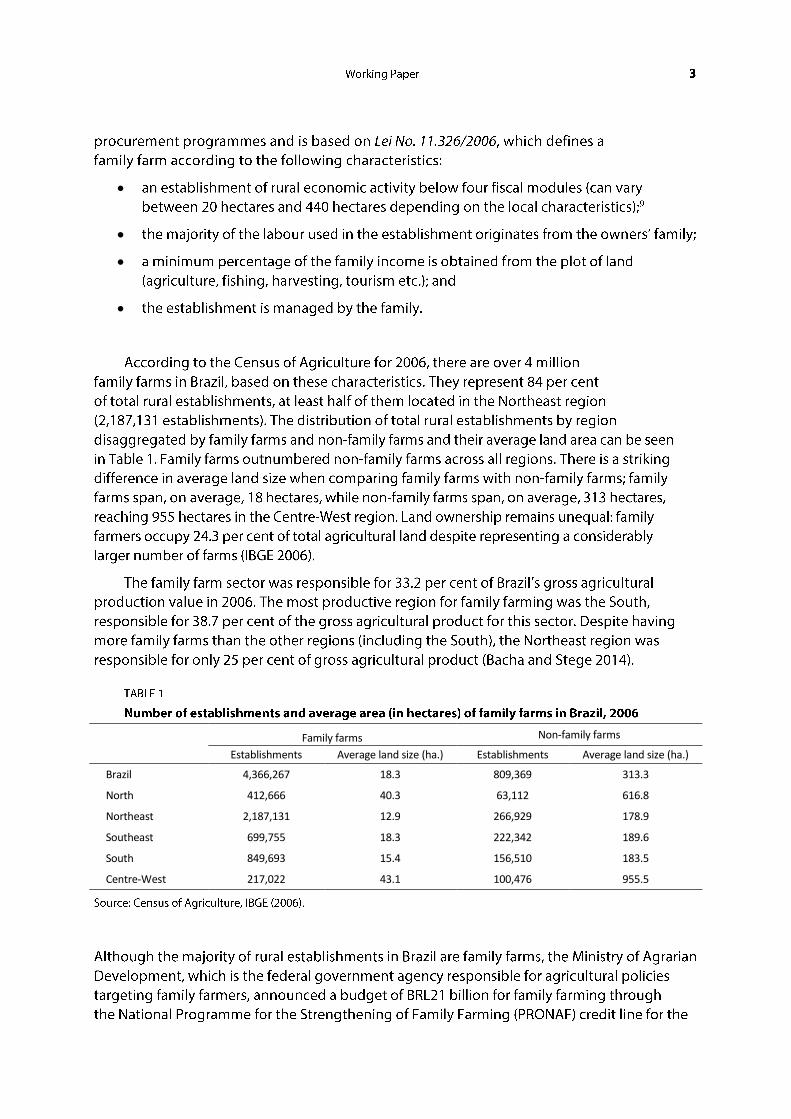
Family farms Non-family farms
Establishments Average land size (ha.) Establishments Average land size (ha.)
Brazil 4,366,267 18.3 809,369 313.3
North 412,666 40.3 63,112 616.8
Northeast 2,187,131 12.9 266,929 178.9
Southeast 699,755 18.3 222,342 189.6
South 849,693 15.4 156,510 183.5
Centre-West 217,022 43.1 100,476 955.5
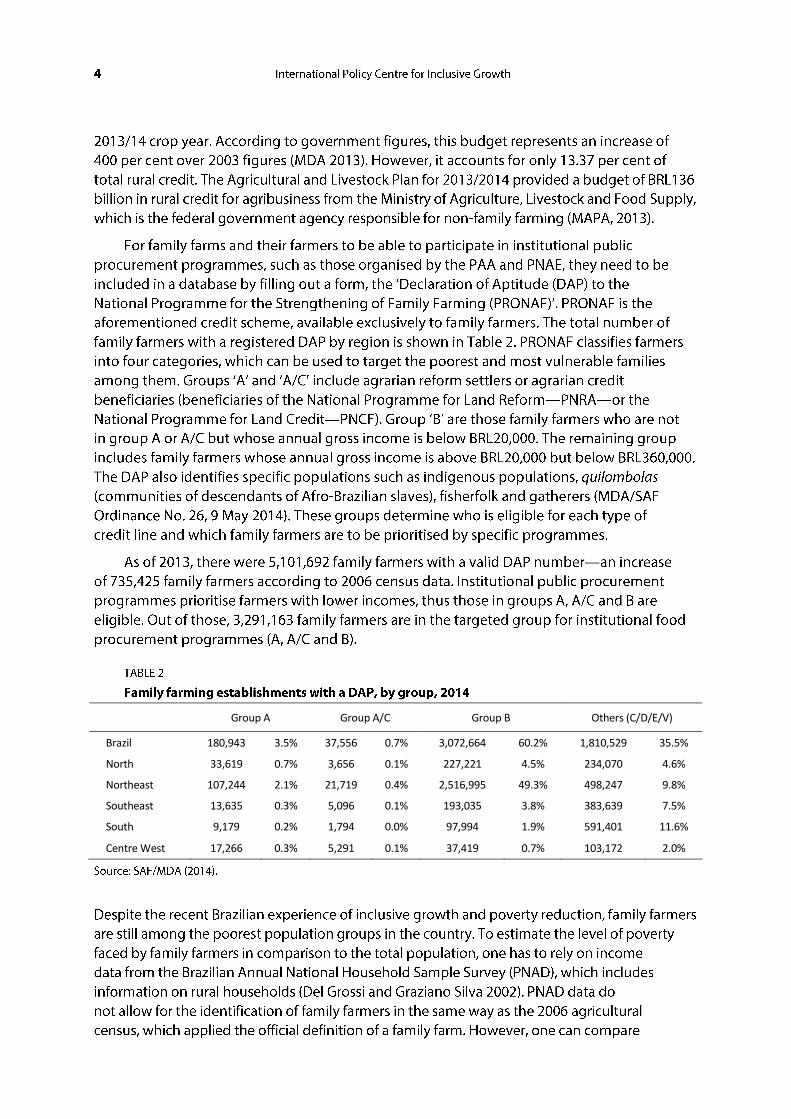
Group A Group A/C Group B Others (C/D/E/V)
Brazil 180,943 3.5% 37,556 0.7% 3,072,664 60.2% 1,810,529 35.5%
North 33,619 0.7% 3,656 0.1% 227,221 4.5% 234,070 4.6%
Northeast 107,244 2.1% 21,719 0.4% 2,516,995 49.3% 498,247 9.8%
Southeast 13,635 0.3% 5,096 0.1% 193,035 3.8% 383,639 7.5%
South 9,179 0.2% 1,794 0.0% 97,994 1.9% 591,401 11.6%
Centre West 17,266 0.3% 5,291 0.1% 37,419 0.7% 103,172 2.0%

10
Total population Rural population
Household head’s occupation in agriculture
Year Poor Extremely poor Poor Extremely poor Poor Extremely poor
2006 17.3% 5.8% 37.9% 15.1% 44.2% 19.3%
2009 13.5% 4.7% 29.6% 11.5% 35.6% 14.7%
2011 11.0% 4.4% 27.5% 11.3% 33.0% 13.4%
2013 9.0% 4.0% 22.9% 9.2% 28.3% 11.4%

11
Year PAA PNAE Total
BRL nominal USD PPP BRL nominal USD PPP BRL nominal USD PPP
2011 699 475 235 160 934 635
2012 847 542 366 234 1,214 776
2013 466 283 564 342 1,030 625
Total 2,012 1,300 1,165 736 3,178 2,036


Year
Financial resources (in millions)
Nominal BRL USD PPP
2003 145 149
2004 180 174
2005 333 306
2006 492 440
2007 461 392
2008 509 407
2009 591 454
2010 681 491
2011 699 475
2012 847 542
2013 466 283

Modality Description
Yearly limit
Implementer Type of access Price Family farmers Organisation
Purchase for simultaneous donation
Purchase of food from local family farmers to donate to institutions or entities in the social assistance network
BRL6,500 (BRL8,000 when sold through an
organisation)
BRL2 million Conab,
states and municipalities
Individuals, cooperatives/ associations or informal groups**
Average of 3 prices in local or regional wholesale
market over the last 12 months
Incentive for the production and consumption of milk (PAA-Milk)
Purchase of milk for donation to families at risk of food insecurity in the semi-arid region
BRL8,000 (BRL4,000 per
semester)
Not applicable
States in the semi-arid
region
Individuals, cooperatives/a
ssociations
Averaging the prices paid to farmers over the last 3 months in each state
Direct purchase
Purchase of a list of products/produce to sustain price; an important role in the regulation of prices and supply
BRL8,000 BRL0.5 million
Conab
Individuals, cooperatives/associations or informal
groups
Conab’s reference price
Stock formation
Financial support for stock formation of producers’ organisations; provide tools to support commercialisation
BRL8,000 BRL1.5 million
Conab Cooperatives/ associations
Conab’s reference price
Institutional purchase
At least 30 per cent of public institutions’ resources destined for the purchase of foodstuffs must be spent on produce from family farmers
BRL20,000 per institution
BRL6 million per
institution
Federal government,
states and municipalities
Cooperatives/associations
Call for proposals based on price research (minimum 3)
in the local or regional market or PNAE’s reference price
Purchase of seeds
Purchase of non-genetically modified seeds and seedlings for donation
BRL16,000 BRL6 million
per organisation
Conab Cooperatives/associations
Average of 3 price quotes in the local regional market for
similar seeds, considering logistical costs


Year Financial resources (in the millions)
Nominal BRL USD PPP
2003 954.2 979
2004 1,025 991
2005 1,266 1,165
2006 1,500 1,342
2007 1,520 1,294
2008 1,490 1,191
2009 2,013 1,545
2010 3,034 2,188
2011 3,051 2,074
2012 3,306 2,116
2013 3,539 2,146


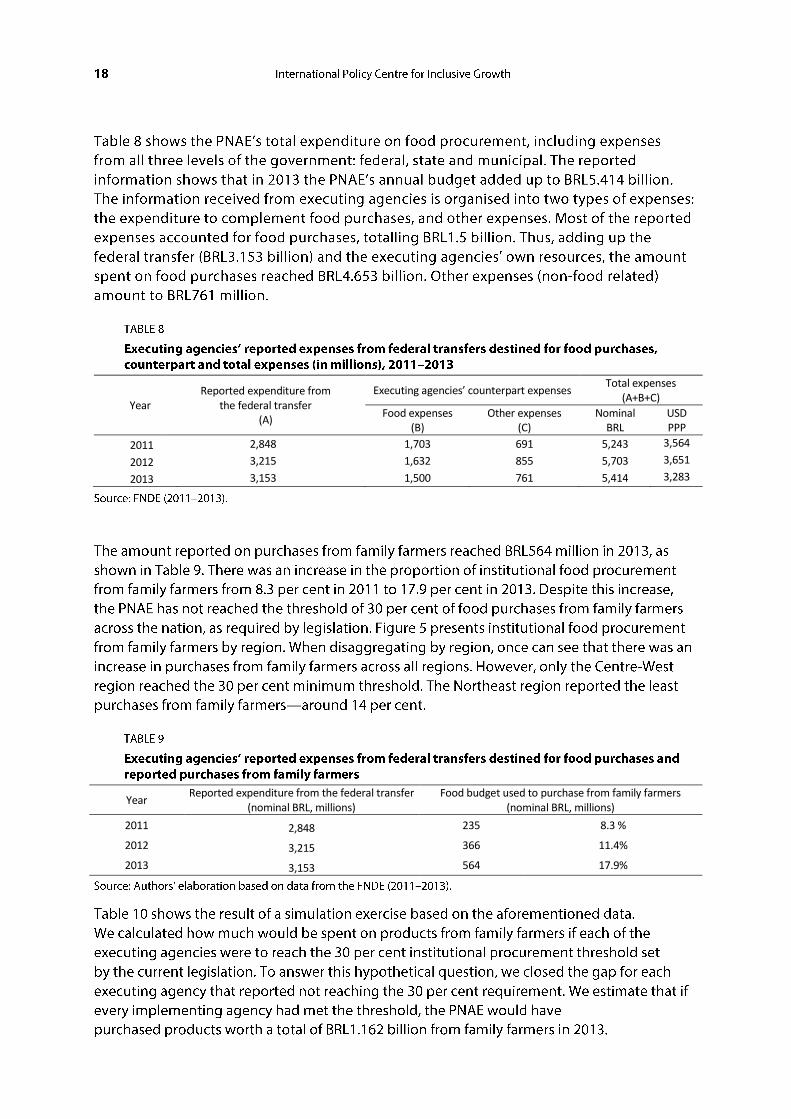
Year Reported expenditure from
the federal transfer (A)
Executing agencies’ counterpart expenses Total expenses
(A+B+C)
Food expenses (B)
Other expenses (C)
Nominal BRL
USD PPP
2011 2,848 1,703 691 5,243 3,564
2012 3,215 1,632 855 5,703 3,651
2013 3,153 1,500 761 5,414 3,283
Year Reported expenditure from the federal transfer
(nominal BRL, millions) Food budget used to purchase from family farmers
(nominal BRL, millions)
2011 2,848 235 8.3 %
2012 3,215 366 11.4%
2013 3,153 564 17.9%

Year Purchases from family farmers
(nominal BRL, millions) If the 30 per cent threshold
had been met (BRL, millions)
2011 235 941
2012 366 1,036
2013 564 1,162


Year Total domestic agricultural
purchases (BRL millions) Total domestic agricultural output
(BRL millions) Share
2003 2,286.5 194,432.3 1.18%
2004 2,471.8 214,523.7 1.15%
2005 2,766.6 207,947.5 1.33%
2006 2,920.9 213,151.8 1.37%
2007 3,387.7 244,915.0 1.38%
2008 4,048.8 305,367.3 1.33%
2009 4,109.6 301,049.1 1.37%
Year Total food purchases Total domestic food output Share
2003 3,970.60 292,568.32 1.36%
2004 4,365.08 335,466.09 1.30%
2005 5,226.21 355,324.42 1.47%
2006 5,745.21 377,927.82 1.52%
2007 6,367.03 420,073.68 1.52%
2008 7,322.72 492,849.66 1.49%
2009 7,808.69 524,846.67 1.49%

Year Direct domestic purchases from food industry
Direct domestic purchases from
agriculture
Indirect domestic purchases from
agriculture
Total domestic purchases from agriculture
(A) (B) (C) (B)+(C)
2003 3,970.6 295.8 1,990.7 2,286.5
2004 4,365.1 330.2 2,141.6 2,471.8
2005 5,226.2 389.6 2,377.1 2,766.6
2006 5,745.2 438.5 2,482.4 2,920.9
2007 6,367.0 498.9 2,888.8 3,387.7
2008 7,322.7 589.9 3,458.9 4,048.8
2009 7,808.7 650.3 3,459.2 4,109.6
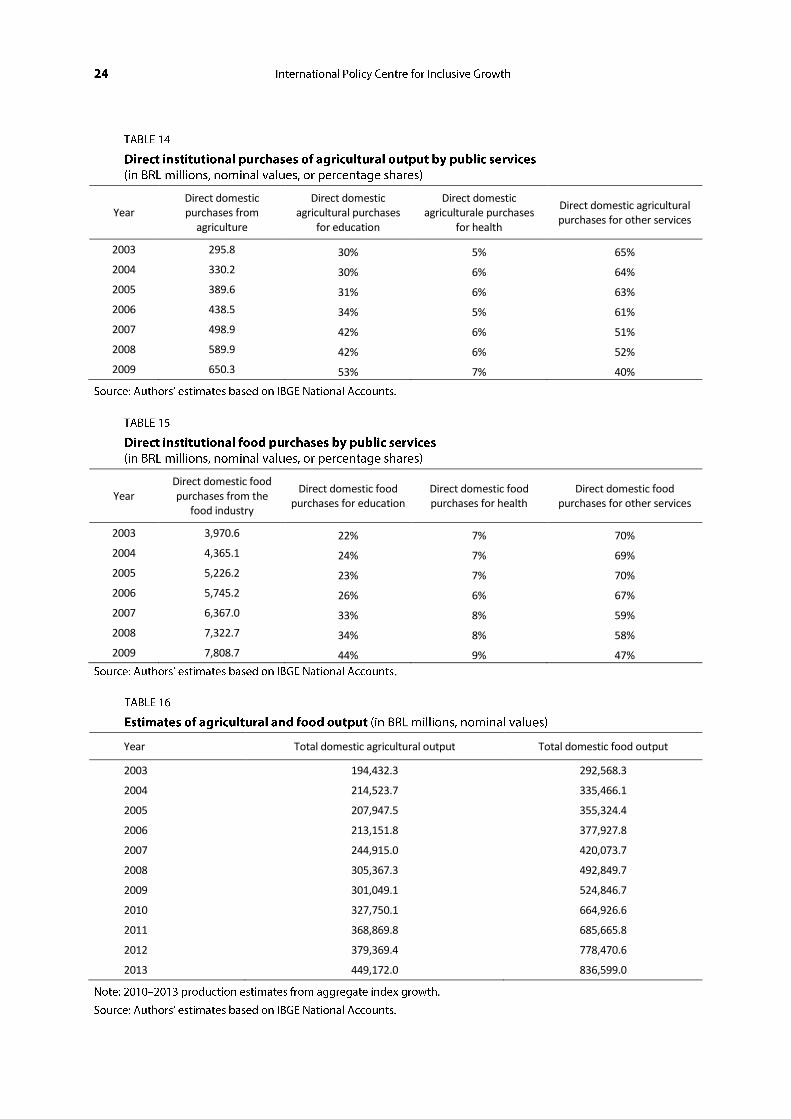
Year Direct domestic purchases from
agriculture
Direct domestic agricultural purchases
for education
Direct domestic agriculturale purchases
for health
Direct domestic agricultural purchases for other services
2003 295.8 30% 5% 65%
2004 330.2 30% 6% 64%
2005 389.6 31% 6% 63%
2006 438.5 34% 5% 61%
2007 498.9 42% 6% 51%
2008 589.9 42% 6% 52%
2009 650.3 53% 7% 40%
Year Direct domestic food purchases from the
food industry
Direct domestic food purchases for education
Direct domestic food purchases for health
Direct domestic food purchases for other services
2003 3,970.6 22% 7% 70%
2004 4,365.1 24% 7% 69%
2005 5,226.2 23% 7% 70%
2006 5,745.2 26% 6% 67%
2007 6,367.0 33% 8% 59%
2008 7,322.7 34% 8% 58%
2009 7,808.7 44% 9% 47%
.
Year Total domestic agricultural output Total domestic food output
2003 194,432.3 292,568.3
2004 214,523.7 335,466.1
2005 207,947.5 355,324.4
2006 213,151.8 377,927.8
2007 244,915.0 420,073.7
2008 305,367.3 492,849.7
2009 301,049.1 524,846.7
2010 327,750.1 664,926.6
2011 368,869.8 685,665.8
2012 379,369.4 778,470.6
2013 449,172.0 836,599.0

Year Total agricultural purchases Total food purchases
Nominal BRL USD PPP Nominal BRL USD PPP
2003 2,286.5 2,345.7 3,970.6 4,073.4
2004 2,471.8 2,389.3 4,365.1 4,219.3
2005 2,766.6 2,545.7 5,226.2 4,809.0
2006 2,920.9 2,614.2 5,745.2 5,141.9
2007 3,387.7 2,883.3 6,367.0 5,419.0
2008 4,048.8 3,236.2 7,322.7 5,853.1
2009 4,109.6 3,155.1 7,808.7 5,995.0
2010 4,474.1 3,226.3 9,892.8 7,133.8
2011 5,035.4 3,422.9 10,201.4 6,934.7
2012 5,178.7 3,314.9 11,582.1 7,413.8
2013 6,131.6 3,718.0 12,446.9 7,547.5

Year Direct agricultural purchases Direct food purchases
Nominal BRL USD PPP Nominal BRL USD PPP
2003 87.3 89.6 899.5 922.8
2004 99.1 95.8 1,011.7 977.9
2005 119.1 109.6 1,212.0 1,115.2
2006 150.1 134.3 1,515.1 1,356.0
2007 210.7 179.3 2,127.8 1,811.0
2008 246 196.6 2,466.4 1,971.4
2009 345.9 265.6 3,456.7 2,653.8
2010 376.6 271.6 4,379.3 3,157.9
2011 423.8 288.1 4,515.9 3,069.8
2012 435.9 279.0 5,127.2 3,281.9
2013 516.1 312.9 5,510.0 3,341.1
Year Direct agricultural purchases Direct food purchases
Nominal BRL USD PPP Nominal BRL USD PPP
2003 14.5 14.9 266.4 273.3
2004 20.3 19.6 324.7 313.9
2005 23.2 21.3 376.7 346.6
2006 22.3 20.0 364.4 326.1
2007 31.9 27.2 505.0 429.8
2008 37.7 30.1 608.1 486.1
2009 44.5 34.2 706.0 542.0
2010 48.5 35.0 894.4 645.0
2011 54.6 37.1 922.3 627.0
2012 56.1 35.9 1,047.1 670.3
2013 66.4 40.3 1,125.3 682.4

Year Direct domestic purchases
from agriculture Indirect domestic purchases
from agriculture Total domestic
agriculture purchases
(A) (B) (C)
2003 295.77 1,990.7 2,286.5
2004 330.24 2,141.6 2,471.8
2005 389.55 2,377.1 2,766.6
2006 438.49 2,482.4 2,920.9
2007 498.91 2,888.8 3,387.7
2008 589.90 3,458.9 4,048.8
2009 650.34 3,459.2 4,109.6
2010 708.02 3,766.0 4,474.1
2011 796.84 4,238.5 5,035.4
2012 819.53 4,359.2 5,178.7
2013 970.32 5,161.2 6,131.6


DGP=ij CIij + i Gi (1)

DDGP=ij CIij(1-mi) + i Gi(1-mi) (2)
DIGP=i ãifoodDDGPfood , (3)


International Policy Centre for Inclusive Growth (IPC - IG)United Nations Development Programme
SBS, Quadra 1, Bloco J, Ed. BNDES, 13º andar
70076-900 Brasilia, DF - BrazilTelephone: +55 61 2105 5000
E-mail: [email protected] URL: www.ipc-undp.org