working paper no. 42 2008 - in titut za ekonomska ... paper-42.pdf · working paper no. 42 2008....
TRANSCRIPT

DOES INTERNATIONAL OPENNESS AFFECT PRODUCTIVITY OF LOCAL FORMS?
EVIDENCE FROM SOUTHERN EUROPE
Jože P. Damijan, Jose de Sousa and Olivier Lamotte
WORKING PAPER No. 42 2008

DOES INTERNATIONAL OPENNESS AFECT PRODUCTIVITY OF LOCAL FIRMS?
EVIDENCE FROM SOUTHERN EUROPE1
Jože P. Damijan2
Jose de Sousa3
Olivier Lamotte4
WORKING PAPER No. 42 2008
Editor of the WP series: Boris Majcen
© 2008 Institute for Economic Research
Ljubljana, December 2008
1 We gratefully acknowledge financial support of Global Development Network. We would like to thank the
editor and the anonymous referee for offering very constructive and helpful suggestions. We also thank Mario Holzner, Michael Landesmann, Jeffrey Reimer, T. N. Srinivasan, Robert Stehrer, and the participants at two GDN-WIIW workshops in Vienna, at the University of Orleans and at the Global Development Network Conference in Beijing for helpful comments. The usual disclaimer applies.
2 University of Ljubljana (Faculty of Economics); Vienna University of Economics and Business Administration; Institute for Economic Research, Ljubljana; LICOS, KU Leuven, Belgium. e-mail: [email protected]
3 CREM, University of Rennes 1 & 2 and CES University of Paris 1, 106-112 boulevard de l’Hôpital, Paris, France. E-mail: [email protected]
4 ESG Paris, 25 rue Saint-Ambroise, Paris, France. E-mail: [email protected]

CIP - Kataložni zapis o publikaciji Narodna in univerzitetna knjižnica, Ljubljana 330.342.1 PAVLIČ Damijan, Jože Does international openess affect productivity of local firms? : evidence from southern Europe / Jože P. Damijan, Jose de Sousa, Olivier Lamotte. - Ljubljana : Institute for Economic Research, 2008. - (Working paper / Inštitut za ekonomska raziskovanja, ISSN 1581-8063 ; 2008, 42) ISBN 978-961-6543-63-7 1. Sousa, Jose de 2. Lamotte, Olivier 243320832

Abstract
This paper examines the role of international openness on the change of firm productivity in Southeastern Europe (SEE). This is a crucial question for middle income countries. Using firm-level data for six transition economies over the period 1994-2002, we identify whether foreign ownership and propensity to trade with more advanced countries can bring about higher learning effects. We find that (i) foreign ownership has helped at restructuring and enhancing productivity of local firms in four out of six countries, (ii) exporting to advanced markets has a larger impact on productivity growth in four countries, especially when firm’s absorptive capacity is taken into account, (iii) in contrast, exporting to the less competitive markets of ex-Yugoslavia seems to affect negatively the productivity growth in three countries, and (iv) learning effects from importing follow a similar path than exporting. Our results suggest that trade liberalisation is not uniformly beneficial. Regional composition of trade flows and absorptive capacity of local firms matter. Trade liberalisation within the SEE region thus may not provide a substitute for a general trade liberalisation and access to the more competitive markets of OECD countries. Keywords: trade liberalisation, international trade, foreign ownership, total factor
productivity, transition economies JEL classification: F14, D24, L25.

1 Introduction
Southeastern Europe (SEE) represents one of the poorest region in Europe,1
with an average real GDP per capita of 2,760 US$ in 2006, representing 13% of the
eurozone average.2 However, with an average real GDP per capita growth rate of
5% per annum, the region is slowly recovering from the war episodes and the drastic
output falls of the 1990s. In the meantime, SEE countries have engaged in a recent
worldwide integration process, through the joining of the World Trade Organization
(WTO),3 the joining of the European Union (EU)4 and the establishment of bilat-
eral and multilateral free trade agreements.5 This integration process echoes the
current globalization with its two key drivers: cross-border trade and cross-border
investment. As a result, inflows of foreign direct investment (FDI) and exports of
goods and services of SEE countries more than doubled between 2000 and 2005.
An obvious question is posed: does a link exist between this international openness
and recent rapid growth in the region? We attempt to answer this question at the
microeconomic level by investigating the link between international openness and
performances of local firms.
International openness may affect firm productivity through various channels.
International trade is a first obvious channel of technology transfer, in particular
through imports of intermediate products and capital equipment (Markusen, 1989;
Grossman and Helpman, 1991; Feenstra, Markusen and Zeile, 1992) and exports1According to the World Bank, SEE includes 3 low middle income countries (Albania, Bosnia-
Herzegovina and Macedonia), 4 up middle income countries (Bulgaria, Croatia, Roumania andSerbia-Montenegro) and one high income country (Slovenia).
2Authors’ calculations using data from the World Development Indicators (World Bank). If wedrop Slovenia, the highest income country in SEE, the average GDP per capita falls to about 2,400constant 2000 US$.
3As of January 2008, all SEE countries are WTO members except Bosnia-Herzegovina andSerbia-Montenegro which are under negotiation as “observer governments”. For more details seeTable 8 in Appendix and http://www.wto.org.
4Slovenia joined the EU the 1st of May 2004 and adopted the euro the 1st of January 2007.Bulgaria and Romania joined the EU the 1st of January 2007, after the establishment of cooperationand association agreements aimed at creating a free trade area. The other SEE countries signedStabilization and Association agreements with the EU since 2001 except Bosnia-Herzegovina andSerbia-Montenegro which are still under negotiation. They are official (Croatia and Macedonia) orpotential (Albania, Bosnia-Herzegovina and Serbia-Montenegro) candidate member states.
5A regional economic integration process has emerged within the framework of the Central Eu-ropean Free Trade Agreement (CEFTA) and various bilateral trade agreements entered in force atthe beginning of the 2000s. For more details see Table 9 in appendix and the list of trade agreementsnotified to the GATT/WTO: http://www.wto.org/english/tratop_e/region_e/summary_e.xls.
2

into industrial countries (Clerides et al., 1998). In both cases the geographic desti-
nation of trade flows is extremely important. Firms exporting to advanced markets
can learn more due to the higher quality, technical, safety and other standard re-
quirements as well as tougher competition (and lower markups). Similarly, firms
importing capital and intermediate inputs from more advanced markets have to
meet according technical standards to use the advanced western technology. Hence,
higher propensity to trade with more advanced countries may obviously result in
higher level of productivity and faster total factor productivity (hereafter TFP)
growth.
The microeconomics of transition offers rather mixed evidence about the role
of international trade as a determinant of firm productivity growth. Djankov and
Hoekman (1998) investigate the initial post-reform period (1991-95) in Bulgaria.
They find that exports and imports are important sources of TFP growth at the
level of the firm. However, they do not control for the self-selection of the most
productive firms in international trade. Controlling for selection sample, Halpern et
al. (2005) find that imports have a statistically significant and large effect on firm
productivity in Hungary over the period 1992-2003. In the export side, a robust
evidence is the self-selection of the most productive firms in export markets.6 Less
conclusive is the learning-by-exporting effect. The study of a panel of Slovenian
firms from 1994 to 2000 offers a striking controversy. De Loecker (2006) documents
that firms learn from exporting. However, Damijan and Kostevc (2006) qualify this
result. They find that productivity improvements, although present, are far from
permanent and tend to dissipate shortly after initial entry on the export market.
A second obvious channel of external knowledge spillovers is the form of owner-
ship, foreign vs. domestic. An exhaustive line of research has been conducted on
different effects of foreign ownership on firm performance. Firms that are foreign
owned are expected to be better managed and governed, to have access to up-to-date
technology and business links of the parent firm. All this taken together may result
in higher performance of foreign owned firms in terms of higher level and growth of
productivity and higher wages. However, the literature highlights that the presence6See Greenaway and Kneller (2007) for a comprehensive survey.
3

of foreign owned firms may also generate adverse effects by driving domestic firms
out of the market.
A bunch of empirical studies on transition economies address the question of
the performance of foreign vs. domestic ownership and document mixed evidence.
Foreign investment has a positive impact on TFP growth of recipient firms in the
initial post-reform period in Czech Republic (1992-96: Djankov and Hoekman, 2000;
1994-98: Damijan et al., 2003), Poland (1993-97: Konings, 2000; 1994-98: Damijan
et al., 2003) as well as in Estonia and Slovenia (Damijan et al., 2003). These
findings are robust to corrections for the sample selection bias that arises because
foreign investors tend to invest in domestic firms with above-average productivity.
However, foreign firms do not seem to perform better than domestic firms in Bulgaria
(Konings, 2000; Damijan et al., 2003), Hungary and Slovakia (Damijan et al., 2003).
Romania even offers conflicting results: no effect in Konings (2000) and a positive
one in Damijan et al. (2003). Evidence of spillovers of foreign affiliates to other firms
within industries (horizontal spillovers) and across industries (vertical spillovers) is
ambiguous. The literature in transition economies finds no or negative horizontal
spillovers (Djankov and Hoekman, 2000; Konings, 2000; Damijan et al., 2003) due to
a competition effect which drives local firms out of the market. In contrast, recent
papers find convincing evidence of positive vertical spillovers (Schoors and van der
Tol, 2002; Javorcik, 2004; Merlevede and Schoors, 2006; Gorodnichenko et al., 2007).
This paper participates in the ongoing debate over the microeconomics of tran-
sition. In particular, we are interested in what extent both foreign trade flows and
foreign investments contributed to improvements in firm performance in Southeast-
ern Europe. In that way, we assess the crucial relationship between international
openness and firm productivity growth of middle income countries. Former studies
have generally focussed on more advanced transition economies, on one channel at
a time or/and on the initial post-reform period. We perform our analysis by using
firm level data matched with bilateral trade flows (exports and imports) for 6 SEE
countries over the period 1994-2002. The impact of foreign ownership and trade
reliance on firm performance, measured with total factor productivity (TFP), is es-
timated with different panel data techniques and a control for potential selection
4

bias. We lack appropriate firm level data to investigate the indirect spillover effects
of foreign capital on other firms.7 However, using a longer period of time, we have
more hindsight to analyze the direct effects of trade reorientation and foreign own-
ership. Indeed, ownership effects may take time to have an impact on performance
due to lags in restructuring (Konings, 2000).
We do not find a clear link between international openness and firm performance.
The effects vary across countries and channels. Considering the trade channel, we
find in Slovenia and Romania that exporting to advanced countries provides larger
learning effects than exporting to less advanced markets. In Bulgaria, we find that
positive spillovers from exporting to the advanced EU-15 markets benefit only firms
with higher absorptive capacity. In Croatia, positive spillovers for firms with higher
absorptive capacity stem from the rest of OECD countries, but not from the EU-15
countries. On the other hand, exporting to less competitive markets of ex-Yugoslavia
seems to affect negatively the productivity growth of firms in Bulgaria, Croatia and
Romania. Similar results are found for importing links.
Considering the FDI channel, we also find contrasting results on the impact on
foreign ownership on TFP growth. Four out of six countries (Bosnia-Herzegovina,
Croatia, Romania and Slovenia) experience faster TFP growth in foreign owned
firms, despite a documented selection process in FDI decisions. It seems that after
restructuring foreign owned firms have improved their TFP at a much faster rate
than purely domestic owned firms. However, in Bulgaria and Macedonia, no signifi-
cant robust difference on TFP growth has been found between domestic and foreign
ownership.
The remainder of the article is organized as follows. We first present our data
sets and provide basic descriptive statistics (Section 2). Then, we discuss the em-
pirical model and the methodology (Section 3). Finally, we report the results and
summarize the findings (Section 4).7See Gorodnichenko et al. (2007) on this important topic.
5

2 Data and descriptive statistics
2.1 Data
To study the link between international openness and firm performance, we make
use of firm level data for 6 out of the 8 SEE countries: Bosnia-Herzegovina (BIH),
Bulgaria (BGR), Croatia (HRV), Macedonia (MKD), Romania (ROM) and Slovenia
(SVN). We cannot perform similar estimations for firms in Albania and Serbia and
Montenegro, since we are lacking the necessary information on foreign ownership
and trade flows. For all countries, except Slovenia, firm level data is obtained from
Amadeus database provided by Bureau van Dijk. For Slovenia, the source of data
is the Statistical Office of Slovenia. Firm level data contain value added, labor and
value added per employee as well as information on foreign ownership.
As shown in Table 1, the time span and coverage of the data varies across coun-
tries. For Bulgaria, Croatia, Macedonia, Romania and Slovenia datasets cover the
period 1995-2002, while for Bosnia-Herzegovina we only have data for 1999-2002.
Firm samples size varies also across countries. In 2000, for Macedonia and Bosnia-
Herzegovina we have data for about 130 and 220 firms only, while for other countries
samples are much larger: Bulgaria (8,300 firms), Croatia (3,100), Slovenia (3,800)
and Romania (27,000). Similar differences can be seen also in terms of represen-
tativeness of the datasets. In Slovenia, our dataset represents 61 per cent of all
manufacturing firms in 2000 and covers about 90 per cent of employment, output
and value added of the total manufacturing sector. Data coverage is also quite good
for Romania (about 70 per cent of manufacturing output in 2000), while in Bul-
garia and Macedonia our dataset covers some 47 per cent of manufacturing output
in 2000. Unfortunately, for Croatia and Bosnia-Herzegovina less reliable national
accounts are available and thus no good judgement about the representativeness of
the datasets can be made. Nevertheless, comparing the Croatian firm numbers to
Slovenia, we may speculate that our sample covers a large proportion of the Croatian
manufacturing sector. Based on this data coverage, we can argue that the results
obtained below may be fairly representative of the developments in the economies
of Slovenia, Romania, Croatia and Bulgaria, but less so for Bosnia-Herzegovina and
6

Macedonia.
Data on bilateral trade flows - exports and imports - is obtained from CEPII
database (see http://www.cepii.fr). Tables 2 and 3 report the dependence of SEE
countries on exports to and imports from advanced markets. Shares of exports
of individual SEE countries to EU-15 markets range between 65% and 75%, while
share of imports from the EU-15 region is close to 80%. On the other side, Tables 2
and 3 reveal that countries of former Yugoslavia do continue to trade extensively
with each other, reflecting the hysteresis of trade patterns (de Sousa and Lamotte,
2007). Bosnia-Herzegovina (export share to SEE region of 30%) and Macedonia
(import share from SEE region of 20%) seem to rely heavily on SEE markets. In the
next subsection we determine empirically whether high propensity to trade within
the SEE region can bring about learning effects compared to trade with advanced
countries.
3 Empirical model and methodology
3.1 Modeling impact of trade and FDI effects on firm perfor-mance
In this subsection we estimate the impact of external sources of technology transfer,
such as foreign ownership and trade flows, on productivity growth of SEE firms. We
use the standard growth accounting approach that is typically used in this sort of
analysis. Production function is being used to measure the importance of knowledge
spillovers for individual firm. In this model, value added Y of each firm i at time t
takes on the following form:
Yit = H i(Kαit, L
βit, T
γit), (1)
where Kit, Lit, and Tit are the capital stock, the number of employees and tech-
nology (knowledge), respectively. The production function is homogenous of degree
r in K and L, so long as it has non-constant returns to scale (α + β 6= 1).
Differentiating equation (1) with respect to time, we get:
yit = αkit + βlit + γτit, (2)
7

Table1:
Datasamples
andcoverage
oftheda
taforsixSE
Ecoun
tries
1995
1996
1997
1998
1999
2000
2001
2002
%of
popu
lation
a
BIH
#Firms
219
219
220
221
#Fo
reignFirms
11
55
Value
Add
ed78
940
61288
191649
189715
shVA_forb
0.042
0.069
0.016
0.009
Employment
45297
46960
38267
34391
Sales
287889
323411
299319
330788
BGR
#Firms
1.332
3.052
1.531
1.541
7.309
8.357
9.549
3.403
0.336
#Fo
reignFirms
3194
4859
284
325
387
151
Value
Add
ed355.46
474.238
417.141
391.809
504.187
468.485
477.245
276.51
0.833
shVA_forb
0.015
0.022
0.036
0.042
0.045
0.047
0.053
0.054
Employment
1,207,769
777.639
2,568,554
1,548,078
2,006,033
2,547,526
2,858,518
2,009,973
0.343
Sales
5,001,364
2,574,027
6,463,700
5,112,335
6,211,294
7,750,010
7,379,755
5,407,629
0.474
HRV
#Firms
71185
345
3.001
3.093
3.108
3.111
3.121
0.613
#Fo
reignFirms
08
1559
6478
8084
Value
Add
ed45.873
90.404
122.294
206.529
213.267
222.27
225.717
226.265
0.859
shVA_forb
0.000
0.127
0.092
0.067
0.072
0.088
0.094
0.095
Employment
84.067
141.683
172.728
2,594,288
2,970,492
3,738,190
4,321,526
4,225,805
Sales
1,867,941
3,890,341
5,012,296
8,268,446
8,576,967
1.00E+07
1.15E+07
1.18E+07
MKD
#Firms
22
35
7132
130
2#
ForeignFirms
157
6422
Value
Add
ed1
3429
254
636
30.813
29.82
250
0.222
shVA_forb
0.000
0.094
0.098
0.087
Employment
00
00
0221.319
173.48
00.356
Sales
3.617
70.19
3.396
913
2.334
919.8
788.019
602
0.471
ROM
#Firms
2.051
16.979
19.366
21.746
23.94
27.035
27.955
29.749
0.635
#Fo
reignFirms
131
926
1094
1368
1667
2070
2318
2542
Value
Add
ed129.981
1,452,415
1,442,840
1,403,159
1,402,002
1,680,773
1,474,506
1,487,379
0.539
shVA_forb
0.128
0.094
0.099
0.124
0.138
0.152
0.171
0.188
Employment
2.99E+06
3.64E+07
4.05E+07
3.67E+07
4.05E+07
4.87E+06
5.98E+06
6.09E+06
0.600
Sales
1.13E+07
1.23E+08
1.42E+08
1.33E+08
1.34E+08
1.68E+07
2.14E+07
2.18E+07
0.698
SVN
#Firms
2.911
3.205
3.349
3.586
3.739
3.841
3.727
4.075
0.610
#Fo
reignFirms
121
200
217
230
239
252
268
264
Value
Add
ed231.076
225.343
211.834
216.127
214.762
216.779
214.234
221.532
0.897
shVA_forb
0.060
0.097
0.128
0.134
0.170
0.196
0.214
0.224
Employment
4.79E+08
5.65E+08
6.47E+08
7.20E+08
8.02E+08
901000000
9.94E+08
1.14E+09
0.911
Sales
1.76E+09
2.01E+09
2.28E+09
2.58E+09
2.75E+09
3.28E+09
3.67E+09
4.05E+09
0.987
Notes:
a:in
%of
firm
popu
lation
in2000;b
:shareof
valuead
dedby
foreignow
nedfirms(in%);Sa
lesin
1000
euros.
Source:Firm
leveld
ata-
Amad
eus,
BureauvanDijk
,exceptforSloven
ia(Statistical
Office
ofSlovenia).
Aggregate
data
-UNID
OIndu
strial
Statistics.
8

Table 2: Regional export shares, 1994-2002, in %Variables 1995 1996 1997 1998 1999 2000 2001 2002
BIH shX_YUG 30.6 26.4 34.0 33.9shX_EU15 45.8 54.6 53.7 52.8shX_NEU10 8.9 13.0 9.6 8.6shX_OECDoth 14.8 6.0 2.7 4.7
BGR sh_YUG 0.9 6.0 4.1 3.5 4.4 4.1 3.7 1.2shX_EU15 75.8 71.5 73.2 74.6 70.1 67.6 67.3 70.2shX_NEU10 7.9 7.8 7.2 6.8 8.7 8.9 8.5 6.4shX_OECDoth 15.4 14.7 15.5 15.1 16.8 19.3 20.4 22.1
HRV shX_YUG 17.4 17.1 16.4 17.3 17.5 16.2 15.3 14.4shX_EU15 54.3 57.5 57.4 57.9 57.7 58.6 61.3 59.4shX_NEU10 24.1 21.5 20.7 19.9 19.2 17.6 17.3 19.1shX_OECDoth 4.2 3.9 5.5 4.9 5.7 7.6 6.1 7.1
MKD shX_YUG 8.5 15.6 19.0 11.2 14.9 14.8 5.8 3.6shX_EU15 80.5 77.1 58.5 67.2 61.0 55.0 69.7 57.4shX_NEU10 5.9 5.6 17.8 9.7 10.6 11.6 9.1 5.7shX_OECDoth 5.1 1.7 4.7 11.8 13.5 18.6 15.5 33.3
ROM shX_YUG 1.0 3.7 1.9 2.3 0.9 0.9 0.9 0.6shX_EU15 71.0 70.0 66.2 66.3 67.7 70.9 75.5 75.1shX_NEU10 8.9 9.6 10.2 17.4 13.9 12.8 11.7 12.5shX_OECDoth 19.1 16.7 21.7 14.1 17.4 15.4 11.9 11.9
SVN shX_YUG 12.7 14.4 15.1 15.6 13.9 14.7 16.1 15.9shX_EU15 74.1 71.0 70.2 69.3 70.1 67.7 66.9 66.2shX_NEU10 4.9 6.0 6.7 7.4 7.8 9.0 9.2 11.3shX_OECDoth 8.3 8.7 8.0 7.7 8.2 8.6 7.8 6.6
Notes: Export shares are shares of exports of individual country to differentregions in total country’s exports calculated as averages from NACE 4-digit in-dustries. shX_YUG: share of exports to former Yugoslavia (SVN, HRV, BIH,SCG and MKD); shX_EU15: export share to the old 15 EU member states;shX_NEU10: export share to the new 10 EU member states; shX_OECDoth:share of exports to other OECD countries. Source: CEPII, authors’ calculations.
9

Table 3: Regional import shares, 1994-2002, in %Variables 1996 1997 1998 1999 2000 2001 2002
BGR shM_YU 1.8 1.9 1.9 2.1 1.5 2.3shM_EU15 79.3 79.6 81.7 80.6 78.1 80.4shM_NEU10 6.6 8.0 8.4 9.2 13.5 9.4shM_OECDoth 12.4 10.5 8.1 8.1 6.8 7.9
HRV shM_YU 11.6 11.3 11.3 11.1 10.2 10.0 9.9shM_EU15 60.6 63.7 65.6 65.0 66.1 65.5 65.4shM_NEU10 24.8 21.9 20.4 20.5 20.7 21.7 21.5shM_OECDoth 3.0 3.1 2.8 3.3 2.9 2.9 3.3
MKD shM_YU 18.3 12.9 21.1 15.9 20.3 21.3shM_EU15 51.9 60.4 38.5 51.2 42.9 42.3shM_NEU10 26.6 16.9 33.0 23.0 29.3 29.9shM_OECDoth 3.2 9.8 7.4 10.0 7.5 6.5
ROM shM_YU 0.4 0.6 0.7 0.9 0.9 0.9 0.8shM_EU15 86.3 79.1 74.0 76.8 77.2 79.8 79.3shM_NEU10 7.3 12.8 19.3 17.4 17.7 15.3 14.6shM_OECDoth 6.0 7.4 5.9 4.9 4.2 4.0 5.3
SVN shM_YU 9.4 7.7 7.4 7.4 8.1 8.9 9.6shM_EU15 82.9 83.4 79.3 83.5 83.0 82.0 81.8shM_NEU10 4.5 5.1 4.5 5.2 5.3 5.5 5.2shM_OECDoth 3.3 3.7 8.8 3.9 3.6 3.5 3.4
Notes: Import shares are shares of imports of individual country fromdifferent regions in total country’s imports calculated as averages fromNACE 4-digit industries. shM_YU; share of imports from former Yu-goslavia (SVN, HRV, BIH, SCG and MKD); shM_EU15: import sharefrom the old 15 EU member states, shM_NEU10: import share from thenew 10 EU member states; shM_OECDoth: share of imports from otherOECD countries. Source: CEPII, authors’ calculations.
10

where k, l and τ indicate the logarithmic growth rate of K, L, and T , respec-
tively. α, β, and γ represent the elasticity of output with respect to k, l and τ . The
basic idea underlying equation (2) is that an individual firm can increase its produc-
tivity also by relying on external sources of knowledge spillovers. By assumption,
technology growth τ is a function of ownership Fi and various knowledge spillover
effects Zjt:
τit = f i(Fi, Zjt), (3)
Where Zjt includes the potential home market spillovers SecSizejt, as well as
foreign knowledge spillovers from exporting Xjt and importing Mjt. The home mar-
ket spillovers are related to economies of scale proxied by the log of value added at
the NACE 2-digit sector j level. Foreign trade spillovers are measured as shares of
regional exports and imports at the sector j level. This measure of international
knowledge spillovers complies with the Hausman, Hwang and Rodrik (2007)’s study
demonstrating that it is not only about how much a country exports, but what and
where a country exports. Hausman et al. (2007) classify goods according to their
main export destinations and assign higher indices for goods that are exported to
more developed economies and demonstrate that growth is correlated with the type
of goods that a country exports. In this respect, we calculate trade shares at the
NACE 2-digit sector for 4 major trade destinations of the SEE countries: the old
15 EU member states (EU15), the other OECD countries (rOECD) and the succes-
sor states of former Yugoslavia (exYU), while exports and imports shares with the
new 10 EU member states (NEU10) are taken as a control group.8 We hypothesise
that larger learning effects are associated with higher exports shares to more devel-
oped markets (EU-15 and other OECD countries) since a higher quality of goods
is required for exporting to more competitive markets. Similarly, importing higher
shares of goods from more competitive markets provides higher learning effects for
local firms due to the latest technology and intermediates that can be purchased in
advanced countries.8Trade shares and not the volumes of exports and imports are taken as the latter may well be
correlated with the absolute sector levels, which stand for sector economies of scale and enter ourmodel on the right hand side. Note also that we use sector trade since we do not dispose withtrade flows at the firm level.
11

Finally, we estimate the following regression model:
yit = αkit + βlit + δFi + κ lnSecSizejt + µXjt + σMjt + φt + χjt + uit, (4)
where φ indicates time specific effects which capture the time specific economic
shocks typical for each country under investigation. In addition, we also include χjt,
that indicates time and sector specific (Tt ∗ Sj) effects, which capture the effects of
the actual evolution of sector specific institutional improvements in each country.9
uit is the error term and
shXjt_EU15, shXjt_NEU10, shXjt_exY U, shXjt_rOECD ∈ Xjt,
shMjt_EU15, shMjt_NEU10, shMjt_exY U, shMjt_rOECD ∈Mjt,
are regional export and import shares.
3.2 Econometric issues
Estimating (4) poses at least two econometric problems that can potentially lead to
seriously biased estimations of the estimated coefficients. First problem arises due
to possible non-random selection process of firms into exporting as well as into their
foreign ownership status. The second problem typically arises in growth accounting
approach where output and inputs are simultaneously determined. We have to deal
with both issues in order to get robust and reliable estimations of our coefficients of
interest.
3.2.1 Correction for selection bias
In this approach there are two potential sources of selection bias. The first bias
stems from the fact that only the most productive firms start exporting. This self-
selection issue is well documented in the literature since the seminal work of Bernard
and Jensen (1995), Clerides et al. (1998) or Roberts and Tybout (1997). The newer
strand of literature also documents that due to the required higher productivity
threshold only the most productive firms exports towards many markets (see Eaton,9One may argue, that especially in the SEE region institutional improvements may increase
the relative performance of sectors that rely more heavily on those institutions, such as sectorsproducing complex goods, and may therefore also impact the pattern of export shares acrosssectors. This point is made quite clear in Costinot (2007).
12

Kortum and Kramarz, 2004; Bernard, Jensen and Schott, 2007) and towards more
competitive markets.10 Ideally, in our attempt to estimate the impact of trade
liberalisation on firm performance in SEE firms we would be able to control for
this self-selection of more productive firms into exports and more specifically into
exports towards more competitive markets. This would allow us to disentangle
the pure learning-by-exporting and learning-by-importing effects from the selection
issue. Unfortunately, in our datasets we do not dispose with the information on
firm exports status, not to speak of the information on firm export destinations.
There is little therefore one can do about this selection issue. What we can do,
however, is to control for possible amplified effects of trade liberalisation in firms
with higher absorptive capacity, which is typically higher for more productive firms.11
Firm’s absorptive capacity is usually measured by firm’s skill intensity measured by
labour costs per employee. Based on this, we control for amplified effects of trade
liberalisation in firms with higher absorptive capacity by introducing the interaction
terms of firm specific skill intensity with the sector and region specific export and
import shares. Hence, we estimate the following regression model:
yit = αkit + βlit + δFi + κ lnSecSizejt +µwit ∗Xjt + σwit ∗Mjt +φt +χjt + uit, (5)
where wit stands for firm’s average skill intensity. Estimating equation (5) will
enable us to check whether exporting to (importing from) different regions (EU-15,
other OECD countries, ex-Yugoslav markets) has a differential effect on firms with
higher absorptive capacity than on firms with lower absorptive capacity.
The second potential bias arises due to the fact that firms that are foreign owned
were not acquired randomly by their parent companies but according to some se-
lection process. This selection may be correlated with firm characteristics which
introduces additional bias in our empirical model. This study deals with this se-
lection problem using the two-step method proposed by Heckman (1979).12 In the10See Damijan and Kostevc (2006) for empirical findings and Melitz and Ottaviano (2006) for
theoretical exposition.11The literature on spillover effects from FDI documents that firms with higher absorptive ca-
pacity may benefit more from FDI spillovers (see Damijan et al., 2003, 2008 and Javorcik, 2004).12Another approach to deal with the endogeneity of foreign ownership is the propensity score
matching (see e.g. Arnold and Javorcik, 2004). In a related study, Damijan et al. (2008) make useof a propensity score approach as a robustness check on estimations with Heckman correction, butobtain quite similar results both in terms of magnitude and significance of the estimates.
13

Heckman procedure, the bias that results from using non-randomly selected samples
is dealt with as an ordinary specification bias arising due to omitted variables prob-
lem.13 Heckman proposes to use estimated values of the omitted variables (which
when omitted from the model give rise to the specification error) as regressors in the
basic model. Hence, in the first step we account for the probability pi [0, 1] that a
firm’s selection for FDI is conditional on its initial structural characteristics before
the take over. The following probit equation has been estimated:
Pr(pit0 = 1 | Xi,jt0) = S (Xit0 6= Xjt0) (6)
where i and j (i = 1, ..., n, j = 1, ...,m) are indicating individual foreign and
domestic firm, respectively. The error terms are assumed to be IID and normally
distributed, thus S(·) is a cumulative distribution function of the standard normal
distribution. Xi,jt0 is a matrix of firms’ structural characteristics in the initial year
t0. These are the firm size measured by the number of employees (Employment), the
capital to labor ratio (K/L-ratio), the value added by employee (VA/employment),
the skill intensity measured by labour costs per employee (Skill Intensity) and
economies of scale at the NACE two-digit sector j level (SecSize). Due to data
limitation on ownership changes within the observed period, we are forced to as-
sume unchanged ownership over the whole period for all of the countries with the
exception of Slovenia, whereby we took firms’ structural characteristics in the first
year of our sample as their initial characteristics. In order to avoid autocorrelation,
the first year of observation is then excluded from the second stage estimations.14
Results, reported in Table 4, indicate some selection process in FDI decisions by
parent foreign companies. Foreign parent companies seem to select smaller firms in
SEE countries (significant for BIH, ROM and SVN) as well as less initially productive
(not true for ROM) and less capital and skill intensive firms.
Based on these probit results, the so-called inverse Mill’s ratio, λi, for all ob-
servations (for non-zero as well as zero observations regarding foreign investment13The problem of sample selection bias has been extensively dealt with in the econometric litera-
ture. See for instance Amemiya (1984) and Wooldridge (2002) for excellent surveys of the literatureand correction methods.
14Note that by construction the firm’s characteristics that enter the second stage, i.e. the mainempirical model, are not correlated with the firm’s characteristics in the first (Heckman) stage asthe initial year data does not enter the main empirical estimations.
14
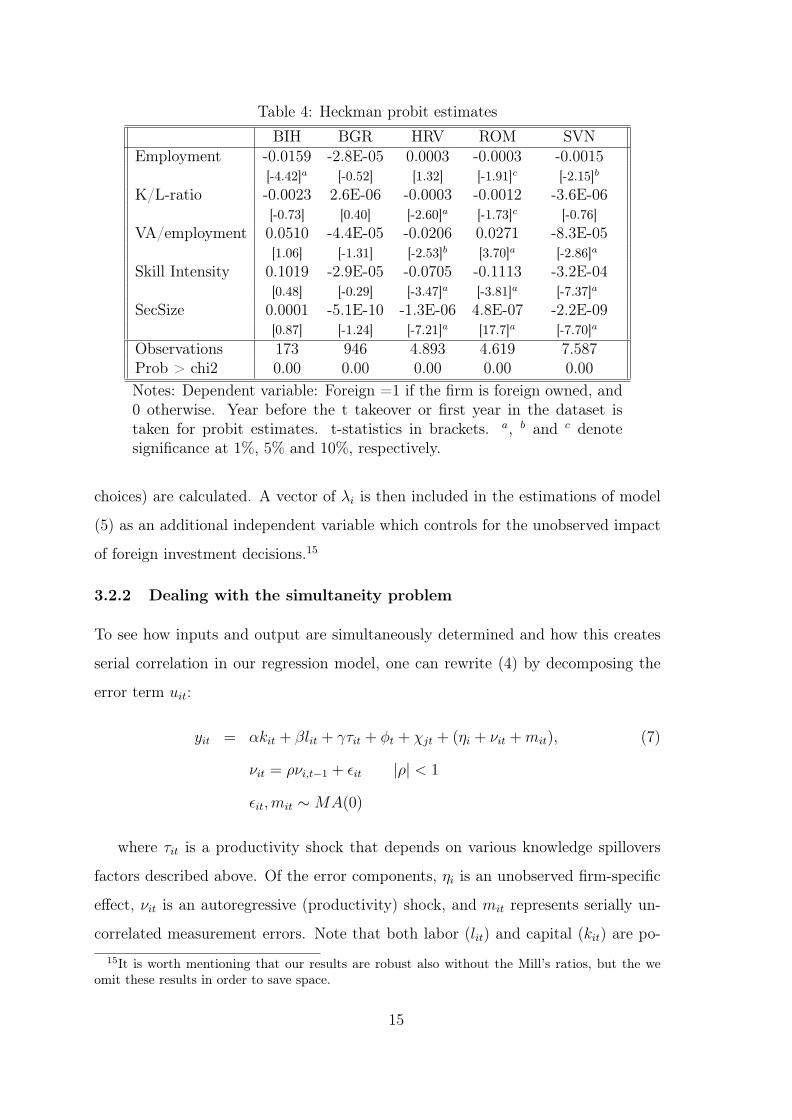
Table 4: Heckman probit estimatesBIH BGR HRV ROM SVN
Employment -0.0159 -2.8E-05 0.0003 -0.0003 -0.0015[-4.42]a [-0.52] [1.32] [-1.91]c [-2.15]b
K/L-ratio -0.0023 2.6E-06 -0.0003 -0.0012 -3.6E-06[-0.73] [0.40] [-2.60]a [-1.73]c [-0.76]
VA/employment 0.0510 -4.4E-05 -0.0206 0.0271 -8.3E-05[1.06] [-1.31] [-2.53]b [3.70]a [-2.86]a
Skill Intensity 0.1019 -2.9E-05 -0.0705 -0.1113 -3.2E-04[0.48] [-0.29] [-3.47]a [-3.81]a [-7.37]a
SecSize 0.0001 -5.1E-10 -1.3E-06 4.8E-07 -2.2E-09[0.87] [-1.24] [-7.21]a [17.7]a [-7.70]a
Observations 173 946 4.893 4.619 7.587Prob > chi2 0.00 0.00 0.00 0.00 0.00Notes: Dependent variable: Foreign =1 if the firm is foreign owned, and0 otherwise. Year before the t takeover or first year in the dataset istaken for probit estimates. t-statistics in brackets. a, b and c denotesignificance at 1%, 5% and 10%, respectively.
choices) are calculated. A vector of λi is then included in the estimations of model
(5) as an additional independent variable which controls for the unobserved impact
of foreign investment decisions.15
3.2.2 Dealing with the simultaneity problem
To see how inputs and output are simultaneously determined and how this creates
serial correlation in our regression model, one can rewrite (4) by decomposing the
error term uit:
yit = αkit + βlit + γτit + φt + χjt + (ηi + νit +mit), (7)
νit = ρνi,t−1 + εit |ρ| < 1
εit,mit ∼MA(0)
where τit is a productivity shock that depends on various knowledge spillovers
factors described above. Of the error components, ηi is an unobserved firm-specific
effect, νit is an autoregressive (productivity) shock, and mit represents serially un-
correlated measurement errors. Note that both labor (lit) and capital (kit) are po-15It is worth mentioning that our results are robust also without the Mill’s ratios, but the we
omit these results in order to save space.
15

tentially correlated with firm-specific effects (ηi) as well as with both productivity
shocks (νit) and measurement errors (mit).
When estimating growth accounting model, one should take into account the
inherent endogenous structure of the model. This means that not only present
and lagged dependent variables are correlated, but lagged dependent variable (value
added) might be correlated with present independent variables (inputs); i.e. past
performance determines demand for inputs in the present period. This creates serial
correlation between the inputs and the error term on right hand side of (7) that
is captured by the autoregressive productivity shock, which shows up in economet-
ric estimations as AR(1) autoregressive process of the error term. This should be
explicitly controlled for in econometric estimations. In order to deal with this simul-
taneity problem one has to estimate dynamic version of (7). The time dimension of
panel data enables us to capture the dynamics of adjustment by inclusion of lagged
dependent as well as lagged independent variables. A dynamic version of the growth
model (7) can then be written as:
yit = ρyi,t−1 + αkit − ραki,t−1 + βlit − ρβli,t−1 + (φt − ρφt−1) + (χjt − ρχj,t−1)
+ (γit − ργi,t−1 + ηi(1− ρ) + εit +mit − ρmi,t−1). (8)
The OLS estimator is unbiased and consistent when all explanatory variables are
exogenous and are uncorrelated with the individual specific effects. This, however,
is not the case in our model, which includes lagged variables. One can show that the
OLS estimator will be seriously biased due to correlation of the lagged dependent
variable with the individual specific effects as well as with the independent variables.
This is due to the fact that yit is a function of ηi in (8), and then yi,t−1 is also a
function of ηi. As a consequence, yi,t−1 is correlated with the error term, which
renders the OLS estimator biased and inconsistent, even if the νit and mit in (8) are
not serially correlated. This holds also whether the individual effects are considered
fixed or random (see Hsiao, 1986, Baltagi, 1995, Wooldridge, 2002).
There are several ways of controlling for the unobserved heterogeneity and si-
multaneity. One way is to include exogenous variables into the first-order autore-
gressive process. This, in turn, reduces the bias in the OLS estimator, but its
16
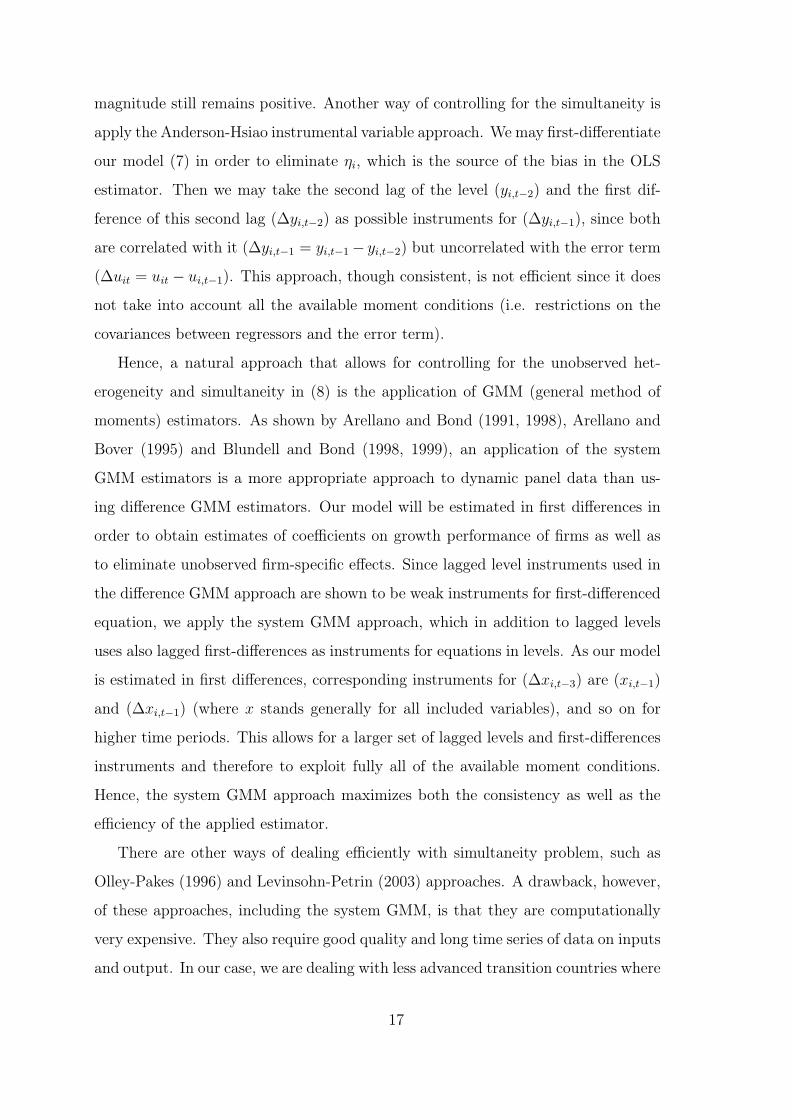
magnitude still remains positive. Another way of controlling for the simultaneity is
apply the Anderson-Hsiao instrumental variable approach. We may first-differentiate
our model (7) in order to eliminate ηi, which is the source of the bias in the OLS
estimator. Then we may take the second lag of the level (yi,t−2) and the first dif-
ference of this second lag (∆yi,t−2) as possible instruments for (∆yi,t−1), since both
are correlated with it (∆yi,t−1 = yi,t−1− yi,t−2) but uncorrelated with the error term
(∆uit = uit − ui,t−1). This approach, though consistent, is not efficient since it does
not take into account all the available moment conditions (i.e. restrictions on the
covariances between regressors and the error term).
Hence, a natural approach that allows for controlling for the unobserved het-
erogeneity and simultaneity in (8) is the application of GMM (general method of
moments) estimators. As shown by Arellano and Bond (1991, 1998), Arellano and
Bover (1995) and Blundell and Bond (1998, 1999), an application of the system
GMM estimators is a more appropriate approach to dynamic panel data than us-
ing difference GMM estimators. Our model will be estimated in first differences in
order to obtain estimates of coefficients on growth performance of firms as well as
to eliminate unobserved firm-specific effects. Since lagged level instruments used in
the difference GMM approach are shown to be weak instruments for first-differenced
equation, we apply the system GMM approach, which in addition to lagged levels
uses also lagged first-differences as instruments for equations in levels. As our model
is estimated in first differences, corresponding instruments for (∆xi,t−3) are (xi,t−1)
and (∆xi,t−1) (where x stands generally for all included variables), and so on for
higher time periods. This allows for a larger set of lagged levels and first-differences
instruments and therefore to exploit fully all of the available moment conditions.
Hence, the system GMM approach maximizes both the consistency as well as the
efficiency of the applied estimator.
There are other ways of dealing efficiently with simultaneity problem, such as
Olley-Pakes (1996) and Levinsohn-Petrin (2003) approaches. A drawback, however,
of these approaches, including the system GMM, is that they are computationally
very expensive. They also require good quality and long time series of data on inputs
and output. In our case, we are dealing with less advanced transition countries where
17

both the quality of datasets as well as availability of long time series is not warranted.
For instance, we face very poor availability of data for Bosnia-Herzegovina and
Macedonia (only three years of observations), while for the other four countries
data series are longer. The quality of data in terms of the persistency of series is
however quite poor. We can observe extremely large changes of value added, labor
and value added per employee in the early years of our sample, while in the second
part of our sample period the changes become more moderate. This is due to the
transition process, characterized by an initial huge drop in economic activity and
a fast recovery afterwards. Thus, the lack of persistency makes GMM estimations
less efficient as even lagged levels are poor instruments for the model estimated in
levels. Accordingly, we have to limit our econometric efforts to the availability of
data. We will therefore first estimate our empirical model (7) in log first differences
(i.e. growth rates) to obtain estimates of coefficients on firm’s TFP growth as well as
to eliminate firm fixed effects (ηi), which is the source of bias in the OLS estimator.
This will give us the benchmark estimates. In addition, we will run GMM estimates
for the countries where the length of the time series makes this approach reasonable.
4 Results
We now provide estimates of the impact of foreign ownership and trade liberalisation
on firm performance in SEE firms, using both first differences (section 4.1) and GMM
estimations (section 4.2).
4.1 Results with first differences estimation
Availability of data for imports is smaller than for exports. We therefore present
results for the model first with exports shares only (Table 5) and then with export
and imports shares (Table 6). In Table 5, we also report results with and without
controlling for absorptive capacity.16 As we are regressing growth rate of value added
on the growth rate of inputs, we can interpret the results in terms of the contribution16Note that due to small sample sizes for Bosnia-Herzegovina and Macedonia, we bootstrapped
the standard errors with 500 replications to get more reliable estimates. For the other countries,we have enough observations to get reliable standard errors. Nevertheless, we have checked thatwhen bootstrapping the estimates do not change.
18

of different factors to the growth of TFP.
Results presented in Table 5 show for three countries (Bosnia-Herzegovina, Ro-
mania and Slovenia) faster TFP growth in foreign owned firms as compared to
purely domestic owned firms. Despite some selection process of foreign ownership,
documented in Table 4, these results suggest that after restructuring foreign owned
firms improve their TFP at a much faster rate than purely domestic owned firms.17
However, in Bulgaria and Croatia, we do not observe such a significant differential
impact between foreign and domestic owned firms on TFP growth. The coefficient
on foreign ownership is significant at 20 per cent only.18
In terms of the impact of export propensity to different regional markets, we find
that in Romania and Slovenia the higher propensity to export to advanced markets
(EU-15, rest of OECD countries) has a larger impact on TFP growth than exporting
to less advanced markets such as new EU member states and countries of former
Yugoslavia. In Bulgaria the positive spillovers from exporting to advanced EU-15
markets benefit only firms with higher absorptive capacity, while in Croatia these
positive spillovers for firms with higher absorptive capacity stem from the rest of
OECD countries, but not from the EU-15 countries. On the other side, relying
on exporting to less competitive markets of ex-Yugoslavia seem to affect negatively
the productivity growth of firms in Bulgaria, Croatia and Romania. Note that in
Romania the spillovers from exporting to markets of ex-Yugoslavia is less negative
for firms with higher absorptive capacity. Based on this, one can conclude that
exporting to advanced market provides much larger learning effects for a typical
firm than exporting to less advanced markets. Furthermore, relying on exporting to
less competitive markets may even generate negative spillovers for TFP growth.
In Table 6, we include the imports shares into our empirical model without al-
tering our results on export shares substantially. In most countries the significant
impact of exports to more competitive markets on firms’ TFP growth remains pre-
served as well as the negative impact of export reliance on ex-Yugoslav markets. It is17A similar pattern is found in Indonesia, where foreign ownership leads to significant produc-
tivity improvements in the acquired plants (Arnold and Javorcik, 2005). The rise in productivityis also found to be the result of restructuring.
18We do not elaborate on the estimates for Macedonia. They are all insignificant and less reliabledue to the small sample size and the a lack of degrees of freedom.
19
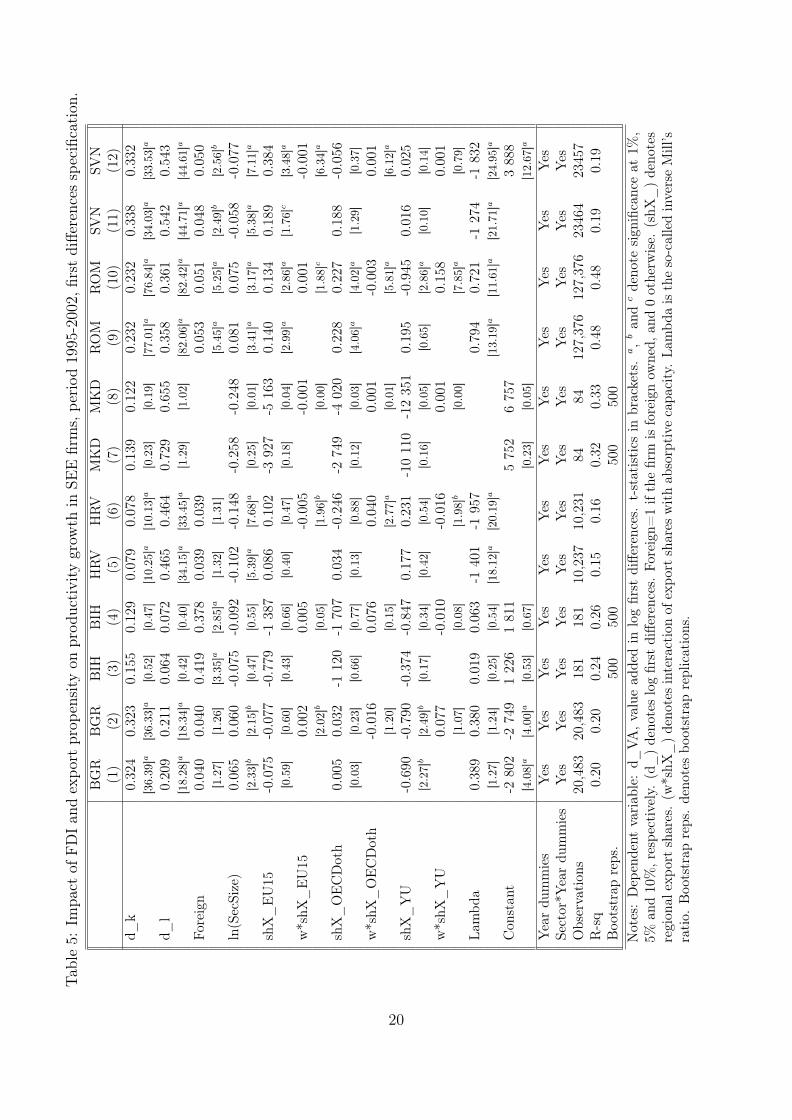
Table5:
Impa
ctof
FDIan
dexpo
rtprop
ensity
onprod
uctivity
grow
thin
SEEfirms,pe
riod
1995
-200
2,first
diffe
rences
specification
.BGR
BGR
BIH
BIH
HRV
HRV
MKD
MKD
ROM
ROM
SVN
SVN
(1)
(2)
(3)
(4)
(5)
(6)
(7)
(8)
(9)
(10)
(11)
(12)
d_k
0.324
0.323
0.155
0.129
0.079
0.078
0.139
0.122
0.232
0.232
0.338
0.332
[36.39
]a[36.33
]a[0.52]
[0.47]
[10.25]a
[10.13]a
[0.23]
[0.19]
[77.01]a
[76.84]a
[34.03]a
[33.53]a
d_l
0.209
0.211
0.064
0.072
0.465
0.464
0.729
0.655
0.358
0.361
0.542
0.543
[18.28
]a[18.34
]a[0.42]
[0.40]
[34.15]a
[33.45]a
[1.29]
[1.02]
[82.06]a
[82.42]a
[44.71]a
[44.61]a
Foreign
0.040
0.040
0.419
0.378
0.039
0.039
0.053
0.051
0.048
0.050
[1.27]
[1.26]
[3.35]
a[2.85]
a[1.32]
[1.31]
[5.45]
a[5.25]
a[2.49]
b[2.56]
b
ln(SecSize)
0.065
0.060
-0.075
-0.092
-0.102
-0.148
-0.258
-0.248
0.081
0.075
-0.058
-0.077
[2.33]
b[2.15]
b[0.47]
[0.55]
[5.39]
a[7.68]
a[0.25]
[0.01]
[3.41]
a[3.17]
a[5.38]
a[7.11]
a
shX_EU15
-0.075
-0.077
-0.779
-1387
0.086
0.102
-3927
-5163
0.140
0.134
0.189
0.384
[0.59]
[0.60]
[0.43]
[0.66]
[0.40]
[0.47]
[0.18]
[0.04]
[2.99]
a[2.86]
a[1.76]
c[3.48]
a
w*shX
_EU15
0.002
0.005
-0.005
-0.001
0.001
-0.001
[2.02]
b[0.05]
[1.96]
b[0.00]
[1.88]
c[6.34]
a
shX_OECDoth
0.005
0.032
-1120
-1707
0.034
-0.246
-2749
-4020
0.228
0.227
0.188
-0.056
[0.03]
[0.23]
[0.66]
[0.77]
[0.13]
[0.88]
[0.12]
[0.03]
[4.06]
a[4.02]
a[1.29]
[0.37]
w*shX
_OECDoth
-0.016
0.076
0.040
0.001
-0.003
0.001
[1.20]
[0.15]
[2.77]
a[0.01]
[5.81]
a[6.12]
a
shX_YU
-0.690
-0.790
-0.374
-0.847
0.177
0.231
-10110
-12351
0.195
-0.945
0.016
0.025
[2.27]
b[2.49]
b[0.17]
[0.34]
[0.42]
[0.54]
[0.16]
[0.05]
[0.65]
[2.86]
a[0.10]
[0.14]
w*shX
_YU
0.077
-0.010
-0.016
0.001
0.158
0.001
[1.07]
[0.08]
[1.98]
b[0.00]
[7.85]
a[0.79]
Lambd
a0.389
0.380
0.019
0.063
-1401
-1957
0.794
0.721
-1274
-1832
[1.27]
[1.24]
[0.25]
[0.54]
[18.12]a
[20.19]a
[13.19]a
[11.61]a
[21.71]a
[24.95]a
Con
stan
t-2
802
-2749
1226
1811
5752
6757
3888
[4.08]
a[4.00]
a[0.53]
[0.67]
[0.23]
[0.05]
[12.67]a
Yeardu
mmies
Yes
Yes
Yes
Yes
Yes
Yes
Yes
Yes
Yes
Yes
Yes
Yes
Sector*Y
eardu
mmies
Yes
Yes
Yes
Yes
Yes
Yes
Yes
Yes
Yes
Yes
Yes
Yes
Observation
s20,483
20,483
181
181
10,237
10,231
8484
127,376
127,376
23464
23457
R-sq
0.20
0.20
0.24
0.26
0.15
0.16
0.32
0.33
0.48
0.48
0.19
0.19
Boo
tstrap
reps.
500
500
500
500
Notes:Dep
endent
variab
le:d_
VA,v
alue
addedin
logfirst
diffe
rences.t-statistics
inbrackets.a,ban
dcdeno
tesign
ificanceat
1%,
5%an
d10%,respe
ctively.
(d_)deno
teslogfirst
diffe
rences.Fo
reign=
1ifthefirm
isforeignow
ned,
and0otherw
ise.
(shX
_)deno
tes
region
alexpo
rtshares.(w
*shX
_)deno
tesinteractionof
expo
rtshares
withab
sorptive
capa
city.La
mbd
aistheso-calledinverseMill’s
ratio.
Boo
tstrap
reps.deno
tesbo
otstrapreplications.
20

only for Slovenia, where exports shares become generally insignificant after including
the import shares into the empirical model.
The role of imports follows a similar path as exporting. Importing from the
advanced EU and OECD countries is highly important for firms in Romania and
Slovenia. At the same time, for firms in Bulgaria and Romania importing from
countries of former Yugoslavia provides a dominant learning effect. In contrast, for
Croatian firms with higher absorptive capacity importing from ex-Yugoslav markets
provides a negative spillover.19
In general terms, considering the results of Tables 5 and 6, trade liberalization
is not uniformly benefiting firms. The regional composition of trade flows seems
important. Exporting to or importing from more competitive markets is found to
generate more likely stronger and positive learning effects for individual firms. In
contrast, trade reliance on less competitive markets may generate even negative
impact on firm TFP growth. Trade liberalisation within the SEE region thus may
not provide a substitute for general trade liberalisation in competitive markets.
Access to the competitive markets of EU-15 and other advanced OECD countries is
essential for benefitting from learning-by-exporting as well as learning-by-importing.
In addition, individual absorptive capacity may play an important role in enhancing
the firm potential for taking advantages of the trade spillovers that arise due to the
trade liberalisation.
4.2 Results with system GMM estimation
In this section we provide a robustness check for our results obtained using log
first-differences. To control for simultaneity between the inputs and output we
estimate a dynamic model by employing the system GMM estimations (as described
above) for four countries with longer time series. We again present results for two
specifications of the model, i.e. with exports shares only and with both exports
and imports shares. Note that we report the most robust results obtained by trying
many alternative specifications. All countries, but Romania, do pass the Hansen test19For Macedonia no learning effects from exporting to and importing from individual geographic
regions could be found. However, again, these results are less reliable due to the small sample sizefor Macedonian firms.
21

Table 6: Impact of FDI, export and import propensity on productivity growth inSEE firms, period 1995 - 2002, first differences specification.
BGR HRV MKD ROM SVN(1) (2) (3) (4) (5)
d_k 0.276 0.085 -0.106 0.228 0.365[25.75]a [8.67]a [0.18] [63.92]a [28.11]a
d_l 0.231 0.461 0.632 0.365 0.515[16.87]a [26.88]a [1.10] [69.86]a [33.16]a
Foreign 0.027 0.036 0.048 0.038[0.76] [1.10] [4.15]a [1.55]
ln(SecSize) 0.088 -0.156 0.607 0.114 -0.106[1.91]c [7.03]a [0.63] [2.93]a [8.83]a
shX_EU15 -0.058 -0.394 -0.641 -0.061 0.145[0.32] [1.10] [0.00] [1.06] [0.79]
w*shX_EU15 0.003 0.062 0.699 0.008 0.001[0.09] [1.88]c [0.31] [2.40]b [0.01]
shX_OECDoth 0.054 -1125 -0.546 0.151 0.428[0.28] [2.71]a [0.00] [2.27]b [1.64]
w*shX_OECDoth -0.006 0.164 0.584 0.003 -0.001[0.11] [4.32]a [0.20] [0.89] [0.14]
shX_YU -0.951 -0.312 -1.586 -0.556 -0.237[2.49]b [0.47] [0.00] [1.39] [1.09]
w*shX_YU 0.245 0.056 1953 0.089 0.001[2.04]b [0.93] [0.36] [3.26]a [1.84]c
shM_EU15 0.082 0.140 1.186 0.353[0.19] [0.26] [9.17]a [1.56]c
w*shM_EU15 0.022 -0.052 -1.093 -0.007 -0.001[0.55] [1.60] [0.54] [2.23]b [1.52]
shM_OECDoth 0.441 0.729 1.179 0.448[0.99] [0.84] [5.33]a [1.66]c
w*shM_OECDoth -0.117 -0.015 -0.742 0.007 -0.001[3.10]a [0.48] [1.02] [1.22] [1.76]c
shM_YU 2081 0.439 1.381 -0.305[1.77]c [0.35] [1.57] [1.02]
w*shM_YU -0.433 -0.254 1.213 0.100 0.000[2.68]a [2.75]a [0.18] [2.31]b [0.55]
Lambda 0.328 -2.041 0.427 -2.465[0.88] [13.32]a [5.40]a [22.54]a
Constant 5.058 -4.010 5.436[5.64]a [0.55] [4.90]a
Year dummies Yes Yes Yes Yes YesSector*Year dummies Yes Yes Yes Yes YesObservations 15,498 6,855 77 91,219 14,584R-sq 0.16 0.15 0.39 0.49 0.19Bootstrap replications 500Notes: Dependent variable: d_VA, value added specified in log firstdifferences. t-statistics in brackets. a, b and c denote significance at 1%,5% and 10%, respectively. Foreign=1 if the firm is foreign owned, and 0otherwise. (shX_) and (shM_) are regional export and imports shares,respectively; (w*sh_) denotes interaction of trade shares with absorptivecapacity. Lambda is the so-called inverse Mill’s ratio.
22

of over-identification as well as the AR(2) test for serial correlation. For Romania,
we tried also alternative specifications of the model with different lag lengths as well
as a one-step GMM approach as proposed by Wooldridge (2005). In each case, we
found fairly robust results compared to those of Tables 5 and 6.
Results in Table 7 basically confirm those obtained by first-differences estima-
tions. In particular, foreign ownership remains a significant determinant of TFP
growth in Romania and Slovenia. In Bulgaria and Croatia, we find contrasting re-
sults for the foreign ownership estimates. In the first-differences specification, the
coefficient was significant at 20 per cent only, now it becomes significant at 1 or 5
per cent, respectively. However, this result does not hold in the specifications where
both export and import shares are included.
Unfortunately, positive impact of high export propensity to EU-15 countries is
not being preserved for Croatia, Slovenia and Romania. For Romania a positive
impact of exports to other OECD countries is still significant, while in Bulgaria and
Croatia only firms with higher absorptive capacity benefit from exporting to other
advanced OECD markets. In Bulgaria and Romania significant positive impact
of high imports from the EU-15 and other OECD countries is still documented.
On the other side, Bulgaria and Romania also show substantial learning effects
from importing from markets of ex-Yugoslavia, while these markets tend to generate
negative spillovers for Croatian firms.
These differences in estimates between the first-differences and GMM estimators
might arise due to poor quality of the data and lack of persistency of datasets.
Therefore, GMM estimations are likely to be less efficient because even lagged levels
are poor instruments for the model estimated in levels.
5 Conclusion
In this paper, we attempt to establish a link between two stylized facts of South-
eastern European countries: rapid growth and increasing integration in the world
economy. We investigate this relationship at the micro level by analyzing the impact
of foreign ownership and international trade orientation on firm productivity. We
use firm level data matched with bilateral trade flows for 6 SEE countries over the
23

Table 7: Impact of FDI, export and import propensity on productivity growth inSEE firms, period 1995 - 2002, robustness check with system GMM estimations
BGR BGR HRV HRV ROM ROM SVN SVN(1) (2) (3) (4) (5) (6) (7) (8)
d_vat−1 0.322 0.055 0.254 0.183 0.318 0.222 -0.005 0.067[8.49]a [1.41] [3.00]a [1.77]c [14.56]a [5.94]a [0.11] [1.04]
d_k 0.339 0.242 0.037 0.041 0.435 0.307 0.157 0.073[6.19]a [3.20]a [1.59] [1.31] [22.63]a [14.48]a [2.40]b [0.79]
d_l 0.168 0.417 0.729 0.752 0.151 0.474 0.616 0.596[2.27]b [3.77]a [8.03]a [8.19]a [4.12]a [9.12]a [7.39]a [5.09]a
Foreign 0.076 0.025 0.058 -0.005 0.046 0.019 0.029 0.043[6.61]a [0.20] [2.16]b [0.03] [11.45]a [4.62]a [5.45]a [2.76]a
ln(SecSize) 0.321 -0.348 -0.565 -0.551 -0.606 -0.298 -0.065 -0.126[2.20]b [1.75]c [2.90]a [2.91]a [3.11]a [1.13] [0.43] [0.83]
shX_EU15 -4 967 0.448 -1 085 -1 826 -1 268 5 694 0.311 3 777[5.75]a [0.35] [0.83] [0.75] [1.74]c [5.55]a [0.11] [0.76]
w*shX_EU15 -0.001 0.617 -0.053 -0.036 -0.033 -0.343 0.000 -0.001[0.12] [1.63] [1.07] [0.19] [1.48] [1.38] [1.78]c [0.05]
shX_OECDoth -5 576 0.544 -3 912 -11 313 -1 219 5 198 -4 520 -2 902[5.35]a [0.29] [1.28] [2.30]b [1.39] [5.97]a [1.21] [0.39]
w*shX_OECDothw -0.003 1 651 0.430 0.711 0.127 -0.065 -0.001 -0.001[0.11] [2.17]b [2.30]b [1.98]b [1.68]c [0.49] [1.04] [0.22]
shX_YU -4 467 -11 516 -2 960 -1 337 -26 006 9 877 -0.169 11 279[1.63] [3.15]a [1.03] [0.28] [6.73]a [1.92]c [0.05] [2.18]b
w*shX_YU 0.051 0.474 -0.050 -0.162 1 057 -0.569 -0.001 -0.004[0.66] [0.36] [0.39] [0.48] [3.13]a [0.66] [0.93] [2.43]b
shM_EU15 8 041 -3 250 1 577 7 252[4.68]a [1.33] [1.02] [0.95]
w*shM_EU15 -0.753 0.190 0.246 0.001[1.75]c [0.98] [1.19] [0.61]
shM_OECDoth 18 149 -9 344 14 486 3 227[3.66]a [1.74]c [3.91]a [0.36]
w*shM_OECDoth -0.540 0.168 0.492 0.003[2.11]b [0.67] [1.32] [0.80]
shM_YU 34 313 4 284 -26 619 2 873[4.59]a [0.64] [1.46] [0.36]
w*shM_impYU -4 454 -0.915 6 252 0.002[3.18]a [1.66]c [4.47]a [1.00]
Lambda -3 451 1 215 -7 883 -7 291 4 777 2 295 -3 868 -1 884[1.44] [0.52] [3.89]a [3.80]a [4.21]a [1.26] [4.78]a [1.43]
Constant 6 244 -4 775 21 271 22 953 3 832 -5 050 13 208 1 412[1.50] [1.09] [3.87]a [3.66]a [1.19] [0.78] [2.85]a [0.24]
Year dummies Yes Yes Yes Yes Yes Yes Yes YesSector*Year dummies Yes Yes Yes Yes Yes Yes Yes YesObservations 20,992 15,498 10,340 6,836 132,267 91,219 23,110 14,343Hansen (p-value) 0.00 0.10 0.88 0.90 0.00 0.00 0.11 0.37chi2 (p-value) 0.00 0.00 0.00 0.00 0.00 0.00 0.00 0.00AR1 (p-value) 0.00 0.00 0.00 0.00 0.02 0.00 0.00 0.00AR2 (p-value) 0.25 0.65 0.55 0.14 0.48 0.01 0.92 0.24Notes: Dependent variable: d_VA-value added, specified in log first differences. t-statistics inbrackets. a, b and c denote significance at 1%, 5% and 10%, respectively. Foreign=1 if the firmis foreign owned, and 0 otherwise. (shX_) and (shM_) are regional export and imports shares,respectively; (w*sh_) denotes interaction of trade shares with absorptive capacity. Lambda isthe so-called inverse Mill’s ratio.
24

period 1994-2002. We find interesting evidence of differential effects of international
openness on productivity growth. The effects vary across countries and channels.
First, the results on the impact on foreign firms on TFP growth are quite uni-
form. Four out of six countries (Bosnia-Herzegovina, Croatia, Romania and Slove-
nia) experience faster TFP growth of foreign owned firms. In Bulgaria significant
differences have been found only in the case of the GMM estimations. Hence, we can
conclude that foreign ownership has helped at restructuring local firms and brought
about improvements in their TFP at a much faster rate than in the case of purely
domestic owned firms.
Second, the results suggest that trade and its direction is an important source of
productivity growth in some countries. In Romania and Slovenia, higher propensity
to export to advanced markets (EU-15, rest of OECD countries) has a larger impact
on TFP growth than exporting to less advanced markets such as new EU member
states and countries of former Yugoslavia. In Bulgaria the positive spillovers from
exporting to advanced EU-15 markets benefit only firms with higher absorptive
capacity, while in Croatia the positive spillovers for firms with higher absorptive
capacity stem from the rest of OECD countries, but not from the EU-15 countries.
On the other side, relying on exporting to less competitive markets of ex-Yugoslavia
seems to affect negatively the productivity growth of firms in Bulgaria, Croatia and
Romania. Similar results are found also for importing links. Importing from the
advanced EU and OECD countries is highly important for firms in Romania and
Slovenia, while for firms in Bulgaria and Romania importing from countries of former
Yugoslavia provides a dominant learning effect. In contrast, for Croatian firms with
higher absorptive capacity importing from ex-Yugoslav markets provides a negative
spillover. For Macedonia no learning effects from exporting to and importing from
individual geographic regions could be found.
Thus, in terms of policy implications, trade liberalisation is not uniformly bene-
ficial. The regional composition of trade flows and absorptive capacity of local firms
seem important. Exporting to or importing from more competitive markets is more
likely to generate positive learning effects for individual firms, while trade reliance
on less competitive markets may generate even negative spillovers. Trade liberali-
25

sation within the SEE region thus may not provide a substitute for a general trade
liberalisation in competitive markets. Free access to the more competitive markets
of EU-15 and other advanced OECD countries is essential for local firms in the SEE
countries to benefit from learning through trade. In addition, individual absorptive
capacity may also play an important role in amplifying the learning effects that arise
due to the trade liberalisation.
References
Amemiya, T. (1984). ‘Tobit Models. A Survey’, Journal of Econometrics, 24, pp. 3-61.
Arellano, M. and S.R. Bond (1991). ‘Some Tests of Specification for Panel Data: Monte
Carlo Evidence and an Application to Employment Equations’, Review of Economic
Studies, 58, pp. 277-297.
Arellano, M. and S.R. Bond (1998). ‘Dynamic Panel Data Estimation using DPD98 for
GAUSS’, Mimeo, Institute for Fiscal Studies, London.
Arellano, M. and O. Bover (1995). ‘Another Look at the Instrumental-variable Estimation
of Error-components Model’, Journal of Econometrics, 68, pp. 29-52.
Arnold, J.M. and B. S. Javorcik (2005). ‘Gifted Kids or Pushy Parents? Foreign Acqui-
sitions and Plant Productivity in Indonesia’, Policy Research Working Paper Series
No3597, Washington: World Bank.
Baltagi, H.B. (1995). Econometric Analysis of Panel Data, Chichester: John Wiley &
Sons.
Bernard, A.B. and J.B. Jensen. 1995. ‘Exporters, Jobs, and Wages in U.S.Manufacturing:
1976-1987’, Brookings Papers on Economic Activity: Microeconomics, pp. 67-119.
Bernard, A.B., Jensen, J.B. and P.K. Schott (2006), ’Trade costs, firms and productivity,’
Journal of Monetary Economics, 53, pp. 917-937.
Blundell, R.W. and S.R. Bond (1998). ‘Initial Conditions and Moment Restrictions in
Dynamic Panel Data Models’, Journal of Econometrics, 87, pp. 115-143.
Blundell, R.W. and S.R. Bond (1999). ‘GMM Estimation with Persistent Panel Data:
An Application to Production Functions’, Institute for Fiscal Studies Working Paper
No. W99/4.
26

Clerides, S., Lach, S. and J. Tybout (1998). ‘Is Learning-by-Exporting Important? Micro-
Dynamic Evidence from Colombia, Mexico and Morocco’, Quarterly Journal of Eco-
nomics, 113, pp. 903-947.
Costinot, A. (2007). ‘On the Origins of Comparative Advantage’, Mimeo, University of
California, San Diego.
Damijan, P.J., Knell, M., Majcen, B. and M. Rojec (2003). ‘The Role of FDI, R&D Ac-
cumulation and Trade in Transferring Technology to Transition Countries: Evidence
from Firm Panel Data for Eight Transition Countries’, Economic Systems, 27, pp.
189-204.
Damijan, J.P., M. Knell, B. Majcen and M. Rojec (2008). ‘Impact of Firm Heterogeneity
on Direct and Spillover Effects of FDI: Micro Evidence from Ten Transition Coun-
tries’, Mimeo, University of Ljubljana
Damijan, P.J. and C. Kostevc (2006). ‘Learning-by-Exporting: Continuous Productivity
Improvements or Capacity Utilization Effects? Evidence from Slovenian Firms’,
Review of World Economics/Weltwirtschaftliches Archiv, 142, pp. 599-614.
De Loecker, J. (2007). ‘Do exports generate higher productivity? Evidence from Slovenia’,
Journal of International Economics, 73, pp. 69-98.
De Sousa, J. and O. Lamotte (2007). ‘Does Political Disintegration lead to Trade Dis-
integration? Evidence from Transition Countries’, Economics of Transition, 15, pp.
825-843.
Djankov, S. and B. Hoekman (1998). ‘Trade Reorientation and Post-Reform Productivity
Growth in Bulgarian Enterprises’, Journal of Economic Policy Reform, 2, pp. 151-
68.
Djankov, S. and B. Hoekman (2000). ‘Foreign Investment and Productivity Growth in
Czech Enterprises’, World Bank Economic Review, 14, pp. 49-64.
Eaton, J., Kortum, S. and F. Kramarz (2004), ‘Dissecting Trade: Firms, Industries, and
Export Destinations’, American Economic Review, 94, 150-154.
Feenstra, R., Markusen, J. and W. Zeile (1992). ‘Accounting for Growth with New Inputs:
Theory and Evidence’, American Economic Review, 82, pp. 415-421.
Gorodnichenko, Y., Svejnar, J. and K. Terrell (2007). ‘When Does FDI Have Positive
Spillovers? Evidence From 17 Emerging Market Economies’, CEPR Discussion Pa-
per No. 6546, London:CEPR.
27

Greenaway, D. and R. Kneller (2007). ‘Firm Heterogeneity, Exporting and Foreign Direct
Investment’, Economic Journal, 117, pp. 134-161.
Grossman, G. and E. Helpman (1991). Innovation and Growth in the Global Economy,
Cambridge, MA: MIT Press.
Halpern, L., Koren, M. and A. Szeidl (2005). ‘Imports and Productivity’, CEPR Discus-
sion Paper No. 5139, London: CEPR.
Hausman, R., Hwang J., and D. Rodrik (2007). ‘What you export matters’, Journal of
Economic Growth, 12, pp. 1-25.
Heckman, J.J. (1979). ‘Sample Selection Bias as a Specification Error’, Econometrica, 47,
pp. 153-161.
Hsiao, C. (1986). Analysis of Panel Data, Cambridge, MA: Cambridge University Press.
Javorcik, B. Smarzynska (2004). ‘Does Foreign Direct Investment Increase the Produc-
tivity of Domestic Firms? In Search of Spillovers Through Backward Linkages’,
American Economic Review, 94, pp. 605-27.
Konings, J. (2000). ‘The effects of foreign direct investment on domestic firms: evidence
from firm level data in emerging economies’, CEPR Discussion Paper No. 2586,
London: CEPR.
Levinsohn, J. and A. Petrin (2003). ‘Estimating Production Functions Using Inputs to
Control for Unobservables’, Review of Economic Studies, 70, pp. 317-342.
Markusen, J.R. (1989). ‘Trade in Producer Services and in Other Specialized Intermediate
Inputs’, American Economic Review, 79, pp. 85-95.
Melitz, M.J. and G.I.P. Ottaviano (2005), ‘Market Size, Trade, and Productivity’, NBER
Working Paper No. 11393.
Merlevede, B. and K. Schoors (2006). ‘FDI and the Consequences. Towards More Com-
plete Capture of Spillover Effects, Ghent University Working Paper No. 06/372,
Ghent.
Olley, S.G. and A. Pakes (1996). ‘The Dynamics of Productivity in the Telecommunica-
tions Equipment Industry’, Econometrica, 64, pp. 1263-1297.
Roberts, M. and J. Tybout (1997). ‘An Empirical Model of Sunk Costs and the Decision
to Export’, American Economic Review, 87, pp.515-61.
28

Schoors, K. and B. van der Tol (2002). ‘Foreign Direct Investment Spillovers within and
between Sectors: Evidence from Hungarian Data’, Ghent University Working Paper
No. 02/157, Ghent.
Wooldridge, J. (2002). Econometric Analysis of Cross Section and Panel Data, Cam-
bridge, Mass.: MIT Press.
Wooldridge, J. (2005). ‘On estimating firm-level production functions using proxy vari-
ables to control for unobservables’, Mimeo., Michigan State University.
29

6 Appendix
Table 8: SEE countries and WTO membership
Member since:Albania September 8th, 2000Bulgaria December 1st, 1996Croatia November 30th, 2000Macedonia April 4th, 2003Romania January 1st, 1995Slovenia July 30th, 1995
Under negotiation since:Bosnia-Herzegovina July 15th, 1999Montenegro February 15th, 2005Serbia February 15th, 2005Source: WTO’s website, www.wto.org.
Table 9: Free trade agreements between SEE countries
Albania Bosnia-H. Bulgaria Croatia Macedonia Romania Serbia-M. SloveniaAlbania - 12/04 09/03 06/03 07/02 01/04 08/04 12/06bBosnia-H. 12/04 - 12/04 01/05 07/02 12/04 06/02 01/02Bulgaria 09/03 12/04 - 03/03a 01/00 07/97 06/04 01/99aCroatia 06/03 01/05 03/03a - 06/97 03/03a 07/04 01/98Macedonia 07/02 07/02 01/00 06/97 - 01/04 05/05 01/99Romania 01/04 12/04 07/97 03/03a 01/04 - 07/04 01/97aSerbia-M. 08/04 06/02 06/04 07/04 05/05 07/04 - 01/03Slovenia 12/06b 01/02 01/99a 01/98 01/99 01/97a 01/03 -Source: www.stabilitypact.org and www.wto.org. Notes: Dates refer to the entry in force of the agree-ments (mm/yy). a Indicates that trade liberalisation took place in the framework of the CEFTA(Central European Free Trade Agreement). Original CEFTA agreement was signed by Czech Republic,Hungary, Poland and Slovakia on December 1992. Slovenia joined in 1996, Romania in 1997, Bulgariain 1999, Croatia in 2003, Macedonia in 2006 and Albania, Bosnia-Herzegovina, Serbia and Montenegroin 2007. Slovenia, Bulgaria and Romania left CEFTA with the entry in the EU. b Indicates that tradeliberalisation took place in the framework of the Stabilization and Association Agreement between theEU and SEE countries.
30

PUBLISHED PAPERS IN THE SERIES 1. Lado Rupnik: THE NEW TAX SYSTEM IN SLOVENIA, IER, Ljubljana, 1993, 16 p. 2. Franc Kuzmin: SOME DILEMMAS IN THE THEORY OF COST-PUSH INFLATION –
SLOVENIAN CASE, IER, Ljubljana, 1993, 17 p. 3. Miroslav Glas: SLOVENE SMALL BUSINESS, IER, Ljubljana, 1993, 26 p. 4. Tine Stanovnik: SOCIAL SECURITY IN SLOVENIA, IER, Ljubljana, 1993, 14 p. 5. Peter Stanovnik, Ivo Banič: THE ROLE OF FDIs IN SLOVENIA'S ECONOMIC DEVELOPMENT,
IER, Ljubljana, 1993, 13 p. 6. Vladimir Lavrač: THE ADJUSTMENT OF THE SLOVENIAN MONETARY SYSTEM TO THE
EUROPEAN MONETARY INTEGRATION PROCESS, IER, Ljubljana, 1993, 14 p. 7. Andrej Kumar: EUROPEAN INTEGRATION – REALITY OR A DREAM?, IER, Ljubljana, 1994,
20 p. 8. Frančiška Logar, Danica Zorko: UPSWING OF TOURISM IN SLOVENIA, IER, Ljubljana, 1994, 23 p. 9. Milena Bevc: EDUCATIONAL CAPITAL IN SLOVENIA IN THE EARLY 90s, IER, Ljubljana, 1994,
28 p. 10. Franc Kuzmin: THE MAIN CHARACTERISTICS OF SLOVENE LABOUR MARKET DURING
TRANSITION PERIOD – THE PROBLEM OF UNEMPLOYMENT, IER, Ljubljana, 1994, 9 p. 11. Emil Erjavec, Miroslav Rednak, Jernej Turk: THE MAIN ISSUES INVOLVED IN THE ECONOMIC
TRANSITION OF SLOVENE AGRICULTURE, IER, Ljubljana, 1994, 16 p. 12. Stanka Kukar: THE HIDDEN ECONOMY AND THE LABOUR MARKET IN SLOVENIA IN THE
PERIOD OF TRANSITION, IER, Ljubljana, 1994, 16 p. 13. Milan Lapornik, Peter Stanovnik: INDUSTRIAL AND ENTERPRISE RESTRUCTURING IN
SLOVENIA, IER, Ljubljana, 1995, 24 p. 14. Vladimir Lavrač: COMMON CAPITAL MARKET OF CEFTA COUNTRIES – A POSSIBLE WAY
OF DEEPENING CEFTA, IER, Ljubljana, 1997, 15 p. 15. Valentina Prevolnik: HEALTH CARE REFORM IN SLOVENIA, IER, Ljubljana, 1997, 17 p. 16. Tine Stanovnik: THE TAX SYSTEM AND TAX REFORM IN SLOVENIA, IER, Ljubljana, 1997,
16 p.

WORKING PAPERS 1. Vladimir Lavrač: EXCHANGE RATE OF THE SLOVENIAN TOLAR IN THE CONTEXT OF
SLOVENIA'S INCLUSION IN THE EU AND IN THE EMU, IER, Ljubljana, 1999, 18 p. 2. Tine Stanovnik, Nada Stropnik: ECONOMIC WELL-BEING OF THE ELDERLY AND PENSION
REFORM IN SLOVENIA, IER, Ljubljana, 1999, 34 p. 3. Marjan Simončič, Franc Kuzmin: MACROECONOMIC EFFECTS OF THE PENSION REFORM IN
SLOVENIA, IER, Ljubljana, 1999, 26 p. 4. Jože Pavlič Damijan: EFFICIENCY OF FREE TRADE AGREEMENTS: DID THE REDUCTION
OF TRADE BARRIERS HAVE ANY EFFECT ON INCREASING TRADE BETWEEN SLOVENIA AND THE CEFTA COUNTRIES?, IER, Ljubljana, 1999, 18 p.
5. Boris Majcen: SECTOR PERFORMANCE IN THE SLOVENE ECONOMY: WINNERS AND LOSERS OF EU INTEGRATION, IER, Ljubljana, 2000, 37 p. + appendix
6. Peter Stanovnik, Art Kovačič: SOME QUESTIONS OF THE INTERNATIONAL COMPETITIVENESS OF NATIONAL ECONOMIES WITH EMPHASIS ON SLOVENIA, IER, Ljubljana, 2000, 24 p.
7. Janez Bešter: TAKEOVER THEORIES AND PREDICTION MODELS – THE CASE OF SLOVENIAN PRIVATISED COMPANIES, IER, Ljubljana, 2000, 16 p.
8. Jeffrey David Turk, Hedvika Usenik: BUYER SUPPLIER RELATIONSHIPS IN THE ENGINEERING INDUSTRIES IN SLOVENIA AND COMPARISONS WITH HUNGARY, IER, Ljubljana, 2000, 22 p.
9. Jože Pavlič Damijan, Boris Majcen: TRADE REORIENTATION, FIRM PERFORMANCE AND RESTRUCTURING OF SLOVENIAN MANUFACTURING SECTOR, IER, Ljubljana, 2001, 16 p.
10. Jože Pavlič Damijan, Boris Majcen, Matija Rojec, Mark Knell: THE ROLE OF FDI, R&D ACCUMULATION AND TRADE IN TRANSFERRING TECHNOLOGY TO TRANSITION COUNTRIES: EVIDENCE FROM FIRM PANEL DATA FOR EIGHT TRANSITION COUNTRIES, IER, Ljubljana, 2001, 26 p.
11. Matija Rojec, Jože Pavlič Damijan, Boris Majcen: EXPORT PROPENSITY OF ESTONIAN AND SLOVENIAN MANUFACTURING FIRMS: DOES FOREIGN OWNERSHIP MATTER?, IER, Ljubljana 2001, 22 p.
12. Nevenka Hrovatin, Sonja Uršič: THE DETERMINANTS OF FIRM PERFORMANCE AFTER OWNERSHIP TRANSFORMATION IN SLOVENIA, IER, Ljubljana, 2001, 21 p.
13. Vladimir Lavrač, Tina Žumer: EXCHANGE RATE ARRANGEMENTS OF ACCESSION COUNTRIES IN THEIR RUN-UP TO EMU: NOMINAL CONVERGENCE, REAL CONVERGENCE AND OPTIMUM CURRENCY AREA CRITERIA, IER, Ljubljana, 2002, 35 p.
14. Vladimir Lavrač: MONETARY, FISCAL AND EXCHANGE RATE POLICIES FROM THE VIEWPOINT OF THE ENLARGEMENT OF THE EUROZONE: SURVEY OF THE LITERATURE, IER, Ljubljana, 2002, 21 p.
15. Jože Pavlič Damijan, Črt Kostevc: THE EMERGING ECONOMIC GEOGRAPHY IN SLOVENIA, IER, Ljubljana 2002, 30 p.
16. Boris Majcen: THE EFFECTS OF FOREIGN TRADE LIBERALIZATION AND FINANCIAL FLOWS BETWEEN SLOVENIA AND EU AFTER THE ACCESSION, IER, Ljubljana 2002, 33 p.
17. Jože Pavlič Damijan, Mark Knell, Boris Majcen, Matija Rojec: TECHNOLOGY TRANSFER THROUGH FDI IN TOP-10 TRANSITION COUNTRIES: HOW IMPORTANT ARE DIRECT EFFECTS, HORIZONTAL AND VERTICAL SPILLOVERS?, IER, Ljubljana, 2003, 23 p + appendix

18. Jože Pavlič Damijan, Črt Kostevc: THE IMPACT OF EUROPEAN INTEGRATION ON ADJUSTMENT PATTERN OF REGIONAL WAGES IN TRANSITION COUNTRIES: TESTING COMPETITIVE ECONOMIC GEOGRAPHY MODELS, IER, Ljubljana, 2003, 27 p.
19. Vladimir Lavrač: ERM 2 STRATEGY FOR ACCESSION COUNTRIES, IER, Ljubljana, 2003, 21 p. 20. Renata Slabe Erker: ENVIRONMENTAL SUSTAINABILITY IN SLOVENIA, IER, Ljubljana, 2003,
25 p. 21. Tine Stanovnik, Miroslav Verbič: PERCEPTION OF INCOME SATISFACTION AND
SATISFACTION WITH THE QUALITY OF LIVING; AN ANALYSIS OF SLOVENIAN HOUSEHOLDS, IER, Ljubljana, 2003, 18 p.
22. Vladimir Lavrač: FULFILLMENT OF MAASTRICHT CONVERGENCE CRITERIA FOR SLOVENIA AND OTHER ACCEDING COUNTRIES. IER, Ljubljana, 2004, 15 p.
23. Janez Bešter: ANATOMY OF A POST-MERGER INTEGRATION: THE CASE OF SLOVENIA. IER, Ljubljana, 2004, 21 p.
24. Miroslav Verbič: ECONOMETRIC ESTIMATION OF PARAMETERS OF PRESERVATION OF PERISHABLE GOODS IN COLD LOGISTIC CHAINS. IER, Ljubljana, 2004, 33 p.
25. Egbert L. W. Jongen: AN ANALYSIS OF PAST AND FUTURE GDP GROWTH IN SLOVENIA.
IER, Ljubljana, 2004, 42 p.
26. Egbert L. W. Jongen: FUTURE GDP GROWTH IN SLOVENIA: LOOKING FOR ROOM FOR
IMPROVEMENT. IER, Ljubljana, 2004, 37 p.
27. Peter Stanovnik, Marko Kos: TECHNOLOGY FORESIGHT IN SLOVENIA. IER, Ljubljana, 2005,
22 p.
28. Art Kovačič: COMPETITIVENESS AS A SOURCE OF DEVELOPMENT. IER, Ljubljana, 2005, 25 p.
29. Miroslav Verbič, Boris Majcen, Renger van Nieuwkoop: SUSTAINABILITY OF THE SLOVENIAN
PENSION SYSTEM: An ayalysis with an overlapping-generations General Equilibrium Model. IER,
Ljubljana, 2005. 24 p.
30. Miroslav Verbič: AN ANALYSIS OF THE SLOVENIAN ECONOMY WITH A QUARTERLY
ECONOMETRIC MODEL. IER, Ljubljana, 2006. 26 p.
31. Vladimir Lavrač, Boris Majcen: ECONOMIC ISSUES OF SLOVENIA'S ACCESSION TO THE EU.
IER, Ljubljana, 2006. 37 p.
32. Miroslav Verbič, Renata Slabe Erker: ECONOMIC VALUATION OF ENVIRONMENTAL VALUES
OF THE LANDSCAPE DEVELOPMENT AND PROTECTION AREA OF VOLČJI POTOK. IER,
Ljubljana, 2007. 28.p.
33. Boris Majcen, Miroslav Verbič. MODELLING THE PENSION SYSTEM IN AN OVERLAPING-
GENERATIONS GENERAL EQUILIBRIUM FRAMEWORK. IER, Ljubljana, 2007. 37 p.
34. Boris Majcen, Miroslav Verbič (corresponding author), Ali Bayar and Mitja Čok. THE INCOME TAX
REFORM IN SLOVENIA: SHOULD THE FLAT TAX HAVE PREVAILED? IER, Ljubljana, 2007.
29 p.
35. Miroslav Verbič. VARYING THE PARAMETERS OF THE SLOVENIAN PENSION SYSTEM: AN
ANALYSIS WITH AN OVERLAPPING-GENERATIONS GENERAL EQUILIBRIUM MODEL.
IER, Ljubljana, 2007. 28 p.

36. Miroslav Verbič, SUPPLEMENTARY PENSION INSURANCE IN SLOVENIA: AN ANALYSIS
WITH AN OVERLAPPING-GENERATIONS GENERAL EQUILIBRIUM MODEL. IER,
Ljubljana, 2007. 32 p.
37. Matjaž Črnigoj: RISK AVERSE INSIDERS WITH SPECIFIC OBJECTIVE FUNCTION AND
CAPITAL STRUCTURE. IER, Ljubljana, 2007. 13 p.
38. Renata Slabe Erker, Janez Filiplič: MONITORING SUSTAINABILITY FOR SLOVENIA’S
REGIONS. IER, Ljubljana, 2007, 22 p.
39. Jože P. Damijan, Črt Kostevc: TRADE LIBERALIZATION AND ECONOMIC GEOGRAPHY IN
TRANSITION COUNTRIES: CAN FDI EXPLAIN THE ADJUSTMENT PATTERN OF
REGINAL WAGES? IER, Ljubljana, 2008, 40 p.
40. Jože P. Damijan, Matija Rojec, Boris Majcen, Mark Knell: IMPACT OF FORM HETEROGENEITY
ON DIRECT AND SPILLOVER EFFECTS OF FDI: MICRO EVIDENCE FROM TEN
TRANSITION COUNTRIES. IER, Ljubljana, 2008, 25 p.
41. Jože P. Damijan, Črt Kostevc, Matija Rojec. INNOVATION AND FIRMS’ PRODUCTIVITY
GROWTH IN SLOVENIA: SENSIVITY OF RESULTS TO SECTORAL HETEROGENEITY AND
TO ESTIMATION METHOD. IER, Ljubljana, 2008, 37 p.

OCCASIONAL PAPERS 1. Helen O'Neill: IRELAND'S ECONOMIC TRANSITION: THE ROLE OF EU REGIONAL FUNDS
– AND OTHER FACTORS, IER, Ljubljana, 2000, 16 p.
2. Sanja Maleković: CROATIAN EXPERIENCE IN REGIONAL POLICY, IER, Ljubljana 2000, 13 p.
3. Peter Backé, Cezary Wójcik: ALTERNATIVE OPTIONS FOR THE MONETARY INTEGRATION
OF CENTRAL AND EASTERN EUROPEAN EU ACCESSION COUNTRIES, IER, Ljubljana, 2002,
17 p.
4. Andreas Freytag: CENTAL BANK INDEPENDENCE IN CENTRAL AND EASTERN EUROPE ON
THE EVE OF EU-ENLARGEMENT, IER, Ljubljana, 2003, 29 p.
5. Jasmina Osmanković: REGIONALIZATION AND REGIONAL DEVELOPMENT IN BOSNIA AND
HERZEGOVINA IN THE POST-WAR PERIOD, IER, Ljubljana, 2004, 16 p.
6. Carlos Vieira, Isabel Vieira, Sofia Costa: MONETARY AND FISCAL POLICIES IN EMU: SOME
RELEVANT ISSUES, IER, Ljubljana, 2004, 36 p.
7. Bojan Radej. THE FOUR CAPITAL MODEL, MATRIX AND ACCOUNTS. IER, Ljubljana, 2007.
25 p.