working paper - pure.iiasa.ac.atpure.iiasa.ac.at/3163/1/wp-88-042.pdfakira tani june 1988 wp-88-42...
TRANSCRIPT

W O R K I N G PAPER
PENETRATION MECHANISM OF NEW TECHNOLOGIES: INTEGRATION FORMULATION FROM THE COMPANY LEVEL TO THE MACROECONOMIC LEVEL
Akira Tani
June 1988 WP-88-42
I n t e r n a t i o n a l I n s t i t u t e for Applied Systems Analysis

NOT FOR QUOTATION WITHOUT P E R M I S S I O N O F THE AUTHOR
PENETRATION MECHANISM O F NEW TECHNOLOGIES: INTEGRATED FORMULATION FROM THE COMPANY LEVEL TO THE MACROECONOMIC LEVEL
A k i r a T a n i
June 1 9 8 8 WP-88-42
Working Papere are i n t e r i m reports on w o r k of the I n t e r n a t i o n a l I n s t i t u t e f o r A p p l i e d S y s t e m s A n a l y s i s and have received o n l y l i m i t e d r e v i e w . V i e w s o r o p i n i o n s expressed h e r e i n do n o t necessar i ly repre- s e n t those of t h e I n s t i t u t e o r of i t s N a t i o n a l M e m b e r O r g a n i z a t i o n s .
INTERNATIONAL I N S T I T U T E FOR A P P L I E D SYSTEMS ANALYSIS A - 2 3 6 1 L a x e n b u r g , A u s t r i a
FOREWORD
One of the most important tasks of the CIM project is to
understand the diffusion mechanism of advanced manufacturing
technologies such as CIM and its components.
The author developed a macroeconometric forecasting model of
in his first paper, entitled "Future Penetration of Advanced
Industrial Robots in the Japanese Manufacturing Industry". In
addition, his second paper pointed out the importance of the
company size factor in the diffusion of technologies by means of
quantitative analyses. The present paper proposes an integrated
formulation of the diffusion mechanism of costs/benefits from the
company level (micro- level > to the macroeconomic level by introducing the factors related to company size. This is quite
an interesting quantitative and methodological approach, which
includes a new kind of elements. However, it should be kept in
mind that so far the model is only valid for the technologies,
which are mainly driven by labor substitution.
It is hoped that the approach proposed in this paper will be
applied to build up the forecasting model of CIM diffusion.
Prof. Jukka Ranta
Proj ect Leader
Computer Integrated Manufacturing

Summary
A new approach to formulate the penetration mechanism of
advanced technological equipment into industry is proposed in
this paper. This approach aims at the integration of the company
level (micro-level) and the industry level (macro-level) into the
penetration mechanism.
Our model is formulated on the basis of several empirical
laws observed in the real world. As a result, the following
factors are introduced into the model:
a) Cost/benefit judgement at the company level;
b) Economy of scale in user costs;
c) Wage rate gap between large and small companies;
d) Company size distribution;
e) Decreasing price of advanced technological equipment;
f) Increase of the wage rate.
Although we introduce many parameters related to the above
factors, we can derive the final mathematical form of our model
as a kind of Gompertz curves.
New sophisticated implications can be added to the
parameters of the Gompertz curves through our model.
This model focuses on the benefits of labor-saving.
However, the formulation itself is also applicable to other kinds
of benefits, if the benefits can be expressed as a function of
company size.

Contents
Foreword
Summary
1. Introduction
2. Empirical Laws in Technology Diffusion
3. Formulation
4. Implications
5. Numerical examples
6. Conclusions
References
Appendix A - Notation of Variables and Parameters
Appendix B - General Form of Model

1. Introduction
One of the most important tasks of the CIM project is to
understand the diffusion mechanism of advanced manufacturing
technologies, such as CIM and its components.
Generally speaking, there are two different approaches to
the diffusion problems. One is called the micro-level approach,
which focuses on the decision-=king problem in introducing the
advanced technologies at the companyr (or factory) level.
Cost/benefit analyses are carried out through a lot of case
studies. The other is called the macro-level approach, which
deals with the diffusion process of the technologies into the
industries by means of statistical data and methods.
Macroeconomic models are developed to forecast the future
diffusion C Tani, 1987a; Mori, 1987; Tchijov, 1987b1. However,
there are many difficulties concerning the interrelation between
these models.
The present paper proposes an integrated approach from the
micro-level to the macro-level as a mathematical model. In his
earlier paper on the "Enterprise Size and its Impact on
Penetration of Industrial Robots - Application of Econometric
Analysis" C Tani, 1987bl the author shows that the distribution of
company size is one of the most important factors affecting the
penetration. Maly C 1987al has also pointed out the importance of
the company size.
By introducing the company size factor, the author makes an
effort, in this paper, to build a bridge between cost/benefit
analyses at the company level and the diffusion curve at the
macro-level.
2 , Empirical Laws in Technolo~y Diffusion
When we review the past history the technology, we can
observe some kinds of broad, general trends in the diffusion
processes of new technological equipment into industries. These
general trends might be called "empirical laws" in technology
diffusion. The following "empirical laws" are used in our
formulation of penetration mechanisms.
' In this paper, "company" means establishment (or factory in most cases of manufacturers) rather than enterprise.

<I> Decreasing price of advanced equipment.
The price has a tendency to decrease year by year, although
it is high at the initial stage of diffusion. The reasons
generating this tendency could be classified into the
following factors:
a) The technological innovation effect (see Figure 1);
b) The "Economy of scale" effect in production (see Figure
2);
C) The "Experience curve" (or learning curve) effect in
product ion (see Figure 31, C Tani, 1987b; Ayres 8 Funk,
19871 . However, it is difficult to extract these three effects
separately from the statistical data because they work
simultaneously to reduce the costs of production in the real
diffusion process.
(2 ) Large companies (or factories) introduce the advanced
equipment earlier than smaller companies in terns of the
statistical (macro-level> diffusion rate (see Figure 4 ) . In
other words, this says that most of the advanced equipment
is introduced in large companies at an early stage of
diffusion in terms of share of equipment number installed.
This does not mean that large companies are simply more
innovative in technology adoption.
For example, the following should be noted:
large companies small companies
Number of companies 2 Company size (employees) 1000 Units/company 100 Number of units 200
(= 2 x 100)
In the above cases, small companies are more innovative (10
to 21, while most units are introduced in large companies
(200 to 30).
(3) Decision-making to introduce the advanced equipment at the
company level depends mainly on the cost/benefit evaluation
criterion CJIRA, 1984; Maly, 1987b; Sheinin & Tchijov, 1987;
ECE 19861. If the major benefit is a labor-saving effect,
the relative cost of equipment to wage rate becomes the most

-3 -
COST -DUCTION FOR RANDOM ACCESS MEMORY
Figure 1. Technological innovation effect Source [Ayres, 19871.

Unit production cost
, Q
Annual production quantity
Figu re 2 . Economy of s c a l e e f f e c t
Unit production cost
Cumulated units of production
Figu re 3 . Exper ience curve e f f e c t

P e n e t r a t i o n R a t e o f I . R .
U/L I
S I Z E (Number o f Workers )
Figure 4. Penetration rate of I.R. by size of establish- ments in Japanese whole manufacturing industry (final estimation)
Source: [Tani 1987bl .

important factor in decision-wking C Mori, 1987; Tani,
1987a; Ayres, Brautzsch & Mori, 19871.
( 4 ) "Economy of scale" in user costs.
The cost-performance of advanced equipment has a tendency to
be better in larger companies than in smaller companies Csee
Figure 5). Small companies must pay not only the fixed
costs, but also additional costs to improve their
capabilities to use advanced equipment effectively.
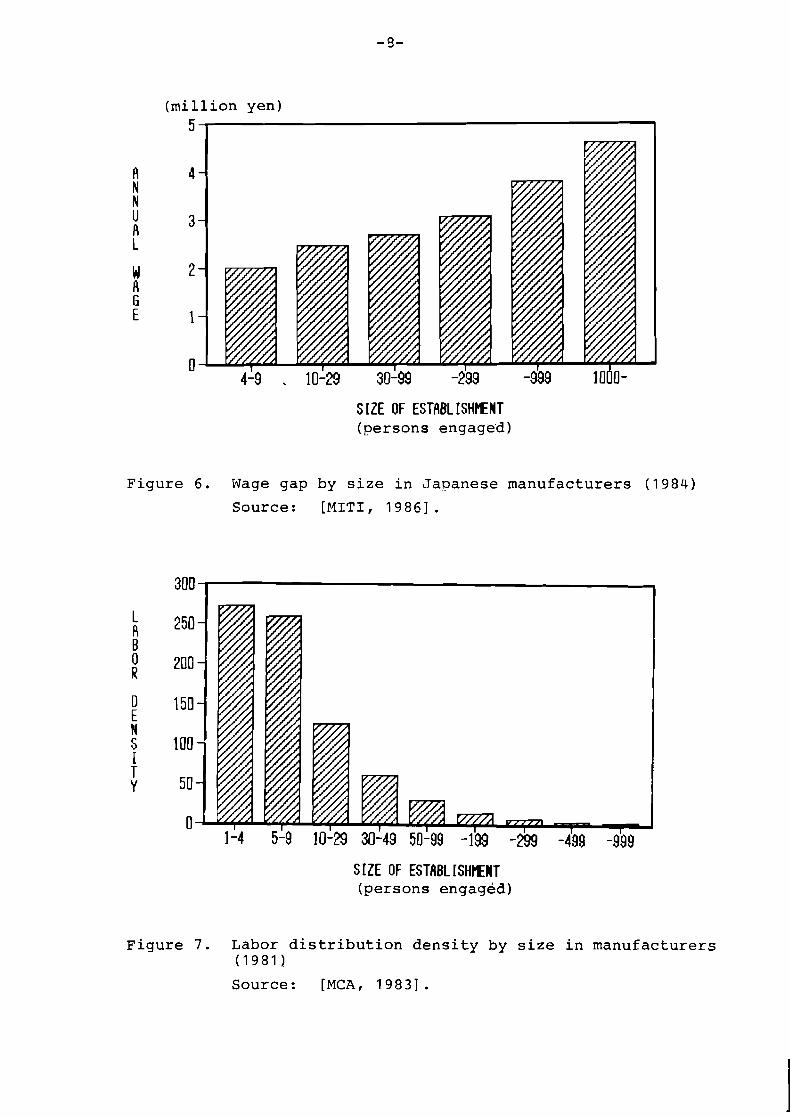
(5) The wage gap between large and small companies (see Figure
6 ) .
(6) Company size distribution (see Figure 7).
Small and medium-sized companies have a great share of labor
in industry.
The above two tendencies are clearly observed in Japan.
The same patterns are also seen in the U.S. A., although the
differences among company sizes are smaller than in Japan.
( 7 ) As the diffusion proceeds with technological progress and
price reduction, various applications of advanced equipment
appear; the equipment is of higher quality and is used in
the broader industrial sectors, which accelerates the
further diffusion of technologies.
3. Formulation
This chapter formulates the penetration mechanism of
advanced technological equipment into industry, based upon the
empirical laws discussed in the previous chapter. As explained
before, various applications and user-oriented industrial sectors
of the equipment are potentially considered C J IRA, 1985; Tani,
1987cl. Therefore, we should first make a kind of matrix
(sectors x applications). Then, the penetration mechanism for
each cell of the matrix should be generally formulated. After
that we will be able to apply the penetration model for each cell
to other cells, and finally obtain the total diffusion process by
summing up the results of these cells.
In other words, it is important to keep in mind the
following three-dimensional diffusion of technologies into
industry.
a> Diffusion from large companies to smaller companies;
b) Diffusion to other sectors having the same application;

Average Monthly EDP Expenses per Worker ( i n 1000 yen per month)
- 8 - 8 - I@ - * Y U U U 1 a 8 I # 1 I I I I I ) Number o f b
0.1 u ma I 8 S I@ - - - - - - ( i n 1000 pe
R=0.98 Samples: 236
c: EDP expenses i n m i l l i o n yen/month x: Number of workers i n thousands
Batch P r o c e s s i n g System
Figure 5. Economy of scale in EDP expenses (company size and EDP expenses
Source: [JIPDEC, 19871 .
( m i l l i o n y e n ) 5 , I
S [ZE OF ESTRBL I S H K N T ( p e r s o n s engage'd)
F i g u r e 6 . Wage g a p by s i z e i n J a p a n e s e m a n u f a c t u r e r s (1984)
Source : [P.IITI, 19861 .
S I Z E OF ESTRBL I S H K N T ( p e r s o n s engaged )
F i g u r e 7 . Labor d i s t r i b u t i o n d e n s i t y by s i z e i n m a n u f a c t u r e r s (1981)
Source : [MCA, 19831.

c, Diffusion to other applications within the same sector.
This concept is illustrated in Figure 8. Therefore we will
hereafter focus on the formulation of the penetration mechanism
for a given cell.
(1) Distribution of Company Size
First, we introduce the number of employees in some
company (x) as an index of company size.
Labor distribution density corresponding to company
size x in a given industrial sector is denoted as f(x),
which satisfies the following equation:
where
L denotes the total number of labor in a given industry, and
f(x>dx gives the number of employees in the companies whose
size is within the range C x, x+dxl . In our model the exponential function is assumed as a
distribution density function
where parameters and A are positive.
By substituting equation (2) into (11, parameter A is
expressed in the following equation:
(2 > Decision-making mechanism at the company level
Firstly, it is assumed that the number of units Cu(x>l
introduced in company of size x is proportional to the
number of employees (x) as shown below.
where parameter u, denotes the density of advanced equipment
in terms of units, per employee.

Applications
Figure 8. Three-dimensional diffusion of high technological equipment.

Secondly , w e i n t r o d u c e l < x > a s l a b o r s a v e d by u s i n g t h e
advanced equipment i n company of s i z e x . Then, l < x > is
assumed p r o p o r t i o n a l t o u < x > a s shown i n e q u a t i o n (5).
where pa ramete r 1 , d e n o t e s t h e number of workers t h a t c a n be
reduced by i n t r o d u c i n g one u n i t of t h e equipment .
T h i r d l y , inves tment c o s t C C ( x , t ) I f o r i n t r o d u c i n g u ( x >
u n i t s of equipment is assumed p r o p o r t i o n a l t o t h e number of
u n i t s , u ( x > . C(x , t > c a n be e x p r e s s e d i n t h e f o l l o w i n g
e q u a t ion:
where p ( x , t > d e n o t e s t h e u n i t c o s t .
According t o t h e laws of t e c h n o l o g i c a l p r o g r e s s and
economy of s c a l e i n u s e r c o s t , a s e x p l a i n e d i n t h e p r e v i o u s
c h a p t e r , u n i t c o s t p < x , t ) c a n be e x p r e s s e d a s f o l l o w s :
where x---- and e--'*+, d e n o t e t h e e f f e c t s of "economy of s c a l e "
i n u s e r c o s t , and t h e d e c r e a s i n g p r i c e by t e c h n o l o g i c a l
p r o g r e s s , r e s p e c t i v e l y . Parameter P,, is a c o n s t a n t
c o e f f i c i e n t .
On t h e o t h e r hand, t h e b e n e f i t s CB(x, t>l of l a b o r
s a v i n g c a n be e x p r e s s e d as shown below.
where w(x, t > d e n o t e s t h e annua l wage i n company of s i z e x a t
t i m e t .
According t o t h e e m p i r i c a l laws of t h e wage g a p and
wage i n c r e a s e e x p l a i n e d i n t h e p r e v i o u s c h a p t e r , t h e annua l
wage w(x, t ) c a n be e x p r e s s e d a s f o l l o w s :
W ( X , t ) = W,, xh epf .

where xt.. and eEJt. denote the effects of the wage gap and wage
increase, respectively. Parameter W,, is a constant
coefficient.
According to the assumptions stated above, we can
obtain the cost/benefit ratio (C/B) as shown below.
It is assumed that the company decides to introduce advanced
equipment if the ratio of investment costs to benefits (C/B)
is less than n years.
By substituting equation (11) for equation (la), the above
condition of introducing advanced equipment can be
transformed into the condition for company size x as
follows.
where
Condition (12) means that companies of a larger number of
employees than X (t > introduce the equipment.
(3) Diffusion at the macroeconomic level
The population of advanced equipment at the
macroeconomic level CU(t>l can be obtained by the following
equat ion.
"With regard to the pay-back time, see CSheinin & Tchijov, 19871 for FMS, and CJIRA, 19841 for Industrial Robots.

where U, (= u, - L) denotes the upper limit of the
population.
Finally, diffusion rate R(t) C = U(t)/U,l can be
expressed explicitly as follows:
The conditions for the parameters are shown as below.
The whole structure of this model is illustrated in Figure
9.
4. Implications
(1) Type of diffusion curve
By the differentials of R(t) in equation (15) we can
ascertain that our model R(t) has a kind of S-shaped
curves. r3
-"The Meaning of S-shaped curves in diffusion rates is discussed in C Tchi j ov, 1987a1 .

Rlt) = EXP I- q .*-'"I
Diffusion rate jR/, ------ curve
t time
f(x)\\; 1 J L [ $ *
L = c f ( x ) d x
Company sue (x ) X - Xl t )
I
I Investment cost CortI'Benefit
C1x.t) C/B
T Benefit of labor-raving
B(x.t)
Wage w1x.t)
Number of units Labor raved
ulx)
Company sue
Labor d~stribut~on
Figure 9. Structure of the model.
*) Rlt l

d q -- = . r . R . e--.l.-t. . (q.e--r't. - 1) dt'
A point of inflection (tt) can be calculated by solving the
equation
d 2R - - - 0 dt"
as shown below.
when t < tt
when t = tl:
when t > tt
In addition, R(t) has the following values at infinite
points:
By using tt instead of q, equation (15) can be transformed
into the following form:

The parameters t* and r can be interpreted as a time shift
and a diffusion speed, respectively.
Finally, it can be ascertained that our model becomes a
Gompertz curve CKotz 81 Johnson, 1983; Kurtz, 19843 which is
well known as a growth curve, as follows:
where
( 2 ) Implications
In order to clarify the meaning of our model equation
(15) in more detail, we analyze the impacts of the
parameters in our diffusion model. Partial derivatives of R
with respect to the parameters satisfy the following
conditions:
aR a~ a ~ " a ~ 4
(-1, (- > , - (-> > 0 a w,. a 1 ,, aa a P
Each paranreter in (38) gives a monotonous impact on the
diffusion. The equations in (30) show us the conditions for
promoting the diffusion as follows:
1) greater share of large companies (smaller A >

2) lower price of equipment (smaller P,)
3) higher wage rate (larger W,::.)
4) higher labor-saving effect (larger 1,)
5) more rapid price decrease (larger a)
6) more rapid wage increase (larger P). On the other hand, the parameters a and b give a non-
monotonous impact on the diffusion. In order to investigate
the impact by a and b, we introduce the following parameter
y instead of a and b for reasons of simplicity.
Equation (15) can be expressed in the following form by
using parameter y:
where
The resulting partial derivative of R with respect to y is
shown below.
when t < t,
when t = t,
when t > t,
where

The d i f f u s i o n r a t e a t t i m e t,:, R ( t , > , h a s t h e f o l l o w i n g
v a l u e , which depends o n l y on A , namely t h e parameter of
company s i z e d i s t r i b u t i o n .
According t o t h e r e s u l t s shown above, w e c a n d e r i v e t h e
impact of t h e p a r a m e t e r s of "economy of s c a l e i n u s e r c o s t s "
(pa ramete r a ) and "wage gap between l a r g e and small
companies" (pa ramete r b > on t h e d i f f u s i o n R ( t > a s f o l l o w s :
1) Larger a and b promote t h e d i f f u s i o n u n t i l t h e X d i f f u s i o n rate r e a c h e s e - .
2 ) However, l a r g e r a and b s low down t h e f u r t h e r d i f f u s i o n
a f t e r t h a t p o i n t .
3 ) The t u r n i n g p o i n t (t,,> a p p e a r s a t a lower d i f f u s i o n X ra te ( R ( t b C > = e- > i f t h e s h a r e of l a r g e companies is
smaller ( l a r g e r A > .
Although t h e impact of a + b is t h e o r e t i c a l l y complex, t h e
a c t u a l impact is e a s y t o unders tand because A < < l . Smaller
(a+b> d e l a y s t h e d i f f u s i o n , b u t t h e speed of d i f f u s i o n is
f a s t e r a f t e r t h e d i f f u s i o n h a s s u b s t a n t i a l l y se t i n .
5 . Numerical Examples
In o r d e r t o v i s u a l i z e t h e i m p l i c a t i o n s d e s c r i b e d i n t h e
p r e v i o u s c h a p t e r , some numer ica l examples a r e shown i n t h i s
c h a p t e r .
The p a r a m e t e r s a r e se t f o r a b a s i c case a s f o l l o w s :
t = 0 (1980)
A = 0 . 0 0 1
a+p = 0 . 0 5
a + b = 0 . 2
psz, = 30
W., = 1.5
1 a:.> = 1
n = 3

The curves of diffusion rate R(t) are shown in Figure 10.
The impacts of parameters A , (a+P) and (a+b) are also illustrated
in a visual way.
Supposing that unit prices for three applications, A, B, and
C, are 30, 40 and 50 at t = 0, respectively, the total diffusion
curve for A + B + C can be obtained by summing up the three curves as shown in Figure 11.
6. Conclusions
A new approach to formulate the penetration mechanism of
high technological equipment into industry has been proposed in
this paper. This approach aims at the integration of company-
level studies and macro-economic level studies in the penetration
mechanism. In other words, the outline of our model might be
summarized as follows:
a) The basic mechanism of penetration is a decision-making rule
to introduce the advanced equipment at the company level.
b) Cost/benef it at the company level depends upon the size of
the company, the technological progress and the wage
increase.
c) The diffusion rate at the macro-level is obtained by
applying the decision-making rule to the whole companies
through the distribution function of the company size.
d) Total diffusion of advanced equipment in the national
economy is calculated by applying the above procedures to
all industrial sectors and applications.
The formulation from a) to c) leads us finally to a simple
mathematical model which is a well-known Gompertz curve, although
we introduce the various factors as variables and parameters in
formulating the "empirical laws".
It might be concluded that the theoretical reasoning for
applying a Gompertz curve to forecast the diffusion of
technologies into industry is reinforced in this process.6
In addition, new sophisticated implications can be added to
the parameters of the Gompertz curve through our model as
sLogistic curves are usually applied, as, e. g. , in C Tani, 1978a; Tchi j ov, 1987bl .

1 990 2000 Year
1990 2000 Year
1 990 2000 Year
Figure 10. Numerical examples.

1990 2000 Year
Figure 1 1 . Typical diffusion curve for various applications.

described in Chapter 4. However, it should be noted that the
Gompertz curve model is an example of the results by the
formulation of penetration mechanism proposed by this paper.
To be more adequate for actual cases, we could adopt other
kinds of functions for sub-model equations, which would mean that
we could derive different shapes of diffusion curves from the
same formulation. In other words, the principal aim of this
paper is not to specify the shape of diffusion curves, but to
formulate the mechanism of penetration in a mathematical form.
Although we focused on the benefits of labor-saving in our
model, our formulation itself is also applicable to other cases,
in which other kinds of benefits dominate, if we can express the
benefits as a function of company size x.
Generally speaking, there are several kinds of benefits
generated by introducing advanced technologies. In the case of
CIM, the benefits from flexibility and quality of production are
considered to be important as well as labor-saving ones.
Our formulation in this paper assumes that the benefit at
company level is proportional to the wage rate and company size.
It should be noted that direct labor-saving is an example of such
benefits.
For instance, it might require additional labor to achieve
high flexibility and quality without advanced technologies. The
above benefits might be expressed as the saving of such
additional labor.
Finally, any model has its own limitations of applications.
The model proposed in this paper depends greatly upon the several
assumptions listed. If some assumptions are not adequate in
cases of applications to other sectors and countries, different
models could be derived from a similar formulation method.
In order to apply this model to real-world cases, some
modifications are necessary. The general form of our model is
explained in Appendix B. For example, the exponential function
of company size distribution shows a deviation in the range of
very small companies. As a decision-making criterion, a
probabilistic function should be introduced. The experience
curve or economy of scale in production should be incorporated
instead of the simple trend function.

However, i t may be concluded t h a t t h e mathematical model
proposed here can be regarded a s a u s e f u l s t e p towards f u r t h e r
i n v e s t i g a t i o n s on t h e d i f f u s i o n mechanism o f new t e c h n o l o g i e s
such as CIM.
REFERENCES
C Ayres, 19871 Ayres, R. U. Future Trends in Factory Automation. Working Paper WP-87-22.
C Ayres, Brautzsch & Mori , 19871 Ayres, R. U. , Brautzsch, H. -U. , & Mori, S. Computer Integrated Manufacturing and Employment: Methodological Problems of Estimating the Employment Effects of CIM: Application on the Macroeconomic Level. Vorking Paper VP-87-19.
CAyres Sr Funk, 19871 Ayres, R.U. & Funk, J.L. The Economic Benefits of Computer-Integrated Manufacturing (Paper I). Working Paper VP-87-39.
C ECE, 19861 Economic Commission for Europe. Recent Trends in Flexible Manufacturing, United Nations, 1986.
C J IPDEC, 19871 J IPDEC. White paper on Informatizat ion. Japan Information Processing Development Center, 1987.
C J IRA, 19841 J IRA. Report on Research and Study on the Analysis of Economic Results with Application of Industrial Robots. Japan Industrial Robot Association, June 1984.
C J IRA, 19851 J IRA. Long Range Forecasting of Demand for Industrial Robots in Manufacturing Sectors. Japan Industrial Robot Association, June 1985.
C Kotz & Johnson, 19831 Kotz, S. & Johnson, B. L. Encyclopedia of Statistical Sciences. John Wiley & Sons, Inc. , 1983.
C Kurtz, 19841 Kurtz, M. Handbook of Engineering Economics. McGraw-Hill, Inc. , 1984.
CMaly, 1987al Maly, M. Company Size, Age and Innovation Activity in the Steel Industry (Example of BOF Technology). Working Paper WP-87-36.
CMaly, 1987bl Maly, M. Economic Benefits of FMS (East-West Comparison). Vorking Paper WP-87-107.
C MCA, 19831 MCA. Establishment Census. Stat 1st ics Bureau, Management and Coordination Agency, Japan, 1983.
C MITI, 19861 MITI. Census of Manufacturers. Ministry of International Trade and Industry, Japan 1986.
CMori, 19871 Mori, S. Social Benefits of CIM: Labor and Capital Augmentation by Industrial Robots and BC Machine Tools in the Japanese Manufacturing Industry (Paper 11). Working Paper WP-87-40.
CSheinin & Tchijov, 19871 Sheinin, R. L. & Tchijov, I. Flexible Manufacturing Systems (FMS): State of Art and Development. Working Paper WP-87-17.

C Tani, 1987~~1 Tani, A . Future Penetration of Advanced Industrial Robots in the Japanese Manufacturing Industry: An Econometric Model. Working Paper WP-87-95.
CTani, 1987b1 Tani, A. Enterprise Size and Its Impact on Penetration of Industrial Robots: Application of Econometric Analysis. Working Paper WP-87-108.
CTani, 1987~1 Tani, A. International Comparisons of Industrial Robot Penetration. Working Paper WP-87-125.
1 Tchijov, 1987a1 Tchijov, I. The Cyclical Dynamics of Diffusion Rates. Working Paper WP-87-14.
[Tchijov, 1987bl Tchijov, I. CIM Diffusion: The Case of NC- machines in the U. S. Metalworking Industry. Working Paper WP-87-77.

APPENDIX A : N o t a t i o n of Variables a n d P a r a m e t e r s
U ( t > :
u w :
R ( t > :
t k :
t &,. :
company s i z e (number of employees i n company)
t o t a l number of employees i n i n d u s t r y
l a b o r d i s t r i b u t i o n d e n s i t y f u n c t i o n w i t h r e s p e c t t o
company s i z e x - A- x
p a r a m e t e r of l a b o r d i s t r i b u t i o n C f (x) a e I
number of u n i t s i n t r o d u c e d i n company o f s i z e x
d e n s i t y of advanced equipment ( u n i t s p e r employee)
l a b o r s a v e d by i n t r o d u c i n g advanced equipment i n
company of s i z e x
l a b o r s a v e d p e r u n i t of equipment
i n v e s t m e n t c o s t f o r i n t r o d u c i n g equipment i n company of
s i z e x a t t i m e t
u n i t c o s t of equipment i n company of s i z e x a t t i m e t
p a r a m e t e r showing t h e e f f e c t of "economy of scale" In
u s e r c o s t ( c o s t a x - - - l a )
a n n u a l r a t e of p r i c e d e c r e a s e ( p r i c e cr e -.."- > c o n s t a n t c o e f f i c i e n t which d e n o t e s t h e u n i t c o s t of
equipment i n company s i z e x = l a t t i m e t=8
b e n e f i t of l a b o r s a v i n g i n company of s i z e x a t t i m e t
a n n u a l wage i n company s i z e x st t i m e t
p a r a m e t e r showing t h e e f f e c t of t h e wage g a p between
l a r g e a n d small companies (wage cr xt-I->
a n n u a l wage i n c r e a s e r a t e !wage a e P t . , >
c o n s t a n t c o e f f i c i e n t which d e n o t e s t h e a n n u a l wage i n
company s i z e x=l a t t i m e t = 0
d e c i s i o n c r i t e r i o n f o r i n v e s t m e n t ( y e a r s )
s i z e of companies which decide t o i n t r o d u c e advanced
equipment a t t i m e t
p o p u l a t i o n of advanced equipment i n i n d u s t r y a t t i m e t o
uppe r l i m i t of t h e p o p u l a t i o n
d i f f u s i o n ra te of advanced equipment C R ( t > = U ( t ) / U w >
a p o i n t of i n f l e c t i o n i n R i t )
t u r n i n g p o i n t of impac t of p a r a m e t e r y


APPENDIX B: General Form of the Model
In Chapter 3 we specified the functions of p(x, t), w(x, t)
and f (x). In addition, we assumed the extreme criterion of
decision-making as shown in equation (11). These assumptions
might be too simple to apply the model to real cases.
Therefore, the general form of our model is explained as
follows:
where g(z, denotes a probabilistic decision-making function, and
z is defined below.
The function g(z> satisfies the following conditions:
As a function of g(z,, a cumulative logarithmic normal
distribution would be adequate.
where N( ) means a cumulative normal distribution function.
The shape of g(z> is illustrated in Figure B. Finally, in
case of a wider generalization, f(x> can also be treated as a
t ime-dependent function.
The experience curve could be incorporated into our model as
described below.
Instead of p(x,t), the following equation is introduced.

Figure B. Probabilistic decision-making function g(Z) 9

where H( ) a n d M., d e n o t e a f u n c t i o n of t h e e x p e r i e n c e c u r v e and
c u m u l a t i v e u n i t s of p r o d u c t i o n up t o t i m e t , r e s p e c t i v e l y .
M, c a n be e x p r e s s e d a s below i f t h e r e are no i m p o r t s and
e x p o r t s :
where m d e n o t e s a r e p l a c e m e n t p e r i o d .
Al though it is i m p o s s i b l e t o s o l v e t h e above e q u a t i o n s
a n a l y t i c a l l y w i t h r e s p e c t t o U ( t > , w e c o u l d a p p l y t h e above-
s t a t e d g e n e r a l model by n u m e r i c a l methods.