working paper series conference on household finance and ... · conference on “household finance...
TRANSCRIPT

CONFERENCE ON HOUSEHOLD FINANCE AND CONSUMPTION
WORK ING PAPER SER I E SNO 1304 / F EBRUARY 2011
by Sule Alan, Ruxandra Dumitrescuand Gyongyi Loranth
SUBPRIME CONSUMER CREDIT DEMAND
EVIDENCE FROM A LENDER’S PRICING EXPERIMENT

CONFERENCE ON HOUSEHOLD
FINANCE AND CONSUMPTION
1 We are grateful to the lender for generously providing us with the data. We especially thank the lender’s database managers who volunteered
a great deal of assistance. We thank Orazio Attanasio, James Banks, Martin Browning, Thomas Crossley, Mark Jenkins, Soren Leth-Petersen,
Valerie Lechene, Hamish Low, Nick Souleles, Philip Vermeulen and participants of the Cambridge-Wharton conference, BCL-ECB
conference and seminar participants at Cambridge University, Koc University, University of Copenhagen, the Institute
for Fiscal Studies (IFS) and Bundesbank-ECB for comments and suggestions. This research is funded
by the Cambridge Center for Financial Analysis and Policy (CFAP) and the University of Vienna.
2 Corresponding author: Faculty of Economics and CFAP, University of Cambridge, United Kingdom;
phone: +44 1223 335 283; e-mail: [email protected]
3 Faculty of Economics and CFAP, University of Cambridge, United Kingdom.
4 Faculty of Business, Economics and Statistics and
University of Vienna and CEPR.
This paper can be downloaded without charge from http://www.ecb.europa.eu or from the Social Science Research Network electronic library at http://ssrn.com/abstract_id=1761585.
NOTE: This Working Paper should not be reported as representing the views of the European Central Bank (ECB). The views expressed are those of the authors
and do not necessarily reflect those of the ECB.
WORKING PAPER SER IESNO 1304 / FEBRUARY 2011
SUBPRIME CONSUMER
CREDIT DEMAND
EVIDENCE FROM A LENDER’S
PRICING EXPERIMENT1
by Sule Alan 2, Ruxandra Dumitrescu 3 and Gyongyi Loranth 4
In 2011 all ECBpublications
feature a motiftaken from
the €100 banknote.

CONFERENCE ON “HOUSEHOLD FINANCE AND CONSUMPTION”
This paper was presented at the conference on “Household Finance and
Consumption”, which was co-organised by the Banque centrale du Luxembourg
and the ECB, and was held on 25-26 October 2010 in Luxembourg. The
organising committee consisted of Michael Ehrmann (ECB), Michalis
Haliassos (CFS and Goethe University), Thomas Mathä (Banque centrale du
Luxembourg), Peter Tufano (Harvard Business School), and Caroline Willeke
(ECB). The conference programme, including papers, can be found at
http://www.ecb.europa.eu/events/conferences/html/joint_ecb_lux.en.html. The
views expressed in this paper are those of the authors and do not necessarily
reflect those of the Banque centrale du Luxembourg, the ECB or the
Eurosystem.
© European Central Bank, 2011
AddressKaiserstrasse 2960311 Frankfurt am Main, Germany
Postal addressPostfach 16 03 1960066 Frankfurt am Main, Germany
Telephone+49 69 1344 0
Internethttp://www.ecb.europa.eu
Fax+49 69 1344 6000
All rights reserved.
Any reproduction, publication and reprint in the form of a different publication, whether printed or produced electronically, in whole or in part, is permitted only with the explicit written authorisation of the ECB or the authors.
Information on all of the papers published in the ECB Working Paper Series can be found on the ECB’s website, http://www.ecb.europa.eu/pub/scientific/wps/date/html/index.en.html
ISSN 1725-2806 (online)

3ECB
Working Paper Series No 1304February 2011
Abstract 4
1 Introduction 5
2 Subprime credit card market in the UK 9
3 Theoretical framework 10
4 Data and experimental design 13
4.1 Implementation 16
4.2 Other threats to internal validity 17
5 Assessing the experimental design 18
6 Results 20
6.1 Experimental estimates 20
6.2 Heterogeneity in treatment effects 24
6.3 Can econometrics replicate the experiment? 25
7 Conclusion 30
References 32
Tables 34
CONTENTS

4ECBWorking Paper Series No 1304February 2011
Abstract
We test the interest rate sensitivity of subprime credit card borrowers using a unique panel data
set from a UK credit card company. What is novel about our contribution is that we were given
details of a randomized interest rate experiment conducted by the lender between October 2006
and January 2007. We �nd that individuals who tend to utilize their credit limits fully do not
reduce their demand for credit when subject to increases in interest rates as high as 3 percentage
points. This �nding is naturally interpreted as evidence of binding liquidity constraints. We
also demonstrate the importance of truly exogenous variation in interest rates when estimating
credit demand elasticities. We show that estimating a standard credit demand equation with
nonexperimental variation leads to seriously biased estimates even when conditioning on a rich
set of controls and individual �xed e¤ects. In particular, this procedure results in a large and
statistically signi�cant 3-month elasticity of credit card debt with respect to interest rates even
though the experimental estimate of the same elasticity is neither economically nor statistically
di¤erent from zero.
Keywords: subprime credit; randomized trials; liquidity constraints.
JEL Classi�cation: D11, D12, D14

5ECB
Working Paper Series No 1304February 2011
1 Introduction
Borrowing rates a¤ect �rms�and households�demand for credit. Quantifying such e¤ects, i.e.,
estimating credit demand elasticities, has become an increasingly important academic endeav-
our. At the micro level, lenders are interested in gauging these elasticities as an input to their
optimal loan pricing strategies. At the macro level, knowledge of these elasticities is essential for
the conduct of monetary policy. Moreover, they can be informative regarding whether house-
holds are credit constrained. This is of course important given policy concern with the �nances
of poor and vulnerable households.
In estimating the sensitivity of credit demand to borrowing rates, the major di¢ culty faced
by researchers is that genuinely exogenous variation in borrowing rates is rarely observed. For
example, the observed cross sectional variation in interest rates is likely to be endogenous
to borrowing and repayment behavior through unobservable characteristics of the borrowers.
Researchers try to overcome this problem by using quasi-experimental designs. Attanasio et al
(2008) estimate interest rate elasticities of car loan demand exploiting the tax reform of 1986 in
the US. Alessie et al (2005) analyze the same issue using a similar design. Gross and Souleles
(2002) use the US Credit Bureau data and exploit some �rm-speci�c practices to instrument
borrowing rates. Adams et al (2007) use data on a US private subprime auto loan company. The
general conclusion drawn from the studies is that there seems to be no sensitivity to borrowing
rates among low income households. However, such households display some sensitivity to
loan features related to liquidity, such as down payment requirements, credit limits and loan
maturities. This �nding is interpreted as the presence of binding liquidity constraints1. All the
studies mentioned above rely on identifying assumptions and may be subject to criticism.
Similar to the literature cited above, we estimate the sensitivity of credit demand to interest
rates. For this, we use a unique panel data set on detailed credit card transactions from a private
1The exception is the Gross and Souleles (2002) study where the authors �nd evidence of signi�cant elasticityof credit card debt with respect to interest rates.

6ECBWorking Paper Series No 1304February 2011

7ECB
Working Paper Series No 1304February 2011

8ECBWorking Paper Series No 1304February 2011

9ECB
Working Paper Series No 1304February 2011
card market in the next section. In Section 3, we present a simple life cycle model to motivate
the choice of our outcome variable. Data and the experimental design are explained in detail in
section 4. We assess the lender�s experiment to pin down the expected statistical and economic
e¤ects in Section 5. We present and discuss the experimental and nonexperimental estimates
in section 6. Section 7 concludes.
2 Subprime Credit Card Market in the UK
Credit cards have steadily grown in importance as a payment device in all industrialized coun-
tries. As of 2007, it is estimated that approximately 70 million credit cards were in issue in the
UK (see Data Monitor Report (2008)). Moreover, borrowing on credit cards (revolving credit
card debt from one month to the next, therefore incurring interest charges) grew rapidly over
the last few decades in the UK, attracting much attention from consumer protection groups,
regulatory bodies and, of course, the media. In 2007 total credit card debt stood at around £ 65
billion, representing approximately 30% of consumer credit in the UK.
Consumers who are not considered suitable for unsecured credit by the mainstream issuers
comprise the UK "nonstandard" credit card market. By de�nition, individuals deemed to be
nonstandard borrowers are more di¢ cult to evaluate in terms of default risk. This can be due
to volatile income (many self-employed), low income (unemployed), the lack of credit history in
the UK, or impaired credit history due to past defaults or mortgage arrears. Approximately 7
million individuals in the UK fall into this category, and they are in possession of approximately
6 million nonstandard credit cards as of 2007 (8.6% of total credit cards in issue)6. The average
member of the nonstandard population has 0.85 cards whereas the average number of cards
held by the prime segment is 1.5. The most distinctive feature of a nonstandard credit card is
the high interest charged for the revolving debt. The rate is typically around 30-40%, with the
6Reasons to fall into the non-standard catagory are: absence of a bank account, unemployment, being anincome support claimant, CCJs record, mortgage arrears and repossesions record, bankruptcy record and beinga self employed with less than three years�proof of income.

10ECBWorking Paper Series No 1304February 2011
highest observed rate around 70% 7. A typical nonstandard borrower usually starts with a very
small credit limit like £ 150 and the credit limit generally remains around £ 5008.
The term "subprime" refers to a subsection of the nonstandard market in the UK. This
subsection usually comprises individuals with adverse credit histories i.e., individuals with an
even higher risk of default than the typical nonstandard individual. Therefore, issuers who
target this segment exclusively (such as our lender) invest heavily in advanced risk based pricing
practices to combat the adverse e¤ect of delinquencies and bankruptcies. Our lender serves the
"subprime" segment and targets self employed individuals with low income and individuals who
are a¤ected by County Court Judgements (CCJs)9. The presence of CCJs, in general, is the
most common reason to fall into the subprime category. As of 2007, the number of credit cards
held by individuals with a CCJ was approximately 2.9 million. The second most common reason
is being self-employed (1.3 million cards).
3 Theoretical Framework
In this section we lay out a simple dynamic model of consumption tailored for individuals in
our data set. The exposition is intended to determine a meaningful choice variable for credit
card borrowing. This variable is then used as an outcome variable to estimate interest rate
sensitivity.
Assume that the generic individual is a lifetime utility maximizer with a time separable
utility function. Assume further that the only tool available to him to implement his desired
consumption pro�le is credit card borrowing. His problem can be written as a two period
7A policy of interest rate ceilings for credit has not been adopted in the UK. Such policies, although debated,are considered conterproductive as they may drive vulnarable consumers such as those with low income and/orlimited credit history into illegal credit markets.
8To provide a comparison, the interest rate applied to a typical mainstream card is around 15-18% with acredit limit of £ 2000 and above.
9County Court Judgement refers to an adverse ruling of the County Court against a person who has notsatis�ed debt payments with their creditors. An adverse ruling remains on the individual�s record for six yearsfrom the date of judgement. CCJs are the attribute most comonly associated with subprime individuals in theUK. Unfortunately we do not have information on whether an individual has a CCJ or not in our data set.

11ECB
Working Paper Series No 1304February 2011

12ECBWorking Paper Series No 1304February 2011

13ECB
Working Paper Series No 1304February 2011
4 Data and Experimental Design
Our data set is provided to us by a private credit card issuer which operates in the subprime
segment of the UK market. It speci�cally targets self employed individuals with low income and
individuals who are a¤ected by County Court Judgements (CCJs). For con�dentiality reasons,
the limited number of nonstandard credit card issuers in the UK prevents us from giving the
exact market share of our lender. Nevertheless, we can say that it is one of the major players in
the subprime market. It has several credit card products all with conditions typically observed
in subprime markets such as high interest rates and low credit limits. The data set comprises all
individual transactions including purchases, payments and interest charges, as well as minimum
payment requirements. We also have income, age and marital status reported by individuals
at the application stage. Unfortunately, we do not have information about individuals�other
credit commitments such as mortgages and other consumer loans.
Since 2006, the lender has routinely performed randomized interest rate experiments on sub-
samples of their clients. The company further informed us that they only raised (or lowered)
interest rates on individual accounts via controlled experiments, not in any other fashion. Each
experiment lasted around 3-6 months and the lender initiated another experiment immediately
following the previous one. Interest rate changes were permanent until the next change took ef-
fect. The proportion of individuals allocated to control groups became increasingly smaller with
each new experiment. All interest rate experiments were designed based on ex-ante determined
blocks which we will explain in greater detail below.
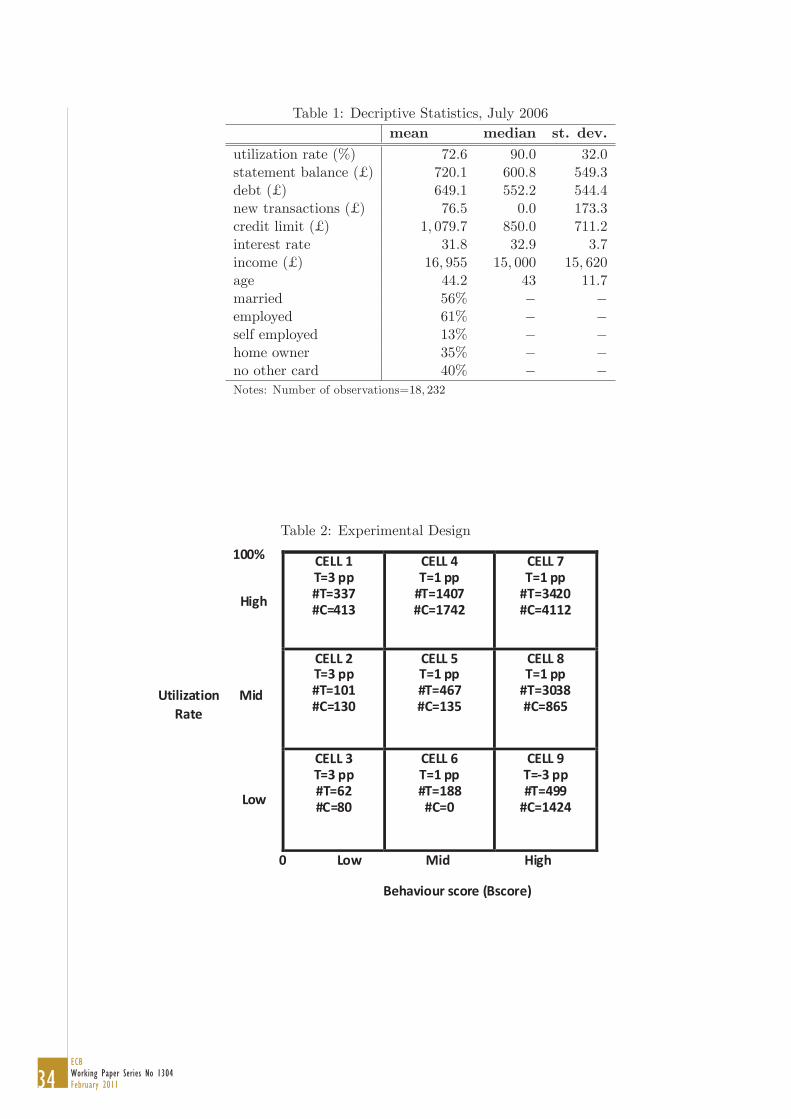
The lender agreed to provide us with one of the experiments that was designed in July
2006 and implemented in October 2006, involving 18,900 individuals. In January 2007, another
experiment was implemented with 27,000 individuals and some of the individuals in our experi-
ment were included in the next experiment. Therefore, the e¤ect of interest rate changes can be
cleanly measured only over the three months following the implementation of the experiment.

14ECBWorking Paper Series No 1304February 2011

15ECB
Working Paper Series No 1304February 2011

16ECBWorking Paper Series No 1304February 2011
rates and low behavior scores (high default risk) in July 2006. In this cell, 337 individuals
received a 3 percentage point increase in interest rates while 413 individuals were in the control
group. Similarly, cell 9 contains individuals who had low utilization rates and high behavior
score (low default risk) in July 2006. In this cell, 499 individuals received a 3 percentage points
reduction in interest rates while 1424 individuals were in the control group. For cell 6, the
lender did not allocate any individual to a control group, making the cell unavailable for our
purposes. Our private conversations with the lender suggest that selection ratios are based on
pro�tability concerns rather than statistical power concerns.
As can be seen from the cell design, the treatment is not homogenous across cells; cells with
low behavior scores (cells 1, 2 and 3) received a 3 percentage point increase in interest rates
whereas cells 4, 5, 7 and 8 received a 1 percentage point increase. Note also that the cross
sectional distribution of interest rates prior to the implementation did not di¤er across cells. It
is clear from this design that we cannot estimate the overall average treatment e¤ect for the
entire sample. For example, since a 3 percentage point decrease in interest rate was given only to
individuals with high behavior scores and low utilization rates (cell 9), we cannot generalize the
e¤ect of a 3 percentage point decrease in interest rates to the experimental sample. Similarly,
the estimated e¤ect of the 3 percentage point increase can be generalized only to individuals
with low behavior scores.
4.1 Implementation
Unlike many studies that used randomized �eld experiments (mainly in development economics),
we were not involved in the design or implementation of the experiment our analysis is based on.
Although randomized experiments are now standard practice amongst credit card companies
and they have every incentive to implement them correctly, we need to make sure that the
randomization was carried out properly to ensure the internal validity of our results.
We perform several tests including a series of mean equality and distribution equality tests on

17ECB
Working Paper Series No 1304February 2011
a range of variables including our outcome variables. These tests were carried out for the month
of July 2006 (the date of the design) and repeated for August 2006 and September 2006 (the last
2 months before the implementation). Table 3 presents the p-values obtained from mean equality
tests and Table 4 presents the likelihood ratio statistics (�2) from the probit regression of the
treatment dummy on several variables such as debt, interest rates, credit limit, income, age,
behavior score, utilization rate and statement balance. We also performed distribution equality
tests using Kolmogorov-Simirnov and K-Wallis tests for the variables in Table 3 (results are
available upon request) and could not detect any statistically signi�cant di¤erence between the
treated and the controls. We are in the end, convinced that the randomization was carried out
properly.
4.2 Other Threats to Internal Validity
Even though the randomization was carried out properly there may be other threats to the
internal validity of our experimental estimates. Sample attrition, for example, would be of par-
ticular concern if it were caused by the treatment. This could happen if the treatment (interest
rate increase) initiated delinquency and eventually default, making the remaining treatment
sample no longer comparable to the control sample. If the treatment caused some accounts
to be charged o¤, our treatment e¤ect estimates may be biased toward �nding insensitivity to
interest rates. Recall however that we can follow outcomes of the experiment only for three
months. It is unlikely that we would see any default in such a short period as it usually takes
several months of delinquency for the lender to charge the delinquent account o¤.
However, we can explore whether the treatment induced intention to default by looking into
the number of delinquent months following the treatment. The idea here is that if the treatment
induces default, we may observe it as delinquency (missed monthly payments) starting from the
implementation date. For this, we investigate whether there is any statistically signi�cant
di¤erence between the treated and control in terms of falling into a delinquency cycle after

18ECBWorking Paper Series No 1304February 2011
the treatment. More speci�cally, we test the equality of number of delinquent months between
the treated and the control groups from September 2006 to December 2006, inclusive. Table 5
presents these results (p-values for equality tests). We do not reject the hypothesis of equality
and conclude that the treatment did not induce intention to default within the sample period.
Another problem common in randomized experiments is noncompliance, that is, the possi-
bility that units allocated to the treatment group are not treated. This situation could arise in
our case if, for example, some individuals that are allocated to a treatment group objected to
the interest rate increase and the lender consequently reversed the change. Fortunately, we do
not face this problem in our sample; all accounts that are allocated into treatment groups did
receive the change in interest rates.
5 Assessing the Experimental Design
In this section we assess how informative the experimental design is in answering the questions
we pose. In particular, we would like to know �rst, how much of an e¤ect we can detect
statistically and second, how much of an economic e¤ect we can expect given the theoretical
model outlined in section 3. For the former we resort to the concept of "minimum detectable
e¤ect". In our case it is the minimum true di¤erence (in £ ) between the control and the treated
that can be statistically detectable with 80% con�dence at a 5% signi�cance level16.
In order to calculate expected economic e¤ect of a change in interest rates, we �rst assume
a functional form for the utility function in the intertemporal model we outlined in section 3.
Following the large body of theoretical and empirical literature, we take the constant relative
risk aversion (CRRA) utility function:
U(C) =C1�
1� (6)
16See List et al (2010) and Du�o et al (2006) for excellent reviews.

19ECB
Working Paper Series No 1304February 2011

20ECBWorking Paper Series No 1304February 2011
As a simple illustration, if, based on the micro evidence17, we take 1 = 0:75 and monthly
income/consumption of £ 1400 (given the reported mean individual income in Table 1), the
above inequality implies that a 1 percent increase in (1 + r) is expected to reduce current
consumption of unconstrained borrowers by at least £ 10.518. Together with the calculated
minimum detectable e¤ects, such expected economic e¤ects will be useful in order to interpret
our experimental results in the following section.
6 Results
6.1 Experimental Estimates
The main objective of the paper is to infer the interest rate sensitivity of monthly credit card
borrowing. Individuals who would like to borrow more but have limited access to credit are
expected to be insensitive to the cost of borrowing. The sensitivity of demand for borrowing
to interest rates can be easily determined at the extensive margin; as interest rates go up, loan
take up is expected to go down for unconstrained individuals. However, testing this sensitivity
using credit card debt requires a di¤erent treatment. As explained in section 3, once incurred,
revolved credit card debt itself is no longer the proper choice variable for a given month.
Guided by the standard intertemporal theory of consumption outlined in Section 3, we
estimate the following equation for each cell:
NNB = �+ �T + " (12)
where NNB denotes the net new borrowing and T is the treatment dummy which takes the
value of 1 if the individual is in the treatment group and 0 if the individual is in the control
17See Attanasio et al (1999), Alan (2006) and Alan and Browning (2010).18Remember that individuals in our sample are assumed to be net borrowers, or simply "hand to mouth" con-
sumers with no savings. It is also important to note that theoretically, the income income e¤ect is realized at thetime when interest rate change is communicated. Therefore, expected economic e¤ect after the implementationis only the substitution e¤ect.

21ECB
Working Paper Series No 1304February 2011

22ECBWorking Paper Series No 1304February 2011

23ECB
Working Paper Series No 1304February 2011

24ECBWorking Paper Series No 1304February 2011
low utilization cells, although the means are imprecisely estimated for cells 2 and 5. For cells 2,
5 and 8 (with an average utilization rate around 50%) and cells 3 and 9 (with average utilization
rate around 10%) we �nd statistically zero average treatment e¤ects. Note however that the
minimum detectable e¤ects are large for these cells. Given the expected economic e¤ects, our
estimates will not be precise enough to detect the expected e¤ect with any con�dence (minimum
detectable e¤ects are larger than expected economic e¤ects). For example, consider cell 5. The
expected consumption decline due to a 1 percentage point increase in interest rates is at least
£ 8. The minimum detectable e¤ect for this cell is £ 25 implying that it is very unlikely for us to
detect a true e¤ect. While we do not feel con�dent about the results obtained from cell-by-cell
estimation, in Subsection 6.3, we con�rm these "insensitivity" results when pooling across all
low utilization cells.
6.2 Heterogeneity in Treatment E¤ects
Based on the discussion above, the apparent insensitivity to interest rates by borrowers who
utilize their credit limits fully can be interpreted as evidence of binding liquidity constraints
among this group. It is generally accepted that liquidity constraints are more likely to a¤ect the
young and those with low income. In our case, having no other credit card than the one issued
by our lender may also indicate the actual credit limit the individual is facing. A very high uti-
lization individual who reported to possess no other credit card would be the likeliest candidate
to be constrained in the strong sense of the term. On the other hand, individuals who reported
to have other credit cards may have the �exibility to transfer their balances (subject to some
switching costs) to other cards when faced with an increase in interest rates. Such a transfer
clearly would not change the individual�s overall debt holding (no reduction in consumption)
but would seem that way in our sample due to the observed payment. Unfortunately, we have
no way of knowing the nature of the payments, whether it is a balance transfer to another
card or a genuine payment, made toward balances. Balance transfers would bias our results

25ECB
Working Paper Series No 1304February 2011
toward �nding sensitivity, and the estimated magnitude of consumption reduction should then
be considered as an upper bound.
Table 8 presents estimated average treatment e¤ects conditional on having other credit
cards, age and income19. Results in this table are generally very similar to our previous results.
We see no interest rate sensitivity in any cell, whether individuals have other credit cards or not.
The numbers do not show any clear pattern. A possible explanation for this may be that the
other credit cards these individuals hold are likely to be equally high interest rate cards since
they were willing to apply for a new high interest rate card. Anecdotal evidence also suggests
that some individuals apply for a new high interest rate card when they fully utilize their other
high interest rate cards.
In contrast to the �ndings of Attanasio et al (2008) and Alessie et al (2005), we do not �nd
any signi�cant di¤erence between high and low income individuals with the exception of cell
1 where we estimate about £ 31 reduction in net new borrowing for individuals who reported
income over £ 20,000 (columns 5 and 6 in Table 8). Note, however, that the distinction between
high and low income is only relative in our case, as almost all our individuals have low income.
In summary, we �nd no evidence of sensitivity to either a 1 or 3 percentage point increase (or the
3 percentage point decrease, cell 9) in our sample, even after conditioning on variables that are
thought to be useful in characterizing unconstrained individuals, such as being middle aged and
older, and possessing multiple credit cards. This result was largely expected for the individuals
who were fully utilizing their credit cards (and among those who have no other credit cards).
6.3 Can Econometrics Replicate the Experiment?
Credit demand equations have been estimated on nonexperimental data, usually by imposing
some exogeneity restrictions. Attanasio et al (2008), Alessie et al (2005) and Gross and Souleles
19We also condition on employment status and home ownership. Unreported results are very similar andavailable upon request.

26ECBWorking Paper Series No 1304February 2011

27ECB
Working Paper Series No 1304February 2011

28ECBWorking Paper Series No 1304February 2011

29ECB
Working Paper Series No 1304February 2011

30ECBWorking Paper Series No 1304February 2011
comes from the low utilization cells (see columns 2 and 4). While the nonexperimental use of
the data yields an economically and statistically large response to interest rates in the direction
predicted by the intertemporal theory, the experimental results tell us a completely di¤erent
story. With the nonexperimental use of the data, we estimate a £ 32 decline in debt (implying
an elasticity of -1.72) and £ 11 decline in net new borrowing over 3 months in response to a 1
percentage point increase in interest rates. On the other hand, the experimental variation alone
shows that these individuals in fact accumulate debt (approximately £ 16 over three months,
implying the elasticity of 0.85) in response to a 1 percentage point increase in interest rates.
Recall our discussion in Section 3 that when faced with an increase in interest rate, in-
dividual�s debt automatically increases due to additional interest charges unless the net new
borrowing declines. Since the net new borrowing is positive in low utilization cells (see Table
6, column 1), we observe an increase in debt when faced with higher interest rates. It appears
that the cross cell variation is very strong for the lower utilization group, causing signi�cant
omitted variable bias due to nonlinearities inherited in the block design. This bias is so strong
that results obtained with mixed within and cross cell variation are materially very di¤erent
(£ 32 decline versus £ 16 increase in 3 months). This result clearly illustrates the importance of
careful research design when estimating such demand equations.
7 Conclusion
We estimate the sensitivity of credit demand to interest rates. A unique data set on monthly
credit card transactions from a subprime credit card company that includes a randomized
interest rate experiment gives us the opportunity to carry out this task with truly exogenous
variation in interest rates. We �nd that individuals who utilize their credit limits fully are
insensitive to exogenous increases in interest rates as high as 3 percentage points. We interpret
this �nding as evidence of binding liquidity constraints.

31ECB
Working Paper Series No 1304February 2011

32ECBWorking Paper Series No 1304February 2011
References
[1] Adams, W., L. Einav, and J. Levin, �Liquidity Constraints and Imperfect Information
in Subprime Lending,�American Economic Review 99 (2009), 49�84.
[2] Alan, S., �Entry Cost and Stock Market Participation over the Life Cycle,�Review of
Economic Dynamics 9 (2006), 588�611.
[3] � �, and M. Browning, �Estimating Intertemporal Allocation Parameters Using Syn-
thetic Residual Estimation,�Review of Economic Studies 77 (2010), 1231-1261.
[4] Alessie, R., S. Hochguertel, and G. Weber, �Consumer Credit: Evidence from
Italian Micro Data,�Journal of the European Economic Association 3 (2005), 144-78.
[5] Attanasio,O., J. Banks, C. Meghir and G. Weber, "Humps and bumps in Lifetime
Consumption" Journal of Business and Economic Statistics, 17 (1999), 22-35.
[6] Attanasio, O. P., P. K. Goldberg, and E. Kyriazidou, �Credit Constraints in the
Market for Consumer Durables: Evidence from Micro Data on Car Loans,� International
Economic Review 49 (2008), 401-36.
[7] BIS - Department for Business, Innovation & Skills, �Review of the Regulation of Credit
and Store Cards. Government Response to Consultation, Economic Impact Assessment,�
March 2010.
[8] Duflo, E., R. Glennerster and M. Kremer, �Using Randomization in Development
Economics Research: A Toolkit�(2006)
[9] Gross, D. B., and N.S. Souleles, �Do Liquidity Constraints and Interest Rates Matter
for Consumer Behavior? Evidence from Credit Card Data,�Quarterly Journal of Eco-
nomics 117 (2002), 149-85.

33ECB
Working Paper Series No 1304February 2011
34ECBWorking Paper Series No 1304February 2011
CELL 1T=3 pp#T=337#C=413
CELL 4T=1 pp
#T=1407#C=1742
CELL 7T=1 pp
#T=3420#C=4112
CELL 2T=3 pp#T=101#C=130
CELL 5T=1 pp#T=467#C=135
CELL 8T=1 pp
#T=3038#C=865
CELL 3T=3 pp#T=62#C=80
CELL 6T=1 pp#T=188#C=0
CELL 9T=-3 pp#T=499
#C=1424
0 Low Mid High
Behaviour score (Bscore)
UtilizationRate
100%
Low
Mid
High

35ECB
Working Paper Series No 1304February 2011

36ECBWorking Paper Series No 1304February 2011

37ECB
Working Paper Series No 1304February 2011

38ECBWorking Paper Series No 1304February 2011

39ECB
Working Paper Series No 1304February 2011

Work ing PaPer Ser i e Sno 1118 / november 2009
DiScretionary FiScal PolicieS over the cycle
neW eviDence baSeD on the eScb DiSaggregateD aPProach
by Luca Agnello and Jacopo Cimadomo