working paper series - piie · 3 shows that the united states is relatively more dynamic. in...
TRANSCRIPT

Working Paper S e r i e s
1750 Massachusetts Avenue, NW Washington, DC 20036-1903 Tel: (202) 328-9000 Fax: (202) 328-5432 www.piie.com
W P 1 6 - 1 F E B R U A R Y 2 0 1 6
The Origins of the Superrich: The Billionaire Characteristics DatabaseCaroline Freund and Sarah Oliver
Abstract
Th is working paper presents a new dataset on the sources of billionaire wealth and uses it to describe changes in extreme wealth in the United States, Europe, and other advanced countries. Th e data classify wealth as either self-made or inherited and identify the company and industry from which it comes. Among self-made billionaires, individuals are further classifi ed as company founders, executives, politically-connected, or in fi nance. Data analysis shows that the superrich in the United States are more dynamic than in Europe. Just over half of European billionaires inherited their fortunes, as compared with one-third in the United States. Th e median age of a company of a European billionaire is nearly 20 years older than that of an American billionaire. Traditional sectors explain more than half of the rise in wealth in Europe; the fi nancial sector and technology-related sectors together are largely responsible for the rise in US wealth. Th ere is some evidence that rents are higher in the United States than Europe, as not only is the number of US billionaires expanding rapidly, but US billionaires are also getting richer on average over time, especially when wealth is connected to resources, nontradables, or fi nance.
JEL Codes: D63, O57, P48Keywords: wealth inequality, top 1 percent, extreme wealth, crony capitalism
Caroline Freund, senior fellow at the Peterson Institute for International Economics since May 2013, is author of Rich People Poor Countries: Th e Rise of Emerging-Market Tycoons and their Mega Firms. She was previously chief economist for the Middle East and North Africa at the World Bank (2011–13). Sarah Oliver has been a research analyst at the Peterson Institute for International Economics since August 2013.
Note: Th is working paper is part of the Institute’s project on Inequality and Inclusive Capitalism, which is partially supported by a series of major grants from the ERANDA-Rothschild Foundation. Th is paper and accompanying dataset serve as background for the book Rich People Poor Countries: Th e Rise of Emerging-Market Tycoons and their Mega Firms.

2
1. INTRODUCTION
Despite slow global income growth, extreme wealth is increasing rapidly. Th e 2015 Forbes World’s
Billionaires list shows a record number of billionaires in the world (1,826), as well as a record number of
billionaires under age 40, self-made billionaires, and female billionaires.1 Th ese records break the same
records set by the 2014 list. Th e billionaire characteristics dataset used in this paper, by compiling the
Forbes lists from 1996–2015 and adding detailed information on the individuals listed, helps identify
patterns in the most well-rewarded activities across countries and over time.
Th is paper provides an overview of the dataset, along with the methodology used for creating new
variables and researching individual billionaire characteristics. Th e data, built from 20 years of the Forbes
World’s Billionaires list, include information on the sector and characteristics of each billionaire as well as
information on the company associated with a billionaire’s wealth and how a billionaire became a member
of the superrich.
Th e data show three interesting trends. First, extreme wealth is growing signifi cantly faster in
emerging markets than in advanced countries. Th e rise of emerging-market wealth is the subject of our
book using this dataset, Rich People Poor Countries: Th e Rise of Emerging-Market Tycoons and their Mega
Firms (Freund 2016). Th e book shows that there has been a sharp increase in billionaires from emerging
markets over the past 20 years, a large and growing share of whom are company founders, creating new
and innovative products. Th e emerging-market superrich are no longer concentrated in the resource and
politically-connected sectors of the past.
Second, wealth is increasingly self-made, even in the advanced countries. Th e relatively rapid growth
in the number of self-made billionaires and their wealth alleviates some concerns raised by the economist
Th omas Piketty about returns to capital growing faster than income, which would cause fortunes to
become more concentrated over time if capital remained in the same hands. In fact, extreme wealth is
created and destroyed at a nearly constant rate in the United States, such that the median age of the
businesses behind American fortunes is about the same now as in 2001. Th ere is somewhat less dynamism
in the other advanced economies, especially Europe, where fortunes are older and aging over time.
Finally, there are marked diff erences across regions and countries, even within income groups, which
off er information about the climate for big business. Among emerging markets, East Asia is home to the
large-scale entrepreneur. In contrast, the Middle East and North Africa is the only region where the share
of inherited wealth is growing and the share of company founders is falling. Other emerging-market
regions fall somewhere in between. Using the data to evaluate wealth creation in the advanced countries
1. Kerry Dolan, “Inside the 2015 Billionaires List: Facts and Figures,” Forbes, March 2, 2015, http://www.forbes.com/sites/kerryadolan/2015/03/02/inside-the-2015-forbes-billionaires-list-facts-and-fi gures/ (accessed on January 3, 2016).

3
shows that the United States is relatively more dynamic. In Europe, inherited wealth still makes up the
majority of billionaire wealth, while the growth in US billionaires has been driven by self-made wealth.
Th is paper is divided into seven sections. Th e next section describes related research using the Forbes
World’s Billionaires List. Section three describes the list and explains the individual and company variables
added to the data. Section four discusses regional trends in wealth creation. Section fi ve focuses on wealth
creation among advanced countries. Section six estimates the share of wealth growth stemming from
growth in the number of billionaires and growth in their average wealth. Section seven concludes.
2. RELATED WORK
Th e Forbes World’s Billionaires lists have been used in previous research for a number of purposes. Th e
data are sometimes used to fi ll gaps in income data at the top of the wealth distribution in order to
provide a more complete analysis of income inequality. Both Hurst et al. (1998) and Klevmarken et al.
(2003), for example, use Forbes data to supplement the Panel Study of Income Dynamics (PSID) wealth
share data for the United States. Piketty (2014) uses the data to describe trends in wealth inequality in his
book Capital in the Twenty-First Century.
Other work has used Forbes data to analyze business trends in specifi c countries or years. While the
billionaire population is a small part of the business community, data on this group off er insights into
how business is done in the most lucrative sectors, which are likely to refl ect the economic climate for
big business more generally. Gandhi and Walton (2012) use Forbes data from 1996 to 2012 to assess the
impact being politically connected has on billionaire wealth in India. Similarly, Guriev and Rachinsky
(2005) use Forbes data from 2004 to understand the role of oligarchs in Russia’s transition to capitalism.
Sharma (2012) uses turnover among the 10 wealthiest people in a country as a measure of the overall
health of emerging-market economies. Bagchi and Svejnar (2013) use Forbes data from 1987 to 2002 to
look at whether the type of wealth in a country is connected to overall growth. Th ey fi nd that politically-
connected billionaire wealth has a negative eff ect on economic growth, while unconnected wealth is not
correlated with GDP growth.
Th e most closely related paper to this work is Kaplan and Rauh (2013) who use the World’s
Billionaires lists from 1987, 1992, 2001, and 2011 to compare US billionaires to billionaires in the rest
of the world. Th ey assess US and non-US billionaires in three areas: self-made versus inherited wealth,
income level of billionaires’ families, and industry. Th ey argue that the composition of US billionaires
supports the importance of skills-biased technological change—and subsequent development of tech
“superstars” who are increasingly likely to have made their own fortunes—as a contributor to increased
income inequality in the United States. However, this same phenomenon is not present in the rest of the
world.

4
Th is paper’s contribution to the previous analysis is to provide a more comprehensive look at the
movement of the superrich and their businesses across years, countries, and industries. Th is paper also
uses the data to examine the most highly rewarded economic activities in advanced countries.
3. DESCRIPTION OF THE DATA
Th e billionaires characteristics database builds on 20 years of the Forbes World’s Billionaires list, from
1996 to 2015.2 Forbes uses shareholder information, company fi nancial statements, current exchange
rates, and meetings with candidates to estimate individual net worth.3 Th e data list all individuals with a
net worth over $1 billion in a given year. From 1996 to 2010, the data include the name, rank, country
of citizenship, and net worth (current US dollars) of the world’s billionaires. From 2011 on, the source
of wealth is also provided, listed either as a specifi c company or broader sector. According to Forbes’
methodology, the absence of a particular country in the data, such as China before 1997, is an indication
that the country had no billionaires in that year rather than an indication of missing data.4 Th e advantage
of Forbes is that it has the longest series available and lists billionaires by name.
Forbes is not the only source of information about the super wealthy. Th e fi rms Knight Frank and
Wealth-X both also compile yearly data on the world’s superrich. Wealth-X uses a diff erent methodology
from Forbes and claims to be the most comprehensive, as they have a proprietary database of privately
and publicly-held companies, created in association with UBS; however, the data are only available for
recent years. All three sources show very similar patterns for the years for which they have data. For
example, in 2013, the share of emerging-market billionaires on the Forbes list is 44 percent of the total
billionaires in that year. In the same year, Knight Frank and Wealth-X both put the emerging-market
share at 44 and 42 percent respectively. Knight Frank and Wealth-X also off er information on individuals
with tens or hundreds of millions of dollars. Table 1 shows a comparison of the total wealth, number of
billionaires, and emerging-market share for each of the three data sources in 2013, a year when all three
datasets are available.
Th ere are likely to be discrepancies between the reported number of billionaires and the actual
number of billionaires in the world, as some billionaires may prefer to keep the size of their fortunes
confi dential. Th ese discrepancies can exist both in cases of inherited fortunes and wealth tied to private
2. Following initial publication of the 2014 list, Forbes began updating changes in billionaire net worth and relative rank daily. Th is analysis uses the 2014 list as it stood at the time of initial publication in March 2014. In addition to the March 2015 list, this dataset also includes net worth as of September 2015.
3. An important source is the Orbis database from Bureau van Dijk Electronic Publishing, which provides data on ownership stakes in both public and privately held companies. Forbes values the privately held companies by coupling estimates of revenues or profi ts with prevailing price-to-revenues or price-to-earnings ratios for similar public companies.
4. Th e World’s Billionaires: 25 Anniversary Timeline, Forbes, 2012, http://www.forbes.com/special-report/2012/billionaires-25th-anniversary-timeline.html (accessed January 3, 2016).

5
companies. Inherited wealth, which may not remain in the specifi c company that initially created it,
may be more likely to be diversifi ed and thus may be overlooked by Forbes journalists. Indeed, only 12
percent of the 2014 billionaires have wealth that Forbes classifi ed as “diversifi ed” (5 percent) or the result
of “investments” (7 percent). Alternatively, it is also likely that many private companies are overlooked,
at least until the company goes public or the founder dies. In some cases, private company fortunes fi rst
make the list when an inheritance is taxed, potentially making inheritors more likely to be on the list.
Table A2 in the appendix alleviates such concerns by comparing wealth at the top of the distribution,
where these discrepancies are likely to be smaller, and fi nds that self-made billionaires are also more
prevalent among the group of the wealthiest 100 billionaires in both the advanced countries and emerging
markets, and broad patterns remain intact.
Another type of billionaire excluded from the list are those whose income is tied to illegal extraction
of rents, including corrupt government offi cials or drug lords. For example, Hosni Mubarak, Viktor
Yanukovych, and Muammar Gaddafi , among others, acquired wealth that by various estimates reached
into the billions. As a rule, Forbes does not include monarchs and other country leaders whose wealth is
tied to their position of power. Forbes made an exception in 1997 and 1998, including eight monarchs
and four dictators, but the list was incomplete and this group was discontinued in later years.5 Still,
provided the measurement error is roughly constant over time, the analysis should refl ect recent trends—
or at least recent trends in private business.
One shortcoming of this dataset is Forbes’ inconsistent reporting of family fortunes across part of
the sample. In 1996 and 2001–14, billionaires are reported as individuals unless “ownership breakdown
among [siblings] isn’t clear,” and in those cases siblings must have a net worth of at least US$2 billion
to be included.6 However, from 1997 to 2000, the list aggregates individual billionaires by family. As
a result, the number of billionaires is systematically lower in these years, and the average net worth of
billionaires is systematically higher. A clear example of this is the Walton family, heirs to the Walmart
fortune, who appear on Forbes’ lists every year. In 1996, fi ve Walton family members, with an average
rank of 40 and net worth of $4.7 billion appear on the list. From 1997 to 2000, there is a single Walton
family observation, with a fortune ranging from $15.1 billion to $46.7 billion (in 1996 US dollars).
However, in 2001 the family members are once again reported separately, and the fi ve originally listed
5. Royalty include: Sultan Hassanal Bolkiah, Brunei; King Fahd bin Abdul Aziz Al Saud, Saudi Arabia; Sheikh Zayed bin Sultan Al Nahyan and Sheikh Maktoum bin Rashid Al Maktoum, United Arab Emirates; Queen Beatrix, the Netherlands; King Bhumibol Adulyadej, Th ailand; Sheikh Jaber Al-ahmed Al-jabar Al-sabah and Sheikh Hamid bin Khalifa Al Th ani, Qatar. Dictators include: Suharto family, Indonesia; Hafez Al-Assad, Syria; Sadaam Hussein, Iraq; and Fidel Castro, Cuba.
6. Luisa Kroll, “Inside the 2013 Billionaires List: Facts and Figures,” Forbes, March 4, 2013, http://www.forbes.com/sites/luisakroll/2013/03/04/inside-the-2013-billionaires-list-facts-and-fi gures/ (accessed January 15, 2016).

6
billionaires return with an average rank of 42 and an average net worth of $14.5 billion (along with a
sixth Walton with a real net worth of $2 billion). Since the data from 1997 to 2000 cannot be used to
track the changes in the number of billionaires or average real net worth, observations from 1997 to 2000
are excluded when necessary.
Th e compiled Forbes data are supplemented with variables on characteristics of the billionaires
and their businesses. Table A1 in the appendix includes a brief summary of each variable and the years
for which it is available. Th e next section presents the methodology and description of the additional
variables.
Additions for all years: Sector and region variables
An industry and sector variable is added to each observation. Th e industry variable is two-tiered,
beginning with 15 disaggregated categories based on those created by Kaplan and Rauh (2013). Th e
detailed industry categories are subsequently aggregated into fi ve broad sector categories: resource related,
new, traded, nontraded, and fi nancial. Th e source of wealth variable present in the data is used to classify
billionaires appearing between 2011 and 2013. When wealth was listed as diversifi ed, internet and
LexisNexis searches were used to determine the primary company associated with wealth to categorize
these individuals. Th ese classifi cations were extended to all years an individual billionaire was present
in the data. In order to classify billionaires who do not appear after 2010, web searches were used to
determine the source of wealth. Table 2 presents a breakdown of the industry categories present in each of
the aggregate sectors.
Th e resource-related sector seeks to capture how much natural resource extraction and the energy
sector benefi t billionaires. Th ough steel is not a natural resource, it is included in this category because
the key inputs need for its production, coal and iron ore, are major contributors to the resource sector.
Th e new sector category seeks to assess how changing computer and medical technology aff ects billionaire
wealth, while traded sectors are separated from nontraded sectors in order to assess the impact of trade
openness and globalization. Real estate is grouped with the fi nancial sector, because real estate investment
more closely resembles an asset than a good or service for consumption.
A region variable was also added. In 1996, the billionaires list represented only 40 countries; by
2015, 70 countries appeared on the list. (An additional seven countries appear at some point during the
sample, but not in the last year.) Th e world’s billionaires fall into six regions: Europe (separated by high-
and low-income countries), Latin America, sub-Saharan Africa, the Middle East and North Africa, South
and Central Asia, and East Asia (separated by high- and low-income countries). A fi nal category, Anglo
countries, encompasses billionaires from the United States, Canada, Australia, and New Zealand. Table 3
presents a list of the countries included in each regional category.
7
Additions to the 1996, 2001, and 2014 lists
To evaluate the underlying determinants of the rise in extreme wealth across countries, new variables on
the characteristics of billionaires and their businesses were created for three years in the sample period:
1996, 2001, and 2014. Data were collected on the primary companies associated with billionaires, the
founding date of those companies, the source of wealth creation, and gender. Th e variables were created
using information from the 2014 Forbes’ billionaire biographies, news articles, and company websites.7 At
least some information is publically available for 95 percent of billionaires on the 1996 list, 98 percent on
the 2001 list, and 99 percent on the 2014 list.
Company variables
Where a single company can be identifi ed as the main or initial source of an individual’s wealth, two
variables describe that primary company. Th e fi rst variable determines whether the company is new,
acquired, or the result of privatization. Firms are considered new when a billionaire or relative founded
the company. Firms are considered acquired when a billionaire or family member bought a company
from someone outside of the family. Firms are considered privatized when the company was originally
state-owned. About 1 percent of fi rms do not fi t these broader categories and include subsidiaries (such as
Shinsegae Group, which branched off of Samsung) and franchises (such as McDonald’s Japan), which are
categorized by their specifi c type of company rather than being included in the larger three categories. In
addition to identifying the type of company, the second variable is the founding date, as self-reported on
the company’s website or other company information.
Wealth creation variables
Categorizing wealth is a subjective process, as available information does not always provide complete
individual or company histories and self-reporting may tend to glorify success. A conservative approach
is used in this paper to defi ne self-made wealth,8 especially company founders, requiring them to have
no stories connecting them to relatives or friends in government and the source of their wealth to be
unrelated to natural resources, fi nance, or privatization. Th e methodology is described below in detail.
Determining the extent to which wealth is inherited or self-made is challenging, since some
billionaires inherited a fortune already worth billions when they made it on the Forbes list, while others
built up a smaller company into a billion dollar one. Wealth is considered inherited if the 2014 billionaire
is a relative (sibling, child, spouse, etc.) of the founder of the company from which the primary source
7. Th e dataset provides links to specifi c sources for each individual.
8. Information from Forbes biographies was not relied on, as some data are missing and a relatively large share of billionaires self-report their wealth as self-made.

8
of wealth is derived. Using this broad defi nition of inherited wealth helps to avoid overestimating the
impact of self-made wealth and classifi es billionaires who built existing companies into billion dollar ones
in the inherited category. Th e group of questionable cases is about 10 percent of the total sample. 9 An
example is Gina Rinehart, worth $17.7 billion, who inherited the $125 million family business in 1992.
Although she grew her fortune substantially (while also benefi tting from booming commodity prices),
her wealth nonetheless stemmed from a sizable family fortune. Th e methodological reason for using a low
threshold to defi ne inherited wealth is that the information regarding who founded a particular business
is generally available on company websites or in news articles, but the dollar amount inherited, or the size
of the company at the death of a company founder, or even when the wealth was passed to the second
generation, is not. Th e one exception is when billionaires inherit only a single store or factory from their
family, in which case they are considered self-made (about 2 percent of the sample). For example, GEMS
Education Chair Sunny Varkey took over a single school with less than 400 students from his parents in
1980, and thus his wealth is considered self-made rather than inherited.
Wealth is classifi ed as “self-made” either when the individual listed was the founder of the company,
or when their source of wealth is a result of their position at a particular company. Billionaires who may
have benefi tted from political connections but did not inherit their wealth are also considered self-made
(though these billionaires are separated into their own self-made subcategory later). In parent-child,
sibling, and husband-wife partnerships, both members are considered to be self-made if both members of
the partnership were involved in the founding.10
Self-made wealth is further divided into four categories: founders, executives, fi nance, and resource
and politically-connected billionaires. Billionaires are fi rst categorized as either founders or executives and
then further defi ned into two additional groups based on their sector and political connections.
Individuals who are explicitly listed as founders on company websites are defi ned as company
founders. A second category of self-made wealth encompasses those self-made billionaires whose wealth
comes from their position as an executive at a particular company (such as Facebook Chief Operating
Offi cer Sheryl Sandberg). Cases where the billionaire was described as chairman, chief executive offi cer, or
other leadership position, without also being listed as the founder, are coded as executives in the data set.
Th is group also includes those individuals who own a particular company but are not explicitly listed as
9. In their analysis of the Forbes lists of billionaires for 1987, 1992, 2001, and 2012, Kaplan and Rauh (2013) distinguish between billionaires whose wealth is self-made, inherited, and built from a “modest business.” According to their analysis, these inheritors of modest businesses make up less than 10 percent of total observations both in the United States and in the world in 2012. Kaplan and Rauh do not provide a cutoff for what constitutes a modest business.
10. In 2014, seven observations (0.43 percent of the sample) list a married couple jointly as billionaires. All of these couples are self-made and each have a combined net worth of at least $2 billion, so for this analysis, these couples are split into two observa-tions, dividing their wealth in half. In 2001, there is one self-made married couple and one inherited brother and sister listed jointly as billionaires, but as the total net worth of each pair is less than $2 billion, they are excluded from the analysis.

9
founders or given executive titles and those billionaires who inherited only a single store or factory from
their family.
From these two broad categories, founders and executives, all fi nancial sector and real estate
billionaires are then grouped into a single fi nance category. Th e fi nancial sector represents a wide range
of people who are diffi cult to otherwise categorize, so they are treated as a separate group. Some are the
people who backed new and innovative companies early on or developed new products to make markets
function more effi ciently. Others benefi tted from political connections, weak regulatory oversight, or
insider trading.
Th ree types of self-made billionaires end up in the politically-connected/resource-related category. A
billionaire is identifi ed as politically connected if there are news stories connecting wealth to past positions
in government, close relatives or friends in government, or questionable licenses.11 Th ough being related
to a politician may not necessarily lead to being more favorable treated than other entrepreneurs, this
paper treats all political connections as the same rather than attempting to judge the impact of these
connections on current wealth. In each case where a billionaire is classifi ed as politically connected, the
data include a note explaining the classifi cation, as well as a link to the news source or webpage where the
data were collected.
Privatizations, which by defi nition require connections with the state, also fi t into this category.
As in the case of political connections, there are some cases where billionaires are entrepreneurs who
transformed their newly private companies into successful industry leaders. On the other hand,
privatizations often allow insiders to cherry-pick undervalued state-owned companies. To avoid subjective
value judgements, all privatizations were included in the politically-connected/resource-related category.
Finally, self-made billionaires whose wealth originates in resource-related industries, including oil,
natural gas, minerals, and coal, are placed in this category because resource extraction relies on control
of territory associated with the resource, which is frequently disbursed through government contracts.
Resource wealth also accrues to those who have the good luck of fi nding resources in their backyards. In
both cases, company value is largely driven by external forces and company management is secondary.
Some such companies do benefi t from good management, but much of the return from resource
extraction comes from world prices and is therefore outside of managerial control.
To further disaggregate inherited wealth, inherited billionaires are divided by generation and
self-made wealth based on the sector and the billionaire’s relationship to the company and home
government. Including the generation of the heir of a fortune demonstrates how quickly fortunes
dissipate. A generational variable for the 2001 and 2014 lists classifi es the the relationship of the current
11. Billionaires who use their wealth to then gain political connections are also part of the overall landscape but are beyond the scope of this analysis. See West (2014) for an analysis of the role of extreme wealth and politics.

10
billionaire to that of the company founder in terms of generational diff erence. A billionaire who inherited
from either a parent, aunt, uncle, or in-law is considered a second generation inheritor, while a grandchild
is considered third generation; up to fi ve or more generations are defi ned. Spouses of billionaires represent
the fi nal type of inherited wealth.
Other variables
Th e threshold for making the Forbes list is having a net worth of $1 billion in current US dollars,
implying that the marginal billionaire in 1996 is richer than the one in 2014 in real terms. In light of this,
a real net worth variable in constant 1996 US dollars is included to adjust the current real net worth for
infl ation.
In addition to the real net worth variable, the real billionaires variable equals 1 where billionaire
wealth meets the $1 billion cutoff in 1996 US dollar terms. Th e rationale for excluding these billionaires
in analysis of long-term trends is that since infl ation has decreased the minimum threshold for inclusion
in the list, the growth in the number of billionaires is overreported over time. However, in practical terms,
excluding those billionaires who do not make the $1 billion cutoff using 1996 dollars does not noticeably
change results. Figure 1 plots real net worth over time for all billionaires, separated by emerging-market
and advanced country billionaires. In each case, the darker line represents the full sample of billionaires
and the lighter line excludes those billionaires who do not make the $1 billion cutoff in 1996 dollars.
While there is a change in the level of total real net worth, particularly in later years, the trends are
consistent across both groups.
4. TRENDS IN BILLIONAIRE WEALTH 1996–2015
Overall, there are two important shifts in the makeup of billionaires over the past 20 years. First, the
number and total net worth of billionaires in emerging markets has grown rapidly. Second, over this
period, the population of self-made billionaires overtook the population of inheritors.
Th e rapid growth in emerging-market wealth is displayed in fi gures 2 and 3, which map the number
of billionaires by country over time. Europe and East Asia particularly highlight this trend. In East Asia,
the concentration of billionaires shifts from Japan to China, while Southeast Asia sees billionaire fortunes
collapse with the Asian fi nancial crisis, followed by a resurgence in more recent years (fi gure 2). A similar
shift to emerging markets is apparent in Europe, with wealth moving eastward over time (fi gure 3).
Breaking down billionaires by self-made and inherited wealth shows that inherited billionaires
were more numerous than self-made billionaires in 1996. Th e tech boom in 2001 helped put self-made
billionaires in the majority. Rapid emerging-market growth strengthened self-made wealth even more over
the next decade (fi gure 4).
11
5. TRENDS IN THE UNITED STATES, EUROPE, AND OTHER ADVANCED COUNTRIES
To determine how important diff erent sources of wealth in the industrialized world are, the advanced
countries are split into three groups. First, since over half of all advanced country billionaires in 2014
were US citizens, US billionaires are treated as a single group. Th e second group encompasses advanced
countries in Europe. Australia, Canada, Japan, New Zealand, and South Korea are grouped together as
“other advanced economies.”
Among advanced countries, the share of self-made billionaires has been expanding most rapidly in the
United States. In Europe, despite a sizable drop from 1996 to 2001, inheritances still account for over half
of all fortunes in 2014. In other advanced countries the share of inherited fortunes has fallen somewhat
over the last decade. Figure 5 shows the breakdown of the number of billionaires by type for the United
States, Europe, and other advanced economies. Figure A1 in the appendix shows the distribution of
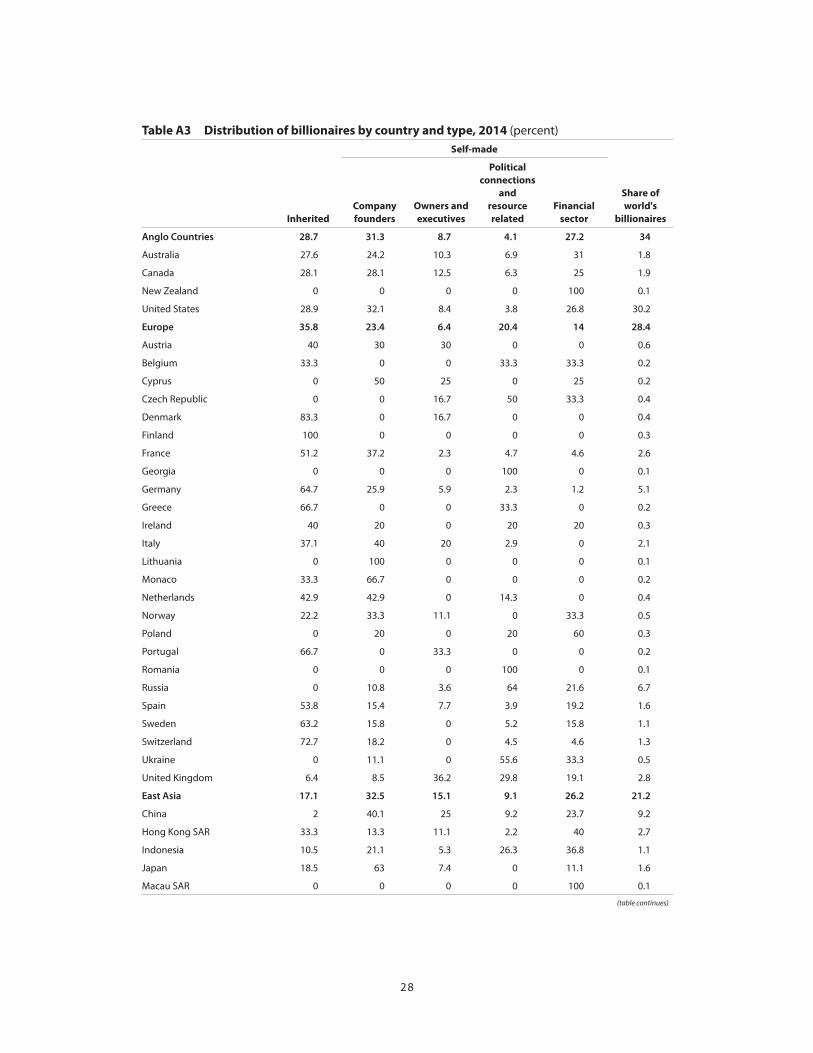
wealth (instead of number) by type of billionaire, and similar patterns emerge. Table A3 records the
distribution of billionaires by country and type in the full sample.
Extreme Wealth Is Driven by Finance in the United States
Figure 5 shows one group that is growing especially rapidly in the United States: fi nancial sector billion-
aires. Th e United States, with 27 percent of billionaires working in fi nance in 2014, now has signifi cantly
more fi nancial sector billionaires as a share of the total billionaire population than Europe (10 percent) or
other advanced countries (20 percent).12
Th e importance of fi nance in the United States can be seen in the sectoral contributions to growth
in extreme wealth. Table 4 shows the contributions of each sector to overall growth in wealth and the
number of billionaires in each of the three advanced country regions from 1996 to 2014. Over 40
percent of the growth in the total US billionaire population is attributable to growth in fi nancial sector
billionaires, as compared with 14 percent in Europe and 12 percent in other advanced economies (table
4). After fi nance, new sectors are most important in growing US extreme wealth. In Europe, the traded
sectors provided the biggest boost to wealth growth. In other advanced countries, the nontraded sectors
contributed the most to wealth growth.
Within the US fi nancial industry, hedge funds have played an especially large role in creating extreme
wealth. Th is group made up less than 10 percent of American fi nancial sector wealth in 2000 and 22
percent in 2015. While the total real net worth of hedge fund billionaires in other advanced economies
has stayed more or less constant since 1996 (after accounting for infl ation), total US hedge fund wealth
12. Other fi nancial centers, including the United Kingdom (19 percent), Singapore (25 percent), and Hong Kong (40 percent), also have high concentrations of fi nancial wealth (table A3).

12
ballooned to over $120 billion by September 2015 (fi gure 6). Over 80 percent of hedge fund billionaires
are from the United States.
Th is shift towards the hedge fund industry among US fi nancial sector billionaires is emblematic of a
broad trend, showing hedge funds providing relatively high returns and as a result attracting people from
other types of business, especially over the last two decades. Kostovetsky (2009), using data from 1993
to 2004, fi nds that young, high-performing mutual fund managers exited mutual funds to create or join
hedge funds at faster rates in the late 1990s and early 2000s than in the early 1990s, even controlling for
the eff ects of the dotcom bubble in 1999–2000. Additionally, mutual fund managers in the Northeast
region of the United States (where hedge funds are overwhelmingly concentrated) were more likely to
recruit from outside the top 15 business schools in later years, as more of the top graduates were instead
recruited to the hedge fund sector. Michael Lewis (2010) describes how hedge funds pulled the best and
brightest from the bond-trading fl oors of the big banks and tracks the hedge funds that saw the mortgage
market bubble well before any of the banks did. Sebastian Mallaby (2010) chronicles the rise of the hedge
fund industry in the 21st century and their survival (and success) after the fi nancial crisis, highlighting the
fact that it was not the hedge funds that needed a bailout.
Europe: Extreme Wealth Is Still Largely Inherited
While US fortunes are increasingly in the fi nancial sector and the high-tech sector, Europe has a greater
share of inherited wealth. Europe is home to the oldest fortunes, where over 20 percent of inherited
billionaires are fourth generation or later heirs. In contrast, less than 10 percent of inherited US fortunes
are fourth generation or older, and in other advanced countries no fortunes are older than three genera-
tions (fi gure 7).
Th e relatively high share of inherited wealth in Europe can also be seen in the age of companies
associated with European billionaires. Th e median American business associated with a large fortune is 42
years old, as compared with 61 in Europe. Th e age gap between inherited fi rms is also large. In the United
States, inherited fi rms have a median age of 76 years, consistent with the large share of inherited wealth
currently in the hands of the second generation. In contrast, European inherited fi rms have a median age
of 91.
Even self-made fi rms tend to be older in Europe, suggesting that businesses take longer to grow large
in Europe. Th e fi rms associated with self-made wealth in the United States and Europe are closer in age
than those of inherited wealth, with a median age of 33 and 38 years respectively—but there is still a
15 percent gap. Th e diff erence is partly because the United States is home to a much greater number of
self-made technology sector billionaires, representing 12 percent of all US billionaires (56 individuals)
versus 5 percent of billionaires in Europe (17 individuals), and their businesses tend to be young.

13
But even within industries, American businessmen and women are younger. For example, businesses
associated with company founders in new sectors in the United States and Europe have median ages of
24 and 30, respectively. Growing a company into a billion-dollar fi rm appears to be a slower process in
Europe than in the United States.
Figure 8 shows the distribution of fi rm age in 2014 for billionaires in the United States, Europe, and
other advanced countries. Th e United States has a large concentration of young fi rms. While Europe and
other advanced economies have similar modes, around 50 years, the number of fi rms over 50 in other
advanced economies drops sharply as fi rms approach 100. In contrast, there is a heavier and longer tail in
the distribution of European fi rm age, stretching out to 400 years.
In addition to being relatively old, European fortunes are aging rapidly, with a median age of 52
in 2001 and 61 in 2014, respectively (fi gure 9). By 2014, there is a notable absence of any businesses
established post-2007 in creating extreme wealth in Europe. In contrast, wealth is created and destroyed
at a nearly constant rate in the United States, such that the median American fortune was roughly the
same age in 2014 (42) as it was in 2001 (38), and the shape of the distribution is almost unchanged.
6. WEALTH GROWS MAINLY ON THE EXTENSIVE MARGIN
Th ere are two potential sources of growth in total real net worth of billionaires over time. First, individual
billionaires may be getting richer on average over time (intensive margin). Alternatively, the increase
in total real net worth could be primarily driven by an increase in the number of billionaires overall
(extensive margin).
Th e following time-series regressions together determine the relative contributions of intensive and
extensive margins to total billionaire wealth, where the coeffi cients on average real net worth and number
of billionaires sum to 1 (by construction).
(1) ln(average real net worth)t=0+1ln(total real net worth)t+t
(2) ln(number of billionaires)t=0+1ln(total real net worth)t+t
Th is set of regressions is run for the entire sample, excluding 1997–2000, since the methodology used
for calculating net worth and number of billionaires in these years systematically overreports net worth
and underreports the number of billionaires. Th e regressions are run using real billionaires and real wealth
to avoid any potential overcounting due to infl ation, though results are similar using data in current
dollars.
In all regions, growth is primarily from the extensive margin, meaning that the growth in the total
real net worth in these countries is driven by additions of new superrich to the list rather than growth
of existing fortunes. Put diff erently, some individuals may be getting richer, but there are now more low

14
net worth billionaires, so average wealth remains constant. In Europe and other non-European advanced
economies, the growth in total net worth from richer billionaires is insignifi cant—indicating that growth
in extreme wealth is due to a bigger population of superrich. In contrast, in the United States, almost 20
percent of the growth in billionaire wealth is driven by the intensive margin. Th ere are more American
billionaires and on average they are getting richer over time (table 5).
Industrial composition may explain variation in the intensive margin across the three regions, or the
intensive margin may be signifi cant within industries only in the United States. Industries with a sizable
intensive margin may matter more in the United States than elsewhere. Table 6 reports results by region
and industry. In resources, nontradables, and fi nance, US billionaires are getting signifi cantly richer
over time. In contrast, in the other regions, with the exception of nontradables in Europe, none of the
other industry-region combinations show a signifi cant intensive margin, and even in nontradables the
coeffi cient is signifi cantly smaller for Europe than for the United States. Although the United States is
more dynamic, with more self-made wealth and younger fi rms, the importance of the intensive margin in
these particular sectors, which tend to be less open to competition, is suggestive of especially high rents in
the United States relative to other advanced countries.
7. CONCLUSION
Th is paper provides an overview of the data and methodology used to amend the Forbes World’s
Billionaires List with individual and company characteristics and discusses trends in extreme wealth
creation in the advanced countries. By adding variables classifying billionaires by industry, and details
about the billionaires’ relationship to the company that represents their source of wealth, these data
provide an important tool for analyzing worldwide trends in billionaire wealth growth. Th e data can also
be used for studies of wealth inequality or big business.
Th e analysis presented here shows wealth creation in the United States is more dynamic than
in Europe, with more self-made wealth and younger businesses. It also shows the surge of US hedge
fund wealth is a distinctly US phenomena. Finally, the paper fi nds that among the rich countries, only
American billionaires are getting richer on average over time, potentially refl ecting extreme rents in
resources, fi nance, and nontradables.

15
REFERENCES
Bagchi, Sutirtha, and Jan Svejnar. 2013. Does Wealth Inequality Matter for Growth? Th e Eff ect of Billionaire Wealth, Income Distribution, and Poverty. IZA Discussion Paper No. 7733. Bonn, Germany: Institute for the Study of Labor. Available at http://ftp.iza.org/dp7733.pdf (accessed on January 3, 2016).
Freund, Caroline. 2016. Rich People Poor Countries: Th e Rise of Emerging-Market Tycoons and their Mega Firms. Washington: Peterson Institute for International Economics.
Gandhi, Aditi, and Michael Walton. 2012. Where Do India’s Billionaires Get Th eir Wealth? Economic and Political Weekly XLVII, no. 40 (October 2012): 10–14. Available at http://www.michaelwalton.info/wp-content/uploads/2012/10/Where-Do-Indias-Billionaires-Get-Th eir-Wealth-Aditi-Walton.pdf (accessed on January 3, 2016).
Guriev, Sergei, and Andrei Rachinsky. 2005. Th e Role of Oligarchs in Russian Capitalism. Journal of Economic Perspectives 19 (1): 131–50.
Hurst, Erik, Ming Ching Luoh, and Frank Staff ord. 1998. Th e Wealth Dynamics of American Families, 1984–94. Brookings Papers on Economic Activity 1998, no. 1: 267–337. Washington: Brookings Institution Press. Available at http://www.jstor.org/stable/2534673 (accessed on January 3, 2016).
Kaplan, Steven, and Joshua Rauh. 2013. It’s the Market: Th e Broad-Based Rise in the Return to Top Talent. Journal of Economic Perspectives 27, no. 3: 35–56.
Klevmarken, N. Anders, Joseph P. Lupton, and Frank P. Staff ord. 2003. Wealth Dynamics of the 1980s and 1990s: Sweden and the United States. Th e Journal of Human Resources 38, no. 2: 322–53. Madison, WI: University of Wisconsin Press. Available at http://www.jstor.org/stable/1558747 (accessed on January 3, 2016).
Kostovetsky, Leonard. 2009. Brain Drain: Are Mutual Funds Losing their Best Minds? Rochester, NY: University of Rochester. Photocopy. Available at http://lk.simon.rochester.edu/HumanCapital.pdf (accessed January 28, 2016).
Lewis, Michael. 2010. Th e Big Short: Inside the Doomsday Machine. New York: W. W. Norton and Company.
Mallaby, Sebastian. 2010. More Money than God: Hedge Funds and the Making of a New Elite. London: Bloomsbury.
Piketty, Th omas. 2014. Capital in the Twenty-First Century. Cambridge, MA: Belknap Press.
Sharma, Ruchir. 2012. Breakout Nations: In Pursuit of the Next Economic Miracle. New York: W. W. Norton and Company.
West, Darrell. 2014. Billionaires: Refl ections on the Upper Crust. Washington: Brookings Institution.
Copyright © 2016 by the Peterson Institute for International Economics. All rights reserved. No part of this working paper may be reproduced or utilized in any form or by any means, electronic or mechanical, including
photocopying, recording, or by information storage or retrieval system, without permission from the Institute.
Th is publication has been subjected to a prepublication peer review intended to ensure analytical quality. Th e views expressed are those of the authors. Th is publication is part of the overall program of the Peterson Institute for
International Economics, as endorsed by its Board of Directors, but it does not necessarily refl ect the views of individual members of the Board or of the Institute’s staff or management.
Th e Peterson Institute for International Economics is a private nonpartisan, nonprofi t institution for rigorous, intellectually open, and indepth study and discussion of international economic policy. Its purpose is to identify and analyze important issues to make globalization benefi cial and sustainable for the people of the United States and the world, and then to develop and communicate
practical new approaches for dealing with them. Its work is funded by a highly diverse group of philanthropic foundations, private corporations, and interested individuals, as well as by income on its capital fund. About 35 percent of the Institute’s
resources in its latest fi scal year were provided by contributors from outside the United States. A list of all fi nancial supporters for the preceding four years is posted at http://www.piie.com/institute/supporters.pdf.

16
Table 1 Forbes billionaires list versus other billionaires data, 2013
Total wealth
(billions of dollars)Total number of
billionaires
Emerging-market
share (percent)
Forbes 5,319 1,386 44
Knight Frank n.a. 1,553 44
UBSWealth X 6,366 2,149 42
n.a. = not available
Sources: Forbes World’s Billionaires list, Knight Frank, and Wealth-X and UBS World Ultra Wealth Report.
Table 2 Sector classifications for billionaires
Broad sector category Major components
Industry subcategories
(based on Kaplan and Rauh 2013)
Resource-related Energy (excluding solar and wind), mining, steel Energy, mining, metals
New Computer technology, software, medical tech-nology, solar and wind power, pharmaceuticals
Computer technology, medical technology
Nontradable Retail, entertainment, media, telecommunica-tions, construction, restaurants and other service industries
Retail/restaurant, media, construction
Financial Banking, insurance, hedge funds, private equity, venture capital, investments, diversified wealth, real estate
Money management, venture capital, hedge funds, private equity/leveraged buyout, real estate
Tradable Agriculture, consumer goods, shipping, manufacturing
Consumer goods, nonconsumer industrial
Other1 Education, engineering, infrastructure sports team ownership, unidentified diversified wealth
Diversified/other
1. Accounts for less than 5 percent of observations.
Table 3 Countries represented in each regional group
Regions Countries
Anglo Australia, Canada, New Zealand, United States
Europe
High income Austria, Belgium, Denmark, Finland, France, Germany, Greece, Iceland, Ireland, Italy, Liechtenstein, Monaco, Netherlands, Norway, Portugal, Spain, Sweden, Switzerland, United Kingdom
Emerging market Cyprus, Czech Republic, Georgia, Lithuania, Poland, Romania, Russia, Serbia, Ukraine
East Asia
High income Japan, Republic of Korea
Emerging market China, Hong Kong SAR, Indonesia, Macao SAR, Malaysia, Philippines, Singapore, Thailand, Taiwan, Vietnam
Latin America Argentina, Belize, Brazil, Chile, Colombia, Ecuador, Guatemala, Mexico, Peru, St. Kitts and Nevis, Venezuela
Middle East and North Africa Algeria, Bahrain, Egypt, Israel, Kuwait, Lebanon, Morocco, Oman, Qatar, Saudi Arabia, Turkey, United Arab Emirates
South Asia India, Kazakhstan, Nepal, Pakistan
Sub-Saharan Africa Angola, Nigeria, South Africa, Swaziland, Tanzania, Uganda

17
0
1,000
2,000
3,000
4,000
5,000
1995 2000 2005 2010 2015
WorldAdvanced economiesEmerging-market economies
billions of US dollars, 1996
Figure 1 Total real net worth of billionaires, 1996–2015
Note: Darker lines represent the full sample of billionaires, and lighter lines exclude those billionaires who do not make the $1 billion cutoff in 1996 US dollars.
Source: Authors’ calculations using Forbes World’s Billionaires list.

18
Figure 2 Billionaires by country, East Asia
1996 2005
2010 2015
Source: Authors’ calculations using Forbes World’s Billionaires list.
China 213
China 64
China 2

19
Figure 3 Billionaires by country, Europe
1996 2005
2010 2015
Source: Authors’ calculations using Forbes World’s Billionaires list.
2010 2015
Germany 103
88

20
55.344.7
30.4
69.6
41.9
58.1
Figure 4 Distribution of billionaires by source of wealth (percent)
Source: Authors’ calculations using data from Forbes World’s Billionaires list.
Self-made Inherited
1996 2001 2014
0
10
20
30
40
50
60
70
80
90
100
United States Europe Other advanced economies
1996 2001 2014
share of billionaires
Inherited wealth Self-made company founders Self-made financial sectorSelf-made owners and executives Political connections and resource related
Figure 5 Distribution of billionaires by type, advanced economies
Sources: Authors’ calculations using data from Forbes World’s Billionaires list.
1996 2001 2014 1996 2001 2014

21
Table 4 Sector contribution to growth in wealth and number of billionaires,
1996–2014 (percent)Wealth growth Growth in number of billionaires
United
States Europe
Other advanced
economies
United
States Europe
Other advanced
economies
Resource related 2.8 2.6 8.0 4.2 5.2 5.8
New sectors 22.1 7.8 33.5 19.0 12.7 31.9
Nontraded sectors 23.0 21.7 42.9 15.7 20.2 33.3
Financial sector 35.0 10.2 –1.3 41.6 13.5 11.6
Traded sectors 14.9 52.4 13.2 14.7 43.4 13.0
Other sectors 2.1 5.3 3.6 4.7 4.9 4.3
Sources: Authors’ calculations using data from Forbes World’s Billionaires list.
0
50
100
150
1996 2001 2006 2011 2015
United StatesOther advanced economies
billions of US dollars, 1996
Figure 6 Growth in real net worth associated with hedge fund billionaires, United States versus other advanced economies, 1996–September 2015
Sources: Authors’ calculations using data from Forbes World’s Billionaires list.

22
0
20
40
60
United States Europe Other advanced economies
share of inherited billionaires
Spouse 2nd generation 3rd generation4th generation 5th generation or older
Figure 7 Inherited wealth distribution by generation, 2014
Sources: Authors’ calculations using data from Forbes World’s Billionaires list.
0
0.005
0.010
0.015
0.020
100 200 300 400
company age (log scale, years)
United StatesEuropeOther advanced economies
share of firms
Figure 8 Distribution of firm age by region, 2014
Sources: Authors’ calculations using data from Forbes World’s Billionaires list.
502510

23
0
0.005
0.010
0.015
0.020
100 200 300 400
company age (years, log scale)
20012014
share of firms
0
0.005
0.010
100 200 300 400company age (years, log scale)
share of firms
Figure 9 Distribution of firm age over time, United States and Europe, 2001 and 2014
United States
Europe
Sources: Authors’ calculations using data from Forbes World’s Billionaires list.
20012014
5025
5025
10
10

24
Table 5 Intensive and extensive margins for total real net worth, 1996, 2001–September 2015
United States Europe Other advanced economies
ln (average
size)
ln (number
billionaires)
ln (average
size)
ln (number
billionaires)
ln (average
size)
ln (number
billionaires)
ln (total real net worth) 0.195*** 0.805*** 0.071 0.929*** –0.027 1.027***
[0.060] [0.060] [0.047] [0.047] [0.068] [0.068]
Observations 17 17 17 17 17 17
R-squared 0.411 0.922 0.131 0.963 0.011 0.939
*** p<0.01, ** p<0.05, * p<0.1
Notes: Standard errors in brackets, constants not reported. Regressions exclude 1997–2000 because of differences in Forbes methodology in these years.
Source: Authors’ calculations using data from Forbes World’s Billionaires list.

256
Ta
ble
6
In
ten
siv
e a
nd
ex
ten
siv
e m
arg
ins
for
tota
l re
al
ne
t w
ort
h,
va
rio
us
sec
tors
, 1
99
6,
20
01
–S
ep
tem
be
r 2
01
5
Re
sou
rce
re
late
dN
ew
No
ntr
ad
ed
F
ina
nc
ial
Tra
de
d
ln (a
vera
ge
size
)ln
(num
ber
billi
onai
res)
ln (a
vera
ge
size
)ln
(num
ber
billi
onai
res)
ln (a
vera
ge
size
)ln
(num
ber
billi
onai
res)
ln (a
vera
ge
size
)ln
(num
ber
billi
onai
res)
ln (a
vera
ge
size
)ln
(num
ber
billi
onai
res)
Un
ite
d S
tate
s
ln
(tot
al re
al n
et w
orth
)0.
386*
**0.
614*
**0.
085
0.91
5***
0.43
0***
0.57
0***
0.20
9***
0.79
1***
0.17
20.
828*
**
[0.0
34]
[0.0
34]
[0.0
67]
[0.0
67]
[0.0
44]
[0.0
44]
[0.0
49]
[0.0
49]
[0.1
25]
[0.1
25]
O
bser
vatio
ns17
1717
1717
1717
1717
17
R-
squa
red
0.89
80.
957
0.09
60.
925
0.86
20.
916
0.55
0.94
60.
112
0.74
5
Eu
rop
e
ln
(tot
al re
al n
et w
orth
)0.
072
0.92
8***
–0.0
911.
091*
**0.
187*
**0.
813*
**0.
058
0.94
2***
0.10
20.
898*
**
[0.0
53]
[0.0
53]
[0.0
83]
[0.0
83]
[0.0
54]
[0.0
54]
[0.0
65]
[0.0
65]
[0.0
79]
[0.0
79]
O
bser
vatio
ns17
1717
1717
1717
1717
17
R-
squa
red
0.10
80.
953
0.07
40.
920.
441
0.93
70.
050.
933
0.1
0.89
5
Oth
er
ad
va
nce
d e
con
om
ies
ln
(tot
al re
al n
et w
orth
)0.
109
0.89
1***
0.06
60.
934*
**–0
.106
1.10
6***
0.14
80.
852*
**0.
156
0.84
4***
[0.0
81]
[0.0
81]
[0.0
59]
[0.0
59]
[0.0
73]
[0.0
73]
[0.2
14]
[0.2
14]
[0.0
95]
[0.0
95]
O
bser
vatio
ns17
1717
1717
1717
1717
17
R-
squa
red
0.10
90.
890.
077
0.94
30.
125
0.93
90.
031
0.51
40.
151
0.84
***
p<0.
01, *
* p<
0.05
, * p
<0.1
Not
e: S
tand
ard
erro
rs in
bra
cket
s.
Sour
ce: A
utho
rs’ c
alcu
latio
ns u
sing
dat
a fr
om F
orbe
s Wor
ld’s
Billi
onai
res
list.

26
APPENDIX
7
Table A1 Variables in billionaire characteristics database
Variable name Description
Available
years Source
name name of individual or family on the billionaires list 1996–2015 Forbes
rank rank of individual on the billionaires list, by year 1996–2015 Forbes
citizenship billionaire country of citizenship 1996–2015 Forbes
networthusbillion net worth of billionaire, current US dollars 1996–2015 Forbes
sourceofwealth Forbes-reported source of billionaire wealth 2011–15 Forbes
age billionaire age 2002–15 Forbes
deflator1996 deflator for US economy, using 2009 as base year adjusted to 1996 baseline
1996–2015 author’s calculations using data from Federal Reserve, St. Louis
realnetworth real net worth of billionaires, 1996 US dollars 1996–2015 author’s calculations
realbillionaires equals 1 where billionaire wealth is at least $1 billion in 1996 dollar terms
1996–2015 author’s calculations
countrycode 3-digit ISO country code, which corresponds to billionaire's citizenship
1996–2015 author’s calculations
industry industry labels based on Kaplan and Rauh (2013) 1996–2015 author’s calculations
IndustryAggregates broad industry categories 1996–2015 author’s calculations
region categorical variable that divides billionaires into regions based on country of citizenship
1996–2015 author’s calculations
north equals 0 for emerging markets and 1 for advanced economies
1996–2015 author’s calculations
gdpcurrentus by country GDP, current US dollars 1996–2015 author’s calculations
selfmade binary variable that is 0 for inherited billionaires and 1 for self-made billionaires
1996, 2001, 2014
author’s calculations
gender binary variable that is 0 for male billionaires and 1 for female billionaires
1996, 2001, 2014
author’s calculations
source2 sector of billionaire company 1996, 2001, 2014
author’s calculations
company company primarily associated with billionaire's wealth
1996, 2001, 2014
author’s calculations
company type indicates whether the company was new, acquired, or privatized when the billionaire or family members were first associated with it
1996, 2001, 2014
author’s calculations
relationshiptocompany describes the billionaire's relationship to the company primarily responsible for their wealth, such as founder, executive, relation, or shareholder
1996, 2001, 2014
author’s calculations
founding date founding date of company associated with the billionaire's wealth
1996, 2001, 2014
author’s calculations
notes extra information about individual billionaires 1996, 2001, 2014
author’s calculations
sources variables (source–source5)
record of web pages used to compile information on individuals
1996, 2001, 2014
author’s calculations
political connection equals 1 where the billionaire is linked to a politi-cian, privatized company, or questionable license (justification given in notes variables)
1996, 2001, 2014
author’s calculations
founder equals 1 where relationship to company is founder 1996, 2001, 2014
author’s calculations
generationofinheritance categorical variable that divides inherited billioni-ares by generation
1996, 2001, 2014
author’s calculations
typeofwealth categorical variable that divides billionaires into inherited, self-made founders, self-made execu-tives, politically connected/resource-related, and self-made finance
1996, 2001, 2014
author’s calculations

27
Reliability of the Data
Th ere are some methodological concerns with the Forbes data. Th e fi rst is that inherited wealth, which
is not necessarily tied to a specifi c company, may be more likely to be diversifi ed and thus may be
overlooked by Forbes journalists, who use shareholder information to estimate wealth. Indeed, only 12
percent of the 2014 billionaires have wealth that Forbes classifi ed as “diversifi ed” (5 percent) or the result
of “investments” (7 percent). Th e second is that many private companies may be overlooked because
valuation is diffi cult, at least until the company goes public or the founder dies, and much of that wealth
is likely to be self-made and excluded. For example, Twitter’s three principals did not make the billion-
aires’ list until their initial public off ering in 2013. In other cases, private company fortunes fi rst make the
list when an inheritance is taxed, potentially making inheritors more likely to be on the list.
One way to estimate the potential magnitude of the fi rst concern is to focus on the top of the
billionaire distribution where inherited fortunes are unlikely to be missing, that is, the top 100 billionaires
in each group. Since the billionaire ranked 100 in the rich world is worth $11.3 billion and in emerging
markets $5 billion, in 2014, it is hard to imagine many billionaires in these groups falling below the
Forbes’ radar screen. Table A2 compares the shares of wealth and billionaires in the top 100 observations
versus the entire sample of billionaires. Even with this metric, the same patterns hold. More than half of
billionaires are self-made and more so in the South than the North. Th is method is, however, less likely to
adequately address the concern about private companies, as valuation remains a problem, irrespective of
the cutoff .
Table A2 Shares of billionaires and wealth among 100 richest individuals, 2014
Rich world Emerging markets
Share of
billionaires
(percent)
Share of
total wealth
(percent)
Average net
worth
(billions of US dollars)
Share of
billionaires
(percent)
Share of
total wealth
(percent)
Average net
worth
(billions of US dollars)
Top 100
Inherited wealth 48.5 44.4 16.6 28.2 23.1 9.1
Self-made wealth 51.5 55.6 20.0 71.8 76.9 11.8
Full sample
Inherited wealth 37.3 41.1 4.8 20.9 21.9 3.4
Self-made wealth 62.7 58.9 4.1 79.1 78.1 3.2
Source: Authors’ calculations using data from Forbes World’s Billionaires list.
28
Table A3 Distribution of billionaires by country and type, 2014 (percent)
Inherited
Self-made
Share of
world's
billionaires
Company
founders
Owners and
executives
Political
connections
and
resource
related
Financial
sector
Anglo Countries 28.7 31.3 8.7 4.1 27.2 34
Australia 27.6 24.2 10.3 6.9 31 1.8
Canada 28.1 28.1 12.5 6.3 25 1.9
New Zealand 0 0 0 0 100 0.1
United States 28.9 32.1 8.4 3.8 26.8 30.2
Europe 35.8 23.4 6.4 20.4 14 28.4
Austria 40 30 30 0 0 0.6
Belgium 33.3 0 0 33.3 33.3 0.2
Cyprus 0 50 25 0 25 0.2
Czech Republic 0 0 16.7 50 33.3 0.4
Denmark 83.3 0 16.7 0 0 0.4
Finland 100 0 0 0 0 0.3
France 51.2 37.2 2.3 4.7 4.6 2.6
Georgia 0 0 0 100 0 0.1
Germany 64.7 25.9 5.9 2.3 1.2 5.1
Greece 66.7 0 0 33.3 0 0.2
Ireland 40 20 0 20 20 0.3
Italy 37.1 40 20 2.9 0 2.1
Lithuania 0 100 0 0 0 0.1
Monaco 33.3 66.7 0 0 0 0.2
Netherlands 42.9 42.9 0 14.3 0 0.4
Norway 22.2 33.3 11.1 0 33.3 0.5
Poland 0 20 0 20 60 0.3
Portugal 66.7 0 33.3 0 0 0.2
Romania 0 0 0 100 0 0.1
Russia 0 10.8 3.6 64 21.6 6.7
Spain 53.8 15.4 7.7 3.9 19.2 1.6
Sweden 63.2 15.8 0 5.2 15.8 1.1
Switzerland 72.7 18.2 0 4.5 4.6 1.3
Ukraine 0 11.1 0 55.6 33.3 0.5
United Kingdom 6.4 8.5 36.2 29.8 19.1 2.8
East Asia 17.1 32.5 15.1 9.1 26.2 21.2
China 2 40.1 25 9.2 23.7 9.2
Hong Kong SAR 33.3 13.3 11.1 2.2 40 2.7
Indonesia 10.5 21.1 5.3 26.3 36.8 1.1
Japan 18.5 63 7.4 0 11.1 1.6
Macau SAR 0 0 0 0 100 0.1
(table continues)

29
Table A3 Distribution of billionaires by country and type, 2014 (percent) (continued)
Inherited
Self-made
Share of
world's
billionaires
Company
founders
Owners and
executives
Political
connections
and
resource
related
Financial
sector
Malaysia 0 23.1 0 46.1 30.8 0.8
Philippines 20 20 0 10 50 0.6
Singapore 37.5 12.5 12.5 12.5 25 1
South Korea 74.1 18.5 3.7 0 3.7 1.6
Taiwan 17.9 42.8 10.7 3.6 25 1.7
Thailand 18.2 18.2 9.1 36.3 18.2 0.7
Vietnam 0 0 0 0 100 0.1
Latin America 49.1 19.3 6.1 8.8 16.7 6.9
Argentina 80 0 0 0 20 0.3
Brazil 47.7 21.5 7.7 4.6 18.5 3.9
Chile 66.7 8.3 0 16.7 8.3 0.7
Colombia 50 0 0 0 50 0.2
Mexico 37.5 12.5 12.5 25 12.5 1
Peru 37.5 50 0 12.5 0 0.5
Venezuela 66.7 0 0 0 33.3 0.2
Middle East/North Africa 43.6 17.9 9 14.1 15.4 4.7
Algeria 0 100 0 0 0 0.1
Egypt 71.4 14.3 14.3 0 0 0.4
Israel 22.2 27.8 16.7 16.7 16.7 1.1
Kuwait 100 0 0 0 0 0.3
Lebanon 66.7 0 0 33.3 0 0.4
Morocco 50 0 0 0 50 0.2
Oman 0 0 0 50 50 0.1
Saudi Arabia 0 0 14.3 42.9 42.9 0.4
Turkey 45.9 29.2 8.3 8.3 8.3 1.4
United Arab Emirates 75 0 0 0 25 0.2
South Asia 30.6 30.7 6.5 17.7 14.5 3.8
India 33.9 33.9 7.2 10.7 14.3 3.4
Kazakhstan 0 0 0 100 0 0.3
Nepal 0 0 0 0 100 0.1
Sub-Saharan Africa 18.7 25 18.8 25 12.5 1
Angola 0 0 0 100 0 0.1
Nigeria 0 50 0 50 0 0.3
South Africa 37.5 25 12.5 12.5 12.5 0.5
Swaziland 0 0 100 0 0 0.1
Tanzania 0 0 100 0 0 0.1
Uganda 0 0 0 0 100 0.1
Total 30.4 27.7 9.3 11.3 21.3 100
Source: Authors' calculations using data from Forbes World's Billionaires list.

30
0
10
20
30
40
50
60
70
80
90
100
United States Europe Other advanced economies
1996 2001 2014 1996 2001 2014 1996 2001 2014
share of total real net worth
Inherited wealth Self-made company founders Self-made financial sector
Self-made owners and executives Political connections and resource related
Figure A1 Distribution of wealth by type of billionaire, advanced economies
Source: Authors’ calculations using data from Forbes World’s Billionaires list and the billionaire characteristics database.