working paper series...section 2 identifies the three major causes of the current eu ets’...
TRANSCRIPT
Les Cahiers de la Chaire Economie du Climat
Governance of CO2 markets: Lessons from the EU ETS
Christian de Perthuis1 and Raphaël Trotignon
2
The European emissions trading scheme (EU ETS) is the centrepiece of Europe’s
climate policy. The system has been undermined variously by the weakness of its regulation,
an undesirable overlap with other public policies and the far-reaching economic and financial
crisis that caused the market price of allowances to plunge.
This article attempts to identify the conditions for making the coming years of the EU
ETS a success. It draws historical lessons from the eight years the scheme has been in
operation, and then analyzes, using the ZEPHYR-Flex model, the various interventions by the
public authorities currently under discussion in order to revive the market. These simulations
reveal the risk of carrying forward problems to the future, with further clouding of the
visibility needed by ETS actors in the long term.
Finally, the article proposes to draw lessons from monetary policy by outlining what
might be the mandate of an Independent Carbon Market Authority, with responsibility for the
dynamic management of the supply of allowances, and whose main mission would be to
ensure the optimal linkage between the different temporal horizons of the climate strategy.
Keywords: Emission trading, EU ETS, governance.
n° 2013-07
Working Paper Series
1. Paris Dauphine University and Climate Economics Chair
2. Climate Economics Chair


1
Governance of CO2 markets: Lessons from the EU ETS
Christian de Perthuis and Raphael Trotignon
Affiliations
Christian de Perthuis: professor at Paris-Dauphine University, France
Raphael Trotignon: corresponding author, research fellow at Climate Economics
Chair, Paris-Dauphine University. Address: 28 place de la Bourse, Palais
Brongniart, 75002 France. Email:
Abstract
The European emissions trading scheme (EU ETS) is the centrepiece of Europe’s
climate policy. The system has been undermined variously by the weakness of
its regulation, an undesirable overlap with other public policies and the far-
reaching economic and financial crisis that caused the market price of
allowances to plunge. This article attempts to identify the conditions for making
the coming years of the EU ETS a success. It draws historical lessons from the
eight years the scheme has been in operation, and then analyzes, using the
ZEPHYR-Flex model, the various interventions by the public authorities
currently under discussion in order to revive the market. These simulations
reveal the risk of carrying forward problems to the future, with further clouding
of the visibility needed by ETS actors in the long term. Finally, the article
proposes to draw lessons from monetary policy by outlining what might be the
2
mandate of an Independent Carbon Market Authority, with responsibility for
the dynamic management of the supply of allowances, and whose main mission
would be to ensure the optimal linkage between the different temporal horizons
of the climate strategy.
Keywords: Emission trading, EU ETS, governance
Research Highlights
• History suggest that ex ante expectations tend to overestimate the
constraint
• Economic conditions, policy overlaps, and Kyoto credits cause the
current weakness
• “Set aside” or “backloading” does not resolve structural issues
• Changing/extending the reduction target is necessary but not sufficient
• An Independent authority could ensure the credibility of the constraint
over time

3
Introduction
The economic literature differentiates “command and control” policies, in which
the public authority set up standards and rules to directly reduce environmental
damages, from policies based on “economic tools” aiming at internalizing the
cost of environmental damages. There is a large consensus among economists to
favor “economic tools” that aim at protecting the environment in the most
efficient way, i.e. by minimizing the total cost of pollution abatement. Despite
those recommendations, most of the environmental policies conducted in the
real world continue to favor “command and control” policies.
There are two ways of introducing these economic instruments: price-based
regulation and quantity-based regulation. The case of the European Union
Emission Trading Scheme (EU ETS) provides to date the most complete
experience of carbon pricing through a quantitative tool, a cap-and-trade
program. Covering more than 12,000 industrial installations in 30 European
countries, responsible for almost half of European CO2, it entered into force in
2005 to facilitate the achievement by European Member States of the targets set
by the Kyoto Protocol for the period 2008-2012. The rules are set up in the
EU ETS directive; see European Parliament and the Council of the EU, 2003. The
launching of this instrument and its functioning during the first trading period
(2005-2007) has been analyzed by Ellerman et al., 2010, who considered this
experience as a major innovation in the field of climate policies, that could
inspire the development of other schemes in the world.
However, since the publication of this first ex post evaluation, the EU-ETS has
faced new challenges: the unexpected economic recession strongly affected the

4
industries under the cap and contributed to reduce their CO2 emissions; the
market was hit in 2008 and 2009 by large scale frauds that affected its
reputation; the large possibility of using offset contributed to reduce the
severity of the cap defined for the second trading period which ended with a
carbon price collapse. At the current price, less than 5 Euros per ton of CO2,
most observers consider that the EU ETS does not send the right incentives to
reduce emissions both in the short and the long term. This raises the issue of the
rules that should govern the market.
Since the end of 2011, the EU ETS is subject to this debate. In July 2012, The
European Commission made a proposal dedicated at reducing the supply of
allowances in the market between 2013 and 2015 (European Commission,
2012a). This so called “back loading” proposal has not yet been implemented.
Nevertheless in July 2013 the European Parliament approved the proposed
amendment with some modifications and voted to open talks with the Council
aimed at reaching agreement on this basis. In addition to the “back loading”
proposition, the European Commission published in December 2012 a report on
the state of the European carbon market, which outlines options for a structural
reform of the EU ETS (European Commission, 2012b).
This article is an attempt to contribute to this debate. Contrary to most of the
views it doesn’t take for granted that the current price on the EU ETS is “too
low” because of an existing “surplus” of allowances on the market. By nature,
the EU ETS aims at minimizing the cost of reaching a certain predefined
emission target. The carbon price has a major role to play, in influencing the
decisions of economic players both in the short-term management of their

5
existing assets, and in the longer term direction of their investments. The
economic efficiency of the policy is thus dependent on the EU ETS capacity to
establish rules that will modify the short term behavior of agents as well as their
investments decision, which requires changing their medium to long term
anticipations. The major implication of the choice of quantitative instruments is
that the price associated to carbon emissions will not be fixed by the authority
but will be revealed by the market. It will reflect the current and anticipated
scarcity of emission allowances, so that the economic efficiency relies not on a
subjective desirable price level but on actors’ anticipations of the medium to
long term emission constraint, and especially how these expectations evolve
over time. This lead us to recommend very different measures than the
“backloading” or the so called “structural measures” proposed by the European
Commission to reanimate the European carbon market.
In the first section, we analyze the key role of anticipations in a cap-and-trade
program by comparing the past expectations to actual EU ETS developments.
Section 2 identifies the three major causes of the current EU ETS’ weaknesses,
and distinguishes among these the economic influences from the effects of other
structural settings. In section 3 we examine with our EU ETS simulation model
ZEPHYR the options for structural reform made by the European Commission.
None of the options appears to completely remedy the issues identified
previously. Section 4 tries to build on these lessons and proposes the
improvement of the current governance framework with the creation of an
Independent Carbon Market Authority (ICMA), whose mandate would allow
participants to build sound expectations over time. The last section concludes in
trying to precise the general lessons that can be drawn from the EU-ETS case.
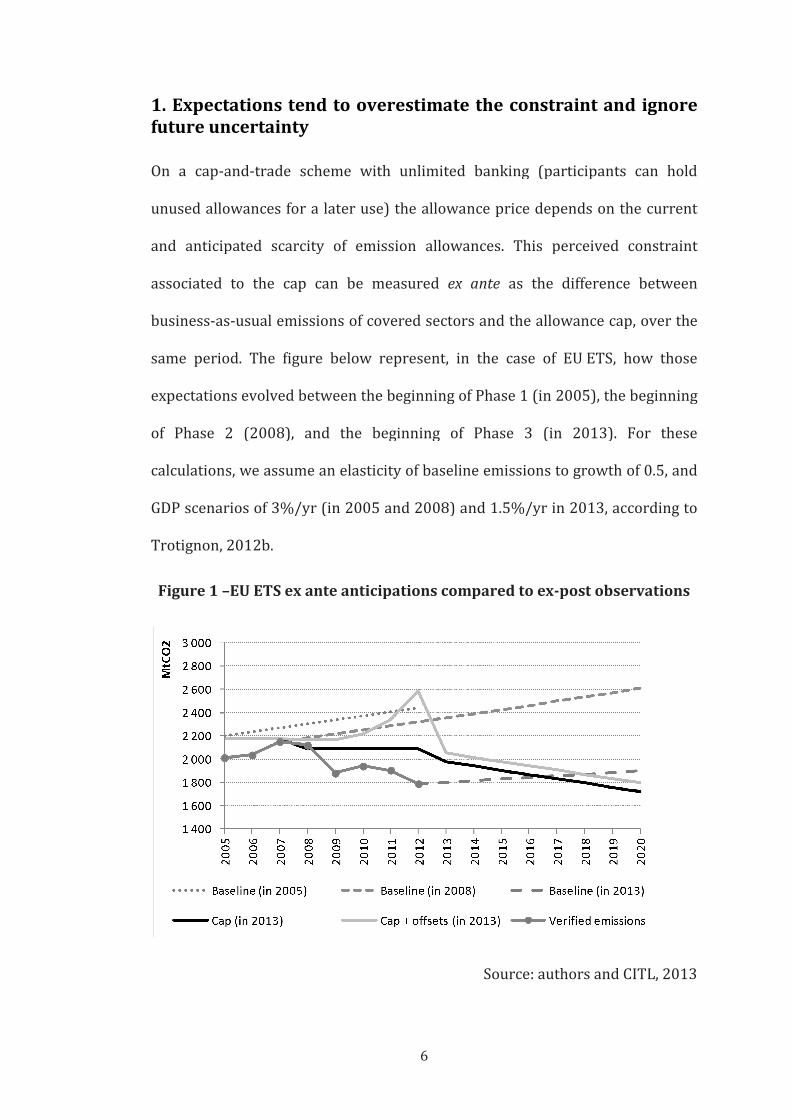
1. Expectations tend to overestimate the constraint and ignore
future uncertainty
On a cap-and-trade scheme with unlimited banking
unused allowances for a later use)
and anticipated scarcity of emission allowances.
associated to the cap can be measured
business-as-usual emissions
same period. The f
expectations evolved between the beginning of Phase 1 (in 2005), the beginning
of Phase 2 (2008), and the beginning of Phase 3 (in 2013).
calculations, we assume an elasticity of baseline emissions to growth of 0.5, and
GDP scenarios of 3%/yr (in 2005 and 2008) and 1.5%/yr in 2013
Trotignon, 2012b.
Figure 1 –EU ETS ex ante anticipations compared to ex
6
Expectations tend to overestimate the constraint and ignore
future uncertainty
de scheme with unlimited banking (participants can hold
for a later use) the allowance price depends on the current
and anticipated scarcity of emission allowances. This perceived
associated to the cap can be measured ex ante as the difference between
usual emissions of covered sectors and the allowance cap
The figure below represent, in the case of EU
expectations evolved between the beginning of Phase 1 (in 2005), the beginning
of Phase 2 (2008), and the beginning of Phase 3 (in 2013).
lculations, we assume an elasticity of baseline emissions to growth of 0.5, and
GDP scenarios of 3%/yr (in 2005 and 2008) and 1.5%/yr in 2013
ETS ex ante anticipations compared to ex-post observations
Source: authors
Expectations tend to overestimate the constraint and ignore
(participants can hold
price depends on the current
perceived constraint
as the difference between
and the allowance cap, over the
, in the case of EU ETS, how those
expectations evolved between the beginning of Phase 1 (in 2005), the beginning
of Phase 2 (2008), and the beginning of Phase 3 (in 2013). For these
lculations, we assume an elasticity of baseline emissions to growth of 0.5, and
GDP scenarios of 3%/yr (in 2005 and 2008) and 1.5%/yr in 2013, according to
post observations
authors and CITL, 2013

7
2005 was the first year of EU ETS, Phase 1 (2005-2007) being a trial period. At
that time, very few information was available on the emissions of covered
installations, as well on the probable scarcity of allowances, and it was not yet
clear if banking into Phase 2 was going to be allowed in some Member States or
not. Accounting for a sustained economic growth and positing emission levels
around the cap in 2005, a certain scarcity of EUAs was anticipated.
It eventually turned out that verified emissions for the year 2005 were lower
than initially expected, and the market price immediately integrated this new
information at the time of publication in April 2006. It progressively dropped to
zero in 2007 as it became clear that the quantity of allowances was sufficient to
cover verified emissions over the period, and that banking between Phase 1 and
Phase 2 had been definitely forbidden.
2008 is marked by the vote of the European Climate Energy Package, a set of
directives and regulations aiming to reach the 2020 objectives (targets for
greenhouse gas emissions, renewable energy, and energy efficiency). In
particular, the EU ETS directive was extended to 2020 by taking into account
the emission reduction target announced by the European Council, 2007;
European Parliament and the Council of the EU, 2009. A calculation accounting
for sustained economic growth and an equally spread use of offsets over time
would show a large anticipated deficit of allowances until 2020. Most price
forecast at the time were counting on a EUA price in 2012 of around 35€/tCO2.
Again, expectations did not come true and in 2012 the carbon price had
dropped below 10€/tCO2. The unforeseen financial crisis and the degraded
growth outlooks are indeed responsible for part of this change in anticipations,
8
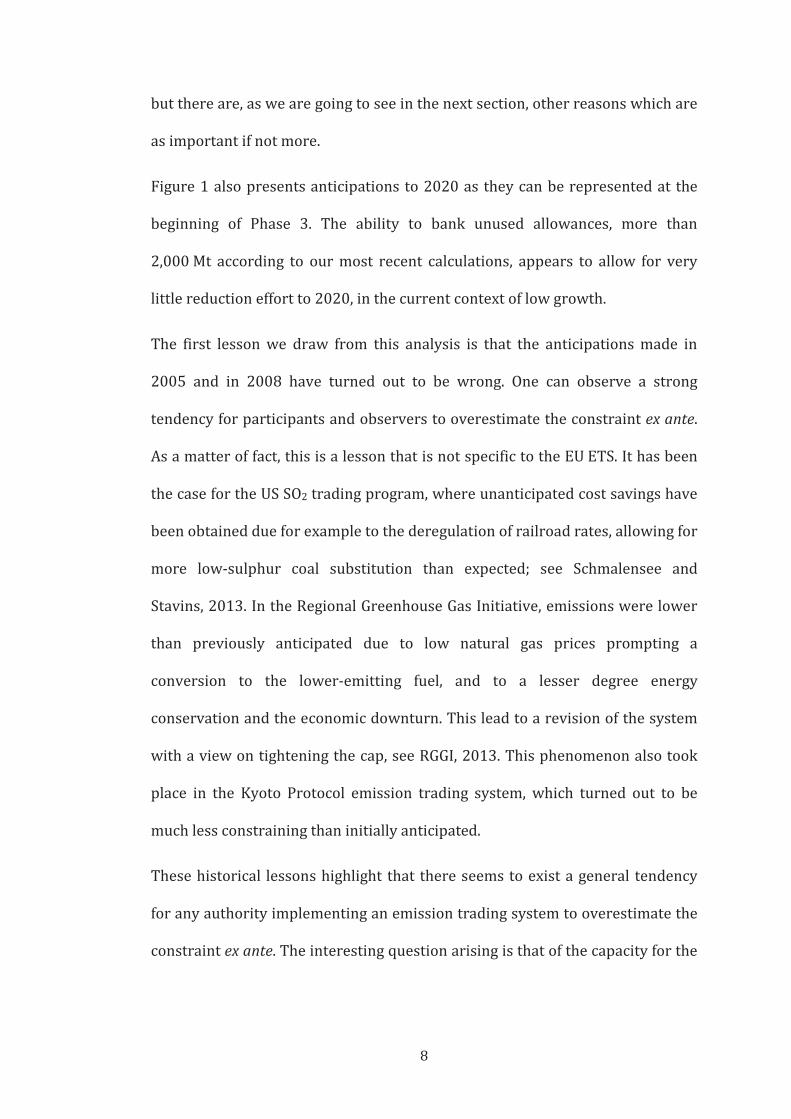
but there are, as we are going to see in the next section, other reasons which are
as important if not more.
Figure 1 also presents anticipations to 2020 as they can be represented at the
beginning of Phase 3. The ability to bank unused allowances, more than
2,000 Mt according to our most recent calculations, appears to allow for very
little reduction effort to 2020, in the current context of low growth.
The first lesson we draw from this analysis is that the anticipations made in
2005 and in 2008 have turned out to be wrong. One can observe a strong
tendency for participants and observers to overestimate the constraint ex ante.
As a matter of fact, this is a lesson that is not specific to the EU ETS. It has been
the case for the US SO2 trading program, where unanticipated cost savings have
been obtained due for example to the deregulation of railroad rates, allowing for
more low-sulphur coal substitution than expected; see Schmalensee and
Stavins, 2013. In the Regional Greenhouse Gas Initiative, emissions were lower
than previously anticipated due to low natural gas prices prompting a
conversion to the lower-emitting fuel, and to a lesser degree energy
conservation and the economic downturn. This lead to a revision of the system
with a view on tightening the cap, see RGGI, 2013. This phenomenon also took
place in the Kyoto Protocol emission trading system, which turned out to be
much less constraining than initially anticipated.
These historical lessons highlight that there seems to exist a general tendency
for any authority implementing an emission trading system to overestimate the
constraint ex ante. The interesting question arising is that of the capacity for the

9
public authority to establish a coherence between the short term and the longer
term constraint that will be robust over time, in this context of uncertainty.
2. The three causes of current market weaknesses
Most observers (as well as the European Commission in its report on the state
of the carbon market), attribute the current weakness of the EU ETS to the
economic crisis that strongly affected industrial output and induced a “surplus”
of allowances. As we are going to see in this section, this observation is
incomplete and does not allow to draw the correct lessons from the functioning
of the market and thus to propose adequate recommendations.
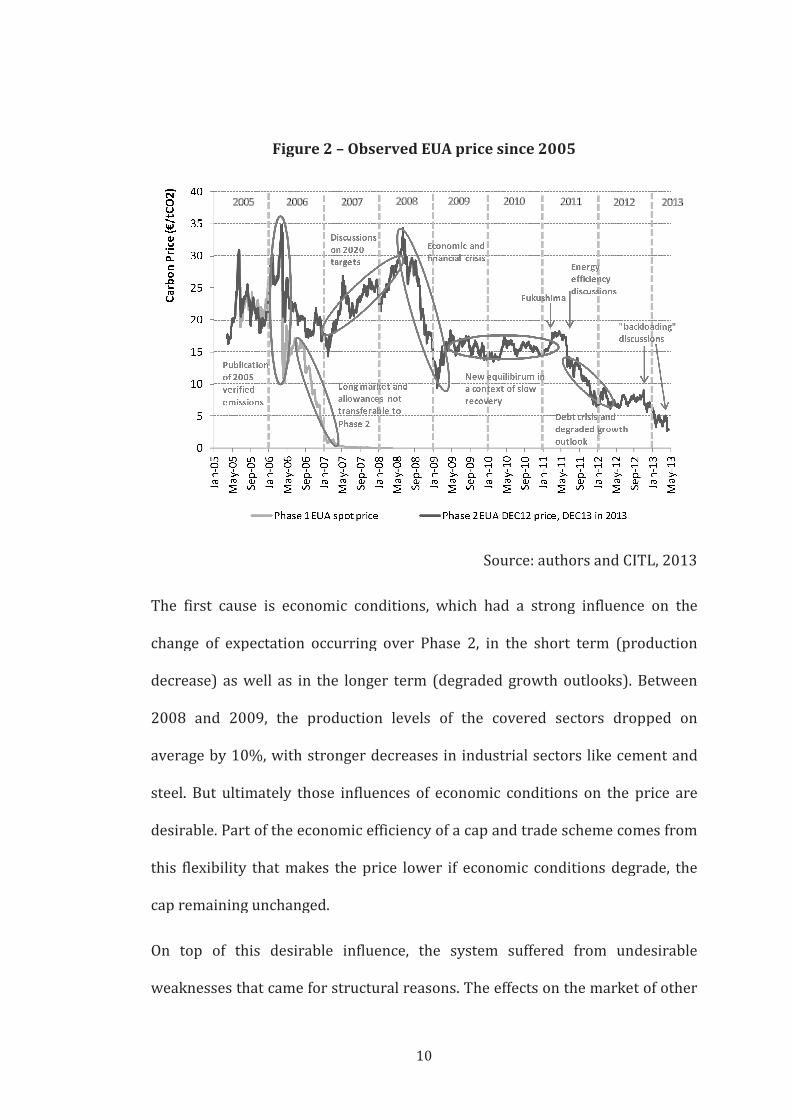
There are three main causes for the current malfunctioning of the market (see
the observed EUA price on Figure 2 below). The first is effectively the
unforeseen decline in industrial activity since the 2008 crisis, and future
prospects perceived as unfavorable. The second is the high use of carbon offsets
over a short period of time resulting from the unforeseen evolution of the
international Kyoto system in conjunction with the time-flexibility left to
participants for using offsets. The third reason is the interactions between the
allowance system and other energy and climate policies, mainly renewable
energy and energy efficiency policies that can drive EU ETS emissions down
independently of the EUA price.
Figure
The first cause is economic conditions,
change of expectation occurring over Phase 2
decrease) as well as in the longer term (degraded growth outlooks)
2008 and 2009, the production
average by 10%, with stronger decreases in industrial sectors like cement and
steel. But ultimately
desirable. Part of the economic efficiency of a cap and trade scheme comes from
this flexibility that makes the price lower if economic conditions degrade, the
cap remaining unchanged.
On top of this desirable influence, the system
weaknesses that came for structural reasons
10
Figure 2 – Observed EUA price since 2005
Source: authors
he first cause is economic conditions, which had a strong influence on the
change of expectation occurring over Phase 2, in the short term
as well as in the longer term (degraded growth outlooks)
2008 and 2009, the production levels of the covered sectors dropped on
erage by 10%, with stronger decreases in industrial sectors like cement and
ultimately those influences of economic conditions
e. Part of the economic efficiency of a cap and trade scheme comes from
makes the price lower if economic conditions degrade, the
cap remaining unchanged.
On top of this desirable influence, the system suffered
that came for structural reasons. The effects on the market of oth
Observed EUA price since 2005
ource: authors and CITL, 2013
had a strong influence on the
, in the short term (production
as well as in the longer term (degraded growth outlooks). Between
the covered sectors dropped on
erage by 10%, with stronger decreases in industrial sectors like cement and
s of economic conditions on the price are
e. Part of the economic efficiency of a cap and trade scheme comes from
makes the price lower if economic conditions degrade, the
from undesirable
. The effects on the market of other
11
climate and energy policies (energy efficiency, renewable energy) and the
unforeseen use of carbon credits over time, resulted in a strongly decreased
demand for EUAs in the market in the short term, as well as blurred
anticipations in the long term.
Weigt et al., 2012 evaluate the effect of renewable energy support in Germany to
be responsible for a reduction of 10 to 16% in the German electricity sector’s
emissions. In the same way, energy efficiency policies can reduce the demand
for electricity generated by EU ETS covered sectors, thus implying emission
reductions independently of the carbon price. If those structural weaknesses are
not controlled in some way, this process of increasing interaction will
automatically lead to the marginalization of the ETS, because the emission base
of the system will be eroded by other policies. The fact that both the
environmental and economic effectiveness of cap and trade programs can be
significantly compromised by interactions with other regulations is crucial, and
has been pointed out as a key element for the implementation of cap-and-trade
programs by Goulder, 2013. It is much harder for participants to make sound
expectations for the future in a context of uncontrolled policy super-imposition.
As far as the market is concerned, there is only one cap that matters in the end,
it is the total domestic cap plus the allowed offsets over the period. The rules for
using offsets in the EU ETS fixed the amount that could be used over 2008-2012
to approximately 1,400 Mt. This limit was then extended to around 1,600 Mt
over 2008-2020 when the Climate Energy Package was voted, see European
Parliament and the Council of the EU, 2009. This provision leaves most
participants free to decide the timing at which offsets will be used (the right to
12
use offsets can be banked to later years). Between 2008 and 2009, around 80
million offsets per year have been used in the EU ETS; see Trotignon, 2012a. But
in 2010, the European Commission announced qualitative restrictions on
certain offset types that represented the majority of existing offsets, stating that
the restriction would apply only from 2013 onward; see Hedegaard, 2010. As a
consequence and by anticipation of the future restriction, the use of those
offsets surged over the rest of Phase 2 to represent a cumulated amount of
around 900 Mt over five years. The price of those largely available offsets
dropped to less than 1 €/t, allowing participants to comply with the ETS
constraint at very low cost, because of the unforeseen evolution of the Kyoto
trading system. It was first anticipated that Europe would not be the only buyer
of offsets, but no other large scale source of demand eventually emerged.
The lesson is that if the domestic cap is unchanged but the authorized use of
offsets over time is changed, this is strictly equivalent to changing the cap. If the
public authority leaves too much flexibility for using offsets, then the
anticipations of the future constraint over time can be blurred, and the public
authority can lose part of its sovereignty in deciding the reduction effort that
will be effective domestically over a certain period. In proposals for cap-and-
trade programs outside of Europe, this uncertainty has been accounted for by
measures such as conversion rates between offsets and allowances, or price
threshold above which more offsets become allowed in the system (option
discussed in RGGI for example).
Of course, a cap-and-trade alone cannot do everything by itself, and other
targeted policies are probably needed to support specific goals, which will have
13
an impact on EU ETS emissions. As a consequence, there will be policy
interactions between the EU ETS and other policies. European climate energy
policies are concerned, but also unilateral national policies. The United
Kingdom’s tax on electricity sectors emissions is a good example; see United
Kingdom’s HM Revenue and Customs, 2013. If such measures are taken
individually by Member States, the economic efficiency of the EU ETS will suffer
from it, because the advantage of having a uniform CO2 price falls when
individual countries or sector “force” a carbon price that is higher than the
market price. In the next section we are examining whether the solutions on the
table today would be able to solve those identified weaknesses.
3. Evaluation of the Commission’s proposals with the ZEPHYR
model
The European Commission took two parallel measures to try to solve the
current weaknesses. The first is a short term action, called backloading; see
European Commission, 2012a. This measure consists of delaying the auctioning
of 900Mt taken from the 2013-2015 allowance cap, which would be injected
back in the market through the 2019-2020 auctions. In that way the overall cap
over Phase 3 would not be changed but the timing of auctions would shift
volumes towards the end of the period. The second measure was to launch
discussions on the so called “structural reform” of the EU ETS, following the
publication of the Commission’s report on the state of the European carbon
market; European Commission, 2012b. This report proposed six different
options for extending or strengthening the system. The backloading proposal as
well as different options from the report have been tested with our EU ETS
14
simulation model, ZEPHYR-Flex. The model simulates the compliance behavior
of EU ETS installations in each sector and calculates annual supply-demand
equilibrium up to 2020, based on scenarios for growth, offsets and the future
cap, see Trotignon, 2012b and De Perthuis and Trotignon, 2012. In the reference
scenario, that describes the situation before any intervention, the annual
reduction factor of the cap is set to -1.74% and is supposed constant up to 2030
(continuity of current trajectory), banking is allowed from Phase 3 into Phase 4,
and we assume a complete use of offset limits up to 2020, and no offsets after
2020. The baseline emission growth is derived from a GDP growth scenario of
2%/yr from 2013 to 2020. In this reference scenario, the resulting EUA price
would be around 6€/tCO2 in 2015 and 13€/tCO2 in 2020.
3.1 “Set aside” or “backloading” does not resolve structural issues
Two extreme cases can be represented. In the first situation, the change in the
timing of auctions is perfectly anticipated by participants. In that case, there is
no change compared to the reference scenario, because the overall cap is not
changed by the backloading. In the opposite situation, participants do not
anticipate the lower short term cap, and the price rises quite abruptly before
plunging again when volumes are re-injected in the market. The Figure 3 below
represents a central situation between the two extremes described above. In
this scenario, the price would rise to 16€/tCO2 in 2015 and drop down to
3€/tCO2 in 2019.

Figure
These simulations show
the medium to long term and leads to even greater confusion in terms of market
participants’ expectations
leads in the medium term to an even lower price than today, as long as the
allowances cap remains unchanged.
3.2 Changing/extending the reduction target
sufficient
Options from the Commission’s report have also been tested. The two that
best able to correct the market would be option
longer term constraint: option
target to 34% and a linear extension o
combined option (b) + (c), which involves a cancellation of allowances in Phase
3 and a revision of the linear reduction factor of the cap in Phase 4, equivalent to
a Roadmap trajectory implemented from Phase 3. In both
model indicates a price
15
Figure 3 – Results in the backloading scenario
Source: Climate Economics Chair, ZEPHYR
These simulations show that backloading alone does not rectify the market in
the medium to long term and leads to even greater confusion in terms of market
participants’ expectations. The price rise induced by such a short
leads in the medium term to an even lower price than today, as long as the
allowances cap remains unchanged.
Changing/extending the reduction target is necessary but not
Commission’s report have also been tested. The two that
best able to correct the market would be options giving more clarity on the
longer term constraint: option (a), which consists of raising the 2020 reduction
target to 34% and a linear extension of the reduction after 2020; and the
combined option (b) + (c), which involves a cancellation of allowances in Phase
3 and a revision of the linear reduction factor of the cap in Phase 4, equivalent to
a Roadmap trajectory implemented from Phase 3. In both cases, the
price that could go up to around €25/tCO2 in 2020.
backloading scenario
Source: Climate Economics Chair, ZEPHYR-Flex model
that backloading alone does not rectify the market in
the medium to long term and leads to even greater confusion in terms of market
. The price rise induced by such a short-term measure
leads in the medium term to an even lower price than today, as long as the
is necessary but not
Commission’s report have also been tested. The two that seem
giving more clarity on the
(a), which consists of raising the 2020 reduction
f the reduction after 2020; and the
combined option (b) + (c), which involves a cancellation of allowances in Phase
3 and a revision of the linear reduction factor of the cap in Phase 4, equivalent to
cases, the ZEPHYR
in 2020. Only those

16
options which make the allowances cap visible in the longer term seem to be
able to remedy the current situation in the market.
3.3 Other proposals from the Commission and summary of our
results
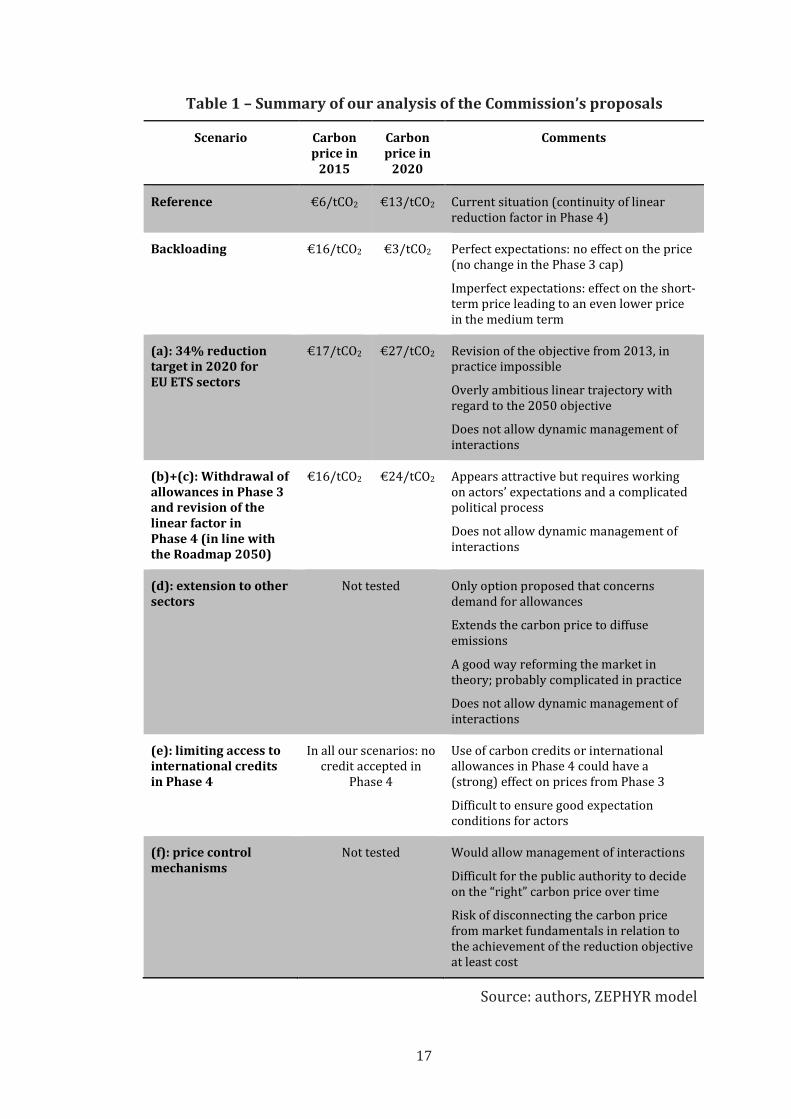
The Table below summarizes our results and comments the different options.
17
Table 1 – Summary of our analysis of the Commission’s proposals
Scenario Carbon
price in
2015
Carbon
price in
2020
Comments
Reference €6/tCO2 €13/tCO2 Current situation (continuity of linear
reduction factor in Phase 4)
Backloading €16/tCO2 €3/tCO2 Perfect expectations: no effect on the price
(no change in the Phase 3 cap)
Imperfect expectations: effect on the short-
term price leading to an even lower price
in the medium term
(a): 34% reduction
target in 2020 for
EU ETS sectors
€17/tCO2 €27/tCO2 Revision of the objective from 2013, in
practice impossible
Overly ambitious linear trajectory with
regard to the 2050 objective
Does not allow dynamic management of
interactions
(b)+(c): Withdrawal of
allowances in Phase 3
and revision of the
linear factor in
Phase 4 (in line with
the Roadmap 2050)
€16/tCO2 €24/tCO2 Appears attractive but requires working
on actors’ expectations and a complicated
political process
Does not allow dynamic management of
interactions
(d): extension to other
sectors
Not tested Only option proposed that concerns
demand for allowances
Extends the carbon price to diffuse
emissions
A good way reforming the market in
theory; probably complicated in practice
Does not allow dynamic management of
interactions
(e): limiting access to
international credits
in Phase 4
In all our scenarios: no
credit accepted in
Phase 4
Use of carbon credits or international
allowances in Phase 4 could have a
(strong) effect on prices from Phase 3
Difficult to ensure good expectation
conditions for actors
(f): price control
mechanisms
Not tested Would allow management of interactions
Difficult for the public authority to decide
on the “right” carbon price over time
Risk of disconnecting the carbon price
from market fundamentals in relation to
the achievement of the reduction objective
at least cost
Source: authors, ZEPHYR model
18
But in the light of the issues discussed in the previous section, none of the
routes proposed by the Commission in its consultation paper seems completely
satisfactory, because the question of market governance remains a taboo that is
not explicitly addressed.
If we stay within the current system of governance, the most appropriate action
would be to speed up the adoption by the 27 EU Member States of a credible
goal for 2030. Backloading accompanied by an emissions reduction target of
40% in 2030 could raise the price of CO2 allowances to €16/tCO2 in 2015 and
€24/tCO2 in 2020. In the current governance framework, such a decision is very
difficult to obtain because a lot of time and efforts are necessary for Member
States to agree on the general climate targets and then to negotiate the
distribution of efforts between the different policy tools and countries.
In the event of the adoption of a clearer long term reduction target, retaining the
current governance would, however, leave a rigid system unable to adapt to
shocks which are unpredictable today but are certain to occur between now and
2030. We propose exploring an alternative route to the options currently on the
table, in which an independent carbon market authority would be established.
4. The case for an Independent Carbon Market Authority (ICMA)
A cap-and-trade program is fundamentally an instrument of public policy,
consequently is will not be revived unless there is a strong political
involvement, especially in determining its long term emission reduction target.
The negotiation of a Climate Energy Package for 2030 is currently underway
following the publication of the European Commission’s green paper on a
framework for climate and energy policies; European Commission, 2013. A
19
decision on a longer term reduction target is thus an important prerequisite to
the propositions of governance improvements detailed hereafter.
The experience from eight years of market history previously analyzed shows
that the current governance framework does not enable participants to shape
sound expectations over time. Over the long term, the most inconvenient
influences are not those of economic conditions but those induced by structural
weaknesses linked to climate-energy policies overlap and to uncontrolled
international linking (offsets + non-EU allowances). Dealing with those two
uncertainties requires a more flexible intervention framework than the one
available today. It would be extremely inefficient for Europe to engage in years-
long debates such as the backloading negotiations every time something
unexpected happens.
The recovery of the market calls for strong political support at a European level
and a commitment to reform its governance, involving the establishment of a
predictable and dedicated intervention framework. This mandate could be
entrusted to an independent carbon market authority, which would ensure the
consistency and credibility of the allowances system in the short to long term
through the dynamic management of the supply of allowances. This framework
is inspired by the example of monetary policies, with which emission trading
has many similarities, as shown by Whitesell, 2012. In particular, Whitesell
underlines that in both systems the public authority tends to be naturally
subjugated by short term market conditions and is less inclined to ensure the
credibility of the long term target over time.

20
4.1 A possible mandate for the Independent Carbon Market
Authority (ICMA)
In our proposal, the role of the political authority remains unchanged: namely,
to define detailed policy objectives for emissions reduction at a European and
national level; and to select the range of public policy instruments to achieve
these objectives.
ICMA’s mandate (detailed in Table 2) is to maintain the credibility and political
ambition of the policy over time by a dynamic management of allowances
supply, from the short term (through the timing of auctions) to the long term
(through the revision of EU ETS’ cap).
In the short term, it would be a matter of being able to adjust the timing of
auctions so as to ensure proper functioning and liquidity in the trading market.
In the medium and long term, it would be a matter of being able to adjust the
allowances cap in order to control interactions with other climate and energy
policies and with international carbon credits.
To motivate and justify its actions, the independent authority should implement
fair and transparent monitoring of the system (monitoring of transactions,
compliance behaviour, low-carbon investment, emission trajectories, effects on
competitiveness). It should also report regularly and publicly on its actions to
the Council and the European Parliament.
At an institutional level, the mandate of this authority could either be assigned
to a new agency, or the powers of the existing energy markets authority could
be extended.

21
Table 2 – Outline of the mandate of the Independent Carbon Market
Authority
Function Associated action
Regular monitoring and
transparency of information
Collecting, analysing and sharing information on:
• Transactions on the ETS market
• Emission trajectories
• Compliance behaviour
• Low-carbon investment
• Effects on competitiveness
Motivating and justifying its decisions.
Liquidity and good
functioning of the market in
the short term
Primary market: time management of allowances auctions.
No need for intervention in the secondary market.
Credibility over time of the
medium-to-long-term
constraint
The public authority determines the detailed emissions
reduction objectives and the policy instruments to achieve
these objectives.
The independent carbon market authority implements this
policy objective in the sectors covered and can dynamically
adjust the allowances cap in two cases:
• To maintain consistency with other climate and
energy policy instruments
• To control interactions with carbon credits and
international allowances.
No need for a price corridor or cost control reserve.
Reporting and compliance
with the mandate
Periodic hearings by the European Parliament and the
European Council.
Frequent public reporting.
Source: authors
In practical terms, it may be wondered how such an authority would have
reacted to the recent market malfunctioning. In the short term, the question of
backloading would no longer arise because of the mandate given by the
European Parliament and the Council to the Independent Carbon Market
Authority for the dynamic management of auctions. Faced with the three

22
previously identified causes for the fall in the market price, the independent
carbon market authority would not have made any changes to the cap following
the economic recession (in view of the normal and desirable adjustment of the
equilibrium price after an economic shock). It would, however, have
investigated the impact of changes in the functioning of the international Kyoto
credit market and the impact of other Climate and Energy Package directives,
with a view to tightening the cap. This tightening would involve returning to the
constraint level initially assigned by the public authority to the sectors covered.
4.2 Is there a need for a price floor or a price collar?
In our vision, ICMA’s means of action should be based on quantitative
instruments, and there is no explicit need of introducing a long term price floor
or a price collar as it is the case for example in California’s cap-and-trade
program; see California Air Resources Board, 2013.
But the public authority could decide to increase the visibility of the carbon
price signal by introducing such price targets. Would these decisions solve the
problem and make the creation of an ICMA unnecessary?
If the public authority decides to introduce a price floor without changing the
current governance of the market, it bears a risk of disconnecting the price
signal from quantity-based market fundamentals. For example, in the case of a
price floor, if the market conditions bring the carbon price to the floor, the
unbalance between supply and demand will increase as the cap entities will be
incited to continue to abate emission by an artificial price which doesn’t reflect
market conditions. Instead of correcting the initial unbalance, the price floor
will exacerbate it and the price signal will be blurred.

23
If the public authority wants to give a long term signal with explicit price target
trajectories in the medium and long term, the only practical way to implement it
is to introduce a dynamic supply management of allowances to adapt the
quantitative parameters of the market. This requires a change in the way the
market is managed today. In other words, our proposal doesn’t require explicit
price targets. But if these price targets have to be introduced, the only way to
manage the situation would be to establish an ICMA and to add to its mandate
these additional provisions.
Conclusion
The historical development of cap-and-trade programs reveals a strong
tendency to over-estimate the constraint ex ante, by fear of high prices, which
leads to the implementation of flexibility measures and additional policies
aiming at containing the costs associated to the cap-and-trade constraint. What
is observed ex post is very different from initial expectations, with prices
generally much lower than expected. The key point to keep in mind is that the
public authority and market participants will never know and anticipate
perfectly in advance the future developments that will determine the actual
constraint.
It is thus very hard for the public authority to ensure the predictability of the
constraint in a context which is very uncertain by nature. This awkward
situation requires a governance framework that can express very clearly the
medium to long term targets of the policy, and at the same time has a capacity to
react in the short term to unanticipated situations.
24
One of the ways to reconcile both requirements is to have the public authority
determine the long term goals and the policy mix allowing reaching these goals,
while entrusting to an independent authority the means to maintain this
constraint over time in function of the uncertainties. The job of the ICMA is to
give credibility and robustness over time to the reduction constraint set by the
public authority. There are three pillars for such a framework to be effective:
the existence of a precise mandate that determines the independence of the
ICMA, the level of expertise of the ICMA, and the reporting and accountability
rules of the ICMA.
In the short term, the question of backloading would not be asked anymore
because of ICMA’s mandate on the timing of auctions. In the longer term, the
ICMA would also have the mandate to adapt the ETS cap, not in reaction to a
change in economic conditions, but when unexpected events such as policy
instruments overlap would require an intervention to maintain the credibility of
the scheme to reach both short term and long term goals of greenhouse gas
emission reductions.
25
References
California Air Resources Board, 2013, California Cap on Greenhouse Gas Emission and Market-
Based Compliance Mechanisms, Subchapter 10 Climate Change, Article 5, Sections 95800 to
96023, Title 17, California Code of Regulations, April 2013
CITL, 2013, Community Independent Transaction Log (until 2012) then European Union
Transaction Log (EUTL), accessible at http://ec.europa.eu/environment/ets/
De Perthuis, C., and Trotignon, R., 2012, The European CO2 allowances market: issues in the
transition to Phase III, Cahiers de la Chaire Economie du Climat, Information and debates N°14,
Climate Economics Chair, March 2012
Ellerman, A. D., Convery, F. J. and De Perthuis, C., 2010, Pricing Carbon: The European Union
Emissions Trading Scheme, Cambridge University Press, January 2010
European Commission, 2011, Communication from the Commission to the European
Parliament, the Council, the European Economic and Social Committee and the Committee of the
Regions, A Roadmap for moving to a competitive low carbon economy in 2050, COM(2011) 112
final
European Commission, 2012a, Proposal for a decision of the European Parliament and of the
Council amending Directive 2003/87/EC clarifying provisions on the timing of auctions of
greenhouse gas allowances, COM(2012) 416 final, 2012/0202 (COD)
26
European Commission, 2012b, Report from the Commission to the European Parliament and the
Council, The state of the European carbon market in 2012, COM(2012) 652 final
European Commission, 2013, Green paper: A 2030 framework for climate and energy policies,
COM(2013) 169 final, March 2013
European Council, 2007, Presidency conclusions of Brussels European Council 8/9 March 2007,
7224/1/07 REV 1, CONCL 1, May 2nd 2007
European Parliament and the Council of the EU, 2003, Directive 2003/87/EC of the European
Parliament and of the Council of 13 October 2003 establishing a scheme for greenhouse gas
emission allowance trading within the Community and amending Council Directive 96/61/EC
European Parliament and the Council of the EU, 2009, Directive 2009/29/EC of the European
Parliament and of the Council of 23 April 2009 amending Directive 2003/87/EC establishing a
scheme for greenhouse gas emission allowance trading within the Community, Official Journal
of the European Union I.140, 63–87
Goulder, L. H., 2013, Markets for Tradable Pollution Allowances: What are the (New) Lessons ?,
Journal of Economic Perspectives, Volume 27, Number 1, Winter 2013, Pages 87–102
Hedegaard, C., 2010, Statement by Connie Hedegaard, European Commissioner for Climate
Action, on the Commission’s Proposal for Quality Restrictions on the Use of Credits from
Industrial Gas Projects, MEMO/10/614, Press Release, Europa, Brussels, 25 November 2010.

27
RGGI, 2013, RGGI 2012 Program Review: Summary of Recommendations to Accompany Model
Rule Amendments, Regional Greenhouse Gas Initiative, Program Design Material, 2013
Schmalensee, R. and Stavins, R. N., 2013, The SO2 Allowance Trading System: The Ironic History
of a Grand Policy Experiment, Journal of Economic Perspectives—Volume 27, Number 1—
Winter 2013—Pages 103–122
Trotignon, R., 2012a, Combining cap-and-trade with offsets: lessons from the EU-ETS, Climate
Policy, 12(3): 273-287
Trotignon, R., 2012b, In Search of the Carbon Price. The European CO2 Emission Trading
Scheme: From ex ante and ex post analysis to the projection in 2020, PhD Thesis of Raphael
Trotignon, under the supervision of Christian de Perthuis, Paris-Dauphine University, October
2012
United Kingdom’s HM Revenue and Customs, 2013, Carbon price floor: rates from 2015-16,
exemption for Northern Ireland and technical changes, April 2013
Weight, H., Delarue, E. and Ellerman, A. D., 2012, CO2 Abatement from Renewable Energy
Injections in the German Electricity Sector: Does a CO2 Price Help?, MIT CEEPR Working Paper
WP 2012-003, April 2012
Whitesell, W. C., 2012, Climate Policy Foundations: Science and Economics with Lessons from
Monetary Regulation, Cambridge University Press, 2012

Les Cahiers de la Chaire Economie du Climat
n° 2013-07
Working Paper Series
Contact us :
Chaire Economie du Climat - Palais Brongniart (4e étage)
28 Place de la Bourse, 75 002 Paris
Tel : +33 (0)1 73 01 93 31
Email : [email protected]
La Chaire Economie du Climat est une initiative de CDC Climat et de l’Université Paris-Dauphine
sous l’égide de la Fondation Institut Europlace de Finance
Working Papers Publication Director: Pierre-André Jouvet
Les opinions exposées ici n’engagent que les auteurs. Ceux-ci assument la responsabilité de
toute erreur ou omission
n° 2012-10 Longevity, pollution and growth
By Natacha Raffin and Thomas Seegmuller
n° 2013-01 Can Uncertainty Justify Overlapping Policy Instruments to Mitigate
Emissions?
By Oskar Lecuyer and Philippe Quirion
n° 2013-02 Free allocations in EU ETS Phase 3: The impact of emissions-performance
benchmarking for carbon-intensive industry
By Stephen Lecourt, Clément Pallière and Oliver Sartor
n° 2013-03 An empirical analysis of the cumulative nature of deforestation
By Julien Wolfersberger, Serge Garcia and Philippe Delacote
n° 2013-04 Modeling of Emission Allowance Markets: A Literature Review
By Vincent Bertrand
n° 2013-05 EU ETS Phase 3 benchmarks: Implications and potential flaws
By Stephen Lecourt
n° 2013-06 Switching to biomass co-firing in European coal power plants: Estimating
the biomass and CO2 breakeven prices
By Vincent Bertrand
n° 2013-07 Governance of CO2 markets: Lessons from the EU ETS
By Christian de Perthuis and Raphael Trotignon