working paper the anti-poverty, targeting, and labor
TRANSCRIPT

5757 S. University Ave.
Chicago, IL 60637
Main: 773.702.5599
bfi.uchicago.edu
WORKING PAPER · NO. 2021-115
The Anti-Poverty, Targeting, and Labor Supply Effects of the Proposed Child Tax Credit ExpansionKevin Corinth, Bruce D. Meyer, Matthew Stadnicki, and Derek WuOCTOBER 2021

The Anti-Poverty, Targeting, and Labor Supply Effects of the Proposed Child Tax Credit Expansion
Kevin Corinth University of Chicago
Bruce D. Meyer University of Chicago, NBER, and AEI
Matthew Stadnicki
University of Chicago Derek Wu
University of Chicago October 4, 2021
Abstract The proposed change under the American Families Plan (AFP) to the Tax Cuts and Jobs Act (TCJA) Child Tax Credit (CTC) would increase maximum benefit amounts to $3,000 or $3,600 per child (up from $2,000 per child) and make the full credit available to all low and middle-income families regardless of earnings or income. We estimate the anti-poverty, targeting, and labor supply effects of the expansion by linking survey data with administrative tax and government program data which form part of the Comprehensive Income Dataset (CID). Initially ignoring any behavioral responses, we estimate that the expansion of the CTC would reduce child poverty by 34% and deep child poverty by 39%. The expansion of the CTC would have a larger anti-poverty effect on children than any existing government program, though at a higher cost per individual raised above the poverty line than other programs. Relatedly, the CTC expansion would allocate a smaller share of its total dollars to families at the bottom of the income distribution—as well as families with the lowest levels of long-term income, education, or health—than any existing means-tested program with the exception of housing assistance. We then simulate anti-poverty effects accounting for labor supply responses. By replacing the TCJA CTC (which contained substantial work incentives akin to the EITC) with a Universal Basic Income-type benefit, the CTC expansion reduces the return to working at all by $2,000 per child for the typical worker with children. Relying on elasticity estimates consistent with mainstream simulation models and the academic literature, we estimate that this change in policy would lead 1.5 million workers (constituting 2.6% of all working parents) to exit the labor force. The decline in employment with its resulting lost earnings would mean that child poverty would only fall by 22% and deep child poverty would not fall at all with the CTC expansion.
Keywords: Child Tax Credit; Poverty; Administrative data; Survey misreporting; Simulation; Employment
* Authors can be contacted at the following email addresses: Kevin Corinth ([email protected]); Bruce Meyer ([email protected]); Matthew Stadnicki ([email protected]); Derek Wu ([email protected]). This paper, which has been subject to a limited Census Bureau review, is released to inform interested parties of research and to encourage discussion. Any opinions and conclusions expressed herein are those of the author(s) and do not represent the views of the U.S. Census Bureau. The Census Bureau has reviewed this data product for unauthorized disclosure of confidential information and has approved the disclosure avoidance practices applied to this release, authorization numbers: CBDRB-FY2021-CES005-024 and CBDRB-FY2021-CES005-028. We thank many employees of the U.S. Census Bureau for their assistance; Pablo Celhay, Jeffrey Grogger, Elaine Maag, Nikolas Mittag, James Sullivan, and Scott Winship for helpful discussions and comments; and Gillian Meyer, Connor Murphy, and Angela Wyse for excellent research assistance. We appreciate the financial support of the Alfred P. Sloan Foundation, the Russell Sage Foundation, the Charles Koch Foundation, the Menard Family Foundation, and the American Enterprise Institute.

1
1. Introduction Policymakers require accurate evidence on the effects of potential policies to make
informed decisions. The recent proposal under the American Families Plan (AFP) to make
permanent the temporary expansion of the Child Tax Credit (CTC) in the United States presents a
particularly relevant case study. Proposed under the crisis conditions of the COVID-19 pandemic,
the changes would replace the Tax Cuts and Jobs Act (TCJA) CTC with a larger benefit that would
be available to all low and middle-income families regardless of earnings or income. In total,
families would receive an additional $101 billion in benefits, more than the U.S. spends on either
the Supplemental Nutrition Assistance Program (SNAP), rental housing assistance, or the Earned
Income Tax Credit (EITC). Despite the magnitude of the proposed changes, the research on the
CTC expansion pales compared to what preceded the welfare reforms of the 1990s. The research
notably relies solely on survey data with pronounced income underreporting, and it fails to
incorporate the large labor supply effects of the CTC expansion.
The importance of this proposed policy has led a number of researchers to simulate its anti-
poverty effects (Acs and Werner 2021; Brill, Pomerleau, and Seiter 2021; Collyer et al. 2021;
Congressional Research Service 2021; Marr et al. 2021). As well as relying solely on survey data,
these studies do not incorporate labor supply changes in response to changes in the CTC when
modelling impacts on income and poverty. The National Academy of Sciences (NAS) (2019)
analyzes the employment and hours effects of a similar policy and is often cited as evidence that
the proposed CTC expansion would have minimal employment effects,1 but it omits the effects
on employment and poverty of eliminating the work incentives of the pre-existing CTC, basing its
calculations on an idealized situation without a pre-existing CTC.
Furthermore, relying on surveys alone to measure income may bias estimates of the anti-
poverty effects of proposed policies. Survey-reported values of income have been found to
understate true incomes both for market income sources (e.g., Bee and Mitchell 2017) and
government benefits (e.g., Meyer and Mittag 2019). This error can lead survey data to not only
1 One report notes: “An expert panel convened by the National Academy of Sciences projected that under a child credit policy similar to the expanded Child Tax Credit, 99.5 percent of working parents would continue to work, and few would substantially reduce their hours” (Sherman, Marr, and Hingten 2021). Some previous studies simulating the anti-poverty effects of the CTC expansion cite the NAS report as a justification for not incorporating labor supply effects (e.g., Acs and Werner 2021; Collyer et al. 2021). A letter from 462 economists submitted to Congressional leaders on September 15, 2021 argues the CTC expansion would lead to minimal work reduction based on the NAS report, stating: “Indeed, the panel of experts who reviewed this issue for the National Academy of Sciences concluded that a universal child allowance would have a negligible effect on employment.”

2
overstate the level of poverty but also understate the anti-poverty effects of existing government
programs (Meyer and Wu 2018; Shantz and Fox 2018; Meyer, Wu, et al. 2021). To address the
misreporting of income and other information in surveys, the Comprehensive Income Dataset
(CID) links major household surveys with an unprecedented set of tax records and administrative
government program data sources. In this paper, we use the CID for the first time to simulate the
effects of a proposed policy. The CID improves on existing efforts to simulate proposed policies
by providing a more accurate distribution of baseline incomes, allowing for a more accurate
modeling of the proposed CTC expansion, and for more accurate comparisons of the CTC
expansion with existing programs.
We first analyze the static poverty reduction effects of expanding the CTC, referring to the
CTC change as the “incremental” CTC. To enable a consistent comparison between the CID-based
results and estimates relying on survey data alone, we set our poverty thresholds such that 13.7%
of children are in poverty in our baseline. The 13.7th percentile of child income—and thus the
poverty threshold—using the CID is $37,890 for a family of four. This amount is 14% higher than
the 13.7th percentile of child income using the same income definition but relying on underreported
income responses in the survey data, and 40% higher than the official poverty threshold updated
for 2022. This 13.7% baseline child poverty rate is similar to that used for previous simulations of
the CTC expansion and was the child poverty rate according to the Supplemental Poverty Measure
in 2018. From this baseline, we find that—absent behavioral responses—child poverty would fall
by 34% and deep child poverty would fall by 39%.
We next compare the anti-poverty effects of the proposed changes to the CTC with those
of existing government programs, again before accounting for labor supply changes. To put the
programs on an equal footing, we take as our baseline a setting in which the AFP CTC is in place,
and then simulate how much poverty would increase if a given program were eliminated. In other
words, these results indicate how much poverty is avoided as a result of each program. The
incremental CTC, if made permanent, would keep 5.8 million people (including 3.4 million
children) out of poverty and become the most important program for preventing child poverty.
Reverting back to the TCJA CTC would increase child poverty by 51%. Eliminating the EITC, the
program with the second highest effect, would increase child poverty by 42%.
Despite its large anti-poverty effects, the incremental CTC is less targeted to the bottom
part of the income distribution than other means-tested programs. A lower share of incremental
CTC dollars would be received by families in the bottom 10% or 50% of annual income than all

3
other major means-tested programs (with the exception of rental housing assistance for the bottom
10%). In line with these results, the incremental CTC keeps fewer children out of poverty—per
dollar spent on families with children—than other major means-tested programs. The EITC in
particular provides a larger share of benefits to families in the bottom decile of annual income
(20%) than the incremental CTC (15%). The incremental CTC is also less targeted than other
means-tested programs to families with low long-run market income, low educational attainment,
and poor health. Yet, the incremental CTC is more targeted than the TCJA CTC to families with
low incomes and low levels of well-being.
While the static results are useful as a baseline, it is important to account for any resulting
changes in employment. The TCJA CTC yields strong work incentives because the credit is
generally available only to parents who work. Eliminating the TCJA CTC would therefore reduce
employment participation by decreasing the return to work. Replacing the TCJA CTC with a child
allowance (akin to a universal basic income-type benefit for children) would further reduce
employment through an income effect. We simulate the employment effects of the CTC expansion
relying on elasticity estimates used by the NAS, Congressional Budget Office and the academic
literature. We estimate that the decreased return to work would lead 1.32 million working parents
to exit the labor force, while the income effect would reduce employment by a further 0.14 million,
for a total employment loss of 1.46 million workers (constituting 2.6% of all working parents).
Our estimate of employment loss due to the CTC expansion differs markedly from the
corresponding estimate in a 2019 NAS report, which concludes that replacing the CTC with a child
allowance similar to the proposed AFP CTC would reduce employment by 0.15 million workers
(National Academy of Sciences 2019). NAS (2019) obtains a much smaller employment reduction
because it does not account for the decrease in the return to work, despite accounting for such an
effect when analyzing reforms to the EITC.
Labor force exits due to the CTC expansion would have important implications for its anti-
poverty effect. Allowing for behavioral responses, we estimate that the effect of the CTC
expansion on child poverty would fall from 34% based on our static simulation to 22% based on
our dynamic simulation. Moreover, we estimate that the CTC expansion would have no effect on
deep child poverty after allowing for labor supply responses, in stark contrast to the 39% reduction
in deep poverty based on our static simulation. However, we do not model the effects of the CTC
expansion on long-term outcomes such as health, education, incarceration, and single parenthood.

4
Finally, we compare static results obtained using our CID-based simulation (which links
surveys with administrative data) to results obtained using only survey data. This comparison
demonstrates the important role of linked data in facilitating a wide-ranging analysis of the effects
of the proposed CTC expansion. As noted earlier, the correction for underreporting of income in
the survey leads us to set poverty thresholds 14% higher using the CID in order to hold constant
the share of children in poverty. Despite doing so, we estimate a low baseline level of deep child
poverty (2.3%) that is a direct result of improvements in the measurement of income leading to
considerably fewer children in the left tail of the income distribution. Additionally, in contrast to
the static survey-only results, the static CID-based results find smaller differences between the
incremental CTC and existing programs in preventing poverty, and greater targeting of existing
tax credits to families at the bottom of the income distribution. These improvements reflect the
ability of the CID to more accurately measure all sources of income, including tax credits. We also
compare our static results to those of prior simulations of the AFP CTC, which have found larger
anti-poverty effects between 35% and 46% (compared to the 33% effect we find). Our estimate is
lower because we account for incomplete take-up of the AFP CTC by non-tax filers, and because
we update incomes to a 2022 baseline.
By using the CID to simulate proposed policies, our paper builds on a growing body of
research using the CID to improve our understanding of economic well-being in the United States.
Other research using the CID has focused on using linked administrative data to address errors in
surveys (Medalia et al. 2019; Celhay, Meyer, and Mittag 2021; Meyer et al. 2020; Meyer and
Mittag 2021), measuring extreme poverty (Meyer, Wu, et al. 2021), analyzing the effect of existing
programs on economic well-being (Meyer and Wu 2018; Meyer and Mittag 2019), and improving
our understanding of the homeless population (Meyer, Wyse, et al. 2021). This is the first paper to
use the CID to more accurately simulate the effects of proposed policies.
The rest of this paper proceeds as follows: Section 2 describes the proposed CTC
expansion. Section 3 describes the data sources. Section 4 describes the methodology for
simulating income under the TCJA CTC and AFP CTC. Section 5 reports the static results, Section
6 reports the dynamic results accounting for changes in labor supply, and Section 7 discusses their
implications. Section 8 concludes.

5
2. The Proposed Child Tax Credit Expansion This section describes the TCJA CTC, the AFP CTC, and how work incentives would
change as a result of the expansion. The TCJA CTC is a tax credit for families with children,
providing $117 billion in benefits in 2018. Unlike the EITC, the full amount of the TCJA CTC is
only available as a non-refundable credit and so families must have a sufficient amount of taxable
income to receive it. Lower-income families can receive a smaller refundable portion of the credit,
but—like the EITC—this refundable portion phases in with earned income, leaving families with
no earned income ineligible for any benefits. In contrast, most means-tested benefits—including
SNAP, rental housing assistance, and Supplemental Security Income (SSI)—provide maximum
benefits to families with no income and phase out as incomes increase. The AFP CTC would
similarly provide the maximum benefit to low-income families, but it would not phase out until
incomes reach much higher levels. We describe the TCJA CTC and AFP CTC in more detail
below, followed by a discussion of their differing work incentives.
Tax Cuts and Jobs Act CTC
The TCJA CTC offers tax filers a credit of up to $2,000 per dependent child under 17, with
up to $1,400 being refundable. The refundable portion of the CTC (called the Additional CTC or
ACTC) does not require tax filers to have any federal income tax liability. It begins phasing in at
$2,500 of earned income, at a rate of $0.15 per dollar of earned income.2 A maximum of $1,400
per dependent child can be claimed as a refundable credit, and the remaining portion of the
maximum $2,000 credit must be claimed as a non-refundable credit that offsets federal income tax
liability. In Figure 1, the solid line shows the credit amount as a function of earnings for a family
headed by a single parent with two children. The CTC phases out at a 5% rate beginning at
$200,000 of taxable income for single filers and $400,000 for married filers. An additional $500
credit (called the Credit for Other Dependents or ODC) can be claimed on behalf of dependents
17 and over who are not eligible for the $2,000 credit. The ODC is non-refundable and phases out
at the same rate as the non-refundable CTC for dependents under 17.
The TCJA CTC itself represents an expansion relative to the CTC prior to the passage of
TCJA in 2017. Prior to TCJA, the CTC was capped at $1,000 per child (with a lower refundable
2 For example, a tax filer with one dependent child, no tax liability and $3,500 of earned income would receive a refundable credit of $150 (15% of the difference between $3,500 and $2,500).

6
portion). The TCJA version of the CTC is set to expire after 2025, at which time this older version
of the CTC would again take effect absent legislative action.
American Families Plan CTC
On March 11, 2021, President Biden signed the American Rescue Plan Act into law.
Among other provisions, the law temporarily expanded the CTC for 2021 only. In April 2021, the
Biden Administration proposed extending this expanded version of the CTC through 2025 as part
of the AFP.3 The AFP CTC would increase the maximum per-child credit from $2,000 for all
children under 17 to $3,600 for children aged 0 to 5 and $3,000 for children aged 6 to 17. It would
also make the CTC fully refundable, meaning families with little or no tax liability would qualify
for the entire amount. Notably, children aged 17 would qualify for the full $3,000 under the AFP
CTC, whereas they are only eligible for the ODC (up to $500) under TCJA. In Figure 1, the dashed
line shows the credit amount as a function of earnings (it is constant) for a family headed by a
single parent with two children. The higher maximum payment would begin to phase out starting
at $75,000 for single filers, $112,500 for head of household filers, and $150,000 for married filers.
The $2,000 credit would still be available to higher income tax filers eligible under TCJA. See
Appendix Table A1 for the full set of parameters under the TCJA CTC and AFP CTC.
In addition to changing benefit amounts, the CTC expansion would be administered
differently (assuming it follows the rules for the CTC implemented under the American Rescue
Plan Act). Families would receive CTC payments on a monthly basis (as they currently do for
most means-tested programs), and they could update eligibility information (e.g., the birth of a
new child) throughout the year.
Changes in Work Incentives Due to the CTC Expansion
By making the CTC fully refundable, the expansion under the AFP would eliminate the
work incentives of the pre-existing TCJA credit. We focus on the return to work—what is relevant
for the work participation decision—because the literature on labor supply for low-income
families, particularly single mothers, has focused on the work/non-work decision and found it to
3 The American Families Plan would additionally expand early childhood education, offer free tuition at community colleges, expand Pell grants, expand the EITC for childless workers, and expand the Child and Dependent Care Tax Credit (CDCTC) among other provisions. We focus only on the AFP CTC in this paper because 1) on its own it would represent a transformational change for the U.S. safety net and 2) the other provisions of the American Families Plan cannot be modeled as precisely.
7
be highly responsive to tax incentives. The return to work is equal to earnings net of taxes and
reduced transfer benefits when an individual moves from not working to working. The return to
work would be lower under the AFP because families with no earnings would receive the full CTC
benefit, whereas under TCJA such families would receive no CTC benefit.
To be precise, the change in the return to work due to the CTC reform can be written as the
return to work under the AFP minus the return to work under TCJA, where the return to work
under a given policy is equal to income given current earnings 𝐸𝐸∗ (or more generally the earnings
an individual would receive if she chose to work) minus income with zero earnings:
𝐶𝐶ℎ𝑎𝑎𝑎𝑎𝑎𝑎𝑎𝑎 𝑖𝑖𝑎𝑎 𝑅𝑅𝑎𝑎𝑡𝑡𝑡𝑡𝑡𝑡𝑎𝑎 𝑡𝑡𝑡𝑡 𝑊𝑊𝑡𝑡𝑡𝑡𝑜𝑜
= [𝐼𝐼𝑎𝑎𝐼𝐼𝑡𝑡𝐼𝐼𝑎𝑎𝐴𝐴𝐴𝐴𝐴𝐴(𝐸𝐸∗) − 𝐼𝐼𝑎𝑎𝐼𝐼𝑡𝑡𝐼𝐼𝑎𝑎𝐴𝐴𝐴𝐴𝐴𝐴(0)]�����������������������𝑅𝑅𝑅𝑅𝑅𝑅𝑅𝑅𝑅𝑅𝑅𝑅 𝑅𝑅𝑡𝑡 𝑤𝑤𝑡𝑡𝑅𝑅𝑤𝑤 𝑅𝑅𝑅𝑅𝑢𝑢𝑅𝑅𝑅𝑅 𝐴𝐴𝐴𝐴𝐴𝐴
− [𝐼𝐼𝑎𝑎𝐼𝐼𝑡𝑡𝐼𝐼𝑎𝑎𝑇𝑇𝑇𝑇𝑇𝑇𝐴𝐴(𝐸𝐸∗)− 𝐼𝐼𝑎𝑎𝐼𝐼𝑡𝑡𝐼𝐼𝑎𝑎𝑇𝑇𝑇𝑇𝑇𝑇𝐴𝐴(0)]�������������������������𝑅𝑅𝑅𝑅𝑅𝑅𝑅𝑅𝑅𝑅𝑅𝑅 𝑅𝑅𝑡𝑡 𝑤𝑤𝑡𝑡𝑅𝑅𝑤𝑤 𝑅𝑅𝑅𝑅𝑢𝑢𝑅𝑅𝑅𝑅 𝑇𝑇𝑇𝑇𝑇𝑇𝐴𝐴
Since the CTC reform does not affect tax liability or transfer benefits,4 all non-CTC components
of the return to work are the same under the AFP and TCJA and thus drop out of the expression
above. We can therefore rewrite the expression as:
𝐶𝐶ℎ𝑎𝑎𝑎𝑎𝑎𝑎𝑎𝑎 𝑖𝑖𝑎𝑎 𝑅𝑅𝑎𝑎𝑡𝑡𝑡𝑡𝑡𝑡𝑎𝑎 𝑡𝑡𝑡𝑡 𝑊𝑊𝑡𝑡𝑡𝑡𝑜𝑜 = [𝐶𝐶𝐶𝐶𝐶𝐶𝐴𝐴𝐴𝐴𝐴𝐴(𝐸𝐸∗)− 𝐶𝐶𝐶𝐶𝐶𝐶𝐴𝐴𝐴𝐴𝐴𝐴(0)] − �𝐶𝐶𝐶𝐶𝐶𝐶𝑇𝑇𝑇𝑇𝑇𝑇𝐴𝐴(𝐸𝐸∗) − 𝐶𝐶𝐶𝐶𝐶𝐶𝑇𝑇𝑇𝑇𝑇𝑇𝐴𝐴(0)�
For most individuals, the CTC under the AFP does not depend on earnings and so 𝐶𝐶𝐶𝐶𝐶𝐶𝐴𝐴𝐴𝐴𝐴𝐴(𝐸𝐸∗) =
𝐶𝐶𝐶𝐶𝐶𝐶𝐴𝐴𝐴𝐴𝐴𝐴(0). Also, 𝐶𝐶𝐶𝐶𝐶𝐶𝑇𝑇𝑇𝑇𝑇𝑇𝐴𝐴(0) can be assumed in most cases to be zero, because one needs positive
earnings (or positive tax liability from unearned income) to receive the TCJA CTC. Thus, the
decrease in the return to work for most working parents is simply the amount of the TCJA CTC
given current earnings, 𝐶𝐶𝐶𝐶𝐶𝐶𝑇𝑇𝑇𝑇𝑇𝑇𝐴𝐴(𝐸𝐸∗).
Figure 2 illustrates the TCJA CTC benefit schedule—equaling the decrease in the return
work due to the CTC expansion—for a single parent with two children under age 17. Her return
to work falls by $2,000 if she currently earns $16,000. Her return to work falls by $4,000 if she
currently earns $31,000. For comparison, Figure 2 also shows how another tax credit, the EITC,
affects the return to work for the same family type. The EITC is widely recognized to encourage
4 Because the non-refundable portion of the TCJA CTC is applied after the Child and Dependent Care Tax Credit (CDCTC) and Credit for Other Dependents (ODC), the fully refundable AFP CTC would not enable the individual to claim an additional amount of these non-refundable credits. The AFP CTC does not affect benefit determinations for transfer benefits.

8
work and to do so by increasing the share of single parents who work at least some hours in a year
(Hotz and Scholz 2003; Nichols and Rothstein 2016). Beyond a low earnings level, the subsidy to
work under the TCJA CTC that would be lost with the reform is a substantial share of the EITC
subsidy, finally exceeding the EITC subsidy at just under $30,000 of earnings. The TCJA CTC
subsidy to work remains flat at $4,000 as income rises, while the EITC subsidy falls, reaching zero
at $47,440. Others have noted the common feature of the EITC and CTC in encouraging work
among parents (e.g., Holt and Maag 2009; Greenstein 2015; Hoynes and Rothstein 2016; Moffitt
2016).
As shown in Appendix Figure A1, the decrease in the return to work is higher for
individuals on the phase-out portion of the AFP CTC such that 𝐶𝐶𝐶𝐶𝐶𝐶𝐴𝐴𝐴𝐴𝐴𝐴(𝐸𝐸∗) < 𝐶𝐶𝐶𝐶𝐶𝐶𝐴𝐴𝐴𝐴𝐴𝐴(0). In the
case of a single parent with two children, the incremental CTC amount under the AFP phases out
at earnings levels between $112,500 and $164,500, at which point AFP CTC reverts to the TCJA
CTC amount. At this point, 𝐶𝐶𝐶𝐶𝐶𝐶𝐴𝐴𝐴𝐴𝐴𝐴(𝐸𝐸∗) = 𝐶𝐶𝐶𝐶𝐶𝐶𝑇𝑇𝑇𝑇𝑇𝑇𝐴𝐴(𝐸𝐸∗), and so the change in the return to work
is the full AFP CTC benefit when not working, i.e., 𝐶𝐶𝐶𝐶𝐶𝐶𝐴𝐴𝐴𝐴𝐴𝐴(0). This amount is equal to $6,600
for a single parent with two children aged 5 and 10.
To see the change in work incentives for the entire distribution of working parents in the
United States with annual earnings up to $100,000, Figure 3 (solid line, top panel) shows the
average percent change in the return to work due to the CTC expansion for working parents with
different levels of earnings.5 For example, the CTC expansion would decrease the return to work
by 10% for workers with earnings between $30,000 and $40,000. For comparison, Figure 3
(dashed line, top panel) shows the percent change in the return to work due to hypothetically
eliminating the EITC, which is the actual EITC benefit received by the worker divided by the
return to work under TCJA. For example, eliminating the EITC would decrease the return to work
by 8% for workers with earnings between $30,000 and $40,000. We also show, in the lower panel,
the total number of workers with children in tax units in the different earnings ranges.
While eliminating the EITC would create stronger work disincentives for working parents
with the lowest earnings, work disincentives from the CTC expansion would nonetheless be
important for low earners. The work incentives of the TCJA CTC are 40% percent of EITC work
5 For each working parent, we calculate the percent change in the return to work as the change in the return to work due to the CTC expansion divided by the return to work under TCJA. We then calculate the mean percent change in the return to work over all working parents in each earnings bin. Here we are averaging over families of different sizes and with different ages of children, and we are accounting for other government benefits (namely SNAP) that individuals receive.

9
incentives for those with earnings between $10,000 and $20,000 (representing 9% of all working
parents), and 65% of EITC incentives for those between $20,000 and $30,000 in earnings
(representing another 9% of all working parents). For working parents with earnings above
$30,000, the CTC expansion’s work disincentives would be greater than those due to eliminating
the EITC. For those with earnings between $30,000 and $40,000 (representing 9% of all working
parents) and those between $40,000 and $50,000 (representing 7% of all working parents) the CTC
incentives are 30% and 203% higher than the EITC incentives, respectively. Among the 39% of
working parents with earnings below $50,000, the CTC incentives are 62% of the EITC incentives,
and among the 66% of working parents with earnings below $100,000, the CTC incentives are
88% of the EITC incentives. In sum, if one believes that eliminating the EITC would substantially
reduce employment by reducing the return to work, then the CTC expansion should substantially
reduce employment for the same reason.
3. Data We start with the 2017 Current Population Survey Annual Social and Economic
Supplement (CPS ASEC), which we rely on for our survey-only analyses. Fielded between
February and April 2017, the 2017 CPS ASEC asks respondents about incomes received during
calendar year 2016. We do not use a more recent version of the CPS ASEC due to the wider
availability of administrative data sources for calendar year 2016. The CPS ASEC contains a wide
variety of questions on income sources and amounts, and it includes an extensive set of
demographic information on respondents. The Census Bureau uses the CPS ASEC to produce its
annual official poverty measure, supplemental poverty measure, and historical median income
series (Fox and Burns 2021; Shrider et al. 2021). Other simulations of the AFP CTC have also
relied on the CPS ASEC.
For the CID-based simulation, we link the 2017 CPS ASEC to a large set of administrative
data sources at the individual level. The linked data improve the accuracy of measures of earnings,
pension income, Social Security benefits, cash welfare, food assistance, housing assistance, and
taxes. At the same time, the CID retains the strengths of the CPS ASEC, including the ability to
observe detailed demographic characteristics, the family structure of individuals, and incomes not
fully captured by administrative sources.
Administrative data on earnings come from individually linked Internal Revenue Service
(IRS) Forms 1040s and W-2s, as well as the Social Security Administration’s Detailed Earnings

10
Record (DER). Given the incompleteness of the administrative records in capturing all earnings
sources such as off-the-books work, we take the higher of earnings amounts in the DER, W-2s,
and 1040s and continue to use survey earnings that exceed combined administrative earnings if
they reflect earnings that are plausibly missed in the tax records.6 We also obtain more accurate
values of asset income and retirement income from IRS Forms 1040s and 1099-Rs, which we use
to directly replace survey values. Furthermore, we are able to use values of Adjusted Gross Income
(AGI) from IRS Forms 1040 to provide a lower bound for other sources of money income such as
Unemployment Insurance, child support, and alimony.
Because we observe tax units, claimed dependents, and AGI—among other relevant tax
inputs—we can accurately impute federal and state income tax liabilities and payroll tax liability.
The linked tax data help to correct for large survey errors in tax liabilities and credits (Jones and
Ziliak 2020; Meyer et al. 2020). Consistent with more accurately calculating taxes in our
simulation, our aggregate amount of TCJA CTC benefits using the CID matches aggregate benefits
reported by the Internal Revenue Service, after accounting for the small share of CTC-eligible
children not represented in the CPS ASEC. The CID further improves on survey-only simulations
by allowing for a more accurate modeling of the proposed CTC expansion, using actual tax unit
structure, tax filing status, taxable income, and birth dates of dependents (factors that affect both
eligibility and benefits levels of the AFP CTC).
We use NBER’s TAXSIM calculator to impute taxes using the precise inputs provided on
tax forms. Meyer et al. (2020) find that linking these administrative tax data to surveys
substantially improves the accuracy of tax liabilities and credits. We also link administrative data
covering various government program benefits. We link administrative data on Old Age,
Survivors, and Disability Insurance (OASDI) from the SSA’s Payment History Update System
(PHUS) and the Master Beneficiary Record (MBR), and Supplemental Security Income (SSI) from
SSA’s Supplemental Security Record (SSR).7 We link rental housing assistance benefits from the
U.S. Department of Housing and Urban Development’s (HUD) Public and Indian Housing
6 Specifically, we bring in survey earnings if they are not imputed, if employment characteristics (hours/weeks worked, industry of job, job occupation, and employer size) are not imputed, and if one of the following conditions holds: 1) earnings are missing across all tax records, 2) the number of survey-reported employers exceeds the number of employers in the tax records, 3) the survey respondent reports being self-employed, or 4) the survey respondent reports working for a small employer. Prior work has found that these situations constitute a minority of cases where survey earnings exceed administrative data earnings (Meyer, Wu, et al. 2021). 7 To expedite Census Bureau review, we do not include administrative values for service-connected disability payments to veterans from the U.S. Department of Veterans Affairs (as we have in other projects).

11
Information Center (PIC) and Tenant Rental Assistance Certification System (TRACS) data,
which cover all mainstream HUD programs—public housing, Housing Choice Vouchers, and
Project-based assistance.8 We also link SNAP data from a select subset of states for which we have
administrative data, which we use for a subset of the analyses.
We link these data sources using anonymized Protected Identification Keys (PIKs) created
by the Census Bureau’s Person Identification Validation System (PVS; Wagner and Layne 2014).
The PVS maps individuals to PIKs based on Social Security numbers, names, addresses, and dates
of birth. Over 99% of administrative records are associated with a PIK, while a lower share of
records in 2017 CPS ASEC are associated with a PIK.9 This allows us to merge in administrative
data for the vast majority of the CPS ASEC sample. We drop from the sample any family in which
no member has an associated PIK as well as whole-imputed families. We then use inverse
probability weighting to scale up the weights of the remaining individuals in the sample who are
similar in terms of observable characteristics to dropped individuals.10
4. Methodology We describe our methodology in two parts. First, we describe how we construct baseline
income. Second, we describe how we calculate the TCJA CTC (which is a component of baseline
income) and the AFP CTC.
Constructing Baseline Income
For the survey-only version of baseline income, we use a post-tax, post-transfer income
measure that includes non-medical in-kind transfers—namely, rental housing assistance, SNAP,
school lunch, WIC, and energy assistance (all imputed by the Census Bureau). We subtract federal
and state income tax liabilities net of tax credits and payroll taxes imputed using TAXSIM based
8 Since our HUD administrative data do not cover all forms of rental housing assistance—omitting U.S. Department of Agriculture (USDA) programs, the Low Income Housing Tax Credit (LIHTC), and state and local programs—we treat survey respondents reporting housing assistance receipt who not appear in the HUD data as true recipients (and impute amounts based on average benefit amounts by household size, zip code, and year bins from the HUD data). 9 In the years for which PIK rates have been made publicly available, more than 90 percent of CPS ASEC families and households are PIKed (Meyer and Mittag 2019; Meyer, Wu, et al. 2021; Meyer and Mittag 2021). 10 In the end, our analysis sample (covering individuals in PIKed and non-whole imputed families) contains 77.3% of all individuals in the original CPS sample.

12
on tax rules under the Tax Cuts and Jobs Act (TCJA) that did not take effect until 2018.11 Like
other simulations, we assign refundable tax credits including the TCJA CTC based on the tax year
for which credits are accrued, rather than the following year when the credits are mostly received.
The CID-based version of baseline income uses the same post-tax, post-transfer definition of
income, but it also incorporates administrative data whenever available. For income sources for
which we do not have administrative data—including Public Assistance (largely Temporary
Assistance for Needy Families (TANF) or General Assistance), school lunch, WIC, and energy
assistance—we continue to use the survey values.
The sharing unit for both the survey-only and CID versions of baseline income is the
Supplemental Poverty Measure (SPM) family unit.12 We equivalize incomes using the NAS (1995)
equivalence scale of the form (A + PK)F, where A and K respectively designate the number of
adults and children in the family, P is child consumption as a share of adult consumption, and F
reflects economies of scale.13 Because we are interested in the effects of the AFP CTC in 2022 (the
first year of its proposed enactment), we use 2016 incomes as a starting point to project 2022
incomes. To do so, we increase market income by the C-CPI-U (the same index used to update
thresholds for tax brackets under TCJA) and we increase OASDI and SSI amounts by the CPI-W
(the same index used by rule to update benefit amounts). For most other means-tested benefits, we
increase amounts based on changes in scheduled maximum benefits.14 See Appendix Table A2 for
how each specific benefit amount is updated to 2022. We note that the total population, child
population, and number of workers will be different in 2022 than in 2016. If annual growth rates
from 2016 to 2020 hold for 2021 and 2022, the total population will be 2.7% higher in 2022 than
in 2016 and the child population will be 2.6% lower. The employment to population ratio may be
similar depending on the recovery from the COVID-19 induced recession. In January 2016, the
11 We subtract neither medical out-of-pocket expenses nor child care and work expenses from income (as the SPM does). Meyer and Sullivan (2012b) find that subtracting medical out-of-pocket expenses leads the SPM to identify a less deprived poor population. While deducting work expenses from resources is a reasonable goal, it is not clear that the imputed values in the CPS ASEC—which are used for the SPM—lead to a poverty measure that better identifies the most disadvantaged. 12 The SPM family unit includes related individuals, cohabitating unmarried couples, unrelated children under 15, and foster children under the age of 22. 13 Following Meyer and Sullivan (2012a), we set P = F = 0.7 to allow for diminishing marginal costs with each additional individual and a larger cost of adults relative to children. 14 Technically, benefits will not increase by the same rate as the change in maximum benefits for those receiving less than the maximum benefit. For example, the change in the SNAP benefit for a given family is equal to the change in the maximum benefit minus approximately 0.3 times the change in the family’s net income. We instead update by the percent change in maximum benefits for the sake of simplicity and so our multipliers can be shared without relying on the restricted-use microdata.

13
employment to population ratio was 59.7%, and by August 2021 it had recovered to 58.5% after
hitting a trough of 51.3% in April 2020.
Calculating Tax Cuts and Jobs Act CTC and American Families Plan CTC
In the survey-only version of baseline income, we use the TCJA CTC benefit calculated
by TAXSIM on the basis of survey information. We calculate the AFP CTC benefit outside of
TAXSIM on the basis of imputed tax unit information in the CPS ASEC, according to the
parameters set forth in the American Rescue Plan Act (described earlier). The CID has
advantageous features that allow us to more accurately impute both the TCJA CTC and AFP CTC.
One important advantage is that we can use the information on 1040s such as AGI, number of
claimed dependents, and other items to more accurately calculate credit amounts.
Another advantage of the CID is that it allows us to observe the identities of dependents
claimed on 1040s. This enables us to determine the amount of the TCJA CTC or AFP CTC claimed
on behalf of each child, even if the child does not live in the same family as the adult who claims
them. Previous studies relying only on survey rosters have necessarily assumed that tax units are
formed only by people within the family or household, neglecting the possibility of complex
families. We calculate that there are 6.1 million children in the 2017 CPS ASEC (8% of all children
in the survey) who are claimed on a 1040 by primary and secondary filers who do not appear in
the survey family of the child.15
Our approach to accounting for complex families is to assume all non-CTC taxes and tax
credits are paid or received by the adults in a sharing unit. Since they have legal control of the
money and in general make the actual payments and receive any refunds, this rule seems
appropriate. However, in the case of the CTC, we associate dollars with the children on whose
behalf the credits are claimed. An advantage of this approach is that the surveyed children are
those for whom we have the most detailed information from both survey and linked administrative
data, and they are appropriately weighted. A disadvantage is that all CTC benefits claimed on
behalf of children who appear outside of the survey frame (e.g., living abroad, in institutions, etc.)
would not be captured in our simulations. However, it is worth noting that existing research—
without the benefit of the CID—also misses those children and implicitly assumes that all
dependents in a survey can only be claimed by individuals in their family. We improve on existing
15 We also frequently observe surveyed adults who claim on their 1040s children outside of the survey family, though we do not observe survey weights for these children because they are not generally in the survey.

14
research by assigning the correct value of the CTC based on the 1040 on which dependents are
actually claimed (and whose primary/secondary filers may or may not appear in the survey). In
Appendix A, we describe our methodology for allocating CTC benefits to complex families—in
cases where surveyed adults claim children outside of the surveyed adult’s family, and in cases
where surveyed children are claimed by adults outside of the surveyed child’s family.16
A final issue for calculating AFP CTC amounts is that not all eligible families may take up
the credit. We assume all tax filers claim the AFP CTC because they automatically receive the
payments.17 Eligible non-filers do not automatically receive AFP CTC payments, but we may
expect a high rate of take-up. Benefit amounts are relatively high and eligibility rules are simple
and transparent. Receipt of the AFP CTC (based on the rules of the AFP CTC under the American
Rescue Plan Act) does not require filing taxes and requires no documentation.18 There is likely to
be little stigma from the CTC expansion because the vast majority of families in the U.S. receive
the benefit. Nonetheless, there may be significant information frictions that could diminish take-
up, especially in the early years of the AFP CTC, which have been found in other programs
(Daponte, Sanders, and Taylor 1999; Manoli and Turner 2014; Armour 2018).
We assume a baseline take-up rate among non-filers of 75%. This reflects the expectation
of high take-up of the AFP CTC in its second year of existence (following the temporary increase
in the CTC in 2021), but also that take-up may rise over time. We also show our total and child
poverty effects under other assumptions on the take-up rate, including 0%, 25%, 50%, and 100%.
For reference, take-up of the EITC is estimated to be 78% (Internal Revenue Service 2021c), and
take-up of SNAP is estimated to be near complete among families eligible for the full SNAP
benefit (Vigil 2019), which is similar in magnitude to the incremental CTC benefit for families
with little income. In addition, Acs and Werner (2021) assume a 78% take-up rate among non-
filers who also do not receive SSI or OASDI benefits. Other simulations of the CTC expansion
(Collyer, Wimer, and Harris 2019; Collyer et al. 2021; Congressional Research Service 2021; Marr
16 An alternative approach would be to add non-surveyed dependents listed on the tax returns of a surveyed adult to the surveyed adult’s sharing unit. This approach has some merit. However, we would bring in the CTC for children who are not in the survey, while dropping those in the survey who appear on the returns of someone outside the survey unit. This would effectively be building a new frame of children based on a hybrid of survey and tax information that would make our results hard to compare to survey-based estimates. Such a hybrid frame would require new ways of conceiving the sample and possible new weights that would rely on assumptions that are difficult to verify. 17 For the CID-based simulation, non-filers are those families to whom we (i) do not a link a 1040 and (ii) do not simulate a nonzero tax liability or have refundable tax credits of at least $500 (using survey information). 18 The signup form can be completed online and requires only minimal information—name, mailing address, email address, date of birth, and Social Security numbers for the adult and dependents (see Appendix Figure A2).

15
et al. 2021) assume 100% take-up among non-filers (see Appendix Table A3). Our incomplete
take-up assumption also accounts for the relatively small number of unauthorized immigrant
children in the CPS ASEC who are not eligible for the AFP CTC, and thus should not be assigned
AFP CTC benefits.19
5. Static Results In this section, we report a series of results on the static effects of the CTC expansion. We
start by reporting aggregate CTC recipients and dollars. We then report the effects of the AFP CTC
on poverty rates (as well as deep and near poverty rates) for the full population and child
population, providing a baseline for our dynamic simulation. Finally, we analyze how the anti-
poverty effect of the CTC expansion compares to those of existing programs, as well as its
targeting to different groups based on various well-being measures.
Aggregate CTC Recipients and Spending
Table 1 reports the number of recipients and aggregate benefit dollars for the TCJA CTC
and AFP CTC. While our simulation year is 2022, we first compare benefit dollars under the TCJA
CTC in 2018 based on the CID to the administrative total from the IRS Statistics of Income (SOI)
report. A comparison of our total CID-based benefit dollars with total SOI dollars provides a check
on the accuracy of our CID-based estimates. According to the SOI report, $117.7 billion of CTC
benefits were paid out for tax year 2018. We estimate that $110.2 billion of CTC benefits were
paid out to the CPS ASEC universe based on the CID, constituting 94% the SOI aggregate. This
difference is likely explained by our estimate that the CPS captures approximately 95% of all
children who can be claimed as a dependent on a 1040, with the deviation from 100% mostly
explained by children who are living abroad (and thus not in the CPS survey frame) or not
represented in the CPS ASEC population benchmark due to an undercount of the non-
institutionalized population.20
19 A Pew study estimates that there are 675,000 unauthorized immigrant children in the U.S. in the CPS ASEC (Passel and D’Vera 2018). Using the CID-based CPS ASEC, we find that there are 473,000 weighted children under age 18 who are (i) not linked to a Social Security number, (ii) Hispanic, (iii) not a citizen, and (iv) born outside of the United States who are covered by the survey. 20 See Appendix B for more information on the discrepancy between the number of children represented by the CPS ASEC and the number of children who can potentially be claimed as a dependent for purposes of the CTC—and the implications for our aggregate estimates of CTC spending.

16
The other panels of Table 1 update incomes for 2022 and report the number of recipients
and benefit dollars under the TCJA CTC, the AFP CTC, and their difference (the incremental
CTC). Based on the CID, we find that expanding the CTC increases the number of children living
in a family receiving at least some amount of CTC by 4.4 million. The expansion also increases
total benefits paid by $101.3 billion (from $111.8 billion under the TCJA CTC to $213.1 billion
under the AFP CTC). The increase in spending due to the CTC expansion is $3.0 billion higher
under the CID than under the survey-only simulation.
Static Poverty Reduction Effects of Expanding the CTC
We next estimate the poverty reduction effects of expanding the CTC without accounting
for behavioral effects. We set our poverty threshold such that 13.7% of the child population under
the TCJA CTC in 2022 is poor (i.e., we set the threshold equal to the 13.7th percentile of
equivalized income among children). We choose 13.7% because it is the baseline child poverty
rate used for simulations of the CTC expansion in several other studies, and because it was the
child poverty rate according the Supplemental Poverty Measure in 2018.21 The poverty threshold
for a family of four using the CID is $37,890, 14% higher than the $33,229 poverty threshold using
the survey data only in order to maintain the same 13.7% share of children in poverty at baseline
in both simulations. The higher threshold using the CID reflects underreporting of income in the
survey data. The static effect of the CTC expansion on poverty is equal to the percent of the poor
population whose income is raised above the poverty thresholds after incorporating the AFP CTC
in family income. We also consider effects on deep poverty (below 50% of the poverty threshold)
and near poverty (below 150% of the poverty threshold).
Table 2 reports poverty effects of expanding the CTC for both the full population and the
child population. Using the CID, the overall poverty rate falls from 10.8% to 9.0%, a 17%
reduction. Child poverty falls from 13.7% to 9.1%, a 34% reduction. Using the survey data only,
overall and child poverty fall by 16% and 34%, respectively. The similarity of the CID and survey-
only results are consistent with the similar increases in aggregate spending across the two
approaches seen in Table 1. Deep poverty—for which the CID-based threshold is $18,945—falls
21 We do not geographically adjust thresholds across areas, recognizing that high housing costs in some areas can reflect higher quality amenities such as higher quality schools, better transportation, and health care (Meyer, Wu, and Curran 2021).

17
by 39% among all children (Table 3). On the other hand, near poverty—for which the CID-based
threshold is $56,835—falls by 11% among all children (Table 3).
Despite raising poverty thresholds 40 percent above official thresholds when using the
CID, it is worth noting that the baseline level of deep child poverty remains strikingly low at 2.3%.
It is on this low baseline rate that we estimate a 39% reduction in deep child poverty as a result of
the CTC expansion. The low levels of deep poverty are a direct result of improvements in the
measurement of income, which include using administrative data to correct errors in survey reports
of income and broadening the resource measure to account for tax liabilities and credits as well as
non-medical in-kind transfers. These adjustments lead to considerably fewer children in the left
tail of the income distribution—echoing the findings in Meyer, Wu, et al. (2021), who find sharp
reductions in the prevalence of extreme poverty (defined as $2/person/day) after various
improvements to the measurement of income. Notably, the low level of deep child poverty persists
despite excluding administrative values for income sources such as SNAP and TANF, which are
targeted to families with children and heavily underreported in the survey.
We consider the robustness of our static poverty reduction estimates to alternative
assumptions of take-up of the AFP CTC among non-filers (Appendix Table A4). At one extreme,
the child poverty reduction grows from 34% to 36% after assuming that all non-filers take up the
AFP CTC. At the other extreme, child poverty would still fall by 30% even if no non-filers take
up the AFP CTC. Thus, while the poverty reduction effects vary based on the take-up assumption,
they are in a fairly tight range and the overall effects would be large regardless of the ultimate
take-up rate. Finally, because our survey-only results differ from those of several other studies
simulating the same CTC expansion (Acs and Werner 2021; Brill, Pomerleau, and Seiter 2021;
Congressional Research Service 2021; Marr et al. 2021), we assess the extent to which different
aspects of our methodology drive the differences. When we make closer methodological decisions
to these studies in our survey-only analysis, we find percent reductions in child poverty within 2
to 3 percentage points of their estimates (see Appendix Table A5 for our results when adopting the
methodological assumptions of other studies).22 The differences are mostly a result of our updating
22 To compare our results to those in other studies, we make several changes to our methodology that include (i) assuming a 100% take-up rate, (ii) not updating incomes to 2022, (iii) subtracting medical out of pocket expenses, child care, other work-related expenses, and child support paid, and (iv) using SPM thresholds scaled up to produce the same baseline child poverty rate as the study in question. The latter two changes are based on the use of the SPM by these other studies. See Meyer and Sullivan (2012b) and Burkhauser et al. (2021) for a discussion of the shortcomings of the SPM for accurately measuring poverty.

18
income values to 2022 and accounting for incomplete take-up of the AFP CTC among non-tax
filers.
Static Anti-Poverty Effects of the Incremental CTC Compared to Existing Programs
Next, we compare the anti-poverty effects of the incremental CTC to those of existing
programs. To put all programs on an equal footing, we consider a new baseline in which the AFP
CTC has already been enacted and then simulate how much poverty would increase if a particular
program were eliminated. In this case, the anti-poverty effect of each program is equal to the
percent increase in the number of individuals with incomes falling below the poverty threshold
after removing a particular program. This calculation indicates the extent to which a program
prevents individuals from falling into poverty.
The incremental CTC, if enacted, would become the most important anti-poverty program
for preventing child poverty (Figure 4). Reverting from the AFP CTC back to the TCJA CTC
would increase child poverty by 51%.23 Eliminating the second most important program, the EITC,
would increase child poverty by 42%. Eliminating SNAP would increase child poverty by 33%.
Anti-poverty effects of rental housing assistance, SSI, DI, OASI, and public assistance are smaller.
The incremental CTC would also become the second most important program for preventing
overall poverty: Reverting back to the TCJA CTC would increase overall poverty by 20%, while
eliminating OASI would increase overall poverty by 57%.24
While the incremental CTC would have a larger anti-poverty effect among children than
any other means-tested program, it would do so in the least cost-effective way (see Appendix Table
A7). Note that costs are measured solely in terms of total benefit dollars paid out and do not include
administrative costs, which tend to be lower for programs that are administered through the tax
system (like the EITC and CTC).25 The incremental CTC costs $29,680 to families with children
per child lifted out of poverty, compared to $15,655 for SNAP, $20,636 for the EITC, $25,504 for
SSI, and $24,863 for housing assistance. The incremental CTC is also relatively cost-ineffective
in reducing overall poverty. The incremental CTC pays out $17,602 to all families per individual
23 This estimate contrasts with the 34% decrease in child poverty (as a result of the CTC expansion) that we previously calculated, since it is estimated on an income base that includes the AFP CTC (whereas the previous effect is estimated on an income base that includes only the TCJA CTC). As a result, the 51% effect is approximately equal to 0.34 divided by 1 minus 0.34. 24 Appendix Table A6 reports the values represented in Figure 4. 25 At the same time, lower administrative costs may be associated with higher rates of non-compliance given that there are fewer resources available to verify recipient eligibility (see, e.g., Liebman 1998, Meyer 2010).

19
lifted out of poverty, compared to $12,312 for SNAP, $13,168 for the EITC, $17,575 for SSI, and
$16,583 for housing assistance.
Comparing the CID-based results to those relying only on the survey reveals the
importance of using the CID to assess the anti-poverty effects of potential policies. For example,
the effect of SNAP on child poverty is 53% higher using the CID than using the survey alone
(Figure 4). The effect of the EITC on child poverty is 18% higher under the CID. Thus, the survey
data alone overstate the relative merits of the CTC expansion since they understate the poverty
reduction of other anti-poverty programs.
Targeting
We also compare the targeting of the incremental CTC with that of existing programs,
again from the baseline in which the AFP CTC has already been enacted (to put all program on an
equal footing). We focus on the incremental CTC (as the most currently relevant decision for
policymakers is whether or not to switch from the TCJA CTC to the AFP CTC), but we also report
results for the AFP CTC in its entirety and the TCJA CTC on its own. For each program, we
calculate the share of all program dollars received by families in (i) each decile of annual income,
(ii) each decile of long-term income (five-year average of market income using linked tax records),
(iii) different categories of educational attainment levels of the family head, and (iv) different
categories of health status of the family head. This analysis allows us to view how each program
is targeted on the basis of different measures of well-being.
Figure 5 reports the share of each program’s total spending received by families in each
decile of the annual income distribution (where deciles are based on income under the AFP CTC
so that programs are compared on an equal footing). The incremental CTC provides a lower share
of its dollars to the bottom decile than any existing means-tested program, with the exception of
housing assistance. The incremental CTC allocates 15% of its total dollars to families in the bottom
income decile, compared with 20% of EITC dollars, 29% of SNAP dollars, and 33% of SSI
dollars.26 The incremental CTC also provides a smaller share of dollars to families in the bottom
half of the distribution (the lowest five deciles) than all other means-tested programs (including
housing assistance). Yet, the incremental CTC pays out a larger share of dollars to the bottom
decile as well as bottom half of the income distribution than the TCJA CTC. CID-based results
26 The estimates for SNAP are calculated using the subset of 14 states for which we have linked administrative data on SNAP.

20
differ from survey-only results, with the survey-only simulation indicating that the incremental
CTC targets families in the bottom decile more than the EITC (Appendix Figure A3).
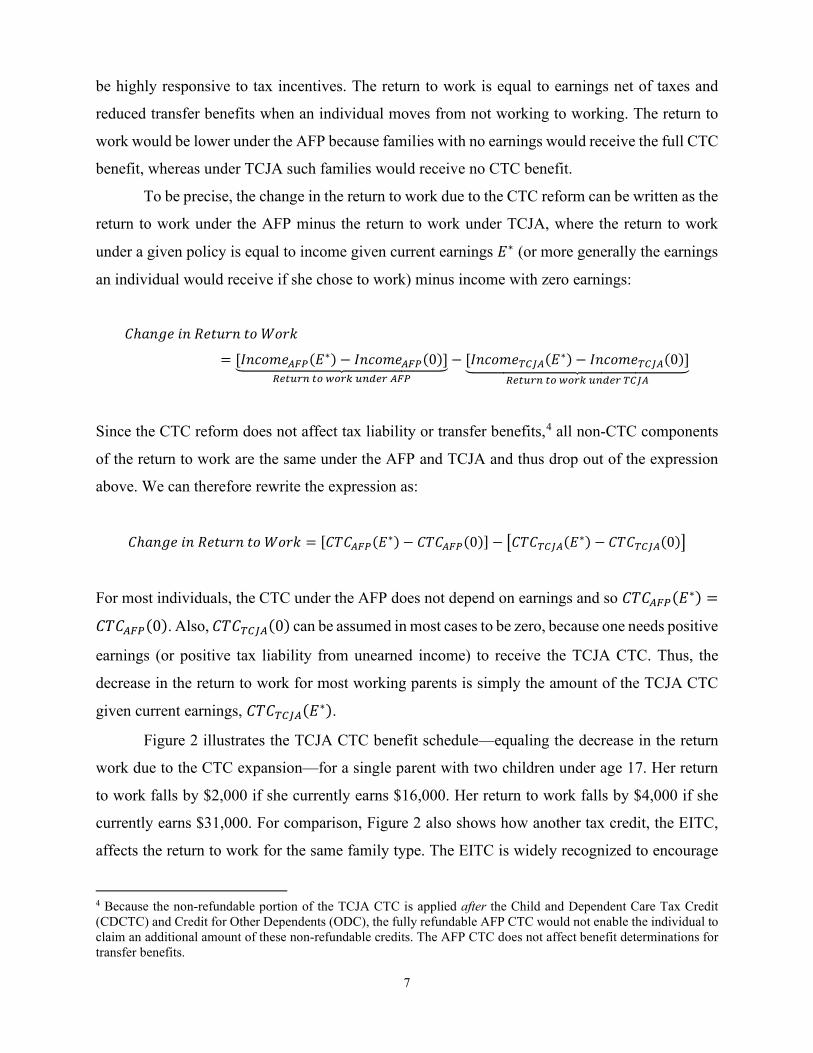
We report targeting results based on other measures of well-being in Figure 6 (long-run
income), Figure 7 (educational attainment of the family head), and Figure 8 (self-reported health
status of the family head). Consistent with the results based on annual income, the incremental
CTC is also less targeted to the least well-off families on the basis of these other measures
(compared to other means-tested transfers).
6. Dynamic Results Accounting for Changes in Labor Supply
This section incorporates labor supply responses into our poverty estimates, using the CID.
The CTC expansion would reduce the incentive to work for most workers with children. Under
the TCJA CTC, workers receive up to $2,000 per child only if they work or have a nonzero federal
tax liability due to income from other sources. Under the AFP CTC, workers receive no additional
benefit amount as a result of working. In addition to reducing the return to work, the CTC
expansion would increase family incomes, further reducing employment through an income effect.
Due to the resulting reduction in employment (and its impact on family income), we estimate that
some families will be added to poverty rolls in our dynamic simulation of the AFP CTC.
Changes in Labor Supply
To estimate the reduction in labor force participation due to the CTC expansion, we apply
work participation elasticities from the literature, which indicate the percent change in the
probability of participation due to a one percent change in the return to work. Letting 𝜖𝜖 denote the
participation elasticity, the percent change in the probability of working is equal to 𝜖𝜖 times the
percent change in the return to work. We consider the work decisions of each tax unit with at least
one current worker and at least one dependent child under the age of 18.
We start by calculating the percent change in the return to work for each tax unit, which is
the change in the return to work due to the CTC expansion divided by the current return to work
under the TCJA CTC. The change in the return to work is the incremental CTC benefit when
working at the current earnings level minus the incremental CTC benefit when not working. The
current return to work under the TCJA CTC is current earnings minus the additional tax liability
accrued due to working minus the transfer benefits lost due to working.

21
To calculate the percent change in the probability of working for each tax unit that is
currently working, we multiply the percent change in the tax unit’s return to work by the relevant
elasticity for the tax unit. We apply an elasticity of 0.75 for single mother tax units currently
receiving the EITC and 0.25 for all other tax units. The 0.75 elasticity for tax units receiving the
EITC is equal to the midpoint of the 0.3 to 1.2 range recommended for EITC-eligible workers
based on the literature review relied on by the CBO (McClelland and Mok 2012).27 The 0.25
elasticity is consistent with those used by other simulation models and the academic literature
(Congressional Budget Office 2012; Chetty et al. 2013).28 As we show later, our elasticity
assumptions produce employment effects consistent with NAS (2019) modelling of an expansion
of the EITC.
In addition to the effects of a decreased return to work, the increase in incomes due to the
CTC expansion would further be expected to reduce labor force participation through the income
effect. To estimate the reduction in participation in the labor force due to higher incomes, we apply
elasticities that indicate the percent change in the probability of participation due to a one percent
change in income. We follow NAS (2019) in their simulation of a child allowance, which uses an
elasticity of -0.085 for single mother tax units. We assign an elasticity of -0.05 for all other tax
units.29 We multiply these elasticities by the increase in income due to the CTC expansion divided
by income under the TCJA CTC for the tax unit’s family.
To estimate the total number of current workers exiting the labor force due to the CTC
expansion, we multiply each individual worker’s weight in the CPS ASEC by the percent change
in the probability of the worker exiting the labor force, either due to the decrease in the return to
27 In reviewing the literature on EITC expansions during the 1990s, Nichols and Rothstein (2016) note: “Given the clear patterns in the 1990s, it is not surprising that studies based on the 1993 expansion indicate that the EITC raises single mothers’ employment rates. Meyer and Rosenbaum (2001) find that this expansion raised single mothers’ annual employment rates by 3.1 percentage points, over one-third of the total increase relative to single childless women between 1992 and 1996. This implies an extensive-margin labor supply elasticity around 0.7.” 28 The Penn Wharton Budget Model assumes a baseline labor supply elasticity of 0.50 (combining participation and hours). CBO (2012) recommends a labor supply elasticity of between 0.22 and 0.32 for primary workers across all earnings deciles and secondary workers altogether. In a meta analysis, Chetty et al. (2013) conclude: “The estimates in table 1 should therefore be interpreted as a rough guide to plausible targets for calibration: they suggest that extensive margin elasticities around 0.25 are reasonable, while values above 1 are not.” We also show sensitivity results with each combination of the following elasticities: 0.5, 0.75, and 1.2 for EITC recipient tax units and 0.05, 0.25, and 0.45 for non-EITC recipient tax units. 29 NAS (2019, p. 431) assumes an employment elasticity with respect to income of -0.05 for men and -0.12 for married women. Because we conduct our analysis at the tax unit level, we take the lower -0.05 estimate to model joint decisions to exit the labor force. NAS (2019, p. 545) reports an income elasticity of 0 for men in its simulation of child allowances—it is not clear whether the 0 elasticity reported on page 545 or -0.05 elasticity reported on page 431 was ultimately used.

22
work or to higher incomes. We sum these products over all workers with children in the CPS
ASEC to estimate the number of current workers exiting the labor force. See Appendix C for
further details of our methodology.
We report changes in work incentives and employment for workers based on the earnings
of their tax unit, in intervals of $10,000. We estimate there were 56 million adults with children
who worked during the year and were a member of a tax unit with strictly positive earnings
(Appendix Figure A4). Of those adults, 23% (13 million) had tax unit earnings of less than
$30,000, and 43% had tax unit earnings of between $30,000 and $100,000. For workers with
earnings between $30,000 and $100,000, the mean return to work falls by approximately $2,900
to $3,300 (Appendix Figure A5). For workers with earnings below $30,000, the return to work
falls by less—with cell means between $450 and $2,400—because their TCJA CTC benefit had
not yet fully phased in. Notably, the pattern of the cell mean decrease to the return to work that we
estimate in the CID accords in changes across current earnings with the decrease in the return to
work calculated for a hypothetical family in Appendix Figure A1.
The extent to which the decrease in the return to work affects labor supply depends on the
baseline return to work. If the baseline return to work is lower, a given decrease in the return to
work will reduce labor supply more. Appendix Figure A6 shows the percent decrease in the return
to work due to CTC expansion, relative to the baseline return to work under the TCJA CTC.
Workers with earnings between $0 and $30,000 face a mean percent decrease in the return to work
of between 7% and 10%. The percent decrease in the return to work falls as earnings rise, reflecting
the higher baseline return to work (in dollars) for those with higher earnings.
We multiply the percent change in the return to work by the relevant labor supply elasticity
for each worker (0.75 for single mother EITC recipients and 0.25 for all other workers with
children), and we multiply the percent change in income by the relevant income elasticity (0.085
for single mother EITC recipients and 0.05 for all other workers with children). As a result of the
CTC expansion, we estimate that employment falls by 1.5 million workers, representing 2.6% of
all working parents. Workers with earnings below $50,000 account for 72% of the employment
loss (Appendix Figure A7). Most the of the employment reduction (1.32 million) is the result of
the substitution effect from a decreased return to work. The remaining portion (0.14 million) is the
result of the income effect from increasing incomes for working families. Table 4 reports
employment reductions under other labor supply elasticity assumptions.

23
We do not account for reductions in work hours among current workers who continue
working under the CTC expansion. Since the implicit marginal tax rate rises for workers on the
phase-in portion of the TCJA CTC, there will likely be a reduction in hours worked among those
who continue to work. Whereas the TCJA CTC rewards an additional dollar of earnings with
approximately $0.15 of benefits for these workers, the AFP CTC provides no reward for an
additional dollar of earnings. We estimate that 10.4 million workers on the phase-in portion of the
TCJA CTC face on average a 14.6 percentage point increase in their implicit marginal tax rate due
to the CTC expansion (Table 5).30 See Appendix D for our methodology for these estimates. Not
accounting for reductions in earnings of these workers facing higher implicit marginal tax rates
will lead us to understate the reduction in earnings across all workers.
Incorporating Labor Supply Reductions into Poverty Simulations
We next incorporate the earnings losses resulting from the labor force exit of 1.5 million
estimated workers into our estimates of the overall and child poverty rates under the AFP CTC.
To do so, we simulate adjusted post-tax, post-transfer incomes for the families of current workers
who exit the labor force. We subtract earnings, reduce tax liabilities, and add transfer benefits
resulting from the reduction of earnings, while also recalculating the AFP CTC amount based on
the reduction in AGI due to lost earnings. Finally, we estimate the number of individuals and
children whose (adjusted) equivalized post-tax, post-transfer family income falls below the
poverty threshold ($37,890) and deep poverty threshold ($18,945). See Appendix B for a detailed
methodology.
Table 6 reports the overall and child poverty rate after accounting for labor supply
reductions. Under the TCJA CTC, the child poverty rate was anchored to 13.7% and the overall
poverty rate is 10.8%. The CTC expansion reduces the child poverty rate to 10.8%, a 22%
decrease, based on our dynamic simulation. By comparison, the CTC expansion cut child poverty
by 34% based on our static simulation. Thus, accounting for changes in labor supply induced by
the CTC expansion cuts the static child poverty reduction by over a third. Table 6 also reports
results for deep poverty. The CTC expansion does not reduce deep poverty among children in our
dynamic simulation, eliminating the entire 39% static estimate. Deep poverty among the overall
30 The implicit marginal tax rate also rises for workers on the phase-out portion of the incremental CTC (starting with AGI of $112,500 for tax units filing head of household and starting with AGI of $150,000 for tax units filing married filing jointly).

24
population also does not fall under our dynamic simulation, compared to the 15% static estimate.
These findings on deep poverty can be explained by the inability of AFP CTC benefits and SNAP
benefits by themselves to lift a family over half of our poverty line. For example, a single parent
with two children would receive between $6,000 and $7,200 from the AFP CTC and about $7,000
in SNAP benefits, less in total than the $19,600 deep poverty threshold.31
7. Discussion This section puts our results in perspective. First, we discuss the plausibility of our estimate
of 1.5 million workers exiting the labor force. We begin by comparing our estimates to the
estimated effects of the EITC in NAS (2019), and to the effects of welfare reform in the 1990s.
We then briefly discuss the NAS committee’s omission of the main labor supply effect when
modelling the replacement of the CTC with a child allowance, and their inclusion of income effect
estimates which are similar to ours. Second, we further discuss the targeting of the AFP CTC.
Finally, we discuss some caveats and unaccounted for factors that could lead our estimates to
overstate or understate effects on poverty or work effort.
We start by discussing the plausibility of the estimated 1.5 million person decline in
employment from replacing the TCJA CTC with a child allowance akin to a UBI for families with
children. NAS (2019) does not account for the decrease in the return to work when modeling the
replacement of the CTC with a child allowance that shares the basic features of the AFP CTC (a
$3,000 annual per child payment for all low and middle income families). However, NAS (2019)
simulates an expansion of the EITC that changes the incentives in a similar manner and for a
similar population as the AFP CTC. In their case, they are looking at an increase in work incentives
while the CTC expansion would do the reverse. NAS simulates a policy that would expand the
EITC by increasing all federal payments by 40%. In this case, NAS (2019) accounts for the
decision to work at all and estimates that the increase in the return to work from the EITC
expansion would bring 771,000 new parents (single mothers) into employment (p. 495).32 If
increasing the EITC by 40% would bring 771,000 new parents into employment, then—by
31 We do not model newly obtained housing assistance or TANF for families experiencing employment loss because they are not entitlement programs. Some newly poor families may eventually obtain benefits from these programs which could lift them out of deep poverty. 32 It appears that NAS (2019) estimates that approximately 200,000 current workers would stop working due to the EITC expansion they model (p. 490, p. 495). However, in our EITC simulation which is solely intended to benchmark our estimates of the change in the return to work, we do not account for the income effect and higher marginal tax rates on the EITC phase-out, so we do not account for this effect in our calculations.

25
symmetry and linear extrapolation—eliminating the existing EITC would be expected to lead 1.9
million workers to exit employment.33 Applying the same elasticities as those used for our
simulation of the CTC expansion, we estimate that eliminating the existing federal EITC would
reduce employment by 1.7 million workers. Since our EITC employment loss estimates are
consistent with NAS (2019), we may expect that NAS would obtain a similar effect to our AFP
CTC estimates if it incorporated the decrease in the return to work from eliminating the TCJA
CTC.
The relative similarity of our estimates of the employment effects of the CTC expansion
and elimination of the EITC illuminates the common feature of the EITC and TCJA CTC in
encouraging work. As shown in Figure 3, the EITC more strongly encourages work for parents
with earnings up to $30,000, while the TCJA CTC more strongly encourages work for parents with
earnings above $30,000. The somewhat smaller employment reduction from the CTC expansion—
despite the inclusion of an income effect that does not apply when eliminating the EITC—is a
result of greater responsiveness to the changed work incentives at low earnings levels. However,
work incentives of the TCJA CTC are still substantial even for those with low earnings and have
important effects for those with earnings above $30,000 as well.
The employment decrease we estimate is also consistent with the rise in employment
among single mothers during the 1990s. Between 1990 and 1999, the employment of single
mothers rose by 1.2 to 1.4 million people (Han et al. 2021).34 Welfare reform had many features,
but the two most salient were the expansion of the EITC which increased the financial return to
working and welfare reform that eliminated unconditional cash aid. The CTC expansion
incorporates these two main features of welfare reform, but in the opposite direction, reducing the
financial return to work and providing unconditional cash aid to an even larger group than the
original AFDC program.
To interpret the applicability of the experience of welfare reform to the CTC expansion it
is helpful to scale the relative size of the changes in work incentives and unconditional aid. At its
peak, AFDC provided aid to 4 million adults and their children, but the number had declined to
about 2 million by the end of the 1990s. Thus, the number of adults receiving aid declined by about
2 million. The CTC would reach several multiples of that count, including about 10 million single
33 If there are decreasing returns to incentives to participate in the labor force, the decrease in employment would be even greater. 34 The range of estimates is due to a choice of whether to control for the education of single mothers (which greatly increased over this period) or not, and if so, what year to use for the base year distribution.

26
parents. But it should be noted that the AFP CTC would not bring back the high implicit marginal
tax rates that applied to about 2 million more families prior to welfare reform. Under AFDC, a
non-working single parent with two children in 1994 could receive a maximum annual benefit of
$8,175 (in 2021 dollars) in the average state (U.S. Department of Health and Human Services,
n.d.). In comparison, the CTC expansion would provide between $6,000 and $7,200 of
unconditional cash assistance to a non-working single parent with two children. The relative size
of the EITC and AFP CTC work incentives were described in Section 2, where we show that the
incentives of the CTC reversed by the expansion are a substantial share of the EITC incentives at
very low earnings, and exceed EITC incentives at earnings above $30,000. But that figure for the
EITC in 2021 reflects total EITC which reflects increases prior to 1990 to which we cannot
attribute the increase in employment of single mothers in the 1990s. In 1990 the maximum credit
was already $1,934 (in 2021 dollars) compared to the $5,920 in Figure 2. Thus, the change in the
EITC incentives (along with TANF changes) that led to the 1.2 to 1.4 million increase in
employment are substantially smaller than the EITC incentives indicated in Figure 2 and more
comparable to the AFP CTC work incentives that go in the opposite direction.
A large body of evidence concludes that some combination of EITC expansion and welfare
reform was responsible for a large rise in employment among single mothers during the 1990s,
beyond the effect of a strong economy (Meyer and Rosenbaum 2001; Grogger 2003). While the
bulk of the literature concludes that the EITC expansion played the predominant role (see
Schanzenbach and Strain 2020), some have argued that the shift away from unconditional cash
assistance under AFDC was more important (Kleven 2019). Whether thought of as reversing
welfare reform or eliminating a program similar to the EITC, the CTC expansion should be
expected to reverse at least most or all of the employment gains of the 1990s.
In explaining its modeling of a child allowance, the NAS report notes that a child allowance
in its simplest form only has an income effect, i.e., it does not change the return to work. However,
the report then applies this reasoning to simulations that involve eliminating either the pre-TCJA

27
CTC or the TCJA CTC.35 Others have noted that the CTC expansion has a substitution effect,
altering the return to work, but have not considered the work/nonwork decision.36
Our estimate of the income effect of the CTC is very similar to that of the NAS, which is
unsurprising given that we use the same elasticities. NAS (2019) estimates that a child allowance
of $3,000 per child would reduce employment by 149,000 workers, similar to the 138,000
reduction we estimate. The difference likely arises from using a different baseline benefit (NAS
uses the smaller pre-TCJA CTC), a different maximum benefit for children aged 0 to 5 (NAS uses
$3,000 instead of $3,600), and an earlier phaseout of the child allowance in the NAS simulation.
Additional evidence on the plausibility of our estimates comes from two other studies.
Lippold (2019) estimates that when a child turns 17 and thus loses eligibility for the CTC—prior
to the more generous TCJA version taking effect—low-income parents’ probability of
employment falls by 8.4 percentage points, implying a work participation elasticity with respect
to the return to work of 1.04. Hamilton et al. (2021) find in a survey based on stated intentions
rather than observed behavior that 6.4% of parents likely eligible for the temporarily expanded
CTC for 2021 planned to use the credit to “work less or change jobs” (Hamilton et al. 2021).37 Of
course, it is not clear how these stated intentions will ultimately translate into changes in behavior,
but the estimate does not rule out the 2.6% reduction in employment among parents we estimate.
More broadly, evidence of employment reductions has been found in the context of other
means-tested programs. As seen in Appendix Figure A8, the incremental CTC (the difference
between the AFP CTC and TCJA CTC for each family) is similar in structure to means-tested
programs such as SNAP that provide a maximum amount of benefits to those with no income and
phase out as income rises. Hoynes and Schanzenbach (2012) estimate that SNAP receipt during
the program’s rollout in the 1960s and 1970s (then called the Food Stamp program) reduced
employment by single women recipients by 24 to 27 percentage points. While those effects apply
to a period of less generosity of other programs, East (2018) estimates that SNAP receipt during
35 While NAS (2019) uses as its baseline the smaller pre-TCJA CTC which offered a maximum payment of $1,000 per child, decreasing the return to work by $1,000 per child is still a significant work disincentive (in alternative estimates, NAS uses the TCJA CTC as its baseline, estimates which similarly do not appear to account for the decrease in work due to the elimination of the existing CTC). 36 See Winship (2021) and Goldin, Maag, and Michelmore (2021). These authors discuss the substitution effect along the phase-in of the TCJA CTC schedule, but not the participation margin which past work has found to be the important one for this population. Furthermore, the work/non-work decision is affected by more than the phase-in—it is affected by the entire TCJA CTC schedule, even parts that are flat where there is no substitution effect operating on hours worked. While these workers do not face an increased implicit marginal tax rate on an additional dollar of earnings, their return to working at all falls. 37 There were 63 million parents in the United States in 2020, and so 6.4% would represent about 4 million parents.

28
the 1990s and 2000s reduced employment of single women immigrants (who on average had 1.3
children in her sample) by 43%. Reductions in labor supply of varying amounts and durations have
been found for other means-tested programs, including for housing assistance for which effects
are smaller and tend to fade out in the long run (Jacob and Ludwig 2012; Mills et al. 2006; Gubits
et al. 2018) and experimental negative income tax programs in the 1970s (Robins 1985).
We next discuss the targeting implications of the policy shift from the TCJA CTC to the
AFP CTC. By virtue of its large scale—$101 billion in 2022—the incremental CTC would become
more important than any means-tested program in preventing child poverty based on a static
simulation. At the same time, the cost per person lifted out of poverty would be higher than that
for any means-tested program. Relatedly, the shift to the AFP CTC would be less targeted to the
bottom decile of the income distribution than any means-tested program—including the EITC,
which encourages work at the extensive margin. The shift to the AFP CTC would thus reduce
poverty at a higher cost per individual raised above the poverty line than other programs. This is
not surprising given that the CTC expansion would increase benefits for tax units with adjusted
gross income of up to $164,500 for a single parent with two children and at an even higher income
level for married parents. At the same time, more strongly means testing the expansion would
increase work disincentives for working parents relative to the TCJA CTC, as the reduced benefits
for middle income families would decrease their return to work further.
A few caveats are in order. While our baseline estimate is that employment will decline by
1.5 million adults based on the midpoint of ranges used in past simulations and the central tendency
of literature surveys, both lower and higher changes are predicted by other elasticities in the
literature. Since we rely on elasticities from the literature rather than estimate a full structural
model, we would need other information to allocate the average tendencies implied by elasticities
to particular individuals. For example, we do not know whether a one percent decline in average
hours implies a ten percent decline for one in ten people or a one percent decline for every worker.
Similarly, we would need a more sophisticated model than the one we employ to consider the
separate incentives of both spouses in a couple. These complications are avoided in our modeling
of the work/nonwork decisions for single worker families since average tendencies imply
probabilistic choices that are easily modeled. As a result, we focus only on the work/nonwork
decision, not incorporating the reduction in hours that would be expected for those who remain in
the workforce due to the increase in marginal tax rates along the previous phase-in and over the
new phase-out of the CTC. This understatement of the work response is likely offset to some extent

29
by our simplified work decision of couples, taking them both to stop working or neither. In fact,
the employment response for couples should be spread across a larger number of families, some
who would have only one spouse leave the labor market. Since the loss of one out of two low-
income earners from a family is likely to lead a family to be below the poverty line but not the
deep poverty line, the implication of our simplification is that the child poverty reduction of the
AFP CTC has likely been overstated, but the deep child poverty reduction understated. As the
large majority of our response comes from single parents, even assuming no response of married
couples as an extreme would leave the large majority of the behavioral response we estimate. For
example, at least 83 percent of the families that experience a drop in earnings in our simulations
have only one worker.38
8. Conclusion In this paper, we simulate the effects of a proposed expansion of the CTC that would
increase maximum benefit amounts and also make the full credit available to all low- and middle-
income families regardless of earnings or tax liability. Absent behavioral responses, child poverty
would fall by 34% and deep child poverty would fall by 39%. These static simulations suggest that
the incremental CTC—the difference between the AFP CTC and the TCJA CTC—would become
the most important anti-poverty program for children in the United States (keeping 3.4 million
children out of poverty). However, the poverty reduction would come at a cost of $101 billion in
benefit dollars, implying that the incremental CTC would be less effective than other major means-
tested programs in keeping children out of poverty per dollar of benefits. Relatedly, a smaller share
of the incremental CTC would be targeted to families with lower levels of income and well-being.
These calculations ignore any changes in behavior, in particular employment and hours
decisions. The AFP CTC would replace the TCJA CTC—which like the EITC has substantial work
incentives—with a program akin to a Universal Basic Income that provides benefits regardless of
earnings. Consequently, the expansion would reduce the return to work for most working parents
by at least $2,000 per child. We estimate that the CTC expansion would lead 1.5 million working
parents to exit the labor force. Most of the effect (1.3 million) is due to the decrease in the return
to work. For comparison, we estimate that eliminating the EITC would lead 1.7 million working
38 This figure is based on public-use data with various simplifying assumptions, as we have not yet disclosed the relevant numbers.

30
parents to exit the labor force. The somewhat smaller but nonetheless comparable effect we
estimate for the CTC expansion reflects the strong work incentives of the TCJA CTC. When
incorporating the estimated employment reduction into our poverty simulations, we find that the
CTC expansion would reduce child poverty by 22% instead of the 34% reduction we found based
on our static simulation. The CTC expansion would not decrease deep child poverty, reversing the
39% reduction we estimated based on a static simulation.
To undertake these analyses, we use the Comprehensive Income Dataset (CID), which
links household survey data with administrative tax and program participation records. Relative to
prior studies that rely on survey data alone, using the CID allows us to more accurately simulate
tax liabilities and credits (using actual tax unit structure and inputs) and provides a more accurate
distribution of baseline incomes (which are misreported in the survey data). By providing accurate
reports of government program receipt, the CID also enables more accurate comparisons of the
anti-poverty and targeting effects of the CTC expansions with those of existing programs. Finally,
the CID retains the strengths of surveys, allowing us to observe the family structure of individuals,
measure targeting via well-being characteristics like education and health, and incorporate income
sources not fully captured by administrative sources. While prior studies using the CID have
addressed issues ranging from the measurement of poverty to the effects of existing programs on
economic well-being, this is the first paper to use the CID to more accurately simulate the effects
of proposed policies. In doing so, it provides a blueprint for future simulations of proposed policies
that rely on linked survey and administrative data to improve their accuracy.

31
References Acs, Gregory, and Kevin Werner. 2021. “How a Permanent Expansion of the Child Tax Credit
Could Affect Poverty.” Urban Institute. https://www.urban.org/sites/default/files/publication/104626/how-a-permanent-expansion-of-the-child-tax-credit-could-affect-poverty_1.pdf.
Armour, Philip. 2018. “The Role of Information in Disability Insurance Application: An Analysis of the Social Security Statement Phase-In.” American Economic Journal: Economic Policy 10 (3): 1–41. https://doi.org/10.1257/pol.20160605.
Bee, Adam, and Joshua Mitchell. 2017. “Do Older Americans Have More Income Than We Think?” SESHD Working Paper SESHD-WP2017-39. Bureau of the Census (US). https://www.census.gov/content/dam/Census/library/working-papers/2017/demo/SEHSD-WP2017-39.pdf.
Brill, Alex, Kyle Pomerleau, and Grant M. Seiter. 2021. “The Tax Benefits of Parenthood: A History and Analysis of Current Proposals.” American Enterprise Institute.
Burkhauser, Richard V., Corinth, Kevin, Bruce D. Meyer, Angela Rachidi, Matt Weidenger, and Scott Winship. 2021. “Addressing the Shortcomings of the Supplemental Poverty Measure.” American Enterprise Institute. https://www.aei.org/wp-content/uploads/2021/07/Addressing-the-Shortcomings-of-the-Supplemental-Poverty-Measure.pdf?x91208.
Celhay, Pablo, Bruce Meyer, and Nikolas Mittag. 2021. “Errors in Reporting and Imputation of Government Benefits and Their Implications.” w29184. Cambridge, MA: National Bureau of Economic Research. https://doi.org/10.3386/w29184.
Census Bureau. 2014. “The Undercount of Young Children.” https://www.census.gov/content/dam/Census/library/working-papers/2014/demo/2014-undercount-children.pdf.
Chetty, Raj, Adam Guren, Day Manoli, and Andrea Weber. 2013. “Does Indivisible Labor Explain the Difference between Micro and Macro Elasticities? A Meta-Analysis of Extensive Margin Elasticities.” NBER Macroeconomics Annual 27 (1): 1–56. https://doi.org/10.1086/669170.
Collyer, Sophie, Megan A. Curran, Robert Paul Hartley, Zachary Parolin, and Christopher Wimer. 2021. “The Potential Poverty Reduction Effect of the American Families Plan.” Poverty and Social Policy Fact Sheet. Center on Poverty and Social Policy at Columbia University. https://static1.squarespace.com/static/5743308460b5e922a25a6dc7/t/6089abfe510bad33dcecc4c9/1619635200067/Poverty-Reduction-Analysis-American-Families-Plan-CPSP-2021.pdf.
Collyer, Sophie, Christopher Wimer, and David Harris. 2019. “Earnings Requirements, Benefit Values, and Child Poverty under the Child Tax Credit: Eliminating the Earnings Requirement Does More to Impact Child Poverty than Increasing Benefit Levels.” Poverty and Social Policy Brief 3 (3).
Congressional Budget Office. 2012. “How the Supply of Labor Responds to Changes in Fiscal Policy.” https://www.cbo.gov/sites/default/files/cbofiles/attachments/10-25-2012-Labor_Supply_and_Fiscal_Policy.pdf.
Congressional Research Service. 2021. “The Child Tax Credit: The Impact of the American Rescue Plan Act (ARPA; P.L. 117-2) Expansion on Income and Poverty.”

32
Daponte, Beth Osborne, Seth Sanders, and Lowell Taylor. 1999. “Why Do Low-Income Households Not Use Food Stamps? Evidence from an Experiment.” The Journal of Human Resources 34 (3): 612. https://doi.org/10.2307/146382.
East, Chloe N. 2018. “Immigrants’ Labor Supply Response to Food Stamp Access.” Labour Economics 51 (April): 202–26. https://doi.org/10.1016/j.labeco.2018.01.003.
Fox, Liana E., and Kalee Burns. 2021. “The Supplemental Poverty Measure: 2020.” Current Population Reports. U.S. Census Bureau.
Greenstein, Robert. 2015. “Policymakers Often Overstate Marginal Tax Rates for LowerIncome Workers and Gloss Over Tough Trade-Offs in Reducing Them: Condensed Version.” Center on Budget and Policy Priorities. https://www.cbpp.org/sites/default/files/atoms/files/1-12-15tax.pdf.
Grogger, Jeffrey. 2003. “The Effects of Time Limits, the EITC, and Other Policy Changes on Welfare Use, Work, and Income among Female-Headed Families.” Review of Economics and Statistics 85 (2): 394–408. https://doi.org/10.1162/003465303765299891.
Gubits, Daniel, Marybeth Shinn, Michelle Wood, Scott R. Brown, Samuel R. Dastrup, and Stephen H. Bell. 2018. “What Interventions Work Best for Families Who Experience Homelessness? Impact Estimates from the Family Options Study: What Interventions Work Best for Families Experiencing Homelessness?” Journal of Policy Analysis and Management 37 (4): 835–66. https://doi.org/10.1002/pam.22071.
Hamilton, Leah, Stephen Roll, Mathieu Despard, Elaine Maag, and Yung Chun. 2021. “Employment, Financial and Well-Being Effects of the 2021 Expanded Child Tax Credit: Wave 1 Executive Summary.” Social Policy Institute Research.
Holt, Steve, and Elaine Maag. 2009. “Considerations in Efforts to Restructure Work-Based Credits.” Urban Institute. https://www.urban.org/research/publication/considerations-efforts-restructure-work-based-credits.
Hotz, V. Joseph, and John Karl Scholz. 2003. “The Earned Income Tax Credit.” In Means-Tested Transfer Programs in the United States. University of Chicago Press.
Hoynes, Hilary, and Jesse Rothstein. 2016. “Tax Policy Toward Low-Income Families.” w22080. Cambridge, MA: National Bureau of Economic Research. https://doi.org/10.3386/w22080.
Hoynes, Hilary Williamson, and Diane Whitmore Schanzenbach. 2012. “Work Incentives and the Food Stamp Program.” Journal of Public Economics 96 (1–2): 151–62. https://doi.org/10.1016/j.jpubeco.2011.08.006.
Internal Revenue Service. 2021a. “2021 Child Tax Credit and Advance Child Tax Credit Payments — Topic C: Calculation of the 2021 Child Tax Credit.” https://www.irs.gov/credits-deductions/2021-child-tax-credit-and-advance-child-tax-credit-payments-topic-c-calculation-of-the-2021-child-tax-credit.
———. 2021b. “Publication 972: Child Tax Credit and Credit for Other Dependents.” https://www.irs.gov/pub/irs-pdf/p972.pdf.
———. 2021c. “EITC Participation Rate by States.” Jacob, Brian A, and Jens Ludwig. 2012. “The Effects of Housing Assistance on Labor Supply:
Evidence from a Voucher Lottery.” American Economic Review 102 (1): 272–304. https://doi.org/10.1257/aer.102.1.272.
Kleven, Henrik. 2019. “The EITC and the Extensive Margin: A Reappraisal.” w26405. Cambridge, MA: National Bureau of Economic Research. https://doi.org/10.3386/w26405.
Lippold, Kye. 2019. “The Effects of the Child Tax Credit on Labor Supply.” SSRN Electronic Journal. https://doi.org/10.2139/ssrn.3543751.

33
Maggie R. Jones, and James P. Ziliak. 2020. “The Antipoverty Impact of the EITC: New Estimates from Survey and Administrative Tax Records.” Center for Economic Studies Working Paper 19-14. Washington, D.C: U.S. Census Bureau.
Manoli, Dayanand, and Nicholas Turner. 2014. “Nudges and Learning: Evidence from Informational Interventions for Low-Income Taxpayers.” w20718. Cambridge, MA: National Bureau of Economic Research. https://doi.org/10.3386/w20718.
Marr, Chuck, Kris Cox, Stephanie Hingtgen, and Katie Windham. 2021. “Congress Should Adopt American Families Plan’s Permanent Expansions of Child Tax Credit and EITC, Make Additional Provisions Permanent.” Center on Budget and Policy Priorities. https://www.cbpp.org/sites/default/files/5-24-21tax.pdf.
McClelland, Robert, and Shannon Mok. 2012. “A Review of Recent Research on Labor Supply Elasticities.” Congressional Budget Office Working Paper Series, October.
Medalia, Carla, Bruce D Meyer, Amy B O’Hara, and Derek Wu. 2019. “Linking Survey and Administrative Data to Measure Income, Inequality, and Mobility.” International Journal of Population Data Science 4 (1). https://doi.org/10.23889/ijpds.v4i1.939.
Meyer, B. D., and D. T. Rosenbaum. 2001. “Welfare, the Earned Income Tax Credit, and the Labor Supply of Single Mothers.” The Quarterly Journal of Economics 116 (3): 1063–1114. https://doi.org/10.1162/00335530152466313.
Meyer, Bruce D., and Nikolas Mittag. 2019. “Using Linked Survey and Administrative Data to Better Measure Income: Implications for Poverty, Program Effectiveness, and Holes in the Safety Net.” American Economic Journal: Applied Economics 11 (2): 176–204. https://doi.org/10.1257/app.20170478.
———. 2021. “An Empirical Total Survey Error Decomposition Using Data Combination.” Journal of Econometrics 224 (2): 286–305. https://doi.org/10.1016/j.jeconom.2020.03.026.
Meyer, Bruce D., and James X. Sullivan. 2012a. “Winning the War: Poverty from the Great Society to the Great Recession.” Brookings Papers on Economic Activity Fall: 133–200.
Meyer, Bruce D, and James X. Sullivan. 2012b. “Identifying the Disadvantaged: Official Poverty, Consumption Poverty, and the New Supplemental Poverty Measure.” Journal of Economic Perspectives 26 (3): 111–36. https://doi.org/10.1257/jep.26.3.111.
Meyer, Bruce D., and Derek Wu. 2018. “The Poverty Reduction of Social Security and Means-Tested Transfers.” ILR Review 71 (5): 1106–53. https://doi.org/10.1177/0019793918790220.
Meyer, Bruce D., Derek Wu, and Brian Curran. 2021. “Does Geographically Adjusting Poverty Thresholds Improve Poverty Measurement and Program Targeting?” Working Paper.
Meyer, Bruce D., Derek Wu, Grace Finley, Patrick Langetieg, Carla Medalia, Mark Payne, and Alan Plumley. 2020. “The Accuracy of Tax Imputations: Estimating Tax Liabilities and Credits Using Linked Survey and Administrative Data.” w28229. Cambridge, MA: National Bureau of Economic Research. https://doi.org/10.3386/w28229.
Meyer, Bruce D., Derek Wu, Victoria Mooers, and Carla Medalia. 2021. “The Use and Misuse of Income Data and Extreme Poverty in the United States.” Journal of Labor Economics 39 (S1): S5–58. https://doi.org/10.1086/711227.
Meyer, Bruce D., Angela Wyse, Alexa Grunwaldt, Carla Medalia, and Derek Wu. 2021. “Learning about Homelessness Using Linked Survey and Administrative Data.” w28861. Cambridge, MA: National Bureau of Economic Research. https://doi.org/10.3386/w28861.

34
Mills, Gregory, Daniel Gubits, Larry Orr, David Long, Judie Feins, Bulbul Kaul, Michelle Wood, and Amy Jones. 2006. “Effects of Housing Vouchers on Welfare Families.” U.S. Dept. of Housing and Urban Development.
Moffitt, Robert A. 2016. “The US Safety Net and Work Incentives: Is There a Problem? What Should Be Done?” In The U.S. Labor Market: Questions and Challenges for Public Policy. American Enterprise Institute.
National Academy of Sciences. 2019. A Roadmap to Reducing Child Poverty. Edited by Greg Duncan and Suzanne Le Menestrel. Washington, D.C.: National Academies Press. https://doi.org/10.17226/25246.
Nichols, Austin, and Jesse Rothstein. 2016. “The Earned Income Tax Credit.” In Economics of Means-Tested Transfer Programs in the United States, Volume 1. National Bureau of Economic Research.
Passel, Jeffrey S., and Cohn D’Vera. 2018. “U.S. Unauthorized Immigrant Total Dips to Lowest Level in a Decade.” Pew Research Center. https://www.pewresearch.org/hispanic/2018/11/27/u-s-unauthorized-immigrant-total-dips-to-lowest-level-in-a-decade/.
Robins, Philip K. 1985. “A Comparison of the Labor Supply Findings from the Four Negative Income Tax Experiments.” The Journal of Human Resources 20 (4): 567. https://doi.org/10.2307/145685.
Schanzenbach, Diane Whitmore, and Michael Strain. 2020. “Employment Effects of the Earned Income Tax Credit: Taking the Long View.” w28041. Cambridge, MA: National Bureau of Economic Research. https://doi.org/10.3386/w28041.
Shantz, Katherine, and Liana E. Fox. 2018. “Precision in Measurement: Using State-Level Supplemental Nutrition Assistance Program and Temporary Assistance for Needy Families Administrative Records and the Transfer Income Model (TRIM3) to Evaluate Poverty Measurement.” Washington, D.C.: U.S. Census Bureau.
Sherman, Arloc, Chuck Marr, and Stephanie Hingten. 2021. “Earnings Requirement Would Undermine Child Tax Credit’s Poverty-Reducing Impact While Doing Virtually Nothing to Boost Parents’ Employment.” Center on Budget and Policy Priorities. https://www.cbpp.org/sites/default/files/9-23-21tax.pdf.
Shrider, Emily A., Melissa Kollar, Frances Chen, and Jessica Semega. 2021. “Income and Poverty in the United States: 2020.” Current Population Reports. U.S. Census Bureau.
Tax Policy Center. 2021. “Tax Policy Center Briefing Book: Key Elements of the U.S. Tax System: What Is the Child Tax Credit.” https://www.taxpolicycenter.org/briefing-book/what-child-tax-credit.
U.S. Department of Health and Human Services. n.d. “A Brief History of the AFDC Program.” https://aspe.hhs.gov/sites/default/files/private/pdf/167036/1history.pdf.
Vigil, Alma. 2019. “Trends in Supplemental Nutrition Assistance Program Participation Rates: Fiscal Year 2010 to Fiscal Year 2017.” United States Department of Agriculture. https://fns-prod.azureedge.net/sites/default/files/resource-files/Trends2010-2017.pdf.
Wagner, Deborah, and Mary Layne. 2014. “The Person Identification Validation System (PVS): Applying the Center for Administrative Records Research and Applications’ (CARRA) Record Linkage Software.” CARRA Working Paper Series #2014-01. Washington, D.C: U.S. Census Bureau. https://www.census.gov/content/dam/Census/library/working-papers/2014/adrm/carra-wp-2014-01.pdf.

35
Tables and Figures Table 1. Aggregate Recipients and Benefit Dollars for Tax Cuts and Jobs Act (TCJA) Child Tax Credit and American Families Plan (AFP) Child Tax Credit
Scenario Families (millions)
All people (millions)
Children (millions)
Spending (billions $)
(1) (2) (3) (4) 2018: TCJA CTC CID — — — 110.2 IRS SOI — — — 117.7 2022: TCJA CTC Survey-only 35.1 142.5 63.3 106.8 CID 40.7 161.2 67.3 111.8 2022: AFP CTC Survey-only 40.3 163.0 71.4 205.1 CID 43.6 171.6 71.7 213.1 2022: Difference between AFP and TCJA CTC
Survey-only 5.2 20.5 8.1 98.3 CID 2.9 10.4 4.4 101.3
Source: 2017 CPS ASEC (adjusted to 2018 or 2022 levels using changes in prices and benefits) linked to administrative IRS records, TAXSIM, 2018 IRS SOI line item totals Notes: This table shows total CTC family recipients, individual CTC recipients, and total CTC dollars paid out, calculated for various scenarios in both the CID and survey. Column 1 shows the total number of families that receive either the TCJA or AFP CTC. A family is defined as a recipient if any tax unit within the family receives the CTC. Columns 2 and 3 show the total number of people and children who receive either the TCJA or AFP CTC. An individual is defined as a recipient if they are in a family that receives the CTC. Finally, Column 4 shows total CTC dollars paid out in each scenario. The SOI total refers to the total number of non-refundable and refundable CTC dollars listed in the IRS’s 2018 Statistics of Income line item totals. The “2022: AFP CTC” scenario refers to the AFP CTC simulations, which assume 75% take-up among non-filers. Filers in the survey are defined as those who are designated as filers in the CPS. Filers in the CID are defined as individuals in tax units who meet one of the following three conditions: a) they are in a tax unit that links to a 1040, b) their survey tax unit has non-zero federal tax liability before credits after being run through TAXSIM, or c) their survey tax unit has more than $500 in federal tax credits after being run through TAXSIM. The survey-only sample consists of all individuals in the 2017 CPS ASEC. The CID sample consists of all individuals in PIKed and non-whole imputed families, with survey weights adjusted for non-PIKing and whole imputes using inverse probability weighting. The Census Bureau has reviewed this data product for unauthorized disclosure of confidential information and has approved the disclosure avoidance practices applied to this release, authorization number: CBDRB-FY2021-CES005-024.

36
Table 2. Poverty Rate in 2022 Under Tax Cuts and Jobs Act (TCJA) Child Tax Credit and American Families Plan (AFP) Child Tax Credit for Full and Child Population, Survey-Only vs. CID
Population TCJA CTC AFP CTC Change (p.p.) Change (percent) (1) (2) (3) (4) CID (Threshold for family of 4: $37,890) Full population 10.8% 9.0% -1.8 -16.7% Children under 18 13.7% 9.1% -4.6 -33.6% Survey Only (Threshold for family of 4: $33,229) Full population 11.8% 10.0% -1.8 -15.6% Children under 18 13.7% 9.1% -4.6 -33.8%
Source: 2017 CPS ASEC (adjusted to 2022 levels using changes in prices and benefits) linked to administrative IRS and program records, TAXSIM Notes: This table shows poverty reduction estimates for the CTC expansion using only the CPS ASEC and in the CID. The income concept for all estimates is post-tax, post-transfer income including all non-medical in-kind transfers, equivalized to adjust for different sharing unit sizes. The sharing unit is the family, defined as the SPM unit. The poverty threshold is equal to the 13.7th percentile of equivalized family income for all children, determined separately for the survey-only and CID simulations. The table shows thresholds for a family with two adults and two children. The TCJA CTC is the CTC under the Tax Cuts and Jobs Act. The AFP CTC is the CTC under the American Rescue Plan Act of 2021 (and proposed as part of the American Families Plan). Both the survey-only and CID-based simulations assume 75% take-up of the AFP CTC among non-filers. The survey-only sample consists of all individuals in the 2017 CPS ASEC. The CID sample consists of all individuals in PIKed and non-whole imputed families, with survey weights adjusted for non-PIKing and whole imputes using inverse probability weighting. The Census Bureau has reviewed this data product for unauthorized disclosure of confidential information and has approved the disclosure avoidance practices applied to this release, authorization number: CBDRB-FY2021-CES005-028.

37
Table 3. Regular, Deep, and Near Poverty Rate in 2022 Under Tax Cuts and Jobs Act (TCJA) Child Tax Credit and American Families Plan (AFP) Child Tax Credit by Population Subgroup, CID
Population TCJA CTC AFP CTC Change (p.p.) Change (percent) (1) (2) (3) (4) A. Deep Poverty (Threshold for family of 4: $18,945) Full population 2.3% 2.0% -0.3 -14.5% Children under 18 2.3% 1.4% -0.9 -38.8% B. Near Poverty (Threshold for family of 4: $56,835) Full population 26.6% 24.9% -1.7 -6.4% Children under 18 35.9% 32.0% -3.9 -11.0%
Source: 2017 CPS ASEC (adjusted to 2022 levels using changes in prices and benefits) linked to administrative IRS and program records, TAXSIM Notes: This table shows poverty, deep poverty, and near poverty reduction estimates (using equivalized post-tax, post-transfer CID income) for the CTC expansion for different subpopulations using the CID. This simulation assumes 75% take-up among non-filers. Our sample consists of all individuals in PIKed and non-whole imputed families, with survey weights adjusted for non-PIKing and whole imputes using inverse probability weighting. The Census Bureau has reviewed this data product for unauthorized disclosure of confidential information and has approved the disclosure avoidance practices applied to this release, authorization number: CBDRB-FY2021-CES005-028.

38
Table 4. Workers with Children Exiting the Labor Force due to Income and Substitution Effects from the CTC Expansion, by Substitution Elasticity
Single Mother EITC Recipients
Other workers 0.05 0.25 0.45
0.50 0.70 1.25 1.79 0.75 0.92 1.46 2.00 1.20 1.30 1.85 2.39
Source: 2017 CPS ASEC (adjusted to 2022 levels using changes in prices and benefits) linked to administrative IRS and program records, TAXSIM Notes: Exit due to the income effect equals 0.14 million and is not impacted by substitution elasticities. Estimates are based on simulations of the American Families Plan (AFP) Child Tax Credit (CTC) for 2022 and include labor force exits due to income and substitution effects. The substitution effect elasticities are applied to the percent decrease in return to work. Percent decrease in the return to work is the decrease in the return to work divided by the baseline return to work among currently working parents. The baseline return to work is earnings net of tax liability and reduced transfer benefits from working. The decrease in the return to work due to the CTC expansion is the change in the AFP CTC (between working and not working) minus the change in the Tax Cuts and Jobs Act (TCJA) CTC (between working and not working). The income effect estimate applies elasticities of 0.085 for single mothers receiving EITC benefits and 0.05 for other workers to the percent increase in income. The percent increase in income is the increase in CTC benefit from the TCJA to the AFP CTC divided by family post-tax and post-transfer income. A working adult with children is any adult aged 18 or over who (i) is the primary or secondary filer in a tax unit that includes at least one dependent under the age of 18 and has strictly positive earnings, and (ii) either reported working in 2016 or is the primary filer in a tax unit in which no adult reported working in 2016. Exit probabilities due to income and substitution effects are modeled additively. All workers in a tax unit are modeled as both remaining or both exiting the labor force. Our sample consists of all individuals in PIKed and non-whole imputed families, with survey weights adjusted for non-PIKing and whole imputes using inverse probability weighting. The Census Bureau has reviewed this data product for unauthorized disclosure of confidential information and has approved the disclosure avoidance practices applied to this release, authorization number: CBDRB-FY2021-CES005-028.

39
Table 5. Number of Tax Units, Adults, and Workers Facing Higher Implicit Marginal Tax Rates with the American Families Plan (AFP) Child Tax Credit—on Phase-In of Tax Cuts and Jobs Act (TCJA) Child Tax Credit—and Mean Change in Implicit Marginal Tax Rate, 2022
Workers on phase-in of TCJA CTC
Total (millions)
Number with higher implicit marginal tax
rate (millions) Mean p.p. change in
implicit marginal tax rate (1) (2) (3) Adults in tax units 246.2 14.2 14.6 Tax units 180.4 11.9 14.8 Workers in tax units 163.7 10.4 14.6
Source: 2017 CPS ASEC (adjusted to 2022 levels using change in prices and benefits) linked to administrative IRS and program records, TAXSIM Notes: Mean percentage point change in implicit marginal tax rate (column 3) is among those with a higher implicit marginal tax rate (column 2). The increase in the implicit marginal tax rate on an additional dollar of earnings in column (3) is equal to the phase-in rate of the TCJA CTC. This includes the phase-in of the ACTC, which phases in at $0.15 per dollar of earnings, and the phase-in of the non-refundable CTC, which phases in at the marginal federal income tax rate of the tax unit (generally 10% or 12% for tax units on the phase-in part of the TCJA CTC schedule). To infer the phase-in rate of the TCJA CTC, we exploit the fact that a tax unit receiving a strictly positive but less than maximum amount of a particular credit will receive more of that credit if its earnings increase by an additional dollar (with the exception of those tax units on the phase-out portion of the TCJA CTC). The increase in the implicit marginal tax rate on an additional dollar of earnings in column (5) is equal to the phase-out rate of the incremental CTC, $0.05 per dollar of earnings. Tax units receiving, under the AFP CTC, strictly more than the previous maximum benefit but strictly less than the new maximum benefit are considered impacted. See Appendix D for further details. Our sample consists of all individuals in PIKed and non-whole imputed families, with survey weights adjusted for non-PIKing and whole imputes using inverse probability weighting. The Census Bureau has reviewed this data product for unauthorized disclosure of confidential information and has approved the disclosure avoidance practices applied to this release, authorization number: CBDRB-FY2021-CES005-024.

40
Table 6. Poverty and Deep Poverty Rate in 2022 Under Tax Cuts and Jobs Act (TCJA) Child Tax Credit and American Families Plan (AFP) Child Tax Credit for Full and Child Population, Dynamic Simulation, CID
Dynamic Simulation Static
Simulation
Population Rate Under TCJA CTC
Rate Under Expanded
CTC Change (p.p.)
Change (percent)
Change (percent)
(1) (4) (5) (6) (7) A. Poverty (Threshold for family of 4: $37,890) Full population 10.8% 9.7% -1.1 -10.1% -16.7% Children under 18 13.7% 10.8% -3.0 -21.5% -33.6% B. Deep Poverty (Threshold for family of 4: $18,945) Full population 2.3% 2.4% 0.1 2.6% -14.5% Children under 18 2.3% 2.3% 0.0 0.6% -38.8% C. Near Poverty (Threshold for family of 4: $56,835) Full population 26.6% 25.4% -1.2 -4.6% -6.4% Children under 18 35.9% 33.0% -2.9 -8.0% -11.0%
Source: 2017 CPS ASEC (adjusted to 2022 levels using changes in prices and benefits) linked to administrative IRS and program records, TAXSIM Notes: Dynamic estimates are based on simulations of the AFP Child Tax Credit (CTC) for 2022 and include labor force exits due to income and substitution effects. The substitution effect elasticities are applied to the percent decrease in return to work. Percent decrease in the return to work is the decrease in the return to work divided by the baseline return to work among currently working parents. The baseline return to work is earnings net of tax liability and reduced transfer benefits from working. The decrease in the return to work due to the Child Tax Credit expansion is the change in the AFP CTC (between working and not working) minus the change in the TCJA CTC (between working and not working). The income effect estimate applies elasticities of 0.085 for single mothers receiving EITC benefits and 0.05 for other workers to the percent increase in income. The percent increase in income is the increase in CTC benefit from the TCJA to the AFP CTC divided by family post-tax and post-transfer income. A working adult with children is any adult aged 18 or over who (i) is the primary or secondary filer in a tax unit that includes at least one dependent under the age of 18 and has strictly positive earnings, and (ii) either reported working in 2016 or is the primary filer in a tax unit in which no adult reported working in 2016. Exit probabilities due to income and substitution effects are modeled additively. All workers in a tax unit are modeled as both remaining or both exiting the labor force. We adjust tax liabilities and Supplemental Nutrition Assistance Program benefits for workers exiting the labor force. Our sample consists of all individuals in PIKed and non-whole imputed families, with survey weights adjusted for non-PIKing and whole imputes using inverse probability weighting. The Census Bureau has reviewed this data product for unauthorized disclosure of confidential information and has approved the disclosure avoidance practices applied to this release, authorization number: CBDRB-FY2021-CES005-028.

41
Figure 1. Child Tax Credit Under Tax Cuts and Jobs Act (TCJA) and American Families Plan (AFP), Single Parent with Two Children (One Aged 0-5 and Another Aged 6-16)
Source: Internal Revenue Service, U.S. Department of Agriculture Notes: The TCJA CTC is the CTC under the Tax Cuts and Jobs Act. The AFP CTC is the CTC under the American Rescue Plan Act of 2021. Incremental CTC is the difference in benefits a family receives between the AFP CTC and TCJA CTC. All adjusted gross income is assumed to come from earned income, and the family is assumed to take the standard deduction and claim no other non-refundable tax credits. For Supplemental Nutrition Assistance Program (SNAP) benefits, the family is assumed to take the standard deduction only. Benefit levels are based on 2021 rules.
0
1
2
3
4
5
6
7
0 10 20 30 40 50 60Adjusted Gross Income (Thousands $)
AFP Child Tax Credit
TCJA Child Tax Credit
Benefit Amount (Thousands $)

42
Figure 2. Tax Cuts and Jobs Act Child Tax Credit and Earned Income Tax Credit by Adjusted Gross Income Using 2020 Parameters, Single Parent with Two Children Under Age 17
Source: Internal Revenue Service, Congressional Research Service Notes: Child Tax Credit (CTC) and Earned Income Tax Credit (EITC) parameters are based on 2020 tax law (all dollar values expressed in 2020 nominal terms). The refundable CTC phases in at a 15% rate because it is calculated as 15% times the difference between earnings and $2,500, up to a maximum of $1,400 per dependent child. The non-refundable CTC phases in at a 10% rate because it is a non-refundable credit and thus phases in at the federal marginal tax rate once Adjusted Gross Income is sufficiently high to generate a positive tax liability. The CTC as a whole phases in at a 25% rate when the refundable portion of the CTC and non-refundable portion of the CTC phase in simultaneously. All adjusted gross income is assumed to come from earned income, and the family is assumed to take the standard deduction and claim no other non-refundable tax credits.
$5,920
$4,000
Adjusted Gross Income
TCJA Child Tax Credit
Earned Income Tax Credit
$0 $2,500 $14,800 $19,330 $30,300
Credit amount
$47,440

43
Figure 3. Mean Percent Decrease in the Return to Work Due to Child Tax Credit Expansion and Elimination of the Earned Income Tax Credit, and Number of Workers with Children, by Tax Unit Earnings
Source: 2017 CPS ASEC (adjusted to 2022 levels using changes in prices and benefits) linked to administrative IRS and program records, TAXSIM Notes: Estimates in the top panel are based on simulations of the proposed CTC expansion for 2022 and the elimination of the EITC as it is defined by current law. Percent decrease in the return to work is the decrease in the return to work divided by the baseline return to work among currently working parents. The baseline return to work is earnings net of tax liability and reduced transfer benefits from working. The decrease in the return to work due to the CTC expansion is the change in the AFP CTC (between working and not working) minus the change in the TCJA CTC (between working and not working). The change in the return to work due to the elimination of the EITC is the EITC benefit itself. A working adult with children is any adult aged 18 or over who (i) is the primary or secondary filer in a tax unit that includes at least one dependent under the age of 18 and has strictly positive earnings, and (ii) either reported working in 2016 or is the primary filer in a tax unit in which no adult reported working in 2016. Tax unit earnings are reported in $10,000 bins. Our sample consists of all individuals in PIKed and non-whole imputed families, with survey weights adjusted for non-PIKing and whole imputes using inverse probability weighting. The Census Bureau has reviewed this data product for unauthorized disclosure of confidential information and has approved the disclosure avoidance practices applied to this release, authorization number: CBDRB-FY2021-CES005-028.
0%
5%
10%
15%
20%
25%
30%
35%
0-10 10-20 20-30 30-40 40-50 50-60 60-70 70-80 80-90 90-100Tax Unit Annual Earnings (thousands $)
Child Tax Credit (CTC) Expansion
Elimination of the Earned Income Tax Credit (EITC)
Percent decrease in return to work
0
1
2
3
4
5
6
0-10 10-20 20-30 30-40 40-50 50-60 60-70 70-80 80-90 90-100Tax Unit Annual Earnings (thousands $)
Workers with children (millions)

44
Figure 4a. Percent Increase in Child Poverty in Absence of Given Program, Survey-Only vs. CID
Figure 4b. Percent Increase in Poverty in Absence of Given Program, Survey-Only vs. CID
Source: 2017 CPS ASEC (adjusted to 2022 levels using changes in prices and benefits) linked to administrative IRS and program records, TAXSIM Notes: Baseline income is equivalized post-tax, post-transfer income including the AFP CTC. Both the survey-only and CID-based simulations assume 75% take-up of the AFP CTC among non-filers. The poverty threshold for a family of four (two adults and two children) is $37,890 in the CID and $33,229 in the survey only. Effects are calculated as the percent change in the poverty rate if the program were removed. For the CID-based simulation, we drop non-PIKed and whole imputed families in the CPS, adjusting survey weights using inverse probability weighting. For the survey-only simulation, our sample consists of all individuals in the 2017 CPS ASEC. The Census Bureau has reviewed this data product for unauthorized disclosure of confidential information and has approved the disclosure avoidance practices applied to this release, authorization number: CBDRB-FY2021-CES005-028.

45
Figure 5. Share of Total Program Dollars Received by Decile of Annual Income, CID
Source: 2017 CPS ASEC (adjusted to 2022 levels using changes in prices and benefits) linked to administrative IRS and program records, TAXSIM. Notes: This figure shows shares of total program dollars received by each decile of annual family income (after taxes/non-medical in-kind transfers and including the American Families Plan (AFP) CTC). Baseline incomes are equivalized to account for different family sizes. Administrative data are used for all programs. Baseline income and the incremental and AFP CTC use the CID-based CTC expansion simulation with assumed 75% take-up among non-filers. SNAP estimates are calculated using the subset of states for which administrative SNAP data are available. We drop non-PIKed and whole imputed families in the CPS, adjusting survey weights using inverse probability weighting. The Census Bureau has reviewed this data product for unauthorized disclosure of confidential information and has approved the disclosure avoidance practices applied to this release, authorization number: CBDRB-FY2021-CES005-028.

46
Figure 6. Share of Total Program Dollars Received by Decile of 5-Year Income, CID
Source: 2017 CPS ASEC (adjusted to 2022 levels using changes in prices and benefits) linked to administrative IRS and program records, TAXSIM. Notes: This figure shows shares of total program dollars received by each decile of 5-year income. 5-year income is the sum of income on tax forms (AGI on 1040 for filers and wages/retirement-income from W-2 and 1099-R for non-filers) from 2014-2018. Baseline incomes are equivalized to account for different family sizes. Administrative data are used for all programs. Baseline income and the incremental and American Families Plan (AFP) CTC use the CID-based AFP CTC simulation with assumed 75% take-up among non-filers. SNAP estimates are calculated using the subset of states for which administrative SNAP data are available. We drop non-PIKed and whole imputed families in the CPS, adjusting survey weights using inverse probability weighting. The Census Bureau has reviewed this data product for unauthorized disclosure of confidential information and has approved the disclosure avoidance practices applied to this release, authorization number: CBDRB-FY2021-CES005-024.
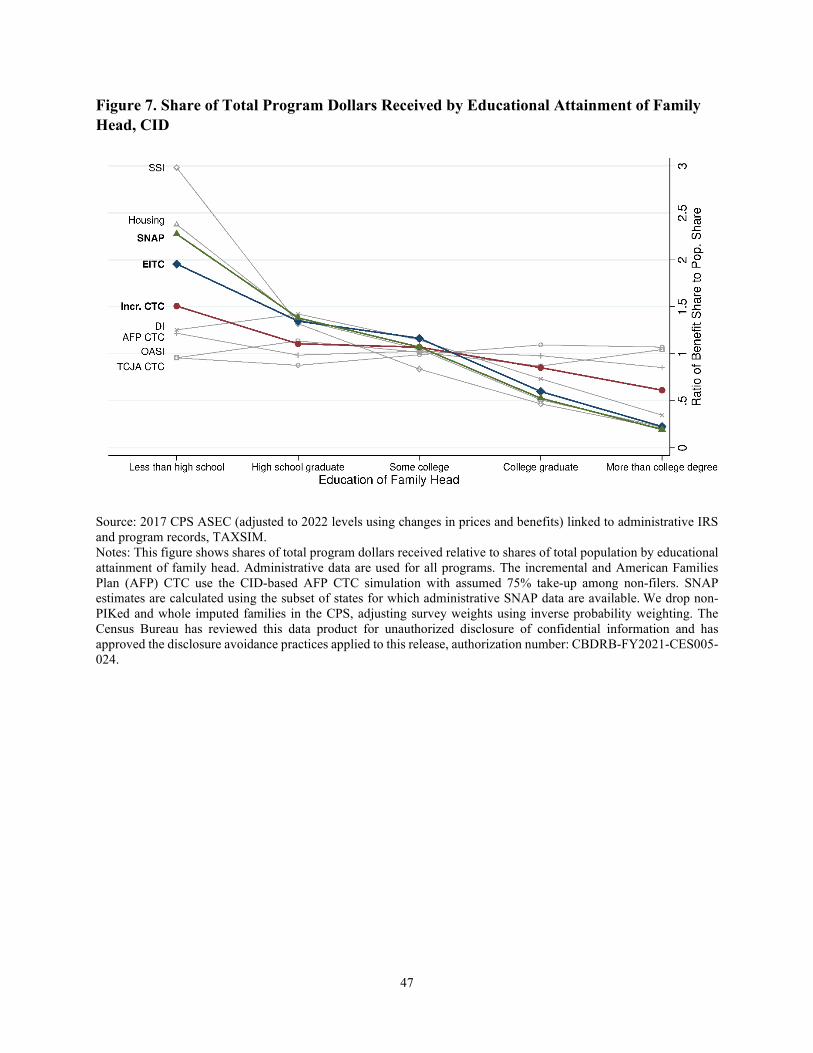
47
Figure 7. Share of Total Program Dollars Received by Educational Attainment of Family Head, CID
Source: 2017 CPS ASEC (adjusted to 2022 levels using changes in prices and benefits) linked to administrative IRS and program records, TAXSIM. Notes: This figure shows shares of total program dollars received relative to shares of total population by educational attainment of family head. Administrative data are used for all programs. The incremental and American Families Plan (AFP) CTC use the CID-based AFP CTC simulation with assumed 75% take-up among non-filers. SNAP estimates are calculated using the subset of states for which administrative SNAP data are available. We drop non-PIKed and whole imputed families in the CPS, adjusting survey weights using inverse probability weighting. The Census Bureau has reviewed this data product for unauthorized disclosure of confidential information and has approved the disclosure avoidance practices applied to this release, authorization number: CBDRB-FY2021-CES005-024.

48
Figure 8. Share of Total Program Dollars Received by Health Status of Family Head, CID
Source: 2017 CPS ASEC (adjusted to 2022 levels using changes in prices and benefits) linked to administrative IRS and program records, TAXSIM. Notes: This figure shows shares of total program dollars received relative to shares of total population by self-reported health status of family head. Administrative data are used for all programs. The incremental and American Families Plan (AFP) CTC use the CID-based AFP CTC simulation with assumed 75% take-up among non-filers. SNAP estimates are calculated using the subset of states for which administrative SNAP data are available. We drop non-PIKed and whole imputed families in the CPS, adjusting survey weights using inverse probability weighting. The Census Bureau has reviewed this data product for unauthorized disclosure of confidential information and has approved the disclosure avoidance practices applied to this release, authorization number: CBDRB-FY2021-CES005-024.

49
Appendix Tables and Figures Table A1. Provisions of the Child Tax Credit Under the Tax Cuts and Jobs Act and the American Families Plan
Tax Cuts and Jobs Act American Families Plan Dependents who qualify for the full credit
Dependent children aged 0-16 Dependent children aged 0-17
Maximum amount of full credit
$2,000 per qualifying dependent $3,600 (age 0-5), $3,000 (age 6-17) per qualifying dependent
Non-refundable portion of credit
Federal income tax liability (after previous non-refundable credits applied) up to $2,000 per qualifying dependent
None
Refundable portion of the credit
15% of earned income above $2,500, up to $1,400 per qualifying dependent
$3,600 (age 0-5), $3,000 (age 6-17) per qualifying dependent
Adjusted Gross Income level where benefits begin to phase out
$200,000 (single/head of household filers); $400,000 (married filing jointly)
Phase out 1: $75,000 (single); $112,500 (head of household); $150,000 (married filing jointly) Phase out 2: $200,000 (single/head of household filers); $400,000 (married filing jointly)
Phase out rate 5% Phase out 1: 5%, until per-child credit reaches $2,000 per qualifying dependent Phase out 2: 5%, until credit reaches $0
Provisions of the Credit for Other Dependents (ODC)
Applied to dependents who do not qualify for full credit, maximum credit of $500 per dependent, phased out at 5% rate beginning at $200,000 (single/head of household filers), $400,000 (married filing jointly)
Same as under TCJA CTC
Source: IRS (2021a); IRS (2021b) Notes: Tax Cuts and Jobs Act (TCJA) Child Tax Credit (CTC) is the CTC applicable to tax year 2020. American Families Plan (AFP) CTC is the CTC applicable to tax year 2021, as specified by the American Rescue Plan Act of 2021. Non-refundable portion of the Tax Cuts and Jobs Act CTC is applied after the Child and Dependent Care Tax Credit and the Credit for Other Dependents (see https://www.irs.gov/irm/part21/irm_21-006-003r). See Tax Policy Center (2021) for a description of the TCJA CTC and AFP CTC.

50
Table A2. Rules Used to Update Various Income Sources to 2022 Levels
Income source How updated for 2022 Justification (1) (2) Market income Annual average in C-CPI-U C-CPI-U used to update tax
brackets each year OASDI and SSI Annual average CPI-W CPI-W used to update OASDI
and SSI benefits each year VA benefits Percent change in maximum benefit for veteran with
no dependents, given 50% disability rating Update based on maximum benefit
SNAP Percent change in maximum benefit for 3-person family (separate multipliers for AK and HI), disregarding the 2020 emergency increase in maximum benefits due to pandemic benefits set to expire in September 2021
Update based on maximum benefit
Housing assistance Percent change in county-level Fair Market Rent for 2-bedroom housing unit
Benefit amount tied to payment standard in county which is itself based on Fair Market Rent
TANF State-level change in maximum benefits for 3-person family
Update based on state-specific maximum benefit
School lunch Percent change in reimbursement rate for free school lunch (separate multipliers for AK and HI)
Update based on reimbursement rate
LIHEAP Percent change in Census region-level average utility gas prices in urban areas
Benefit amount tied to actual costs of utilities
WIC Percent change in average monthly person-level WIC food costs
Update based on change in benefit
Source: C-CPI-U (2016-2020), CPI-W (2016-2020), USDA SNAP maximum benefit amounts (2016-2020), Average WIC food costs (2016-2020), USDA School Lunch Reimbursement Rates (2016-2021), HHS TANF maximum benefit amounts (2016-2019), VA maximum benefit amounts (2016-2020), HUD fair market rents (2016-2021), BLS average utility gas prices (2016-2020) Notes: Market incomes, OASDI/SSI, VA benefits, SNAP, WIC, and LIHEAP are updated based on the change in their respective indices between 2016 and 2020, with the 2020-2021 and 2021-2022 increases assumed to be equal to average annual increase from 2016 to 2020. For SNAP, we only update through 2020 because the 2021 amounts reflect temporary increases in SNAP allotment as a result of pandemic-related policy changes. School lunch and housing assistance are updated based on the change in their respective indices between 2016 and 2021, with the 2021-2022 increases assumed to be equal to the average annual increase from 2016 to 2021. For TANF, we update based on state-level changes in the relevant index between 2016 and 2019, with the 2019-2020, 2020-2021, and 2021-2022 increases assumed to be equal to the average annual increase from 2016 to 2019 at the national level (we use the change in the national average weighted by state population to mitigate carrying through potentially one-off state-level policy changes).

51
Table A3. Simulations of the American Families Plan Child Tax Credit and Related Policies: Comparisons to the Literature
Study Survey data
source Modifications of data source Simulated policy Simulation year
Baseline child poverty rate
% Effect on child poverty
Non-filer take-up
Use SPM
(1) (2) (3) (4) (5) (6) (7) (8) Our paper: CID 2017 CPS
ASEC Link tax records & admin government program data
Fully refundable CTC with $3,600 for children age 0-5 and $3,000 for children age 6-17
2022 (2018 tax law and update income values to 2022)
15.3% 33.6% 75% No
Our paper: survey-only
2017 CPS ASEC
None (Same as above) 2022 (2018 tax law and update income values to 2022)
13.7% 33.8% 75% No
Acs and Werner (2021)
2018 ACS ATTIS model (Same as above) 2018 14.2% 41.3% 78% Yes
Brill et al. (2021) 2020 CPS ASEC
Not stated (Same as above) Not stated 12.4% 35% Not stated Yes
CRS (2021) 2016-2018 CPS ASEC
TRIM model (Same as above) 2015-2017 (TCJA tax law)
13% 46% 100% Yes
Marr et al. (2021)
2019 CPS ASEC
None (Same as above) 2021 (2021 tax law and inflate incomes to 2021)
13.7%* 41% 100% Yes
Collyer et al (2019)
2018 CPS ASEC
None Fully refundable CTC with $3,600 for children age 0-5 and $3,000 for children age 6-16
2018 14.9%** 38%** 100% Yes
Collyer et al (2021)
2019 CPS ASEC
None American Families Plan 2022 (updates employment)
14.7% 47.4% 100% Yes
*Baseline child poverty rate is not reported in Marr et al. (2021). The rate is calculated based on the reported 41% reduction in child poverty and 4.1 million children lifted out of poverty, which implies a baseline of 10 million children in poverty, or 13.7% given the reported 72.993 million children in the U.S. according to Marr et al. (2021). **Poverty rate among children aged 0 to 16 only. Notes: ATTIS model is the Urban Institute’s Analysis of Transfers, Taxes, and Income Security model. TRIM model is the Transfer Income Model developed by the Urban Institute for the U.S. Department of Housing and Urban Development. American Families Plan includes fully refundable CTC with $3,600 for children age 0-5 and $3,000 for children age 6-17; expansion of the EITC for childless workers; expansion of child care subsidies, expansion of the Child and Dependent Care Tax Credit, expansion of the Summer Electronic Benefit Transfer Program; and expansion of Pell Grant awards. The Census Bureau has reviewed this data product for unauthorized disclosure of confidential information and has approved the disclosure avoidance practices applied to this release, authorization number: CBDRB-FY2021-CES005-024.

52
Table A4. Aggregate Recipients and Dollars for American Families Plan (AFP) Child Tax Credit and Change in Child Poverty Rate (Varying Take-Up Rates Among Non-Filers), CID
Non-Filer Take-Up Rate
Number of Children Receiving AFP CTC
(millions) Total Spending on AFP
CTC (billions $) Percent Change in
Child Poverty (1) (2) (3)
0% 69.1 201.0 -29.9% 25% 70.3 205.2 -31.0% 50% 71.1 209.2 -32.4% 75% 71.7 213.1 -33.6%
100% 72.3 217.1 -35.5% Source: 2017 CPS ASEC (adjusted to 2022 levels using changes in prices and benefits) linked to administrative IRS and program records, TAXSIM Notes: This table shows the total number of children receiving the AFP CTC, total AFP CTC spending, and percent change in child poverty under different assumptions of the take-up rate for non-filers. A child is defined as receiving the AFP CTC if they reside in a family where at least one tax unit within the family receives the AFP CTC. Filers are defined as individuals in tax units who meet one of the following three conditions: a) they are in a tax unit that links to a 1040, b) their survey tax unit has non-zero federal tax liability before credits after being run through TAXSIM or c) their survey tax unit has more than $500 in federal tax credits after being run through TAXSIM. The poverty threshold for a family of four is $37,890. Our sample consists of all individuals in PIKed and non-whole imputed families, with survey weights adjusted for non-PIKing and whole imputes using inverse probability weighting. The Census Bureau has reviewed this data product for unauthorized disclosure of confidential information and has approved the disclosure avoidance practices applied to this release, authorization number: CBDRB-FY2021-CES005-024 and CBDRB-FY2021-CES005-028.

53
Table A5. Survey-Only Child Poverty Effects of the American Families Plan Child Tax Credit Based on Assumptions in Comparison Studies
Percent change in child
poverty
Comparison study Subtract expenses
SPM thresholds
100% take-up?
Income adjusted to future year?
Our analysis
Comparison study
(1) (2) (3) (4) (5) (6) Survey-only No No No Yes -34% Survey-only w/ SPM Yes Yes No Yes -34% Acs and Werner (2018) Yes Yes No No -39% -41% CRS (2021) Yes Yes Yes No -44% -46% Marr et al. (2021) Yes Yes Yes Yes -38% -41%
Source: 2017 CPS ASEC (adjusted to 2022 levels using change in prices and benefits), TAXSIM Notes: Survey-only refers to our survey-only simulation. Survey-only with SPM refers to our survey-only simulation when subtracting expenses from income and using the SPM thresholds. Expenses subtracted in column (1) include work and childcare expenditures, child support paid, and medical out-of-pocket and Medicare Part B expenditures. SPM thresholds in column (2) are obtained by scaling SPM thresholds included in the CPS ASEC by a constant multiple such that the child poverty rate matches the baseline rate in the published study as reported in Appendix Table A4. We use 2016 income values in comparisons with studies that do not adjust incomes for price and benefit changes and our 2022 income values in comparisons with studies that do adjust for a later year. Thus, income years do not match exactly in these comparisons. We do not compare our results to Brill et al. (2021) because they do not state their take-up rate and whether or not income is adjusted for a future year.

54
Table A6. Percent Increase in Poverty in Absence of Given Program, Survey-Only vs. CID
Program Spending (billions $) Percent increase in Poverty
All Families Families with
Children Full Population Children (1) (2) (3) (4) CID Incremental CTC 101.3 101.3 20.1% 50.7% AFP CTC 213.1 209.5 35.7% 89.2% TCJA CTC 111.8 108.2 12.5% 30.1% EITC 73.1 58 19.4% 41.8% SSI 53.9 18.8 10.7% 11.0% OASDI 958.8 82.5 75.0% 22.1% OASI 814.1 51.1 56.6% 10.6% DI 144.8 31.3 18.7% 11.5% SNAP 54.6 34.6 15.7% 33.1% Housing Assistance 72.6 27.5 15.3% 16.4% Survey Only Incremental CTC 98.4 97.9 18.4% 51.1% AFP CTC 205.1 203.3 29.4% 80.6% TCJA CTC 106.8 105.4 5.3% 12.8% EITC 48.5 44.6 14.6% 35.3% Public Assistance 7.7 5.9 1.8% 4.2% SSI 55.6 13 8.8% 6.6% OASDI 859.8 64 76.4% 19.4% OASI 744.1 42.3 61.9% 10.8% DI 115.7 21.7 14.2% 8.3% SNAP 34.7 21.5 11.3% 21.6% Housing Assistance 30.6 15 9.2% 14.9%
Source: 2017 CPS ASEC (adjusted to 2022 levels using changes in prices and benefits) linked to administrative IRS and program records, TAXSIM Notes: Effects are calculated as the percent change in the poverty rate (using equivalized post-tax, post-transfer income) if the program were removed. The poverty threshold is $37,890 in the CID and $33,229 in the survey only. For the CID-based simulation, we drop non-PIKed and whole imputed families in the CPS, adjusting survey weights using inverse probability weighting. For the survey-only simulation, our sample consists of all individuals in the 2017 CPS ASEC. The Census Bureau has reviewed this data product for unauthorized disclosure of confidential information and has approved the disclosure avoidance practices applied to this release, authorization number: CBDRB-FY2021-CES005-024 and CBDRB-FY2021-CES005-028.

55
Table A7. Cost per Individual Lifted out of Poverty by Program, CID
Spending (billions $) Cost per Individual Lifted out of
Poverty
Program All families Families with
children Full Population Children Incremental CTC 101.3 101.3 $17,602 $29,680 AFP CTC 213.1 209.5 $20,836 $34,896 TCJA CTC 111.8 108.2 $31,126 $53,345 EITC 73.1 58 $13,168 $20,636 SSI 53.9 18.8 $17,575 $25,504 OASDI 958.8 82.5 $44,579 $55,579 OASI 814.1 51.1 $50,145 $71,746 DI 144.8 31.3 $26,962 $40,431 SNAP 54.6 34.6 $12,312 $15,655 Housing Assistance 72.6 27.5 $16,583 $24,863
Source: 2017 CPS ASEC (adjusted to 2022 levels using changes in prices and benefits) linked to administrative IRS and program records, TAXSIM Notes: Effects are calculated as the percent change in the poverty rate (using equivalized post-tax, post-transfer income) if the program were removed. The poverty threshold is $37,890 in the CID and $33,229 in the survey only. For the CID-based simulation, we drop non-PIKed and whole imputed families in the CPS, adjusting survey weights using inverse probability weighting. For the survey-only simulation, our sample consists of all individuals in the 2017 CPS ASEC. To estimate the cost per individual lifted out of poverty, we divide program spending by the number of individuals added to poverty if the program were removed. For the cost per child lifted out of poverty, we use program spending on families with children. The Census Bureau has reviewed this data product for unauthorized disclosure of confidential information and has approved the disclosure avoidance practices applied to this release, authorization number: CBDRB-FY2021-CES005-024 and CBDRB-FY2021-CES005-028.

56
Figure A1. Decrease in the Return to Work due to the Child Tax Credit Expansion Compared to the Elimination of the Earned Income Tax Credit, Single Parent with Two Children Ages 5 and 10
Source: Internal Revenue Service, Congressional Research Service Notes: Figure shows the decrease in the return from work due to the CTC expansion for a hypothetical single parent with two children and no unearned income. The decrease in the return to work is equal to the incremental CTC benefit (the AFP CTC minus the TCJA CTC) when not working minus the incremental CTC benefit when working. For example, if the parent does not work, she receives $6,600 under the AFP CTC, which is $6,600 more than her TCJA CTC of $0. If she works and earns less than $30,500, her return to work falls by less than $4,000 due to the phase-in of the TCJA CTC. If she works and earns between $30,500 and $112,500, her return falls by $4,000, the amount of her TCJA CTC. If she works and earns between $112,500 and $164,500, her return to work falls by more than $4,000 because the incremental CTC begins to phase out. If she works and earns more than $164,500, her return to work falls by $6,600 because the incremental CTC has fully phased out. The decrease in the return to work due to the elimination of the EITC is equal to the EITC benefit itself.
0
1
2
3
4
5
6
7
0 25 50 75 100 125 150 175Tax Unit Earnings (Thousands $)
CTC expansion
Elimination of EITC
Decrease in Return to Work (Thousands $)
$30,500 $112,500 $164,500

57
Figure A2. Sign-Up Website for Child Tax Credit under American Rescue Plan Act
Source: Internal Revenue Service, accessed at <irs.gov/credits-deductions/child-tax-credit-non-filer-sign-up-tool> on September 5, 2021

58
Figure A3. Share of Total Program Dollars Received by Decile of Annual Income, Survey-Only
Source: 2017 CPS ASEC (adjusted to 2022 levels using changes in prices and benefits), TAXSIM. Notes: This figure shows shares of total program dollars received by each decile of annual family income (after taxes/non-medical in-kind transfers and including the AFP CTC). Baseline incomes are equivalized to account for different family sizes. Baseline income and the incremental and AFP CTC use the survey-based AFP CTC simulation with assumed 75% take-up among non-filers. Our sample consists of all individuals in the 2017 CPS ASEC.
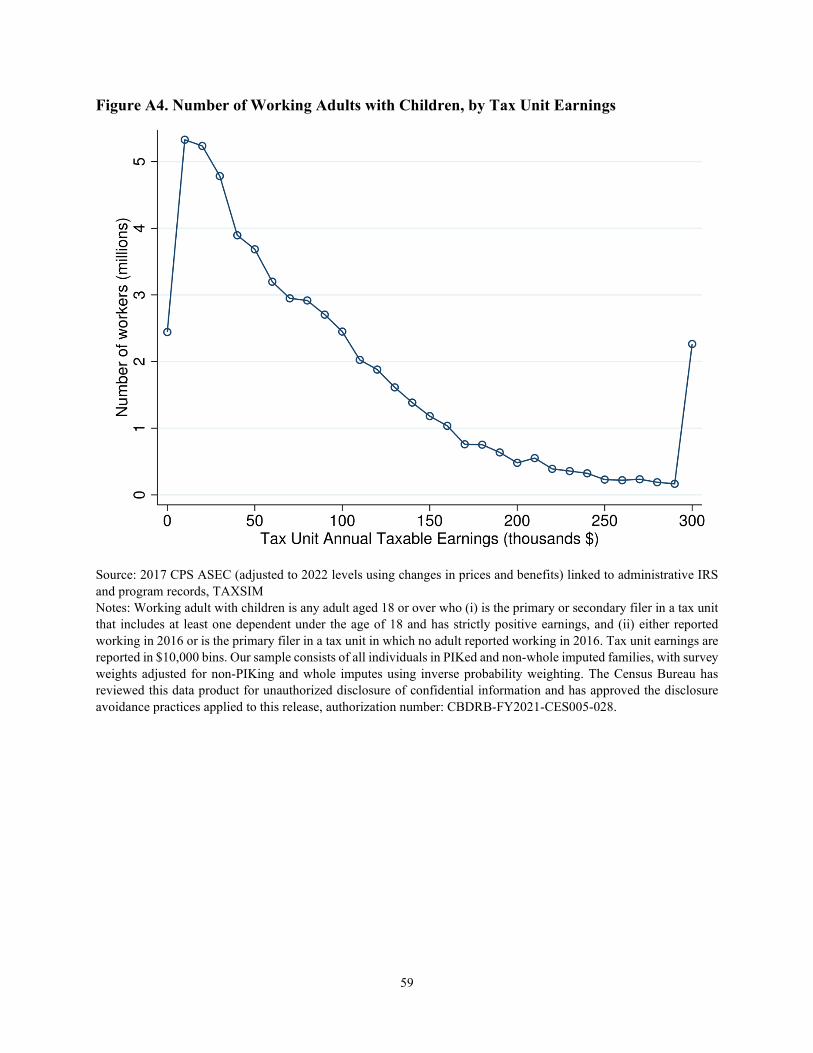
59
Figure A4. Number of Working Adults with Children, by Tax Unit Earnings
Source: 2017 CPS ASEC (adjusted to 2022 levels using changes in prices and benefits) linked to administrative IRS and program records, TAXSIM Notes: Working adult with children is any adult aged 18 or over who (i) is the primary or secondary filer in a tax unit that includes at least one dependent under the age of 18 and has strictly positive earnings, and (ii) either reported working in 2016 or is the primary filer in a tax unit in which no adult reported working in 2016. Tax unit earnings are reported in $10,000 bins. Our sample consists of all individuals in PIKed and non-whole imputed families, with survey weights adjusted for non-PIKing and whole imputes using inverse probability weighting. The Census Bureau has reviewed this data product for unauthorized disclosure of confidential information and has approved the disclosure avoidance practices applied to this release, authorization number: CBDRB-FY2021-CES005-028.

60
Figure A5. Mean Decrease in the Return to Work due to the Child Tax Credit Expansion Among Working Adults with Children, by Tax Unit Earnings
Source: 2017 CPS ASEC (adjusted to 2022 levels using changes in prices and benefits) linked to administrative IRS and program records, TAXSIM. Notes: The decrease in the return to work due to the Child Tax Credit expansion is the change in the American Families Plan CTC (between working and not working) minus the change in the Tax Cuts and Jobs Act CTC (between working and not working). Working adult with children is any adult aged 18 or over who (i) is the primary or secondary filer in a tax unit that includes at least one dependent under the age of 18 and has strictly positive earnings, and (ii) either reported working in 2016 or is the primary filer in a tax unit in which no adult reported working in 2016. Tax unit earnings are reported in $10,000 bins. Our sample consists of all individuals in PIKed and non-whole imputed families, with survey weights adjusted for non-PIKing and whole imputes using inverse probability weighting. The Census Bureau has reviewed this data product for unauthorized disclosure of confidential information and has approved the disclosure avoidance practices applied to this release, authorization number: CBDRB-FY2021-CES005-028.

61
Figure A6. Mean Decrease in the Return to Work due to the Child Tax Credit Expansion as a Share of the Return to Work Under Tax Cuts and Jobs Act Child Tax Credit Among Working Adults with Children, by Tax Unit Earnings
Source: 2017 CPS ASEC (adjusted to 2022 levels using changes in prices and benefits) linked to administrative IRS and program records, TAXSIM. Notes: Figure shows the mean of the ratios of the decrease in return to work to baseline return to work. The decrease in the return to work due to the Child Tax Credit (CTC) expansion is the change in the American Families Plan CTC (between working and not working) minus the change in the Tax Cuts and Jobs Act CTC (between working and not working). The baseline return to work is earnings net of tax liability and reduced transfer benefits from working. Working adult with children is any adult aged 18 or over who (i) is the primary or secondary filer in a tax unit that includes at least one dependent under the age of 18 and has strictly positive earnings, and (ii) either reported working in 2016 or is the primary filer in a tax unit in which no adult reported working in 2016. Tax unit earnings are reported in $10,000 bins. Our sample consists of all individuals in PIKed and non-whole imputed families, with survey weights adjusted for non-PIKing and whole imputes using inverse probability weighting. The Census Bureau has reviewed this data product for unauthorized disclosure of confidential information and has approved the disclosure avoidance practices applied to this release, authorization number: CBDRB-FY2021-CES005-028.

62
Figure A7. Number of Working Adults with Children Exiting Labor Force due to Child Tax Credit Expansion, by Tax Unit Earnings
Source: 2017 CPS ASEC (adjusted to 2022 levels using changes in prices and benefits) linked to administrative IRS and program records, TAXSIM. Notes: Estimates are based on simulations of the proposed Child Tax Credit (CTC) expansion for 2022. The substitution effect estimates apply elasticities of 0.75 for single mothers receiving EITC benefits and 0.25 for other workers to percent decrease in the return to work. Percent decrease in the return to work is the decrease in the return to work divided by the baseline return to work among currently working parents. The baseline return to work is earnings net of tax liability and reduced transfer benefits from working. The decrease in the return to work due to the CTC expansion is the change in the American Families Plan (AFP) CTC (between working and not working) minus the change in the Tax Cuts and Jobs Act (TCJA) CTC (between working and not working). The income effect estimates apply elasticities of 0.085 for single mothers receiving EITC benefits and 0.05 for other workers to the percent increase in income. The percent increase in income is the increase in CTC benefits from the TCJA to the AFP CTC divided by family post-tax and post-transfer income. A working adult with children is any adult aged 18 or over who (i) is the primary or secondary filer in a tax unit that includes at least one dependent under the age of 18 and has strictly positive earnings, and (ii) either reported working in 2016 or is the primary filer in a tax unit in which no adult reported working in 2016. Exit probabilities due to income and substitution effects are modeled additively. All workers in a tax unit are modeled as both remaining or both exiting the labor force. Our sample consists of all individuals in PIKed and non-whole imputed families, with survey weights adjusted for non-PIKing and whole imputes using inverse probability weighting. The Census Bureau has reviewed this data product for unauthorized disclosure of confidential information and has approved the disclosure avoidance practices applied to this release, authorization number: CBDRB-FY2021-CES005-028.

63
Figure A8. Incremental Child Tax Credit and Total Supplemental Nutrition Assistance Program Benefit, Single Parent with Two Children (One Aged 0-5 and Another Aged 6-16)
Source: Internal Revenue Service, U.S. Department of Agriculture Notes: The TCJA CTC is the CTC under the Tax Cuts and Jobs Act. The AFP CTC is the CTC under the American Rescue Plan Act of 2021. Incremental CTC is the difference in benefits a family receives between the AFP CTC and TCJA CTC. All adjusted gross income is assumed to come from earned income, and the family is assumed to take the standard deduction and claim no other non-refundable tax credits. For Supplemental Nutrition Assistance Program (SNAP) benefits, the family is assumed to take the standard deduction only. Benefit levels are based on 2021 rules.

64
Appendix A This appendix describes how we allocate CTC benefits to families, with a focus on the less straightforward case of complex families—where surveyed adults claim children outside of the surveyed adult’s family, and where surveyed children are claimed by adults outside of the surveyed child’s family. Our approach for allocating the CTC in general (both in non-complex families and complex families) can be outlined as follows: 1. In the most straightforward cases, the survey children include all of those listed on the
returns of the adults either in or outside the family. In that case, all CTC dollars go to the children in question.
2. In the case when one or more of the tax returns includes children not in the surveyed family, the CTC must be prorated so that only part of the credit is allocated to the children in the surveyed family.
3. Surveyed dependents who do not appear on any 1040 are assumed to receive the CTC if there is a survey adult to claim them. We assume that the AFP CTC can be received by children who do not appear on a 1040 even if there is no survey adult to claim them.
The remainder of this appendix describes our methodology for prorating the CTC when the dependents on the 1040 are not a subset of the dependents in a surveyed family. Our strategy is to prorate the CTC based on the number of claimed dependent children that appear in the survey sharing unit. We implement this adjustment of total benefits when simulating the TCJA CTC and the AFP CTC.39 Note that we assign all other taxes and tax credits (including the Earned Income Tax Credit and the Child and Dependent Care Tax Credit) to the sharing unit of the surveyed primary/secondary filer only. Implementing Our Approach We implement our approach in two steps. First, we calculate the total amount of each credit pertaining to the 1040. Second, we calculate the share of the total amount of each credit that should be allocated to the survey sharing unit. Step 1. Calculate the total amount of each tax credit pertaining to the 1040 We consider separately the TCJA CTC and the AFP CTC. For both of these credits, the amount of the credit that can be claimed on behalf of each dependent varies by the age category of the dependent (under 17 vs. 17+ for the TCJA CTC and under 6 vs. 6-17 vs. 18+ for the AFP CTC). Thus, we split the total amount of the CTC into the total amounts claimed for each age category. This allows us in Step 2 to accurately prorate the total CTC amount based on both the share and age composition of 1040 dependents who appear in the surveyed SPM unit. TCJA CTC. The TCJA CTC contains the following components: For dependents under age 17
39 For TCJA CTC, we subtract out the CTC amount for “non-resident” 1040 dependents in proportion to the share of 1040 dependents who do not appear in the survey. For the AFP CTC, we subtract out the age-specific CTC amounts for “non-resident” 1040 dependents.

65
• Non-refundable CTC (with maximum benefit of $2,000 per dependent) • Additional CTC (ACTC, refundable portion of the CTC with maximum benefit of $1,400
per dependent) For dependents aged 17+
• Non-refundable ODC (with maximum benefit of $500 per dependent) While TAXSIM reports the ACTC as a separate output, it unfortunately aggregates the non-refundable CTC and ODC into a single output (“combined non-refundable CTC”) for each tax unit. Thus, we must split this aggregated amount between these two benefits outside of TAXSIM. To do so, we use the IRS rule that the non-refundable ODC is applied before the non-refundable CTC when calculating non-refundable tax credits.40 We first calculate the total non-refundable ODC for the tax unit as the minimum of (i) the total amount of the “combined non-refundable CTC” outputted by TAXSIM and (ii) $500 times the number of dependents aged 17+ on the 1040. We then calculate the total non-refundable CTC for the tax unit as any remaining amount of the “combined non-refundable CTC” after subtracting out the non-refundable ODC. AFP CTC. The AFP CTC contains the following components: For dependents under age 6
• Fully refundable CTC, with maximum benefit of $3,600 per dependent For dependents aged 6-17
• Fully refundable CTC, with maximum benefit of $3,000 per dependent For dependents age 18+
• Non-refundable ODC, with maximum benefit of $500 per dependent We calculate the total CTC amount for dependents aged 0 to 5 (6 to 17) as $3,600 ($3,000) times the number of dependents aged 0 to 5 (6 to 17) on the 1040, appropriately phased out based on AGI on the 1040. We calculate the total ODC amount as equivalent to the total tax liability (prior to credits) based on the 1040 (calculated by TAXSIM), up to a maximum of $500 times the number of dependents aged 18+ on the 1040. The ODC is appropriately phased out based on AGI on the 1040. Step 2. Prorate the total amount of each credit based on the number and age composition of 1040 dependents appearing in the survey sharing unit In this step, we prorate the total amount of each credit calculated in Step 1 (split across dependent age categories) based on the share of 1040 qualifying dependents for each credit who appear in the survey sharing unit (split across age categories). The denominators for these shares are the numbers of dependents on the 1040 in the following age categories for each credit: TCJA CTC Dependents under age 17
• Claimed for the non-refundable CTC and ACTC Dependents aged 17+
40 See Internal Revenue Service (IRS) documentation, https://www.irs.gov/irm/part21/irm_21-006-003r.

66
• Claimed for the non-refundable ODC AFP CTC Dependents aged 0 to 5
• Claimed for the fully refundable CTC for dependents age 0 to 5 Dependents aged 6 to 17
• Claimed for the fully refundable CTC for dependents age 6 to 17 Dependents aged 18+
• Claimed for the non-refundable ODC41 The numerators for these shares are the numbers of dependents on the 1040 in each age category who appear in the surveyed family. We add the prorated share of each specific credit to the income of the surveyed family.
41 The proration of the ODC under the AFP CTC is different from the proration of the ODC under the TCJA CTC. Between the two scenarios, the total amount of ODC awarded changes and the number of ODC dependents changes (due to changes in age eligibility for the ODC).

67
Appendix B This appendix describes the discrepancy between the number of children represented by the CPS ASEC and the number of children who can potentially be claimed as a dependent for purposes of the CTC. It also describes the implications this discrepancy for our aggregate estimates of CTC spending. In the CID, we only assign CTC benefits to children in the survey frame, who are weighted to represent the total non-institutionalized population of children living in the United States. However, children outside of the non-institutionalized population (as represented by the CPS ASEC) can potentially be claimed as a dependent for purposes of the CTC. In 2016, there were an estimated 129,100 children in institutional group quarters, 2.5 million children with Social Security numbers living outside of the United States, and an estimated 1.5 million children not represented by the CPS ASEC population benchmark due to an undercount of the non-institutionalized population. With regard to the latter group, CPS ASEC benchmarks are derived from population totals in the most recent Decennial Census. The Census Bureau estimated that the net undercount (i.e., gross omissions net of erroneous enumerations and whole person imputations) of children ages 0-11 was 1.5 million in the 2010 Decennial Census (Census Bureau 2014). This cohort corresponds to children ages 6-17 in 2016. Children ages 0-5 in 2016 were all born after the 2010 Census, so their contribution to the population benchmark is not affected by the Census undercount. Thus, while the CPS ASEC captures 74.0 million children in 2017, there are an estimated 78.0 million with Social Security numbers who potentially could be claimed on a 1040 for purposes of the CTC. If the additional 4.0 million children not captured by the CPS ASEC have a similar expected CTC benefit as children represented by the CPS ASEC, then we would expect aggregate CTC payments in the CID to be approximately 95% of aggregate CTC payments according to administrative aggregates. Thus, children not represented by the CPS ASEC but nonetheless eligible for the TCJA CTC can explain the finding that we capture 94% of TCJA CTC dollars in the CID. At the same time, we may slightly overstate CTC spending for another reason—we drop children living in families without any PIKed family member. These children who we drop are unlikely to have the CTC claimed on their behalf because qualifying dependents must have a Social Security number. However, we then upweight other families with at least one PIKed family member such that the weighted total number of children represented by the CPS ASEC is unchanged. Effectively, this means we could give higher weight to children who are more likely to receive the TCJA CTC given that they are more likely to have a Social Security number. However, because we use covariates to determine who to upweight, we are likely to increase the weights of children who also do not receive the TCJA CTC. Because the children we upweight to “take the place” of children dropped from the sample likely have similar CTC amounts, this issue does not likely lead to substantial overstatement of CTC spending.

68
Appendix C This appendix describes our methodology for simulating the effect of the CTC expansion on labor supply and incorporating labor supply reductions into our poverty simulations. Throughout, we use the term “TCJA CTC” to mean the CTC under Tax Cuts and Jobs Act, and we use the term “AFP CTC” to mean the CTC under the American Rescue Plan Act of 2021 and proposed for extension under the American Families Plan. We do not account for reductions in hours worked for workers who face an increased implicit marginal tax on an extra dollar of earnings due to the CTC expansion—this includes workers on the phase-in portion of the TCJA CTC or the phase-out portion of the incremental CTC. Effect of CTC expansion on labor force participation Relative to the TCJA CTC, the Child Tax Credit (CTC) expansion would reduce the incentive to work for most workers with children. Under the TCJA CTC, individuals receive up to $2,000 per child only if they work (or have a nonzero tax liability from other income sources). For example, a worker with two children receives up to $4,000 if she works, and $0 if she does not work and has no tax liability. Under the AFP CTC, workers receive no additional benefit amount as a result of working. Thus, the reduction in the return to work under the AFP CTC (relative to the TCJA CTC) will lead to a decrease in the number of workers as a result of the CTC expansion. In order to estimate the reduction in participation in the labor force, we apply from the academic literature elasticities of participation, which indicate the percent change in the probability of participation due to a one percent change in the return to work. Letting 𝜖𝜖 denote the elasticity, the percent change in the probability of working is equal to 𝜖𝜖 times the percent change in the return to work. We consider the work decisions of each tax unit with at least one current worker,42 assuming that either all current workers in the tax unit decide to work or no one in the tax unit decides to work.43 We start by calculating the percent change in the return to work for each tax unit, which is (1) the change in the return to work due to the CTC expansion divided by (2) the current return to work under the TCJA CTC scenario. Focusing first on (2), the return to work for the tax unit under the TCJA CTC scenario is simply their current earnings minus their additional tax liability accrued due to working minus the SNAP benefits they lose due to working.44 We calculate the additional tax liability accrued due to working
42 Tax units currently working and not working would generally be affected by changes to the return to work. We apply the elasticities only to those who are working. 43 Dual labor supply decisions by multiple workers in a single tax unit are more difficult to model. For the sake of simplicity, we only consider the cases in which either both or neither of the workers drop out of the labor force in response to the CTC expansion. In this way, we effectively treat the couple as a single worker responding to the change in work incentives facing the tax unit as a whole (and we count either zero workers or both workers as potentially exiting the labor force). 44 We do not account for changes in housing assistance, TANF, SSI, DI, or OASI. While a tax unit’s family may become eligible for these programs when the tax unit stops working, neither housing assistance nor TANF are entitlement programs (TANF moreover requires a work test for many recipients and the number of recipients is low), and SSI, DI, and OASI require the adult to be disabled and/or elderly, which is unlikely since the adult was previously

69
as the additional federal income taxes, state income taxes, and payroll taxes (simulated via TAXSIM) paid as a result of going from zero earnings to current earnings. We calculate the amount of SNAP benefits lost due to working as the difference between the maximum SNAP benefits received by a tax unit’s family (reflecting the amount under zero earnings) and the current level of SNAP benefits received (reflecting the amount under current earnings).45,46 Focusing next on (1), the change in the return to work due to the CTC expansion is simply the change in the AFP CTC (between working and not working) minus the change in the TCJA CTC (between working and not working). For most workers, the AFP CTC is equal to the maximum amount whether or not they work, since the AFP CTC does not begin to phase out until $112,500 for tax units filling head of households and $150,000 for tax units filing married filing jointly. The TCJA CTC when not working is typically zero, except for tax units with sufficient unearned income to generate a positive federal tax liability even when not working. Thus, the decrease in the return to work for most workers is simply their TCJA CTC, though it can be higher for tax units with higher incomes.47 In order to calculate the percent change in the probability of working for each tax unit that is currently working, we multiply the percent change in the tax unit’s return to work by the relevant elasticity for the tax unit. We apply an elasticity of 0.75 for tax units currently receiving the EITC and 0.25 for all other tax units. The 0.75 elasticity for tax units receiving the EITC is equal to the midpoint of the 0.3 to 1.2 range recommended for EITC-eligible workers based on a review of the literature in a CBO working paper (McClelland and Mok 2012). The 0.25 elasticity is consistent with mainstream simulation models and the academic literature (Congressional Budget Office 2012; Chetty et al. 2013).48 We consider a range of alternative elasticities in a series of robustness
working and has dependent children under age 18. However, families could potentially receive child SSI benefit when they stop working though most of the families we simulate as stopping work would have had sufficiently low earnings to be eligible for SSI when working. 45 We assume the tax unit’s family receives the maximum SNAP benefit given its family size when the tax unit does not work. We calculate the current level of SNAP benefits as the maximum SNAP benefit (given family size) minus 24% of the tax unit’s earnings, reflecting the 24% phaseout of SNAP benefits with earnings. We do not rely on survey reports of SNAP benefits for the case in which the tax unit works, because doing so could lead us to assign large changes in SNAP benefits for families that fail to report SNAP receipt, even if their earnings are too low to warrant such a large change. This would lead us to understate the return to work by overstating the amount by which SNAP benefits are reduced when switching from not working to working. 46 If the family is ineligible for SNAP when the tax unit has zero earnings (due to unearned income of the tax unit or income from other tax units in the same family), we will understate the return to work by overstating the reduction in SNAP benefits. 47 The change in TCJA CTC between not working and working will be zero for tax units with earnings below $2,500 because tax units require more than $2,500 in earnings to receive the TCJA CTC. The return to work will in rare cases increase for some tax units on the phase out portion (or beyond the phase-out portion) of the TCJA CTC who have substantial unearned income. For these tax units, the reduction in AGI from the loss of earnings could make them eligible to receive a higher amount of TCJA CTC. The TCJA CTC starts phasing out at $400,000 for tax units filling married filing jointly and at $200,000 for other tax units. For purposes of our labor supply calculations, we do not pro-rate CTC benefits based on dependents claimed by tax units who live outside the survey family. This implicitly assumes that workers incorporate the benefits accruing to claimed dependents outside of their family when deciding whether to work. Surveyed dependents claimed by adults outside of their survey family are not assigned as dependents to adults in their survey family. 48 The Penn Wharton Budget Model assumes a baseline labor supply elasticity of 0.50 (combining participation and hours). CBO (2012) recommends a labor supply elasticity of between 0.22 and 0.32 for primary workers across all

70
checks. We show results for every combination of the following elasticities: 0.30, 0.50, 0.75 and 1.20 for EITC recipients; and 0.05, 0.25 and 0.45 for non-EITC recipients. In addition to the effects of a decreased return to work, the increase in income due to CTC expansion would be expected to reduce labor force participation as well. In order to estimate the reduction in participation in the labor force due to higher incomes, we apply elasticities that indicate the percent change in the probability of participation due to a one percent change in income. We follow NAS (2019) in assuming an elasticity of -0.085 for single mother tax units. We assign an elasticity of -0.05 for all other tax units.49 We multiply these elasticities by the percent increase in income—the increase in income due to CTC expansion divided by income under the TCJA CTC, for the tax unit’s family. To estimate the total number of current workers exiting the labor force due to the CTC expansion, we multiply each individual worker’s weight in the CPS ASEC by the percent change in the probability of working for each worker’s tax unit, due either to the substitution effect or income effect.50 We sum these products over all individuals in the CPS ASEC to obtain the number of workers exiting the labor force. Incorporating labor supply reductions into poverty simulations We next incorporate the labor force exits of tax units due to the CTC expansion into our estimates of the poverty rate and child poverty rate under the AFP CTC. For each family that includes a tax unit exiting the labor force with a nonzero probability, we create a new post-tax, post-transfer income value that reflects the exit from the labor force of the tax unit.51 We make the following adjustments to post-tax, post-transfer income of the family. First, we subtract taxable earnings. Second, we replace current tax liabilities (reflecting current earnings) with re-calculated tax liabilities assuming zero earnings. This includes the AFP CTC, though for most tax units the AFP CTC given current earnings is equal to the AFP CTC given zero earnings.52 Third, we replace the family’s survey-based SNAP benefit with the minimum of (i) the family’s
earnings deciles and secondary workers altogether. In a meta analysis, Chetty et al. (2013) conclude: “The estimates in table 1 should therefore be interpreted as a rough guide to plausible targets for calibration: they suggest that extensive margin elasticities around 0.25 are reasonable, while values above 1 are not.” 49 NAS (2019) assumes an employment elasticity with respect to income of -0.05 for men and -0.12 for married women. Because we conduct our analysis at the tax unit level, we take the lower -0.05 estimate to model joint decisions to exit the labor force. 50 We identify a worker with dependent children as any adult aged 18 or over who (i) is the primary or secondary filer in a tax unit that includes at least one dependent under the age of 18 and has strictly positive earnings, and (ii) either reported working in 2016 or is the primary filer in a tax unit in which no adult reported working in 2016. 51 If there are multiple tax units in the family that exit the labor force with nonzero probability, we only consider the labor force exit of the tax unit with the highest probability. This will lead us to understate poverty under the AFP CTC. 52 The AFP CTC given current earnings will differ from the AFP CTC given zero earnings only when AGI given current earnings exceeds $112,500 for tax units filing head of household and $150,000 for tax units filing married filing jointly. For workers at these income levels in complex families who leave the labor force, we may overstate their AFP CTC given zero earnings because we do not pro-rate the credit for any claimed children who live outside the survey family.

71
survey-reported SNAP benefit plus 0.24 times taxable earnings, and (ii) the maximum SNAP benefit given the family’s size.53 Given that every family is modeled as having a probability of exiting the labor force, we need to calculate income and poverty (allowing for behavioral responses) in a way that incorporates these probabilities. We start by creating two versions of each family in the CPS ASEC that reflect the two possible events (not exiting the labor force and exiting the labor force). For individuals in the version of the family that does not exit the labor force, we assign a new set of weights equal to the individual’s CPS ASEC weight times the probability that the tax unit in the individual’s family does not exit the labor force. For individuals in the version of the family that exits the labor force, we assign another set of weights equal to the individual’s CPS ASEC weight times the probability that the tax unit in the individual’s family exits the labor force. Finally, we calculate the number of individuals represented by the first set of weights whose (unadjusted) equivalized post-tax, post-transfer income in the AFP CTC scenario falls below the poverty threshold. And we calculate the number of individuals represented by the second set of weights whose (adjusted) equivalized post-tax, post-transfer income in the AFP CTC scenario falls below the poverty threshold. The sum of individuals across both calculations is the number of people in poverty under the AFP CTC scenario allowing for behavioral responses.
53 We simulate SNAP benefits in this way because SNAP benefits phase out at a 24% rate with earnings, and because underreporting of SNAP could lead us to overstate the increase in SNAP when not working if we simply assign the maximum SNAP benefit.

72
Appendix D This appendix describes how we estimate the number of workers who face an increased implicit marginal tax rate (MTR) as a result of CTC expansion, and the mean increase they face. Estimating changes in implicit marginal tax rates For workers with incomes below the point at which the incremental CTC (AFP CTC minus TCJA CTC) begins to phase out, the increase in the implicit MTR on an additional dollar of earnings due to the CTC expansion is equal to the phase-in rate of the TCJA CTC. This includes the phase-in of the ACTC, which phases in at $0.15 per dollar of earnings, and the phase-in of the non-refundable CTC, which phases in at the marginal federal income tax rate of the tax unit (generally 10% or 12% for tax units on the phase-in part of the TCJA CTC schedule).54 To infer the phase-in rate of the TCJA CTC, we exploit the fact that a tax unit receiving a strictly positive but less than maximum amount of a particular credit will receive more of that credit if its earnings increase by an additional dollar.55 The one exception is for tax units on the phase-out portion of the TCJA CTC, those with AGI of $400,000 or more for tax units married filing jointly and $200,000 or more for other tax units. Specifically, the phase-in rate of the TCJA CTC—and thus the difference in implicit MTR between the TCJA CTC and AFP CTC—can be calculated based on four inputs corresponding to a given tax unit:
• The number of claimed dependents under the age of 17 • The amount of the existing ACTC • The amount of the existing non-refundable CTC • The marginal federal income tax rate (MFITR) of the tax unit (which is the same under the
TCJA CTC and AFP CTC scenarios) In the table below, we show how these inputs can be used to determine the phase-in rates. We use the MFITR schedule for the 2018 tax year to maintain consistency with our tax simulations.
54 Because the non-refundable CTC is applied after the other two major non-refundable credits for lower income families—the Credit for Other Dependents (ODC) and the Child and Dependent Care Tax Credit (CDCTC)—once the non-refundable CTC is eliminated the tax unit will not have these non-refundable credits to take its place. 55 We will misstate the phase-in rate for the trivial share of tax units with earnings or income exactly $1 below the level needed to receive a particular credit.

73
Phase-in Rate of TCJA CTC by Observed Amounts of ACTC and Non-Refundable CTC
ACTC Non-refundable CTC ACTC + non-
refundable CTC Phase-in rate of TCJA
CTC $0 $0 0%
$0 ($0, # Dependents X $2,000) MFITR
($0, # Dependents X $1,400) $0 15%
# Dependents X $1,400 $0 0% ($0, # Dependents X
$1,400) ($0, # Dependents X
$2,000) ($0, # Dependents X
$2,000) 15% + MFITR
# Dependents X $1,400 ($0, # Dependents X $2,000)
($0, # Dependents X $2,000) MFITR
# Dependents X $2,000 0% Note: Only dependents under age 17 are included in this table. Marginal federal income tax rate (MFITR) is the 2018 statutory marginal tax rate that applies to a tax unit with a given filing type and a given amount of taxable income. Tax units on the phase-out range of the TCJA CTC, with AGI of $400,000 or more for tax units filing jointly and $200,000 or more for other tax units, are excluded from this table.