working together for clean air pm 2.5 continuous methods lynnwood, washington site
TRANSCRIPT

Working Together for Clean Air
www.pscleanair.org
PM 2.5 Continuous Methods
Lynnwood, Washington Site
Slide 2
Study Objectives
To share information regarding Continuous Fine Particle Monitoring vs the Federal Reference Method for PM 2.5 at a Woodsmoke Impacted Site
To specifically compare the technologies employed by vendors in continuous fine particle monitoring
To assist us in Long Term Network Management Decisions Which Device (s) should we invest in for future Fine Particle Monitoring
for Woodsmoke Impacted Areas?
Slide 3
Abstract
The Puget Sound Clean Air Agency has a long history of using continuous fine particle monitors in the Seattle Metropolitan Area. In an ongoing continuous improvement effort, we have used a site in a wood smoke impacted area to test new technologies for continuous fine particle monitoring. This presentation is a data update studying both the technical data issues of intercomparison and quality assurance, and the practical issues of maintenance and operations between various samplers including the Rupprecht & Patashnik TEOM (tapered element oscillating microbalance), the TEOM FDMS (filter dynamics measurement system), the Radiance Research Nephelometer, and the Met-One 1020 BAM (beta attenuation monitor) and E-BAM. The standard PM 2.5 method that will be used for comparison is the Federal Reference Method.

Slide 4
Lynnwood, Washington Site
Lynnwood Site
Slide 5
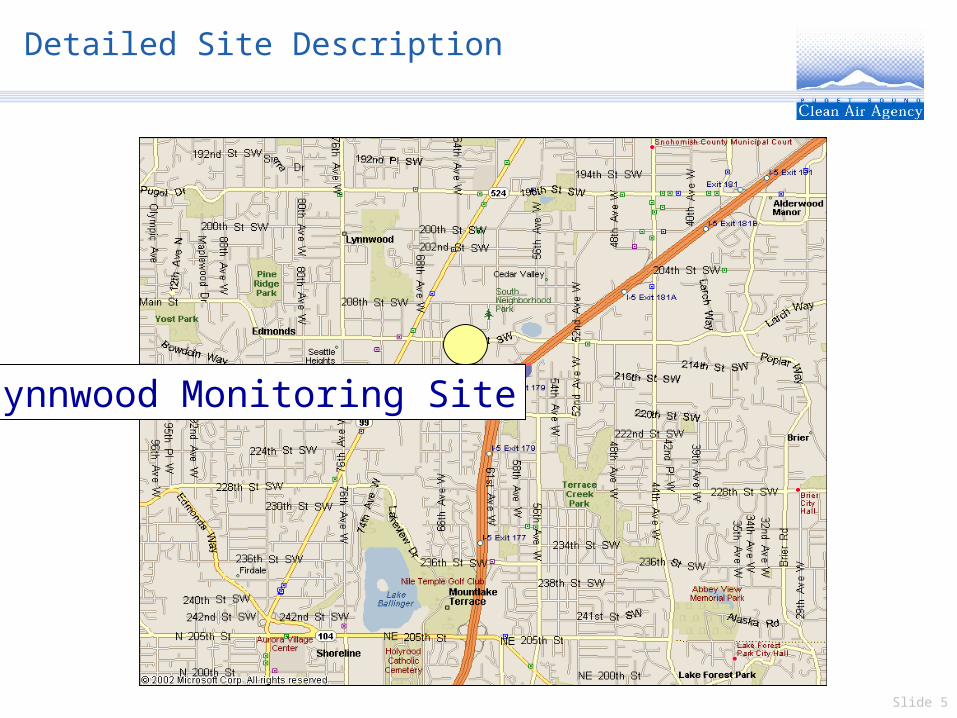
Detailed Site Description
Lynnwood Monitoring Site
Slide 6
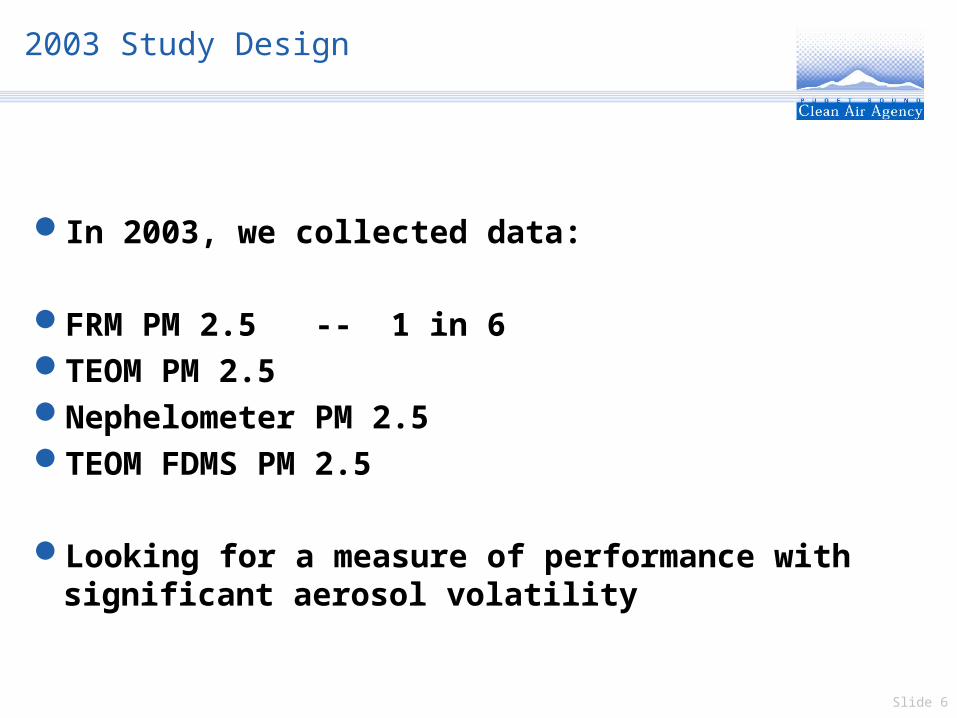
2003 Study Design
In 2003, we collected data:
FRM PM 2.5 -- 1 in 6TEOM PM 2.5Nephelometer PM 2.5TEOM FDMS PM 2.5
Looking for a measure of performance with significant aerosol volatility
Slide 7
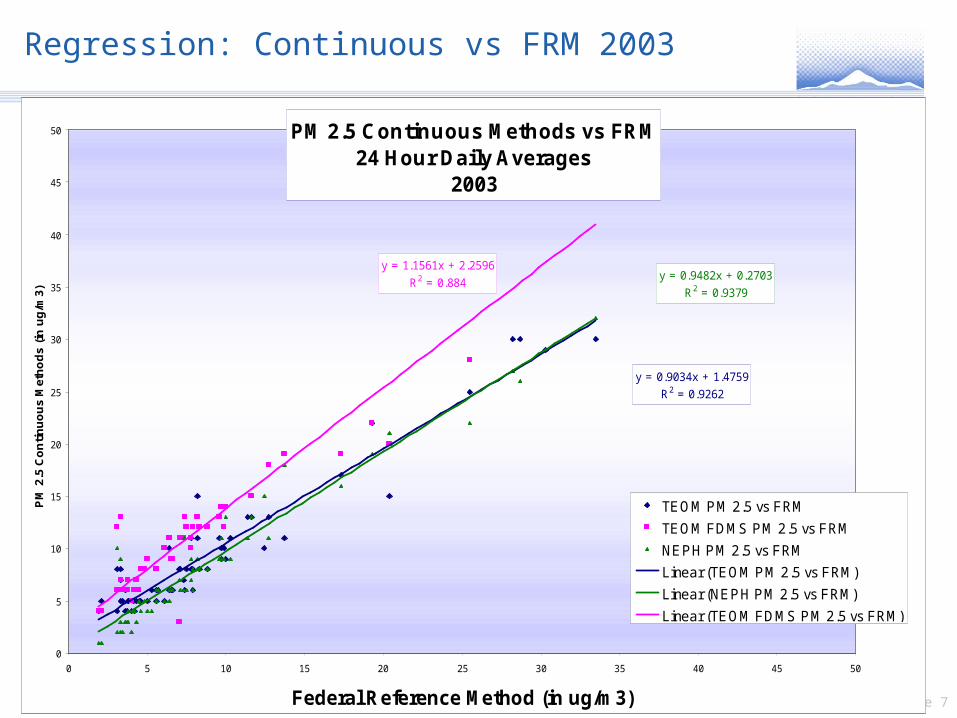
Regression: Continuous vs FRM 2003
PM 2.5 Continuous Methods vs FRM24 Hour Daily Averages
2003
y = 0.9034x + 1.4759
R2 = 0.9262
y = 0.9482x + 0.2703
R2 = 0.9379
y = 1.1561x + 2.2596
R2 = 0.884
0
5
10
15
20
25
30
35
40
45
50
0 5 10 15 20 25 30 35 40 45 50
Federal Reference Method (in ug/m3)
PM
2.5
Co
nti
nu
ou
s M
eth
od
s (i
n u
g/m
3)
TEOM PM 2.5 vs FRM
TEOM FDMS PM 2.5 vs FRM
NEPH PM 2.5 vs FRM
Linear (TEOM PM 2.5 vs FRM)
Linear (NEPH PM 2.5 vs FRM)
Linear (TEOM FDMS PM 2.5 vs FRM)
Slide 8
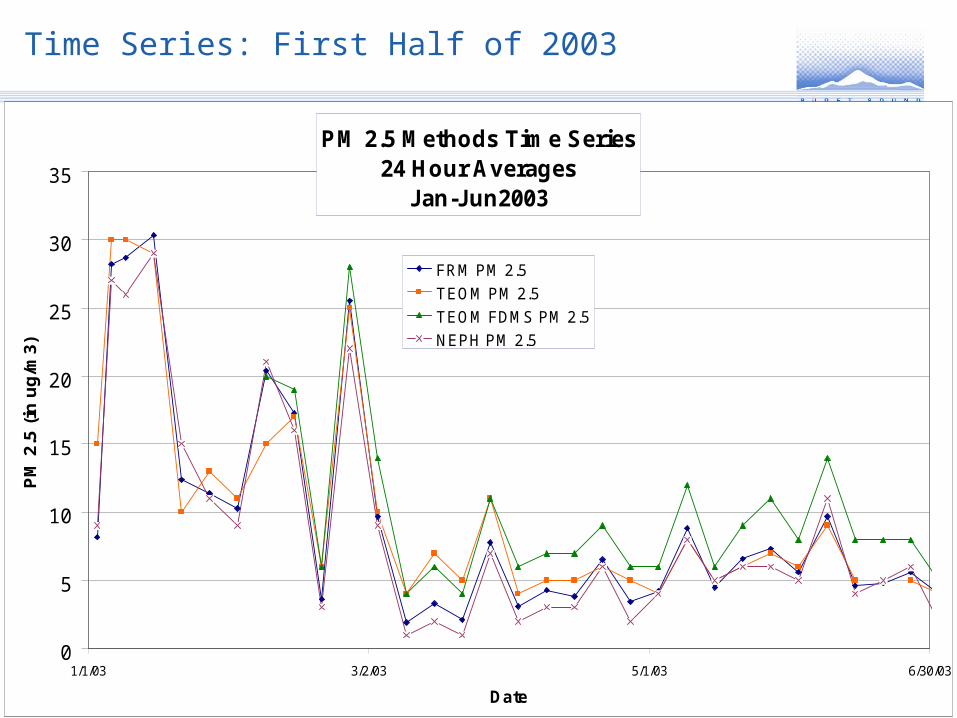
Time Series: First Half of 2003
PM 2.5 Methods Time Series24 Hour Averages
Jan-Jun2003
0
5
10
15
20
25
30
35
1/1/03 3/2/03 5/1/03 6/30/03
Date
PM
2.5
(in
ug
/m3)
FRM PM 2.5
TEOM PM 2.5
TEOM FDMS PM 2.5
NEPH PM 2.5

Slide 9
Time Series: Second Half of 2003
PM 2.5 Methods Time Series24 Hour Averages
Jul-Dec2003
0
5
10
15
20
25
30
35
40
45
50
6/30/03 8/29/03 10/28/03 12/27/03
Date
PM
2.5
(in
ug
/m3)
FRM PM 2.5
TEOM PM 2.5
TEOM FDMS PM 2.5
NEPH PM 2.5
PM 2.5 Methods Time Series24 Hour Averages
Jul-Dec2003
0
5
10
15
20
25
30
35
40
45
50
6/30/03 8/29/03 10/28/03 12/27/03
Date
PM
2.5
(in
ug
/m3)
FRM PM 2.5
TEOM PM 2.5
TEOM FDMS PM 2.5
NEPH PM 2.5

Slide 10
Statistics – Annual Averages
Annual Average ComparisonLynnwood 2003
9.2
12.3
8.89.5
0
2
4
6
8
10
12
14
Mic
rog
ram
s/cu
bic
met
er
Partisol
FDMS
TEOM2.5 (adj)
Neph PM 2.5
Slide 11
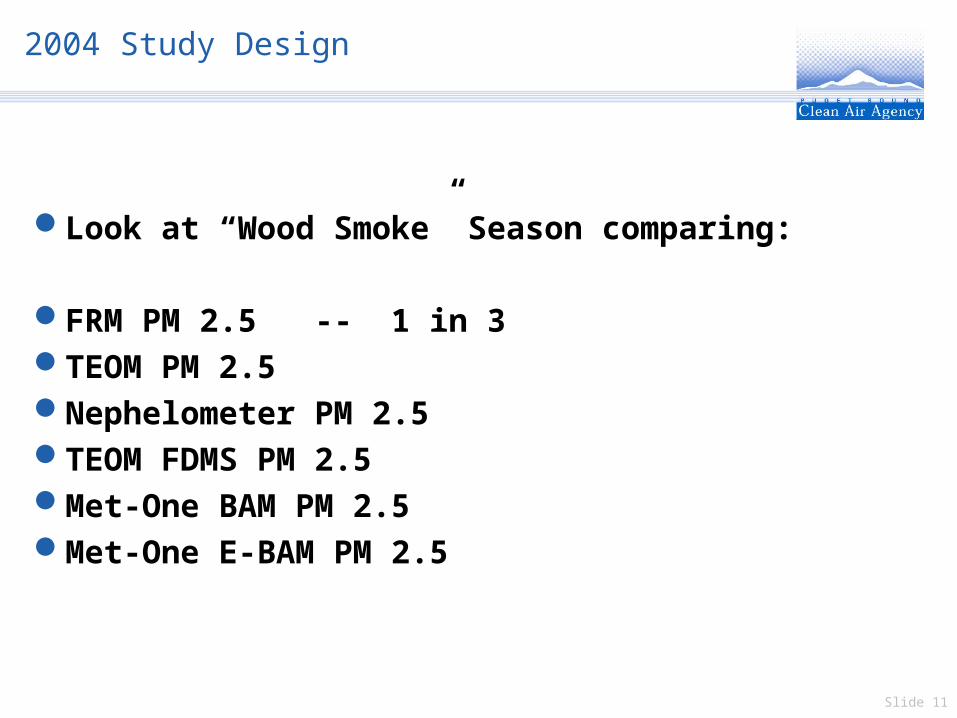
2004 Study Design
Look at “Wood Smoke” Season comparing:
FRM PM 2.5 -- 1 in 3TEOM PM 2.5Nephelometer PM 2.5TEOM FDMS PM 2.5Met-One BAM PM 2.5Met-One E-BAM PM 2.5
Slide 12
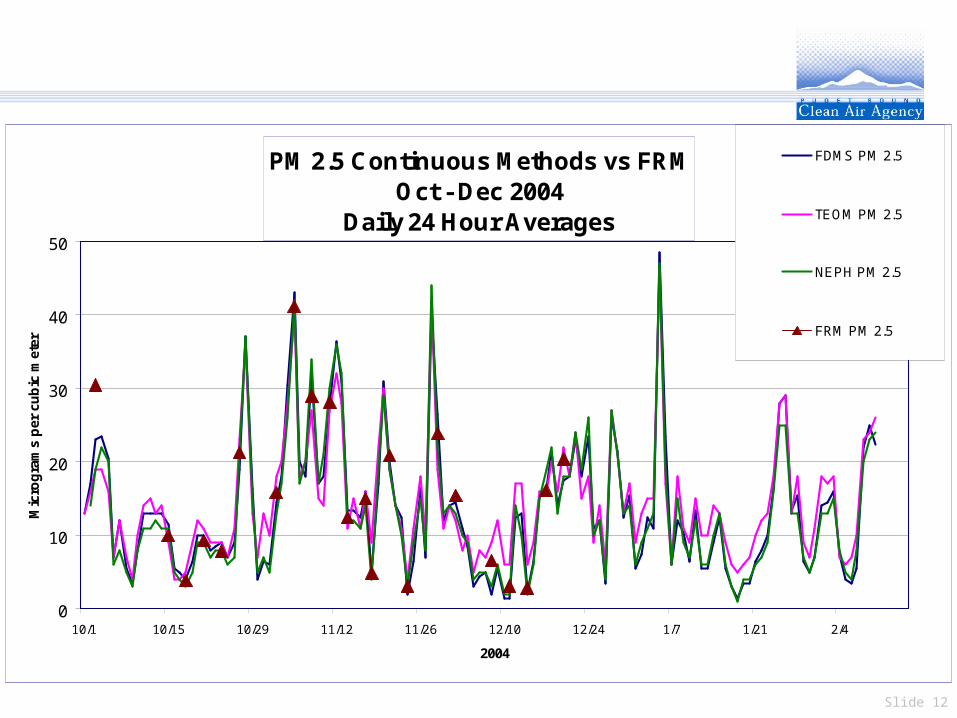
PM 2.5 Continuous Methods vs FRMOct - Dec 2004
Daily 24 Hour Averages
0
10
20
30
40
50
10/1 10/15 10/29 11/12 11/26 12/10 12/24 1/7 1/21 2/4
2004
Mic
rog
ram
s p
er c
ub
ic m
eter
FDMS PM 2.5
TEOM PM 2.5
NEPH PM 2.5
FRM PM 2.5
Slide 13
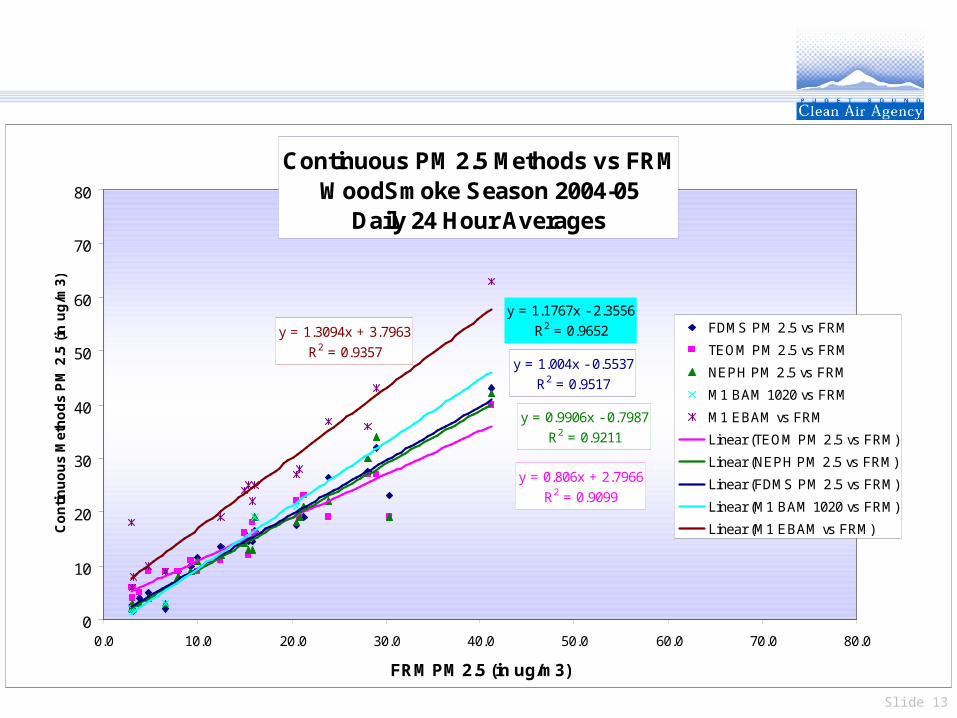
Continuous PM 2.5 Methods vs FRMWoodSmoke Season 2004-05
Daily 24 Hour Averages
y = 0.806x + 2.7966
R2 = 0.9099
y = 0.9906x - 0.7987
R2 = 0.9211
y = 1.004x - 0.5537
R2 = 0.9517
y = 1.1767x - 2.3556
R2 = 0.9652y = 1.3094x + 3.7963
R2 = 0.9357
0
10
20
30
40
50
60
70
80
0.0 10.0 20.0 30.0 40.0 50.0 60.0 70.0 80.0
FRM PM 2.5 (in ug/m3)
Co
nti
nu
ou
s M
eth
od
s P
M 2
.5 (
in u
g/m
3)
FDMS PM 2.5 vs FRM
TEOM PM 2.5 vs FRM
NEPH PM 2.5 vs FRM
M1 BAM 1020 vs FRM
M1 EBAM vs FRM
Linear (TEOM PM 2.5 vs FRM)
Linear (NEPH PM 2.5 vs FRM)
Linear (FDMS PM 2.5 vs FRM)
Linear (M1 BAM 1020 vs FRM)
Linear (M1 EBAM vs FRM)

Slide 14
Continuous PM 2.5 Methods vs FRMWoodSmoke Season 2004-05
Daily 24 Hour Averages
y = 0.806x + 2.7966
R2 = 0.9099
y = 0.9906x - 0.7987
R2 = 0.9211
y = 1.004x - 0.5537
R2 = 0.9517
0
10
20
30
40
50
60
70
0.0 10.0 20.0 30.0 40.0 50.0 60.0 70.0
FRM PM 2.5 (in ug/m3)
Co
nti
nu
ou
s M
eth
od
s P
M 2
.5 (
in u
g/m
3)
FDMS PM 2.5 vs FRM
TEOM PM 2.5 vs FRM
NEPH PM 2.5 vs FRM
Linear (TEOM PM 2.5 vs FRM)
Linear (NEPH PM 2.5 vs FRM)
Linear (FDMS PM 2.5 vs FRM)
Slide 15
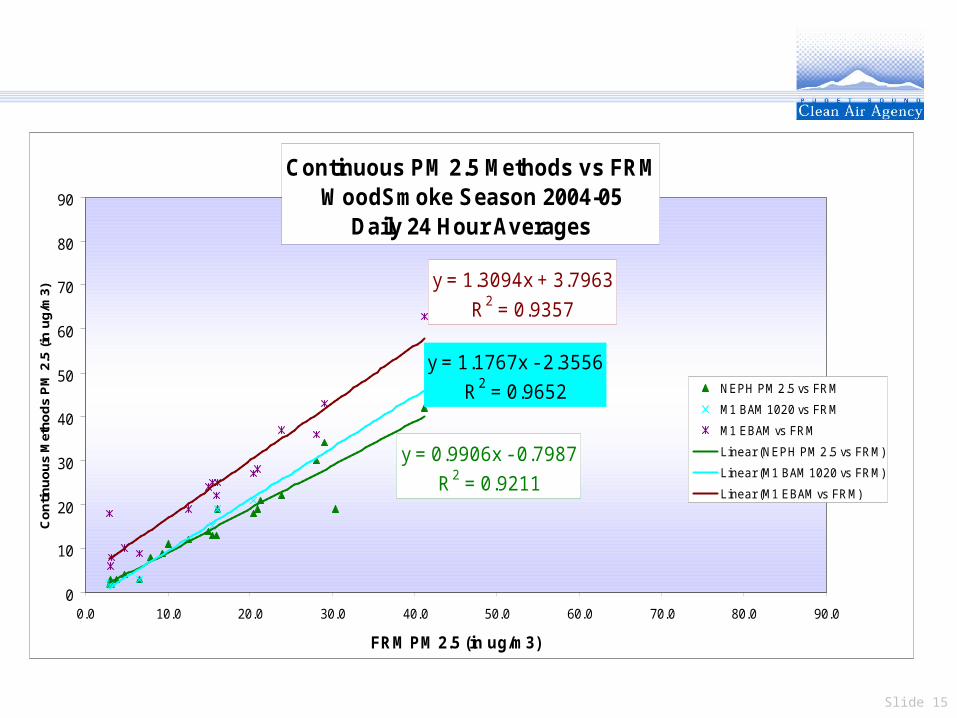
Continuous PM 2.5 Methods vs FRMWoodSmoke Season 2004-05
Daily 24 Hour Averages
y = 0.9906x - 0.7987
R2 = 0.9211
y = 1.1767x - 2.3556
R2 = 0.9652
y = 1.3094x + 3.7963
R2 = 0.9357
0
10
20
30
40
50
60
70
80
90
0.0 10.0 20.0 30.0 40.0 50.0 60.0 70.0 80.0 90.0
FRM PM 2.5 (in ug/m3)
Co
nti
nu
ou
s M
eth
od
s P
M 2
.5 (
in u
g/m
3)
NEPH PM 2.5 vs FRM
M1 BAM 1020 vs FRM
M1 EBAM vs FRM
Linear (NEPH PM 2.5 vs FRM)
Linear (M1 BAM 1020 vs FRM)
Linear (M1 EBAM vs FRM)

Slide 16
Aethalometer Experience
Dual Channel AethalometerProject objective: to learn more about nature of Carbon
Aerosol Some Surprising results…
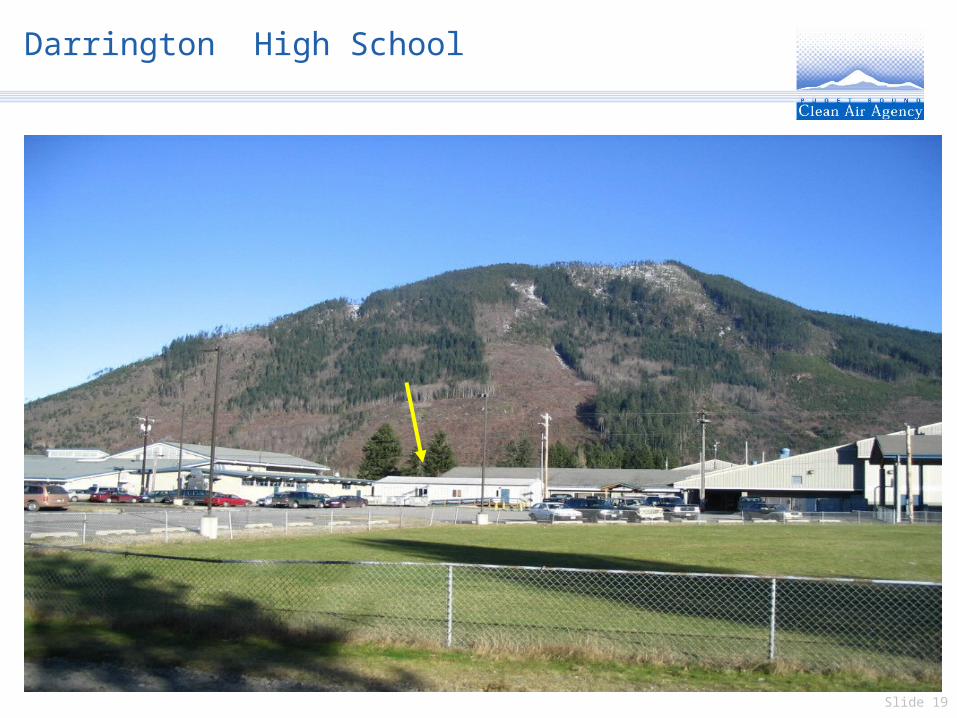
Darrington, WA Sampling SiteHigh Concentration of Wood Smoke

Slide 17
Darrington, Washington

Slide 18
Slide 19
Darrington High School

Slide 20
Dual Channel Aethalometer Graphic
Dual Channel Aethalometer ResultsDarrington WoodSmoke Site
Nov 14-27, 2004
0
2
4
6
8
10
11/14/20040:00
11/15/20040:00
11/16/20040:00
11/17/20040:00
11/18/20040:00
11/19/20040:00
11/20/20040:00
11/21/20040:00
11/22/20040:00
11/23/20040:00
11/24/20040:00
11/25/20040:00
11/26/20040:00
11/27/20040:00
11/28/20040:00
Date/Tim e
BC
or
UV
Ch
ann
el (
in u
g/m
3)
BC (in ug/m3)
UV (in ug/m3)
Dual Channel Aethalometer ResultsFreeway Olive Street Site
Nov 14-27, 2004
0
2
4
6
8
10
11/14/20040:00
11/15/20040:00
11/16/20040:00
11/17/20040:00
11/18/20040:00
11/19/20040:00
11/20/20040:00
11/21/20040:00
11/22/20040:00
11/23/20040:00
11/24/20040:00
11/25/20040:00
11/26/20040:00
11/27/20040:00
11/28/20040:00
Date /Tim e
BC
or
UV
Ch
ann
el (
in u
g/m
3)
BC (in ug/m3)
UV (in ug/m3)

Slide 21
Daily Averages
Particle Monitoring Results: Darrington WoodSmoke SiteDec 23 - Feb 2, 2004
Daily Averages
0
5
10
15
20
25
30
35
40
45
50
12/23/2004 12/30/2004 1/6/2005 1/13/2005 1/20/2005 1/27/2005 2/3/2005
Date /Time
BC
or
UV
Ch
ann
el (
in u
g/m
3)
0
10
20
30
40
50
60
70
80
90
100
110
120
130
NE
PH
PM
2.5
(in
ug
/m3)
BC (in ug/m3)
UV (in ug/m3)
Neph PM 2.5 (in ug/m3)

Slide 22
Hourly Averages
Particle Monitoring Results: Darrington WoodSmoke Site
Jan 8-12, 2005Hourly Averages
0
10
20
30
40
50
60
70
80
90
100
1/8/2005 0:00 1/9/2005 0:00 1/10/2005 0:00 1/11/2005 0:00 1/12/2005 0:00
Date /Time
BC
or
UV
Ch
an
ne
l (i
n
ug
/m3
)
0
25
50
75
100
125
150
175
200
225
250
275
300
325
NE
PH
PM
2.5
(in
ug
/m3
)BC (in ug/m3)
UV (in ug/m3)
Neph PM 2.5 (in ug/m3)

Working Together for Clean Air
www.pscleanair.org
U. of WashingtonDiesel Exposure Lab
Testing
Aethalometer Pilot Experiment
Slide 24
Opportunity
UW Diesel Exposure Laboratory Health Studies: Humans and Mice
Principal Investigator – Dr. Joel Kaufman, MD, MPHEngineering Investigator – Dr. Tim Larson, PHD
Diesel engine Current model turbocharged direct-injection 5.9 liter Cummins B-series
engine (6BT5.9G6, Cummins, Inc., Columbus, IN). 100 kW generator set. Comparable to delivery trucks and school buses.
Fuel Fuel is #2 un-dyed on-highway fuel from a commercial source
Slide 25
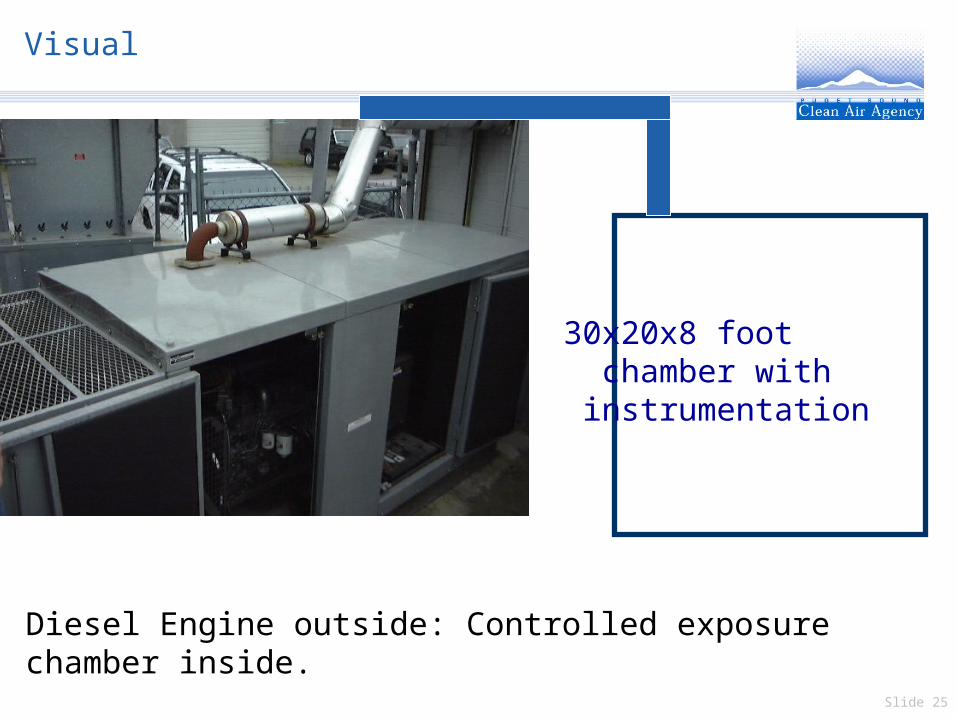
Visual
Diesel Engine outside: Controlled exposure chamber inside.
30x20x8 foot chamber with instrumentation
Slide 26
Initial Study Questions
What will the Aethalometer measure when we expose it to this Acute, High Pollution Level Environment?
What will the ratio be between the PM 2.5 DPM being measured by the TEOM and the PM 2.5 BC being measured by the Aethalometer? How Variable?
How will the Nephelometer measurements relate to the measurements taken with the other devices?
What will the BC and UV channel show us about the nature of the Diesel Particulate Matter?
Slide 27
Study Objectives
Learn more about both channels of the Aethalometer by testing it in the Diesel Exposure Lab Learn about the Maximum Limits of the Aethalometer Learn about the linearity of the Aethalometer over a wide range of
exposures Learn about the relationship between the BC and UV channels
Learn more about the TEOM and NEPH in the Diesel Exposure Lab
Slide 28
Method
Monitored Air in the chamber using TEOM, NEPH, and dual channel Aethalometer at various levels of Total PM 2.5 (in this case, total Diesel Particulate Matter) Experiment lasted 9 weeks Gathered data on 7 sessions of opportunity during those 9 weeks We were able to validate 5 of those sessions (extremely high levels
caused instrument malfunction)
Assumption: TEOM is our Standard PM 2.5 device for this experiment. Historically, we have shown that both the TEOM PM 2.5 device, and the Nephelometer have excellent correlations with the PM 2.5 Federal Reference Method.
Slide 29
Time Synch Problem
Time Synch Problem: The instrument’s clocks were not in synch. For analysis, we used the TEOM’s time standard and subjectively adjusted the other devices’ data accordingly to synch the time. Data Resolution Limiting Factor: Aethalometer 5 minute Averages. For comparison, we calculated 5 minute average data for all 3 devices.

Slide 30
PSCAA Method to Convert Bscat to PM 2.5 for Ambient Air
We use a wide network of Nephelometers to monitor PM 2.5 in Snohomish, King, Pierce, and Kitsap Counties.We use a 24 Hour Average Correlation Factor to convert from Bscat to PM 2.5. We have used nephelometer to PM 2.5 Federal Reference Method historical data (24 Hr Averages) to calculate these factors.Examples:
SITE DOMINANT SOURCES CORRECTION
Marysville Woodsmoke, Mobile 25.8 x10⁴
South Tacoma Woodsmoke, Mobile 24.7 x10⁴
Seattle Duwamish Industrial, Mobile
33.1 x10⁴
Units are meter * g/m3
Slide 31
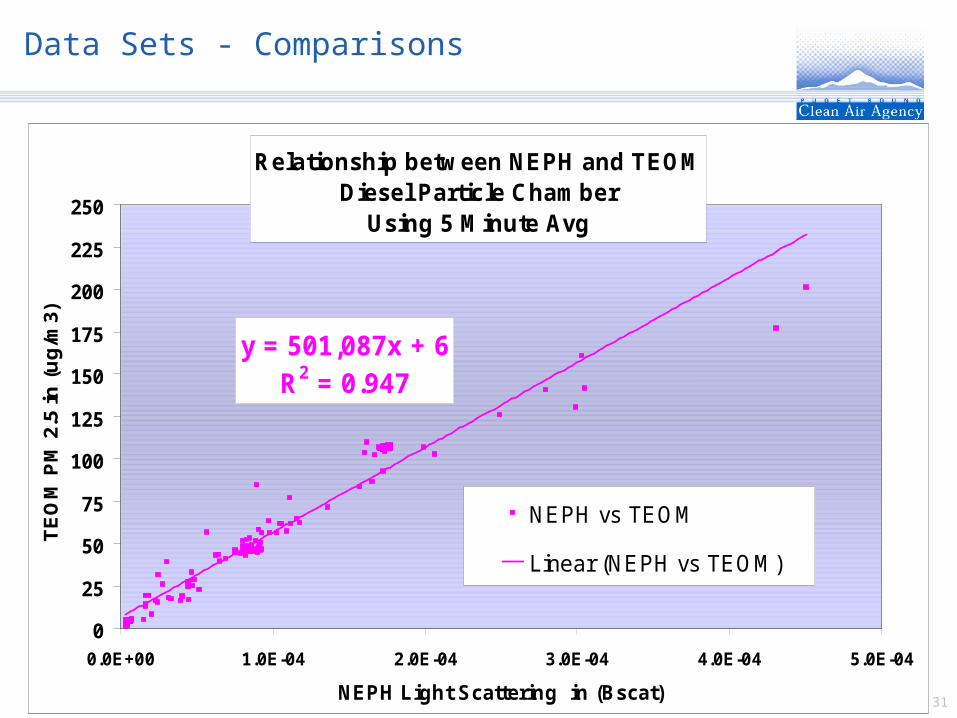
Data Sets - Comparisons
Relationship between NEPH and TEOMDiesel Particle Chamber
Using 5 Minute Avg
y = 501,087x + 6R2 = 0.947
0
25
50
75
100
125
150
175
200
225
250
0.0E+00 1.0E-04 2.0E-04 3.0E-04 4.0E-04 5.0E-04
NEPH Light Scattering in (Bscat)
TE
OM
PM
2.5
in
(u
g/m
3)
NEPH vs TEOM
Linear (NEPH vs TEOM)

Slide 32
Neph and TEOM Discussion
The direct linear relationship shown between the Nephelometer and the TEOM indicate that they both detect and measure Diesel Particulate Matter.
Based on the light scattering properties of DPM, there is a different relationship (slope) than what we would see in the ambient atmosphere when more than just DPM is being measured. Particles from other sources have other light scattering properties.
Diesel particles scatter much less light than the ambient PM 2.5 particles that we see in the ambient atmosphere.

Working Together for Clean Air
www.pscleanair.org
Data Slides
Slide 34
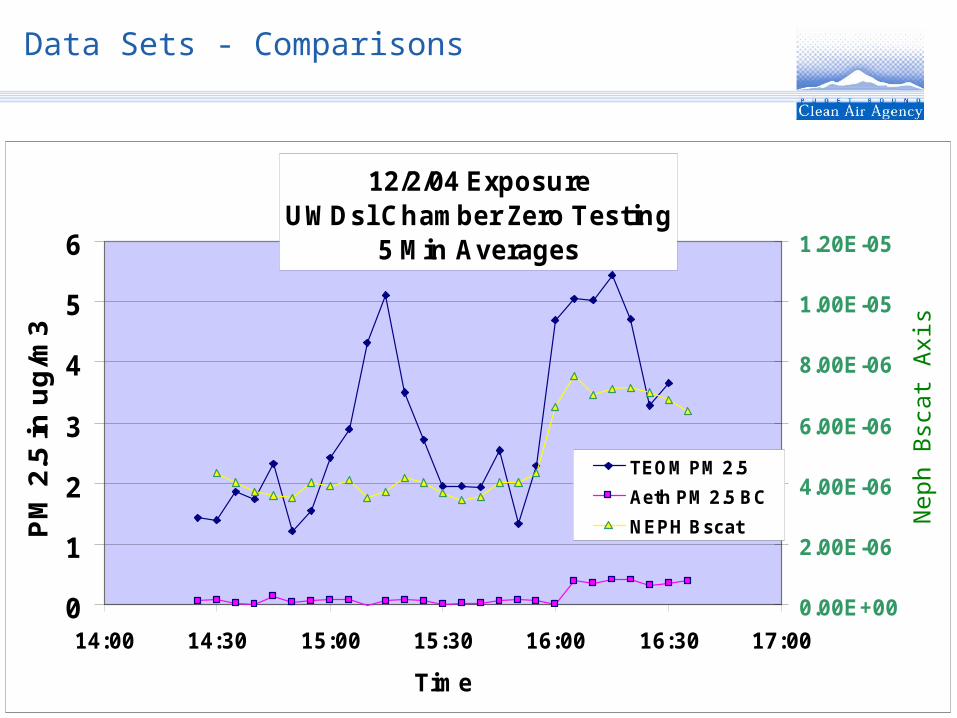
Data Sets - Comparisons
12/2/04 Exposure UWDsl Chamber Zero Testing
5 Min Averages
0
1
2
3
4
5
6
14:00 14:30 15:00 15:30 16:00 16:30 17:00
Time
PM
2.5
in
ug
/m3
0.00E+00
2.00E-06
4.00E-06
6.00E-06
8.00E-06
1.00E-05
1.20E-05
TEOM PM 2.5
Aeth PM 2.5 BC
NEPH Bscat
Nep
h B
scat
Axi
s
Slide 35
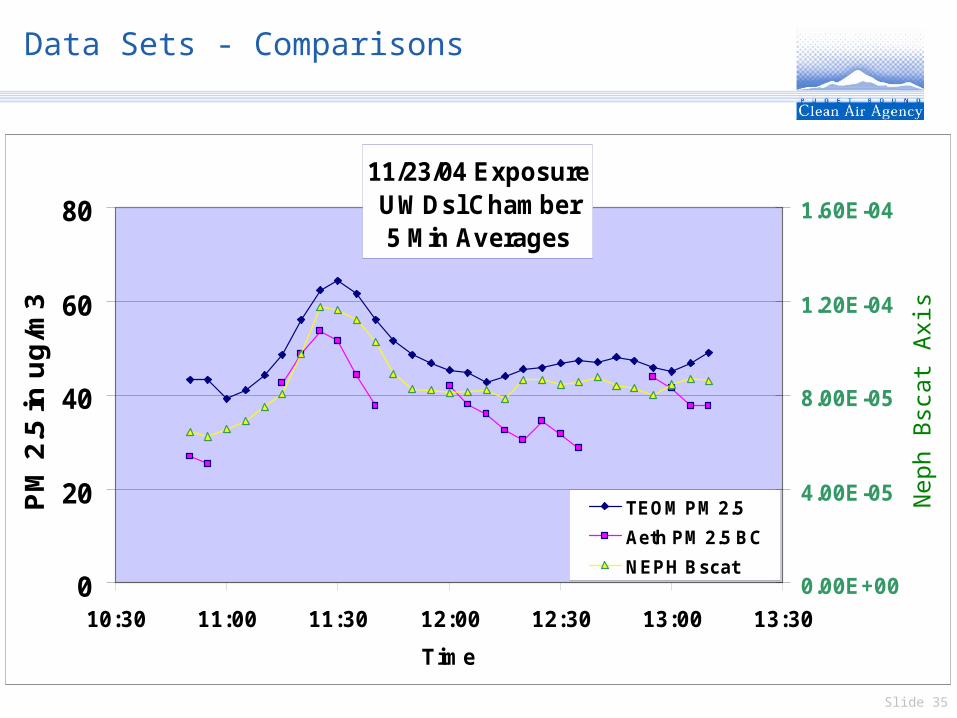
Data Sets - Comparisons
11/23/04 Exposure UWDsl Chamber 5 Min Averages
0
20
40
60
80
10:30 11:00 11:30 12:00 12:30 13:00 13:30
Time
PM
2.5
in
ug
/m3
0.00E+00
4.00E-05
8.00E-05
1.20E-04
1.60E-04
TEOM PM 2.5
Aeth PM 2.5 BC
NEPH Bscat
Nep
h B
scat
Axi
s

Slide 36
Data Sets - Comparisons
11/29/04 Exposure UWDsl Chamber 5 Min Averages
0
20
40
60
80
12:30 13:00 13:30 14:00 14:30
Time
PM
2.5
in
ug
/m3
0.00E+00
4.00E-05
8.00E-05
1.20E-04
1.60E-04
TEOM PM 2.5
Aeth PM 2.5 BC
NEPH Bscat
Nep
h B
scat
Axi
s

Slide 37
Data Sets - Comparisons
12/3/04 Exposure UWDsl Chamber 5 Min Averages
0
50
100
150
200
250
300
12:00 12:30 13:00 13:30 14:00 14:30 15:00 15:30
Time
PM
2.5
in
ug
/m3
0.00E+00
1.00E-04
2.00E-04
3.00E-04
4.00E-04
5.00E-04
6.00E-04
TEOM PM 2.5
Aeth PM 2.5 BC
NEPH Bscat
Nep
h B
scat
Axi
s
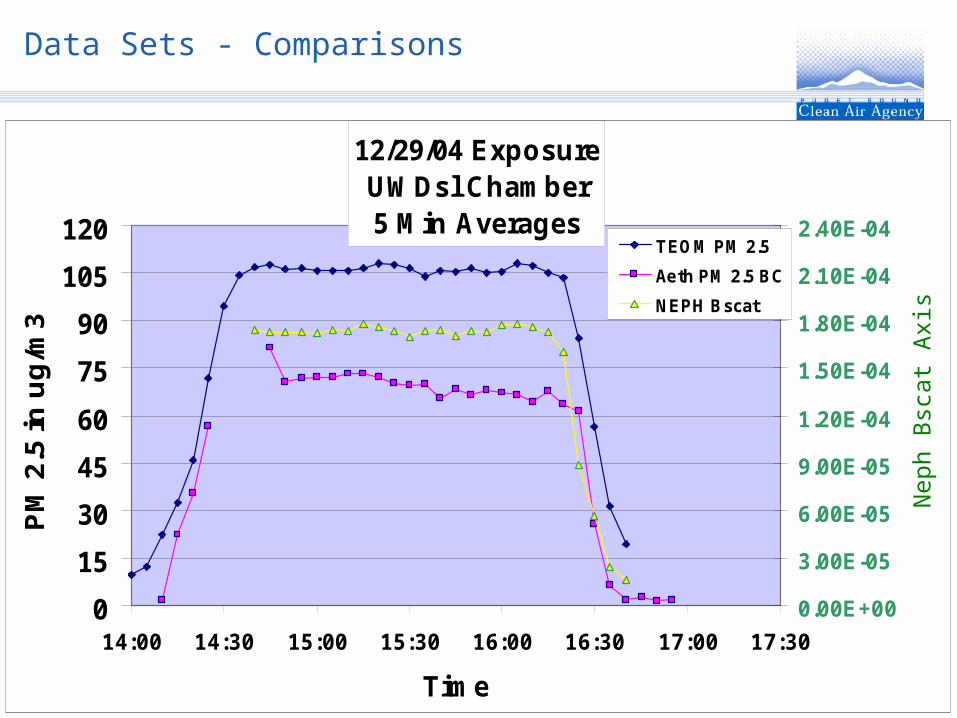
Slide 38
12/29/04 Exposure UWDsl Chamber 5 Min Averages
0
15
30
45
60
75
90
105
120
14:00 14:30 15:00 15:30 16:00 16:30 17:00 17:30
Time
PM
2.5
in
ug
/m3
0.00E+00
3.00E-05
6.00E-05
9.00E-05
1.20E-04
1.50E-04
1.80E-04
2.10E-04
2.40E-04TEOM PM 2.5
Aeth PM 2.5 BC
NEPH Bscat
Data Sets - Comparisons
Nep
h B
scat
Axi
s

Working Together for Clean Air
www.pscleanair.org
Data Analysis
Slide 40
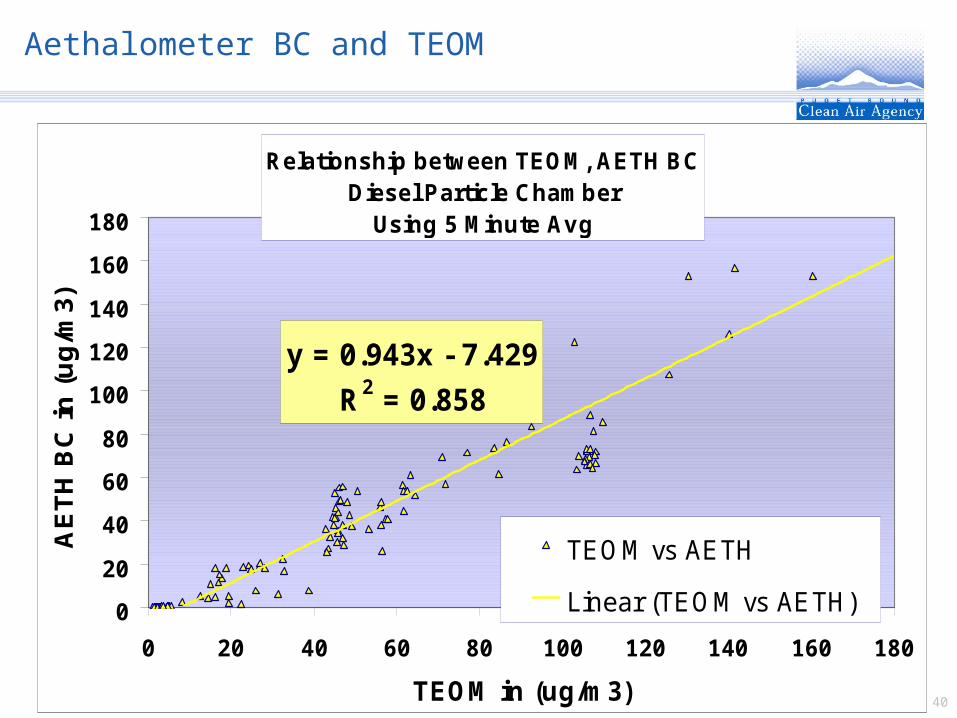
Aethalometer BC and TEOM
Relationship between TEOM, AETH BCDiesel Particle Chamber
Using 5 Minute Avg
y = 0.943x - 7.429
R2 = 0.858
0
20
40
60
80
100
120
140
160
180
0 20 40 60 80 100 120 140 160 180
TEOM in (ug/m3)
AE
TH
BC
in
(u
g/m
3)
TEOM vs AETH
Linear (TEOM vs AETH)
Slide 41
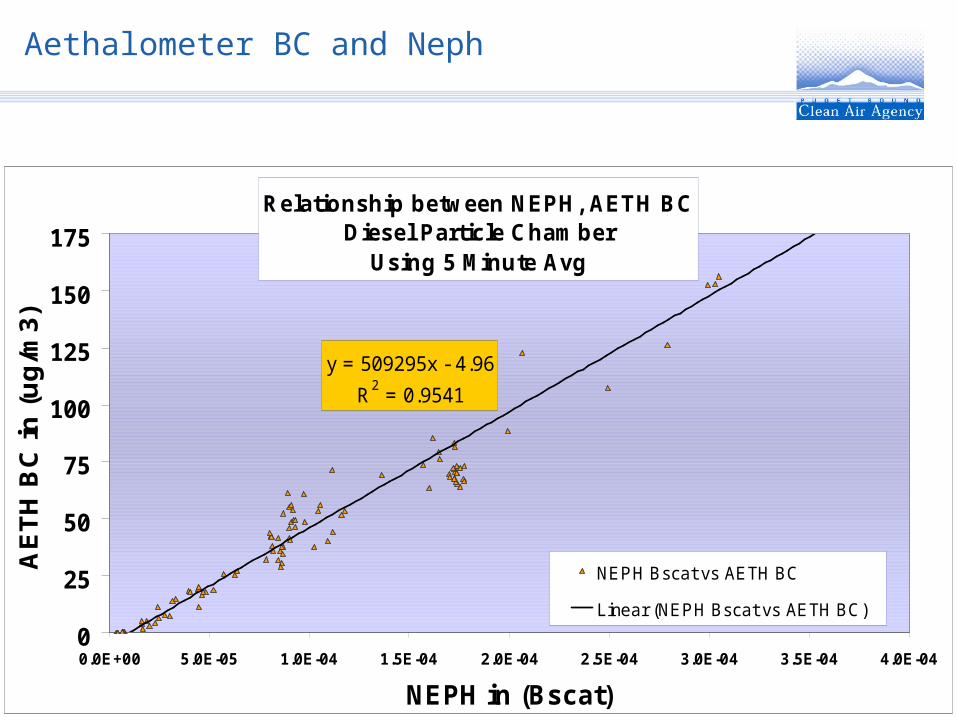
Aethalometer BC and Neph
Relationship between NEPH, AETH BCDiesel Particle Chamber
Using 5 Minute Avg
y = 509295x - 4.96
R2 = 0.9541
0
25
50
75
100
125
150
175
0.0E+00 5.0E-05 1.0E-04 1.5E-04 2.0E-04 2.5E-04 3.0E-04 3.5E-04 4.0E-04
NEPH in (Bscat)
AE
TH
BC
in
(u
g/m
3)
NEPH Bscat vs AETH BC
Linear (NEPH Bscat vs AETH BC)
Slide 42
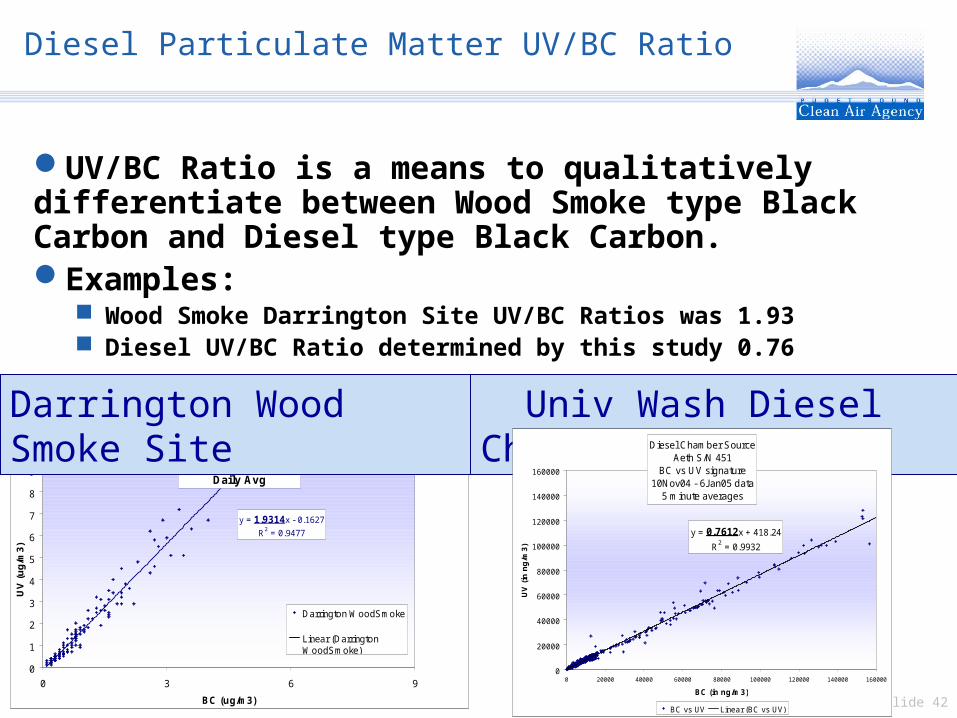
Diesel Particulate Matter UV/BC Ratio
UV/BC Ratio is a means to qualitatively differentiate between Wood Smoke type Black Carbon and Diesel type Black Carbon. Examples:
Wood Smoke Darrington Site UV/BC Ratios was 1.93 Diesel UV/BC Ratio determined by this study 0.76
Aeth Woodsmoke Contrast
Daily Avg
y = 1.9314x - 0.1627
R2 = 0.9477
0
1
2
3
4
5
6
7
8
9
0 3 6 9
BC (ug/m3)
UV
(u
g/m
3)
Darrington WoodSmoke
Linear (DarringtonWoodSmoke)
Darrington Wood Smoke Site Univ Wash Diesel ChamberDiesel Chamber Source
Aeth S/N 451BC vs UV signature
10Nov04 - 6Jan05 data5 minute averages
y = 0.7612x + 418.24
R2 = 0.9932
0
20000
40000
60000
80000
100000
120000
140000
160000
0 20000 40000 60000 80000 100000 120000 140000 160000
BC (in ng/m3)
UV
(in
ng
/m3
)
BC vs UV Linear (BC vs UV)

Slide 43
Pilot Study Preliminary Findings
When monitoring fine particles from a specific diesel source, the light scattering instrument (Nephelometer) and the light absorption instrument (Aethalometer) yield different results than what we see in the ambient atmosphere.
DPM Particles absorb light at 880 nm. DPM Particles scatter less light than other PM 2.5 particles when measuring with the Nephelometer.
The Aethalometer BC channel does a fairly good job measuring DPM particles in terms of g/m3 as compared to the PM 2.5 TEOM.
Combined with the knowledge of results at our wood smoke dominated sites, the UV channel does a good job identifying the difference between the wood smoke generated PM 2.5 particles and the DPM generated PM 2.5 particles
Slide 44
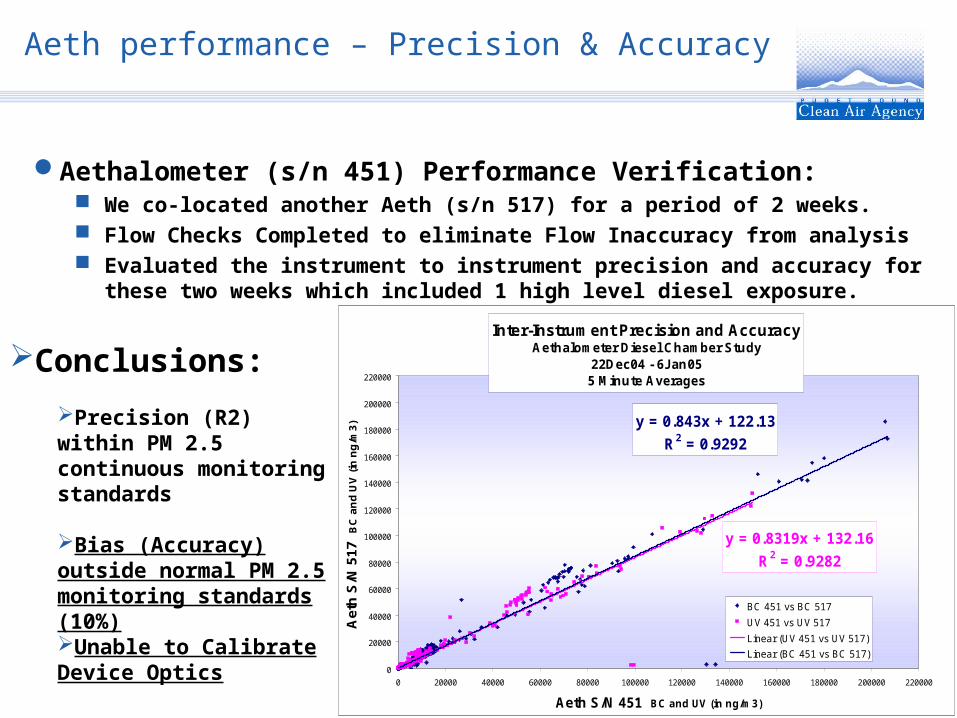
Aeth performance – Precision & Accuracy
Aethalometer (s/n 451) Performance Verification: We co-located another Aeth (s/n 517) for a period of 2 weeks. Flow Checks Completed to eliminate Flow Inaccuracy from analysis Evaluated the instrument to instrument precision and accuracy for these two
weeks which included 1 high level diesel exposure.
Conclusions:
Precision (R2) within PM 2.5 continuous monitoring standards
Bias (Accuracy) outside normal PM 2.5 monitoring standards (10%)Unable to Calibrate Device Optics
Inter-Instrument Precision and Accuracy Aethalometer Diesel Chamber Study
22Dec04 - 6Jan055 Minute Averages
y = 0.8319x + 132.16
R2 = 0.9282
y = 0.843x + 122.13
R2 = 0.9292
0
20000
40000
60000
80000
100000
120000
140000
160000
180000
200000
220000
0 20000 40000 60000 80000 100000 120000 140000 160000 180000 200000 220000
Aeth S/N 451 BC and UV (in ng/m3)
Ae
th S
/N 5
17
BC
an
d U
V (
in n
g/m
3)
BC 451 vs BC 517
UV 451 vs UV 517
Linear (UV 451 vs UV 517)
Linear (BC 451 vs BC 517)
Slide 45
Maintenance Issues
Federal Reference Method (1 in 3) Use R&P 2025 Sequential Samplers Problems with Leak Checks Going into Stop Mode causes a lot of filter data retrieval and filter
exchange problems
R&P TEOM and/or TEOM FDMS (Continuous) Generally, R&P is very good about Service and Manuals We spend more time troubleshooting these than what is desirable, but
we have had good data completeness numbers.
Radiance Research Nephelometers (Continuous) Technology and Device very well understood. Service from Radiance Research lacks
Met-One Beta Attenuation Monitors (Semi-Continuous) Met One Service very good Problems with Leak Checks and Flow Checks New to us, so we’re getting used to the Software Interfaces.
Slide 46
Summary
2003 Data suggests that the FDMS (Filter Dynamics Measurement System) sees aerosol that possibly volatilize from other sampling systems
For example: Nephelometer uses a heated probe to knock out the moisture effects
that we see in certain environmental conditions TEOM is heated to 50° C in Summer and 30° C in Winter to maintain a
constant operating temperature for more consistent measurement FRM is kept near ambient by it’s internal pump, but there could be
volatiles that come off the filters before they are weighed in the laboratory.

Slide 47
Summary
All of the devices seem to do a credible job
No one device is perfect!
Determining network decisions Know the customer Cost and operation
Slide 48
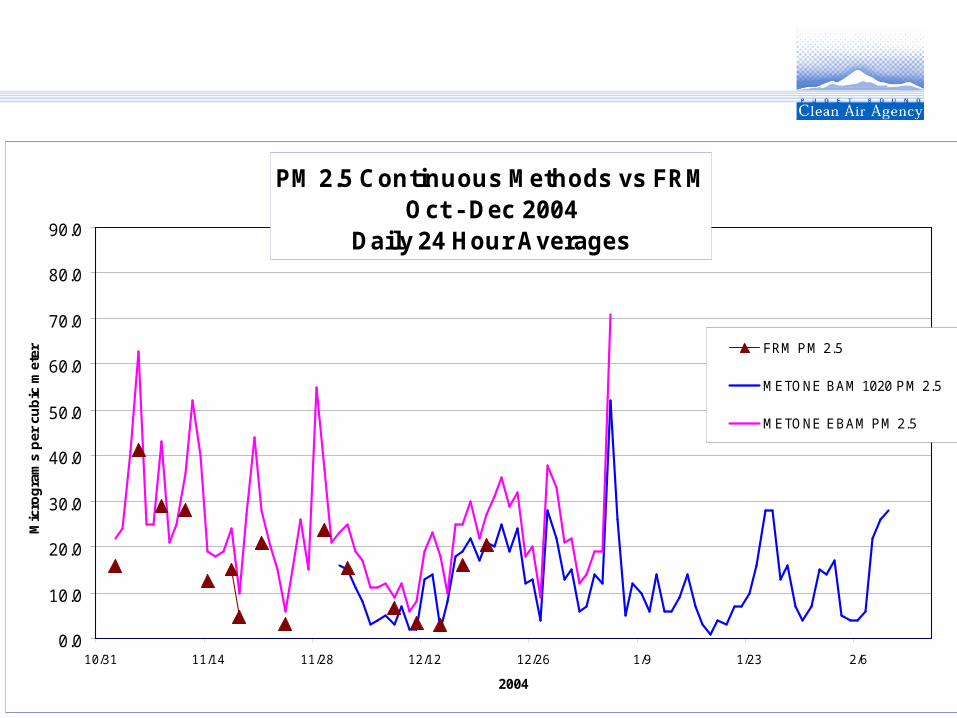
PM 2.5 Continuous Methods vs FRMOct - Dec 2004
Daily 24 Hour Averages
0.0
10.0
20.0
30.0
40.0
50.0
60.0
70.0
80.0
90.0
10/31 11/14 11/28 12/12 12/26 1/9 1/23 2/6
2004
Mic
rog
ram
s p
er c
ub
ic m
eter
FRM PM 2.5
METONE BAM 1020 PM 2.5
METONE EBAM PM 2.5