working together in nrm: a snapshot of our progress in 2012
TRANSCRIPT

Page 1
Working together in NRM: a snapshot of our progress in 2012
Progress has been made against 92% of all targets

Page 2
Message from the SA MDB NRM Board Presiding MemberA review of progress towards the Management Action Targets (MATs) within the Regional NRM Plan has just been completed, which informs you of our progress in the first three years of implementing the Regional NRM Plan.
It was pleasing to discover that progress has been made against 92% of all targets with 60% of all targets either on track, ahead of schedule or achieved. It is important to recognise that this achievement is a whole of region achievement and is a result of all NRM activities carried out in the region, not just the NRM Board’s programs. This includes work of local landholders, volunteers, NRM Groups, Local Action Planning groups, Local Government, community groups, non-government organisations, industry groups and government departments.
Time and money provided by all of our broad NRM family has helped to achieve the progress so far. We ask the community for their continuing support and ongoing enthusiasm to make new progress towards the targets of the Regional NRM Plan into the future. So give yourself a pat on the back for a job well done but keep those sleeves rolled up as there is more work to do.
The NRM Board thanks everyone who participated in the target evaluation workshops, their contribution is greatly valued.
Sharon Starick Presiding Member South Australian Murray-Darling Basin Natural Resources Management Board
Achievement is a result of all NRM activities carried out within the region
“
“
Management Action Targets (MATs): the NRM Plan has 55 MATs that represent ‘stepping stones’ of achievement towards improving the condition of the region’s natural resources.
Planning timeframe:
3-5 yearsTracking Progress of the Regional NRM Plan
The focus of this report is on Management Action Target progress.

Page 3
How is the progress measured?Between June and August 2012 the South Australian Murray-Darling Basin Natural Resources Management (SA MDB NRM) Board initiated an evaluation to address the question “what progress are we making against the MATs”?
Individuals with relevant knowledge were brought together at a series of workshops to review a range of evidence and make an assessment of target progress.
The expert panels included SA MDB NRM Board members, staff of Natural Resources SA MDB, NRM Groups, Local Government, State Agencies and a number of non-government bodies such as Local Action Planning Groups.
How is progress reported in this report?Progress for each target is expressed as an achievement score with a confidence level rating and an explanatory statement to provide additional context as shown to the right. The ‘confidence rating’ indicates workshop participants’ level of confidence in allocating the achievement score based on information presented and discussion at the workshop.
Purple Swamphen. Photo: Callie Nickolai, Natural Resources, SAMDB
ACHIEVEMENT SCORE
LEVEL OF PROGRESS TOWARD ACHIEVING THE TARGET IN THE GIVEN TIMEFRAME
Achieved Target met
Ahead Progress ahead of what was expected
On track Progress as expected
Limited progress
Some progress but target not likely to be met
No progress No progress
Unclear Insufficient information
Resource Condition Targets (RCTs): our NRM Plan has 13 long term targets that reflect the desired state of our natural resources and contribute to achieving our vision for the region.
Vision: A healthy, living landscape meeting the social, environmental, economic and cultural needs of the community, and ensuring the rights and wellbeing of future generations.
Planning timeframe:
15-20 yearsPlanning timeframe:
50 years
Page 4
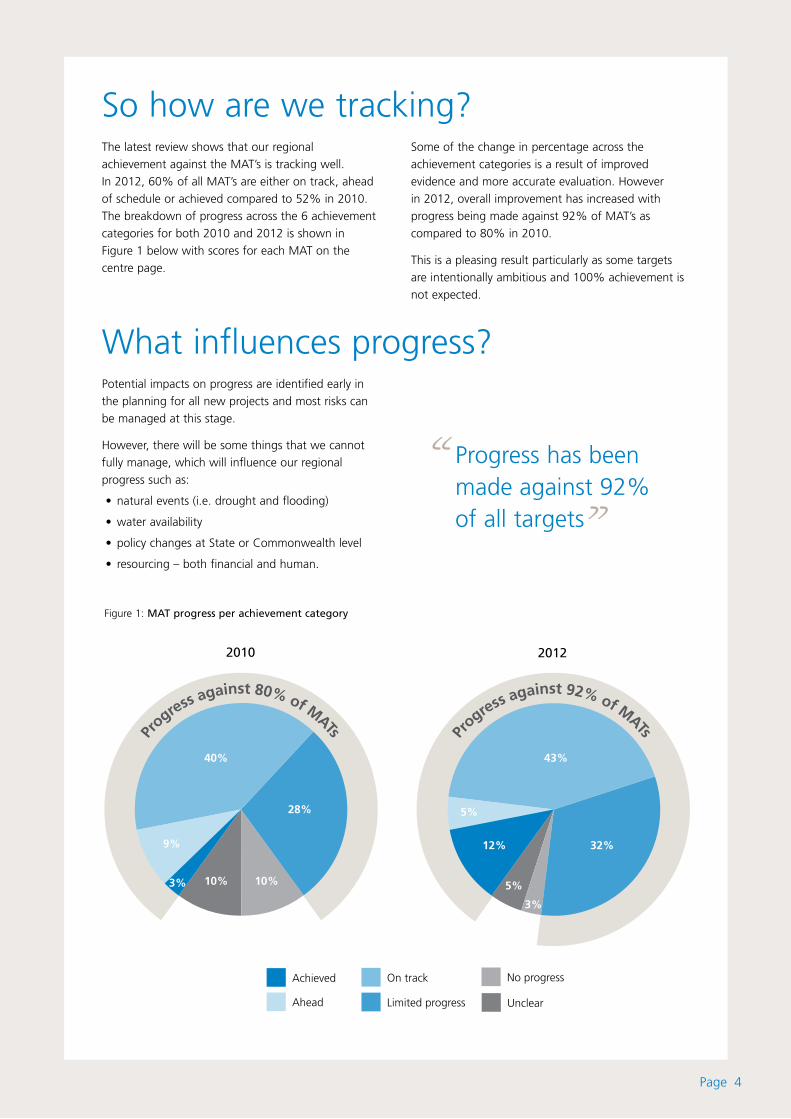
So how are we tracking? The latest review shows that our regional achievement against the MAT’s is tracking well. In 2012, 60% of all MAT’s are either on track, ahead of schedule or achieved compared to 52% in 2010. The breakdown of progress across the 6 achievement categories for both 2010 and 2012 is shown in Figure 1 below with scores for each MAT on the centre page.
Some of the change in percentage across the achievement categories is a result of improved evidence and more accurate evaluation. However in 2012, overall improvement has increased with progress being made against 92% of MAT’s as compared to 80% in 2010.
This is a pleasing result particularly as some targets are intentionally ambitious and 100% achievement is not expected.
What influences progress? Potential impacts on progress are identified early in the planning for all new projects and most risks can be managed at this stage.
However, there will be some things that we cannot fully manage, which will influence our regional progress such as:
• natural events (i.e. drought and flooding)
• water availability
• policy changes at State or Commonwealth level
• resourcing – both financial and human.
Figure 1: MAT progress per achievement category““ Progress has been
made against 92% of all targets
Limited progress
On track
Ahead
Achieved
Unclear
No progress
2010
40%
28%
32%9%
5%
12%
10% 10% 5%
43%
2012
3%
3%
Pr
ogress against 80% of MATs Pr
ogress against 92% of MATs

Page 5
MANAGEMENT ACTION TARGET ACHIEVEMENT SCORE
CONFIDENCE RATING SUPPORTING NOTES
80% increase in the number of people managing natural resources sustainably by 2030 (RCT: P1)
50% of regional community is aware of NRM (P1.1)
High
25% of the NRM community have the knowledge and skills to manage natural resources sustainably by 2014 (P1.2)
High
Increase the level of NRM volunteering in the SA MDB NRM Region above 1200 members (P1.3)
High 15% of residents are involved in NRM/environment groups and volunteering, which is more than double the statewide average. 43% of volunteers have been volunteering for more than 11 years.
Increase protection and preservation of Aboriginal culture by 80% by 2030 (RCT: P2)
50% increase in awareness of Aboriginal culture by 2014 (P2.1)
Low Clear increase within NRM service provider community and evidence of growing number of programs to increase awareness. The target does not adequately represent the desired change in understanding and behaviour and target is unlikely to be achieved by 2014. Measurement needs to improve to track progress.
50% increased participation of Aboriginal people in NRM (P2.2)
Medium Ongoing need for quality data about the full range of ways Aboriginal people are participating.
By 2014, the management of cultural sites and assets improved (P2.3)
Medium Some programs have improved management of specific sites and assets.
People working together to have communities living sustainably
PROGRESS ON AWARENESS, SKILLS, VOLUNTEERING AND PRESERVATION OF ABORIGINAL CULTURE
Working together in NRM: a snapshot of our progress in 2012

Page 6
MANAGEMENT ACTION TARGET ACHIEVEMENT SCORE
CONFIDENCE RATING SUPPORTING NOTES
All landscape development and management to have a neutral or beneficial impact on natural resources by 2030 (RCT: P3)
Effective institutional arrangements in place for all major stakeholder groups by 2014 (P3.1)
High Institutional arrangements in place or developing for major stakeholder groups, however more effort required to measure the effectiveness of arrangements. More work required for institutional arrangements with industry and Local Governments.
By 2014, all State and Local Government, and industry development plans and strategies align with the Regional NRM Plan (P3.2)
Low to Medium
Limited progress with State Government, good progress with Local Government, but uncertainty about alignment of industry plans. ‘Alignment’ is difficult with evolving plans from many stakeholders. Highly dynamic planning environment with a need for more comprehensive and frequent review.
By 2014, all development decisions are consistent with regional NRM goals (P3.3)
Medium Progress on this target is highly contingent on progress of MAT P3.2. Greater direction on development decisions is required from the NRM Board and other Government NRM Agencies. Further education and capacity building of development authorities and staff is required.
25% of natural resource managers have the knowledge and skills to identify and mitigate natural disaster risk by 2014 (P3.4)
Low Evidence available that many NR managers are undertaking natural disaster planning and some mitigation. Information is insufficient to judge the absolute amount and adequacy of skills and knowledge.
25% of priority NRM assets actively managed to enable effective response to natural disaster by 2014 (P3.5)
Low There is evidence that some NRM assets are being managed for effective response to some natural disasters.
30% of public recreation and tourism areas are valued and managed sustainably by 2014 (P3.6)
Low Large numbers of public and recreation areas have systems in place for sustainable management. However, pressures leading to degradation remain and resources for management are limited. No assessment was made of how areas are ‘valued’.
PROGRESS ON DEVELOPMENT AND MANAGEMENT OF RESOURCES
People working together to have communities living sustainably
Working together in NRM: a snapshot of our progress in 2012

Page 7
MANAGEMENT ACTION TARGET ACHIEVEMENT SCORE
CONFIDENCE RATING SUPPORTING NOTES
Reduce greenhouse gas emissions in the SA Murray-Darling Basin by 60% by 2050 (RCT: A1)
Voluntary renewable energy use at 20% and support for renewable energy generation in the region by 2014 (A1.1)
High On track for domestic. More evidence required for industry uptake. Good evidence of support for renewable energy generation.
Natural resource affecting industries adopting climate change sector agreements by 2014 (A1.2)
High State government focus is moving to ‘regional’ rather than ‘sector’ agreements.
By 2014 increase carbon efficiencies of SA MDB NRM Board vehicle fleet and buildings by 20% and 10% respectively (A1.3)
Vehicle: High Reduction in fleet size and change over to more efficient vehicles has contributed most to target achievement
Building: Medium Changes in purchasing of energy has contributed to CO2 efficiencies. Building ownership influences ability to improve building efficiency.
Revegetation for future carbon (CO2-E) sequestration of 126,000 tonnes by 2014 (A1.4)
High There is uncertainty about the contribution from private sector and the amount of clearance that has occurred. A new DEWNR project will better assess extent.
100% of natural resource managers incorporating climate change adaptation into their forward planning or management by 2030 (RCT: A2)
25% of natural resource managers incorporating climate change adaptation into their forward planning or management by 2014 (A2.1)
High Strong indication of many natural managers incorporating climate change adaptation into their forward planning or management. However, there is little information on adequacy of adoption.
PROGRESS TO REDUCE GREENHOUSE GAS EMISSIONS AND INCORPORATING CLIMATE CHANGE INTO MANAGEMENT
Atmosphere Working together to achieve a clean and healthy atmosphere with effective adaptation to climate change
Working together in NRM: a snapshot of our progress in 2012

Page 8
MANAGEMENT ACTION TARGET ACHIEVEMENT SCORE
CONFIDENCE RATING SUPPORTING NOTES
Native ecosystem extent increased to 53% of the Region and native ecosystem condition improved across the Region by 10% by 2030 (RCT: B1)
Protect and manage an additional 10,000ha of existing priority remnant native ecosystems by 2014 (B1.1)
High Approximately 20,000 ha have been protected and managed for biodiversity conservation between 2008 and 2012.
The extent of native ecosystems is increased by 15,000ha by 2014 (B1.2)
High Various revegetation projects have been undertaken, however, the total remains below 15,000 ha.
A 10% improvement in the condition of 25% of native ecosystems in the region by 2014 (B1.3)
Low Programs are in place to improve the extent and condition of native ecosystems, however, there is insufficient monitoring data to report the amount of improvement or to understand concurrent declines in condition.
Increase community appreciation of native ecosystems and species by 30% by 2014 (B1.4)
High There are a number of programs working to build community appreciation and conservation of native ecosystems. 91% of respondents to a region wide survey report that they value native species as important (2012 data), however, no trend data is currently available.
PROGRESS TO IMPROVE CONDITION OF NATIVE ECOSYSTEMS
Biodiversity Working together to achieve a healthy and ecologically productive environment that sustains biodiversity and is valued by the community
Working together in NRM: a snapshot of our progress in 2012

Page 9
MANAGEMENT ACTION TARGET ACHIEVEMENT SCORE
CONFIDENCE RATING SUPPORTING NOTES
By 2030, water-dependent ecosystems in priority areas maintain ecological function, resilience and biodiversity (RCT: B2)
75% of priority floodplains and wetlands actively managed as per management plans by 2014 (B2.1)
High Progress has been made in developing and implementing management plans. While management is being undertaken, not all floodplains and wetlands are being managed to the full extent described in plans due to resource constraints.
Adoption of sustainable grazing practices in Water Dependent Ecosystems by 2014 (B2.2)
Medium There has been adoption of sustainable grazing practice in many WDE, however, some remain subject to unsustainable grazing.
A 20% increase in connectivity between/within aquatic and terrestrial ecosystems of the Lower Lakes, Coorong and marine environments by 2014 (B2.3)
High Works are underway to increase connectivity, however, survival of vegetation will affect achievement.
Reduce the extent of priority pest plants and animals in priority aquatic ecosystems by 10% by 2014 (B2.4)
Fish pests and aquatic
weeds:
Medium Control of fish pests and aquatic weeks is difficult but some progress is being made (i.e. priority sites – e.g. through use of carp screens).
Other priority pests:
Medium Some progress for many pest plants and animals (e.g. local control of willows, rabbits and pigs).
No species or ecosystem moves to a higher risk category and 50% of species move to a lower risk category by 2030 (RCT: B3)
Reduce the impact of critical threats on priority threatened species by 2014 (B3.1)
Medium The impact of threats on some species are being managed with positive results. Substantial effort is directed to reduction of perceived threats, however, there is insufficient evidence that threat reduction efforts are reducing impacts on many priority threatened species.
Reduce the impact of critical threats on EPBC listed threatened ecosystems by 2014 (B3.2)
Medium There is substantial effort to reduce impact of threats on all EPBC listed ecosystems, however, large areas of these ecosystems remain inadequately managed to reduce critical threats.
PROGRESS TO IMPROVE WATER-DEPENDANT ECOSYSTEMS AND REDUCE IMPACTS ON THREATENED SPECIES
Biodiversity Working together to achieve a healthy and ecologically productive environment that sustains biodiversity and is valued by the community
Working together in NRM: a snapshot of our progress in 2012

Page 10
MANAGEMENT ACTION TARGET ACHIEVEMENT SCORE
CONFIDENCE RATING SUPPORTING NOTES
A 10% improvement in soil and land condition from 2008/2009 levels by 2030 (RCT: L1)
Dryland water use efficiency (WUE) is maintained at 80% by 2014 (L1.1)
Low to Medium
80% is an ambitious target that many landholders will have difficulty achieving due to external influences. Target aims to promote improvement in WUE in grain/pulse crops. There are indicators of progress toward this target, however, more monitoring and analysis is required to report quantitative progress. Technical analysis of monitoring data needs to be improved.
90% of landholders are managing pastures sustainably by 2014 (L1.2)
Medium Good evidence of progress in managing for adequate ground cover. No adequate measures of total “sustainability” of pasture management.
50% increase in participation in early warning system for new pest incursions (communication network (L1.3)
Medium There is insufficient quantification of participation and adequacy of surveillance, however progress has been made in increasing capacity for early warning. There are indicators of increased surveillance for new pests on agricultural land and priority incursion pathways.
Species specific control targets for 80% of priority pest plant and animal species are met by 2014 (L1.4)
Weeds: High Most high priority pest species control targets are being met. However, there is less progress for species in the lower priority control categories.
Pests: High
The area of land affected by land degradation processes is reduced by 2030 (RCT: L2)
By 2014 achieve a 6% improvement in wind erosion protection for agricultural cropping land (L2.1)
High The uptake of protective techniques has been high for 10-20 years and wind erosion protection has greatly increased. The future trend is likely to be a slower improvement without additional effort (i.e. R&D, extension, incentives).
By 2014 a 3% increase in the area of grazing land with adequate soil surface cover (based on 2009 levels) (L2.2)
High Lack of baseline and follow-up data.
7,500 hectares of appropriate perennial vegetation (for management of dryland salinity) established in priority areas by 2014 (L2.3)
Medium to High
There are ongoing efforts to record spatial data about perennial vegetation establishment.
Net balance alkaline inputs are equal to acidification levels (L2.4)
High Acidity has increased over the past 10 years because the amount of lime applied each year (10,000 tonnes in 2010/11) is not meeting the annual liming requirement (30,000 tonnes) and the deficit is accumulating.
PROGRESS TO IMPROVE SOIL AND LAND CONDITION
Land Working together to achieve sustainable, productive landscapes
Working together in NRM: a snapshot of our progress in 2012

Page 11
Water Working together to achieve water resources that are healthy, valued and supporting of communities and thriving ecosystems
PROGRESS ON WATER RESOURCE MANAGEMENT
MANAGEMENT ACTION TARGET ACHIEVEMENT SCORE
CONFIDENCE RATING SUPPORTING NOTES
All water resources are managed sustainably by 2018 (RCT: W1)
100% of water resources have a risk assessment by 2014 (W1.1)
High Progress has been made in the seven prescribed water resource areas. There has been no progress in the non-prescribed areas including Burra Creek Catchments. Surface and groundwater status reporting (for prescribed resources) and climate change impact investigations currently being undertaken will inform future risk assessments. The Basin Plan will be a driver to undertake assessments across all water resources areas.
Key water management policies in place for priority water resources by 2014 (W1.2)
High Policy development is on track. Implementation is a continual process e.g. continuing activity for return of low flows in Marne and EMLR.
The environment’s right to water is secured through legislation and recognised and accepted by the community, politicians and other stakeholders as a legitimate user by 2014 (W1.3)
Right to water secured:
High Water Reserve is providing greater security for environmental water. Draft Basin Plan has recognised the right for environmental water.
Recognised and Accepted:
Medium Greater recognition and action on environments right to water is still needed from community, politicians and other stakeholders. Politicians and other stakeholders still have to fight for water for the environment over interstate and alternate uses.
Minimise impacts of irrigation induced saline groundwater flows to water or ecosystem assets (W1.4)
Medium Highland groundwater mound heights have reduced over 10 years, however, the influence of recent drought conditions has focused attention on irrigation management and reduced irrigation applications. There is insufficient evidence linking changes in saline groundwater flow to change in impact on assets. Contributions to this target from Salt Interception Schemes are high. Natural flooding has also contributed.
Complete a basinwide prioritisation process for the development of Land and Water Management Plans by 2012 (W1.5)
High The prioritization process has been undertaken for some areas (e.g. River Murray). However, prioritization is underpinned by data availability and there is a lack of data in some areas.
90% of the irrigated area achieving WUE as prescribed by the relevant WAP by 2014 (W1.6)
High Data on WUE is limited for most prescribed areas, leading to uncertainty about progress. There is an increasing area using efficient irrigation systems which may lead to progress toward this target.
Working together in NRM: a snapshot of our progress in 2012

Page 12
MANAGEMENT ACTION TARGET ACHIEVEMENT SCORE
CONFIDENCE RATING SUPPORTING NOTES
Improve water quality to achieve the regionally endorsed environmental values by 2030 (RCT: W2)
Maintain SA’s position on MDBC Salinity Register in balance by 2014 (W2.1)
High Same as 2010: SA has on-going decline in credits with current projection of falling out of balance by around 2034. Measurement of this target is confounded by changes in data availability, modelling and conversion to dollar units.
By 2014, all appropriate houseboat, vessel (including facilities), and marina strategies, policies and guidelines adopted and implemented (W2.2)
High Further strategy and policy development is required to facilitate further contribution of this target to improving water quality.
Improve water quality to achieve the regionally endorsed environmental values by 2030 (RCT: W2)
70% of treated wastewater generated in Region to be reused by 2014 (W2.3)
High Rates of reuse fluctuate with climate variability.
Influence investment in cross-state water quality (non-salinity) improvements by 2012 (W2.4)
High Progress towards this target has been delayed by slow progress in release of Basin Plan.
50% of land in the agricultural zone to have neutral or beneficial effects on water assets by 2014 (W2.5)
Low Progress in riparian fencing and protection has been undertaken but broad impacts have not significantly changed.
At least one major settlement (>2000 people) with neutral or beneficial effects on water assets by 2014 (W2.6)
High No settlement currently has at least neutral net effect on water assets, however, one settlement may achieve this by 2014.
By 2014 70% of water used shall be taken from sources that are fit-for-purpose (W2.7)
Medium Substantial achievements have been made in ensuring fit-for-purpose water use in the region.
PROGRESS ON WATER QUALITY
Water Working together to achieve water resources that are healthy, valued and supporting of communities and thriving ecosystems
Working together in NRM: a snapshot of our progress in 2012

Page 13
MANAGEMENT ACTION TARGET ACHIEVEMENT SCORE
CONFIDENCE RATING SUPPORTING NOTES
Water is available to enhance and maintain the ecological character of water-dependent ecosystems (RCT: W3)
Murray Mouth open 100% of time (by dredging) by 2014 (W3.1)
High Two years of high flows have achieved a naturally open mouth.
A robust decision making framework for annual allocations of environmental water is established and implemented by 2011 (W3.2)
High A framework is in place under arrangements of the Draft Basin Plan. SA Government has a plan for annual prioritization and is developing a plan for long term environmental water allocations in SA.
By 2014, 50% of water-dependant ecosystems are delivered their environmental water requirement as identified by the relevant WAP or other policy (W3.3)
River Murray System:
High Partially delivered by unregulated flows in 2011/12. Insufficient evidence available to determine if 50% has been achieved (depending on time frame measured and recurrence of delivery of flows) i.e. the delivery of flows once in a 5 year period does not necessarily mean a WDE has been delivered its EWR.
Marne and EMLR:
Medium Limited implementation of relevant policies. Some progress may have resulted from unregulated flows.
Re-establish Coorong and Lower Lakes ecological communities present pre-drought (2002) by 2014 (W3.4)
High Some ecological communities are showing signs of recovery. Availability of environmental water, including variability / timing of water remains an important driver of this target. There is ongoing work to understand ecological processes.
Barrage fishways in operation at least between June and February and whenever possible including additional attractant flows by 2014 (W3.5)
High The fishways are the first to open and the last to close. Attractant flows have been implemented. Adaptive management has been informed by research / monitoring, and environmental water has been used to meet the operation target.
Lower Lake levels maintained between 0.35m and 0.75m AHD to achieve environmental benefits through implementation of Lakes and Barrages Operation Strategy (W3.6)
High Lower Lake levels have been maintained between 0.35m and 0.75m since 2010 (were low before 2010), however, the variation in levels has been low and more variability including lower levels is desirable. The revised levels for this target are now 0.4m and 0.83m. This target is on-track due to high flows but future achievement depends on implementation of the Lakes and Barrages Operating Strategy.
River operations undertaken to maximise inundation at priority floodplain sites and to improve connectivity between the floodplain and the river by 2014 (W3.7)
Low There has been some progress in improving structures to facilitate inundation, however, no progress in stream weir pool manipulation and enhancing high-flow flow events for environmental outcomes.
PROGRESS TO ENHANCE THE ECOLOGICAL CHARACTER OF WATER-DEPENDANT ECOSYSTEMS
Water Working together to achieve water resources that are healthy, valued and supporting of communities and thriving ecosystems
Working together in NRM: a snapshot of our progress in 2012
Page 14
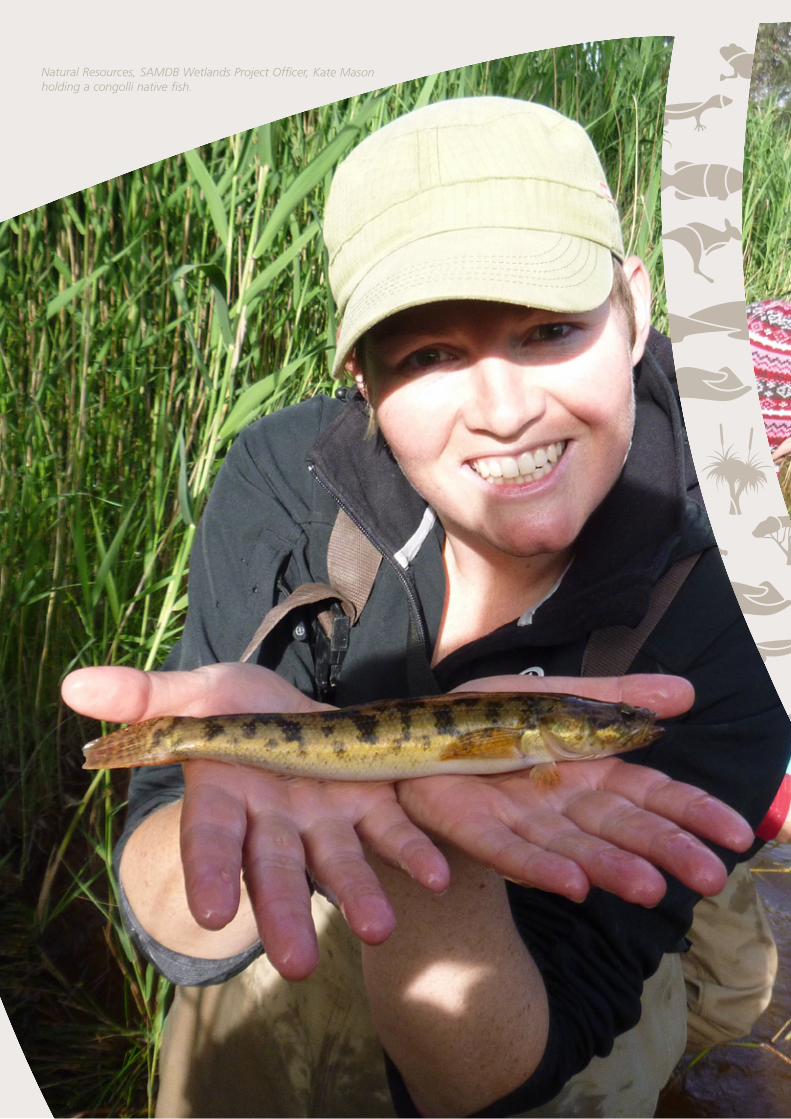
Natural Resources, SAMDB Wetlands Project Officer, Kate Mason holding a congolli native fish.
Page 15
Thanks to our partnersThe SA MDB NRM Board would like to thank all those who have contributed to implementation and assessment of the Regional NRM Plan.
Copyright© South Australian Murray-Darling Basin Natural Resources Management Board 2012
This publication is copyrighted.
Apart from any use permitted under the Copyright Act 1968, no part may be reproduced by any process without the prior permission of the SA MDB NRM Board. All requests and enquiries concerning reproduction and rights should be directed to SA MDB NRM Board, PO Box 2343, Murray Bridge SA 5253.
DisclaimerAlthough reasonable care has been taken in preparing the information contained in this publication, neither the South Australian Murray-Darling Basin Natural Resources Management Board nor the other contributing authors accept any responsibility or liability for any losses of whatever kind arising from the interpretation or use of the information set out in this publication.
Printed December 2012 | FIS91942
Governmentof South Australia
Coober Pedy
Roxby DownsLeighCreek
Ceduna
Port Augusta
Whyalla Port Pirie
Clare
Port Lincoln
Renmark
Adelaide
MurrayBridge
VictorHarbor
Naracoorte
Mount Gambier
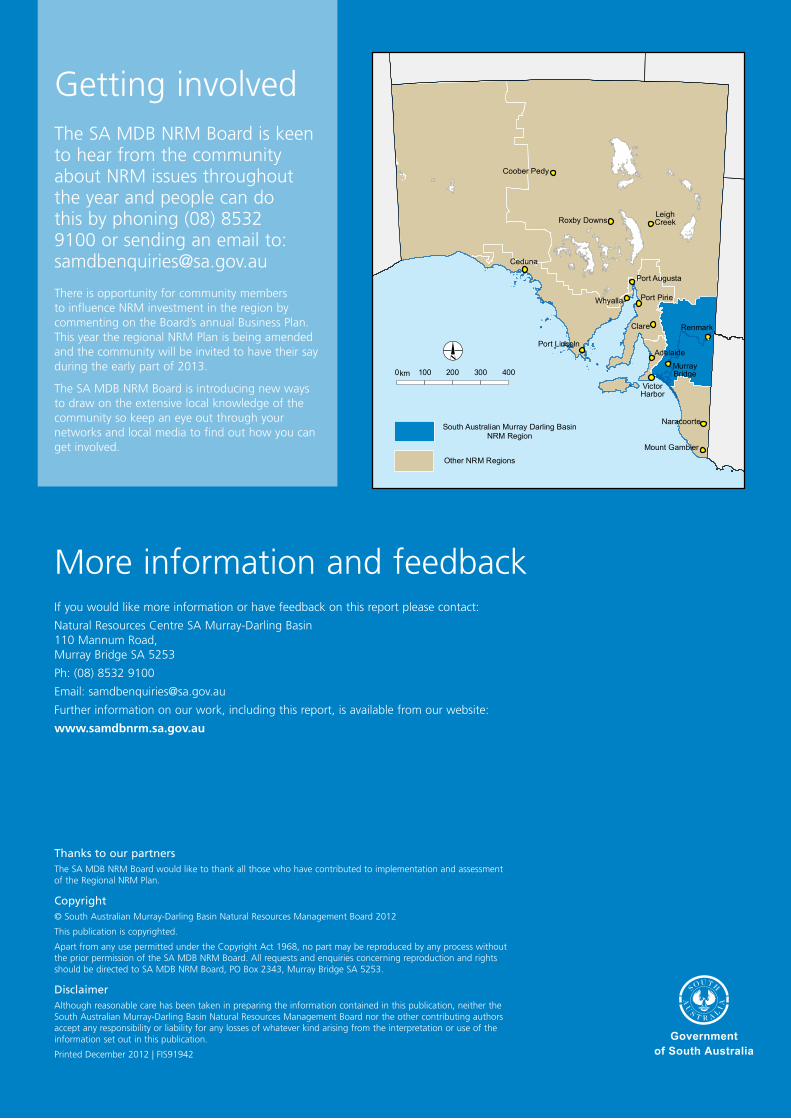
South Australian Murray Darling BasinNRM Region
Other NRM Regions
0 100 200 300 400km
More information and feedbackIf you would like more information or have feedback on this report please contact:
Natural Resources Centre SA Murray-Darling Basin 110 Mannum Road, Murray Bridge SA 5253
Ph: (08) 8532 9100
Email: [email protected]
Further information on our work, including this report, is available from our website:
www.samdbnrm.sa.gov.au
Getting involvedThe SA MDB NRM Board is keen to hear from the community about NRM issues throughout the year and people can do this by phoning (08) 8532 9100 or sending an email to: [email protected]
There is opportunity for community members to influence NRM investment in the region by commenting on the Board’s annual Business Plan. This year the regional NRM Plan is being amended and the community will be invited to have their say during the early part of 2013.
The SA MDB NRM Board is introducing new ways to draw on the extensive local knowledge of the community so keep an eye out through your networks and local media to find out how you can get involved.