workplace relations and the competitiveness of the ... · pdf fileworkplace relations and the...
TRANSCRIPT
KPMG, an Australian partnership and a member firm of the KPMG network of independent member firms affiliated with KPMG International Cooperative (KPMG International), a Swiss entity.
Liability limited by a scheme approved under Professional Standards Legislation.
Workplace Relations and the Competitiveness of the Australian Resources Sector
Report prepared for the Australian Mines and Metals Association
12 March 2015
© 2015 KPMG, an Australian partnership and a member firm of the KPMG network of independent member firms affiliated with KPMG International Cooperative (“KPMG International”), a Swiss entity. All rights reserved. The KPMG name, logo and “cutting through complexity” are registered trademarks or trademarks of KPMG International. Liability limited by a scheme approved under Professional Standards Legislation. March 2015
Page 2
Contents Glossary and acronyms............................................................................................................... 3
1 Introduction ........................................................................................................................ 15
2 Background......................................................................................................................... 17
3 Approach ............................................................................................................................ 21
4 Economic contribution of the Australian resources sector ............................................ 26
5 International competitiveness of the Australian resources sector ................................ 51
6 Workplace relations and the Australian resources sector ............................................. 73
7 Potential changes to the workplace relations framework .............................................. 92
8 Economic implications of changes in workplace relations ............................................ 96
9 Quantitative analysis of changes in workplace relations ............................................. 122
Appendix A Industry definition ........................................................................................... 130
Appendix B Previous economic analysis findings ............................................................ 131
Inherent Limitations
This report has been prepared as outlined in the Scope Section. The services provided in connection with this engagement comprise an advisory engagement, which is not subject to assurance or other standards issued by the Australian Auditing and Assurance Standards Board and, consequently no opinions or conclusions intended to convey assurance have been expressed.
No warranty of completeness, accuracy or reliability is given in relation to the statements and representations made by, and the information and documentation provided by, the Australian Mines and Metals Association’s management, personnel and stakeholders consulted as part of the process.
KPMG does not make any statement in this report as to whether any forecasts or projections included in this report will be achieved, or whether the assumptions and data underlying any prospective economic forecasts or projections are accurate, complete or reasonable. KPMG does not warrant or guarantee the achievement of any such forecasts or projections. Any economic projections or forecasts in this report rely on economic inputs that are subject to unavoidable statistical variation. They also rely on economic parameters that are subject to unavoidable statistical variation. While all care has been taken to account for statistical variation, care should be taken whenever considering or using this information. There will usually be differences between forecast or projected and actual results, because events and circumstances frequently do not occur as expected or predicted, and those differences may be material. Any estimates or projections will only take into account information available to KPMG up to the date of this report and so findings may be affected by new information. Events may have occurred since this report was prepared, which may impact on it and its findings.
KPMG have indicated within this report the sources of the information provided. We have not sought to independently verify those sources unless otherwise noted within the report. KPMG is under no obligation in any circumstance to update this report, in either oral or written form, for events occurring after the report has been issued in final form. The findings in this report have been formed on the above basis.
Third Party Reliance
This report is solely for the purpose set out in the Scope Section and for the Australian Mines and Metals Association’s information, and is not to be used for any other purpose. Other than our responsibility to the Australian Mines and Metals Association, neither KPMG nor any member or employee of KPMG undertakes responsibility arising in any way from reliance placed by a third party on this report. Any reliance placed is that party’s sole responsibility. This report may be made available on the Australian Mines and Metals Association’s and/or the Productivity Commission’s website. Third parties who access the report are not a party to KPMG’s engagement letter with the Australian Mines and Metals Association and, accordingly, may not place reliance on this report. KPMG shall not be liable for any losses, claims, expenses, actions, demands, damages, liabilities or any other proceedings arising out of any reliance by a third party on the report.

© 2015 KPMG, an Australian partnership and a member firm of the KPMG network of independent member firms affiliated with KPMG International Cooperative (“KPMG International”), a Swiss entity. All rights reserved. The KPMG name, logo and “cutting through complexity” are registered trademarks or trademarks of KPMG International. Liability limited by a scheme approved under Professional Standards Legislation. March 2015
Page 3
Glossary and acronyms
ABS Australian Bureau of Statistics
AFMEPKIU Automotive, Food, Metals, Engineering, Printing and Kindred Industries Union. Also known as AMWU (Australian Manufacturing Workers Union).
AFPC Australian Fair Pay Commission
AIRC Australian Industrial Relations Commission
Agreement Enterprise agreements and other registered agreements set out minimum employment conditions and can apply to one business, a group of businesses or a collective group of employees.
AMMA Australian Mines and Metals Association
ASX Australian Stock Exchange
ATO Australian Taxation Office
Australian Workplace Agreement (AWA)
An AWA is a written agreement between the employer and an individual employee which records the terms and conditions of employment.
Award The minimum wages and conditions an employee is entitled are set out in awards (also known as modern awards). Awards are industry or occupation-based, and apply to employers and employees who perform work covered by the award.
‘Better Off Overall’ Test (BOOT)
A test that the Fair Work Commission (FWC) uses to assess enterprise agreements against modern awards. Except in limited circumstances, an enterprise agreement will not be approved by FWC unless it passes the ‘Better Off Overall’ Test. An enterprise agreement will pass this test where FWC is satisfied that each employee that would be covered by the agreement would be “better off overall” if the agreement applied to them, rather than the relevant modern award.
BREE Bureau of Resources and Energy Economics
CFMEU Construction, Forestry, Mining and Energy Union
CIS Centre for Independent Studies
DEEWR Department of Education, Employment and Workplace Relations
Dutch disease The decrease in price competitiveness of a country’s manufactured exports as a result of large increases in income from natural resource discovery and a strong currency.
Enterprise Bargaining Agreements (EBAs)
Enterprise bargaining is the process of negotiation generally between the employer, employees and their bargaining representatives with the goal of making an enterprise agreement.
Fair Work Act (2009) The main legislation that governs the employee / employer relationship in Australia.
Fair Work Ombudsman Enforces compliance with the Fair Work Act (2009), related legislation, awards and registered agreements. The Ombudsman also helps employers and employees by providing advice and education on pay rates and workplace conditions.
FOB Free on board
FTA Free Trade Agreement
FWA Fair Work Australia, renamed the Fair Work Commission on 1 January 2013
FWC Fair Work Commission
Gross Domestic Product (GDP)
The total dollar value of all goods and services produced within an economy.
© 2015 KPMG, an Australian partnership and a member firm of the KPMG network of independent member firms affiliated with KPMG International Cooperative (“KPMG International”), a Swiss entity. All rights reserved. The KPMG name, logo and “cutting through complexity” are registered trademarks or trademarks of KPMG International. Liability limited by a scheme approved under Professional Standards Legislation. March 2015
Page 4
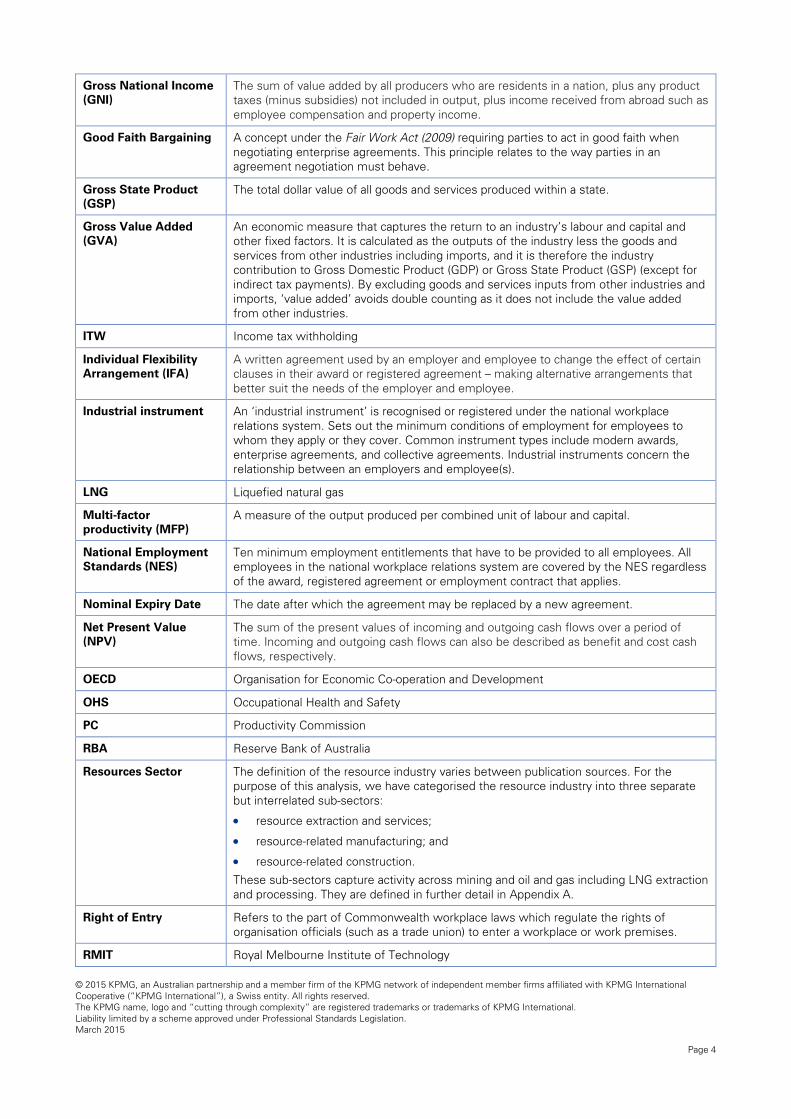
Gross National Income (GNI)
The sum of value added by all producers who are residents in a nation, plus any product taxes (minus subsidies) not included in output, plus income received from abroad such as employee compensation and property income.
Good Faith Bargaining A concept under the Fair Work Act (2009) requiring parties to act in good faith when negotiating enterprise agreements. This principle relates to the way parties in an agreement negotiation must behave.
Gross State Product (GSP)
The total dollar value of all goods and services produced within a state.
Gross Value Added (GVA)
An economic measure that captures the return to an industry’s labour and capital and other fixed factors. It is calculated as the outputs of the industry less the goods and services from other industries including imports, and it is therefore the industry contribution to Gross Domestic Product (GDP) or Gross State Product (GSP) (except for indirect tax payments). By excluding goods and services inputs from other industries and imports, ‘value added’ avoids double counting as it does not include the value added from other industries.
ITW Income tax withholding
Individual Flexibility Arrangement (IFA)
A written agreement used by an employer and employee to change the effect of certain clauses in their award or registered agreement – making alternative arrangements that better suit the needs of the employer and employee.
Industrial instrument An ‘industrial instrument’ is recognised or registered under the national workplace relations system. Sets out the minimum conditions of employment for employees to whom they apply or they cover. Common instrument types include modern awards, enterprise agreements, and collective agreements. Industrial instruments concern the relationship between an employers and employee(s).
LNG Liquefied natural gas
Multi-factor productivity (MFP)
A measure of the output produced per combined unit of labour and capital.
National Employment Standards (NES)
Ten minimum employment entitlements that have to be provided to all employees. All employees in the national workplace relations system are covered by the NES regardless of the award, registered agreement or employment contract that applies.
Nominal Expiry Date The date after which the agreement may be replaced by a new agreement.
Net Present Value (NPV)
The sum of the present values of incoming and outgoing cash flows over a period of time. Incoming and outgoing cash flows can also be described as benefit and cost cash flows, respectively.
OECD Organisation for Economic Co-operation and Development
OHS Occupational Health and Safety
PC Productivity Commission
RBA Reserve Bank of Australia
Resources Sector The definition of the resource industry varies between publication sources. For the purpose of this analysis, we have categorised the resource industry into three separate but interrelated sub-sectors:
• resource extraction and services;
• resource-related manufacturing; and
• resource-related construction.
These sub-sectors capture activity across mining and oil and gas including LNG extraction and processing. They are defined in further detail in Appendix A.
Right of Entry Refers to the part of Commonwealth workplace laws which regulate the rights of organisation officials (such as a trade union) to enter a workplace or work premises.
RMIT Royal Melbourne Institute of Technology
© 2015 KPMG, an Australian partnership and a member firm of the KPMG network of independent member firms affiliated with KPMG International Cooperative (“KPMG International”), a Swiss entity. All rights reserved. The KPMG name, logo and “cutting through complexity” are registered trademarks or trademarks of KPMG International. Liability limited by a scheme approved under Professional Standards Legislation. March 2015
Page 5
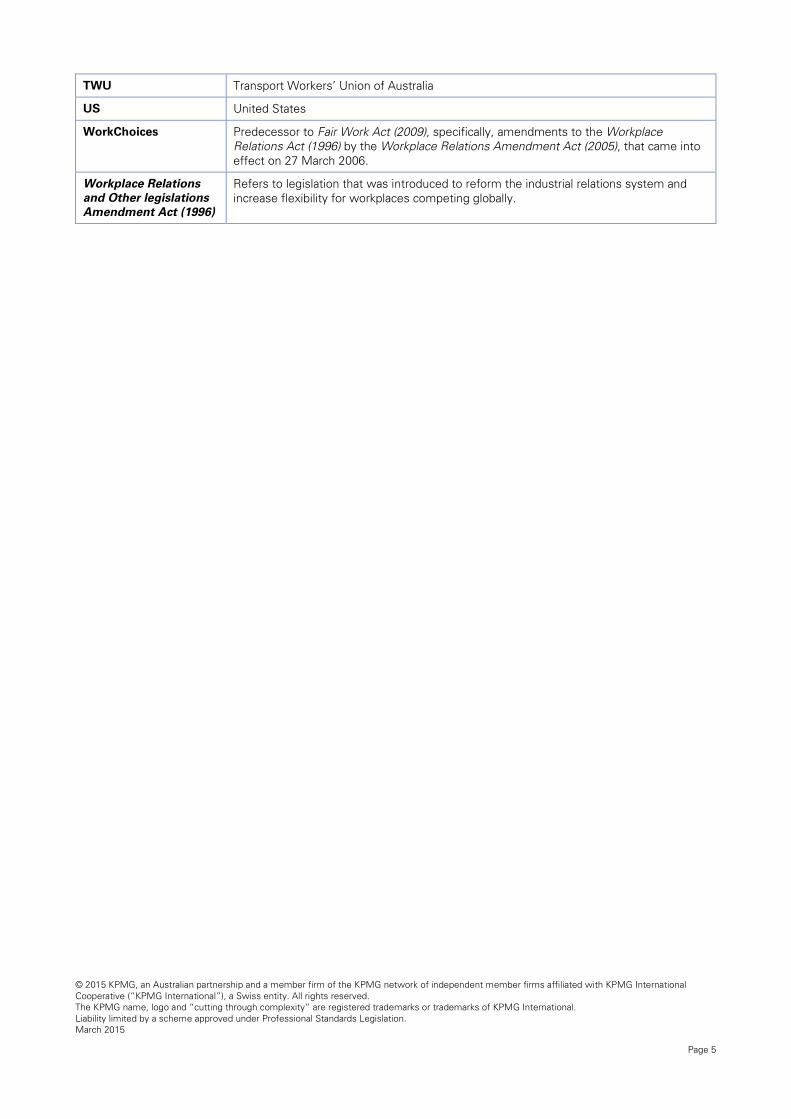
TWU Transport Workers’ Union of Australia
US United States
WorkChoices Predecessor to Fair Work Act (2009), specifically, amendments to the Workplace Relations Act (1996) by the Workplace Relations Amendment Act (2005), that came into effect on 27 March 2006.
Workplace Relations and Other legislations Amendment Act (1996)
Refers to legislation that was introduced to reform the industrial relations system and increase flexibility for workplaces competing globally.

© 2015 KPMG, an Australian partnership and a member firm of the KPMG network of independent member firms affiliated with KPMG International Cooperative (“KPMG International”), a Swiss entity. All rights reserved. The KPMG name, logo and “cutting through complexity” are registered trademarks or trademarks of KPMG International. Liability limited by a scheme approved under Professional Standards Legislation. March 2015
Page 6
The Australian resources sector makes a significant contribution to the Australian economy…
The resources sector is a major contributor to the Australian economy. It supports income for Australians and makes direct investments into capital cities and regions as part of its operations, across a range of industries.
In the early 2000s, growth in global demand for commodities increased significantly, primarily due to demand from rapidly developing Asian economies such as China. To take advantage of the increase in demand for commodities and associated higher commodity prices, the resources sector expanded. This led to growth in industries that provide inputs and services to the resources sector, such as construction and transport.
Over the past decade, investment spending by the resources sector has increased from two per cent of Gross Domestic Product (GDP) to eight per cent. Australia has relied significantly on foreign investment to fund the increase in capacity. This investment has created benefits across the domestic economy by enabling higher levels of output and providing higher incomes to Australian residents, through additional wages and taxes and demand for materials as production inputs that would have not otherwise been available.
As productivity measures outputs relative to inputs, the significant capital injection into the resources sector has perversely had short term adverse implications for industry productivity. Over the last decade, the level of productivity growth in the resources sector has declined significantly as capital inputs ramped up during

© 2015 KPMG, an Australian partnership and a member firm of the KPMG network of independent member firms affiliated with KPMG International Cooperative (“KPMG International”), a Swiss entity. All rights reserved. The KPMG name, logo and “cutting through complexity” are registered trademarks or trademarks of KPMG International. Liability limited by a scheme approved under Professional Standards Legislation. March 2015
Page 7
the sectors investment phase. However, as the resources sector transitions to a more production intensive phase, productivity growth is expected to improve.
Corresponding with a continued increase in commodity prices and an expansion in production and export capacity, Australian resources sector exports doubled between 2004 and 2008. Recent free trade agreements (FTAs) with South Korea and the early conclusion of FTAs with Japan, China and the Trans Pacific Partnership will help to boost export activity in the resources sector.
The resources sector contributes to the Australian economy through a number of channels, including:
• In 2013-14, resource extraction and services is estimated to have contributed 9 per cent ($128 billion) of industry gross value added (GVA). In addition, the direct contribution of resource-related construction and manufacturing are estimated to have contributed $15 billion and $13 billion to GDP respectively. The resources sector also makes indirect economic contributions through its linkages with other industries. An analysis of the total (direct and indirect) economic contribution of the Australian resources sector estimated that the resource economy accounted for 18 per cent of GVA in 2011-12.
• Resource extraction and services directly employs 269,000 people or 2.3 per cent of total Australian employment. In addition, resource-related construction and resources-related manufacturing sectors directly employ 190,000 people or 1.7 per cent of total Australian workers.
• Further, the resources sector also contributes to the employment of people in downstream and upstream sectors such as professionals, administrative services, other construction and education and training. It is estimated that the total (direct and indirect) resources sector employment was 10 per cent of total employment in 2011-12.
• Tax collection from the resources sector (including Federal company tax and State royalties) has increased four-fold over the past decade. The resources sector accounts for 24 per cent of all corporate tax receipts in Australia, significantly higher than the sector share of GDP (10 per cent)1. In addition, royalties paid by the resources sector in 2013-14 were estimated to be $10.1 billion across all States and Territories.
• Australian resources companies have returned large amounts of capital to shareholders. A recent study analysed 43 resources sector companies and found that they delivered an average total shareholder return of approximately 16 per cent each year. This is twice the value of the Standard & Poor’s top 500 companies over the 10 years to 2012. In 2011-12, resources sector companies paid over $20 billion in dividends to shareholders. This represents almost 20 per cent of all dividends paid by Australian companies in that year.
• In addition to these national contributions, the resources sector makes an important contribution to Australian regional economies including through supporting population growth and development in regional communities, increasing full time employment opportunities in regional communities; contributing to higher levels of education and training in regional economies, increasing average household incomes in regional economies and diversifying the economic base in regional communities.
• Importantly, for the competitiveness of the sector, Australian resources companies have long been at the forefront of technological development and environmental research. Research and development activity is an important contributor to driving down costs and improving productivity, key attributes to ensure that the Australian resources sector remains competitive and financially and environmentally sustainable.
1 Australian Taxation Office 2014, Taxation statistics 2011–12, April.

© 2015 KPMG, an Australian partnership and a member firm of the KPMG network of independent member firms affiliated with KPMG International Cooperative (“KPMG International”), a Swiss entity. All rights reserved. The KPMG name, logo and “cutting through complexity” are registered trademarks or trademarks of KPMG International. Liability limited by a scheme approved under Professional Standards Legislation. March 2015
Page 8
The competitiveness of the Australian resources sector faces a number of challenges…
To extract maximum value from Australia’s resource endowment, the Australian resources sector has historically been export-orientated. This global trade requires competing with other global producers and exporters, requiring a constant focus on the cost of production. Australia’s historic competitiveness has been supported by the high grade of minerals, particularly for commodities such as iron-ore and coal, commanding higher prices and being geographically situated next to Asian trading partners. This has provided Australia with a natural advantage over competitors.
In recent years, Australia’s competitiveness has declined, as the cost of production for many commodities has risen faster than the global average. This has been driven by higher input costs and an appreciation of the Australian dollar. The regulatory framework, including the taxation system, the workplace relations framework and approvals processes, can also add to the costs of projects.
Important to Australia’s ability to compete internationally for foreign capital is influenced by the competitiveness of project development costs. These costs are influenced by costs of construction, costs associated with obtaining approvals and costs associated with project delays. Australia’s competitiveness in these areas is summarised below:

© 2015 KPMG, an Australian partnership and a member firm of the KPMG network of independent member firms affiliated with KPMG International Cooperative (“KPMG International”), a Swiss entity. All rights reserved. The KPMG name, logo and “cutting through complexity” are registered trademarks or trademarks of KPMG International. Liability limited by a scheme approved under Professional Standards Legislation. March 2015
Page 9
• The cost of expanding capacity in Australia has become relatively more expensive than our global competitors in recent years. For example: the cost of new thermal coal production capacity increased almost 190 per cent over the last five years. Australia is now 66 per cent more expensive than the global average.
• Labour costs can be a significant driver of overall project development costs. In Australia, wages in the resources sector, specifically construction wages, increased two and a half times faster than the national average in constant prices over the last decade. Construction wages in Australia increased by an average of 16.6 per cent on a compound average annual rate from 2001 to 2012. In comparison, Canada’s increase in wages was around half that rate, while in the US, the increase was around one-third of Australia’s rate over the same time period.
• In Australia, the average project approval duration is 27 months. However, the timeframe for approvals can range from 5 to 42 months. This is longer than a number of competitor countries for like projects, including Canada, the UK and New Zealand.
• An important channel for the economic contribution of the resources sector is through the export of commodities. The production cost competitiveness of Australian operations is an important consideration for the economic contribution of existing operations and the attractiveness of further investment in expanding capacity. Compared to other developed economies, Australia has a cost advantage in a number of key commodities, including iron ore. However, Australia also competes with a number of developing countries, who typically have lower production costs. For example, Brazil is Australia’s main competitor in the global trade for iron ore.
• Australia’s LNG producers are among the highest cost producers in the world. This has been a recent trend, with development costs on more recent projects increasing at a higher rate than the global average. Analysis of unconventional gas projects in Australia and Canada indicate that it is 26-30 per cent more expensive to produce LNG in Australia, compared to Canada.
• Wages account for 12 per cent of revenue in the resources industry in Australia. The costs of wages are significantly higher in Australia relative to other comparable resource intensive economies. Analysis of the costs of staffing an offshore oil and gas service vessel suggest that it is almost 150 per cent more expensive to staff the same vessel in Australia than in Europe.
In addition to development and production related costs, there are a number of legal and compliance costs that can influence resources sector competitiveness. Direct legal and compliance expenditure for businesses, required to comply with regulation and legislation, can represent a significant cost. However, the more significant cost can be indirect, in the form of delays caused by regulatory and legislative requirements. A survey of resources sector businesses indicates that, Australia tends to perform in the bottom half of the cohort in terms of delays due to regulation and legislation relative to other resource- intensive developed economies.
It is important for the resources sector to remain competitive so it can continue to contribute to the Australian economy. To ensure this contribution is sustained, the resources sector must be able to compete in the global market for commodities and for investment capital.

© 2015 KPMG, an Australian partnership and a member firm of the KPMG network of independent member firms affiliated with KPMG International Cooperative (“KPMG International”), a Swiss entity. All rights reserved. The KPMG name, logo and “cutting through complexity” are registered trademarks or trademarks of KPMG International. Liability limited by a scheme approved under Professional Standards Legislation. March 2015
Page 10
One of these challenges includes aspects of the current workplace relations framework…
Consultation with resources sector businesses highlighted that there are a number of challenges associated with the current workplace relations framework that have potential implications for the competitiveness of the sector. These challenges relate to agreement making, industrial action, union right of entry and employee protections. Addressing these challenges has the potential to support favourable economic outcomes, including continued investment in resources projects, improved operational efficiencies and employment growth. Potential economic implications are illustrated below:
These potential economic implications were identified through:
• literature review to investigate the economic implication of changes in the workplace relations framework for the resources sector and the economy as a whole;
• a workshop with resources sector businesses to discuss potential changes and associated sector implications; and
• one-on-one consultation with selected resources sector businesses to obtain additional information regarding challenges and implications of change.
The implications considered reflect an economy-wide view rather than a focus on the distributional impacts (e.g. economic and social impact on employees and other sectors of the economy). For the purpose of this analysis, consultation and consideration of the implications of changes in the workplace relations framework are limited to resource sector businesses.
Investment attraction
Investment in major resources projects has historically been a major driver of economic growth. Australia faces a number of challenges in competing with international jurisdictions to attract investment in major resources projects. Resources sector businesses indicated that the current workplace relations framework impacts the ability to attract investment to major resource projects through the greenfields agreement making process and associated delays, and disruption and delays to projects associated with industrial action.
Greenfields agreements, pertaining to new and prospective projects, require employers to bargain and make agreements with unions rather than with employees directly. Consultation with resources sector businesses suggests that the current greenfields agreement making process has the potential to result in higher labour costs and potential delays to major resources projects. According to Productivity Commission analysis,
© 2015 KPMG, an Australian partnership and a member firm of the KPMG network of independent member firms affiliated with KPMG International Cooperative (“KPMG International”), a Swiss entity. All rights reserved. The KPMG name, logo and “cutting through complexity” are registered trademarks or trademarks of KPMG International. Liability limited by a scheme approved under Professional Standards Legislation. March 2015
Page 11
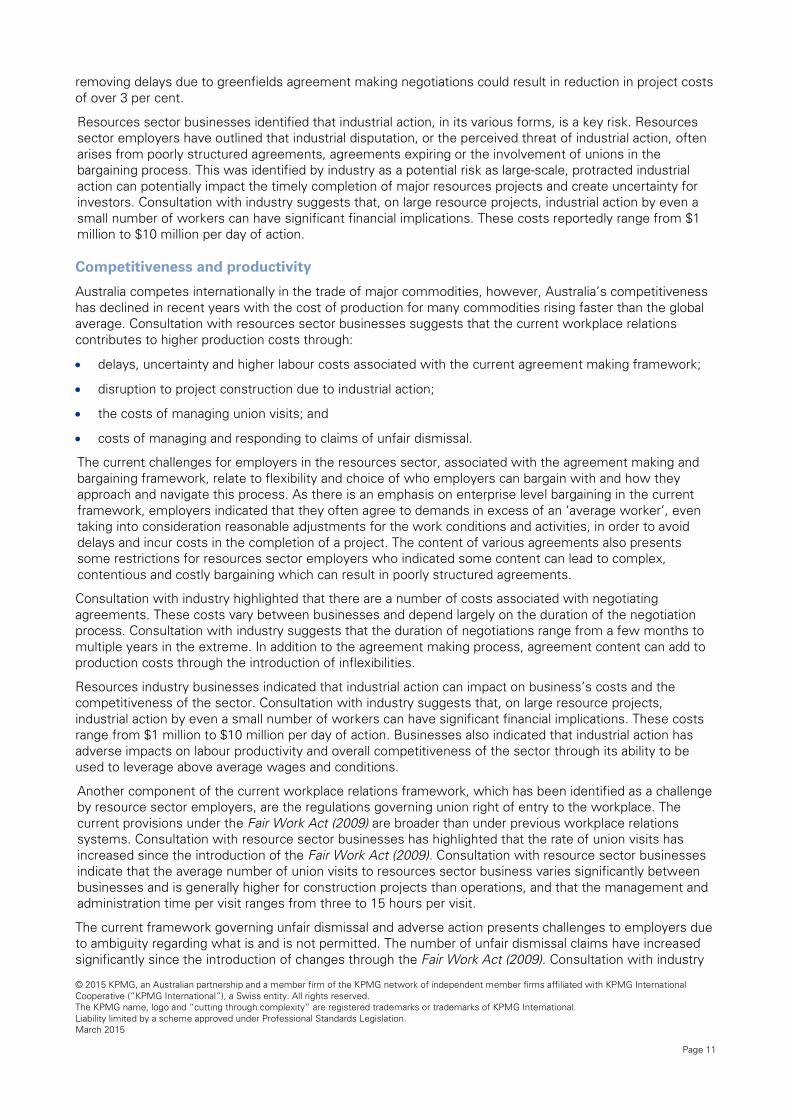
removing delays due to greenfields agreement making negotiations could result in reduction in project costs of over 3 per cent.
Resources sector businesses identified that industrial action, in its various forms, is a key risk. Resources sector employers have outlined that industrial disputation, or the perceived threat of industrial action, often arises from poorly structured agreements, agreements expiring or the involvement of unions in the bargaining process. This was identified by industry as a potential risk as large-scale, protracted industrial action can potentially impact the timely completion of major resources projects and create uncertainty for investors. Consultation with industry suggests that, on large resource projects, industrial action by even a small number of workers can have significant financial implications. These costs reportedly range from $1 million to $10 million per day of action.
Competitiveness and productivity
Australia competes internationally in the trade of major commodities, however, Australia’s competitiveness has declined in recent years with the cost of production for many commodities rising faster than the global average. Consultation with resources sector businesses suggests that the current workplace relations contributes to higher production costs through:
• delays, uncertainty and higher labour costs associated with the current agreement making framework;
• disruption to project construction due to industrial action;
• the costs of managing union visits; and
• costs of managing and responding to claims of unfair dismissal.
The current challenges for employers in the resources sector, associated with the agreement making and bargaining framework, relate to flexibility and choice of who employers can bargain with and how they approach and navigate this process. As there is an emphasis on enterprise level bargaining in the current framework, employers indicated that they often agree to demands in excess of an ‘average worker’, even taking into consideration reasonable adjustments for the work conditions and activities, in order to avoid delays and incur costs in the completion of a project. The content of various agreements also presents some restrictions for resources sector employers who indicated some content can lead to complex, contentious and costly bargaining which can result in poorly structured agreements.
Consultation with industry highlighted that there are a number of costs associated with negotiating agreements. These costs vary between businesses and depend largely on the duration of the negotiation process. Consultation with industry suggests that the duration of negotiations range from a few months to multiple years in the extreme. In addition to the agreement making process, agreement content can add to production costs through the introduction of inflexibilities.
Resources industry businesses indicated that industrial action can impact on business’s costs and the competitiveness of the sector. Consultation with industry suggests that, on large resource projects, industrial action by even a small number of workers can have significant financial implications. These costs range from $1 million to $10 million per day of action. Businesses also indicated that industrial action has adverse impacts on labour productivity and overall competitiveness of the sector through its ability to be used to leverage above average wages and conditions.
Another component of the current workplace relations framework, which has been identified as a challenge by resource sector employers, are the regulations governing union right of entry to the workplace. The current provisions under the Fair Work Act (2009) are broader than under previous workplace relations systems. Consultation with resource sector businesses has highlighted that the rate of union visits has increased since the introduction of the Fair Work Act (2009). Consultation with resource sector businesses indicate that the average number of union visits to resources sector business varies significantly between businesses and is generally higher for construction projects than operations, and that the management and administration time per visit ranges from three to 15 hours per visit.
The current framework governing unfair dismissal and adverse action presents challenges to employers due to ambiguity regarding what is and is not permitted. The number of unfair dismissal claims have increased significantly since the introduction of changes through the Fair Work Act (2009). Consultation with industry

© 2015 KPMG, an Australian partnership and a member firm of the KPMG network of independent member firms affiliated with KPMG International Cooperative (“KPMG International”), a Swiss entity. All rights reserved. The KPMG name, logo and “cutting through complexity” are registered trademarks or trademarks of KPMG International. Liability limited by a scheme approved under Professional Standards Legislation. March 2015
Page 12
indicates that adverse action or unfair dismissal claims are received for between 20 and 40 per cent of terminations. Employee protections, such as unfair dismissal, result in legal, compensation and administrative costs to businesses.
To address these challenges and ensure the ongoing contribution of the Australian resources sector to the Australian economy, the Australian Mines and Metals Association (AMMA) have developed a number of proposed reforms to the current workplace relations framework. These reforms aim to address the challenges outlined above and improve the competitiveness of the Australian resources sector.
The economic benefits of improving the competitiveness of the Australian resources sector have the potential to be significant…
Analysis of Australia’s international competitiveness in the resources sector highlighted that Australia faces a number of challenges in terms of costs of production and delays to projects. Improving Australia’s competitiveness has the potential to make Australia’s average costs of production more competitive and stabilise and/or increase the attractiveness of Australia as a destination for foreign investment.
Research and consultation findings suggest there is significant variation in the potential economic implication of changes in the Australian workplace relations framework. However, it is broadly recognised in available literature that the workplace relations framework is critical to economic performance in Australia. Specifically, changes in the workplace relations framework has the potential to contribute to the improved competitiveness of the Australian resources sector, contributing to future investment growth and labour productivity.
There is limited information available regarding the quantitative impacts of changes in workplace relations regulations. Accordingly, assessing the impacts of reforms to the workplace relations framework involved review of available data, review of previous analyses and relevant literature and consultation with AMMA members.
Given the limited information available, the analysis relies heavily on anecdotal information provided by selected resource sector businesses.
Based on the availability of information, to estimate the upstream and downstream linkages of the resource sector and to demonstrate the potential implications of changes in the workplace relations framework, illustrative scenarios were developed. Specifically, the following scenarios considered:
• an increase in resources sector investment reflecting a reduction in delay and the associated costs as a result of changes to the greenfields agreement process and a reduction in industrial action; and
• an improvement in labour productivity in the resources sector resulting from a reduction in labour costs associated with the agreement making process, a reduction in days lost to industrial action, a reduction in the labour costs of union visits and a reduction in the costs of unfair dismissal claims.
Recognising that there is some uncertainty in the magnitude of the impact of changes in the workplace relations framework, a range of impacts were estimated. Specifically, the following scenarios were modelled:
• Scenario 1: an increase in resources sector labour productivity of 5 per cent and an increase in resources sector investment of 8 per cent; and
• Scenario 2: an increase in resources sector labour productivity of 2 per cent and an increase in resources sector investment of 3 per cent.
It is important to note that these scenarios were developed based on consultation with selected resources sector businesses. The actual impact will likely vary to the extent that these businesses are representative of the sector as a whole. Quantification of these scenarios were based on the maximum values. That is, the analysis assumes that all proposed reforms are successfully implemented. If only a subset of reforms are implemented, the impacts would likely be lower.
The composition of the factors driving these scenarios for analysis are outlined below.

© 2015 KPMG, an Australian partnership and a member firm of the KPMG network of independent member firms affiliated with KPMG International Cooperative (“KPMG International”), a Swiss entity. All rights reserved. The KPMG name, logo and “cutting through complexity” are registered trademarks or trademarks of KPMG International. Liability limited by a scheme approved under Professional Standards Legislation. March 2015
Page 13
Variable Scenario range
Justification a Further information
Resource sector labour productivity
2 – 5 per cent
• A reduction in costs of agreement making. Current agreement making costs range from approximately $150 per worker per annum to over $6,000 per worker per annum (approximately 0.1 to 4.8 per cent of labour costs).
Section 8.2.2
• An increase in productivity enhancing agreement content and reduction in impediments to productivity in agreement content (and associated costs).
Section 8.2.2
• Reduction in days lost to industrial action from current level to previous low level. Equivalent to a direct reduction of lost industry GVA of 0.08 in the mining sector and 0.02 per cent in the construction industry. In addition, the disruptions flow through to other associated businesses and consumers.
Section 8.2.3
• Reduction in claims (of 1 to 2 claims per 500 employees) resulting in a reduction in legal and compensation costs of $30,000 per claim. This represents a cost saving of $60 to $120 per employee per annum (approximately 0.05 to 0.09 per cent of total wages costs).
Section 8.2.5
• Reduction in the ability of industrial action to contribute to excessive inflation in wages and conditions. Section 8.2.3
• A reduction in costs associated with union visits. Current number of union visits range from approximately five per annum per 500 employees to 150 per annum per 500 employees. The average time taken to manage and facilitate visits is between three and 15 hours per visit. This represents a labour cost of between $1,000 and $150,000 per annum on average for every 500 workers (approximately less than 0.0 to 0.2 per cent of labour costs). The high number of union visits were generally in the construction side of the sector.
Section 8.2.4
Resource sector investment
3 – 8 per cent
• A reduction in project delay and associated costs due to the greenfields agreement making process. According to recent analysis, 16 resource and energy projects with an investment value of $700 million move from the ‘Feasibility Stage’ to the ‘Committed’ stages each year. Approximately 10 of these projects require greenfields agreements with an estimated 40 greenfields agreements in operation for each major project. Analysis suggests reduction in the delay due to greenfields negotiations would save $4.6 million in NPV terms. This represents a saving of $23 million across five projects (3.3 per cent of total investment value).
Section 8.1.1
• A reduction in future wage inflation on major projects. Over the 10 years 2002 to 2012, WPI increased 44 per cent while wages agreed through greenfields increased 71 to 110 per cent. A differential of between 27 and 66 per cent (approximately 2.7 and 6.6 per cent per annum). This higher than average wage increase has implications for competitiveness of Australian resource and energy projects that compete globally for investment funds.
Section 8.1.1
• A reduction in actual or threatened industrial activity and the associated instability and uncertainty created. This has the potential to improve Australia’s position in competing globally for investment funds.
Section 8.1.2
a Share of total labour costs is based on current average earnings in the mining industry (approximately $130,000)
Source: KPMG analysis

© 2015 KPMG, an Australian partnership and a member firm of the KPMG network of independent member firms affiliated with KPMG International Cooperative (“KPMG International”), a Swiss entity. All rights reserved. The KPMG name, logo and “cutting through complexity” are registered trademarks or trademarks of KPMG International. Liability limited by a scheme approved under Professional Standards Legislation. March 2015
Page 14
An increase in both labour productivity and investment in the resources sector has a positive impact on GDP and employment.
Chart 1: Impact on GDP and employment
Source: KPMG analysis
The impact of the reform scenarios on GDP is estimated to be between 0.8 and 2.0 per cent. Based on current levels, this is equivalent to GDP growth of between $11.7 billion and $30.9 billion. The impact of the scenarios on employment is estimated to be between 0.1 and 0.3 per cent. Based on current levels of employment, this is equivalent to between 14,000 and 36,000 jobs2.
As outlined above, the analysis of the economic implications of reforms focused on resources sector businesses and did not consider the distributional impacts. However, the quantitative analysis of the reform scenarios found that they result in a positive impact on employment and household consumption. Household consumption can be considered a measure of economic welfare, accordingly, the analysis suggests the economy as a whole is better off under the scenarios.
2 The impact of the reform scenarios on employment is lower, relative to the impacts on GDP. This reflects the relative capital intensity of the resources sector.
2.0
0.3
0.8
0.1
0.0
0.5
1.0
1.5
2.0
2.5
Real GDP Employment
Cha
nge
(%)
Scenario 1 Scenario 2

© 2015 KPMG, an Australian partnership and a member firm of the KPMG network of independent member firms affiliated with KPMG International Cooperative (“KPMG International”), a Swiss entity. All rights reserved. The KPMG name, logo and “cutting through complexity” are registered trademarks or trademarks of KPMG International. Liability limited by a scheme approved under Professional Standards Legislation. March 2015
Page 15
1 Introduction
The Australian Mines and Metals Association (AMMA) is the resources industry’s peak national employer group. The Australian resources sector directly and indirectly employs up to 1.1 million working Australians, 10 per cent of total employment nationally. Accordingly, the Australian workplace relations framework has a significant impact on AMMA members, and the competitiveness of the Australian resources sector.
As part of its 2013 Federal Election campaign, the Coalition committed to an independent review of workplace relations to be undertaken by the Productivity Commission. In committing an in-coming Coalition Government to a Productivity Commission inquiry into Australia’s workplace relations system, the Liberal Party’s election manifesto noted the purpose of the review would be to “ensure Australians have the benefit of an objective, comprehensive and factual assessment of their operation and impact”3.
In December 2014, the Australian Government released Terms of Reference for a Productivity Commission inquiry into Australia’s workplace relations framework. The aim of the inquiry is to ensure that the Fair Work Act (2009) is meeting its objectives and contributing to productive, rewarding, competitive and harmonious workplaces.
The Terms of Reference require the Productivity Commission to assess the impact of the workplace relations framework and consider improvements to the framework. Specifically:
“The Productivity Commission will assess the performance of the workplace relations framework, including the Fair Work Act 2009, focusing on key social and economic indicators important to the wellbeing, productivity and competitiveness of Australia and its people.
A key consideration will be the capacity for the workplace relations framework to adapt over the longer term to issues arising due to structural adjustments and changes in the global economy4.”
The Productivity Commission inquiry will assess the impact of the workplace relations framework on:
• unemployment, underemployment and job creation;
• fair and equitable pay and conditions for employees, including the maintenance of a relevant safety net;
• small businesses;
• productivity, competitiveness and business investment;
• the ability of business and the labour market to respond appropriately to changing economic conditions;
• patterns of engagement in the labour market;
• the ability for employers to flexibly manage and engage with their employees;
• barriers to bargaining;
• red tape and compliance burden for employers;
• industrial conflict and days lost due to industrial action; and
• appropriate scope for independent contracting5.
AMMA is developing a submission to the Productivity Commission inquiry into Australia’s workplace relations framework on behalf of its members which operate in, or support the resources industry. Consistent with the focus of the Productivity Commission inquiry, and the economic significance of the resources sector, a key focus of the AMMA submission is on the competitiveness of the sector.
3 Liberal Party 2013, The Coalition’s Policy to Improve the Fair Work Laws, May 4 Minister for Employment 2014, Productivity Commission Review of the Workplace Relations Framework, Joint Media Release from Senator the Hon Eric Abetz and The Hon Joe Hockey MP, 19 December 2014. 5 Productivity Commission 2014, Workplace relations framework: terms of reference, Productivity Commission, accessed 19 January 2015, http://www.pc.gov.au/inquiries/current/workplace-relations/terms-of-reference

© 2015 KPMG, an Australian partnership and a member firm of the KPMG network of independent member firms affiliated with KPMG International Cooperative (“KPMG International”), a Swiss entity. All rights reserved. The KPMG name, logo and “cutting through complexity” are registered trademarks or trademarks of KPMG International. Liability limited by a scheme approved under Professional Standards Legislation. March 2015
Page 16
1.1 Scope
AMMA has commissioned KPMG to undertake economic research and analysis to inform the AMMA submission to the Productivity Commission inquiry into the Australian workplace relations framework. The KPMG analysis focuses on the competitiveness of the resources sector and economy-wide impacts associated with potential changes in the Australian workplace relations framework. Specifically, the scope of work involves three components:
• analysis of the economic and socio-economic contribution of the Australian resources sector;
• a benchmarking study comparing the competitiveness of Australia’s resource project related costs with projects in other OECD countries; and
• economic analysis of the Fair Work Act (2009) and reform options on the Australian resources sector.
Structure of this report
This report is structured as follows:
• Section 2 provides background on recent developments in workplace relations in Australia and the scope of the current Productivity Commission review;
• Section 3 provides an overview of the approach to the economic research and analysis of the impact of workplace relations reforms on the competitiveness of the Australian resources sector and outlines limitations of the analysis;
• Section 4 outlines the contribution of the resources sector to the Australian economy in terms of investment, growth, employment, taxation and socio-economic benefits;
• Section 5 provides a comparative analysis of the competitiveness of the Australian resources sector relative to international competitors;
• Section 6 describes how the Australian workplace relations framework impacts the resources sector during construction and operations;
• Section 7 outlines a number of potential options for reform to the Australian workplace relations framework that aim to improve the competitiveness of the resources sector;
• Section 8 describes the economic implications of the potential reform options in terms of investment, productivity and employment in the Australian resources sector;
• Section 9 outlines the results of quantitative economic analysis of the impact of changes in the workplace relations framework on the Australian resources sector; and
• a series of appendices provide supplementary information to the main body of the report.

© 2015 KPMG, an Australian partnership and a member firm of the KPMG network of independent member firms affiliated with KPMG International Cooperative (“KPMG International”), a Swiss entity. All rights reserved. The KPMG name, logo and “cutting through complexity” are registered trademarks or trademarks of KPMG International. Liability limited by a scheme approved under Professional Standards Legislation. March 2015
Page 17
2 Background
Workplace relations has been a highly contested policy area in Australia in recent times. There have been several reform packages in this policy area over the last two decades which have transformed Australia’s workplace relations system. These reforms are illustrated in Figure 2-1 and outlined below.
Figure 2-1: Changes to Australia’s workplace relations framework
Source: KPMG analysis of Industrial Relations Act (1993), Workplace Relations Act (1996), Fair Work Act (2005) and Fair
Work Act (2009).
The following section provides an overview of the developments in workplace relations in Australia from 1993 to the recently announced Productivity Commission review of the Australian workplace relations framework.
Industrial Relations Reform Act (1993)
In 1993, the Keating Government introduced major workplace relations reform with the Industrial Relations Reform Act (1993). This reform sought to make enterprise the primary level at which collective bargaining was conducted. The 1993 legislation overshadowed the Prices and Incomes Accord that operated at an economy-wide level since its introduction in 1983. Under the 1993 reforms, compulsorily arbitrated awards and arbitrated wage increases would only act as a safety net, and Enterprise Bargaining Agreements (EBAs) acted as the main mechanism under which wages and conditions were set. The Act was seen as a significant reform as it established a legal right to strike (under certain conditions) and also introduced a federal system of protection against unfair dismissal, administered by the Australian Industrial Relations Commission (AIRC)6.
Workplace Relations Act (1996)
In 1996, the newly elected Howard Government passed the Workplace Relations Act (1996) that supported a more direct relationship between employers and employees. The new framework resulted in greater labour market flexibility and reduced the requirement for third-party interventions, such as from trade unions
6 AIRC 2006, Historical Overview: The Australian Industrial Relations Commission, December.

© 2015 KPMG, an Australian partnership and a member firm of the KPMG network of independent member firms affiliated with KPMG International Cooperative (“KPMG International”), a Swiss entity. All rights reserved. The KPMG name, logo and “cutting through complexity” are registered trademarks or trademarks of KPMG International. Liability limited by a scheme approved under Professional Standards Legislation. March 2015
Page 18
and other employee representatives. Consistent with the previous legislative framework, the Act continued the federal award system for setting minimum standards. The 1996 legislation also introduced individual statutory contracts known as Australian Workplace Agreements (AWAs). AWAs were equivalent to EBAs and provided a statutory framework for employers to bargain directly with employees. In addition to AWAs, common law contracts already provided a mechanism for direct bargaining between employees and employers7.
Workplace Relations Amendment (WorkChoices) Act (2005)
In 2005, the Howard Government introduced further workplace relations reform, through the Workplace Relations Amendment Act (2005) popularly known as WorkChoices. Significant changes as a result of WorkChoices included:
• establishment of the Australian Fair Pay Commission (AFPC) to determine minimum wages, replacing the role the AIRC had played in the matter;
• exemption of companies with 100 or fewer employees from unfair dismissal laws;
• removing the “no disadvantage test” for collective agreements and individual AWAs; and
• using the corporations’ power of the Australian Constitution to underpin the workplace relations framework8.
In 2007, the Government modified WorkChoices by introducing a “fairness test”, which sought to ensure that employees were adequately compensated if they received a reduction in monetary or non-monetary benefits9.
Transitional legislation
In 2008, the Rudd Government passed transitional legislation that brought an end to many of the elements of the previous WorkChoices framework. The transitional legislation, the Workplace Relations Amendment (Transition to Forward with Fairness) Act (2008), prevented new AWAs, re-introduced a ‘no disadvantage test’ for the approval of collective workplace agreements, and set in process the rationalisation and simplification of the federal system of awards, known as ‘award modernisation’.
Fair Work Act (2009)
In 2009, the Rudd Government passed the Fair Work Act (2009) which sought to encourage collective bargaining. The key elements of the Act include:
• a new safety net comprising 10 National Employment Standards (NES);
• a new bargaining system based on enterprise-level collective bargaining in good faith;
• an extension of unfair dismissal protections to employees of companies with 100 or fewer employees, longer qualifying periods for employees working in small businesses and a more streamlined process for dealing with unfair dismissal claims;
• a new institutional framework made up of Fair Work Australia (FWA) and the Fair Work Ombudsman;
• compliance measures including in relation to industrial action; and
7 Ibid 8 Stewart, A. and Priest, E. 2009, The WorkChoices Legislation: An Overview, eds Forsyth, A. & Stewart, A. (2009), Fair Work: The new workplace laws and the WorkChoices legacy, Federation Press, Sydney 9 Ibid
© 2015 KPMG, an Australian partnership and a member firm of the KPMG network of independent member firms affiliated with KPMG International Cooperative (“KPMG International”), a Swiss entity. All rights reserved. The KPMG name, logo and “cutting through complexity” are registered trademarks or trademarks of KPMG International. Liability limited by a scheme approved under Professional Standards Legislation. March 2015
Page 19
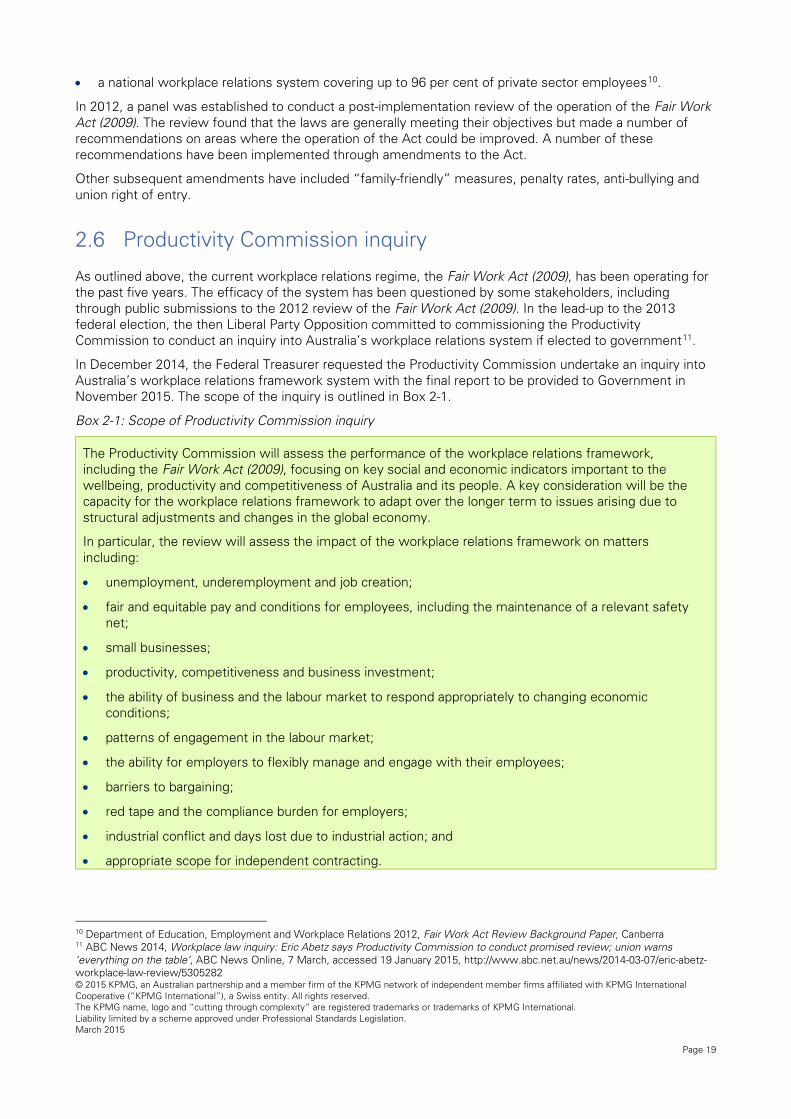
• a national workplace relations system covering up to 96 per cent of private sector employees10.
In 2012, a panel was established to conduct a post-implementation review of the operation of the Fair Work Act (2009). The review found that the laws are generally meeting their objectives but made a number of recommendations on areas where the operation of the Act could be improved. A number of these recommendations have been implemented through amendments to the Act.
Other subsequent amendments have included “family-friendly” measures, penalty rates, anti-bullying and union right of entry.
Productivity Commission inquiry
As outlined above, the current workplace relations regime, the Fair Work Act (2009), has been operating for the past five years. The efficacy of the system has been questioned by some stakeholders, including through public submissions to the 2012 review of the Fair Work Act (2009). In the lead-up to the 2013 federal election, the then Liberal Party Opposition committed to commissioning the Productivity Commission to conduct an inquiry into Australia’s workplace relations system if elected to government11.
In December 2014, the Federal Treasurer requested the Productivity Commission undertake an inquiry into Australia’s workplace relations framework system with the final report to be provided to Government in November 2015. The scope of the inquiry is outlined in Box 2-1.
Box 2-1: Scope of Productivity Commission inquiry
The Productivity Commission will assess the performance of the workplace relations framework, including the Fair Work Act (2009), focusing on key social and economic indicators important to the wellbeing, productivity and competitiveness of Australia and its people. A key consideration will be the capacity for the workplace relations framework to adapt over the longer term to issues arising due to structural adjustments and changes in the global economy.
In particular, the review will assess the impact of the workplace relations framework on matters including:
• unemployment, underemployment and job creation;
• fair and equitable pay and conditions for employees, including the maintenance of a relevant safety net;
• small businesses;
• productivity, competitiveness and business investment;
• the ability of business and the labour market to respond appropriately to changing economic conditions;
• patterns of engagement in the labour market;
• the ability for employers to flexibly manage and engage with their employees;
• barriers to bargaining;
• red tape and the compliance burden for employers;
• industrial conflict and days lost due to industrial action; and
• appropriate scope for independent contracting.
10 Department of Education, Employment and Workplace Relations 2012, Fair Work Act Review Background Paper, Canberra 11 ABC News 2014, Workplace law inquiry: Eric Abetz says Productivity Commission to conduct promised review; union warns ‘everything on the table’, ABC News Online, 7 March, accessed 19 January 2015, http://www.abc.net.au/news/2014-03-07/eric-abetz-workplace-law-review/5305282
© 2015 KPMG, an Australian partnership and a member firm of the KPMG network of independent member firms affiliated with KPMG International Cooperative (“KPMG International”), a Swiss entity. All rights reserved. The KPMG name, logo and “cutting through complexity” are registered trademarks or trademarks of KPMG International. Liability limited by a scheme approved under Professional Standards Legislation. March 2015
Page 20
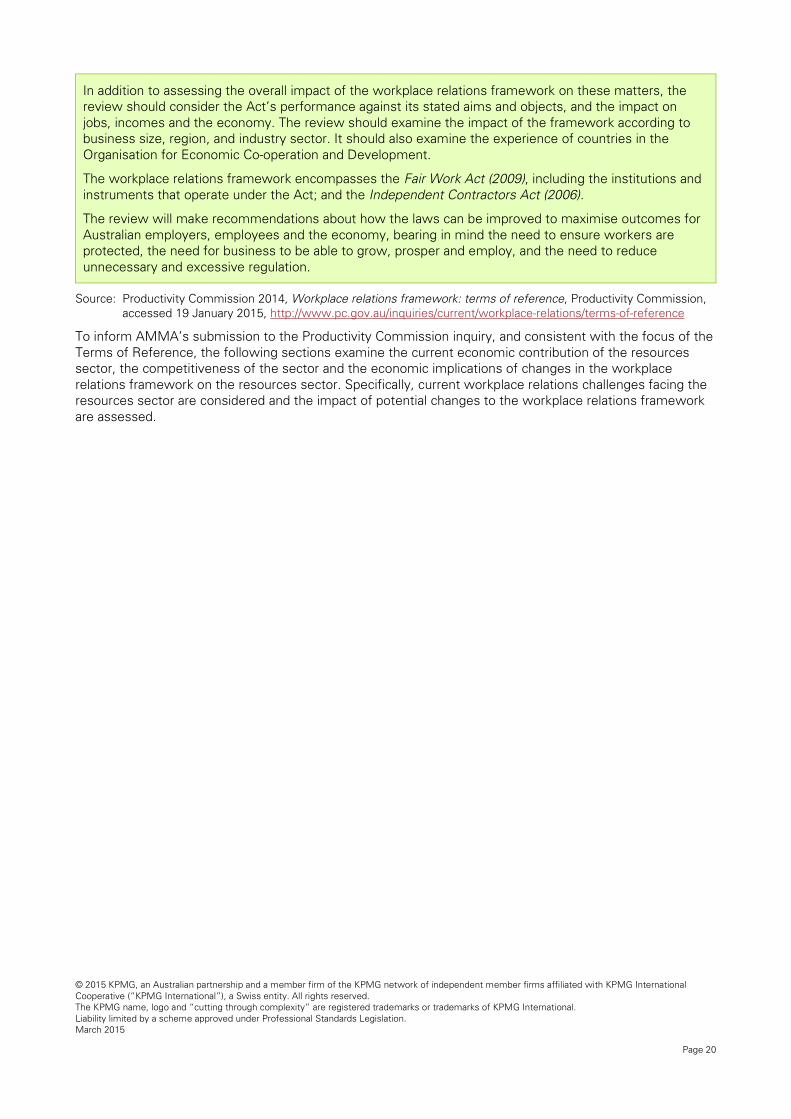
In addition to assessing the overall impact of the workplace relations framework on these matters, the review should consider the Act’s performance against its stated aims and objects, and the impact on jobs, incomes and the economy. The review should examine the impact of the framework according to business size, region, and industry sector. It should also examine the experience of countries in the Organisation for Economic Co-operation and Development.
The workplace relations framework encompasses the Fair Work Act (2009), including the institutions and instruments that operate under the Act; and the Independent Contractors Act (2006).
The review will make recommendations about how the laws can be improved to maximise outcomes for Australian employers, employees and the economy, bearing in mind the need to ensure workers are protected, the need for business to be able to grow, prosper and employ, and the need to reduce unnecessary and excessive regulation.
Source: Productivity Commission 2014, Workplace relations framework: terms of reference, Productivity Commission, accessed 19 January 2015, http://www.pc.gov.au/inquiries/current/workplace-relations/terms-of-reference
To inform AMMA’s submission to the Productivity Commission inquiry, and consistent with the focus of the Terms of Reference, the following sections examine the current economic contribution of the resources sector, the competitiveness of the sector and the economic implications of changes in the workplace relations framework on the resources sector. Specifically, current workplace relations challenges facing the resources sector are considered and the impact of potential changes to the workplace relations framework are assessed.

© 2015 KPMG, an Australian partnership and a member firm of the KPMG network of independent member firms affiliated with KPMG International Cooperative (“KPMG International”), a Swiss entity. All rights reserved. The KPMG name, logo and “cutting through complexity” are registered trademarks or trademarks of KPMG International. Liability limited by a scheme approved under Professional Standards Legislation. March 2015
Page 21
3 Approach
The economic research and analysis to inform the AMMA submission to the Productivity Commission inquiry involved three interrelated stages. These stages are illustrated in Figure 3-1.
Figure 3-1: Economic research and analysis components
The focus of the research and analysis is on the economic implications for the Australian resources sector. The definition of the resources sector varies between publication sources. For the purpose of this analysis, the resources sector includes:
• resource extraction and services;
• resource-related manufacturing; and
• resource-related construction.
These sub-sectors capture activity across mining and oil and gas including Liquefied Natural Gas (LNG) extraction and processing. The components of the resources sector are defined in more detail in Appendix A.
The following section provides an overview of the approach to the economic research and analysis of the impact of workplace relations reforms on the competitiveness of the Australian resources sector. The limitations associated with the analysis are also considered.
Economic and socio-economic contribution of the resources sector
Baseline research and analysis of the current contribution of the resources sector to the Australian economy was undertaken based on existing publicly available research and industry insights. This analysis investigates the contribution of the resources sector to investment, exports, employment and economic growth in Australia.
Analysis of the current economic and socio-economic contribution of the Australian resources sector involved undertaking desktop analysis drawing on existing KPMG analysis and other publications. The focus of the research and literature was to describe and quantify the contribution of the Australian resources sector, including:
• export income;
• taxation contribution;
• employment;

© 2015 KPMG, an Australian partnership and a member firm of the KPMG network of independent member firms affiliated with KPMG International Cooperative (“KPMG International”), a Swiss entity. All rights reserved. The KPMG name, logo and “cutting through complexity” are registered trademarks or trademarks of KPMG International. Liability limited by a scheme approved under Professional Standards Legislation. March 2015
Page 22
• socio-economic programs;
• research and development activities; and
• value to Australian shareholders.
Key sources of information included:
• the Australian Bureau of Statistics (ABS);
• the Reserve Bank of Australia (RBA);
• the Australian Treasury;
• the Australian Taxation Office (ATO);
• State and Territory treasuries;
• the Australian Stock Exchange (ASX); and
• the Bureau of Resources and Energy Economics (BREE), now referred to as the Department of Industry and Science under the Office of the Chief Economist.
International competiveness analysis
A desktop analysis was undertaken to understand how Australia competes relative to other resource-intensive countries that are members of the Organisation for Economic Co-operation and Development (OECD). The analysis considered production costs, project approval timeframes and the legal, compliance and transaction costs incurred by resources companies. The analysis relied on publicly available data and was supplemented with information obtained directly from AMMA members.
Key sources of information included:
• IBIS World industry reports;
• the World Bank;
• the Productivity Commission;
• BREE;
• the Fraser Institute; and
• a number of specialty industry reports.
The most recent information available was included in the analysis. However, due to the limited availability of suitable data, some data is only reported up to 2012.
Economic analysis of Fair Work Act (2009) and options for reform
Economic research and analysis of workplace relations reform options for the Australian resources sector involved a number of tasks:
• A literature review to investigate the economic implications of changes in the workplace relations framework for the resources sector and the economy as a whole.
• A workshop with selected AMMA members to test and obtain further information on the potential implications of reform options developed by AMMA. Members were asked to assist by providing information to inform the analysis of the economic implications of proposed reform options.

© 2015 KPMG, an Australian partnership and a member firm of the KPMG network of independent member firms affiliated with KPMG International Cooperative (“KPMG International”), a Swiss entity. All rights reserved. The KPMG name, logo and “cutting through complexity” are registered trademarks or trademarks of KPMG International. Liability limited by a scheme approved under Professional Standards Legislation. March 2015
Page 23
• Further research and information collection based on the workshop findings regarding the implications of reform options. In addition, where available, KPMG obtained additional detailed information through one-on-one consultation with selected AMMA members.
• Economic modelling was undertaken to assess the economy-wide implications of the proposed reform options. The modelling focused on the economy-wide implications associated with the potential impacts on the resources sector associated with the reform options.
The specific research and analysis that was undertaken is summarised in the following sections.
3.3.1 Literature review
KPMG undertook an extensive review of previous analyses undertaken in Australian, as well as international literature, to identify the potential costs and benefits associated with the current workplace relations framework and the implications of potential changes.
Key documents that were considered in the literature review are summarised in Table 3-1.
Table 3-1: Key literature review sources
Document Description
Productivity Commission 2015, Workplace Relations Framework Issues Papers 1-5, January.
An outline of a range of issues on which the Productivity Commission seeks information and feedback to complete its review of the workplace relations framework.
DEEWR, 2012 Fair Work Act Review Background Paper, January.
Sets out the Terms of Reference for the review of the Fair Work Act (2009) and focuses on key areas for the review including economic growth, productivity, economic prosperity and economic indicators.
DEWWR, 2012, Towards more productive and equitable workplaces: An evaluation of the Fair Work legislation, November.
A best practice, post-implementation assessment of the operation of the Fair Work Act (2009) legislation and the extent to which its effects have been consistent with its objectives.
Department of Employment, 2015, Trends in Federal Enterprise Bargaining, September Quarter 2014, January.
Quarterly report containing data regarding the number of enterprise agreements made in the federal workplace relations system, as well as data about the number of employees covered and the level of wage increases included in collective agreements.
Econtech, 2007, The economic effects of industrial relations reforms since 1993, report prepared for the Australian Chamber of Commerce and Industry, July.
Analysis of the economic impact if all the major industrial relations reforms in Australia from 1993 onwards were reversed.
Fair Work Commission, 2014, Productivity and innovation in enterprise agreement clauses: an overview of literature, data and case studies at the workplace level, December.
Exploration of the provision of resources to those seeking to develop enterprise agreement clauses which may contribute to workplace productivity. As part of this project, all employers, employees and their representatives were invited to nominate enterprise agreement clauses that they believed were innovative or enhanced productivity.
Kates, S. 2010, The AMMA Workplace Relations Research Project - A Survey Based Analysis: First Report, report prepared for AMMA, June.
Survey of member companies of AMMA where respondents were asked to rate their experience of the first eight months of the Fair Work Act (from 1 July 2009 to 28 February 2010) compared with the predecessor industrial relations system. A range of industries within the resources sector were captured in the responses, including general mining, offshore maritime, hydrocarbons, construction, coal mining, gold mining and catering.
Kates, S. 2013, The AMMA Workplace Relations Research Project - A Survey Based Analysis: Report 6, report prepared for AMMA, August.
This report sought to compile a body of research (in the form of survey responses from AMMA members) to assess how the current workplace relations legislation is performing its role of
© 2015 KPMG, an Australian partnership and a member firm of the KPMG network of independent member firms affiliated with KPMG International Cooperative (“KPMG International”), a Swiss entity. All rights reserved. The KPMG name, logo and “cutting through complexity” are registered trademarks or trademarks of KPMG International. Liability limited by a scheme approved under Professional Standards Legislation. March 2015
Page 24
Document Description
encouraging productivity growth in an environment that is fair for both business and employees.
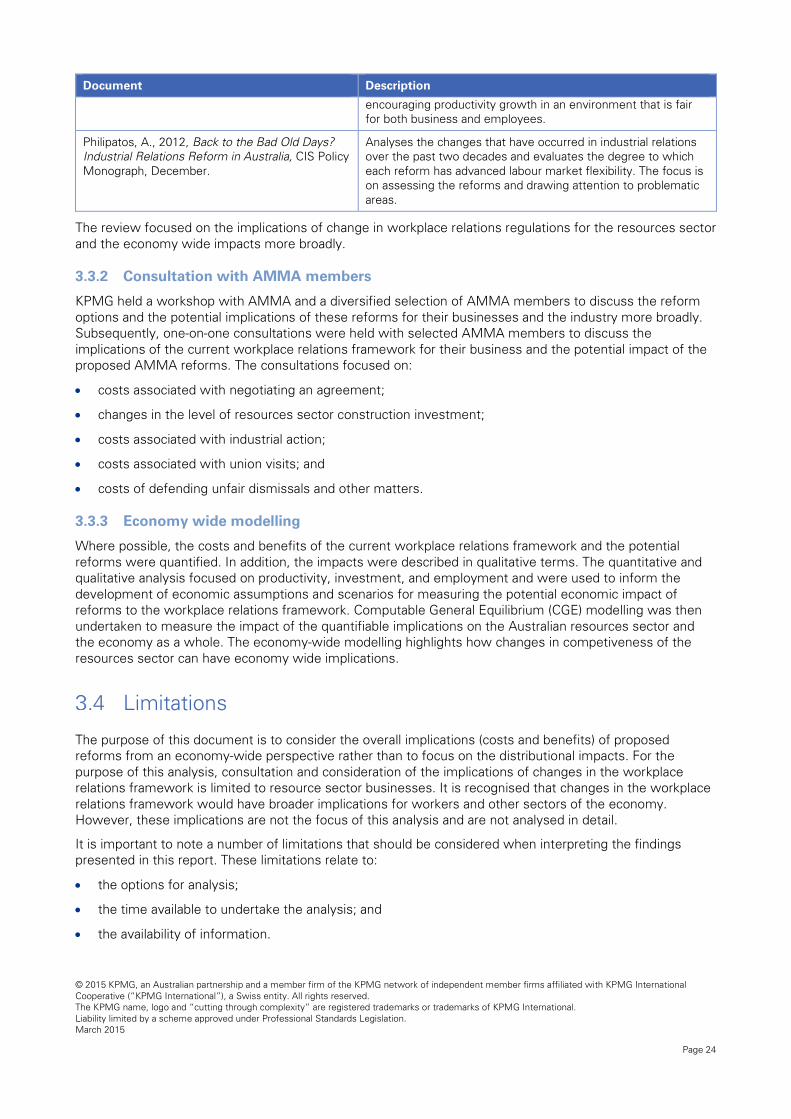
Philipatos, A., 2012, Back to the Bad Old Days? Industrial Relations Reform in Australia, CIS Policy Monograph, December.
Analyses the changes that have occurred in industrial relations over the past two decades and evaluates the degree to which each reform has advanced labour market flexibility. The focus is on assessing the reforms and drawing attention to problematic areas.
The review focused on the implications of change in workplace relations regulations for the resources sector and the economy wide impacts more broadly.
3.3.2 Consultation with AMMA members
KPMG held a workshop with AMMA and a diversified selection of AMMA members to discuss the reform options and the potential implications of these reforms for their businesses and the industry more broadly. Subsequently, one-on-one consultations were held with selected AMMA members to discuss the implications of the current workplace relations framework for their business and the potential impact of the proposed AMMA reforms. The consultations focused on:
• costs associated with negotiating an agreement;
• changes in the level of resources sector construction investment;
• costs associated with industrial action;
• costs associated with union visits; and
• costs of defending unfair dismissals and other matters.
3.3.3 Economy wide modelling
Where possible, the costs and benefits of the current workplace relations framework and the potential reforms were quantified. In addition, the impacts were described in qualitative terms. The quantitative and qualitative analysis focused on productivity, investment, and employment and were used to inform the development of economic assumptions and scenarios for measuring the potential economic impact of reforms to the workplace relations framework. Computable General Equilibrium (CGE) modelling was then undertaken to measure the impact of the quantifiable implications on the Australian resources sector and the economy as a whole. The economy-wide modelling highlights how changes in competiveness of the resources sector can have economy wide implications.
Limitations
The purpose of this document is to consider the overall implications (costs and benefits) of proposed reforms from an economy-wide perspective rather than to focus on the distributional impacts. For the purpose of this analysis, consultation and consideration of the implications of changes in the workplace relations framework is limited to resource sector businesses. It is recognised that changes in the workplace relations framework would have broader implications for workers and other sectors of the economy. However, these implications are not the focus of this analysis and are not analysed in detail.
It is important to note a number of limitations that should be considered when interpreting the findings presented in this report. These limitations relate to:
• the options for analysis;
• the time available to undertake the analysis; and
• the availability of information.

© 2015 KPMG, an Australian partnership and a member firm of the KPMG network of independent member firms affiliated with KPMG International Cooperative (“KPMG International”), a Swiss entity. All rights reserved. The KPMG name, logo and “cutting through complexity” are registered trademarks or trademarks of KPMG International. Liability limited by a scheme approved under Professional Standards Legislation. March 2015
Page 25
The options for analysis (outlined in Section 7) were developed by AMMA through a series of workshops with selected AMMA members. KPMG were not involved in the development of these options. Rather the focus of the KPMG analysis was to consider the potential economic implications of these options. It is recognised that there may be some costs associated with implementing these options (e.g. compliance and regulatory costs). These costs are not considered in this analysis.
The Terms of Reference for the Productivity Commission review were released on 14 December 2014 and the deadline for submissions is 13 March 2015. Accordingly, limited time was available to collect information, consult with all stakeholders, and undertake analysis of the economic implications of the proposed reform options. Therefore, the analysis presents the best available information that could be collected within the limited timeframe.
The ability to undertake rigorous economic analysis is determined by the quality of information available. The nature of proposed reform options and the conditions in the resources sector over the past decade mean that there is limited detailed data available on the link between changes in workplace relations regulations and economic outcomes. Additionally, the available timeframe for analysis limited the scope to gather detailed data from industry. Accordingly, analysis of the economic implications relies on historic information on the relationship between changes in workplace relations over time and labour market and economic variables. This historical information was supplemented with consultation with resources sector employers who provided anecdotal information and cost estimates on the impacts of workplace relations changes on their businesses.
© 2015 KPMG, an Australian partnership and a member firm of the KPMG network of independent member firms affiliated with KPMG International Cooperative (“KPMG International”), a Swiss entity. All rights reserved. The KPMG name, logo and “cutting through complexity” are registered trademarks or trademarks of KPMG International. Liability limited by a scheme approved under Professional Standards Legislation. March 2015
Page 26
4 Economic contribution of the Australian resources sector
© 2015 KPMG, an Australian partnership and a member firm of the KPMG network of independent member firms affiliated with KPMG International Cooperative (“KPMG International”), a Swiss entity. All rights reserved. The KPMG name, logo and “cutting through complexity” are registered trademarks or trademarks of KPMG International. Liability limited by a scheme approved under Professional Standards Legislation. March 2015
Page 27
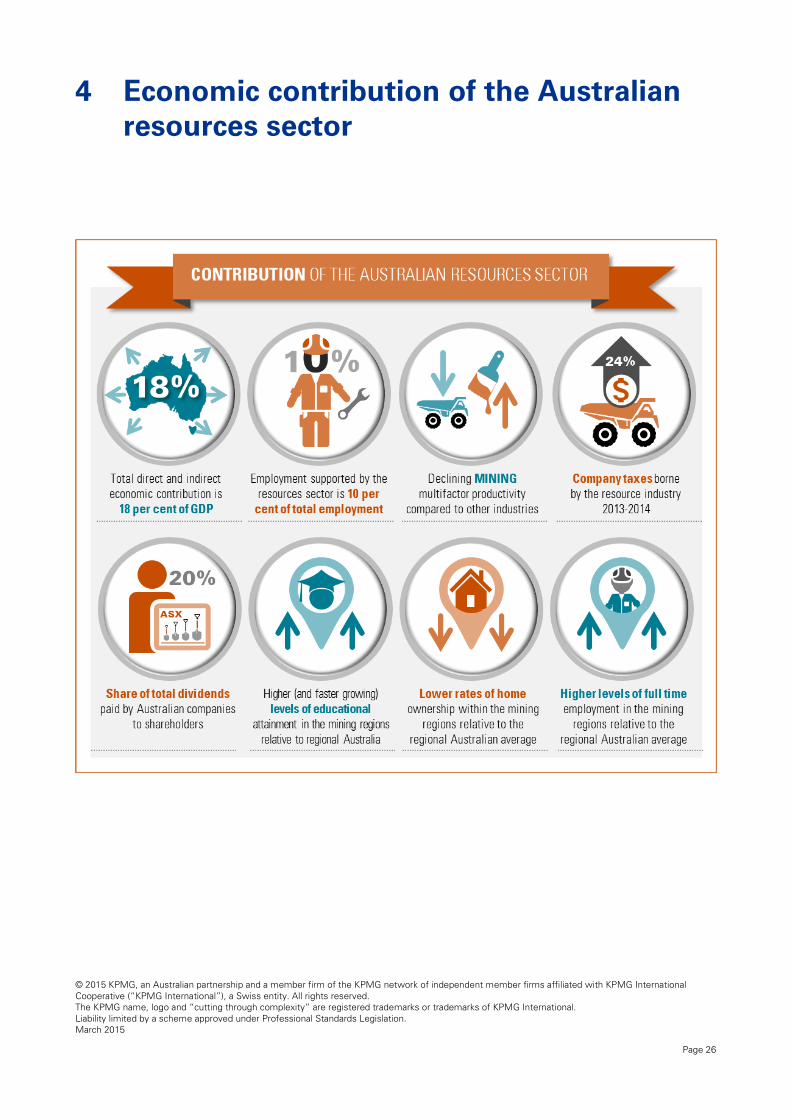
Summary:
The Australian economy has experienced almost a decade of structural adjustment characterised by a dramatic rise in the terms of trade and an associated exchange rate appreciation. The change in relative prices, together with investment in resources sector related infrastructure, have had a significant impact on the Australian economy.
Resources sector investment makes a significant contribution to GDP growth. Over the past decade, investment spending has increased from 2 per cent to 8 per cent of GDP. This investment has generated employment directly in the resources sector and in sectors that support the construction and operation of resources sector facilities and supply chains.
Consistent with the large capital injection into the sector, there has been a sharp reduction in the level of productivity in the sector over the past decade. This lower productivity also reflects a rapidly growing workforce and falling levels of average workforce experience.
Corresponding with a continued increase in commodity prices and an expansion in export capacity, resources exports doubled between 2004 and 2008. Resources exports are expected to continue to increase, despite lower commodity prices, as productive capacity comes on line.
The national resources sector directly generated $155 billion in value added to Australia’s GDP in 2013-14. This represents 10 per cent of total Australian GDP. Over half of the national resources sector GDP is generated in Western Australia. This is consistent with the significant investment in resource projects that has occurred over the last decade. In addition to this direct contribution, the resources sector supports economic activity in other industries that supply goods and services to the sector. The total (direct and indirect) resources sector contribution to GDP is estimated to be approximately 18 per cent of GDP.
In aggregate, the resources sector directly employed 269,000 people in resource extraction and 190,000 in resource-related construction and manufacturing in 2013-14. The resources sector also contributes to the employment of people in other areas such as professionals, administrative services, other construction, and education and training through upstream production linkages. The total (direct and indirect) contribution of the resources sector is estimated to be almost 10 per cent of total employment in Australia.
The resources sector is a major contributor to the Australian economy. It generates income for Australians and makes direct investments into capital cities and regions as part of its operations, across a range of industries. The following section outlines the economic contribution of the Australian resources sector, including:
• the contribution of the resources sector to business investment and to attracting foreign capital inflows;
• the value of production by the resources sector and growth in exports;
• the productivity performance of the sector and drivers of change over time;
• the contribution of the resources sector to economic growth;
• the contribution of the resources sector to employment growth and labour force development;
• the taxation revenue generated by the resources sector for Commonwealth, State and Territory Governments;
• the value created by resources sector companies for shareholders;
• the regional contribution of the resources sector to resources communities; and
• the broader socio-economic contribution of the sector to the Australian community.

© 2015 KPMG, an Australian partnership and a member firm of the KPMG network of independent member firms affiliated with KPMG International Cooperative (“KPMG International”), a Swiss entity. All rights reserved. The KPMG name, logo and “cutting through complexity” are registered trademarks or trademarks of KPMG International. Liability limited by a scheme approved under Professional Standards Legislation. March 2015
Page 28
The resources sector and the Australian economy
To understand the economic contribution of the Australian resources sector, it is important to understand the phases of the resources sector boom that have occurred over the past decade. These phases are illustrated in Figure 4-1 and the implications for the Australian economy are discussed below.
Figure 4-1: Phases of Australia’s resources boom
Source: KPMG analysis
The Australian economy has experienced almost a decade of structural adjustment characterised by a dramatic rise in the terms of trade and associated exchange rate appreciation. This rapid increase in the terms of trade has resulted in Australia’s Gross National Incomes (GNI) growing strongly. The change in relative prices, together with investment in resources sector related infrastructure, have had a significant impact on the Australian economy. The historical relationship between the terms of trade, exchange rates and commodity prices are illustrated in Chart 4-1.
As illustrated in Chart 4-1, the Australian dollar rose strongly between 2006 and 2008 as commodity prices rose. This exchange rate appreciation helped ease pressures that could have otherwise caused the economy to overheat over this period. Conversely, the sharp, but temporary, fall in the Australian dollar during the 2009 Global Financial Crisis (GFC) helped cushion the economy on the downside.
In the early 2000s, growth in global demand for commodities increased significantly, primarily due to demand from rapidly developing Asian economies such as China. To take advantage of the increase in demand for commodities and associated higher commodity prices, the resources sector expanded. This led to growth in industries that provide inputs and services to the resources sector, such as construction and transport.

© 2015 KPMG, an Australian partnership and a member firm of the KPMG network of independent member firms affiliated with KPMG International Cooperative (“KPMG International”), a Swiss entity. All rights reserved. The KPMG name, logo and “cutting through complexity” are registered trademarks or trademarks of KPMG International. Liability limited by a scheme approved under Professional Standards Legislation. March 2015
Page 29
Chart 4-1: Commodity prices, terms of trade and the exchange rate
Source: Reserve Bank of Australia 2015, Index of Commodity Prices, February, Reserve Bank of Australia 2015,
Exchange Rates, February and Australian Bureau of Statistics 2014, Australian National Accounts: National Income, Expenditure and Product, September 2014, Cat. No. 5206.0, Canberra.
The rise in commodity prices resulted in a number of benefits for the Australian economy, including:
• an increase in the terms of trade, resulting in a boost in the purchasing power of domestic income;
• an exchange rate appreciation that had the effect of redistributing the terms of trade benefits to the broader community through lower import prices; and
• an increase in resources investment resulting in direct and indirect employment and growth in the Australian economy.
The increase in production capacity in Australia has resulted in a significant increase in resource exports, boosting the global supply of commodities such as coal and iron ore. Similarly, other countries have expanded their production capacity, contributing to increasing global supply. This increase in supply, together with slowing demand from China, has resulted in a decline in commodity prices. As a result, Australia’s terms of trade have fallen, and the Australian dollar has depreciated.
4.1.1 Resources sector investment
Over the past decade, investment spending by the resources sector has increased from 2 per cent of GDP to 8 per cent12. This reflects the capital stock in the resources sector tripling since the beginning of the commodity prices boom. The resources sector share of capital expenditure is illustrated in Chart 4-2.
12 Downes, P., Hanslow, K. and Tulip P. 2014, The Effect of the Mining Boom on the Australian Economy, RBA Research Discussion Paper 2014-08, August.
0
50
100
150
200
250
300
350
400
450
Indi
ces
(198
2 =
100
)
Commodity Prices Exchange Rate (TWI) Terms of Trade
Commodity Prices
Terms of Trade
Exchange Rates (TWI)
Export demand led commodity price
increases
Increase in terms of trade and
exchange rate
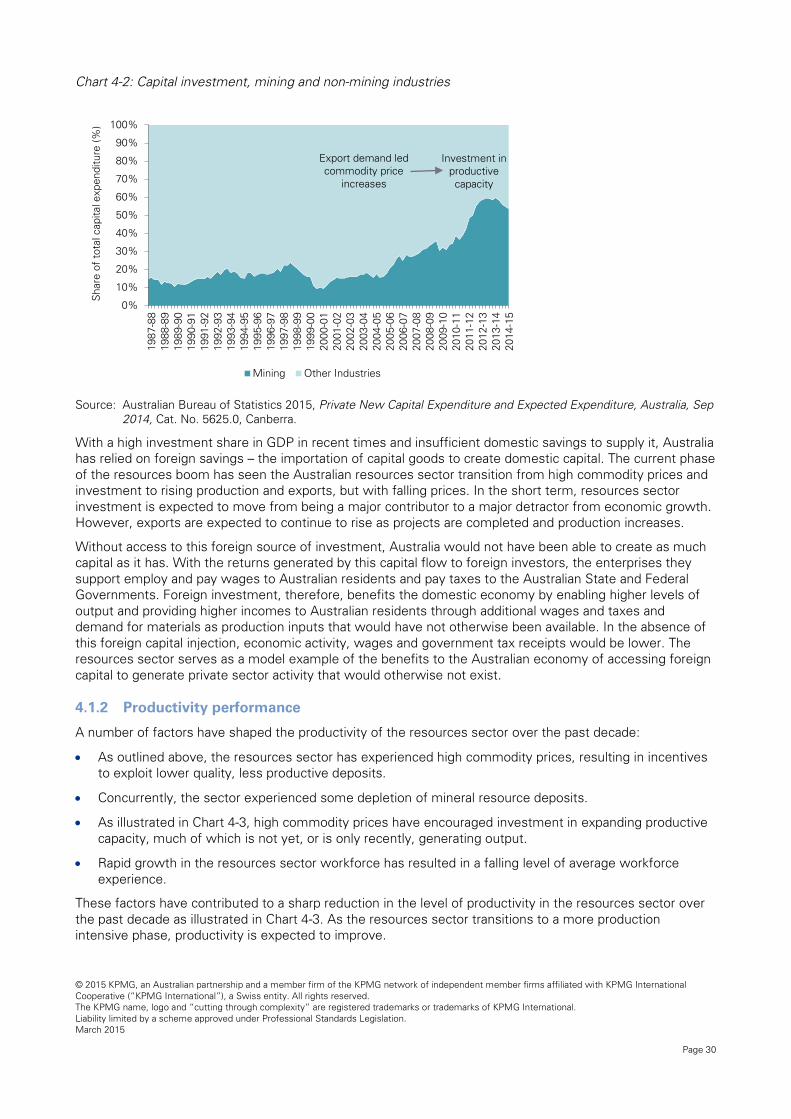
© 2015 KPMG, an Australian partnership and a member firm of the KPMG network of independent member firms affiliated with KPMG International Cooperative (“KPMG International”), a Swiss entity. All rights reserved. The KPMG name, logo and “cutting through complexity” are registered trademarks or trademarks of KPMG International. Liability limited by a scheme approved under Professional Standards Legislation. March 2015
Page 30
Chart 4-2: Capital investment, mining and non-mining industries
Source: Australian Bureau of Statistics 2015, Private New Capital Expenditure and Expected Expenditure, Australia, Sep
2014, Cat. No. 5625.0, Canberra.
With a high investment share in GDP in recent times and insufficient domestic savings to supply it, Australia has relied on foreign savings – the importation of capital goods to create domestic capital. The current phase of the resources boom has seen the Australian resources sector transition from high commodity prices and investment to rising production and exports, but with falling prices. In the short term, resources sector investment is expected to move from being a major contributor to a major detractor from economic growth. However, exports are expected to continue to rise as projects are completed and production increases.
Without access to this foreign source of investment, Australia would not have been able to create as much capital as it has. With the returns generated by this capital flow to foreign investors, the enterprises they support employ and pay wages to Australian residents and pay taxes to the Australian State and Federal Governments. Foreign investment, therefore, benefits the domestic economy by enabling higher levels of output and providing higher incomes to Australian residents through additional wages and taxes and demand for materials as production inputs that would have not otherwise been available. In the absence of this foreign capital injection, economic activity, wages and government tax receipts would be lower. The resources sector serves as a model example of the benefits to the Australian economy of accessing foreign capital to generate private sector activity that would otherwise not exist.
4.1.2 Productivity performance
A number of factors have shaped the productivity of the resources sector over the past decade:
• As outlined above, the resources sector has experienced high commodity prices, resulting in incentives to exploit lower quality, less productive deposits.
• Concurrently, the sector experienced some depletion of mineral resource deposits.
• As illustrated in Chart 4-3, high commodity prices have encouraged investment in expanding productive capacity, much of which is not yet, or is only recently, generating output.
• Rapid growth in the resources sector workforce has resulted in a falling level of average workforce experience.
These factors have contributed to a sharp reduction in the level of productivity in the resources sector over the past decade as illustrated in Chart 4-3. As the resources sector transitions to a more production intensive phase, productivity is expected to improve.
0%
10%
20%
30%
40%
50%
60%
70%
80%
90%
100%
1987
-88
1988
-89
1989
-90
1990
-91
1991
-92
1992
-93
1993
-94
1994
-95
1995
-96
1996
-97
1997
-98
1998
-99
1999
-00
2000
-01
2001
-02
2002
-03
2003
-04
2004
-05
2005
-06
2006
-07
2007
-08
2008
-09
2009
-10
2010
-11
2011
-12
2012
-13
2013
-14
2014
-15
Sha
re o
f to
tal c
apita
l exp
endi
ture
(%)
Mining Other Industries
Export demand led commodity price
increases
Investment in productive capacity
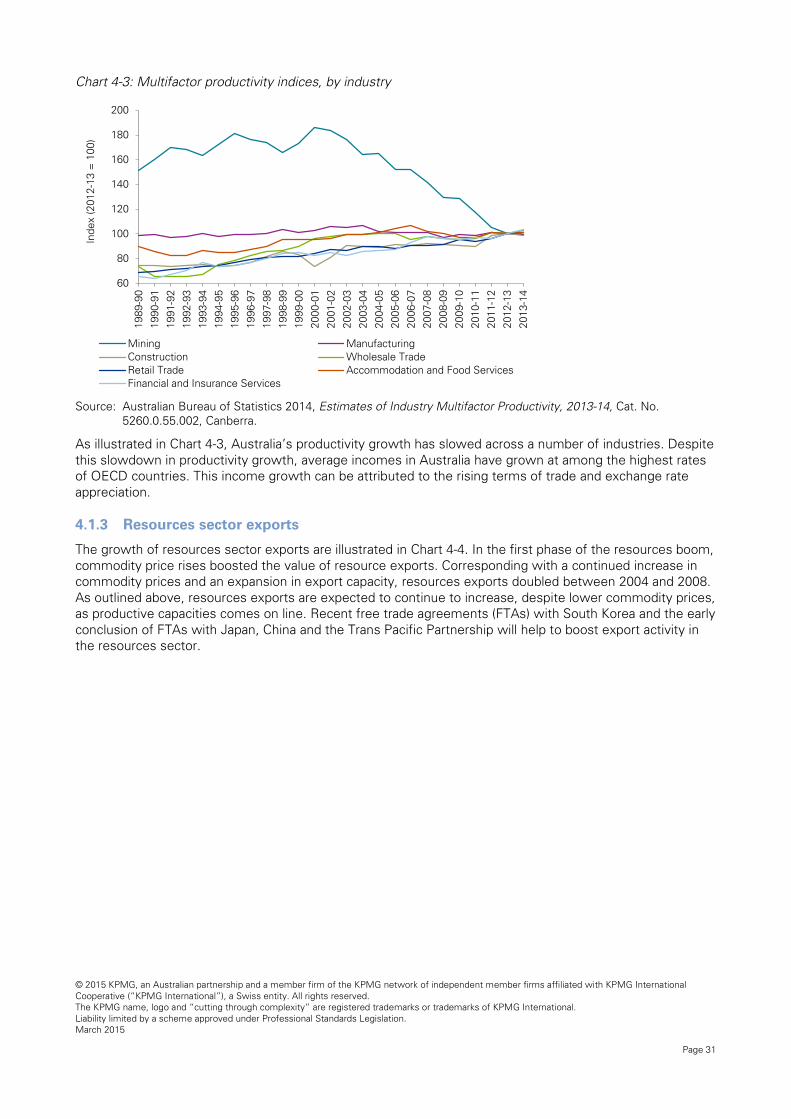
© 2015 KPMG, an Australian partnership and a member firm of the KPMG network of independent member firms affiliated with KPMG International Cooperative (“KPMG International”), a Swiss entity. All rights reserved. The KPMG name, logo and “cutting through complexity” are registered trademarks or trademarks of KPMG International. Liability limited by a scheme approved under Professional Standards Legislation. March 2015
Page 31
Chart 4-3: Multifactor productivity indices, by industry
Source: Australian Bureau of Statistics 2014, Estimates of Industry Multifactor Productivity, 2013-14, Cat. No.
5260.0.55.002, Canberra.
As illustrated in Chart 4-3, Australia’s productivity growth has slowed across a number of industries. Despite this slowdown in productivity growth, average incomes in Australia have grown at among the highest rates of OECD countries. This income growth can be attributed to the rising terms of trade and exchange rate appreciation.
4.1.3 Resources sector exports
The growth of resources sector exports are illustrated in Chart 4-4. In the first phase of the resources boom, commodity price rises boosted the value of resource exports. Corresponding with a continued increase in commodity prices and an expansion in export capacity, resources exports doubled between 2004 and 2008. As outlined above, resources exports are expected to continue to increase, despite lower commodity prices, as productive capacities comes on line. Recent free trade agreements (FTAs) with South Korea and the early conclusion of FTAs with Japan, China and the Trans Pacific Partnership will help to boost export activity in the resources sector.
60
80
100
120
140
160
180
200
1989
-90
1990
-91
1991
-92
1992
-93
1993
-94
1994
-95
1995
-96
1996
-97
1997
-98
1998
-99
1999
-00
2000
-01
2001
-02
2002
-03
2003
-04
2004
-05
2005
-06
2006
-07
2007
-08
2008
-09
2009
-10
2010
-11
2011
-12
2012
-13
2013
-14
Inde
x (2
012-
13 =
100
)
Mining ManufacturingConstruction Wholesale TradeRetail Trade Accommodation and Food ServicesFinancial and Insurance Services
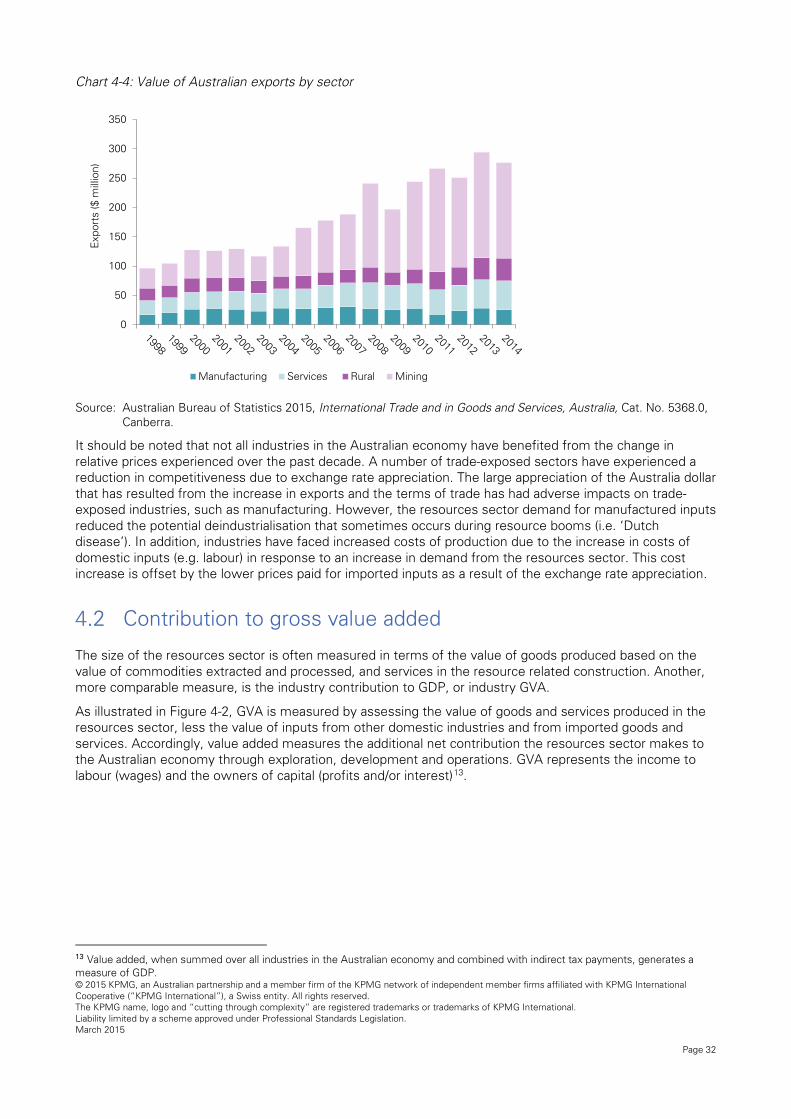
© 2015 KPMG, an Australian partnership and a member firm of the KPMG network of independent member firms affiliated with KPMG International Cooperative (“KPMG International”), a Swiss entity. All rights reserved. The KPMG name, logo and “cutting through complexity” are registered trademarks or trademarks of KPMG International. Liability limited by a scheme approved under Professional Standards Legislation. March 2015
Page 32
Chart 4-4: Value of Australian exports by sector
Source: Australian Bureau of Statistics 2015, International Trade and in Goods and Services, Australia, Cat. No. 5368.0,
Canberra.
It should be noted that not all industries in the Australian economy have benefited from the change in relative prices experienced over the past decade. A number of trade-exposed sectors have experienced a reduction in competitiveness due to exchange rate appreciation. The large appreciation of the Australia dollar that has resulted from the increase in exports and the terms of trade has had adverse impacts on trade-exposed industries, such as manufacturing. However, the resources sector demand for manufactured inputs reduced the potential deindustrialisation that sometimes occurs during resource booms (i.e. ‘Dutch disease’). In addition, industries have faced increased costs of production due to the increase in costs of domestic inputs (e.g. labour) in response to an increase in demand from the resources sector. This cost increase is offset by the lower prices paid for imported inputs as a result of the exchange rate appreciation.
Contribution to gross value added
The size of the resources sector is often measured in terms of the value of goods produced based on the value of commodities extracted and processed, and services in the resource related construction. Another, more comparable measure, is the industry contribution to GDP, or industry GVA.
As illustrated in Figure 4-2, GVA is measured by assessing the value of goods and services produced in the resources sector, less the value of inputs from other domestic industries and from imported goods and services. Accordingly, value added measures the additional net contribution the resources sector makes to the Australian economy through exploration, development and operations. GVA represents the income to labour (wages) and the owners of capital (profits and/or interest)13.
13 Value added, when summed over all industries in the Australian economy and combined with indirect tax payments, generates a measure of GDP.
0
50
100
150
200
250
300
350
Exp
orts
($ m
illio
n)
Manufacturing Services Rural Mining
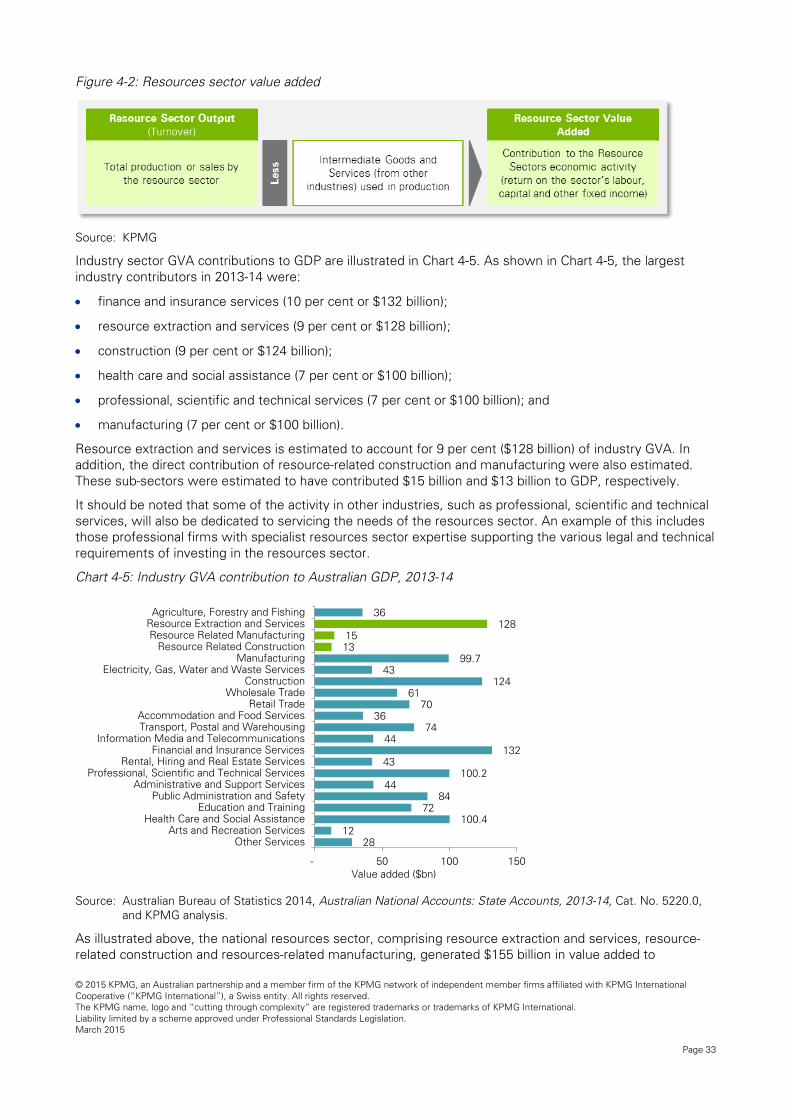
© 2015 KPMG, an Australian partnership and a member firm of the KPMG network of independent member firms affiliated with KPMG International Cooperative (“KPMG International”), a Swiss entity. All rights reserved. The KPMG name, logo and “cutting through complexity” are registered trademarks or trademarks of KPMG International. Liability limited by a scheme approved under Professional Standards Legislation. March 2015
Page 33
Figure 4-2: Resources sector value added
Source: KPMG
Industry sector GVA contributions to GDP are illustrated in Chart 4-5. As shown in Chart 4-5, the largest industry contributors in 2013-14 were:
• finance and insurance services (10 per cent or $132 billion);
• resource extraction and services (9 per cent or $128 billion);
• construction (9 per cent or $124 billion);
• health care and social assistance (7 per cent or $100 billion);
• professional, scientific and technical services (7 per cent or $100 billion); and
• manufacturing (7 per cent or $100 billion).
Resource extraction and services is estimated to account for 9 per cent ($128 billion) of industry GVA. In addition, the direct contribution of resource-related construction and manufacturing were also estimated. These sub-sectors were estimated to have contributed $15 billion and $13 billion to GDP, respectively.
It should be noted that some of the activity in other industries, such as professional, scientific and technical services, will also be dedicated to servicing the needs of the resources sector. An example of this includes those professional firms with specialist resources sector expertise supporting the various legal and technical requirements of investing in the resources sector.
Chart 4-5: Industry GVA contribution to Australian GDP, 2013-14
Source: Australian Bureau of Statistics 2014, Australian National Accounts: State Accounts, 2013-14, Cat. No. 5220.0,
and KPMG analysis.
As illustrated above, the national resources sector, comprising resource extraction and services, resource-related construction and resources-related manufacturing, generated $155 billion in value added to
36 128
15 13
99.7 43
124 61
70 36
74 44
132 43
100.2 44
84 72
100.4 12
28
- 50 100 150
Agriculture, Forestry and FishingResource Extraction and ServicesResource Related Manufacturing
Resource Related ConstructionManufacturing
Electricity, Gas, Water and Waste ServicesConstruction
Wholesale TradeRetail Trade
Accommodation and Food ServicesTransport, Postal and Warehousing
Information Media and TelecommunicationsFinancial and Insurance Services
Rental, Hiring and Real Estate ServicesProfessional, Scientific and Technical Services
Administrative and Support ServicesPublic Administration and Safety
Education and TrainingHealth Care and Social Assistance
Arts and Recreation ServicesOther Services
Value added ($bn)
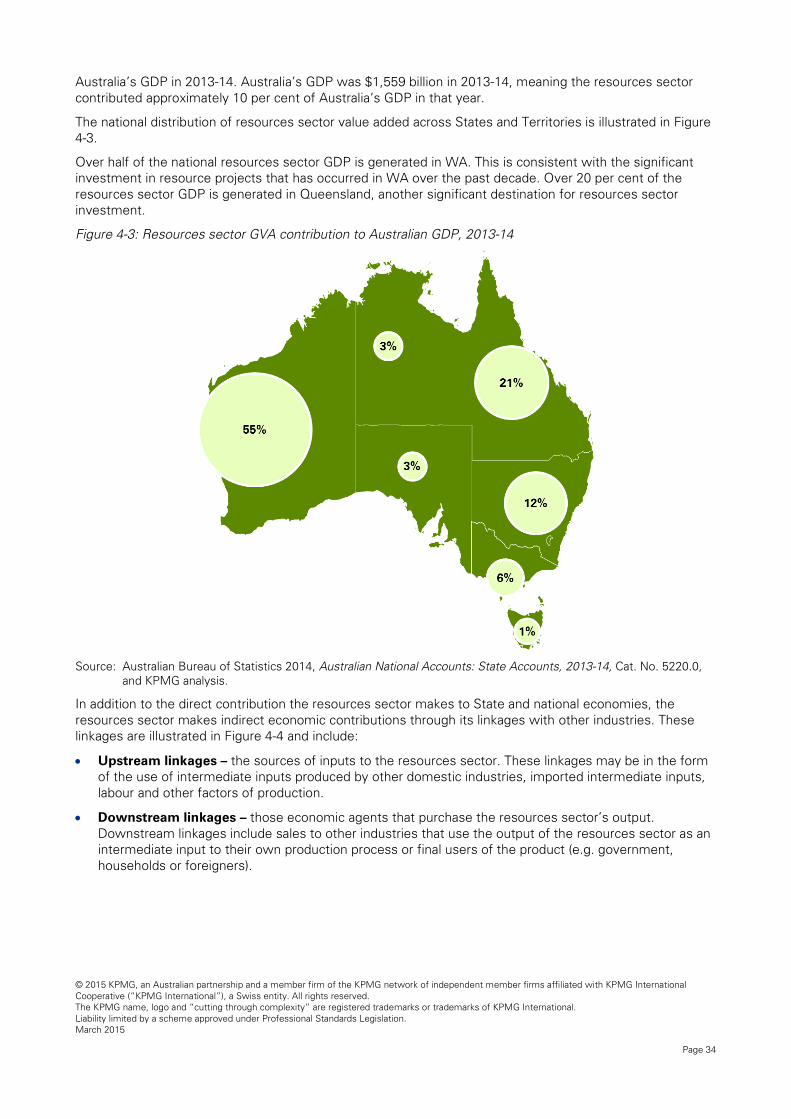
© 2015 KPMG, an Australian partnership and a member firm of the KPMG network of independent member firms affiliated with KPMG International Cooperative (“KPMG International”), a Swiss entity. All rights reserved. The KPMG name, logo and “cutting through complexity” are registered trademarks or trademarks of KPMG International. Liability limited by a scheme approved under Professional Standards Legislation. March 2015
Page 34
Australia’s GDP in 2013-14. Australia’s GDP was $1,559 billion in 2013-14, meaning the resources sector contributed approximately 10 per cent of Australia’s GDP in that year.
The national distribution of resources sector value added across States and Territories is illustrated in Figure 4-3.
Over half of the national resources sector GDP is generated in WA. This is consistent with the significant investment in resource projects that has occurred in WA over the past decade. Over 20 per cent of the resources sector GDP is generated in Queensland, another significant destination for resources sector investment.
Figure 4-3: Resources sector GVA contribution to Australian GDP, 2013-14
Source: Australian Bureau of Statistics 2014, Australian National Accounts: State Accounts, 2013-14, Cat. No. 5220.0,
and KPMG analysis.
In addition to the direct contribution the resources sector makes to State and national economies, the resources sector makes indirect economic contributions through its linkages with other industries. These linkages are illustrated in Figure 4-4 and include:
• Upstream linkages – the sources of inputs to the resources sector. These linkages may be in the form of the use of intermediate inputs produced by other domestic industries, imported intermediate inputs, labour and other factors of production.
• Downstream linkages – those economic agents that purchase the resources sector’s output. Downstream linkages include sales to other industries that use the output of the resources sector as an intermediate input to their own production process or final users of the product (e.g. government, households or foreigners).

© 2015 KPMG, an Australian partnership and a member firm of the KPMG network of independent member firms affiliated with KPMG International Cooperative (“KPMG International”), a Swiss entity. All rights reserved. The KPMG name, logo and “cutting through complexity” are registered trademarks or trademarks of KPMG International. Liability limited by a scheme approved under Professional Standards Legislation. March 2015
Page 35
Figure 4-4: Direct and first and second order impacts
Source: KPMG
An analysis of the total (direct and indirect) economic contribution of the Australian resources sector, undertaken by the RBA, estimated that the resource economy accounted for 18 per cent of GVA in 2011-12. This was comprised of a direct contribution by the resource extraction sector of 11.5 per cent. The remaining 6.5 per cent of GVA was generated by industries that provide inputs to resource extraction and investment activities14. This resource-related activity primarily consists of:
• business services;
• construction;
• transport; and
• manufacturing.
Employment contribution by the resources sector
The sectoral composition of employment in Australia is illustrated in Chart 4-6. Resource extraction and services directly employs 269,000 people or 2.3 per cent of total Australian employment. In addition, resource-related construction and resources-related manufacturing directly employ 190,000 people or 1.7 per cent of total Australian employment.
Australia’s resources boom is estimated to have raised employment and household income through a number of channels. Compared to the counterfactual, the Australian resources boom is estimated to have:
• increased the population by approximately 1 per cent, reflecting net migration flows responding to employment opportunities and wage growth;
• increased employment by 3 per cent through an increase in demand;
• increased real wages by approximately 6 per cent;
• increased the tax base; and
• raised household disposable income by 13 per cent15.
As the resources sector moves from a construction and investment phase to a production phase, compositional change will occur in the Australian economy. Many investment-related activities, such as construction, are significantly more labour-intensive than resource extraction and processing. As the construction phase of the resources sector expansion tempers, the share of resource-related activity in total
14 Rayner V. and Bishop J. 2013, Industry Dimensions of the Resource Boom: An Input-Output Analysis, RBA Research Discussion Paper No 2013-02. 15 Downes, P., Hanslow, K. and Tulip P. 2014, The Effect of the Mining Boom on the Australian Economy, RBA Research Discussion Paper 2014-08.

© 2015 KPMG, an Australian partnership and a member firm of the KPMG network of independent member firms affiliated with KPMG International Cooperative (“KPMG International”), a Swiss entity. All rights reserved. The KPMG name, logo and “cutting through complexity” are registered trademarks or trademarks of KPMG International. Liability limited by a scheme approved under Professional Standards Legislation. March 2015
Page 36
employment is expected to fall, and the composition of occupations and skills required will change. Many occupations that have experienced high demand will see their wage growth moderate, while those in high demand in extraction and processing will see wage growth accelerate.
Resource-related employment directly contributes to 4 per cent of total employment in Australia, compared to 10 per cent of GDP. The higher GDP share highlights the fact that the resources sector is less labour-intensive (and more capital-intensive) than the broader Australian economy. The higher average wages and salaries paid in the resources sector, relative to the broader economy, also contribute somewhat to the higher comparative GDP share.
Chart 4-6: Industry distribution of employment, 2013-14 (‘000)
Source: Australian Bureau of Statistics 2014, Labour Force, Australia, Detailed, Quarterly, November, Cat. No. 6291.0.55.003 (four quarter average) and KPMG analysis.
The national distribution of the Australian resources sector is illustrated in Figure 4-5.
Similar to the distribution of GVA, illustrated in Figure 4-3, employment is concentrated in WA and Queensland. However, the employment proportion of employment in WA (31 per cent) is significantly lower than the share of GVA in WA (55 per cent).
313 269
99 91
831 152
935 393
1,220 758
590 197
415 204
904 386
750 896
1,394 202
484
- 500 1,000 1,500
Agriculture, Forestry and FishingResource Extraction and ServicesResource Related Manufacturing
Resource Related ConstructionManufacturing
Electricity, Gas, Water and Waste ServicesConstruction
Wholesale TradeRetail Trade
Accommodation and Food ServicesTransport, Postal and Warehousing
Information Media and TelecommunicationsFinancial and Insurance Services
Rental, Hiring and Real Estate ServicesProfessional, Scientific and Technical Services
Administrative and Support ServicesPublic Administration and Safety
Education and TrainingHealth Care and Social Assistance
Arts and Recreation ServicesOther Services
Employment ('000)

© 2015 KPMG, an Australian partnership and a member firm of the KPMG network of independent member firms affiliated with KPMG International Cooperative (“KPMG International”), a Swiss entity. All rights reserved. The KPMG name, logo and “cutting through complexity” are registered trademarks or trademarks of KPMG International. Liability limited by a scheme approved under Professional Standards Legislation. March 2015
Page 37
Figure 4-5: Distribution of employment in the resources sector by place of work, 2013-14
Source: Australian Bureau of Statistics, Census of Population and Housing, Australian Bureau of Statistics 2014, Labour
Force, Australia, Detailed, Quarterly, November, Cat. No. 6291.0.55.003 and KPMG analysis.
In addition to direct employment, the resources sector contributes to the employment of people in downstream and upstream sectors such as professionals, administrative services, other construction and education and training.
The industry inter-linkages between the resources sector and other industries in the economy are significant. Research undertaken by the RBA estimates that resource-related activity is significantly more labour-intensive than resource extraction itself. RBA analysis suggests that this resource-related activity accounted for almost 7 per cent of total employment in Australia in 2011-1216.
The RBA estimated that the total (direct and indirect) resources sector employment was 10 per cent of total employment in 2011-12.17 This is equivalent to 1.1 million working Australians.
Contribution to taxation revenue
Despite lower commodity prices and constrained profit margins for resources companies in recent years, the resources sector delivers significant dividends to State and Federal Governments in the form of tax and royalty payments18. The increasing scale of production and export volumes will help to underpin the tax contribution of the resources sector in future years.
Tax collection from the resources sector (including Federal company tax and State royalties) has increased four-fold over the past decade. The resources sector accounts for 24 per cent of all corporate tax receipts in Australia, significantly higher than the sector share of GDP (10 per cent)19.
16 Rayner V. and Bishop J. 2013, Industry Dimensions of the Resource Boom: An Input-Output Analysis, RBA Research Discussion Paper No 2013-02. 17 Ibid. 18 Australian Government Treasury, Economic Roundup Issue 2, 2013. 19 Australian Taxation Office 2014, Taxation statistics 2011–12, April.
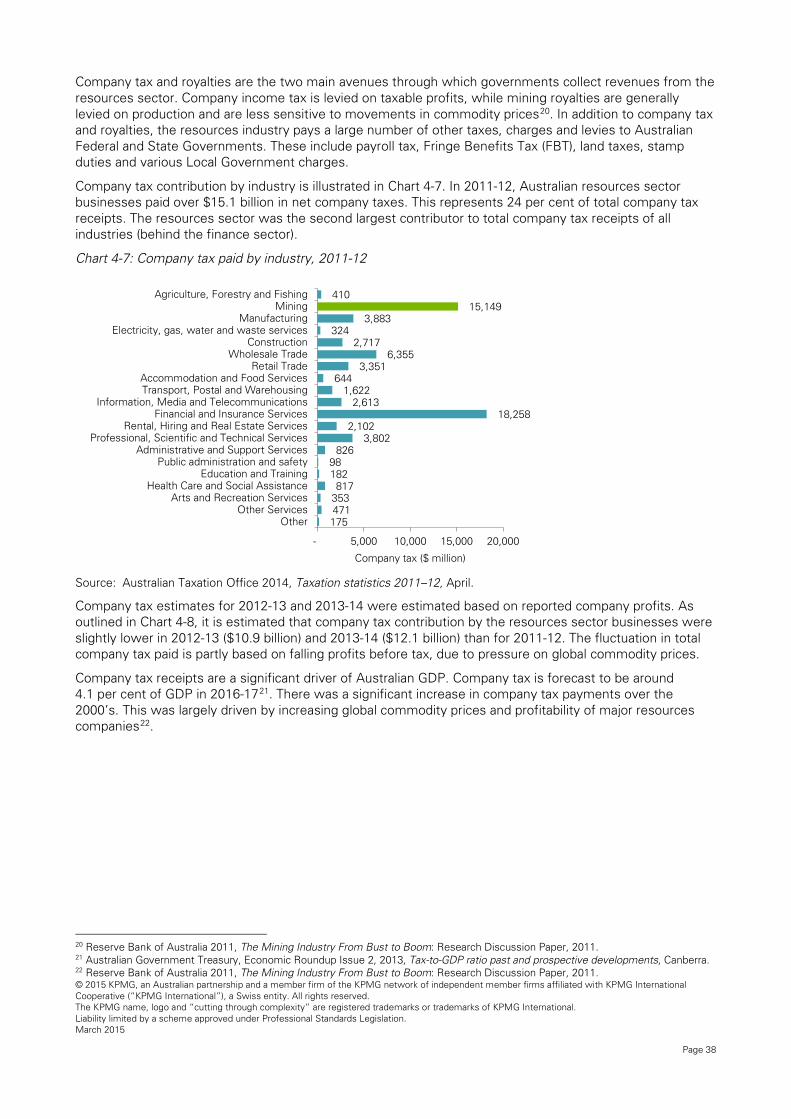
© 2015 KPMG, an Australian partnership and a member firm of the KPMG network of independent member firms affiliated with KPMG International Cooperative (“KPMG International”), a Swiss entity. All rights reserved. The KPMG name, logo and “cutting through complexity” are registered trademarks or trademarks of KPMG International. Liability limited by a scheme approved under Professional Standards Legislation. March 2015
Page 38
Company tax and royalties are the two main avenues through which governments collect revenues from the resources sector. Company income tax is levied on taxable profits, while mining royalties are generally levied on production and are less sensitive to movements in commodity prices20. In addition to company tax and royalties, the resources industry pays a large number of other taxes, charges and levies to Australian Federal and State Governments. These include payroll tax, Fringe Benefits Tax (FBT), land taxes, stamp duties and various Local Government charges.
Company tax contribution by industry is illustrated in Chart 4-7. In 2011-12, Australian resources sector businesses paid over $15.1 billion in net company taxes. This represents 24 per cent of total company tax receipts. The resources sector was the second largest contributor to total company tax receipts of all industries (behind the finance sector).
Chart 4-7: Company tax paid by industry, 2011-12
Source: Australian Taxation Office 2014, Taxation statistics 2011–12, April.
Company tax estimates for 2012-13 and 2013-14 were estimated based on reported company profits. As outlined in Chart 4-8, it is estimated that company tax contribution by the resources sector businesses were slightly lower in 2012-13 ($10.9 billion) and 2013-14 ($12.1 billion) than for 2011-12. The fluctuation in total company tax paid is partly based on falling profits before tax, due to pressure on global commodity prices.
Company tax receipts are a significant driver of Australian GDP. Company tax is forecast to be around 4.1 per cent of GDP in 2016-1721. There was a significant increase in company tax payments over the 2000’s. This was largely driven by increasing global commodity prices and profitability of major resources companies22.
20 Reserve Bank of Australia 2011, The Mining Industry From Bust to Boom: Research Discussion Paper, 2011. 21 Australian Government Treasury, Economic Roundup Issue 2, 2013, Tax-to-GDP ratio past and prospective developments, Canberra. 22 Reserve Bank of Australia 2011, The Mining Industry From Bust to Boom: Research Discussion Paper, 2011.
410 15,149
3,883 324
2,717 6,355
3,351 644
1,622 2,613
18,258 2,102
3,802 826
98 182 817
353 471 175
- 5,000 10,000 15,000 20,000
Agriculture, Forestry and FishingMining
ManufacturingElectricity, gas, water and waste services
ConstructionWholesale Trade
Retail TradeAccommodation and Food ServicesTransport, Postal and Warehousing
Information, Media and TelecommunicationsFinancial and Insurance Services
Rental, Hiring and Real Estate ServicesProfessional, Scientific and Technical Services
Administrative and Support ServicesPublic administration and safety
Education and TrainingHealth Care and Social Assistance
Arts and Recreation ServicesOther Services
Other
Company tax ($ million)
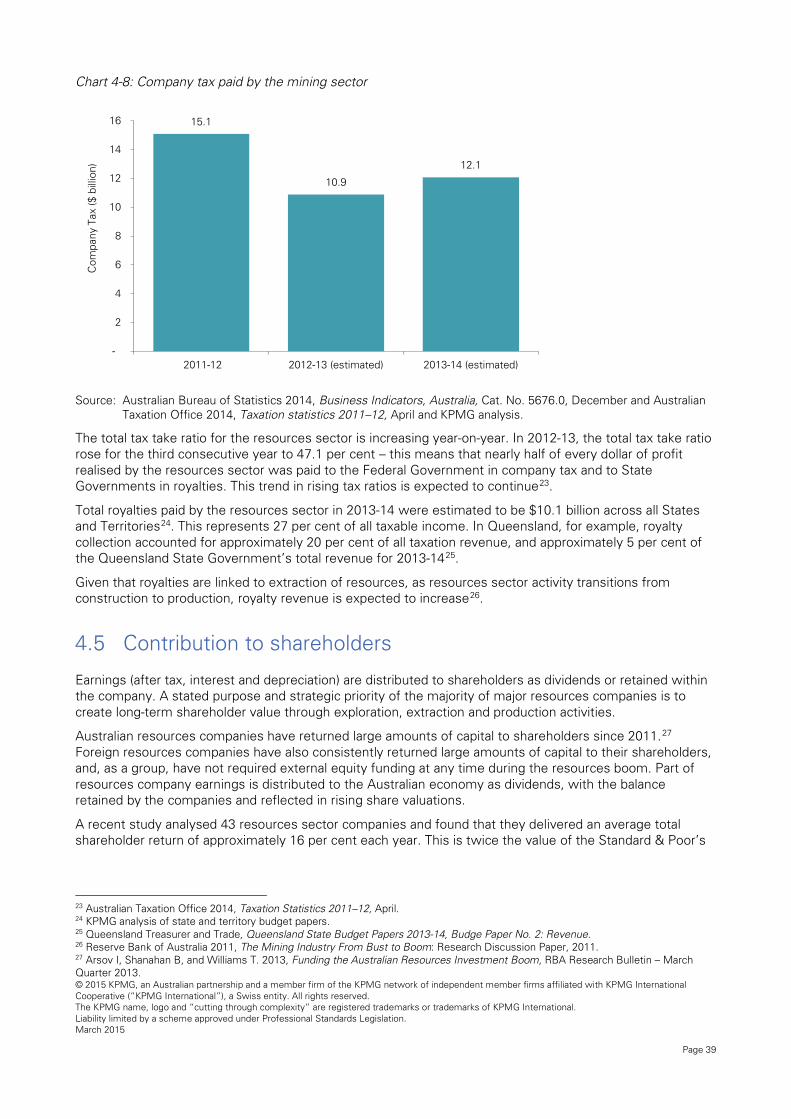
© 2015 KPMG, an Australian partnership and a member firm of the KPMG network of independent member firms affiliated with KPMG International Cooperative (“KPMG International”), a Swiss entity. All rights reserved. The KPMG name, logo and “cutting through complexity” are registered trademarks or trademarks of KPMG International. Liability limited by a scheme approved under Professional Standards Legislation. March 2015
Page 39
Chart 4-8: Company tax paid by the mining sector
Source: Australian Bureau of Statistics 2014, Business Indicators, Australia, Cat. No. 5676.0, December and Australian
Taxation Office 2014, Taxation statistics 2011–12, April and KPMG analysis.
The total tax take ratio for the resources sector is increasing year-on-year. In 2012-13, the total tax take ratio rose for the third consecutive year to 47.1 per cent – this means that nearly half of every dollar of profit realised by the resources sector was paid to the Federal Government in company tax and to State Governments in royalties. This trend in rising tax ratios is expected to continue23.
Total royalties paid by the resources sector in 2013-14 were estimated to be $10.1 billion across all States and Territories24. This represents 27 per cent of all taxable income. In Queensland, for example, royalty collection accounted for approximately 20 per cent of all taxation revenue, and approximately 5 per cent of the Queensland State Government’s total revenue for 2013-1425.
Given that royalties are linked to extraction of resources, as resources sector activity transitions from construction to production, royalty revenue is expected to increase26.
Contribution to shareholders
Earnings (after tax, interest and depreciation) are distributed to shareholders as dividends or retained within the company. A stated purpose and strategic priority of the majority of major resources companies is to create long-term shareholder value through exploration, extraction and production activities.
Australian resources companies have returned large amounts of capital to shareholders since 2011.27 Foreign resources companies have also consistently returned large amounts of capital to their shareholders, and, as a group, have not required external equity funding at any time during the resources boom. Part of resources company earnings is distributed to the Australian economy as dividends, with the balance retained by the companies and reflected in rising share valuations.
A recent study analysed 43 resources sector companies and found that they delivered an average total shareholder return of approximately 16 per cent each year. This is twice the value of the Standard & Poor’s
23 Australian Taxation Office 2014, Taxation Statistics 2011–12, April. 24 KPMG analysis of state and territory budget papers. 25 Queensland Treasurer and Trade, Queensland State Budget Papers 2013-14, Budge Paper No. 2: Revenue. 26 Reserve Bank of Australia 2011, The Mining Industry From Bust to Boom: Research Discussion Paper, 2011. 27 Arsov I, Shanahan B, and Williams T. 2013, Funding the Australian Resources Investment Boom, RBA Research Bulletin – March Quarter 2013.
15.1
10.9
12.1
-
2
4
6
8
10
12
14
16
2011-12 2012-13 (estimated) 2013-14 (estimated)
Com
pany
Tax
($ b
illio
n)
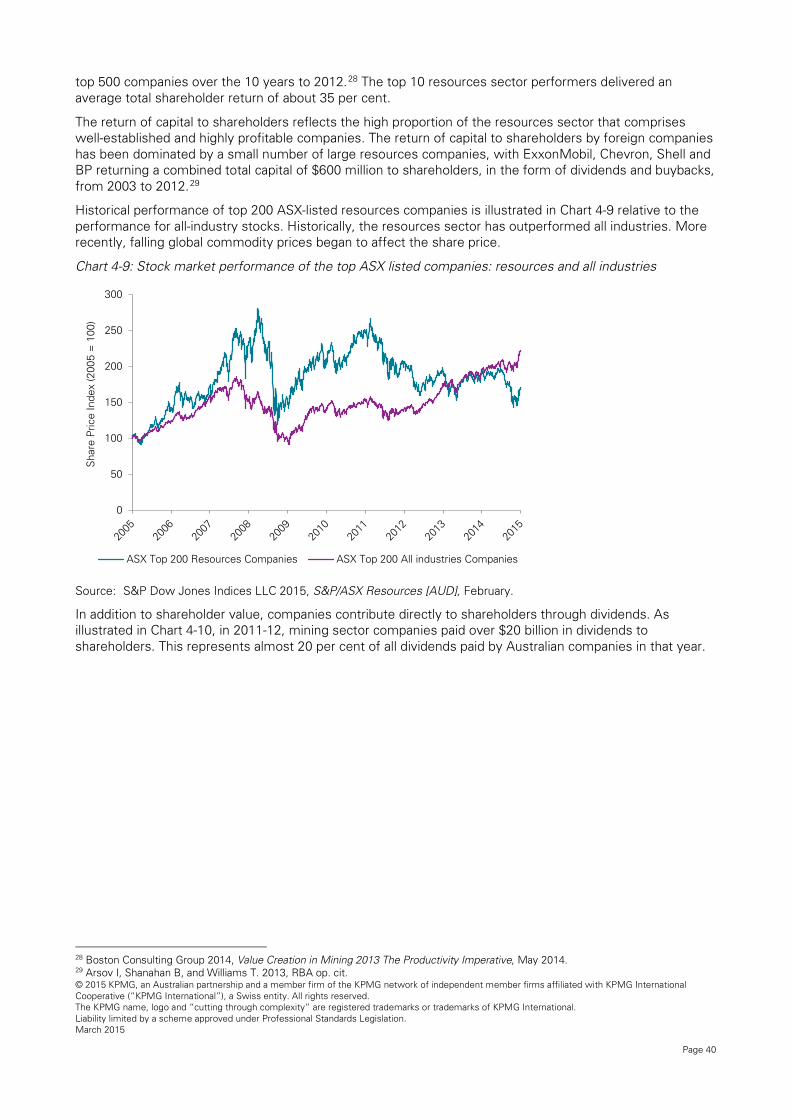
© 2015 KPMG, an Australian partnership and a member firm of the KPMG network of independent member firms affiliated with KPMG International Cooperative (“KPMG International”), a Swiss entity. All rights reserved. The KPMG name, logo and “cutting through complexity” are registered trademarks or trademarks of KPMG International. Liability limited by a scheme approved under Professional Standards Legislation. March 2015
Page 40
top 500 companies over the 10 years to 2012.28 The top 10 resources sector performers delivered an average total shareholder return of about 35 per cent.
The return of capital to shareholders reflects the high proportion of the resources sector that comprises well-established and highly profitable companies. The return of capital to shareholders by foreign companies has been dominated by a small number of large resources companies, with ExxonMobil, Chevron, Shell and BP returning a combined total capital of $600 million to shareholders, in the form of dividends and buybacks, from 2003 to 2012.29
Historical performance of top 200 ASX-listed resources companies is illustrated in Chart 4-9 relative to the performance for all-industry stocks. Historically, the resources sector has outperformed all industries. More recently, falling global commodity prices began to affect the share price.
Chart 4-9: Stock market performance of the top ASX listed companies: resources and all industries
Source: S&P Dow Jones Indices LLC 2015, S&P/ASX Resources [AUD], February.
In addition to shareholder value, companies contribute directly to shareholders through dividends. As illustrated in Chart 4-10, in 2011-12, mining sector companies paid over $20 billion in dividends to shareholders. This represents almost 20 per cent of all dividends paid by Australian companies in that year.
28 Boston Consulting Group 2014, Value Creation in Mining 2013 The Productivity Imperative, May 2014. 29 Arsov I, Shanahan B, and Williams T. 2013, RBA op. cit.
0
50
100
150
200
250
300
Sha
re P
rice
Inde
x (2
005
= 1
00)
ASX Top 200 Resources Companies ASX Top 200 All industries Companies

© 2015 KPMG, an Australian partnership and a member firm of the KPMG network of independent member firms affiliated with KPMG International Cooperative (“KPMG International”), a Swiss entity. All rights reserved. The KPMG name, logo and “cutting through complexity” are registered trademarks or trademarks of KPMG International. Liability limited by a scheme approved under Professional Standards Legislation. March 2015
Page 41
Chart 4-10: Dividends paid by company industry sector, 2011-12
Source: Australian Taxation Office 2014, Taxation statistics 2011–12, April
Contribution to regional economies
The resources sector makes an important contribution to Australian regional economies, including through:
• supporting population growth and development in regional communities;
• increasing employment opportunities in regional communities; and
• diversifying the economic base in regional communities.
The following section highlights how the resources sector has contributed to regional communities in Australia and provides a detailed case study of the contribution to the Pilbara community.
4.6.1 Population growth and development
The resources sector plays a critical role in many regional Australian communities. In February 2013, KPMG undertook analysis on the changing demographic profiles of nine sample resources regions in Australia, namely: Northwest Queensland; Galilee Basin; Bowen Basin; Surat Basin; Hunter Valley; Central South Australia; Kalgoorlie- Boulder; Central West; and Pilbara30 The analysis sought to provide insight into the demographic characteristics of the resident population living within these resources regions across Australia, as well as to understand the underlying socio-economic data and trends. These regions were selected for analysis based on the high concentration of resources sector workers, as it is in these regions where the significant growth in resources employment is impacting on the demographic landscape and where flow-on socio-economic contribution can be seen.
The report found that, on the whole, resident populations in the sampled resources regions are growing and diversifying. Over the five years to June 2011, there were a total of 37,840 residents added to the combined sampled mining regions31. This is equivalent to an average annual population growth rate of 1.5 per cent32. As illustrated in Chart 4-11, of the nine resources regions considered in this report, six experienced population growth at, or above, the regional Australia average growth rates over the same period. The
30 KPMG 2013, Analysis of the Changing Resident Demographic Profile of Australia’s Mining Communities, report prepared for the Minerals Council of Australia, February 2013. 31 Ibid. 32 Australian Bureau of Statistics-defined regional areas ‘with the most usual residents employed in the mining industry’, (2013), 0 - Australian Social Trends, Cat. No. 4102, Canberra.
- 20,000 40,000 60,000
Agriculture, Forestry and FishingMining
ManufacturingElectricity, gas, water and waste services
ConstructionWholesale Trade
Retail TradeAccommodation and Food ServicesTransport, Postal and Warehousing
Information, Media and TelecommunicationsFinancial and Insurance Services
Rental, Hiring and Real Estate ServicesProfessional, Scientific and Technical Services
Administrative and Support ServicesPublic administration and safety
Education and TrainingHealth Care and Social Assistance
Arts and Recreation ServicesOther Services
Other
Dividends ($ million)

© 2015 KPMG, an Australian partnership and a member firm of the KPMG network of independent member firms affiliated with KPMG International Cooperative (“KPMG International”), a Swiss entity. All rights reserved. The KPMG name, logo and “cutting through complexity” are registered trademarks or trademarks of KPMG International. Liability limited by a scheme approved under Professional Standards Legislation. March 2015
Page 42
analysis found that increased resources activity is contributing to a demographic shift, leading to higher levels of residential population growth in the sampled resources regions. The analysis found that over the period 2006 to 2011, the regions with the fastest growing population are located in WA.
In addition to overall growth in population, the analysis found a number of socio-demographic factors characterised these resources regions, relative to the rest of regional Australia. Specifically:
• the resources regions had a higher proportion of ‘working age’ population (average of 71 per cent) relative to the regional Australia average (63 per cent);
• there were higher (and faster growing) levels of educational attainment in the resources regions relative to regional Australia;
• there were lower rates of home ownership within the resources regions relative to the regional Australia average;
• the proportion of residents in the resources regions with a high income increased three-fold between 2006 and 2011, from 7 per cent to 18 per cent; and
• there were higher levels of full-time employment in the resources regions relative to the regional Australia average.
Chart 4-11: Average annual population growth, selected Australian resources regions, 2006 to 2011
Source: KPMG 2013, Analysis of the Changing Resident Demographic Profile of Australia’s Mining Communities, report
prepared for the Minerals Council of Australia, February 2013
The higher proportion of working age population in the resources regions may be attributed to the strong demand for labour within these regions increasing the attractiveness for those of working age. Consistent with the rising level of resources sector employment within these regions, the average incomes of residents has increased significantly over the last five years. The increase in average incomes is particularly strong in the Pilbara region, where, in 2011, 42 per cent of Pilbara residents were earning a high income (defined as earnings of $2,000 or more per week). This compares to an average of 5 per cent of residents in regional Australia as a whole.
4.6.2 Employment and economic opportunities
The KPMG analysis of selected resources regions found that the primary contribution that resources sector activity made to these regional communities is through increased employment opportunities in regional and remote areas. As outlined above, the prospect of increased employment opportunities has translated into rapid growth in the regional population, higher income levels, and higher levels of educational attainment in resources regions relative to the regional Australian average.
-2%-1%0%1%2%3%4%5%6%7%8%
Bow
en B
asin
Gal
ilee
Bas
in
Sur
at B
asin
Nor
th-W
est
QLD
Pilb
ara
Kal
goor
lie-B
ould
er
Cen
tral
Wes
t
Hun
ter V
alle
y
Cen
tral
Sou
th A
ustr
alia
Tota
l Min
ing
Reg
ions
Reg
iona
l Aus
tral
ia
Aus
tral
ia
Ave
rage
ann
ual p
opul
atio
n gr
owth
(%)
Regional Australia average
© 2015 KPMG, an Australian partnership and a member firm of the KPMG network of independent member firms affiliated with KPMG International Cooperative (“KPMG International”), a Swiss entity. All rights reserved. The KPMG name, logo and “cutting through complexity” are registered trademarks or trademarks of KPMG International. Liability limited by a scheme approved under Professional Standards Legislation. March 2015
Page 43
A major contributing factor to developing sustainable regional resources communities includes establishing and cultivating a strong economic base. For many regions in Australia, the resources sector provides this economic base. Some of the economic benefits associated with resources-based regional economies include:
• employment opportunities;
• higher income levels;
• higher education attainment levels;
• contribution to gross regional product (GRP);
• increased regional exports; and
• injections of foreign capital.
Increasing resources-based activity has created significant employment opportunities in regional Australia. In early 2009, mining companies (as with many other industries) put an embargo on hiring in the wake of the Global Financial Crisis (GFC). However, since late 2009 there has been significant growth in resources sector employment. The strong demand for labour is reflected in the high rates of full-time employment within Australia’s resources regions (66 per cent of the workforce in 2011, compared to 58 per cent across regional Australia).
Recent analysis of resources sector employment in WA regions found that a number of regions are heavily reliant on the resources sector as a source of employment. Specifically,
• direct employment in the resources sector accounts for over half the total employment in the Pilbara region;
• direct employment in the resources sector accounts for one third of total employment in the South Eastern region; and
• the resources sector is a significant contributor to employment in the Kimberley, Central and South West regions.
In 2006, the level of high income earners was 5 per cent in Australia’s resources regions. By 2011, this had increased to 13 per cent (compared to 5 per cent across non-mining regional Australia).33
Another positive impact associated with increased resources activity in regional Australia includes higher (and faster growing) rates of educational attainment with 41 per cent completing Year 12 in 2011, compared to 36 per cent in regional Australia.34 This can potentially be attributed to the level of direct investment in the resources industry in regional Australia, but also to the level of investment from individual resources companies in training programs and up-skilling of local labour force participants.
To demonstrate the resources sector contribution to regional Australia, the following case study highlights the contribution the resources sector makes to the Pilbara community.
Case Study 4-1: Contribution of the resources sector to the Pilbara community
A number of regional and remote areas in WA are reliant on the resources sector to support local employment and the community. The Pilbara region in north-west WA is well recognised as a fast-growing and evolving regional community and economy resulting from its abundant iron ore and LNG resources. The Pilbara region includes the resource-driven townships of Port Hedland, Newman and Karratha. Some of the significant positive contributions, arising from the presence and growth of the local resources industry, to the Pilbara region include:
• population growth;
• growth in employment;
33 KPMG 2013, Analysis of the Changing Resident Demographic Profile of Australia’s Mining Communities, report prepared for the Minerals Council of Australia 34 Ibid
© 2015 KPMG, an Australian partnership and a member firm of the KPMG network of independent member firms affiliated with KPMG International Cooperative (“KPMG International”), a Swiss entity. All rights reserved. The KPMG name, logo and “cutting through complexity” are registered trademarks or trademarks of KPMG International. Liability limited by a scheme approved under Professional Standards Legislation. March 2015
Page 44
• regional contribution to State economic growth;
• increasing levels of household income;
• increasing levels of educational attainment;
• contribution to national export income; and
• community development programs.
Challenges:
The economic and social challenges of the Pilbara region include:
• challenging remote geographic context;
• lack of adequate infrastructure;
• environmental pressures;
• ensuring a sustainable population;
• skilled labour shortages;
• over-reliance on the resources sector as the economic base; and
• land rights and bureaucracy35
The Pilbara Cities Vision is a strategic initiative by the Pilbara Development Commission (a statutory authority of the State Government of WA) to support the growth of Karratha and Port Hedland into cities of 50,000 permanent residents by 2035, along with making other Pilbara towns more attractive sustainable local communities. The Pilbara Development Commission was established in 1992 to help address some of the challenges outline above. The Commission works with several key government and resource industry stakeholders to help achieve this vision, including resources companies.
Population growth:
The Pilbara region experienced 42 per cent growth in population between 2006 and 2011, compared to a 4 per cent growth in residential population in regional Australia36 in the same period. This translates to an average annual growth in residential population of 7.3 per cent per annum between 2006 and 2011. This average annual growth rate is over nine times the average annual residential population growth rate at 0.8 per cent for regional Australia, over the same period. Employment opportunities within the region are a large driver of regional population growth in the Pilbara region. These population figures exclude the significant long-distance commuter workforce who work in the Pilbara region. More than 10,600 long distance commuter workers, or 16 per cent of the West Australian resources industry workforce, commute between Perth and the Pilbara (as at August 2011).37
Employment:
As at the 2011 Census, 25 per cent of the total WA resources sector workforce worked in the Pilbara region. Direct employment in the resources sector accounted for half of total employment in the Pilbara region (22,812 jobs). Of these resources sector workers, the largest share were employed in the resource extraction and services industry (18,484 employees, or over 80 per cent of resources sector employment in that region), with most of the remainder employed in resource-related construction.38 Additionally, there is employment provided in the Pilbara region by downstream resources industries (e.g. transport; manufacturing; accommodation and food services; and professional, scientific and technical services).
35 Future Directions International, 2013, Pilbara Prospects 2020, Developments and Challenges for the Region
37 Australian Bureau of Statistics 2011, Census of Population and Housing, Workplace of Perth Residents Employed in the Mining Industry in 2011, Canberra. 38 Australian Bureau of Statistics 2011, Census of Population and Housing, Canberra

© 2015 KPMG, an Australian partnership and a member firm of the KPMG network of independent member firms affiliated with KPMG International Cooperative (“KPMG International”), a Swiss entity. All rights reserved. The KPMG name, logo and “cutting through complexity” are registered trademarks or trademarks of KPMG International. Liability limited by a scheme approved under Professional Standards Legislation. March 2015
Page 45
Growth trends in each of these industries of employment can also be seen between the 2006 and 2011 Censuses, as a result of the existence of the resources sector, increasing the regional importance of the resources industry.
As at the 2011 Census, more than 75 per cent of workers were employed full-time, compared to 58 per cent across regional Australia.
Value-added
Based on the 2011 Census information and the latest data on WA GVA, the Pilbara region contributes an estimated $26.7 billion in resources industry GVA.39 This represents 30 per cent of the total GVA generated directly by the resources sector in WA. Gross Regional Product (GRP) is $34.85 billion.40
Increased levels of income
In 2011, 42 per cent of the Pilbara’s residents earned a high income (defined as $2,000 or more per week). This compares with 5 per cent of high income earners in regional Australia. The rate at which the proportion of high income earners has grown in that community is also significant. There was a 26 percentage point increase, in the proportion of high income earners between the 2006 and 2011 Censuses. This compares to an average of a 3 percentage point increase in the proportion of high income earner residents across the rest of regional Australia over the same period41.
Increased levels of educational attainment
In 2006, 39.6 per cent of residents in the Pilbara region had completed Year 12. This increased to 47 per cent in 2011. This is higher than the regional Australian average with 38 per cent of residents having achieved the same level of educational attainment in 201142.
Exports
The largest export commodity in Australia is iron ore with a total export value of $74.7 billion of iron ore exported from Australia in 2013-1443 44, of which $70 billion is produced and exported from the Pilbara region. In 2013-14, iron ore continued to be the most valuable resources sector in WA, accounting for 61 per cent of the total value of the State’s mineral and petroleum sales45, and the Pilbara region is its most valuable producer and exporter.
Over the period 2000-01 to 2010-11, the value of Australia’s exports of mineral and energy commodities increased at an average annual rate of around 10 per cent. Over the same period, exports of mineral and energy commodities increased from 37 per cent of the total value of Australia’s exports to 60 per cent. The total value of resources exports in 2013-14 was $194.5 billion, which accounted for 58 per cent of total exports46. Resources exports for the Pilbara region for the same period was $44.6 billion, or 22.9 per cent of total Australian resources exports47.
Community development:
The equivalent of 25 per cent of WA’s mining and petroleum royalty revenue is being reinvested, through the ‘Royalties for Regions’ platform, in regional WA’s infrastructure, services and community projects. The Pilbara region is expected to receive approximately $1 billion over a five year period from the Royalties for Regions and the Pilbara Cities Initiative.48 The WA Government has adopted a range of more
39 Australia Bureau of Statistics, 2014, Australian National Accounts: State Accounts, 2013-14, Cat. No. 5220.0, Canberra, November, Australian Bureau of Statistics, Census of Population and Housing, and KPMG analysis. 40 Australian Bureau of Statistics’ (ABS) June 2014 Gross State Product, 2009 / 2010 National Input Output Tables and 2011. 41 Australian Department of Industry 2013, Resources and Energy Statistics 2013, Office of the Chief Economist, Canberra, December 2014. 42 Australian Bureau of Statistics 2006 and 2011, Census of Population and Housing, 2006 and 2011, Canberra. 43 Bureau of Resources and Energy Economics (BREE) 2014, Australian Mineral Statistics 2014. 44 Australian Bureau of Statistics 2013, International Trade Australia, Cat. No. 5465.0, Canberra. 45 Department of Mines and Petroleum, Western Australia 2014, Western Australian Mineral and Petroleum Statistics Digest 2013. 46 Australian Bureau of Statistics 2013, International Trade Australia, Cat. No. 5465.0, Canberra. 47 Ibid. 48 Barclay, M, Everingham, J, Cheshire, L, Brereton, D, Pattenden, C and Lawrence, G 2012, Local Government, mining companies and resource development in Regional Australia: meeting the governance challenge Brisbane, Australia: Centre for Social Responsibility in Mining, The University of Queensland
© 2015 KPMG, an Australian partnership and a member firm of the KPMG network of independent member firms affiliated with KPMG International Cooperative (“KPMG International”), a Swiss entity. All rights reserved. The KPMG name, logo and “cutting through complexity” are registered trademarks or trademarks of KPMG International. Liability limited by a scheme approved under Professional Standards Legislation. March 2015
Page 46
enabling initiatives to expedite social infrastructure planning and development in the Pilbara through public-private partnerships with resources companies to fund the provision of social and physical infrastructure.
Over the last 10 years, royalties received by the WA Government from mineral and petroleum producers have increased, on average, 21 per cent per annum since 2003–04 to a record $6.98 billion in 2013–14. The majority of royalties collected for 2013-14 came from iron ore (76 per cent).
Social contribution to communities
Rapid development of resources extraction projects in Australia has been accompanied by significant socio-economic impacts, such as increased local knowledge and expertise, increased skills and capability, achievement of community or regional priorities, changing legislation and improved infrastructure49. Maximising the potential benefits of these socio-economic impacts requires collaboration among multiple stakeholders, including:
• resources sector employers;
• Federal, State and Local Governments;
• employer and employee interest groups; and
• non-government organisations.
It is crucial to the success of a project for resources companies to familiarise themselves with the socio-economic environment in which they are investing, exploring and operating. Increasingly, project approval processes require social impact assessments and/or social impact management plans to be undertaken. This involves an assessment of the socioeconomic benefits or contribution a project is likely to generate in communities, including the social consequences, both intended and unintended50. This requirement seeks to ensure that resources companies operate in a socially responsible manner by maintaining their ‘social licence to operate’.
This section provides a brief overview of the contribution the Australian resources sector makes to local communities in terms of socio-economic impacts, including:
• impact on the community and stakeholders;
• research and development activity;
• human development; and
• partnerships for sustainable community development.
4.7.1 Community and stakeholder impacts
Developing a new resources project and the ongoing operation of the resources project can have significant socio-economic impacts on local communities. As illustrated in Figure 4-6, these impacts can be broadly categorised into five key areas.
49Uhlmann, V 2014, Prioritising indicators of cumulative socio-economic impacts to characterise rapid devilment of onshore gas resources, Centre for Social Responsibility in Mining, The University of Queensland. 50 Franks, DM, Brereton, D, Moran, CJ, Sarker, T and T, Cohen 2010. Cumulative Impacts: a good practice guide for the Australian coal mining industry, Centre for Social Responsibility in Mining & Centre for Water in the Minerals Industry, Sustainable Minerals Institute, The University of Queensland.

© 2015 KPMG, an Australian partnership and a member firm of the KPMG network of independent member firms affiliated with KPMG International Cooperative (“KPMG International”), a Swiss entity. All rights reserved. The KPMG name, logo and “cutting through complexity” are registered trademarks or trademarks of KPMG International. Liability limited by a scheme approved under Professional Standards Legislation. March 2015
Page 47
Figure 4-6: Socio-economic impact of resource project construction and operation
Source: Barclay, M, Everingham, J, Cheshire, L, Brereton, D, Pattenden, C and Lawrence, G 2012, Local Government, mining
companies and resource development in Regional Australia: meeting the governance challenge Brisbane, Australia: Centre for Social Responsibility in Mining, The University of Queensland
The community socio-economic impacts can be concentrated in one particular category or cumulative, depending on the particular community or region and the socio-economic context. For resources companies, supporting training, up-skilling and capacity-building initiatives that foster employment opportunities in the local communities have the potential to positively impact the sustainability of major operations.
The resources sector also contributes to its local communities and economies, through investment by individual resources companies, including via:
• community investments and grants;
• corporate social responsibility projects including creating training, employment and contracting opportunities; and
• active community partnerships that contribute to local social infrastructure projects and initiatives.
4.7.2 Research and development activity
The resources sector has important linkages with other industries in regional economies and industries and can be leveraged to support continued growth of local resources industries, development of infrastructure and increased flow-on services. Australian resources companies have long been at the forefront of technological development and environmental research. For example:
• The research and technological development activity associated with differential flotation enabling the separation of zinc and lead concentrate originated in Broken Hill.
• Mount Isa Mines developed technology that facilitated the growth of continuous copper on reusable stainless steel cathodes and introduced new techniques in the copper smelting process with its Isasmelt Technology51.
Research and development activity is an important contributor to driving down costs and improving productivity, key attributes to ensure that the Australian resources sector remains competitive and financially and environmentally sustainable.
Australia’s resources sector has increased Research and Development (R&D) activity substantially over the last decade and spent $4 billion on R&D in 2012-13. This represents 22 per cent of all business R&D
51 Roarty, M 2012, The Australian Resources Sector its contribution to the nation, and a brief review of issues and impacts, Australian Parliamentary Library, Research Publications.

© 2015 KPMG, an Australian partnership and a member firm of the KPMG network of independent member firms affiliated with KPMG International Cooperative (“KPMG International”), a Swiss entity. All rights reserved. The KPMG name, logo and “cutting through complexity” are registered trademarks or trademarks of KPMG International. Liability limited by a scheme approved under Professional Standards Legislation. March 2015
Page 48
investment, with the resources sector’s contribution increasing by $265 million in 2012-1352. From 2007–08 to 2009–10, business expenditure on R&D related to resources increased by 30 per cent, compared to an 11 per cent increase in total business expenditure on R&D53.
4.7.3 Community development and collaboration
The extent to which the wellbeing of local communities and individuals is being impacted is an important indicator of the social contribution that the resources sector is making in local communities. The Northern Australia Strategy 54 is an example of an initiative designed to develop and deepen collaboration and partnerships between industry, government and communities to ensure Northern Australia reaches its human development and socio-economic potential. This strategy recognises that human capital is an important factor in the sustainability of local communities which are dominated by the resources sector and that mining companies as large local employers and key community stakeholders have the opportunity to make a significant contribution to human development, in social and socio-economic terms55. A World Bank study on the connection between resource sector development and overall socioeconomic and human development found that this level of development is proportionately higher for middle and higher income countries, such as Australia. From 2007 to 2011, resources intensive countries outperformed their counterparts without mineral wealth by almost 1 per cent in terms of GDP rates and their respective Human Development Index (HDI) performance56. The HDI is a summary measure of average achievement in key dimensions of human development: a long and healthy life, being knowledgeable and having a decent standard of living57.
Commitments by government and resources companies to developing sustainable local resources communities, particularly in regional and remote areas, can help to contribute to socio-economic development. Working within a sustainable development framework, in the resources sector context, is largely focused on people and communities and how increased resources activity can contribute to people’s lives. Corporate social responsibility initiatives by resources companies and resources sector stakeholders can impact positively on the socio-economic environment of local communities and address many of the socio-economic challenges outlined above, through:
• improved occupational health and safety;
• improved community health and safety;
• increased community and stakeholder engagement;
• gender and diversity recognition;
• fostering the growth of artisanal and small scale resources businesses;
• pro-social engagement with indigenous and land-connected Peoples;
• compensation and resettlement;
• increased awareness around environmental and social impact assessments; and
• establishing new initiatives to lessen communities’ economic reliance on resources following the intensive construction phase or following an operational closure.
Resources companies have the opportunity to work with Indigenous communities to improve economic outcomes associated with mining agreements via the Native Title system. More than 80 per cent of resources operations in Australia have neighbouring Indigenous communities. Across 200 resources
52Productivity Commission, 2014, Trade & Assistance Review 2012-13, Annual Report Series, Productivity Commission, Canberra, June, 2014. 53 Australian Bureau of Statistics 2012, Year Book Australia, Cat. No.1301.0, Canberra; Research and Experimental Development, Business, Australia Cat. No. 8104.0, 2010. 54 Australian Government Green Paper, 2014, 2030 Vision for Developing Northern Australia, June, Canberra. 55 Dale, A 2013, Rethinking the future of northern Australia’s regions, Regional Australia Institute, Canberra. 56 McMahon and Moreira 2014, The Contribution of the Mining Sector to Socioeconomic and Human Development, World Bank, Oil, Gas and Mining Unit Working Paper. 57 United Nations Development Programme, Human Development Report, Data, 2014.
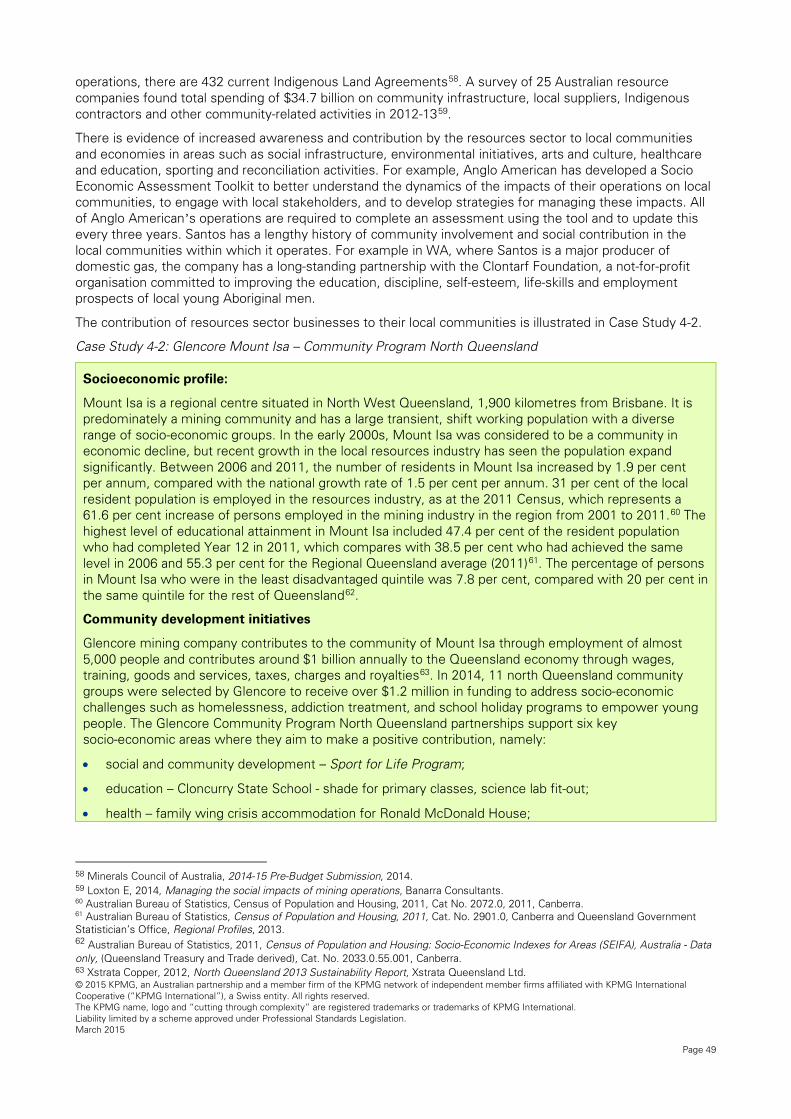
© 2015 KPMG, an Australian partnership and a member firm of the KPMG network of independent member firms affiliated with KPMG International Cooperative (“KPMG International”), a Swiss entity. All rights reserved. The KPMG name, logo and “cutting through complexity” are registered trademarks or trademarks of KPMG International. Liability limited by a scheme approved under Professional Standards Legislation. March 2015
Page 49
operations, there are 432 current Indigenous Land Agreements58. A survey of 25 Australian resource companies found total spending of $34.7 billion on community infrastructure, local suppliers, Indigenous contractors and other community-related activities in 2012-1359.
There is evidence of increased awareness and contribution by the resources sector to local communities and economies in areas such as social infrastructure, environmental initiatives, arts and culture, healthcare and education, sporting and reconciliation activities. For example, Anglo American has developed a Socio Economic Assessment Toolkit to better understand the dynamics of the impacts of their operations on local communities, to engage with local stakeholders, and to develop strategies for managing these impacts. All of Anglo American’s operations are required to complete an assessment using the tool and to update this every three years. Santos has a lengthy history of community involvement and social contribution in the local communities within which it operates. For example in WA, where Santos is a major producer of domestic gas, the company has a long-standing partnership with the Clontarf Foundation, a not-for-profit organisation committed to improving the education, discipline, self-esteem, life-skills and employment prospects of local young Aboriginal men.
The contribution of resources sector businesses to their local communities is illustrated in Case Study 4-2.
Case Study 4-2: Glencore Mount Isa – Community Program North Queensland
Socioeconomic profile:
Mount Isa is a regional centre situated in North West Queensland, 1,900 kilometres from Brisbane. It is predominately a mining community and has a large transient, shift working population with a diverse range of socio-economic groups. In the early 2000s, Mount Isa was considered to be a community in economic decline, but recent growth in the local resources industry has seen the population expand significantly. Between 2006 and 2011, the number of residents in Mount Isa increased by 1.9 per cent per annum, compared with the national growth rate of 1.5 per cent per annum. 31 per cent of the local resident population is employed in the resources industry, as at the 2011 Census, which represents a 61.6 per cent increase of persons employed in the mining industry in the region from 2001 to 2011.60 The highest level of educational attainment in Mount Isa included 47.4 per cent of the resident population who had completed Year 12 in 2011, which compares with 38.5 per cent who had achieved the same level in 2006 and 55.3 per cent for the Regional Queensland average (2011)61. The percentage of persons in Mount Isa who were in the least disadvantaged quintile was 7.8 per cent, compared with 20 per cent in the same quintile for the rest of Queensland62.
Community development initiatives
Glencore mining company contributes to the community of Mount Isa through employment of almost 5,000 people and contributes around $1 billion annually to the Queensland economy through wages, training, goods and services, taxes, charges and royalties63. In 2014, 11 north Queensland community groups were selected by Glencore to receive over $1.2 million in funding to address socio-economic challenges such as homelessness, addiction treatment, and school holiday programs to empower young people. The Glencore Community Program North Queensland partnerships support six key socio-economic areas where they aim to make a positive contribution, namely:
• social and community development – Sport for Life Program;
• education – Cloncurry State School - shade for primary classes, science lab fit-out;
• health – family wing crisis accommodation for Ronald McDonald House;
58 Minerals Council of Australia, 2014-15 Pre-Budget Submission, 2014. 59 Loxton E, 2014, Managing the social impacts of mining operations, Banarra Consultants. 60 Australian Bureau of Statistics, Census of Population and Housing, 2011, Cat No. 2072.0, 2011, Canberra. 61 Australian Bureau of Statistics, Census of Population and Housing, 2011, Cat. No. 2901.0, Canberra and Queensland Government Statistician’s Office, Regional Profiles, 2013. 62 Australian Bureau of Statistics, 2011, Census of Population and Housing: Socio-Economic Indexes for Areas (SEIFA), Australia - Data only, (Queensland Treasury and Trade derived), Cat. No. 2033.0.55.001, Canberra. 63 Xstrata Copper, 2012, North Queensland 2013 Sustainability Report, Xstrata Queensland Ltd.

© 2015 KPMG, an Australian partnership and a member firm of the KPMG network of independent member firms affiliated with KPMG International Cooperative (“KPMG International”), a Swiss entity. All rights reserved. The KPMG name, logo and “cutting through complexity” are registered trademarks or trademarks of KPMG International. Liability limited by a scheme approved under Professional Standards Legislation. March 2015
Page 50
• environment – Southern Gulf catchments, natural resources management activities;
• enterprise and job creation – generating jobs and building skills for disadvantaged people; and
• arts and culture – Mount Isa instrumental music program.
Through these programs, Glencore plays an important role in addressing socio-economic challenges of the local Mount Isa community by providing jobs, skills, and training, paying taxes and royalties, procuring goods and services from local enterprises, supporting community development programs and investing in local infrastructure.
Source: Xstrata Copper 2012, North Queensland 2013 Sustainability Report

© 2015 KPMG, an Australian partnership and a member firm of the KPMG network of independent member firms affiliated with KPMG International Cooperative (“KPMG International”), a Swiss entity. All rights reserved. The KPMG name, logo and “cutting through complexity” are registered trademarks or trademarks of KPMG International. Liability limited by a scheme approved under Professional Standards Legislation. March 2015
Page 51
5 International competitiveness of the Australian resources sector
© 2015 KPMG, an Australian partnership and a member firm of the KPMG network of independent member firms affiliated with KPMG International Cooperative (“KPMG International”), a Swiss entity. All rights reserved. The KPMG name, logo and “cutting through complexity” are registered trademarks or trademarks of KPMG International. Liability limited by a scheme approved under Professional Standards Legislation. March 2015
Page 52
Summary
Australia is rich with natural resources, with natural resource rents representing approximately 8 per cent of GDP. To extract maximum value from Australia’s resource endowment, the Australian resources sector has historically been export-orientated. This global trade requires competing with other global producers and exporters, requiring a constant focus on the cost of production. Australia’s historic competitiveness has been buttressed by the high grade of minerals, particularly for commodities such as iron-ore and coal, commanding higher prices and being geographically situated next to our Asian neighbours. This has provided Australia with a natural advantage over competitors.
In recent years, Australia’s competitiveness has declined, as the cost of production for many commodities has risen faster than the global average. This has been driven by higher input costs and an appreciation of the Australian dollar. The regulatory framework, including the taxation system, the workplace relations framework and approvals processes, can also add to the costs of projects.
To enable Australia to remain competitive and continue exporting, Australia will likely have to address the causes of the decline, including through improved use of inputs in the production process and investigating policy reform. If the resources industry’s competitiveness continues to decline, it could impact its sustainability and threaten the benefits of the sector that flow through to the broader economy in terms of higher employment and incomes.
Many resource-exporting nations are from the developing world. However, there are a group of OECD members, such as Canada and the US, where national resource rents account for more than 1 per cent of GDP. To allow a better like-for-like analysis, this chapter’s analysis focuses on benchmarking the comparative costs of producing resources for that cohort of nations.
Australia’s resources sector is export-oriented, with exports expected to account for over 67 per cent of resources sector revenue in 2014-15. Consistent with this reliance on exports, the performance of the Australian resources sector depends on global trends in supply and demand, and its ability to compete internationally64.
Improving global economic conditions are expected to underpin increases in demand for resources. However, due to rising global supply, prices for key commodities are expected to remain weaker than in recent years. The costs of production, interest rates, credit ratings and the value of the Australian dollar will be key factors that determine the performance of the Australian resources sector in the next few years65. In addition, the ability to attract highly mobile global finance to fund long-term projects will be important for the resources industry and continued investment in the Australian economy. This relies on a wider range of factors – in addition to productive efficiency – including factors that influence the environment for investment, such as a favourable regulatory environment.
Comparatively high development costs and a sub-optimal environment for investment could jeopardise Australia’s ability to attract the capital needed to finance projects and the willingness of businesses to explore, develop and operate in the resources sector. Such a scenario could potentially lead to a decline in investment growth and the associated economic benefits that flow through to the broader economy.
This section provides a comparative analysis of the competitiveness of the Australian resources sector relative to comparable OECD countries. Recognising the need for Australia to compete in terms of investment attraction and productive efficiency, the analysis considers:
• development costs (including timeframes associated with project approvals);
• labour and non-labour production costs; and
• legal and compliance costs.
To analyse the international competitiveness of the Australian resources sector, Australia’s performance is compared with nine other resource-intensive economies. These countries were chosen based on their resource intensity and the comparability of the policy and regulatory environment. Chart 5-1 illustrates OECD
64 IBIS World 2015, Mining in Australia, IBIS World Industry Report B, January. 65 IBIS World 2015, Mining in Australia, IBIS World Industry Report B, January.

© 2015 KPMG, an Australian partnership and a member firm of the KPMG network of independent member firms affiliated with KPMG International Cooperative (“KPMG International”), a Swiss entity. All rights reserved. The KPMG name, logo and “cutting through complexity” are registered trademarks or trademarks of KPMG International. Liability limited by a scheme approved under Professional Standards Legislation. March 2015
Page 53
countries where natural resource rents contribute more than 1 percentage point to GDP66. The composition of rents varies substantially between countries, with Australia having one of the more diverse natural resource mixes.
The nations listed in Chart 5-1 have guided the comparative analysis in this chapter and are often the comparator countries used. They were selected for a ‘like-for-like’ comparison with Australia as:
• the natural resources industry forms a significant component of the national economy; and
• as OECD members, like Australia, they are all advanced market-based economies.
Chart 5-1: Natural resource rents for selected OECD members, 2012, proportion of GDP a
a Excludes forestry rents
Source: World Bank 2014, World Development Indicators, World Bank Group.
The following analysis aims to highlight the international competitiveness of Australia relative to comparable countries. The extent of the comparison and analysis of competitiveness is limited by a number of factors, specifically:
• some comparisons are conducted in US dollars making costs dependent on currency fluctuations;
• the different structure of project approvals processes may require significant work to be completed before an application is submitted, which may not be captured in approvals timeframes;67
• the inability to differentiate if production costs are driven by inadequate investment in capital and technology, and hence have higher operating costs;
• the limited ability to distinguish if cost differentials are driven by the varying grades of commodities; and
• transport costs, such as shipping costs, are largely fixed for certain countries, due to their distance from major markets.
66 The economic rent of a natural resource equals the value of capital services flows rendered by the natural resources, or their share in the gross operating surplus; its value is given by the value of extraction. Resource rent may be divided between depletion and return to natural capital. 67 In the Netherlands, application documents and stakeholders discussion can take up to four years and must be completed before the start of the official application process, which tends to take between 9-12 months. See Roland Berger 2011, Permitting procedures for energy infrastructure projects in the EU: evaluation and legal recommendations, Final Report for the European Commission Directorate-General for Energy, Berlin/Brussels.
15.6%
11.9%
8.3% 7.9%
4.0%
2.1% 1.7% 1.5% 1.2% 1.2%
0%
2%
4%
6%
8%
10%
12%
14%
16%
Chile Norway Mexico Australia Canada Denmark NewZealand
Poland UnitedStates
UnitedKingdom
Oil rents Natural gas rents Coal rents Mineral rents

© 2015 KPMG, an Australian partnership and a member firm of the KPMG network of independent member firms affiliated with KPMG International Cooperative (“KPMG International”), a Swiss entity. All rights reserved. The KPMG name, logo and “cutting through complexity” are registered trademarks or trademarks of KPMG International. Liability limited by a scheme approved under Professional Standards Legislation. March 2015
Page 54
These data and information limitations should be considered when assessing the analysis and findings of the competitiveness of the Australian resources sector.
Development costs and timeframes
Development costs include costs associated with planning and approvals and costs associated with construction and commissioning of project infrastructure. In addition to these direct costs associated with development, the time taken to obtain development approvals has the potential to impact the total project cost. The following section analyses the costs of project development in Australia and the timeframes for approval relative to comparable countries, including:
• the costs associated with expanding capacity;
• the costs of wages during the construction phase of development; and
• approval timeframes for major resource projects.
5.1.1 Costs of expanding capacity
The capital expenditure required to build a tonne of new capacity of thermal coal production has increased significantly in recent years (as illustrated in Chart 5-2). This is a global phenomenon, with global costs (ex Australia), rising by 45 per cent from 2007 to 2011-12, from USD$73 to USD$106 per tonne of capacity. However, in Australia the rise has been even more marked, with costs rising 189 per cent (from USD$61 to USD$176 per tonne of capacity) over the same period. As a result, Australia has gone from being comparatively less expensive relative to the rest of the world to being 66 per cent more expensive than the global average over the five year period.
Chart 5-2: Capital spend to build a tonne of new thermal coal capacity, 2007 and 2011-12
Source: Port Jackson Partners 2012, Opportunity at risk: regaining our competitive edge in minerals resources, report
prepared for the Minerals Council of Australia, Port Jackson Partners
The absolute and relative increase in costs illustrated in Chart 5-2 reduces Australia’s ability to compete globally in attracting capital for project development. This trend in increasing relative costs, reflected in the cost of production analysis for several commodities in this chapter, has several causes, including the:
• elevated level of the Australian dollar from 2007 to 2014;
• increasing marginal cost of production, responding to the significant increase in global demand and supply for resources; and
6173
176
106
0
40
80
120
160
200
Australia Rest of the World
2011
$U
S p
er t
onne
of
capa
city
2007 2011/12

© 2015 KPMG, an Australian partnership and a member firm of the KPMG network of independent member firms affiliated with KPMG International Cooperative (“KPMG International”), a Swiss entity. All rights reserved. The KPMG name, logo and “cutting through complexity” are registered trademarks or trademarks of KPMG International. Liability limited by a scheme approved under Professional Standards Legislation. March 2015
Page 55
• input supply shortages, particularly skilled labour.
More detailed analysis of these generic drivers, which are not specific to a particularly commodity and affect the resource industry as a whole, can be found in Section 4.
5.1.2 Construction wage costs
As outlined in Section 4, the construction phase of a resources project is often more labour-intensive relative to the production phase. Accordingly, labour costs can be a significant driver of overall project development costs. The world has experienced a so-called ‘commodity super-cycle’ in recent years, with commodity prices rising significantly above their long-term average. Associated with this super-cycle, has been a sustained increase in demand for specific skills and a resulting rise in resource and energy sector project construction wages, as illustrated in Chart 5-3.
Chart 5-3. Resource and energy sector project construction wages, 2012
Source: Port Jackson Partners 2012, Opportunity at risk: regaining our competitive edge in minerals resources, report
prepared for the Minerals Council of Australia, Port Jackson Partners
In Australia, wages in the resources sector, specifically construction wages, increased two and a half times faster than the national average in constant prices. In US dollar terms, resources sector construction wages in Australia increased by an average of 16.6 per cent on a compound average annual rate from 2001 to 2012. In comparison, Canada’s increase in wages was around half that rate, while in the US, the increase was around one-third of Australia’s rate over the same time period.
The impact of higher labour costs on the overall costs of project development is illustrated in the following example Case Study 5-1.

© 2015 KPMG, an Australian partnership and a member firm of the KPMG network of independent member firms affiliated with KPMG International Cooperative (“KPMG International”), a Swiss entity. All rights reserved. The KPMG name, logo and “cutting through complexity” are registered trademarks or trademarks of KPMG International. Liability limited by a scheme approved under Professional Standards Legislation. March 2015
Page 56
Case Study 5-1: Cost comparison of construction in Australia and the United States, Incitec Pivot
Incitec Pivot is an Australian multinational company that manufactures, markets and distributes a range of industrial chemicals, fertilisers and explosives to a range of customers, including in the resources sector. It contributes to the production of infrastructure, food, clothing, and energy. It has operations in the US, Canada, Australia, Mexico, Indonesia and Turkey, in addition to joint ventures in other countries.
In 2014, Incitec Pivot compared the hypothetical cost of building an ammonia plant in Australia and in the US. It was estimated that to build the plant, it would cost:
• $1 billion in the US, of which 35 per cent of the project cost ($350 million) was attributable to labour costs; and
• $1.4 billion in Australia, of which 60 per cent of the project cost ($840 million) was attributable to labour costs.
Labour costs were estimated to be 140 per cent more in Australia than in the US. The $490 million difference in labour costs accounted for the entire production cost differential between the two countries. If the labour costs had been identical in both countries, Australia would have been the more competitive option.
Source: Energy Quest 2014, Oil and Gas industry cost trends, report prepared for the Australian Petroleum Production and Exploration Association
5.1.3 Approval timeframes
The approvals timeframes for major resources industry projects varies widely by country. A key variable in the approvals timeline is the type of project subject to approval. For example, the regulatory requirements for a new LNG terminal are different to those for a proposed new coal mine. The different composition of natural resources in OECD countries makes widespread comparison difficult.
Of the 10 resource-intensive OECD countries included in the analysis, project approvals data were available for five members, including Australia. The average approval time and range in approval time is illustrated in Chart 5-4. Historically, project approvals in Canada would take as long as 103 months. This approvals timeframe has improved since 2007 when the Major Projects Management Office (MPMO) came into operation. At the other end of the spectrum is New Zealand, where a legislative time limit on project approvals timelines means some projects are approved within five months.
Of the five members benchmarked (illustrated in Chart 5-4), Australia performs better than any country that does not have a ‘one-stop-shop’, with the average time for project approval taking 27 months. However, the timeframe for approvals can range from five to 42 months.
A ‘one-stop-shop’ serves as a single agency responsible for determining all approvals for a major project. This helps streamline the process for approvals from various levels to governments, and can eliminate duplication. The Australian Government has committed to delivering a one-stop-shop for environmental approvals, and a bill to do so is before Parliament (as of February 2015).68 Based on the experiences internationally, a one-stop-shop will likely improve project approval timelines in Australia.
Australia performs slightly worse than Canada, where natural resource rents account for 4 per cent of GDP compared to 8 per cent in Australia. In Canada, the average time for project approval under the MPMO is 22 months (27 months in Australia).
68 Department of Environment 2015, One-Stop Shop for environmental approvals, accessed 20 February 2015, http://www.environment.gov.au/epbc/one-stop-shop
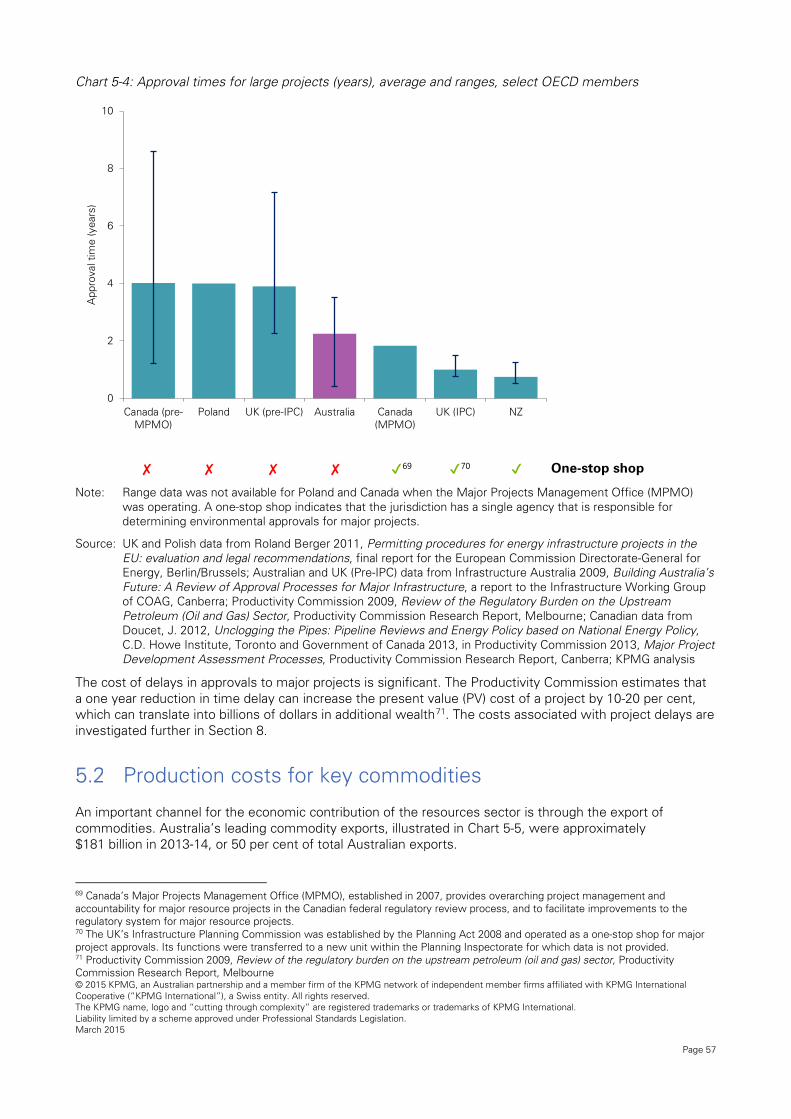
© 2015 KPMG, an Australian partnership and a member firm of the KPMG network of independent member firms affiliated with KPMG International Cooperative (“KPMG International”), a Swiss entity. All rights reserved. The KPMG name, logo and “cutting through complexity” are registered trademarks or trademarks of KPMG International. Liability limited by a scheme approved under Professional Standards Legislation. March 2015
Page 57
Chart 5-4: Approval times for large projects (years), average and ranges, select OECD members
✘ ✘ ✘ ✘ ✔69 ✔70 ✔ One-stop shop
Note: Range data was not available for Poland and Canada when the Major Projects Management Office (MPMO) was operating. A one-stop shop indicates that the jurisdiction has a single agency that is responsible for determining environmental approvals for major projects.
Source: UK and Polish data from Roland Berger 2011, Permitting procedures for energy infrastructure projects in the EU: evaluation and legal recommendations, final report for the European Commission Directorate-General for Energy, Berlin/Brussels; Australian and UK (Pre-IPC) data from Infrastructure Australia 2009, Building Australia’s Future: A Review of Approval Processes for Major Infrastructure, a report to the Infrastructure Working Group of COAG, Canberra; Productivity Commission 2009, Review of the Regulatory Burden on the Upstream Petroleum (Oil and Gas) Sector, Productivity Commission Research Report, Melbourne; Canadian data from Doucet, J. 2012, Unclogging the Pipes: Pipeline Reviews and Energy Policy based on National Energy Policy, C.D. Howe Institute, Toronto and Government of Canada 2013, in Productivity Commission 2013, Major Project Development Assessment Processes, Productivity Commission Research Report, Canberra; KPMG analysis
The cost of delays in approvals to major projects is significant. The Productivity Commission estimates that a one year reduction in time delay can increase the present value (PV) cost of a project by 10-20 per cent, which can translate into billions of dollars in additional wealth71. The costs associated with project delays are investigated further in Section 8.
Production costs for key commodities
An important channel for the economic contribution of the resources sector is through the export of commodities. Australia’s leading commodity exports, illustrated in Chart 5-5, were approximately $181 billion in 2013-14, or 50 per cent of total Australian exports.
69 Canada’s Major Projects Management Office (MPMO), established in 2007, provides overarching project management and accountability for major resource projects in the Canadian federal regulatory review process, and to facilitate improvements to the regulatory system for major resource projects. 70 The UK’s Infrastructure Planning Commission was established by the Planning Act 2008 and operated as a one-stop shop for major project approvals. Its functions were transferred to a new unit within the Planning Inspectorate for which data is not provided. 71 Productivity Commission 2009, Review of the regulatory burden on the upstream petroleum (oil and gas) sector, Productivity Commission Research Report, Melbourne
0
2
4
6
8
10
Canada (pre-MPMO)
Poland UK (pre-IPC) Australia Canada(MPMO)
UK (IPC) NZ
App
rova
l tim
e (y
ears
)

© 2015 KPMG, an Australian partnership and a member firm of the KPMG network of independent member firms affiliated with KPMG International Cooperative (“KPMG International”), a Swiss entity. All rights reserved. The KPMG name, logo and “cutting through complexity” are registered trademarks or trademarks of KPMG International. Liability limited by a scheme approved under Professional Standards Legislation. March 2015
Page 58
Chart 5-5: Australia’s leading resources and energy commodity exports, 2013-14
Source: Bureau of Resources and Energy Economics 2014, Resources and Energy Quarterly, September Quarter,
Canberra
Consistent with their significance to the value of commodity exports from Australia, the following sections consider Australia’s competitiveness relative to other resource-intensive OECD countries in the cost of production of:
• iron ore;
• metallurgical coal;
• thermal coal;
• Liquefied Natural Gas (LNG);
• gold; and
• copper.
Together, these commodities account for 77 per cent of Australia’s resources sector exports.
5.2.1 Iron ore
Iron ore is Australia’s most important commodity, in value of export terms. There was $74.8 billion in iron ore and pellet production in 2013-14, more than the production value of the next four highest commodities combined72. Australia is the largest exporter of iron ore in the world and the second largest producer of iron ore after China. Chart 5-6 shows a cost curve for selected iron ore producing OECD countries.
72 Bureau of Resources and Energy Economics 2014, Resources and Energy Quarterly, September Quarter 2014, Canberra
74.8
23.316.7 16.4
13 11.1 8.75.7 3.2 2.4 3.5 2
0
20
40
60
80V
alue
of
expo
rts
($ b
illio
ns)
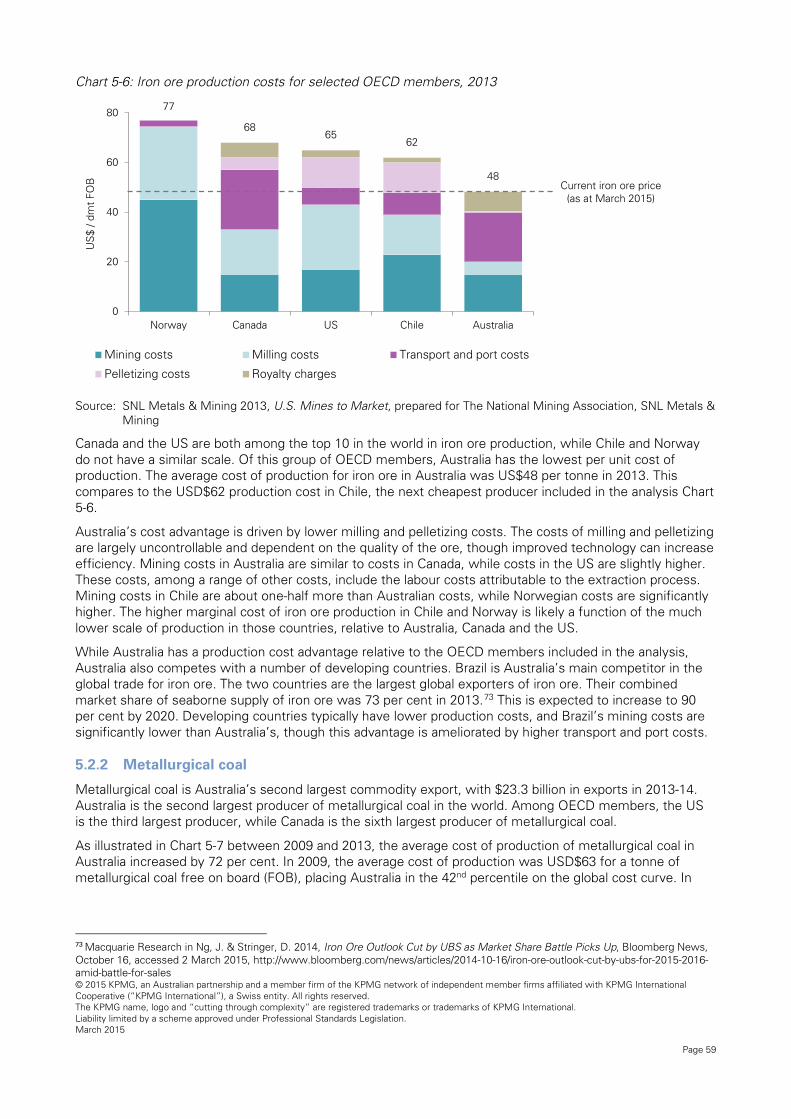
© 2015 KPMG, an Australian partnership and a member firm of the KPMG network of independent member firms affiliated with KPMG International Cooperative (“KPMG International”), a Swiss entity. All rights reserved. The KPMG name, logo and “cutting through complexity” are registered trademarks or trademarks of KPMG International. Liability limited by a scheme approved under Professional Standards Legislation. March 2015
Page 59
Chart 5-6: Iron ore production costs for selected OECD members, 2013
Source: SNL Metals & Mining 2013, U.S. Mines to Market, prepared for The National Mining Association, SNL Metals &
Mining
Canada and the US are both among the top 10 in the world in iron ore production, while Chile and Norway do not have a similar scale. Of this group of OECD members, Australia has the lowest per unit cost of production. The average cost of production for iron ore in Australia was US$48 per tonne in 2013. This compares to the USD$62 production cost in Chile, the next cheapest producer included in the analysis Chart 5-6.
Australia’s cost advantage is driven by lower milling and pelletizing costs. The costs of milling and pelletizing are largely uncontrollable and dependent on the quality of the ore, though improved technology can increase efficiency. Mining costs in Australia are similar to costs in Canada, while costs in the US are slightly higher. These costs, among a range of other costs, include the labour costs attributable to the extraction process. Mining costs in Chile are about one-half more than Australian costs, while Norwegian costs are significantly higher. The higher marginal cost of iron ore production in Chile and Norway is likely a function of the much lower scale of production in those countries, relative to Australia, Canada and the US.
While Australia has a production cost advantage relative to the OECD members included in the analysis, Australia also competes with a number of developing countries. Brazil is Australia’s main competitor in the global trade for iron ore. The two countries are the largest global exporters of iron ore. Their combined market share of seaborne supply of iron ore was 73 per cent in 2013.73 This is expected to increase to 90 per cent by 2020. Developing countries typically have lower production costs, and Brazil’s mining costs are significantly lower than Australia’s, though this advantage is ameliorated by higher transport and port costs.
5.2.2 Metallurgical coal
Metallurgical coal is Australia’s second largest commodity export, with $23.3 billion in exports in 2013-14. Australia is the second largest producer of metallurgical coal in the world. Among OECD members, the US is the third largest producer, while Canada is the sixth largest producer of metallurgical coal.
As illustrated in Chart 5-7 between 2009 and 2013, the average cost of production of metallurgical coal in Australia increased by 72 per cent. In 2009, the average cost of production was USD$63 for a tonne of metallurgical coal free on board (FOB), placing Australia in the 42nd percentile on the global cost curve. In
73 Macquarie Research in Ng, J. & Stringer, D. 2014, Iron Ore Outlook Cut by UBS as Market Share Battle Picks Up, Bloomberg News, October 16, accessed 2 March 2015, http://www.bloomberg.com/news/articles/2014-10-16/iron-ore-outlook-cut-by-ubs-for-2015-2016-amid-battle-for-sales
77
6865
62
48
0
20
40
60
80
Norway Canada US Chile Australia
Mining costs Milling costs Transport and port costs
Pelletizing costs Royalty charges
US
$ / d
mt F
OB Current iron ore price
(as at March 2015)
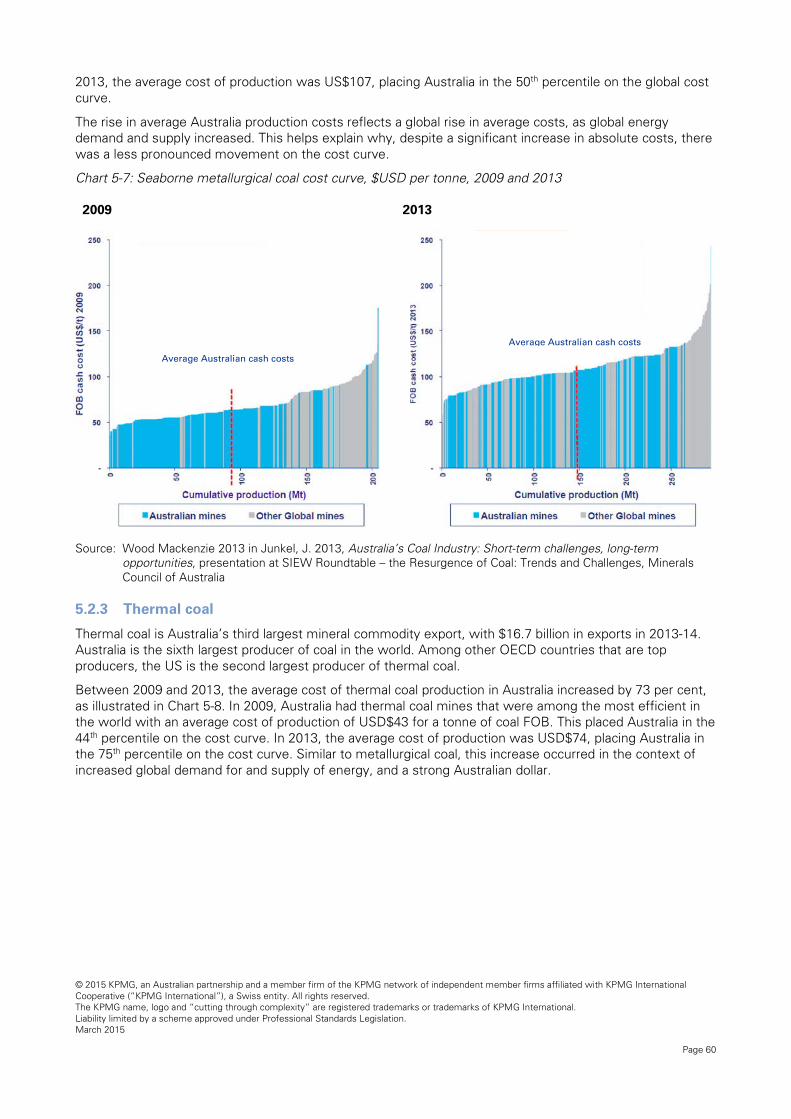
© 2015 KPMG, an Australian partnership and a member firm of the KPMG network of independent member firms affiliated with KPMG International Cooperative (“KPMG International”), a Swiss entity. All rights reserved. The KPMG name, logo and “cutting through complexity” are registered trademarks or trademarks of KPMG International. Liability limited by a scheme approved under Professional Standards Legislation. March 2015
Page 60
2013, the average cost of production was US$107, placing Australia in the 50th percentile on the global cost curve.
The rise in average Australia production costs reflects a global rise in average costs, as global energy demand and supply increased. This helps explain why, despite a significant increase in absolute costs, there was a less pronounced movement on the cost curve.
Chart 5-7: Seaborne metallurgical coal cost curve, $USD per tonne, 2009 and 2013
2009 2013
Source: Wood Mackenzie 2013 in Kunkel, J. 2013, Australia’s Coal Industry: Short-term challenges, long-term
opportunities, presentation at SIEW Roundtable – The Resurgence of
Source: Wood Mackenzie 2013 in Junkel, J. 2013, Australia’s Coal Industry: Short-term challenges, long-term opportunities, presentation at SIEW Roundtable – the Resurgence of Coal: Trends and Challenges, Minerals Council of Australia
5.2.3 Thermal coal
Thermal coal is Australia’s third largest mineral commodity export, with $16.7 billion in exports in 2013-14. Australia is the sixth largest producer of coal in the world. Among other OECD countries that are top producers, the US is the second largest producer of thermal coal.
Between 2009 and 2013, the average cost of thermal coal production in Australia increased by 73 per cent, as illustrated in Chart 5-8. In 2009, Australia had thermal coal mines that were among the most efficient in the world with an average cost of production of USD$43 for a tonne of coal FOB. This placed Australia in the 44th percentile on the cost curve. In 2013, the average cost of production was USD$74, placing Australia in the 75th percentile on the cost curve. Similar to metallurgical coal, this increase occurred in the context of increased global demand for and supply of energy, and a strong Australian dollar.
Average Australian cash costs Average Australian cash costs

© 2015 KPMG, an Australian partnership and a member firm of the KPMG network of independent member firms affiliated with KPMG International Cooperative (“KPMG International”), a Swiss entity. All rights reserved. The KPMG name, logo and “cutting through complexity” are registered trademarks or trademarks of KPMG International. Liability limited by a scheme approved under Professional Standards Legislation. March 2015
Page 61
Chart 5-8: Seaborne thermal coal cost curve, $US per tonne, 2009 and 2013
2009 2013
Source: Wood Mackenzie 2013 in Kunkel, J. 2013, Australia’s Coal Industry: Short-term challenges, long-term opportunities, presentation at SIEW Roundtable – The Resurgence of Coal: Trends and Challenges, Minerals Council of Australia
5.2.4 Liquefied Natural Gas
LNG is Australia’s fourth largest commodity export, with $16.4 billion in exports in 2013-14. Australia is one of the world’s largest LNG producers, with Canada and the United States being among the other OECD countries that are significant producers.
As illustrated in Chart 5-9, Australia’s LNG producers are among the highest cost producers in the world. This has been a recent trend, with development costs on more recent projects increasing at a higher rate than the global average. The drivers of Australia’s higher LNG production costs are outlined further in Case Study 5-2 and include:
• project specification;
• industry collaboration;
• service market maturity;
• labour productivity;
• regulatory approval times; and
• taxation costs.
Average Australian cash costs
Average Australian cash costs
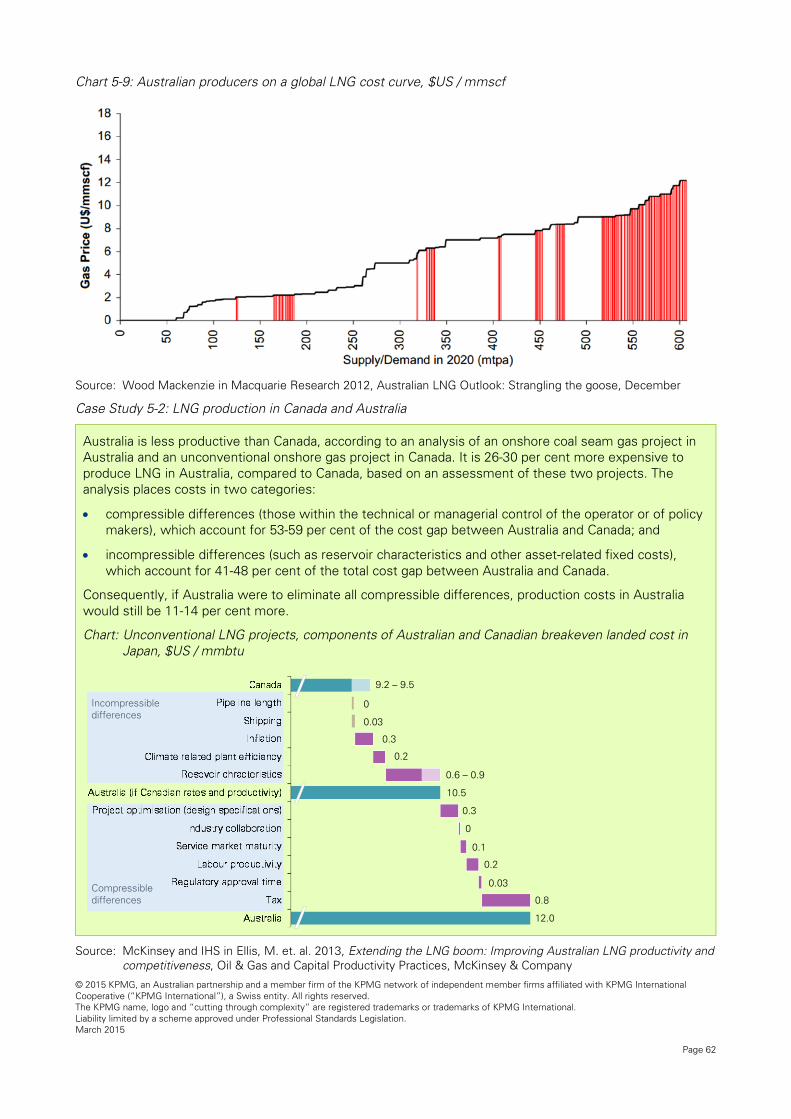
© 2015 KPMG, an Australian partnership and a member firm of the KPMG network of independent member firms affiliated with KPMG International Cooperative (“KPMG International”), a Swiss entity. All rights reserved. The KPMG name, logo and “cutting through complexity” are registered trademarks or trademarks of KPMG International. Liability limited by a scheme approved under Professional Standards Legislation. March 2015
Page 62
Chart 5-9: Australian producers on a global LNG cost curve, $US / mmscf
Source: Wood Mackenzie in Macquarie Research 2012, Australian LNG Outlook: Strangling the goose, December
Case Study 5-2: LNG production in Canada and Australia
Australia is less productive than Canada, according to an analysis of an onshore coal seam gas project in Australia and an unconventional onshore gas project in Canada. It is 26-30 per cent more expensive to produce LNG in Australia, compared to Canada, based on an assessment of these two projects. The analysis places costs in two categories:
• compressible differences (those within the technical or managerial control of the operator or of policy makers), which account for 53-59 per cent of the cost gap between Australia and Canada; and
• incompressible differences (such as reservoir characteristics and other asset-related fixed costs), which account for 41-48 per cent of the total cost gap between Australia and Canada.
Consequently, if Australia were to eliminate all compressible differences, production costs in Australia would still be 11-14 per cent more.
Chart: Unconventional LNG projects, components of Australian and Canadian breakeven landed cost in Japan, $US / mmbtu
Source: McKinsey and IHS in Ellis, M. et. al. 2013, Extending the LNG boom: Improving Australian LNG productivity and
competitiveness, Oil & Gas and Capital Productivity Practices, McKinsey & Company
9.2 – 9.5
0
0.03
0.3
0.2
0.6 – 0.9
10.5
0.3
0
0.1
0.2
0.03
0.8
12.0
Incompressible differences
Compressible differences
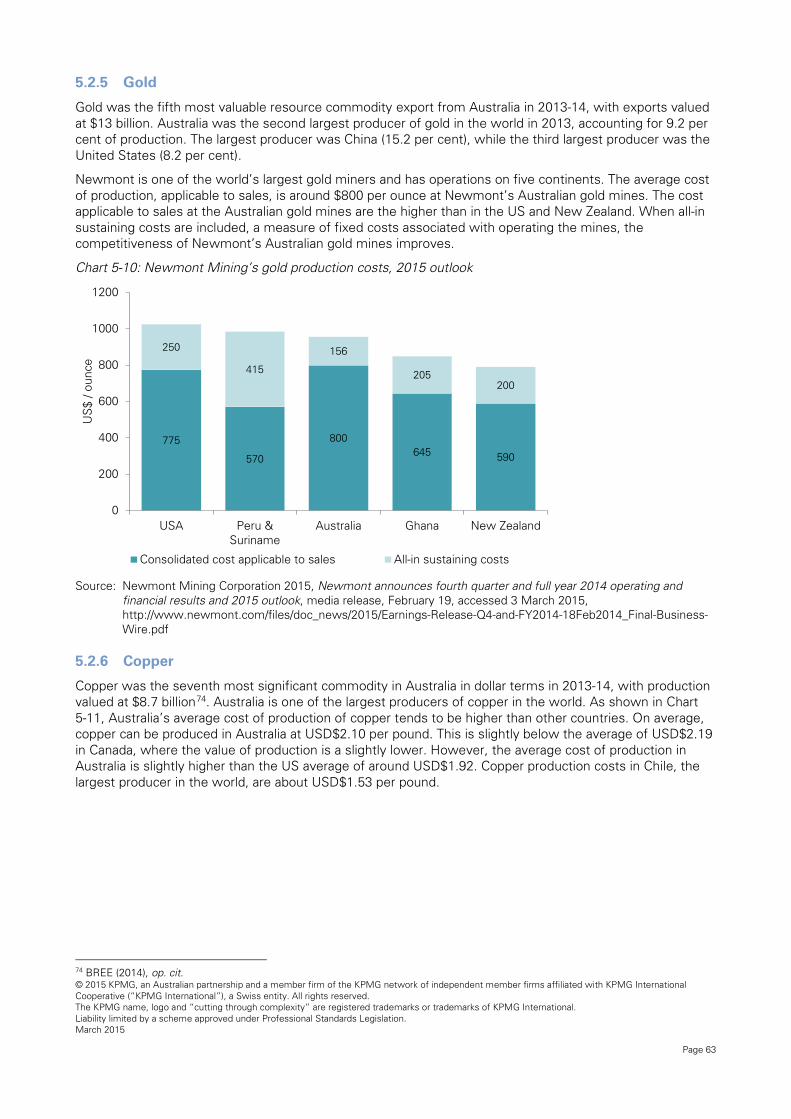
© 2015 KPMG, an Australian partnership and a member firm of the KPMG network of independent member firms affiliated with KPMG International Cooperative (“KPMG International”), a Swiss entity. All rights reserved. The KPMG name, logo and “cutting through complexity” are registered trademarks or trademarks of KPMG International. Liability limited by a scheme approved under Professional Standards Legislation. March 2015
Page 63
5.2.5 Gold
Gold was the fifth most valuable resource commodity export from Australia in 2013-14, with exports valued at $13 billion. Australia was the second largest producer of gold in the world in 2013, accounting for 9.2 per cent of production. The largest producer was China (15.2 per cent), while the third largest producer was the United States (8.2 per cent).
Newmont is one of the world’s largest gold miners and has operations on five continents. The average cost of production, applicable to sales, is around $800 per ounce at Newmont’s Australian gold mines. The cost applicable to sales at the Australian gold mines are the higher than in the US and New Zealand. When all-in sustaining costs are included, a measure of fixed costs associated with operating the mines, the competitiveness of Newmont’s Australian gold mines improves.
Chart 5-10: Newmont Mining’s gold production costs, 2015 outlook
Source: Newmont Mining Corporation 2015, Newmont announces fourth quarter and full year 2014 operating and
financial results and 2015 outlook, media release, February 19, accessed 3 March 2015, http://www.newmont.com/files/doc_news/2015/Earnings-Release-Q4-and-FY2014-18Feb2014_Final-Business-Wire.pdf
5.2.6 Copper
Copper was the seventh most significant commodity in Australia in dollar terms in 2013-14, with production valued at $8.7 billion74. Australia is one of the largest producers of copper in the world. As shown in Chart 5-11, Australia’s average cost of production of copper tends to be higher than other countries. On average, copper can be produced in Australia at USD$2.10 per pound. This is slightly below the average of USD$2.19 in Canada, where the value of production is a slightly lower. However, the average cost of production in Australia is slightly higher than the US average of around USD$1.92. Copper production costs in Chile, the largest producer in the world, are about USD$1.53 per pound.
74 BREE (2014), op. cit.
775
570
800645 590
250
415
156
205200
0
200
400
600
800
1000
1200
USA Peru &Suriname
Australia Ghana New Zealand
US
$ / o
unce
Consolidated cost applicable to sales All-in sustaining costs

© 2015 KPMG, an Australian partnership and a member firm of the KPMG network of independent member firms affiliated with KPMG International Cooperative (“KPMG International”), a Swiss entity. All rights reserved. The KPMG name, logo and “cutting through complexity” are registered trademarks or trademarks of KPMG International. Liability limited by a scheme approved under Professional Standards Legislation. March 2015
Page 64
Chart 5-11: Copper production costs, selected OECD members, 2013
Source: MineCost 2014 in SNL Metals & Mining 2013, U.S. Mines to Market, prepared for The National Mining
Association
The differences in the cost of copper production between nations is driven by:
• Macroeconomic factors that affect the comparative costs of production of any good and service, such as:
- relative exchange rates;
- the cost of inputs, such as energy, labour and materials, in the mining production process; and
- productivity levels in each country, including how technology is used.
• Specific differentiating factors relating to the mining of copper, such as:
- differences in grade of ore (higher grade ore would lead to lower production costs);
- stripping ratios, or the amount of waste relative to ore (lower stripping ratios lead to lower production costs); and
- economies of scale (larger deposits of ore in a single geography can lead to economies of scale that reduce average production costs).
Production costs for key inputs
This section focuses on the production cost components commonly incurred in the resources sector in Australia and comparable countries. The cost structures of operators in the resources sector vary significantly and depend on the size of operations, the type of commodity and the type of service provided. The average cost structure for the Australian resources sector is a share of total revenue as illustrated in Chart 5-12.
Wages account for 12 per cent of revenue in the resources industry. However, the breakdown provided masks some of the flow through costs of labour. Contract mining services, whereby third parties undertake mining activities on behalf of major companies, are categorised as an ‘Other’ cost. However, these third party services include the provision of skilled labour, which is not reflected in the ‘Wages’ cost category.
Purchases of goods and materials accounts for 21 per cent of resources industry revenue. Purchases refer to consumables that are used by the industry, including fuel used in operations and explosives that are used to break up soil.
$2.19 $2.10
$1.92 $1.79
$1.53 $1.44
$-
$0.50
$1.00
$1.50
$2.00
$2.50
Canada Australia US Poland Chile Mexico
Cas
h co
st (U
S$
/ lb
copp
er)
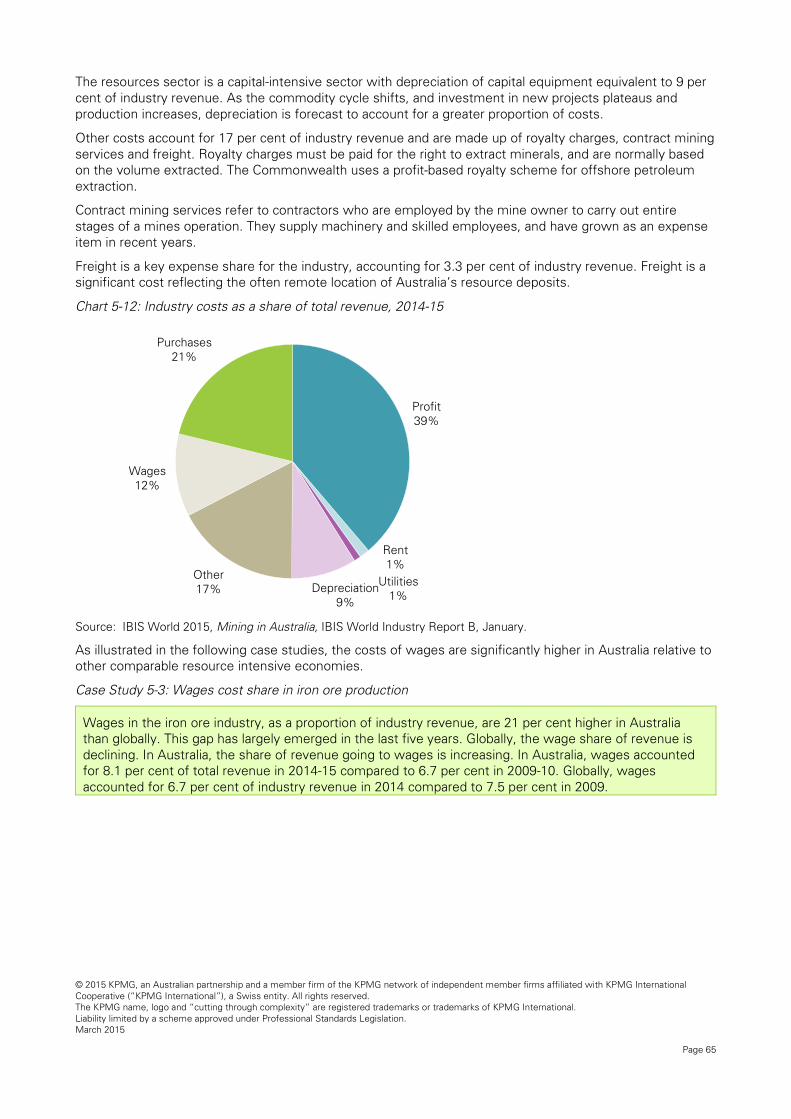
© 2015 KPMG, an Australian partnership and a member firm of the KPMG network of independent member firms affiliated with KPMG International Cooperative (“KPMG International”), a Swiss entity. All rights reserved. The KPMG name, logo and “cutting through complexity” are registered trademarks or trademarks of KPMG International. Liability limited by a scheme approved under Professional Standards Legislation. March 2015
Page 65
The resources sector is a capital-intensive sector with depreciation of capital equipment equivalent to 9 per cent of industry revenue. As the commodity cycle shifts, and investment in new projects plateaus and production increases, depreciation is forecast to account for a greater proportion of costs.
Other costs account for 17 per cent of industry revenue and are made up of royalty charges, contract mining services and freight. Royalty charges must be paid for the right to extract minerals, and are normally based on the volume extracted. The Commonwealth uses a profit-based royalty scheme for offshore petroleum extraction.
Contract mining services refer to contractors who are employed by the mine owner to carry out entire stages of a mines operation. They supply machinery and skilled employees, and have grown as an expense item in recent years.
Freight is a key expense share for the industry, accounting for 3.3 per cent of industry revenue. Freight is a significant cost reflecting the often remote location of Australia’s resource deposits.
Chart 5-12: Industry costs as a share of total revenue, 2014-15
Source: IBIS World 2015, Mining in Australia, IBIS World Industry Report B, January.
As illustrated in the following case studies, the costs of wages are significantly higher in Australia relative to other comparable resource intensive economies.
Case Study 5-3: Wages cost share in iron ore production
Wages in the iron ore industry, as a proportion of industry revenue, are 21 per cent higher in Australia than globally. This gap has largely emerged in the last five years. Globally, the wage share of revenue is declining. In Australia, the share of revenue going to wages is increasing. In Australia, wages accounted for 8.1 per cent of total revenue in 2014-15 compared to 6.7 per cent in 2009-10. Globally, wages accounted for 6.7 per cent of industry revenue in 2014 compared to 7.5 per cent in 2009.
Profit39%
Rent1%
Utilities1%
Depreciation9%
Other17%
Wages12%
Purchases21%

© 2015 KPMG, an Australian partnership and a member firm of the KPMG network of independent member firms affiliated with KPMG International Cooperative (“KPMG International”), a Swiss entity. All rights reserved. The KPMG name, logo and “cutting through complexity” are registered trademarks or trademarks of KPMG International. Liability limited by a scheme approved under Professional Standards Legislation. March 2015
Page 66
Chart: Industry costs, as a percentage of revenue, Australian and Global Iron Ore Mining
Source: IBIS World (2014), Iron Ore Mining, Australian Industry Reports; IBIS World (2014), Global Iron Ore Mining,
Global Industry Report
Case Study 5-4: Cost of offshore service vessel in the oil and gas industry
Offshore oil and gas rigs require specialised services from supply vessels to ensure they continue to operate efficiently and safely. One of the world’s largest providers of these services provided KPMG access to their labour cost data, which shows the cost of labour needed to staff the same type of vessel in four jurisdictions. To protect their commercial interests, they have been de-identified and the raw figures have been converted to a cost of labour index.
An analysis of their operations reveals that it is nearly 150 per cent more expensive to staff the same vessel in Australia compared to a European OECD member. It is more than triple the cost to staff an Australian vessel compared to staffing a vessel with a crew from a South-East Asian nation.
Chart: Cost of labour index for staffing offshore service vessels in the oil and gas industry, 2014
Note: The average Australian exchange rate with the local currency for 2014 has been used in developing the
index. The labour costs consist of the total salary package and other on-costs, such as payroll taxes.
Source: KPMG analysis of industry data
41 39.5
25.3
9.6
10.4
15.8
8.1
6.6
15.228.5
0%
20%
40%
60%
80%
100%
Australia, 2014-15 Global, 2014
Profit Depreciation Other Wages Purchases
308
187
124100
0
50
100
150
200
250
300
350
Australia Scandanavian OECDmember
European OECDmember
South-East Asiannation
Cos
t of s
ervi
ice
inde
x
© 2015 KPMG, an Australian partnership and a member firm of the KPMG network of independent member firms affiliated with KPMG International Cooperative (“KPMG International”), a Swiss entity. All rights reserved. The KPMG name, logo and “cutting through complexity” are registered trademarks or trademarks of KPMG International. Liability limited by a scheme approved under Professional Standards Legislation. March 2015
Page 67
Legal and compliance costs
In Australia, the resources sector is subject to the regulatory and compliance activities of three levels of government. For legal and practical purposes, it can be considered that there are four distinct stages of regulation in the resources industry:
• initial exploration;
• detailed exploration, land access and construction;
• operation and extraction; and
• general business regulations that applies at all times, for businesses operating throughout the economy.
Approval for the right to explore and extract resources generally resides with the State and Territory governments. These jurisdictions are responsible for allocating mining and exploration leases. They are also responsible for setting and collecting royalties on the minerals and petroleum extracted. For offshore production (outside the first three nautical miles) of oil and gas, the Commonwealth Government allocates leases and collects taxes.
State and Territory governments are responsible for regulating workplace health and safety, and environmental issues, including remediation. Each jurisdiction has a separate legal regime for governing mining activity, which can add complexity to businesses working across State and Territory boundaries. However, the requirements largely tend to be similar75.
The resources sector is also open to Native Title land claims. The legislation does not give automatic veto over new developments, and governments can overturn decisions made by tribunals.
In addition to resources specific legal and compliance requirements, resources sector businesses are also subject to the regulation requirements facing other Australian businesses. These regulations include those relating to workplace relations.
5.4.1 Cost of regulatory delays
Direct legal and compliance expenditure for businesses, required to comply with regulation and legislation, can represent a significant cost. These costs are incurred through taking measures to comply with the various types of legislation noted above. However, the more significant costs can be indirect, in the form of delays caused by regulatory and legislative requirements.
A recent analysis estimated the cost of regulatory delays on projects in the upstream petroleum industry. The analysis calculated that a one-year regulatory delay for exploration approval caused up to 9 per cent reduction in the NPV of the project76. A delay in development approval would result in a greater loss. A one-year delay in development approval can cause up to an 18 per cent reduction in a project’s NPV.
The cost of delays on the economy depend on the length of the delay, the point of the development cycle at which it occurs and the value of the project. The impact of delays on resources sector project investment is investigated further in Section 8.
5.4.2 Approach to regulation
Benchmarking of OECD countries’ approach to regulation highlights that Australia tends to perform in the bottom half of the cohort of economies where the resources industry contributes a significant proportion to overall GDP.
The Fraser Institute Survey of Mining companies investigates the mining industries’ perception of conducting business in major resource producing countries around the world. The following charts highlight
75 IBIS World 2015, Mining in Australia, IBIS World Industry Report B, January. 76 Productivity Commission 2009, Review of Regulatory Burden on the Upstream Petroleum (Oil and Gas) Sector, Productivity Commission Research Report.

© 2015 KPMG, an Australian partnership and a member firm of the KPMG network of independent member firms affiliated with KPMG International Cooperative (“KPMG International”), a Swiss entity. All rights reserved. The KPMG name, logo and “cutting through complexity” are registered trademarks or trademarks of KPMG International. Liability limited by a scheme approved under Professional Standards Legislation. March 2015
Page 68
the responses of mining companies to six separate issues on regulation, and whether the jurisdiction’s approach to addressing the issue encourages investment, namely:
• certainty concerning the administration, interpretation and enforcement of existing regulations;
• certainty concerning environmental regulation for the mining industry;
• duplication and regulatory inconsistency for the mining industry;
• taxation regime for mining industry;
• legal system for mining industry; and
• labour regulations and work disruptions for the mining industry.
Of these six issues, Australia is in the top half of the cohort only on the issue of the jurisdiction’s legal system, reflecting the stable political system and history of rule of law in Australia. For the other five issues, only 1 per cent of respondents indicated that Australia’s labour regulations and level of work disruptions encourages investment in the industry.
Despite this performance, there tends to be a wide variation in the performance of the Australian States. Likewise, there is significant variation in the performance of the Canadian provinces and individual states of the US.
Chart 5-13: Certainty concerning the administration, interpretation and enforcement of existing regulations for the mining industry, proportion indicating that jurisdiction's approach encourages investment, 2013
Note: For the US, Australia and Canada, the median figure for the respective States and Provinces is provided. The
ranges for these sub-national jurisdictions is also provided.
Source: Wilson, A. et al. 2014, Survey of Mining Companies 2013, Fraser Institute
51%47%
31% 30%
24% 23% 23%
17%
7%
0%
10%
20%
30%
40%
50%
60%
70%
Sweden Chile Norway Canada NewZealand
Mexico Australia USA PolandPro
port
ion
of r
espn
dent
s in
dica
ting
juris
dict
ion
enco
urag
es in
vest
men
t

© 2015 KPMG, an Australian partnership and a member firm of the KPMG network of independent member firms affiliated with KPMG International Cooperative (“KPMG International”), a Swiss entity. All rights reserved. The KPMG name, logo and “cutting through complexity” are registered trademarks or trademarks of KPMG International. Liability limited by a scheme approved under Professional Standards Legislation. March 2015
Page 69
Chart 5-14: Certainty concerning environmental regulations for mining industry, proportion indicating that jurisdiction's approach encourages investment, 2013
Note: For Canada, Australia and the US, the median figure for the respective Provinces and States is provided. The
ranges for these sub-national jurisdictions is also provided.
Source: Wilson, A. et al. 2014, Survey of Mining Companies 2013, Fraser Institute
23% 22%
15% 14% 13% 13%
10%7%
4%
0%
5%
10%
15%
20%
25%
30%
35%
Sweden Mexico Canada Chile Australia NewZealand
Norway Poland USA
Pro
port
ion
of r
espn
dent
s in
dica
ting
juris
dict
ion
enco
urag
es in
vest
men
t
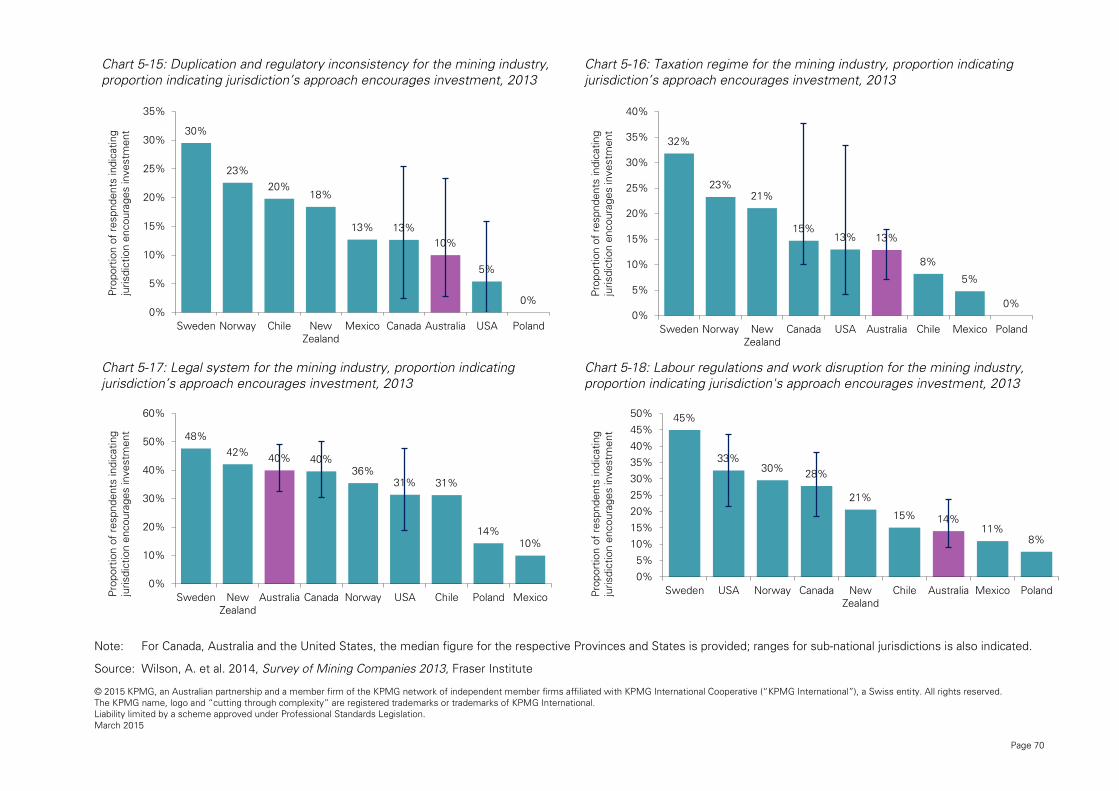
© 2015 KPMG, an Australian partnership and a member firm of the KPMG network of independent member firms affiliated with KPMG International Cooperative (“KPMG International”), a Swiss entity. All rights reserved. The KPMG name, logo and “cutting through complexity” are registered trademarks or trademarks of KPMG International. Liability limited by a scheme approved under Professional Standards Legislation. March 2015
Page 70
Chart 5-15: Duplication and regulatory inconsistency for the mining industry, proportion indicating jurisdiction’s approach encourages investment, 2013
Chart 5-16: Taxation regime for the mining industry, proportion indicating jurisdiction’s approach encourages investment, 2013
Chart 5-17: Legal system for the mining industry, proportion indicating jurisdiction’s approach encourages investment, 2013
Chart 5-18: Labour regulations and work disruption for the mining industry, proportion indicating jurisdiction's approach encourages investment, 2013
Note: For Canada, Australia and the United States, the median figure for the respective Provinces and States is provided; ranges for sub-national jurisdictions is also indicated.
Source: Wilson, A. et al. 2014, Survey of Mining Companies 2013, Fraser Institute
30%
23%20%
18%
13% 13%10%
5%
0%0%
5%
10%
15%
20%
25%
30%
35%
Sweden Norway Chile NewZealand
Mexico Canada Australia USA Poland
Pro
port
ion
of r
espn
dent
s in
dica
ting
juris
dict
ion
enco
urag
es in
vest
men
t
32%
23%21%
15%13% 13%
8%
5%
0%0%
5%
10%
15%
20%
25%
30%
35%
40%
Sweden Norway NewZealand
Canada USA Australia Chile Mexico Poland
Pro
port
ion
of r
espn
dent
s in
dica
ting
juris
dict
ion
enco
urag
es in
vest
men
t
48%42% 40% 40%
36%31% 31%
14%10%
0%
10%
20%
30%
40%
50%
60%
Sweden NewZealand
Australia Canada Norway USA Chile Poland MexicoPro
port
ion
of r
espn
dent
s in
dica
ting
juris
dict
ion
enco
urag
es in
vest
men
t
45%
33%30% 28%
21%
15% 14%11%
8%
0%
5%
10%
15%
20%
25%
30%
35%
40%
45%
50%
Sweden USA Norway Canada NewZealand
Chile Australia Mexico PolandPro
port
ion
of r
espn
dent
s in
dica
ting
juris
dict
ion
enco
urag
es in
vest
men
t

© 2015 KPMG, an Australian partnership and a member firm of the KPMG network of independent member firms affiliated with KPMG International Cooperative (“KPMG International”), a Swiss entity. All rights reserved. The KPMG name, logo and “cutting through complexity” are registered trademarks or trademarks of KPMG International. Liability limited by a scheme approved under Professional Standards Legislation. March 2015
Page 71
Case Study 5-5: Delays costs from completing an Environmental Impact Assessment
The Santos GLNG Project involves the development of coal seam gas resources in the central and southern regions of Queensland. The project is a joint venture of Santos, PETRONAS, Total and KOGAS. The GLNG project involves around USD$18.5 billion in capital expenditure and was expected to create 1,700 jobs during the construction phase and 200 jobs during the operational phase.
Environmental Impact Assessments or Statements (EIAs) are required to be completed for major resource industry developments. The required scope of EIAs have expanded in recent years driven by regulators requiring additional information. The cost of developing EIAs for major mining projects can range from $3 to $15 million for new development and $1.5 to $12 million for amendments to existing approvals.
There were significant costs involved in developing the EIA for the SANTOS GLNG project. The final EIA for the Santos GLNG project was 13,500 pages of general and technical information. However, the more pertinent costs relate to the delay to the project that resulted from the need for such a significant EIA.
The Santos GLNG project, for instance, took more than two years to produce. The document took four days to print and weighed 65 kilograms. Once it was written and delivered, the reviewing agency took one-and-a-half years to assess the EIA.
To the extent that this three-and-one-half year process for completing the EIA delayed the project, it would have resulted in significant impairment of the viability of the project. Based on the analysis of delays costs in the upstream petroleum sector by the Productivity Commission, this was potentially worth billions of dollars.
Source: Santos Ltd 2012, GLNG brings forward USD$2.5 billion of upstream capital expenditure, Santos media release, June 28, accessed February 18 2015, http://www.santos.com/Archive/NewsDetail.aspx?id=1337 and DSDIP 2015, Santos GLNG Gas Field Development Project, Project overview, Queensland Department of State Development, Infrastructure and Planning, accessed February 18 2015, http://www.dsdip.qld.gov.au/assessments-and-approvals/santos-glng-gas-field-development-project.html
Key findings and implications
Australia has historically had a competitive resources sector. This is reflected in a long history exporting resources to various markets around the world, beginning with the United Kingdom, then the United States and Japan, and recently focusing more on Asian markets. However, in recent years, Australia’s competitiveness has diminished77. In the resources sector, Australia has moved up the production cost curve from 2009 to 2013, for key commodities such as metallurgical coal and thermal coal.
The decline in Australia’s competitiveness in resources production is driven by multiple factors, including:
• the higher Australian dollar from 2007 to 2014;
• increasing marginal cost of production, as demand and supply have increased significantly; and
• input supply shortages (particularly skilled labour).
A higher Australian dollar makes Australian exports less competitive. In 2007, on average, the Australian dollar bought around USD$0.75. By 2011, an Australia dollar was buying 37 per cent more, or around USD$1.03. Apart from a brief period following the collapse of Lehman Brothers, a financial institution in the United States, the Australian dollar has remained well above its 25-year average, over the last 7-8 years (currently USD$0.78).
Coinciding with Australia’s higher exchange rate, and partly driving it, has been higher commodity prices. This has been driven by strong demand for commodities, particularly from rapidly industrialising emerging markets. In response to the higher price, producers have invested in developing new capacity. The cost of
77 McKinsey & Company 2014, Compete to prosper: Improving Australia’s global competitiveness, prepared for the Business Council of Australia, July.
© 2015 KPMG, an Australian partnership and a member firm of the KPMG network of independent member firms affiliated with KPMG International Cooperative (“KPMG International”), a Swiss entity. All rights reserved. The KPMG name, logo and “cutting through complexity” are registered trademarks or trademarks of KPMG International. Liability limited by a scheme approved under Professional Standards Legislation. March 2015
Page 72
production at new mines is typically higher, which has contributed to the increase in Australia’s average cost of production. In addition, higher commodity prices have encouraged extraction of more marginal deposits.
The high level of demand for commodities and expansion of production in Australia has contributed to a shortage of skilled labour. It also increased demand for semi-skilled and unskilled labour in regional and remote regions. These two factors have contributed to rapid growth of wages in the resources sector. As seen in Chart 5-3, construction wages in the resources sector increased by over 9 per cent on an annual basis for more than a decade. If there were two workers in 2001, both earning $100, one in the construction industry in the resources sector and the other an average Australian worker, by 2012, the resources industry worker would have been earning around $265, while an average worker would have been on around $150. The rising wages in the resources industry contributed to the declining rate of productivity in the mining industry for most of the 2000s.
The competitiveness of Australia’s production costs, relative to the cohort of countries included in the like-for-like analysis, varies between commodities. For iron ore, Australia’s most significant commodity export, Australia has a production cost advantage relative to the OECD countries considered. However, Australia competes with emerging and non-OECD countries, such as Brazil, for global trade of iron ore and these countries typically have lower average production costs. Globally, Australia’s production costs for coal are mid-range, however, production in Australia has become less competitive in recent years. Australia’s LNG producers are among the highest cost producers in the world. This has been a recent trend, with development costs on more recent projects increasing at a higher rate than the global average.
The core of competitiveness is being able to produce outputs from the most efficient use of scarce inputs. Within this architecture, business can drive competitiveness through uses of technology and approaches to project management. In addition, government has a significant impact on the enabling environment through macroeconomic and microeconomic policy decisions. Of the three factors that were noted as driving the recent decline in competitiveness – the value of the Australian dollar, the marginal cost of production and the availability of production inputs - business can influence some of these factors, but only government, through its actions, can impact all three.
The importance of the resources industry remaining competitive is its continual contribution to the Australian economy, outlined in Section 4. The resources industry contributes significantly to the Australian economy. The benefits from the growth of the resources industry has flowed through to broader parts of the Australian economy. It has accounted for a significant proportion of the increase in Australian household incomes in recent years. To ensure this contribution is sustained, the resources industry must be able to compete in the global market for commodities and for investment capital.

© 2015 KPMG, an Australian partnership and a member firm of the KPMG network of independent member firms affiliated with KPMG International Cooperative (“KPMG International”), a Swiss entity. All rights reserved. The KPMG name, logo and “cutting through complexity” are registered trademarks or trademarks of KPMG International. Liability limited by a scheme approved under Professional Standards Legislation. March 2015
Page 73
6 Workplace relations and the Australian resources sector
Summary
There are a number of challenges associated with the current workplace relations framework that have potential implications for resource sector businesses. These challenges relate to agreement making, industrial action, union right of entry and employee protections.
The statutory agreement making and bargaining framework includes provisions for how employers and employees can bargain for conditions and make agreements. The current challenges for employers in the resources sector, associated with the agreement making and bargaining framework, relate to flexibility and choice of who employers can bargain with and how they approach and navigate this process. As there is an emphasis on enterprise level bargaining in the current framework, employers are often coerced into demands of the majority in order to avoid delays and associated costs in completing a project.
Greenfields agreements, pertaining to new and prospective projects, require employers to bargain and make agreements with unions. This has resulted in costs and delays to major resources projects in Australia in recent years.
The content of various agreements also presents some restrictions for employers and can lead to complex, contentious and costly bargaining which can result in poorly structured agreements.
Industrial action, in its various forms, is a key risk for employers. Resources sector employers have outlined that industrial disputation, or the perceived threat of industrial action, often arises from poorly structured agreements, agreements expiring or the involvement of unions in the bargaining process. This is a potential risk as large scale, protracted industrial action can potentially impact the timely completion of major resources projects and create uncertainty for potential investors.
Another component of the current workplace relations framework which has been identified as a challenge by resource sector employers are the regulations governing union right of entry to the workplace. The current provisions under the Fair Work Act (2009) are broader than under previous workplace relations systems. This widening of rights for unions regarding when and where they can exercise their right to entry has reportedly resulted in a significant increase in the frequency of workplace visits.
The current framework governing unfair dismissal and adverse action presents challenges to employers due to ambiguity regarding what is and is not permitted. There is a lack of understanding regarding definitions, what constitutes a valid reason for termination and what is an adverse action. This has resulted in an increase in the level of applications relating to unfair dismissals and adverse treatment being submitted to the FWC for review, which costs employers time and money to address. It can also negatively impact employer-employee relations and lead to unproductive workplaces.
The current workplace relations system, governed by the Fair Work Act (2009), has been operating since 2009, with amendments enacted in 2012 and 2013 and two amendment Bills tabled in Parliament in 2014. The current system is a set of regulations, institutions and instruments that regulate minimum wages, awards, and penalty rates, how employees and employers bargain with each other at the enterprise or individual levels and unfair dismissal arrangements and general protections in the workplace. The system also provides rights and responsibilities for employees, employee representatives (unions) and employers.
The Fair Work Act (2009) sits within the broader Australian workplace relations system (illustrated in Figure 6-1).

© 2015 KPMG, an Australian partnership and a member firm of the KPMG network of independent member firms affiliated with KPMG International Cooperative (“KPMG International”), a Swiss entity. All rights reserved. The KPMG name, logo and “cutting through complexity” are registered trademarks or trademarks of KPMG International. Liability limited by a scheme approved under Professional Standards Legislation. March 2015
Page 74
Figure 6-1: Australian workplace relations system
Source: Productivity Commission 2015, Workplace Relations Framework: The Inquiry in Context, Productivity
Commission Issues Paper 1, January.
Consultation with resources sector businesses has highlighted a number of challenges associated with the current workplace relations framework. These challenges have the potential impact the competitiveness of Australia’s resources sector. Broadly, these changes relate to four key areas of the Australian workplace relations framework:
• the statutory agreement making and bargaining framework;
• industrial action;
• union right of entry; and
• unfair dismissal and adverse action (employee protections).
The following sections provide an overview of these areas of the current legislative framework and discuss the challenges associated with the Fair Work Act (2009) for employers operating in the Australian resources industry.
The challenges outlined in the following section were identified through a review of available literature, consultation with AMMA and consultation with resource sector businesses. It is recognised that the challenges identified in the following section may be viewed differently by other industries and by workers and employee representatives. However, consistent with the scope of the analysis, the focus of the research and analysis is specific to the implications for the competiveness of resources sector businesses.

© 2015 KPMG, an Australian partnership and a member firm of the KPMG network of independent member firms affiliated with KPMG International Cooperative (“KPMG International”), a Swiss entity. All rights reserved. The KPMG name, logo and “cutting through complexity” are registered trademarks or trademarks of KPMG International. Liability limited by a scheme approved under Professional Standards Legislation. March 2015
Page 75
Agreement making and bargaining framework
A key component of the Australian workplace relations framework are the provisions for how employers, employees and their representatives bargain and make agreements. Agreement making and the bargaining framework comprise rules and principles that apply to bargaining, bargaining representation and various agreement types. The following section outlines the current agreement making and bargaining framework focusing on areas of the framework that present challenges for resource sector businesses. Specifically, the following areas are considered:
• the agreement making process;
• greenfield agreements;
• agreement content;
• good faith bargaining; and
• transfer of business.
6.1.1 Overview
Agreement making process
The Fair Work Act (2009) provides a single-system framework and process for agreement-making. The Act provides for ‘enterprise agreements’, which are collective agreements between an employer and a group of employees. A registered agreement sets out the terms and conditions of employment between an employee or a group of employees and one or more employers. Under the current national workplace relations system, there are two categories of agreements, as outlined in Table 6-1.
Table 6-1: Agreement categories
Agreement type Description
Enterprise agreements
A collective agreement between one or more national system employers and a relevant group of employees, at an enterprise level about terms and conditions of employment. Enterprise agreements are negotiated by the parties through collective bargaining in good faith. These agreements can be tailored to meet the needs of particular enterprises. An enterprise agreement must include a nominal expiry date (NED) no longer than four years from the approval date, a dispute settlement procedure, a flexibility component that allows for the individual flexibility arrangements (IFAs), and a consultation term that requires the employer to consult with employees regarding any major significant workplace changes. Employees are able to initiate protected industrial action when bargaining for a proposed enterprise agreement. There is no provision for individual statutory agreements. Under the Fair Work Act (2009), the following enterprise agreements can be negotiated:
• Single enterprise agreement - made between a single employer (or two or more single interest employers) and employees employed at the time the agreement is made, and who will be covered by the agreement
• Multi-enterprise agreement – made between two or more employers (that are not all single interest employers)
• Greenfields agreements – made in relation to a new enterprise of the employer(s), before any employees are employed. Greenfields agreements can either be single enterprise or multi-enterprise. The parties are the employer and relevant employee associations.
Agreement based transitional instruments
Include various individual and collective agreements that were made prior to the Fair Work Act (2009) being enacted; Australian Workplace Agreements (AWAs) and Individual Transitional Employment Agreements (ITEAS) that were made during the ‘bridging period’ (1 July 2009 – 31 December 2009). These agreements continue to operate until they expire or are replaced.
Source: Department of Employment, Trends in Federal Enterprise Bargaining, June Quarter 2014 and Australian Government Fair Work Ombudsman, 2009, Australia’s new workplace relations system factsheet

© 2015 KPMG, an Australian partnership and a member firm of the KPMG network of independent member firms affiliated with KPMG International Cooperative (“KPMG International”), a Swiss entity. All rights reserved. The KPMG name, logo and “cutting through complexity” are registered trademarks or trademarks of KPMG International. Liability limited by a scheme approved under Professional Standards Legislation. March 2015
Page 76
The single system was designed to remove scope for disputes over the type of agreement into which parties should enter.78 The aim of the Fair Work Act (2009) is to promote a balance between productivity and fairness through enterprise agreements, tailored to suit the needs of both employers and employees, by:
• providing employees with the right to appoint persons of their choice to represent them in negotiations for a proposed agreement (employees who are a member of a union are by ‘default’ a bargaining representative);
• enabling the Fair Work Commission (FWC) to facilitate good faith bargaining and the making of agreements, including through making bargaining orders and dealing with bargaining disputes where the parties request assistance; and
• ensuring that employees covered by an agreement are better off overall against the safety net 79 80.
The agreement making framework which governs these agreements has several components and constituent parts. These components are outlined in Table 6-2.
Table 6-2: Components of the agreement making framework
Component Description
Individual flexibility arrangements
There are no longer statutory individual contracts under the Fair Work Act (2009). However, employees and employers can enter into individual flexibility arrangements (IFAs). IFAs vary the terms and conditions of an enterprise agreement and are made to provide additional flexibility in relation to working hours and family friendly practices. These arrangements are underpinned by guaranteed statutory minimum wages and conditions, which are governed by modern awards and the National Employment Standards (NES).81
The National Employment Standards (NES)
NES are 10 minimum terms and conditions of employment, set out in the Fair Work Act (2009), that apply to national workplace relations system employees. The NES are minimum standards that cannot be overridden by the terms of enterprise agreements or awards.
Agreement approval Once agreement bargaining is complete and a draft enterprise agreement has been made, it must be submitted to a vote by the employees covered by the agreement (except in the case of greenfield agreements). The vote is deemed successful when the majority of the employees endorse the agreement. The application for a proposed enterprise agreement must be lodged with the Fair Work Commission (FWC) within 14 days of the agreement being made. Enterprise agreements are approved by FWC, which assesses whether the ‘better off overall test’ (BOOT) has been satisfied and whether other procedural requirements have been met. There are administrative costs and time delays associated with the voting process, which also gives employees opportunity to take industrial action and increase bargaining time.
Source: Fair Work Ombudsman 2014, An Employer’s Guide to the Fair Work Act, June
The process for negotiating and establishing an agreement is illustrated in Figure 6-2. An agreement is made between one or more employers and employees with their chosen representatives. The agreement making process follows the steps outlined below until the FWC receives, assesses and approves the agreement.
78 Department of Education, Employment and Workplace Relations, 2009, DEEWR Submission to the Fair Work Bill Inquiry 2009, pp. 19, 37; Explanatory Memorandum 79 The Parliament of the Commonwealth of Australia, House of Representatives, Fair Work Bill 2009, Explanatory Memorandum 80 From 1 January 2010, the ‘safety net’ provisions commenced operation which included the commencement of the ‘better off overall’ test and an assessment of enterprise agreements against modern awards (Part 2-4 Fair Work Act). 81 Fair Work Ombudsman 2014, An Employer’s Guide to the Fair Work Act, June 2014
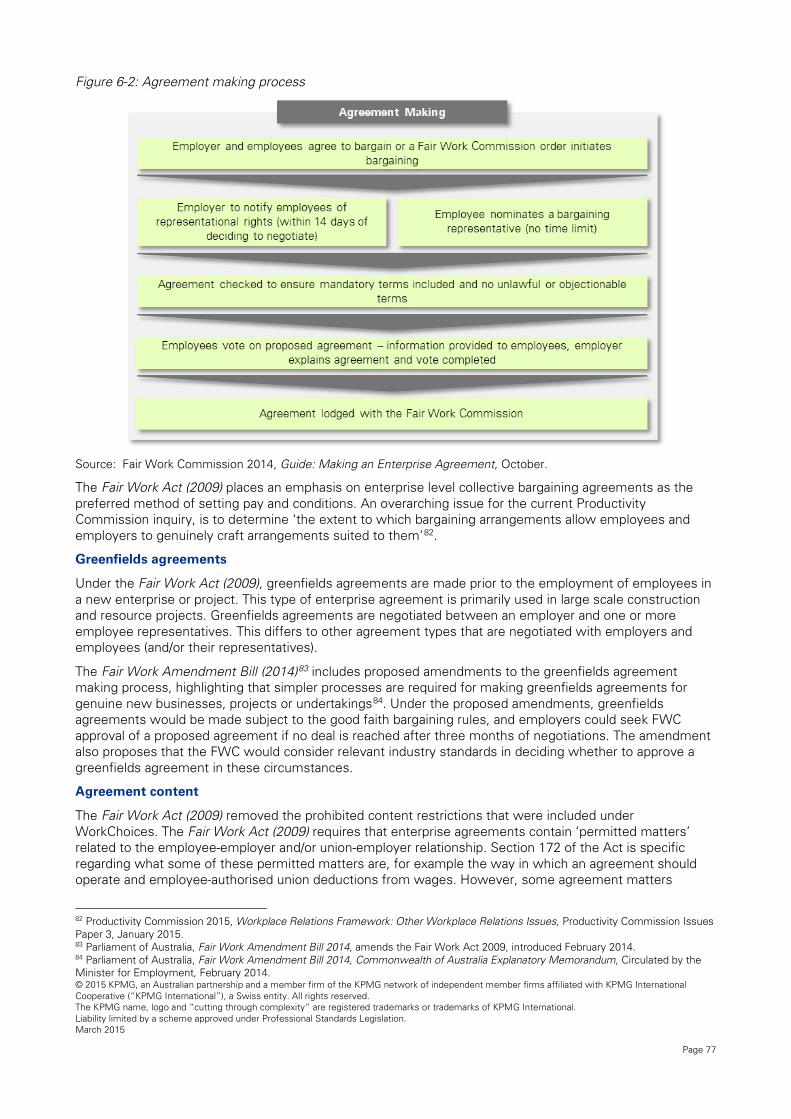
© 2015 KPMG, an Australian partnership and a member firm of the KPMG network of independent member firms affiliated with KPMG International Cooperative (“KPMG International”), a Swiss entity. All rights reserved. The KPMG name, logo and “cutting through complexity” are registered trademarks or trademarks of KPMG International. Liability limited by a scheme approved under Professional Standards Legislation. March 2015
Page 77
Figure 6-2: Agreement making process
Source: Fair Work Commission 2014, Guide: Making an Enterprise Agreement, October.
The Fair Work Act (2009) places an emphasis on enterprise level collective bargaining agreements as the preferred method of setting pay and conditions. An overarching issue for the current Productivity Commission inquiry, is to determine ‘the extent to which bargaining arrangements allow employees and employers to genuinely craft arrangements suited to them’82.
Greenfields agreements
Under the Fair Work Act (2009), greenfields agreements are made prior to the employment of employees in a new enterprise or project. This type of enterprise agreement is primarily used in large scale construction and resource projects. Greenfields agreements are negotiated between an employer and one or more employee representatives. This differs to other agreement types that are negotiated with employers and employees (and/or their representatives).
The Fair Work Amendment Bill (2014)83 includes proposed amendments to the greenfields agreement making process, highlighting that simpler processes are required for making greenfields agreements for genuine new businesses, projects or undertakings84. Under the proposed amendments, greenfields agreements would be made subject to the good faith bargaining rules, and employers could seek FWC approval of a proposed agreement if no deal is reached after three months of negotiations. The amendment also proposes that the FWC would consider relevant industry standards in deciding whether to approve a greenfields agreement in these circumstances.
Agreement content
The Fair Work Act (2009) removed the prohibited content restrictions that were included under WorkChoices. The Fair Work Act (2009) requires that enterprise agreements contain ‘permitted matters’ related to the employee-employer and/or union-employer relationship. Section 172 of the Act is specific regarding what some of these permitted matters are, for example the way in which an agreement should operate and employee-authorised union deductions from wages. However, some agreement matters
82 Productivity Commission 2015, Workplace Relations Framework: Other Workplace Relations Issues, Productivity Commission Issues Paper 3, January 2015. 83 Parliament of Australia, Fair Work Amendment Bill 2014, amends the Fair Work Act 2009, introduced February 2014. 84 Parliament of Australia, Fair Work Amendment Bill 2014, Commonwealth of Australia Explanatory Memorandum, Circulated by the Minister for Employment, February 2014.
© 2015 KPMG, an Australian partnership and a member firm of the KPMG network of independent member firms affiliated with KPMG International Cooperative (“KPMG International”), a Swiss entity. All rights reserved. The KPMG name, logo and “cutting through complexity” are registered trademarks or trademarks of KPMG International. Liability limited by a scheme approved under Professional Standards Legislation. March 2015
Page 78
pertaining to the employer-employee relationship are not clearly defined, for example matters relating to rostering, annual leave entitlements, training requirements, requirements for a specific number of apprentices and restrictions on the use of contractors.
Under the current workplace relations framework, agreements can contain clauses that specify commitments to productivity improvements, however, these clauses are not mandatory. The Fair Work Amendment (Bargaining Processes) Bill 2014 proposes to introduce powers for the FWC that require discussion of productivity improvements as part of the bargaining process, including consideration of the parties’ actual ability to achieve the productivity improvements outlined when deciding upon a bargaining application.
While the legislation is designed to strike a balance between the bargaining ability of employers and employees (including employee representatives), in practical operational terms, it can often lead to unproductive and inefficient bargaining practices, and ultimately industrial disputation (see Section 6.2).
Good faith bargaining
The workplace relations framework governs how employers and employees bargain over wages and conditions. Under the Fair Work Act (2009), bargaining representatives must bargain ‘in good faith’ based on the following principles:
• attending and participating in meetings;
• disclosing relevant information; and
• giving genuine consideration to proposals made by other bargaining representatives.
Bargaining parties are not bound to make any concessions or to reach agreement. The current good faith bargaining framework presents a number of challenges to businesses operating in the resources sector, including the FWC-ordered majority support determination to trigger compulsory bargaining, default bargaining representatives, and limitations associated with the scope orders.
Under the current framework, greenfields agreements are not subject to good faith bargaining rules.
Transfer of business
The current framework stipulates that an agreement or another type of transferable industrial instrument is attached to the employee and the new employer is bound by it, under these provisions. A new statutory test for determining whether a transfer of business has taken place was introduced under the Fair Work Act (2009). This broadened the circumstances that are considered to be a transfer of business. The Fair Work Act (2009) removed the automatic cessation of transferred instruments after 12 months.
6.1.2 Challenges for employers operating in the resources sector
A key priority for resource sector businesses in considering the impact of the Fair Work Act (2009) on workplace relations is whether the current agreement-making framework is sufficiently robust and flexible to support the Australian resources sector to develop new projects, drive productivity in existing project workplaces, create more employment opportunities, drive economic contribution, and ultimately compete internationally.
Employers in the resources sector are currently facing a number of challenges, such as:
• declining commodity prices;
• a tapering investment pipeline; and
• new and increasing cost challenges.
Increased regulatory burden, delays to projects and complex workplace relations processes have the potential to exacerbate challenges currently being experienced in the resources sector. The ability to manage the volume and efficiently navigate the complexity of statutory agreements is crucial to improving workplace productivity and overall competitiveness and sustainability of resources sector operations and investment.
© 2015 KPMG, an Australian partnership and a member firm of the KPMG network of independent member firms affiliated with KPMG International Cooperative (“KPMG International”), a Swiss entity. All rights reserved. The KPMG name, logo and “cutting through complexity” are registered trademarks or trademarks of KPMG International. Liability limited by a scheme approved under Professional Standards Legislation. March 2015
Page 79
Consultation with resources sector businesses suggests that the current agreement making and the bargaining framework, outlined in the previous section, potentially contributes to delays and additional costs to project commencement and completion. Specifically, key challenges include:
• the process for making greenfields agreements;
• agreement content (permitted matters);
• adherence to the good faith bargaining principles;
• transfer of business; and
• the extent to which agreements realistically provide for productivity improvements.
Agreement making
The NED for agreements is currently four years. Agreement renewal is a key risk, as negotiations around the renewal period can be protracted, causing significant delays to project development and legal and management costs. Recent research found that agreement renewal is a major area of concern for over three-quarters of resource sector respondents85. Restrictive and slow processes for agreement approvals are a major risk to resource project delivery timelines and budgets. Some employers are willing to inherit increased risk to avoid having to absorb the upfront costs of negotiating and implementing a greenfields agreement at the start of a new project86. In 2015, 186 agreements in the resource sector are due to expire87. As employees have the right to take protected industrial action during the agreement-making process, this presents an additional risk for employers, and the sector as a whole. If the NED of agreements were extended, or allowed for longer expiry periods based on a specific resources project value (capital expenditure), this would limit the level of risk pertaining to industrial action, delays and costs for employers associated with agreement making88.
Greenfields agreements
A number of resources sector businesses indicated that the process to negotiate greenfields agreements has resulted in delays and additional costs to new projects. The requirement to negotiate with employee representatives limits the flexibility in agreement making. Greenfields agreements proposed by employee representatives tend to be generic and based on other recent agreements. Accordingly, these agreements do not reflect the needs of the specific project. Since the removal of non-union greenfields agreements, negotiation of greenfields agreements has caused major delays to mobilisation or start-up of projects of 20 per cent of projects and minor delays to a further 20 per cent of projects89. Protracted negotiation timeframes have immediate cost implications for resources sector businesses including legal costs, project costs and time spent in negotiations.
A review of the Fair Work Act (2009) highlighted a number of potential issues associated with current greenfields agreement arrangements, including:
• average annual wage increases negotiated in greenfields agreements are higher than industry average increases;
• greenfields agreements are less likely to contain flexible agreement terms compared to other agreements; and
• greenfields agreements are more likely to contain terms for employees, such as annual leave loading, overtime at penalty rates and public holidays at penalty rates, without any offsetting consideration of operational needs90.
85 Kates S, 2013The AMMA Workplace Relations Research Project – A Survey Based Analysis, Report 6, August 86 Ibid 87 Department of Employment, 2014, Trends in Federal Enterprise Bargaining, June Quarter 2014, agreements current in March 2014 quarter, by quarter of expiry, June quarter 2014 – June quarter 2017. 88 Consultation with AMMA members 89 Kates S. 2013, The AMMA Workplace Relations Research Project – A Survey Based Analysis, Report 6, August. 90 Department of Employment, 2012, Towards more productive and equitable workplaces – an evaluation of the Fair Work legislation, recommendations 27-30

© 2015 KPMG, an Australian partnership and a member firm of the KPMG network of independent member firms affiliated with KPMG International Cooperative (“KPMG International”), a Swiss entity. All rights reserved. The KPMG name, logo and “cutting through complexity” are registered trademarks or trademarks of KPMG International. Liability limited by a scheme approved under Professional Standards Legislation. March 2015
Page 80
These factors potentially contribute to increased costs to resources sector businesses91. In addition, current greenfields bargaining processes and agreements have the potential to adversely impact the timely commencement and delivery of major resources projects. Businesses may be forced to agree to demands that are unsustainable for the life of a major project, to establish an agreement and enable projects to commence.
Consultation with resources sector businesses suggests that the current framework provides employee representatives with leverage to make excessive wage claims and delay the commencement of new projects, creating significant uncertainty over whether a project will proceed.
The costs associated with delays to projects include:
• delays in completion of construction and commencement of production and exports;
• cost of idle capital (e.g. machinery and equipment);
• extension of time claims by contractors;
• inability to meet future contracts of sale; and
• investor uncertainty resulting in decision not to invest92.
Overall, the greenfields agreement making process and requirements have potential adverse implications for the competiveness of Australian resources projects relative to other investment destinations. The implications of greenfields agreements on business investment, competitiveness and productivity are investigated further in Section 8.
Agreement content
As outlined above, there is limited specific guidance on the set of matters that are considered part of the employee-employer or union-employer relationship. Consultation suggests that this ambiguity can result in poorly structured enterprise agreements. Resources sector businesses also indicated that there is a lack of clarity around ‘unlawful terms’ and permitted content.
The ambiguity regarding agreement content has resulted in a number of legal disputes regarding agreements. Disputes, such as the one outlined in Case Study 6-1, can result in significant administrative, legal and management costs for resources sector businesses93.
Case Study 6-1: Restrictions on use of contractors
In April 2004, the Federal AFMEPKIU initiated a bargaining period under the Workplace Relations Act 1996 (Cth) ("WR Act") for Wesfarmers Premier Coal Limited employees. In early July, the Federal AFMEPKIU commenced industrial action in support of its claims in the April Bargaining Notice. Significantly, at that stage, the only negotiations between the parties had been for a state agreement.
After the July industrial action, the parties commenced negotiating the terms of a federal certified agreement which included clauses with respect to contractors, right of entry, union meetings and redundancy. Premier Coal considered these were not "matters pertaining" to the employment relationship and therefore could not be included in any certified agreement. In September, the Federal AFMEPKIU issued a second Bargaining Notice, and then took industrial action in October.
Premier Coal argued that industrial action was not protected because the proposed agreement dealt with matters that did not pertain to the employment relationship. The dispute between Wesfarmers and AFMEPKIU escalated to the Federal Court. The Court found that the October action was not covered by that legislation and was not protected action, as it was taken in support of several matters that did not pertain to the employment relationship. Specifically:
• restrictions or qualifications on the use of independent contractors; and
91Ibid. 92 Dr. Kates S, 2012, op. cit. 93 We note that this case study is related to the Workplace Relations Act, it is relevant to the Fair Work Act 2009 and whether a matter pertains to the employment relationship.

© 2015 KPMG, an Australian partnership and a member firm of the KPMG network of independent member firms affiliated with KPMG International Cooperative (“KPMG International”), a Swiss entity. All rights reserved. The KPMG name, logo and “cutting through complexity” are registered trademarks or trademarks of KPMG International. Liability limited by a scheme approved under Professional Standards Legislation. March 2015
Page 81
• clauses that entitled employees not rostered for work, to be paid for their attendance at union meetings.
The Court found that there was evidence that the Federal AFMEPKIU and certain union officials contravened section 170NC of the WR Act, insofar as they took and threatened to take industrial action in October for the purpose of coercing Premier Coal into making an agreement.
Source: Clayton Utz 2005, Federal Court further considers Electrolux issues, accessed 21 February 2015, http://www.claytonutz.com/publications/news/200502/07/federal_court_further_considers_electrolux_issues.page
Esso Australia Pty Ltd v AMWU, CEPU and AWU [2015] FWCFB 210 (10 February 2015) has cast doubt as to whether restrictions on contractors which are non-permitted terms prevent the ability for a union to take protected industrial action in bargaining negotiations94.
Under the current framework, there is currently no obligation to include commitments to productivity improvements in agreements. Consultation with industry suggests that there are mixed views on whether productivity commitments should be included in agreements. Some businesses suggested that these commitments were important to ensuring ongoing viability and competiveness of the industry. Others indicated that productivity improvements were best achieved through management and operational decision making rather than through mandatory commitments in agreements that may limit flexibility. Businesses highlighted that agreement content should avoid content that impeded the ability to achieve productivity improvements.
As at 30 June 2014, around 40 per cent of employees in the resources sector were covered by federal enterprise collective agreements that contained clauses (both general and specific) on commitments to productivity improvements95.
Good faith bargaining
The stated objective of the current agreement making framework is that both employers and employees should have freedom of decision whether to enter into a collective agreement and be subject to the conditions of bargaining and approval before the FWC. Consultation with industry suggests that, under the Fair Work Act (2009), the ability of employers to engage and negotiate directly with their employees is diminished, relative to previous legislative frameworks. Consultation with resources sector businesses suggest that the good faith bargaining principles do not appear to have lessened the protracted bargaining process. Employers are required to engage in bargaining when a majority support determination is ordered by the FWC, that is, if a majority of employees compel an employer to commence bargaining. Employers have indicated that the FWC adopts an overly bureaucratic approach in this regard and suggest that mandatory secret ballots should be implemented to determine majority support96.
Transfer of business
Consultation with resource industry employers suggests that the current transfer of business provisions impose administrative burden on employers in terms of time and resources involved in the preparation and submission of applications to the FWC to stop a transfer and obtain an order. The Fair Work Amendment Bill 2014 makes amendments to the Fair Work Act (2009) to implement elements of The Coalition’s Policy to Improve the Fair Work Laws. Specifically, the Bill responds to a number of outstanding recommendations from the 2012 DEEWR Review97.
Another challenge of the current transfer of conditions provisions relates to setting of pay and conditions. As conditions follow, the employee legacy pay conditions from the previous business can result in workplace tensions as employees are paid different amounts for the same work. This also results in additional costs to
94 Ashurst Australia 2015, FWC Full Bench settles “genuinely seeking an agreement” confusion, February. 95 Fair Work Commission, 2014, Productivity and innovation in enterprise agreement clauses: an overview of literature, data and case studies at the workplace level, December. 96 DEEWR 2012, op. cit, page 131. 97 Parliament of the Commonwealth of Australia 2014, Fair Work Amendment Bill 2014 Explanatory Memorandum, Canberra.
© 2015 KPMG, an Australian partnership and a member firm of the KPMG network of independent member firms affiliated with KPMG International Cooperative (“KPMG International”), a Swiss entity. All rights reserved. The KPMG name, logo and “cutting through complexity” are registered trademarks or trademarks of KPMG International. Liability limited by a scheme approved under Professional Standards Legislation. March 2015
Page 82
the employer who must maintain multiple payroll systems for the same group of employees being covered by multiple instruments98.
Industrial action
Industrial action can be taken by employees, refusing to attend or perform work, or by employers who may lock out their employees. Industrial action is only permissible during enterprise bargaining and then only in limited circumstances. The following section provides an overview of the current legislation pertaining to industrial action and outlines key challenges for the resources sector.
6.2.1 Overview
There are two primary types of industrial action:
• protected industrial action; and
• unprotected industrial action.
The types of industrial action, and associated implications, are illustrated in Figure 6-3.
Protected industrial action occurs when employers, employees and employee representatives organise and engage in industrial action such as a strike or a ban on performing some duties, with some immunity from prosecution and civil liability.99 Protected industrial action can only be taken in limited circumstances during the bargaining process. Specifically:
• the agreement in question must have passed its NED;
• all parties must be seen to be genuinely trying to reach agreement;
• the industrial action must not relate to a proposed greenfields or multi-enterprise agreement; and
• written notice must be given before action is taken.
Unless the action is in response to industrial action taken by the employer, three days’ notice of the planned action must be given. Before an employer takes industrial action, written notice must be given to each bargaining representative of an employee to be covered by the agreement. The employer must also take all reasonable steps to notify the employees to be covered by the proposed agreement of the action.
A secret ballot of eligible workers is required before protected industrial action can be taken to pursue claims during bargaining for an enterprise agreement, except when the action is in response to industrial action by the other party.100 The employer has the right to be heard and to object to the application for a protected action ballot order. Once the secret ballot results are announced employees must commence industrial action within 30 days. Employers must withhold pay from participating employees during industrial action.
The FWC can make an order regarding industrial action that is not protected, or if taken, would not be protected:
• to stop the unprotected industrial action when it is already occurring; and
• to prevent the unprotected industrial action from occurring when it is threatened, impending, probable, or being organised. 101
Currently, there is no requirement for the bargaining process to have commenced for parties to seek permission to take protected industrial action, provided that other requirements have been met. However, the Fair Work Amendment Bill (2014) proposes to introduce this requirement.
98 Ibid. 99 Fair Work Ombudsman, 2013, Industrial Action Fact Sheet, December 2013. 100 Ibid. 101 Ibid.

© 2015 KPMG, an Australian partnership and a member firm of the KPMG network of independent member firms affiliated with KPMG International Cooperative (“KPMG International”), a Swiss entity. All rights reserved. The KPMG name, logo and “cutting through complexity” are registered trademarks or trademarks of KPMG International. Liability limited by a scheme approved under Professional Standards Legislation. March 2015
Page 83
Figure 6-3: Industrial action process
Source: Ashurst 2013, Navigating Employment and Labour Relations in Australia: A Guide for Employers, September.
6.2.2 Challenges for employers operating in the resources sector
Consultation with resource sector businesses highlighted a number of challenges associated with the current framework relating to industrial action, specifically:
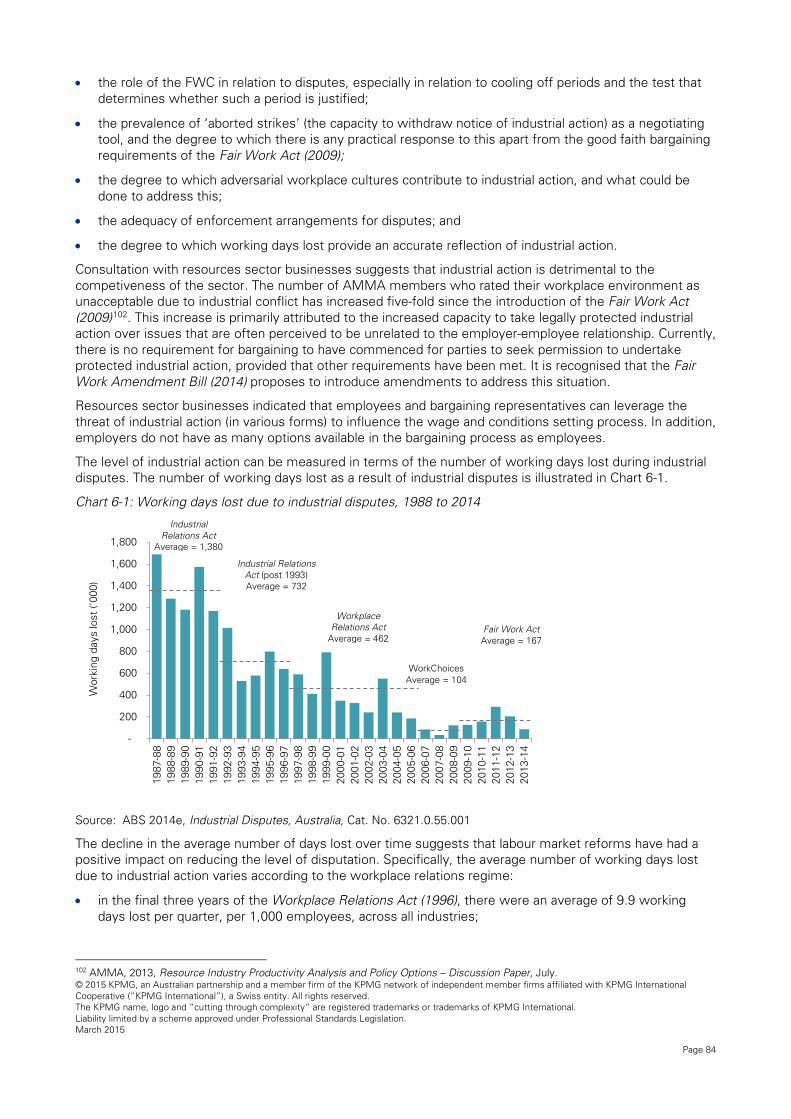
© 2015 KPMG, an Australian partnership and a member firm of the KPMG network of independent member firms affiliated with KPMG International Cooperative (“KPMG International”), a Swiss entity. All rights reserved. The KPMG name, logo and “cutting through complexity” are registered trademarks or trademarks of KPMG International. Liability limited by a scheme approved under Professional Standards Legislation. March 2015
Page 84
• the role of the FWC in relation to disputes, especially in relation to cooling off periods and the test that determines whether such a period is justified;
• the prevalence of ‘aborted strikes’ (the capacity to withdraw notice of industrial action) as a negotiating tool, and the degree to which there is any practical response to this apart from the good faith bargaining requirements of the Fair Work Act (2009);
• the degree to which adversarial workplace cultures contribute to industrial action, and what could be done to address this;
• the adequacy of enforcement arrangements for disputes; and
• the degree to which working days lost provide an accurate reflection of industrial action. Consultation with resources sector businesses suggests that industrial action is detrimental to the competiveness of the sector. The number of AMMA members who rated their workplace environment as unacceptable due to industrial conflict has increased five-fold since the introduction of the Fair Work Act (2009)102. This increase is primarily attributed to the increased capacity to take legally protected industrial action over issues that are often perceived to be unrelated to the employer-employee relationship. Currently, there is no requirement for bargaining to have commenced for parties to seek permission to undertake protected industrial action, provided that other requirements have been met. It is recognised that the Fair Work Amendment Bill (2014) proposes to introduce amendments to address this situation.
Resources sector businesses indicated that employees and bargaining representatives can leverage the threat of industrial action (in various forms) to influence the wage and conditions setting process. In addition, employers do not have as many options available in the bargaining process as employees.
The level of industrial action can be measured in terms of the number of working days lost during industrial disputes. The number of working days lost as a result of industrial disputes is illustrated in Chart 6-1.
Chart 6-1: Working days lost due to industrial disputes, 1988 to 2014
Source: ABS 2014e, Industrial Disputes, Australia, Cat. No. 6321.0.55.001
The decline in the average number of days lost over time suggests that labour market reforms have had a positive impact on reducing the level of disputation. Specifically, the average number of working days lost due to industrial action varies according to the workplace relations regime:
• in the final three years of the Workplace Relations Act (1996), there were an average of 9.9 working days lost per quarter, per 1,000 employees, across all industries;
102 AMMA, 2013, Resource Industry Productivity Analysis and Policy Options – Discussion Paper, July.
-
200
400
600
800
1,000
1,200
1,400
1,600
1,800
1987
-88
1988
-89
1989
-90
1990
-91
1991
-92
1992
-93
1993
-94
1994
-95
1995
-96
1996
-97
1997
-98
1998
-99
1999
-00
2000
-01
2001
-02
2002
-03
2003
-04
2004
-05
2005
-06
2006
-07
2007
-08
2008
-09
2009
-10
2010
-11
2011
-12
2012
-13
2013
-14
Wor
king
day
s lo
st ('
000)
Industrial Relations Act
Average = 1,380
Industrial Relations Act (post 1993) Average = 732
Workplace Relations Act
Average = 462
WorkChoices Average = 104
Fair Work Act Average = 167

© 2015 KPMG, an Australian partnership and a member firm of the KPMG network of independent member firms affiliated with KPMG International Cooperative (“KPMG International”), a Swiss entity. All rights reserved. The KPMG name, logo and “cutting through complexity” are registered trademarks or trademarks of KPMG International. Liability limited by a scheme approved under Professional Standards Legislation. March 2015
Page 85
• in the seven quarters during the operation of WorkChoices, there was an average of 2.4 working days lost, a decline of 76 per cent relative to the average under the Workplace Relations Act (1996); and
• since the commencement of the Fair Work Act (2009) the average number of days lost has increased relative to under WorkChoices number of factors have contributed to the increase in days lost to industrial disputes in recent years. One such contributing factor is the changes in the circumstances under which protected industrial action could be taken. Under the Fair Work Act (2009), there is a wider range of circumstances under which industrial action can be taken compared to under the previous WorkChoices regulations.
Relative to its share of total employment, the prevalence of industrial disputes in the resources sector has been disproportionately higher in recent years. Between 2009 and 2013, the resources industry accounted for 28 per cent of the working days lost due to industrial action in the Australian economy.103 This compares with the industry’s average share of employment of two per cent over the same period.
Industrial action has the potential to contribute to costs and project delays in the resources sector. In addition to the direct implications for resources sector business, industrial action has the potential to impact other businesses that support the sector (e.g. accommodation and catering companies, subcontractors, labour hire, and manufacturing). Additionally, the perception that specific jurisdictions or project sites are more likely to experience the threat of industrial action can be harmful to reputation and future investment in Australia’s resources sector.
The Productivity Commission has highlighted that some unions may threaten industrial action and then not proceed with the action. This is not recorded in the official statistics reported above. In addition, there are some reports of unlawful action being taken causing disruptions to production. This threatened and unlawful industrial action can result in significant costs to the business, through:
• need to conduct contingency planning and facilitate alternative arrangements for the business and for dependent third parties; and
• reputational and brand damage that may reduce sales.
Anecdotally, businesses have noted that the threats of industrial action have been used by unions as a form of leverage to extract concessions from employers.
The implications of industrial action on the resource sector supply chain are highlighted in Case Study 6-2.
Case Study 6-2: Dispute in the port of Port Hedland
In the second half of 2014, the Australian Institute of Marine and Power Engineers (AIMPE), representing about 50 workers, was negotiating a new enterprise agreement with Teekay Shipping, who operate tugboats at Port Hedland. Port Hedland is one of Australia’s busiest ports and around $100 million worth of iron ore exports is shipped through the port daily.
At several points during the negotiation, the union threatened strike action, which would have potentially forced exports to a halt. This could have severely impacted multiple third parties, who were already under strain from a falling iron ore price.
A new enterprise agreement was successfully signed in November 2014, without industrial action taking place. However, the threat of the strike action caused uncertainty to businesses, customers and other stakeholders.
Source: Elizabeth Piesse 2014, Tugboat engineers plan strike in Port Hedland, ABC News Online, November 6, accessed 30 January 2015, http://www.abc.net.au/news/2014-11-06/tug-boat-strike-planned-for-next-week/5873140; Christian, B. (2014), Port Hedland strike averted after deal reached between Teekay Shipping, tugboat workers, ABC News Online, November 11, accessed January 30, http://www.abc.net.au/news/2014-11-10/port-hedland-tugboat-workers-reach-agreement-with-employers/5880798; Reuters (2014), Port Hedland engineers accept pay deal, cancel strike, The Sydney Morning Herald, November 21, accessed January 30, http://www.smh.com.au/business/mining-and-resources/port-hedland-engineers-accept-pay-deal-cancel-strike-20141121-11r1dp.html
103 ABS 2014e, op. cit.; ABS 2014a, op. cit.

© 2015 KPMG, an Australian partnership and a member firm of the KPMG network of independent member firms affiliated with KPMG International Cooperative (“KPMG International”), a Swiss entity. All rights reserved. The KPMG name, logo and “cutting through complexity” are registered trademarks or trademarks of KPMG International. Liability limited by a scheme approved under Professional Standards Legislation. March 2015
Page 86
The economic implications of industrial action are investigated further in Section 8.
Union right of entry
The union right of entry provisions in the current workplace relations framework are a contentious issue for the resources sector in particular, given the size and scale of work sites and workforces involved, complex OHS considerations and often remote geographic locations. The right of entry provisions have been subject to several amendments since the introduction of the Fair Work Act (2009). The following sub section provides an overview of the current provisions governing right of entry as well as the challenges that these provisions present for resource sector employers.
6.3.1 Overview
The workplace relations framework provides legislation governing the right of entry of employee representatives and the circumstances under which they can enter a workplace.104 The FWC is responsible for issuing entry permits to representative officials, and ensuring that entry rights are properly exercised. Under the Fair Work Act (2009) union officials hold a valid and current entry permit and be entitled to represent workers in the workplace as a representative105. They must also provide at least 24 hours written notice of entry (except if entering for a work health and safety investigation).
The purpose of exercising the right to enter a workplace include:
• investigating suspected breaches of the Fair Work Act (2009) and other instruments;
• investigating breaches relating to textile, clothing and footwear industry outworkers;
• meeting with employees; and
• exercising rights under OHS laws.
Under the Fair Work Act (2009) a union has the right to enter if they could potentially represent the industrial interests of employees. Under the previous legislation, the union was required to be party to the agreement to obtain rights to enter a workplace for discussion purposes. Hence, the Fair Work Act (2009) broadened the scope of union right of entry106.
From 1 January 2014, under the Fair Work Amendment Act (2013), employers are required to provide transport and accommodation for union officials on remote site visits and provide lunch rooms as default meeting places for unions107. The FWC’s power to resolve disputes about frequency of union visits was also expanded.
6.3.2 Challenges for employers operating in the resources sector
Entry rights under the Fair Work Act (2009) are broader than those under the previous workplace relations legislation. Consultation with industry suggest that this has resulted in an increase in the frequency of union visits. There is limited published data regarding the number and frequency of union visits to workplaces. Accordingly, recent analysis of the number and implication of these visits relies on anecdotal information.
The following case studies highlight the number and frequency of union visits to resource sector operations.
104 Fair Work Ombudsman, 2014, Right of Entry Fact Sheet, January 2014. 105 Productivity Commission, 2015, Workplace Relations Framework: Other Workplace Relations Issues, Issues Paper 5, January. 106 DEEWR, 2012, Towards more productive and equitable workplaces – an evaluation of the Fair Work legislation. 107 Parliament of Commonwealth of Australia, 2014, Fair Work Amendment Bill 2014 Explanatory Memorandum.

© 2015 KPMG, an Australian partnership and a member firm of the KPMG network of independent member firms affiliated with KPMG International Cooperative (“KPMG International”), a Swiss entity. All rights reserved. The KPMG name, logo and “cutting through complexity” are registered trademarks or trademarks of KPMG International. Liability limited by a scheme approved under Professional Standards Legislation. March 2015
Page 87
Case Study 6-3: Union visits to Pluto LNG Project
During the first two years of construction of the Pluto LNG Project, from 2007 to 2009, there were no union visits to the site. Following the implementation of the Fair Work Act (2009) right of entry rules, there were 217 entry requests within four months. Over the following six months, the number of requests had increased to 450.
Source: AMMA 2012, Submission to the Fair Work Act Review Panel on the Post-Implementation Review of the Fair Work Act 2009, February.
Case Study 6-4: BHP Billiton’s Worsley Alumina Plant, 2007 to 2011
The number of right of entry visits by union officials to selected BHP workplaces is illustrated below.
Chart: Right of entry visits by union officials
The number of visits increased significantly over time, particularly following the introduction of the Fair Work Act (2009).
The primary costs associated with frequent union visits at resources sites (including remote sites) are attributable to administrative costs. The cost of these visits was estimated to be approximately $1,145 per visit.108
This cost included:
• administration and oversight of visits;
• diversion of management from other duties;
• additional security; and
• ensuring OHS compliance.
Source: BHP submission to DEEWR 2012, op. cit. and Fair Work Amendment Bill 2014, Explanatory Memorandum, Regulation Impact Statement, 2014
108 Fair Work Amendment Bill 2014, Explanatory Memorandum, Regulation Impact Statement, 2014
0
82
378
792726
0
100
200
300
400
500
600
700
800
900
2007 2008 2009 2010 2011
Vis
its p
er a
nnum
(no)
Operations Construction

© 2015 KPMG, an Australian partnership and a member firm of the KPMG network of independent member firms affiliated with KPMG International Cooperative (“KPMG International”), a Swiss entity. All rights reserved. The KPMG name, logo and “cutting through complexity” are registered trademarks or trademarks of KPMG International. Liability limited by a scheme approved under Professional Standards Legislation. March 2015
Page 88
Case Study 6-5: Union visits to onshore resource construction projects in Western Australia
At the upper end, an onshore resource construction project in Western Australia experienced on average 56 visits per month, or almost 700 visits per year. On one day, the project received 17 visits. On average, each visit takes between 60 and 90 minutes to manage or up to 3.5 hours for remote locations.
Overall, the costs of union visits include:
• cost of having two personnel available to manage visit;
• additional site security costs;
• vehicle and transport costs; and
• training of union representative to enable accreditation for site access.
Source: CCIWA submission to DEEWR 2012, op. cit.
Overall, the recent review of the Fair Work Act (2009) indicated that there had been a significant increase in the frequency of union visits and associated disruptions to some workplaces. In particular, this is an issue for workplaces where multiple unions have coverage of workers109.
The recent review of the Fair Work Act (2009) recognised that there is cost to employers associated with union workplace visits110. From 1 January 2014 if unions wish to exercise their rights to visit remote locations (as is often the case in the resources sector), employers must make accommodation and transport arrangements for them. While employers are entitled to be reimbursed for those costs, there is a cost associated with time spent making these arrangements111.
The recent review of the Fair Work Act (2009) identified a number of potential implications associated with current arrangements relating to union visits:
• frequency of visits and associated administrative and compliance costs;
• disruption to business operations; and
• establishing a valid entry reason112.
The economic implications of frequent union visits are investigated further in Section 8.
Unfair dismissal and adverse action
The following section outlines some of the provisions that provide protection for employees, employee representatives and employers. These protections relate to unfair dismissal arrangements and adverse action. This section provides an overview of each of these components as well as the challenges they present for resources employers.
6.4.1 Overview
Unfair dismissal
Unfair dismissal occurs when an employee is dismissed from their employment in a harsh, unjust or unreasonable manner. An unfair dismissal is deemed to have occurred when an employee makes an unfair dismissal claim and the FWC finds that the dismissal was harsh, unjust or unreasonable, and the dismissal was not a case of genuine redundancy. To make a claim for unfair dismissal, employees have to have been employed for at least six months before they can apply for unfair dismissal (unless the employer is a small business). Additionally, the employee must earn less than the high income threshold (currently $133,000 per
109 DEEWR, 2012, Towards more productive and equitable workplaces – An evaluation of the Fair Work legislation, Canberra. 110 Ibid. 111 Ibid 112 Ibid
© 2015 KPMG, an Australian partnership and a member firm of the KPMG network of independent member firms affiliated with KPMG International Cooperative (“KPMG International”), a Swiss entity. All rights reserved. The KPMG name, logo and “cutting through complexity” are registered trademarks or trademarks of KPMG International. Liability limited by a scheme approved under Professional Standards Legislation. March 2015
Page 89
year). If an employee earns more than the threshold, they must be covered by an award, or by an enterprise agreement113.
The Fair Work Act (2009) restored protections to employees of businesses with 100 or fewer employees. In addition, ‘genuine operational reasons’ were removed as a defence to unfair dismissal114.
Adverse action
The Fair Work Act (2009) sets out general protections against adverse action in relation to exercising workplace rights and engaging in industrial action. Adverse action can include action that is unlawful if it is threatened or taken for a discriminatory reason (on the basis of race, sex, age, disability, marital status, sexual preference, religion or political opinion)115. The Fair Work Act (2009) also provides that, in some circumstances, an action may not be considered discrimination. For example, in the resources sector context, this may include where the action is based on the inherent physical requirements of the particular position.
Some recent decisions on specific provisions have served to clarify, and will potentially improve the effectiveness of, general protections and adverse actions. In October 2014, there was a high court decision on Construction, Forestry, Mining and Energy Union (CFMEU) vs. BHP Coal Limited, which served to clarify the intended operation of the general protections pertaining to adverse actions, which should have implications for the conduct of employers, employees and unions in the workplace116. This decision makes it clear that employees will not necessarily be protected from disciplinary action simply because of their involvement in industrial activity. However, it is important to note that the onus remains on the employer to clearly demonstrate that the reasons for disciplinary action were not in any way related to an unlawful reason such as an employee’s union membership, or their involvement in any industrial activities.
6.4.2 Challenges for employers operating in the resources sector
Resource sector businesses have identified a number of issues associated with the current employee protections framework, specifically:
• ambiguity regarding scope of ‘adverse action’ provisions;
• regulatory costs associated with the reverse onus of proof;
• escalating number of unfair dismissal claims; and
• inability to take legitimate action over OHS issues.
Under previous workplace relations regulations, a ‘genuine operational reason’ was permitted to be a contributing reason for dismissal. This provision was removed with the introduction of the Fair Work Act (2009). Resource sector employers suggested that changes to unfair dismissal laws have led to an increase in the number of claims.
Since the Fair Work Act (2009) was enacted in 2008-09, unfair dismissal claims lodged with the FWC have almost doubled from 8,000 per year to almost 15,000 per year in 2013-14. This increase is attributed to changes to content of unfair dismissal claims, which means that employers are more susceptible to claims117.
113 Ibid. 114 Ibid. 115 Fair Work Ombudsman, 2013, Protections at Work Fact Sheet, December. 116 Productivity Commission, 2015, Workplace Relations Framework: Employee Protections, Issues Paper 4, January 2015. 117 Philipatos, A., Back to the Bad Old Days? Industrial Relations Reform in Australia, CIS Policy Monograph, 133, 2012.

© 2015 KPMG, an Australian partnership and a member firm of the KPMG network of independent member firms affiliated with KPMG International Cooperative (“KPMG International”), a Swiss entity. All rights reserved. The KPMG name, logo and “cutting through complexity” are registered trademarks or trademarks of KPMG International. Liability limited by a scheme approved under Professional Standards Legislation. March 2015
Page 90
Chart 6-2: Unfair dismissal claim applications
Source: Australian Industrial Relations Commission 2009, Annual Report 2008-09; Fair Work Australia 2010, Annual
Report 2009-10; and Fair Work Australia 2011, Annual Report 2010-11.
General protections, in particular ‘adverse action’ provisions, are designed to provide adequate protections to both employers and employees while also providing certainty and clarity to all parties. Adverse actions is a complex and lengthy set of actions that are defined as adverse, including dismissing an employee, injuring an employee, altering their position or discriminating. Resource industry employers have indicated that the broad scope of protections pertaining to adverse actions causes confusion and additional costs associated with time spent on interpretation, legal fees and compensation costs.
Key findings
As outlined in this section, the current workplace relations framework presents a number of challenges to businesses operating in the Australian resources sector. These challenges and the potential implications for employers in the sector are summarised in Section 8.
6,7075,758
5,1736,067
7,994
11,116
12,840
14,02714,818 14,796
0
2,000
4,000
6,000
8,000
10,000
12,000
14,000
16,000
Unf
air d
ism
issa
l cla
ims
(no.
)
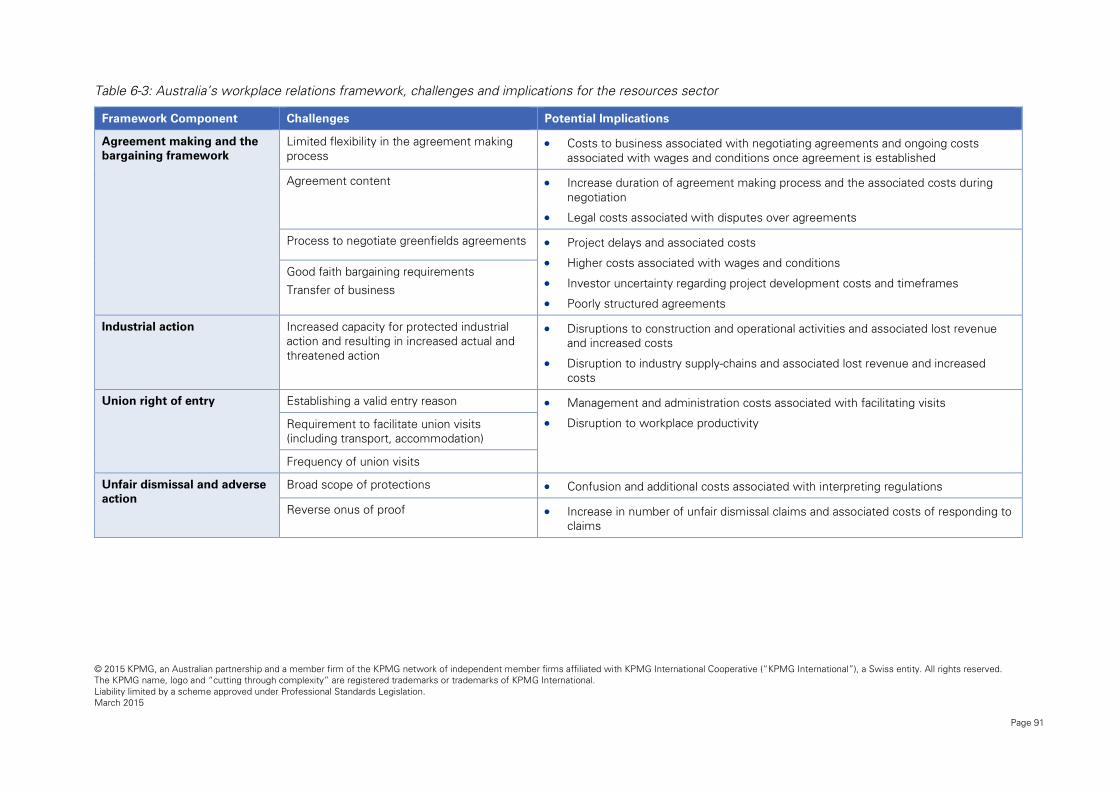
© 2015 KPMG, an Australian partnership and a member firm of the KPMG network of independent member firms affiliated with KPMG International Cooperative (“KPMG International”), a Swiss entity. All rights reserved. The KPMG name, logo and “cutting through complexity” are registered trademarks or trademarks of KPMG International. Liability limited by a scheme approved under Professional Standards Legislation. March 2015
Page 91
Table 6-3: Australia’s workplace relations framework, challenges and implications for the resources sector
Framework Component Challenges Potential Implications
Agreement making and the bargaining framework
Limited flexibility in the agreement making process
• Costs to business associated with negotiating agreements and ongoing costs associated with wages and conditions once agreement is established
Agreement content • Increase duration of agreement making process and the associated costs during negotiation
• Legal costs associated with disputes over agreements
Process to negotiate greenfields agreements • Project delays and associated costs
• Higher costs associated with wages and conditions
• Investor uncertainty regarding project development costs and timeframes
• Poorly structured agreements
Good faith bargaining requirements
Transfer of business
Industrial action Increased capacity for protected industrial action and resulting in increased actual and threatened action
• Disruptions to construction and operational activities and associated lost revenue and increased costs
• Disruption to industry supply-chains and associated lost revenue and increased costs
Union right of entry Establishing a valid entry reason • Management and administration costs associated with facilitating visits
• Disruption to workplace productivity Requirement to facilitate union visits (including transport, accommodation)
Frequency of union visits
Unfair dismissal and adverse action
Broad scope of protections • Confusion and additional costs associated with interpreting regulations
Reverse onus of proof • Increase in number of unfair dismissal claims and associated costs of responding to claims
© 2015 KPMG, an Australian partnership and a member firm of the KPMG network of independent member firms affiliated with KPMG International Cooperative (“KPMG International”), a Swiss entity. All rights reserved.
The KPMG name, logo and “cutting through complexity” are registered trademarks or trademarks of KPMG International.
Liability limited by a scheme approved under Professional Standards Legislation.
March 2015
Page 92
7 Potential changes to the workplace relations framework
Summary
AMMA has developed a series of potential reforms to the Australian workplace relations framework. These reforms aim to respond to the resources sector challenges associated with the current framework. The objectives of the proposed changes are to:
• increase flexibility in the agreement making and bargaining framework;
• minimise disruptions to production and exports associated with industrial action;
• clarify the circumstances and frequency of which unions can enter workplaces to minimise disruption to operations and the associated costs to resource sector businesses; and
• streamline employee protection processes and clarify specific issues in the workplace relations framework, which could help reduce uncertainty and costs to business.
In response to the challenges associated with the current workplace relations framework (outlined in the previous section), AMMA has developed a series of potential reforms to the current framework. The objectives of these reforms are summarised below.
Consistent with the challenges outlined in the previous section, these potential reforms relate to:
• agreement making and the bargaining framework;
• industrial action;
• union right of entry; and
• employee protections.
Statutory agreement making framework
AMMA has developed a series of potential reforms to the agreement making and bargaining framework. The objective of these changes is to increase the flexibility in the bargaining framework for employers in agreement making. These reform options are summarised in Box 7-1.
Increased flexibility in agreement making and the removal of certain conditions in the current bargaining framework has the potential to improve business efficiency and productivity in the broader economy. There are a number of potential benefits of enabling a range of workplace agreements – individual and collective – to be established between employees and employers, including:
• increase the flexibility of the system by making it easier to establish agreements;
• reduce the time taken to make agreements (hence reduce costs to workers and business); and
• increase certainty to employers, employees, customers and other stakeholders.
A key element of these reforms is aimed at greenfields agreements and providing alternatives in certain circumstances to mandatory bargaining with unions before employees have commenced employment.
© 2015 KPMG, an Australian partnership and a member firm of the KPMG network of independent member firms affiliated with KPMG International Cooperative (“KPMG International”), a Swiss entity. All rights reserved.
The KPMG name, logo and “cutting through complexity” are registered trademarks or trademarks of KPMG International.
Liability limited by a scheme approved under Professional Standards Legislation.
March 2015
Page 93
Box 7-1 Proposed AMMA reforms, statutory agreement making and bargaining framework
• Establishment of registered collective agreements, registered greenfields agreements and registered individual agreements.
• Limiting content of agreement to matters that pertain only to the employer-employee relationship.
• Enabling approval of agreements against a no disadvantage test.
• Transitional arrangements agreements for transfer of business.
• Enabling a longer nominal expiry date for agreements, particularly for greenfields agreements.
• Preventing industrial action during the life of an agreement.
• Introducing a rapid approvals process for agreements pertaining to employees above a high income threshold.
Source: AMMA
Industrial action
AMMA has developed a series of potential changes to protected industrial action regulations. These proposed changes aim to minimise interruptions to production and exports associated with industrial action. The proposed changes are summarised in Box 7-2.
Box 7-2 Proposed AMMA reforms, industrial action
• Limit industrial action to claims pertaining to the direct employer-employee relationship.
• Introduction of a public interest test to ensure industrial action is not contrary to the public interest.
• Greater clarity regarding definition of what action is protected and the maximum duration of action.
• Controls regarding threats of industrial action that are later withdrawn.
• Definition of instances where industrial action is permitted (i.e. extent of claims, workplace conditions and impacts on productivity).
• Introduction of a requirement for parties to be genuinely trying to reach an agreement linked to good faith bargaining.
• Limiting ability to take industrial action to those below a high income threshold.
Source: AMMA
The threat and incidence of protected industrial action has a significant impact on resources industry businesses and the broader economy by imposing costs and creating uncertainty for businesses, customers, employees and other stakeholders. Improving the framework that defines industrial action has the potential to reduce uncertainty and improve the attractiveness of the Australian resources sector for investors. This has implications for the cost of capital and potentially the viability and competitiveness of major resources projects.
© 2015 KPMG, an Australian partnership and a member firm of the KPMG network of independent member firms affiliated with KPMG International Cooperative (“KPMG International”), a Swiss entity. All rights reserved.
The KPMG name, logo and “cutting through complexity” are registered trademarks or trademarks of KPMG International.
Liability limited by a scheme approved under Professional Standards Legislation.
March 2015
Page 94
Union right of entry
AMMA has developed a series of potential changes to clarify the circumstances and frequency of which unions can enter workplaces. The objective of these changes is to minimise disruption to operations and the associated costs to resource sector businesses. The proposed changes are summarised in Box 7-3.
Box 7-3 Proposed AMMA reforms, union right of entry
• Limit right of entry for discussion purposes to only those who are party to an existing agreement or are attempting to reach an agreement.
• Introduction of a code of conduct and revocation of permit if conditions are breached.
• Consequences for non-compliance with entry and safety requirements.
Source: AMMA
Union visits result in costs to businesses in attending to the associated regulatory and administrative requirements and the work disruption that is caused when escorting a union official through the premises. Greater clarity regarding the circumstances under which union officials can enter the work place – to attend to matters of genuine need – could reduce the regulatory burden and cost imposed on businesses and increase oversight and certainty around business planning for employers and employees.
A number of the changes proposed by AMMA are broadly consistent with the findings and recommendations of the recent review of the Fair Work Act (2009) in relation to having improved mechanisms for managing the frequency of union entry.
The review highlighted that, if implemented, the recommendations regarding disputes about the frequency of visits could result in a reduction in the frequency and associated costs of union visits. These implications are investigated in further detail in the following sections.
Employee Protections
AMMA has developed a series of proposed reforms to address employee protection issues, largely by streamlining processes associated with each issue. The proposed changes are summarised in Box 7-4.
Box 7-4 Proposed AMMA reforms, other matters
• Ensure primary consideration for assessment of claims is whether there was a valid reason for termination.
• Ensure genuine redundancies are excluded from unfair dismissal claims.
• Limit ability to claim unfair dismissal for breaches of occupational health and safety, physical violence, harassment or misconduct.
• Expand existing code to ensure that Fair Dismissal Code/Procedural Fairness Code covers all businesses.
• Higher fees for applications and hearings.
• Limit ability to claim to those who earn below a high income threshold (for both adverse action and unfair dismissal).
• For adverse action, introduce statutory caps for compensation and a ‘genuine reasons’ defence.
Source: AMMA

© 2015 KPMG, an Australian partnership and a member firm of the KPMG network of independent member firms affiliated with KPMG International Cooperative (“KPMG International”), a Swiss entity. All rights reserved.
The KPMG name, logo and “cutting through complexity” are registered trademarks or trademarks of KPMG International.
Liability limited by a scheme approved under Professional Standards Legislation.
March 2015
Page 95
These proposed changes are intended to:
• clarify exemptions that would not be subject to unfair dismissal processes and streamline the process through institutional changes;
• simplify the process for dealing with adverse actions; and
• remove the ability of individuals with incomes above a high income threshold from being able to make unfair dismissal or adverse action claims.
The proposed changes are intended to streamline processes and clarify specific issues in the workplace relations framework, which could help reduce uncertainty and costs to business. This could have broader implications for productivity levels within the economy and encourage employment.
Clarifying elements of the workplace relations framework can reduce uncertainty and, as a result, costs for business. Providing exemptions for unfair dismissal, if the individual has been involved in physical violence or sexual harassment, would reduce uncertainty and save time, as it would clarify the immediate options available to the employer, and preclude going through a lengthy process.
A number of the changes proposed by AMMA are consistent with the findings and recommendations of the recent review of the Fair Work Act (2009), including:
• requiring applicants to provide more details about the circumstances of the dismissal in initial documentation; and
• requiring the central consideration of the reason for adverse action to be the subjective intention of the person taking the alleged action.
Summary of potential changes
A summary of the potential changes to the Fair Work Act (2009) proposed by AMMA are outlined in Table 7-1.
Table 7-1: Summary of proposed reforms to the workplace relations framework
Reform area Summary of proposed reforms
Agreement making and bargaining framework
The proposed reforms aim to reduce impediments and provide assistance to negotiate workplace agreements at the individual and enterprise level. This aims to assist by providing additional flexibility, choice and reducing costs of negotiations. The objective of the proposed changes is to make it easier to make agreements that maximise the utility of both negotiating parties.
Protected industrial action
The proposed reforms aim to reduce the circumstances under which employees and their representatives can threaten and/or take protected industrial action. The objective of the proposed changes is to reduce interruptions to production and the associated costs, including those associated with contingency planning.
Union right of entry The proposed reforms aim to minimise the frequency of union visits and the associated costs resulting from management of these visits and interruptions to production.
Unfair dismissal The proposed reforms aim to simplify the process for dealing with unfair dismissal applications and provide a set of accepted exemptions (such as physical violence), where unfair dismissal rights would not apply. The changes aim to reduce the costs to businesses associated with managing claims.
Adverse action The proposed reforms aim to simplify and streamline the process for dealing with adverse actions and provide a ‘genuine reasons’ defence for businesses. The objective of the proposed changes is to provide businesses with greater clarity in management of operations.
Source: AMMA

© 2015 KPMG, an Australian partnership and a member firm of the KPMG network of independent member firms affiliated with KPMG International Cooperative (“KPMG International”), a Swiss entity. All rights reserved.
The KPMG name, logo and “cutting through complexity” are registered trademarks or trademarks of KPMG International.
Liability limited by a scheme approved under Professional Standards Legislation.
March 2015
Page 96
8 Economic implications of changes in workplace relations
Summary
The current challenges associated with the Australian workplace relations framework have a number of implications for business, industry and economy-wide performance. The proposed AMMA options aim to address the challenges and support favourable economic outcomes, including continued investment in resources projects, improved operational efficiencies and employment growth.
Investment in major resources projects has historically been a major driver of economic growth. Australia faces a number of challenges in competing with international jurisdictions to attract investment in major resources projects. Australia’s competitiveness in expanding capacity has diminished. The current workplace relations framework is one factor that has the ability to impact investment to major resource projects through the greenfields agreement making process and associated delays, and disruption and delays to projects associated with industrial action.
Consultation with AMMA members suggests that the current greenfields agreement making process has the potential to result in higher labour costs and potential delays to major resources projects. Removing delays due to greenfields agreement making negotiations could result in a reduction in project costs of over 3 per cent.
Industrial action has the potential to cause delays to project development. Consultation with industry suggests that, on large resource projects, industrial action by even a small number of workers can have significant financial implications. These costs range from $1 million to $10 million per day of action. Consultation with resource sector businesses identified that the proposed AMMA reform options have the potential to reduce the risks of actual and threatened industrial action and the associated risks to project timelines and costs.
Australia competes internationally in the trade of major commodities, however, Australia’s competitiveness has declined in recent years with the cost of production for many commodities rising faster than the global average. The current workplace relations contributes to higher production costs through:
• delays, uncertainty and higher labour costs associated with the current agreement making framework;
• disruption to project construction due to industrial action;
• the costs of managing union visits; and
• costs of managing and responding to claims of unfair dismissal.
Consultation with industry highlighted that there are a number of costs associated with negotiating agreements. These costs vary between businesses and depend largely on the duration of the negotiation process. Consultation with industry suggests that the duration of negotiations range from a few months to multiple years in the extreme. In addition to the agreement making process, agreement content can add to production costs through the introduction of inflexibilities.
Strikes and other industrial action can impact productivity and industry competitiveness. In addition, industrial action has adverse impacts for labour productivity and overall competitiveness of the sector through its ability to be used to leverage higher wages and conditions. Consultation with resource industry businesses indicated that the proposed AMMA reform options have the potential to reduce the level of industrial action and associated costs.
Consultation with resource sector businesses has highlighted that the rate of union visits has increased since the introduction of the Fair Work Act (2009). Consultation with AMMA members indicates that the average number of union visits to resources sector business varies significantly between businesses and

© 2015 KPMG, an Australian partnership and a member firm of the KPMG network of independent member firms affiliated with KPMG International Cooperative (“KPMG International”), a Swiss entity. All rights reserved.
The KPMG name, logo and “cutting through complexity” are registered trademarks or trademarks of KPMG International.
Liability limited by a scheme approved under Professional Standards Legislation.
March 2015
Page 97
is generally higher for construction projects than operations, the management and administration time per visit ranges from three to 15 hours per visit.
The number of unfair dismissal claims have increased significantly since the introduction of changes through the Fair Work Act (2009). Consultation with industry indicates that adverse action or unfair dismissal claims are received for between 20 and 40 per cent of terminations. Employee protections, such as unfair dismissal, result in legal, compensation and administrative costs to businesses. Consultation with resources industry businesses indicated that the proposed AMMA reforms have the potential to reduce the number of claims.
The proposed AMMA reform options aim to address these challenges and support favourable economic outcomes, including:
• ensuring a stable environment for investment in major projects;
• supporting growth in industry productivity and minimising potential for wage inflation;
• enhancing equity and flexibility in the workplace;
• reducing costs to business and improving competitiveness; and
• supporting continued growth in employment.
The economic implications of the current resources sector challenges associated with the workplace relations framework are illustrated in Figure 8-1.
Figure 8-1: Economic implications of current framework
Source: KPMG analysis
The following section discusses the potential economic implications of changes in the workplace relations framework consistent with the proposed AMMA reforms.
Consistent with the economic implications outlined in Figure 8-1, the following sections focus on these key areas:
• project investment;
• competitiveness and productivity; and
• employment.

© 2015 KPMG, an Australian partnership and a member firm of the KPMG network of independent member firms affiliated with KPMG International Cooperative (“KPMG International”), a Swiss entity. All rights reserved.
The KPMG name, logo and “cutting through complexity” are registered trademarks or trademarks of KPMG International.
Liability limited by a scheme approved under Professional Standards Legislation.
March 2015
Page 98
There is limited quantitative evidence available to enable empirical analysis of the economic impacts. Accordingly, analysis of the economic implications relies on historic information on the relationship between changes in workplace relations over time and labour market and economic variables. This historical information was supplemented with consultation with resources sector employers who provided anecdotal information and cost estimates on the impacts of changes in workplace relations on their businesses.
Consultation and consideration of the implications of changes in the workplace relations framework is limited to resources sector businesses. It is recognised that changes in the workplace relations framework would have broader implications for workers and other sectors of the economy. These implications are not the focus of this analysis and are not analysed in detail.
Project investment
Investment in major resources projects has historically been a major driver of economic growth. As outlined in Section 4, over the last decade, investment spending by the resources sector increased from 2 per cent to 8 per cent of GDP. This investment has depended heavily on foreign sources of investment.
The significance of mining industry investment is illustrated in Chart 8-1.
Chart 8-1: Mining and non-mining share of industry investment (actual expenditure)
Source: ABS 2014d, Private New Capital Expenditure and Expected Expenditure, Australia, Cat. No. 5625.0
As outlined in Section 5, Australia faces a number of challenges in competing with international jurisdictions to attract investment in major resources projects. Australia’s competitiveness in expanding capacity has diminished. For example:
• To develop additional coal capacity, Australia is 54 per cent more expensive than the global average.
• Construction wages in Australia increased two and a half times faster than the national average, significantly higher than the increase in the US and Canada.
The current workplace relations framework is one factor that impacts the ability to attract investment to major resource projects. It does this through:
• the greenfields agreement making process and associated delays, uncertainty and higher labour costs; and
-
10
20
30
40
50
60
70
80
90
100
Sha
re o
f In
dust
ry In
vest
men
t (%
)
Mining Non-Mining
© 2015 KPMG, an Australian partnership and a member firm of the KPMG network of independent member firms affiliated with KPMG International Cooperative (“KPMG International”), a Swiss entity. All rights reserved.
The KPMG name, logo and “cutting through complexity” are registered trademarks or trademarks of KPMG International.
Liability limited by a scheme approved under Professional Standards Legislation.
March 2015
Page 99
• disruption to project construction and associated delays to completion timelines and costs due to industrial action.
Changes in the level of investment in the resources sector has potential implications for the construction side of the industry and the services that support construction. The implications of the current framework and potential changes for resource sector investment are considered in the following sub-sections.
8.1.1 Greenfield agreement making and the bargaining framework
Workplace relations uncertainty or instability resulting from the greenfields agreement process has the potential to impact the investment pipeline, which has flow-on effects onto the broader economy. As highlighted in recent analysis:
“Greenfields bargaining practices mean that the commencement of projects can be delayed or possibly abandoned. Alternately, employers may be forced to agree to claims that are economically unsustainable… An employer may proceed with a new project without a greenfields agreement in place and negotiate an enterprise agreement when employees commence working on the project. This alternative… may result in protected industrial action early in the life of the enterprise, leading to scheduling and cost blowouts.118”
The current framework poses a significant risk to future investment in major projects. Specifically:
“…there is a significant risk that some bargaining practices and outcomes associated with greenfields agreements potentially threaten future investment in major projects in Australia. This is because the existing provisions effectively confer on a union (or unions) with coverage of a majority of prospective workers a significant capacity to frustrate the making of an appropriate greenfields agreement at all or at least in a timely way119.”
A number of resources sector businesses have indicated that the process to negotiate greenfields agreements has resulted in delays and additional costs to new projects. Negotiation of greenfields agreements has caused major delays to 20 per cent of projects since the removal of non-union greenfields agreements and minor delays to another 20 per cent of projects120. There are a number of costs associated with delays to projects, including:
• delays in project completion and commencement of production;
• cost of idle capital (e.g. machinery and equipment);
• extension of time claims by contractors;
• inability to meet future contracts of sale; and
• investor uncertainty resulting in decision not to invest.
118 Explanatory Memorandum to the Fair Work Amendment Bill 2014. 119 DEEWR 2012, Towards more productive and equitable workplaces: An evaluation of the Fair Work legislation, Department of Education, Employment and Workplace Relations. 120 Kates, S. 2013, op. cit.

© 2015 KPMG, an Australian partnership and a member firm of the KPMG network of independent member firms affiliated with KPMG International Cooperative (“KPMG International”), a Swiss entity. All rights reserved.
The KPMG name, logo and “cutting through complexity” are registered trademarks or trademarks of KPMG International.
Liability limited by a scheme approved under Professional Standards Legislation.
March 2015
Page 100
Figure 8-2: Greenfield agreement process and delays
Source: Fair Work Ombudsman
As at October 2014, the number and value of major project investment in Australia in minerals and energy was estimated by the BREE included:
• 59 projects at the Publicly Announced stage with a combined value of between $75.2 billion and $94.4 billion121;
• 138 projects at the Feasibility Stage with a combined value of $146.7 billion122;
• 44 projects are the Committed Stage with a combined value of $227.7 billion123; and
• five projects reached the Completed Stage with a combined value of $1.2 billion124 125.
Analysis of the potential impacts of project delays associated with the process for making greenfields agreements are summarised in Box 8-1.
Box 8-1: Impact of delays on project cash flows
• On average, 16 major resource and energy projects with a total investment of $700 million move from the ‘Feasibility Stage’ to the ‘Committed’ stages each year. On average, 10 of these are new projects that require greenfields agreements.
• An estimated 40 greenfields agreements are in operation for each major project.
• Shortening delay due to greenfields negotiations by two months would save $4.6 million in net present value terms.
121 Projects at the Publicly Announced Stage are those that are in the very early stage of planning (i.e. pre-feasibility). 122 Projects at the Feasibility Stage have completed an initial feasibility study and results support further development. 123 All commercial, engineering and environmental studies are complete and all regulatory approvals and financing is finalised. 124 Construction and commissioning activities are largely complete and an initial commercial level of production has commenced. 125 Barber, J., Penney, K., Witteveen, B. 2014, Resources and Energy Major Projects, October 2014, Bureau of Resources and Energy Economics, November.

© 2015 KPMG, an Australian partnership and a member firm of the KPMG network of independent member firms affiliated with KPMG International Cooperative (“KPMG International”), a Swiss entity. All rights reserved.
The KPMG name, logo and “cutting through complexity” are registered trademarks or trademarks of KPMG International.
Liability limited by a scheme approved under Professional Standards Legislation.
March 2015
Page 101
• Given the current number of projects and based on the assumption that half of all projects are delayed by greenfields negotiations, the total value of delays is estimated to be $23 million across five projects.
Source: DEEWR 2012, Towards more productive and equitable workplaces: An evaluation of the Fair Work legislation, Canberra
These delays and associated costs have the potential to diminish Australia’s competitiveness in attracting foreign investment in resources projects.
The proposed AMMA reform options have the potential to reduce delays in agreement making by extending the nominal expiry date for agreements pertaining to major projects and establishing registered greenfields agreements. This has the potential to reduce costs associated with delays incurred and improve the competiveness of Australia’s resources sector.
The analysis outlined in Box 8-1 indicates that removing delays due to greenfields agreement making negotiations could result in reduction in project costs of over 3 per cent. These funds could potentially be used to expand existing projects or redirected into other projects in Australia.
While the financial costs associated with delays are significant, they are likely to be marginal, relative to the ongoing high cost wage outcomes that are incurred throughout the life of the agreement. A recent analysis of the public infrastructure found that negotiation of greenfields agreements contributes to wage inflation on major projects. Specifically:
“Most recently, there has been concern that head contractors and unions find it expedient to secure certainty through negotiation of greenfields agreements incorporating excessive wages and conditions before tenders. A major issue is that such agreements have limited the capacity of subcontractors to form their own enterprise agreements with their own employees, and that such agreement have set the standard for subsequent agreements, inflating costs.126”
Consultation with industry indicates that when negotiating a greenfields agreement, the previous major project is generally used as a benchmark and starting point for negotiations. This has the effect of inflating the wages and conditions. The impact of benchmarking is evident in the salary increases in the offshore oil and gas industry illustrated in Chart 8-2.
126 Productivity Commission 2014, Public Infrastructure, Inquiry Report, Volume 2, August.
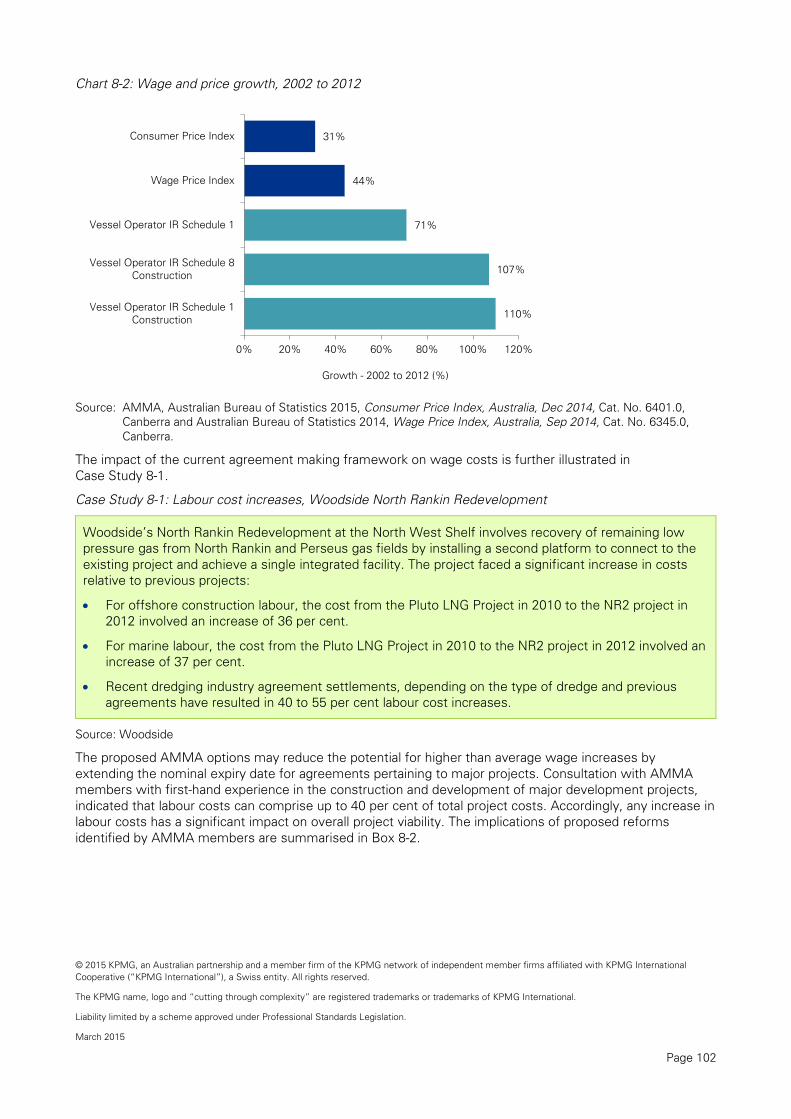
© 2015 KPMG, an Australian partnership and a member firm of the KPMG network of independent member firms affiliated with KPMG International Cooperative (“KPMG International”), a Swiss entity. All rights reserved.
The KPMG name, logo and “cutting through complexity” are registered trademarks or trademarks of KPMG International.
Liability limited by a scheme approved under Professional Standards Legislation.
March 2015
Page 102
Chart 8-2: Wage and price growth, 2002 to 2012
Source: AMMA, Australian Bureau of Statistics 2015, Consumer Price Index, Australia, Dec 2014, Cat. No. 6401.0,
Canberra and Australian Bureau of Statistics 2014, Wage Price Index, Australia, Sep 2014, Cat. No. 6345.0, Canberra.
The impact of the current agreement making framework on wage costs is further illustrated in Case Study 8-1.
Case Study 8-1: Labour cost increases, Woodside North Rankin Redevelopment
Woodside’s North Rankin Redevelopment at the North West Shelf involves recovery of remaining low pressure gas from North Rankin and Perseus gas fields by installing a second platform to connect to the existing project and achieve a single integrated facility. The project faced a significant increase in costs relative to previous projects:
• For offshore construction labour, the cost from the Pluto LNG Project in 2010 to the NR2 project in 2012 involved an increase of 36 per cent.
• For marine labour, the cost from the Pluto LNG Project in 2010 to the NR2 project in 2012 involved an increase of 37 per cent.
• Recent dredging industry agreement settlements, depending on the type of dredge and previous agreements have resulted in 40 to 55 per cent labour cost increases.
Source: Woodside
The proposed AMMA options may reduce the potential for higher than average wage increases by extending the nominal expiry date for agreements pertaining to major projects. Consultation with AMMA members with first-hand experience in the construction and development of major development projects, indicated that labour costs can comprise up to 40 per cent of total project costs. Accordingly, any increase in labour costs has a significant impact on overall project viability. The implications of proposed reforms identified by AMMA members are summarised in Box 8-2.
31%
44%
71%
107%
110%
0% 20% 40% 60% 80% 100% 120%
Consumer Price Index
Wage Price Index
Vessel Operator IR Schedule 1
Vessel Operator IR Schedule 8Construction
Vessel Operator IR Schedule 1Construction
Growth - 2002 to 2012 (%)

© 2015 KPMG, an Australian partnership and a member firm of the KPMG network of independent member firms affiliated with KPMG International Cooperative (“KPMG International”), a Swiss entity. All rights reserved.
The KPMG name, logo and “cutting through complexity” are registered trademarks or trademarks of KPMG International.
Liability limited by a scheme approved under Professional Standards Legislation.
March 2015
Page 103
Box 8-2: Potential reform outcomes, agreement making and wages and conditions
• Ensure that greenfields agreements are negotiated in a timely way and the protracted bargaining process and veto power of union officials are eliminated.
• Ensure that greenfields negotiation do not delay project commencement and completion or jeopardise investment in major projects.
• Improve certainty regarding project costs and timelines.
• Reduce costs associated with prolonged negotiations.
• Reduce costs associated with project delays.
• Limit the duration of negotiation and the associated costs and lost productive time during negotiation.
• Reduce conditions in agreements that potentially have a negative impact on productivity. Control the wage pressure associated with greenfields agreements and potential for delays and additional costs to resources projects.
Source: KPMG consultation with resources industry businesses
Overall, the proposed reforms to the greenfields agreement making process have the potential to reduce project delays and wage inflation.
8.1.2 Industrial action
In addition to delays due to greenfields negotiations, industrial action has the potential to cause delays to project development. The impact of industrial action on project delays and costs is demonstrated in Case Study 8-2.
Case Study 8-2: CFMEU v Woodside Burrrup Pty Ltd (Pluto project), 2010
Pluto project operator Woodside made an application under s.426 of the Fair Work Act (2009) to stop protected action being taken by the employees of one of its sub-contractors. Woodside applied as a third party experiencing ‘significant harm’ as a result of the strike. Woodside revealed it cost $3.5 million a day to keep the Pluto project running, which meant the potential economic loss of each day’s industrial action was $3.5 million given the flow-on effects and delays caused to other work on the project.
Evidence before Fair Work Australia outlined the following impact on Woodside which was either happening or threatened as a result of the industrial action:
• a delay in the commencement of the revenue stream from LNG sales estimated to be of several millions of dollars per day;
• an increase in the number of days it would take to complete the project and consequent costs to Woodside of $3.5 million per day to run the project and site-based services;
• costs from the extension of time to contractors and associated delays; and
• costs of additional resources brought in to finish the work within the allocated contract dates127.
Source: Woodside Energy
Consultation with industry suggests that, on large resource projects, industrial action by even a small number of workers can have significant financial implications. These costs range from $1 million to $10 million per day of action. In addition to protected industrial action, some businesses reported incidents of unlawful industrial action. On one major project, there were numerous incidents of unlawful action that
127 Submission to the Fair Work Act Review Panel, Woodside, 2012.
© 2015 KPMG, an Australian partnership and a member firm of the KPMG network of independent member firms affiliated with KPMG International Cooperative (“KPMG International”), a Swiss entity. All rights reserved.
The KPMG name, logo and “cutting through complexity” are registered trademarks or trademarks of KPMG International.
Liability limited by a scheme approved under Professional Standards Legislation.
March 2015
Page 104
resulted in over 50,000 hours of lost productive time. Industrial action has the potential to create uncertainty regarding the stability of projects, and negative relations in the workplace impacting on productivity.
On large resources projects, AMMA members indicated that they were heavily exposed to losses due to industrial action. Due to this exposure, resources sector businesses indicated that industrial action should only be permitted as a last resort. Additionally, a high income threshold would reduce industrial action on major construction projects.
Actual and threatened industrial action contributes to additional project costs. These costs include:
• costs of contingency;
• legal costs and management time associated with managing industrial disputes;
• direct costs of last productive activity; and
• downstream costs within the resources sector supply chain.
These costs have the potential to be detrimental to the total costs of project delivery.
The proposed AMMA options have the potential to reduce industrial action by:
• limiting the ability for industrial action to be taken during the life of an agreement;
• limiting the ability for industrial action if the claims being pursued do not pertain to the direct “employment relationship” between the employee and employer;
• a public interest test to ensure industrial action is not contrary to the public interest;
• definition of a maximum strike duration for each event;
• ensuring industrial action does not pertain to claims that are considered excessive;
• limiting ability for industrial action to instances when genuine bargaining is undertaken; and
• limiting industrial action to those below a high income threshold.
Consultation with resources sector businesses identified that the proposed AMMA reform options have the potential to reduce the risks of actual and threatened industrial action and the associated risks to project timelines and costs (outlined in Box 8-3).
Box 8-3: Potential reform outcomes, industrial action and project delays
• Reduction in incidence of industrial action and associated adverse impacts on project commencement and delivery timelines and costs of all reforms will have the most significant impact on business including business and client risks.
• Reduction in imbalance in negotiation due to the potential for significant economic losses associated with industrial action. This imbalance is a particular issue when negotiating agreements mid-project as industrial action has significant ramifications.
Source: KPMG consultation with resources industry businesses
Productivity and competitiveness
Australia competes internationally in the trade of major commodities. As outlined in Section 5, Australia’s competitiveness has declined in recent years. The cost of production for many commodities has risen faster than the global average. Relative to global competitors, the labour cost share is higher for Australian resources sector businesses. Accordingly, labour costs have a significant impact on the competitiveness of Australia’s resources sector.

© 2015 KPMG, an Australian partnership and a member firm of the KPMG network of independent member firms affiliated with KPMG International Cooperative (“KPMG International”), a Swiss entity. All rights reserved.
The KPMG name, logo and “cutting through complexity” are registered trademarks or trademarks of KPMG International.
Liability limited by a scheme approved under Professional Standards Legislation.
March 2015
Page 105
A broad range of factors have the potential to impact labour costs and productivity, including:
• management practices and innovation;
• development of human capital through skills enhancement;
• increased innovation and improvements in technology; and
• specialisation and trade.
The current workplace relations potentially impact labour costs and productivity through:
• the agreement making process and associated delays, uncertainty and higher labour costs;
• the costs associated with responding to and settling claims of unfair dismissals;
• the costs associated with managing union visits; and
• disruption to project construction and operation and associated delays and costs due to industrial action.
The following section provides an overview of the relationship between labour market reform and productivity and focuses on the potential impact of agreement making and industrial action on labour costs, competitiveness and productivity.
Productivity is the ratio of outputs to inputs in the production process. There are two common measures of productivity:
• Labour productivity – the output produced per hour of work; and
• Multifactor productivity (MFP) – the output produced per combined unit of labour and capital.
8.2.1 Labour market reform and productivity: An overview
In the late 1980s and early 1990s, there was a shift from a centralised wage-setting structure towards a decentralised system of bargaining. The purpose of decentralisation was to promote productivity through the influence of market forces and wage and condition diversity. This decentralisation was supported by the influential OECD ‘Jobs Strategy’, which took a largely de-regulatory stance on labour market institutions, and formed a blueprint for a workplace relations reform process in several countries128.
The OECD undertook analysis of the impact of workplace relations reform on productivity growth, noting that “the Jobs Strategy remains effective, but it needs refinement to meet future challenges”129. Among a host of recommendations, the analysis noted that “labour demand can be stimulated through flexible working-time arrangements agreed between the employer and employees… [and also that] labour demand is also enhanced by wage flexibility”130. Wage flexibility can be enhanced in a decentralised bargaining framework. Consequently, employers having greater flexibility in agreement making, with enhanced wage flexibility, could increase employment.
Analysis of the impact of changes in the workplace relations framework on the broader economy should be considered in the context of a number of changes to the Australian workforce over the last two decades. Specifically:
• the female share of the workforce has increased from 42 per cent to 46 per cent;
• the proportion of workers working in service industries has increased from 67 per cent to 72 per cent;
• mining and construction industry workforces have increased;
• manufacturing and agriculture sector workforces have declined;
128 OECD 1994, The Jobs Study, Facts, Analysis, and Strategies, Organisation for Economic Cooperation and Development. 129 OECD 2006, Boosting jobs and incomes: policy lessons from reassessing the OECD Jobs Strategy, Organisation for Economic Cooperation and Development, pp. 9. 130 Ibid.
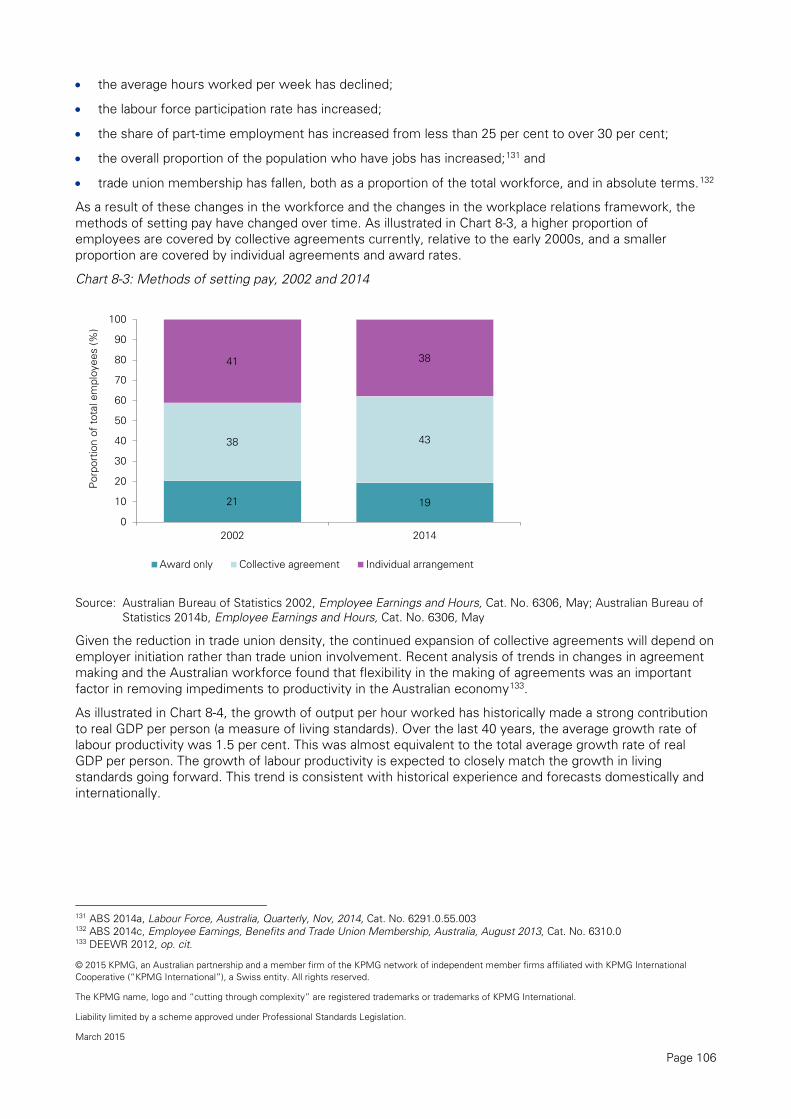
© 2015 KPMG, an Australian partnership and a member firm of the KPMG network of independent member firms affiliated with KPMG International Cooperative (“KPMG International”), a Swiss entity. All rights reserved.
The KPMG name, logo and “cutting through complexity” are registered trademarks or trademarks of KPMG International.
Liability limited by a scheme approved under Professional Standards Legislation.
March 2015
Page 106
• the average hours worked per week has declined;
• the labour force participation rate has increased;
• the share of part-time employment has increased from less than 25 per cent to over 30 per cent;
• the overall proportion of the population who have jobs has increased;131 and
• trade union membership has fallen, both as a proportion of the total workforce, and in absolute terms.132
As a result of these changes in the workforce and the changes in the workplace relations framework, the methods of setting pay have changed over time. As illustrated in Chart 8-3, a higher proportion of employees are covered by collective agreements currently, relative to the early 2000s, and a smaller proportion are covered by individual agreements and award rates.
Chart 8-3: Methods of setting pay, 2002 and 2014
Source: Australian Bureau of Statistics 2002, Employee Earnings and Hours, Cat. No. 6306, May; Australian Bureau of
Statistics 2014b, Employee Earnings and Hours, Cat. No. 6306, May
Given the reduction in trade union density, the continued expansion of collective agreements will depend on employer initiation rather than trade union involvement. Recent analysis of trends in changes in agreement making and the Australian workforce found that flexibility in the making of agreements was an important factor in removing impediments to productivity in the Australian economy133.
As illustrated in Chart 8-4, the growth of output per hour worked has historically made a strong contribution to real GDP per person (a measure of living standards). Over the last 40 years, the average growth rate of labour productivity was 1.5 per cent. This was almost equivalent to the total average growth rate of real GDP per person. The growth of labour productivity is expected to closely match the growth in living standards going forward. This trend is consistent with historical experience and forecasts domestically and internationally.
131 ABS 2014a, Labour Force, Australia, Quarterly, Nov, 2014, Cat. No. 6291.0.55.003 132 ABS 2014c, Employee Earnings, Benefits and Trade Union Membership, Australia, August 2013, Cat. No. 6310.0 133 DEEWR 2012, op. cit.
21 19
38 43
41 38
0
10
20
30
40
50
60
70
80
90
100
2002 2014
Por
port
ion
of t
otal
em
ploy
ees
(%)
Award only Collective agreement Individual arrangement
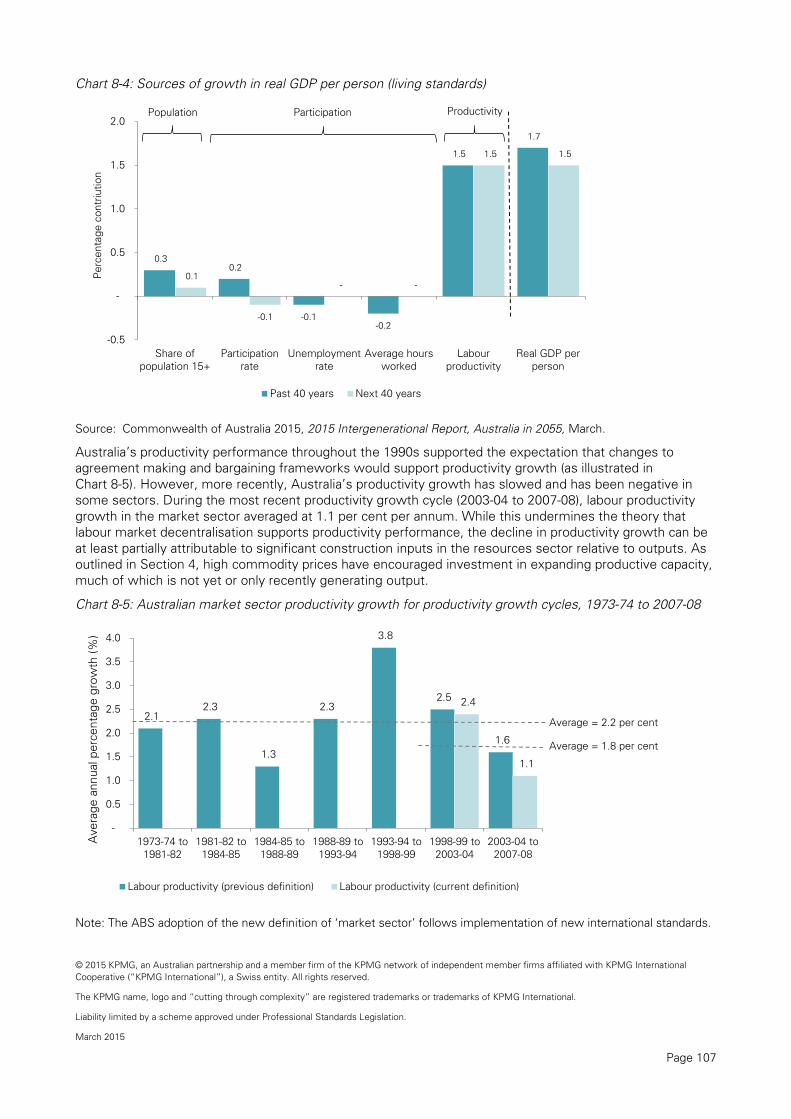
© 2015 KPMG, an Australian partnership and a member firm of the KPMG network of independent member firms affiliated with KPMG International Cooperative (“KPMG International”), a Swiss entity. All rights reserved.
The KPMG name, logo and “cutting through complexity” are registered trademarks or trademarks of KPMG International.
Liability limited by a scheme approved under Professional Standards Legislation.
March 2015
Page 107
Chart 8-4: Sources of growth in real GDP per person (living standards)
Source: Commonwealth of Australia 2015, 2015 Intergenerational Report, Australia in 2055, March.
Australia’s productivity performance throughout the 1990s supported the expectation that changes to agreement making and bargaining frameworks would support productivity growth (as illustrated in Chart 8-5). However, more recently, Australia’s productivity growth has slowed and has been negative in some sectors. During the most recent productivity growth cycle (2003-04 to 2007-08), labour productivity growth in the market sector averaged at 1.1 per cent per annum. While this undermines the theory that labour market decentralisation supports productivity performance, the decline in productivity growth can be at least partially attributable to significant construction inputs in the resources sector relative to outputs. As outlined in Section 4, high commodity prices have encouraged investment in expanding productive capacity, much of which is not yet or only recently generating output.
Chart 8-5: Australian market sector productivity growth for productivity growth cycles, 1973-74 to 2007-08
Note: The ABS adoption of the new definition of ‘market sector’ follows implementation of new international standards.
0.3 0.2
-0.1 -0.2
1.5
1.7
0.1
-0.1
- -
1.5 1.5
-0.5
-
0.5
1.0
1.5
2.0
Share ofpopulation 15+
Participationrate
Unemploymentrate
Average hoursworked
Labourproductivity
Real GDP perperson
Per
cent
age
cont
riutio
n
Past 40 years Next 40 years
2.1 2.3
1.3
2.3
3.8
2.5
1.6
2.4
1.1
-
0.5
1.0
1.5
2.0
2.5
3.0
3.5
4.0
1973-74 to1981-82
1981-82 to1984-85
1984-85 to1988-89
1988-89 to1993-94
1993-94 to1998-99
1998-99 to2003-04
2003-04 to2007-08
Ave
rage
ann
ual p
erce
ntag
e gr
owth
(%)
Labour productivity (previous definition) Labour productivity (current definition)
Population Participation Productivity
Average = 2.2 per cent
Average = 1.8 per cent
© 2015 KPMG, an Australian partnership and a member firm of the KPMG network of independent member firms affiliated with KPMG International Cooperative (“KPMG International”), a Swiss entity. All rights reserved.
The KPMG name, logo and “cutting through complexity” are registered trademarks or trademarks of KPMG International.
Liability limited by a scheme approved under Professional Standards Legislation.
March 2015
Page 108
Source: ABS 2014f, Experimental Estimates of Industry Multifactor Productivity, Australia, Cat. No. 5260.0, Canberra
Overall, Australia’s productivity performance and recent declines are likely to have been driven by a number of factors:
• weak growth in multifactor productivity relative to labour productivity;
• rapid acceleration of business investment and capital formation from around 2000-01;134
• high commodity prices resulting in an incentive to exploit lower quality and less productivity sources of minerals and energy;
• large and rapid increase in the mining sector workforce and resulting decline in average levels of experience;
• persistent drought resulting in lower contribution of the agriculture sector; and
• changes in industry composition in the economy.
Overall, the impacts of workplace relations reforms on productivity growth in Australia suggest that the implications are unclear. A number of analyses have concluded that there is some correlation between labour productivity levels and labour market reforms, although the causal relationship is unclear. While there is limited causal evidence of impacts on productivity in Australia, there is evidence of this link internationally. Analysis of the link between labour market institutions and multifactor productivity in 18 OECD countries found that the level of labour market deregulation had a positive impact on productivity135. Drawing on the international research, the Australian Treasury estimated, in 2005, that “reforming Australia’s employment protection legislation may reduce the productivity gap by about 2 percentage points136”.
Recognising the importance of productivity for continued growth in Australia’s living standards, the 2012 review of the Fair Work Act (2009) highlighted the importance of minimising constraints on flexibility and removing impediments to productive workplace relations. The review highlighted that improving productivity and enhancing workplace equity are not conflicting goals or mutually exclusive137.
The following sub-sections investigate the link between productivity and reforms to the workplace relations framework.
8.2.2 Agreement making and the bargaining framework
The reforms proposed by AMMA (outlined in Section 7) aim to increase flexibility in the agreement making framework. Increased flexibility in the agreement making and bargaining framework is likely to have a number of implications for employers and employees in the resources sector and more broadly. The major implications of this reform are that it could improve choice for both resources sector employers and employees, and improve productivity. Specifically, competitiveness and productivity could be improved through a number of channels:
• reduction in the costs associated with negotiating an agreement;
• ability to incorporate productivity improvements in agreements; and
• a reduction in the ongoing costs associated with agreement outcomes.
Consultation with industry highlighted that there are a number of costs associated with negotiating agreements, including:
• management and administrative time spent planning and in negotiation meetings;
134As a share of GDP, business investment doubled over the decade from 2001-02 to 2011-12. The increase was accompanied by a sudden decline in productivity of capital in the ‘market sector’. 135 Scarpetta S. and Tressel T. 2012, Productivity and Convergence in a Panel of OECD Industries, OECD Economic Working Paper No. 342. 136 Rahman J. 2005, Comparing Australian and United States Productivity, Treasury Economic Roundup, Autumn. 137 DEEWR 2012, Towards more productive and equitable workplaces: an evaluation of the Fair Work legislation.

© 2015 KPMG, an Australian partnership and a member firm of the KPMG network of independent member firms affiliated with KPMG International Cooperative (“KPMG International”), a Swiss entity. All rights reserved.
The KPMG name, logo and “cutting through complexity” are registered trademarks or trademarks of KPMG International.
Liability limited by a scheme approved under Professional Standards Legislation.
March 2015
Page 109
• professional fees associated with advice on industrial relations;
• legal costs and representation for bargaining representatives;
• loss of productive time for bargaining representatives; and
• travel and accommodation costs associated with onsite negotiation.
These costs vary between businesses and depend largely on the duration of the negotiation process. Consultation with industry suggests that the duration of negotiations range from a few months to multiple years in the extreme. Often, the agreement making process requires multiple management and administrative staff focusing full time effort on the agreement process. Consultation with industry suggests that the estimated costs associated with negotiation can be between $0.5 million to $2 million per agreement (covering on average 80 to 800 workers), with many resource businesses having multiple agreements covering multiple sites.
The current transfer of business arrangements also result in upfront costs and ongoing workplace tension for some resources sector businesses. The transfer of business processes can cost in excess of $100,000 in legal and management advice. In addition, the disparity between agreements can cause tension among workers who receive different wages and conditions.
Consultation with industry indicates that the proposed AMMA reforms have the potential to reduce the costs associated with agreement making by:
• introducing modified registered collective and individual agreements;
• enabling agreements to be approved by the FWC (or equivalent) based on a no-disadvantage test against the safety net;
• extending the nominal expiry date on agreements and allowing options for extension of agreements; and
• introducing an expedited agreement process for workers above a high income threshold.
Some resources industry businesses have indicated that the limited requirement to link enterprise agreement outcomes to productivity improvements limits their ability to achieve efficiency gains. In particular, during negotiation of greenfields agreements, productivity improvement conditions are particularly difficult to obtain, with many resources industry businesses reporting that they agreed to certain conditions just to obtain an initial agreement and to ensure that the project progresses138. Over 80 per cent of AMMA members have attempted to negotiate productivity improvements in agreements but have been unsuccessful139. The inability to include productivity improvements in agreements potentially has adverse implications for achieving industry-wide productivity improvements. Some resources businesses indicated that they did not want to tie productivity to agreements and wanted to retain flexibility to make management decisions outside agreements.
Consultation with industry indicates that some agreement content proposed and, often conceded to, in negotiations had the potential to have a negative impact on productivity. This content includes:
• inflexible rosters;
• lockdown rostered days off;
• restrictions on working in inclement weather;
• mandated engagement of non-working union delegate;
• restrictions on a contractor’s ability to select and deploy sub-contractors; and
138 AMMA 2012, Submission to the Fair Work Act Review Panel on the Post-Implementation Review of the Fair Work Act 2009, February. 139 Kates, S. 2011, Workplace Relations Research Project Survey 3 Report, Report prepared for AMMA, RMIT University, April.

© 2015 KPMG, an Australian partnership and a member firm of the KPMG network of independent member firms affiliated with KPMG International Cooperative (“KPMG International”), a Swiss entity. All rights reserved.
The KPMG name, logo and “cutting through complexity” are registered trademarks or trademarks of KPMG International.
Liability limited by a scheme approved under Professional Standards Legislation.
March 2015
Page 110
• greater access for union officials.
Consultation with resources sector businesses indicated that the costs associated with collective agreement outcomes are higher than individual agreements. The primary driver of this cost is not wages. Rather, it is the conditions included in these agreements.
Consultation with industry suggests that the proposed AMMA reforms have the potential to reduce content in agreement that potentially restricts workplace flexibility. The proposed AMMA reforms limit content to matters that pertain to the direct relationship between the employer and the employee.
From an employee perspective, limitation on the content of agreements may be considered detrimental to their overall workplace conditions. The potential impacts on employees are not analysed in detail in this report.
8.2.3 Industrial action
It is broadly accepted that strikes and other industrial action can impact productivity and industry competitiveness. Accordingly, any developments that restrict the scope for organised industrial action could potentially improve productivity performance. Industrial action can influence competitiveness and productivity through:
• a loss of production and revenue for the employer;
• increased uncertainty around projects and work sites;
• lost income for workers; and
• pressure on wage inflation.
It is possible to estimate the costs associated with the days lost to industrial disputes based on the number of days lost and the average gross value added per worker in the sector. The cost of industrial disputes was estimated for the mining and construction sectors and is illustrated in Chart 8-6 and Chart 8-7. These estimates provide an indication of the cost to industry associated with industrial disputes.
The number and value of working days lost in the mining and construction industries has varied significantly over the period 2003 to 2013 (as illustrated in Chart 8-6 and Chart 8-7). The construction industry is illustrated recognising the significant resource related construction that occurred during this period. As noted above, the period corresponded with significant changes to the workplace relations landscape. Specific changes in the workplace relations framework and the changes in the costs associated with industrial action include:
• During the final three years of the operation of the Workplace Relations Act (1999), the average annual value of the days lost to industrial action in the mining industry was around $115 million. This loss was equivalent to 0.15 per cent of the industry GVA of mining.140 In the construction sector, this loss was equivalent to 0.06 per cent of construction industry GVA.
• During the operation of WorkChoices, the average annual value of the days lost to industrial action in the mining industry was around $27 million. This loss was equivalent to 0.03 per cent of the mining sector GVA, a decline of 78 per cent compared to the Workplace Relations Act (1999) regime. In the construction sector, this loss was equivalent to 0.01 per cent.
• During the operation of the Fair Work Act (2009) from 2009, the average annual value of the days lost to industrial action in the mining industry was around $81 million. This loss was equivalent to 0.08 per cent of the mining industry GVA, an increase of 138 per cent compared to the WorkChoices regime. In the construction industry, this loss was equivalent to 0.02 per cent.
140 ABS 2014a, op. cit.; ABS 2014e, op. cit.; ABS 2014f, Australian National Accounts: National Income, Expenditure and Product, September 2014, catalogue number 5206.0; and KPMG analysis.

© 2015 KPMG, an Australian partnership and a member firm of the KPMG network of independent member firms affiliated with KPMG International Cooperative (“KPMG International”), a Swiss entity. All rights reserved.
The KPMG name, logo and “cutting through complexity” are registered trademarks or trademarks of KPMG International.
Liability limited by a scheme approved under Professional Standards Legislation.
March 2015
Page 111
Chart 8-6: Value of days lost to industrial action in the mining industry
Source: ABS 2014a, op. cit.; ABS 2014e, op. cit.; ABS 2014f, op. cit.; KPMG analysis
Chart 8-7: Value of days lost to industrial action in the construction industry
Source: ABS 2014a, op. cit.; ABS 2014e, op. cit.; ABS 2014f, op. cit.; KPMG analysis
0.15
0.03
0.02
0.08
0.00
0.05
0.10
0.15
0.20
-
50
100
150
200
Sha
re o
f m
inin
g G
VA
(%)
Val
ue o
f los
t day
s ($
m)
Value of lost days (LHS) % of Mining GVA (RHS)
0.06
0.01 0.01
0.02
0.00
0.01
0.02
0.03
0.04
0.05
0.06
0.07
0.08
-
10
20
30
40
50
60
Sha
re o
f m
inin
g G
VA
(%)
Val
ue o
f los
t day
s ($
m)
Value of lost days (LHS) % of Constructuion GVA (RHS)

© 2015 KPMG, an Australian partnership and a member firm of the KPMG network of independent member firms affiliated with KPMG International Cooperative (“KPMG International”), a Swiss entity. All rights reserved.
The KPMG name, logo and “cutting through complexity” are registered trademarks or trademarks of KPMG International.
Liability limited by a scheme approved under Professional Standards Legislation.
March 2015
Page 112
In addition to these direct impacts, the disruptions flow through to other associated businesses and consumers. For example, one resources sector business estimated that the direct cost of industrial action was approximately $1,250 per worker per day, however, the costs to other businesses in the supply chain would be almost 10 times this cost.
Industrial action has adverse impacts for labour productivity and overall competitiveness of the sector through its ability to be used to leverage higher wages and conditions. The potential for industrial action to significantly influence wages and conditions is illustrated in the following case studies.
Case Study 8-3: Action against vessel operators
Historically, employers have bargained with the maritime unions on a collective or industry basis. Protected action was undertaken by the MUA against various vessel operators during 2009 and into 2010. During this dispute period, maritime unions were able to secure, on the basis of ongoing strike action, 37 per cent pay rises in addition to a $200 per day construction allowance in return for no productivity improvements commitments.
Two resource industry employers opposed secret ballot applications lodged by the MUA because of the exorbitant wage and conditions demands the union had on the table at the time, including an increased construction allowance from $87 to $500 per day.
Other vessel operators have submitted that MUA sought a 36 per cent wage increase for its members over three years which included a construction allowance in excess of $400 per day, with no link to productivity increases. Farstad outlined that the unsuccessful negotiations lasted for 14 months and the cost of the associated industrial action represented an exposure to Farstad of approximately $700,000 per day.
The MUA and its members took protected industrial action in the form of two 24 hour stoppages and three 48 hour stoppages (a total of eight full day stoppages), amounting to an approximate cost of $5.6 million for Farstad. In addition to the direct cost to Farstad, there were ramifications and costs to businesses that rely on Farstad services.
Source: AMMA and Farstad Shipping
Case Study 8-4: Teekay Marine Pty Ltd conciliation talks with maritime unions
In May 2014, the MUA threatened industrial action by its members at the Port of Port Hedland, Australia’s largest export port, due to the breakdown of conciliation talks between the towage provider Teekay Marine Pty Ltd and the maritime unions, including the MUA, for new Enterprise Bargaining Agreements.
BHP Billiton Iron Ore released a statement advising that any action by MUA members would have severe consequences for Australian exports and would damage the country’s international reputation, and its overall national interest. The statement estimated that the cumulative impact to exporters such as BHP Billiton, Fortescue Metals Group and Atlas Iron was about $100 million per day.
Source: BHP Billiton
Consultation with resources industry businesses indicated that the proposed AMMA reform options have the potential to reduce the level of industrial action and associated costs by:
• limiting the extent of claims that can result in protected industrial action;
• requiring industrial action to be subject to a public interest test;
• defining the maximum duration of industrial action; and
• limiting right to protected industrial action for workers over a high income threshold.
Businesses indicated that this would reduce the ability for industrial action to be used as a tool to leverage above average increases in wages and conditions.
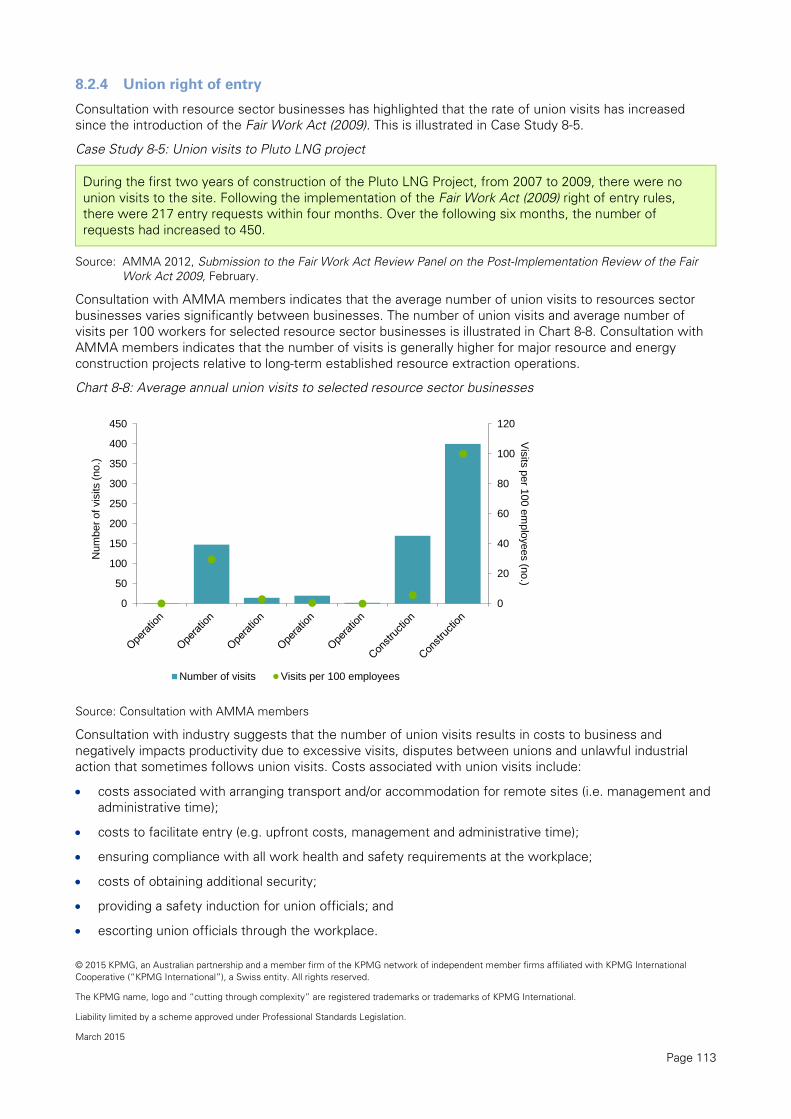
© 2015 KPMG, an Australian partnership and a member firm of the KPMG network of independent member firms affiliated with KPMG International Cooperative (“KPMG International”), a Swiss entity. All rights reserved.
The KPMG name, logo and “cutting through complexity” are registered trademarks or trademarks of KPMG International.
Liability limited by a scheme approved under Professional Standards Legislation.
March 2015
Page 113
8.2.4 Union right of entry
Consultation with resource sector businesses has highlighted that the rate of union visits has increased since the introduction of the Fair Work Act (2009). This is illustrated in Case Study 8-5.
Case Study 8-5: Union visits to Pluto LNG project
During the first two years of construction of the Pluto LNG Project, from 2007 to 2009, there were no union visits to the site. Following the implementation of the Fair Work Act (2009) right of entry rules, there were 217 entry requests within four months. Over the following six months, the number of requests had increased to 450.
Source: AMMA 2012, Submission to the Fair Work Act Review Panel on the Post-Implementation Review of the Fair Work Act 2009, February.
Consultation with AMMA members indicates that the average number of union visits to resources sector businesses varies significantly between businesses. The number of union visits and average number of visits per 100 workers for selected resource sector businesses is illustrated in Chart 8-8. Consultation with AMMA members indicates that the number of visits is generally higher for major resource and energy construction projects relative to long-term established resource extraction operations.
Chart 8-8: Average annual union visits to selected resource sector businesses
Source: Consultation with AMMA members
Consultation with industry suggests that the number of union visits results in costs to business and negatively impacts productivity due to excessive visits, disputes between unions and unlawful industrial action that sometimes follows union visits. Costs associated with union visits include:
• costs associated with arranging transport and/or accommodation for remote sites (i.e. management and administrative time);
• costs to facilitate entry (e.g. upfront costs, management and administrative time);
• ensuring compliance with all work health and safety requirements at the workplace;
• costs of obtaining additional security;
• providing a safety induction for union officials; and
• escorting union officials through the workplace.
0
20
40
60
80
100
120
0
50
100
150
200
250
300
350
400
450
Visits per 100 employees (no.)
Num
ber o
f vis
its (n
o.)
Number of visits Visits per 100 employees

© 2015 KPMG, an Australian partnership and a member firm of the KPMG network of independent member firms affiliated with KPMG International Cooperative (“KPMG International”), a Swiss entity. All rights reserved.
The KPMG name, logo and “cutting through complexity” are registered trademarks or trademarks of KPMG International.
Liability limited by a scheme approved under Professional Standards Legislation.
March 2015
Page 114
Consultation with resource sector businesses indicates that the management and administration time per visit ranges from three to 15 hours per visit.
Consultation with resources sector businesses indicated that the proposed AMMA reforms could potentially minimise interruptions to operations. Specifically, consultation suggests the proposed AMMA reforms would reduce these costs by:
• stipulating that the union needs to be covered by an agreement or be attempting to reach an agreement with the employer if they wish to enter to hold discussions with employees; and
• establishing a code of conduct for union permit holders.
This could reduce the administrative and compliance costs including the productive time lost during visits. A recent analysis estimated that each union visit result in costs to business equivalent to two hours of labour. Across 100 major projects, the cost saving associated with reducing union visits was estimated to be in excess of $5 million per year141.
8.2.5 Unfair dismissals and adverse action
As outlined in Section 7, the number of unfair dismissal claims have increased significantly since the introduction of changes through the Fair Work Act (2009). In addition, adverse action claims have increased in recent years as awareness of these protections have increased. Consultation with industry indicates that adverse action or unfair dismissal claims are received for between 20 and 40 per cent of terminations. Employee protections, such as unfair dismissal, result in legal, compensation and administrative costs to businesses. The process and associated potential costs of unfair dismissal are illustrated in Figure 8-3.
Figure 8-3: Unfair dismissals and associated costs to businesses
Source: Fair Work Commission, Unfair Dismissal - Guide 2, Flowchart on the process, Commonwealth of Australia
2014, April 2014 and consultation with resource industry employers.
141 Fair Work Amendment Bill 2013, Explanatory Memorandum
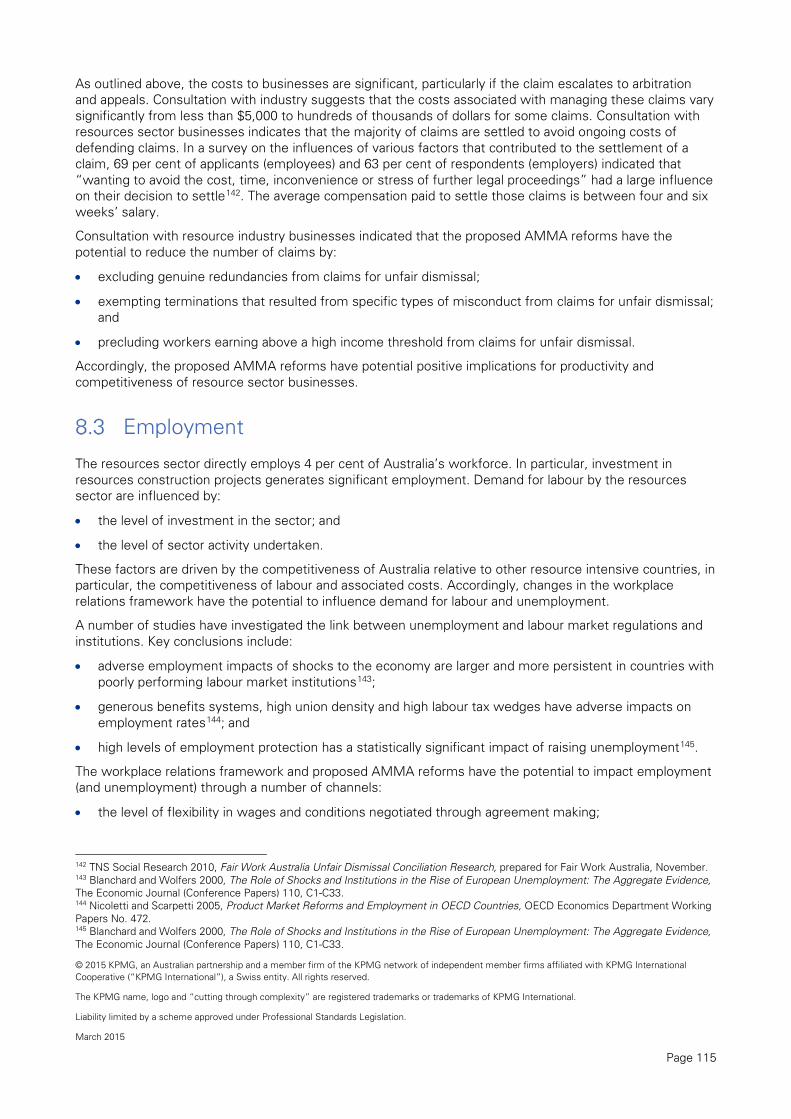
© 2015 KPMG, an Australian partnership and a member firm of the KPMG network of independent member firms affiliated with KPMG International Cooperative (“KPMG International”), a Swiss entity. All rights reserved.
The KPMG name, logo and “cutting through complexity” are registered trademarks or trademarks of KPMG International.
Liability limited by a scheme approved under Professional Standards Legislation.
March 2015
Page 115
As outlined above, the costs to businesses are significant, particularly if the claim escalates to arbitration and appeals. Consultation with industry suggests that the costs associated with managing these claims vary significantly from less than $5,000 to hundreds of thousands of dollars for some claims. Consultation with resources sector businesses indicates that the majority of claims are settled to avoid ongoing costs of defending claims. In a survey on the influences of various factors that contributed to the settlement of a claim, 69 per cent of applicants (employees) and 63 per cent of respondents (employers) indicated that “wanting to avoid the cost, time, inconvenience or stress of further legal proceedings” had a large influence on their decision to settle142. The average compensation paid to settle those claims is between four and six weeks’ salary.
Consultation with resource industry businesses indicated that the proposed AMMA reforms have the potential to reduce the number of claims by:
• excluding genuine redundancies from claims for unfair dismissal;
• exempting terminations that resulted from specific types of misconduct from claims for unfair dismissal; and
• precluding workers earning above a high income threshold from claims for unfair dismissal.
Accordingly, the proposed AMMA reforms have potential positive implications for productivity and competitiveness of resource sector businesses.
Employment
The resources sector directly employs 4 per cent of Australia’s workforce. In particular, investment in resources construction projects generates significant employment. Demand for labour by the resources sector are influenced by:
• the level of investment in the sector; and
• the level of sector activity undertaken.
These factors are driven by the competitiveness of Australia relative to other resource intensive countries, in particular, the competitiveness of labour and associated costs. Accordingly, changes in the workplace relations framework have the potential to influence demand for labour and unemployment.
A number of studies have investigated the link between unemployment and labour market regulations and institutions. Key conclusions include:
• adverse employment impacts of shocks to the economy are larger and more persistent in countries with poorly performing labour market institutions143;
• generous benefits systems, high union density and high labour tax wedges have adverse impacts on employment rates144; and
• high levels of employment protection has a statistically significant impact of raising unemployment145.
The workplace relations framework and proposed AMMA reforms have the potential to impact employment (and unemployment) through a number of channels:
• the level of flexibility in wages and conditions negotiated through agreement making;
142 TNS Social Research 2010, Fair Work Australia Unfair Dismissal Conciliation Research, prepared for Fair Work Australia, November. 143 Blanchard and Wolfers 2000, The Role of Shocks and Institutions in the Rise of European Unemployment: The Aggregate Evidence, The Economic Journal (Conference Papers) 110, C1-C33. 144 Nicoletti and Scarpetti 2005, Product Market Reforms and Employment in OECD Countries, OECD Economics Department Working Papers No. 472. 145 Blanchard and Wolfers 2000, The Role of Shocks and Institutions in the Rise of European Unemployment: The Aggregate Evidence, The Economic Journal (Conference Papers) 110, C1-C33.

© 2015 KPMG, an Australian partnership and a member firm of the KPMG network of independent member firms affiliated with KPMG International Cooperative (“KPMG International”), a Swiss entity. All rights reserved.
The KPMG name, logo and “cutting through complexity” are registered trademarks or trademarks of KPMG International.
Liability limited by a scheme approved under Professional Standards Legislation.
March 2015
Page 116
• approach to bargaining and agreement making; and
• unfair dismissal provisions and other employee protections.
8.3.1 Agreement making and bargaining
Wages and conditions set above the level of the marginal value the worker contributes to production has the potential to result in a reduction in demand for labour and higher unemployment. Similarly, if wage relativities between industries and businesses do not reflect the marginal value of work required, mismatches will occur between supply and demand for labour. This inflexibility in wage relativities is also likely to contribute to higher rates of unemployment in the economy.
As illustrated in Chart 8-9, between September 2009 and September 2014, the average hourly wages in the resources sector (excluding bonuses) increased by 25 per cent146. This compares to an increase of 21 per cent over the same period for all industries. This flexibility in the determination of wages was critical in the facilitation of the resources boom but also protected other industries of the economy from significant upward wage pressure.
Chart 8-9: Wage price index, mining and Australian average
Source: Australian Bureau of Statistics 2014, Wage Price Index, Australia, Sep 2014, cat. no. 6345.0, November.
As illustrated in Chart 8-10, the current wage price index in Australia varies between industries147. This flexibility in the determination of wages enables wages to reflect the marginal value of labour in specific industry sectors.
146 This wage increase likely understates the increase in average earnings in the resources sector due to the prevalence of bonuses and allowances introduced in the industry over the last decade. 147 The Wage Price Index (WPI) measures changes in the price of labour services resulting from market pressures, and is unaffected by changes in the quality or quantity of work performed. It is unaffected by changes in the composition of the labour force, hours worked or changes in characteristics of employees (e.g. work performance).
70
80
90
100
110
120
130
Wag
e P
rice
Inde
x
Mining All Industries (includes Mining)
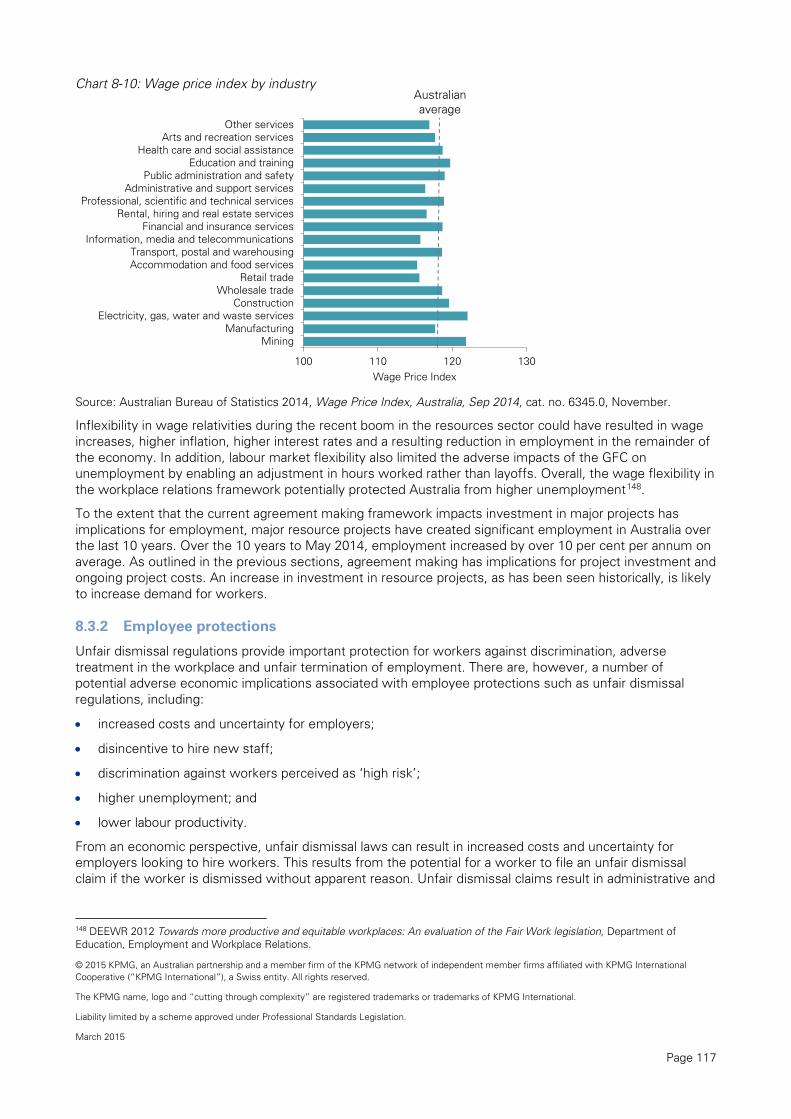
© 2015 KPMG, an Australian partnership and a member firm of the KPMG network of independent member firms affiliated with KPMG International Cooperative (“KPMG International”), a Swiss entity. All rights reserved.
The KPMG name, logo and “cutting through complexity” are registered trademarks or trademarks of KPMG International.
Liability limited by a scheme approved under Professional Standards Legislation.
March 2015
Page 117
Chart 8-10: Wage price index by industry
Source: Australian Bureau of Statistics 2014, Wage Price Index, Australia, Sep 2014, cat. no. 6345.0, November.
Inflexibility in wage relativities during the recent boom in the resources sector could have resulted in wage increases, higher inflation, higher interest rates and a resulting reduction in employment in the remainder of the economy. In addition, labour market flexibility also limited the adverse impacts of the GFC on unemployment by enabling an adjustment in hours worked rather than layoffs. Overall, the wage flexibility in the workplace relations framework potentially protected Australia from higher unemployment148.
To the extent that the current agreement making framework impacts investment in major projects has implications for employment, major resource projects have created significant employment in Australia over the last 10 years. Over the 10 years to May 2014, employment increased by over 10 per cent per annum on average. As outlined in the previous sections, agreement making has implications for project investment and ongoing project costs. An increase in investment in resource projects, as has been seen historically, is likely to increase demand for workers.
8.3.2 Employee protections
Unfair dismissal regulations provide important protection for workers against discrimination, adverse treatment in the workplace and unfair termination of employment. There are, however, a number of potential adverse economic implications associated with employee protections such as unfair dismissal regulations, including:
• increased costs and uncertainty for employers;
• disincentive to hire new staff;
• discrimination against workers perceived as ‘high risk’;
• higher unemployment; and
• lower labour productivity.
From an economic perspective, unfair dismissal laws can result in increased costs and uncertainty for employers looking to hire workers. This results from the potential for a worker to file an unfair dismissal claim if the worker is dismissed without apparent reason. Unfair dismissal claims result in administrative and
148 DEEWR 2012 Towards more productive and equitable workplaces: An evaluation of the Fair Work legislation, Department of Education, Employment and Workplace Relations.
100 110 120 130
MiningManufacturing
Electricity, gas, water and waste servicesConstruction
Wholesale tradeRetail trade
Accommodation and food servicesTransport, postal and warehousing
Information, media and telecommunicationsFinancial and insurance services
Rental, hiring and real estate servicesProfessional, scientific and technical services
Administrative and support servicesPublic administration and safety
Education and trainingHealth care and social assistance
Arts and recreation servicesOther services
Wage Price Index
Australian average

© 2015 KPMG, an Australian partnership and a member firm of the KPMG network of independent member firms affiliated with KPMG International Cooperative (“KPMG International”), a Swiss entity. All rights reserved.
The KPMG name, logo and “cutting through complexity” are registered trademarks or trademarks of KPMG International.
Liability limited by a scheme approved under Professional Standards Legislation.
March 2015
Page 118
legal costs to the employer and compensation costs if the claim is successful149. These effects are illustrated in Figure 8-4.
Figure 8-4: Economic implications of unfair dismissal laws
Source: Alexander Philipatos 2012, Back to the Bad Old Days? Industrial Relations Reform in Australia, CIS Policy
Monograph, pp. 133; KPMG analysis.
There is significant international evidence that indicates that higher levels of employment protection have an adverse impact on unemployment rates. Analysis of unfair dismissal regulations and unemployment rates for 18 OECD countries found that high levels of employment protection have a strong statistical effect on increasing unemployment persistence150. Dismissal regulations create disincentives for employers to fire employees. The current regulations mean that it is more cost effective to persevere with challenging employees in the long term, or invest to improve the productivity of a poorly performing employee. In addition to direct costs, stringent unfair dismissal laws can lead to higher than necessary unemployment rates as employers in volatile sectors (especially on capital intensive project-based work) are less likely to hire new workers. Recent research into the effects of dismissal regulation shows that dismissal costs may reduce dismissals during downturns but limit hiring during upturns because employers foresee future downturns and expect to incur costs for dismissals151. It is noted that there is limited evidence of the correlation between employment protection (such as unfair dismissal regulations) and unemployment in Australia.
There have been a number of studies that have sought to quantify the impact of unfair dismissal laws on unemployment. A survey of businesses undertaken in 2002 estimated that unfair dismissal laws reduced employment of workers on the average wage of 0.46 per cent and employment of workers on the minimum wage of 1 per cent152. An analysis of the impact of workplace relations reforms from 1993 to 2005 found that exempting smaller businesses from unfair dismissal laws is estimated to have reduced the structural unemployment rates by 0.27 percentage points153.
149 Philipatos.A, 2012, Back to the Bad Old Days? Industrial Relations Reform in Australia, CIS Policy Monograph, pp. 133 150 C Bean 2007, The Australian Economic Miracle: A view from the North, in The Economic Effects of Industrial Relations Reforms since 1993. 151 Benoit Freyens and Paul Oslington 2007, Dismissal Costs and their Impact on Employment: Evidence from Australian Small and Medium Enterprises, The Economic Record 83:260, March. 152 Harding 2002, The Effect of Unfair Dismissal Laws on Small and Medium Sized Businesses, Melbourne Institute of Applied Economic and Social Research, University of Melbourne. 153 Econtech 2007, The Economic Effects of Industrial Relations Reforms Since 1993, report prepared for the Australian Chamber of Commerce and Industry, July

© 2015 KPMG, an Australian partnership and a member firm of the KPMG network of independent member firms affiliated with KPMG International Cooperative (“KPMG International”), a Swiss entity. All rights reserved.
The KPMG name, logo and “cutting through complexity” are registered trademarks or trademarks of KPMG International.
Liability limited by a scheme approved under Professional Standards Legislation.
March 2015
Page 119
Chart 8-11: Unfair dismissal claim applications
Source: Australian Industrial Relations Commission 2009, Annual Report 2008-09; Fair Work Australia 2010, Annual
Report 2009-10; and Fair Work Australia 2011, Annual Report 2010-11.
Consultation with resources industry businesses highlighted that employers recognise the importance of employee protections such as adverse action and unfair dismissal laws. Some employers indicated that these protections were misused in some cases, resulting in additional costs to businesses. This additional cost to business has the potential to act as a disincentive to employ new workers.
Summary and key implications
Consultation and consideration of the implications of changes in the workplace relations framework is limited to resource sector businesses. It is recognised that changes in the workplace relations framework would have broader implications for workers and other sectors of the economy. These implications are not the focus of this analysis and are not analysed in detail.
Consultation with resources sector businesses indicated that the proposed AMMA reforms have the potential to impact on the operation and future growth of the sector. Specifically, the reforms have the potential to influence the sustainability of wages and conditions in the industry and the costs associated with managing workplaces. The reforms also have the potential to improve the stability and competitiveness of the Australian resources sector. These factors have the potential to impact the productivity of the sector and level of investment in major resource and energy projects. The economic implications of the proposed AMMA reforms are summarised in Table 8-1.
Resource sector labour productivity improvements have the potential to be gained through efficiencies in the agreement making process that result in a reduction in time spent negotiating agreements. There is also potential to increase business flexibility by removing conditions that restrict operational decisions from agreements. Productivity could also be improved through reducing the potential for industrial action and the associated working days lost as well as threat of industrial action during the bargaining process, which is disruptive to workplace productivity. In particular, limiting industrial action that causes severe economic losses has significant financial implications for resources businesses in terms of limiting immediate damages and reducing the potential for extraordinary influence of action in the bargaining process. Additionally, restricting union visits to only those representatives who are party to an agreement or involved in bargaining has the potential to reduce costs and disruptions associated with union visits.
6,7075,758
5,1736,067
7,994
11,116
12,840
14,02714,818 14,796
0
2,000
4,000
6,000
8,000
10,000
12,000
14,000
16,000
Unf
air d
ism
issa
l cla
ims
(no.
)

© 2015 KPMG, an Australian partnership and a member firm of the KPMG network of independent member firms affiliated with KPMG International Cooperative (“KPMG International”), a Swiss entity. All rights reserved.
The KPMG name, logo and “cutting through complexity” are registered trademarks or trademarks of KPMG International.
Liability limited by a scheme approved under Professional Standards Legislation.
March 2015
Page 120
Immediate gains to productivity may be possible through changes to aspects of the current framework that contribute to administrative and compliance costs. Modifications to employee protections have the potential to reduce the costs of responding to claims without diminishing protection for employees with genuine claims.
As outlined in Sections 4 and 5, Australia competes globally in the production of resources and in attracting funds for investment in resources and energy projects. Accordingly, the stability of workplace conditions and the cost of labour have the potential to influence the level of investment in the resources sector in Australia. Consultation with resources sector employers indicated that the proposed AMMA reforms have the potential to expedite and improve the greenfields agreement making process resulting in a reduction in project delays and associated costs. In addition, the proposed reforms have the potential to avoid future significant wage inflation that has been experienced historically in the sector. The reduction in delays and future wage inflation have the potential to contribute to an improvement in the competitiveness of Australia as an investment destination.
In addition to the improvement in competitiveness outlined above, consultation with industry indicates that there is potential to reduce the level of industrial action through reforms to the agreement making process and through the introduction of a higher income threshold.
To the extent that the proposed reforms influence labour productivity and project investment, there are potential implications for employment (and unemployment). An increase in economic activity resulting from additional investment in projects has the potential to result in an increase in demand for labour. These effects are investigated further and quantified in Section 9.

© 2015 KPMG, an Australian partnership and a member firm of the KPMG network of independent member firms affiliated with KPMG International Cooperative (“KPMG International”), a Swiss entity. All rights reserved.
The KPMG name, logo and “cutting through complexity” are registered trademarks or trademarks of KPMG International.
Liability limited by a scheme approved under Professional Standards Legislation.
March 2015
Page 121
Table 8-1: Economic implications of proposed AMMA reforms
Reform area Proposed reform Economic implications
Agreement making and the bargaining framework
• Extend nominal expiry date for agreements
• Increased flexibility in agreement making
• Limitation on the content of agreement that potentially has a negative impact of productivity
• Ensure timely negotiation of agreements and avoid protracted bargaining
• Introduction of an expedited agreement making and approvals process
• Reduce costs associated with delays during construction of major projects potentially resulting in higher investment
• Potential future increases in wages and conditions may be less costly improving Australia’s competitiveness as an investment destination
• Increase management control over operational decisions potentially contributing to productivity improvements
Industrial action • Limiting the ability for industrial action to be taken during the life of an agreement
• Limiting the ability for industrial action if the claims being pursued do not pertain to the direct “employment relationship” between the employee and employer
• A public interest test to ensure industrial action is not contrary to the public interest
• Definition of a maximum strike duration for each event
• Ensuring industrial action does not pertain to claims that are considered excessive
• Limiting ability for industrial action to instances when genuine bargaining is undertaken
• Limiting industrial action to those below a high income threshold
• Reduce the risk of actual and threaten industrial action and associated risks to project timelines and costs
• Reduction in employees ability to influence the bargaining process through industrial action
• Reduction in days lost to industrial action and associated loss of production
Union right of entry • Stipulating that the union needs to be covered by an agreement or be attempting to reach an agreement with the employer in order to enter to hold discussions with employees
• Establishing a code of conduct for union permit holders that must be adhered to in relation to entry for all circumstances
• Reduction in the administrative and compliance costs associated with union visits and productive time lost
Unfair dismissal and adverse action
• Excluding genuine redundancies from claims for unfair dismissal
• Exempting terminations that resulted from serious offences from claims for unfair dismissal
• Precluding workers earning above a high income threshold from claims for unfair dismissal regardless of agreement or award coverage
• Reduction in employee ability to make a claim for employee protection
• Reduction in costs associated with managing employee protections
Source: Consultation with resource sector businesses

© 2015 KPMG, an Australian partnership and a member firm of the KPMG network of independent member firms affiliated with KPMG International Cooperative (“KPMG International”), a Swiss entity. All rights reserved.
The KPMG name, logo and “cutting through complexity” are registered trademarks or trademarks of KPMG International.
Liability limited by a scheme approved under Professional Standards Legislation.
March 2015
Page 122
9 Quantitative analysis of changes in workplace relations
The previous sections highlighted the economic significance of the resources sector (Section 4) and discussed the potential economic implications of changes in the workplace relations framework (Section 8). The following section provides the results of quantitative analysis of the impact of proposed changes to the workplace relations framework on the resources sector and the economy as a whole.
CGE modelling approach and assumptions
To model the economic impacts beyond those that directly relate to the resources sector, it is necessary to employ a modelling technique that incorporates information about the linkages of the sector within the broader economic context. Input output (IO) tables published by the ABS provide detailed information on the upstream and downstream linkages in the economy.
• Upstream linkages refer to the sources of inputs to the resources sector. These linkages may be in the form of the use of intermediate inputs produced by other domestic industries, imported intermediate inputs, labour and other factors of production. For example, extraction and export of minerals uses inputs such as labour, machinery, fuel and services such as those of the transport industry. This can be thought of as information regarding the cost-side of the resources sector.
• Downstream linkages refer to those economic agents that purchase the resources sector’s output. For example, a construction business might purchase construction materials that it combines with other material inputs using labour and capital to build infrastructure. Consequently, downstream linkages include sales to other industries that use the output of the resources sector as an intermediate input to their own production process or final users of the product like households, the government or foreigners.
An IO table is a useful tool as a snapshot of the economic flows in the economy. An IO table can be used to provide simplified estimates of the sensitivity of the size of the economy and its components (measured by employment and value added) to small shocks within industries. An IO table itself is not an economic model, and IO multipliers are raw and ad hoc in nature. A major limitation of the use of IO multipliers when used to conduct impact analysis is that the relationship between industry inputs and outputs (the coefficients) are fixed, implying that industry structure remains unchanged by the shock to the industry (for example, a change in demand or prices). Furthermore, IO analysis imposes no resource constraints and so industries (and indeed the entire economy) can access unlimited supplies of inputs at fixed costs.
In actuality, scarcity of inputs (e.g. skilled labour, mineral deposits, etc.) mean that the inputs are affected by and respond to changes in prices (e.g. wages) driven by supply and demand adjustments. For example, higher prices/wages driven by the increase in demand for labour to expand resource extraction will, at the margin, increase costs in other sectors and reduce demand for labour by some other parts of the economy.
In IO analysis, where all adjustments relate only to quantities produced, this type of feedback response is not factored to occur, and it is assumed that sectors can access infinite amounts of inputs at fixed costs. Consequently, an IO model can result in an overstatement of the impacts on the economy. For these reasons, while the ABS did for some time publish IO multipliers, it has cease publishing these estimates in recent years over concerns about their validity.
A Computable General Equilibrium (CGE) model makes use of an IO table in the construction of its database, but is extended to make more sophisticated economic and behavioural assumptions, including:
• recognising resource constraints and responses of businesses and workers through adjusting prices/wages;

© 2015 KPMG, an Australian partnership and a member firm of the KPMG network of independent member firms affiliated with KPMG International Cooperative (“KPMG International”), a Swiss entity. All rights reserved.
The KPMG name, logo and “cutting through complexity” are registered trademarks or trademarks of KPMG International.
Liability limited by a scheme approved under Professional Standards Legislation.
March 2015
Page 123
• capturing employment/capital (and other factor inputs) substitution for example, by responding to higher wages by increasing the use of capital;
• capturing a much wider set of economic impacts such as behavioural responses to price changes of consumers, investors, foreigners, etc.; and
• can include the effects of factors such as technological change and shifts in consumer preferences.
By introducing these additional economic variables and constraints, CGE models are able to model beyond the first round impact of an event or policy, account for scarcity and understand the behavioural response to economic variables. This added sophistication means that a CGE model allows for feedback responses by producers, consumers, investors and foreigners and so the results are less likely to be overstated.
A CGE model is constructed as a system of equations that represent behavioural assumptions informed by economic theory, “accounting” relationships that quantify components of the economy, and the imposition of (for example) market-clearing (i.e. supply=demand) and zero-pure-profit (i.e. costs=revenues at the margin) assumptions that anchor aspects of economic behaviour in the longer run.
Scenarios for analysis
Analysis of Australia’s international competitiveness highlighted that Australia’s resources sector faces a number of challenges in terms of costs of production and delays to projects. Improving Australia’s competitiveness has the potential to make Australia’s average costs of production more competitive and increase the attractiveness of Australia as a destination for foreign investment.
The previous sections outlined findings of research on the potential economic implications of changes in the workplace relations framework. Overall, this research suggests that there is significant variation in the findings. However, it is broadly recognised in available literature that the workplace relations framework is critical to economic performance in Australia.
Assessing the impacts of reforms to the workplace relations framework involved review of available data, review of previous analyses and relevant literature and consultation with AMMA members. As noted previously, there is limited information available regarding the quantitative impacts of changes in workplace relations regulations. A number of previous studies have sought to quantify these impacts, specifically:
• An analysis of the impact on the construction industry of reforms to workplace relations the years to 2006 and the Fair Work Building and Construction (FWBC) Amendment 2012 found that the impact on productivity was 9.4 per cent154.
• Analysis of the impact of the introduction of the operation of the FWBC found that the impact on labour costs and multifactor productivity was 2 per cent155.
• An analysis of the impact of the reversal of all major workplace relations reforms in Australia since 1993. The analysis found that workplace relations reforms since 1993 (to WorkChoices) are estimated to have reduced the structural unemployment rate by approximately 1.77 percentage points. The reforms are also estimated to have increased labour productivity by 1.4 per cent. This labour productivity impact is expected to exclude the liberalisation of unfair dismissal laws156.
Further details on these previous analyses are outlined in Appendix B.
154 Independent Economics 2013, Economic Analysis of Building and Construction Industry Productivity: 2013 Update, report prepared for Master Builders Australia, August. 155 The Allen Consulting Group 2013, Economic impact of construction industrial relations arrangements and investment in infrastructure, report prepared for the Business Council of Australia, March. 156 Econtech 2007, The Economic Effects of Industrial Relations Reforms Since 1993, report prepared for the Australian Chamber of Commerce and Industry, July.

© 2015 KPMG, an Australian partnership and a member firm of the KPMG network of independent member firms affiliated with KPMG International Cooperative (“KPMG International”), a Swiss entity. All rights reserved.
The KPMG name, logo and “cutting through complexity” are registered trademarks or trademarks of KPMG International.
Liability limited by a scheme approved under Professional Standards Legislation.
March 2015
Page 124
Given the limited information available, the analysis relies heavily on anecdotal information provided by AMMA members.
It is important to note that the focus of the analysis is on the economic implications for resources sector businesses. It is recognised that the proposed AMMA options may have potential implications for employees and employee representatives. These implications were not considered in detail as a part of this analysis.
Based on the availability of information outlined above, to estimate the upstream and downstream linkages of the resource sector and to demonstrate the potential implications of changes in the workplace relations framework, illustrative scenarios were developed. Specifically, the following scenarios were considered:
• an increase in resources sector investment reflecting a reduction in delay and the associated costs as a result of changes to the greenfields agreement process and a reduction in industrial action; and
• an improvement in labour productivity in the resources sector resulting from a reduction in labour costs associated with the agreement making process, a reduction in days lost to industrial action, a reduction in the labour costs of union visits and a reduction in the costs of unfair dismissal claims.
Recognising that there is some uncertainty in the magnitude of the impact of changes in the workplace relations framework and that impacts are likely to be different over time, a range of impacts were estimated. Specifically, the following scenarios were modelled:
• Scenario 1: an increase in resources sector labour productivity of 5 per cent and an increase in resources sector investment of 8 per cent; and
• Scenario 2: an increase in resources sector labour productivity of 2 per cent and an increase in resources sector investment of 3 per cent; and
It is important to note that these scenarios were developed based on consultation with selected resources sector businesses. The actual impact will likely vary to the extent that these businesses are representative of the sector as a whole. Quantification of these scenarios were based on the maximum values. That is, the analysis assumes that all proposed reforms are successfully implemented. If only a subset of reforms are implemented, the impacts would likely be lower.
The composition of the factors driving these scenarios for analysis are outlined in Table 9-1.

© 2015 KPMG, an Australian partnership and a member firm of the KPMG network of independent member firms affiliated with KPMG International Cooperative (“KPMG International”), a Swiss entity. All rights reserved.
The KPMG name, logo and “cutting through complexity” are registered trademarks or trademarks of KPMG International.
Liability limited by a scheme approved under Professional Standards Legislation.
March 2015
Page 125
Table 9-1: Scenarios for analysis
Variable Scenario range
Justification a Further information
Resource sector labour productivity
2 – 5 per cent
• A reduction in costs of agreement making. Current agreement making costs range from approximately $150 per worker per annum to over $6,000 per worker per annum (approximately 0.1 to 4.8 per cent of labour costs).
Section 8.2.2
• An increase in productivity enhancing agreement content and reduction in impediments to productivity in agreement content (and associated costs).
Section 8.2.2
• Reduction in days lost to industrial action from current level to previous low level. Equivalent to a direct reduction of lost industry GVA of 0.08 in the mining sector and 0.02 per cent in the construction industry. In addition, the disruptions flow through to other associated businesses and consumers.
Section 8.2.3
• Reduction in claims (1 to 2 per 500 employees) resulting in a reduction in legal and compensation costs of $30,000 per claim. This represents a cost saving of $60 to $120 per employee per annum (approximately 0.05 to 0.09 per cent of total wages costs)
Section 8.2.5
• Reduction in the ability of industrial action to contribute to excessive inflation in wages and conditions. Section 8.2.3
• A reduction in costs associated with union visits. Current number of union visits range from approximately five per annum per 500 employees to 150 per annum per 500 employees. The average time taken to manage and facilitate visits is between three and 15 hours per visit. This represents a labour cost of between $1,000 and $150,000 per annum on average for every 500 workers (approximately less than 0.0 to 0.2 per cent of labour costs). The high number of union visits were generally in the construction side of the sector.
Section 8.2.4
Resource sector investment
3 – 8 per cent
• A reduction in project delay and associated costs due to greenfields agreement making process. According to recent analysis, 16 resource and energy projects with an investment value of $700 million move from the ‘Feasibility Stage’ to the ‘Committed’ stages each year. Approximately 10 of these projects require greenfields agreements with an estimated 40 greenfields agreements in operation for each major project. Analysis suggests reduction in the delay due to greenfields negotiations would save $4.6 million in NPV terms. This represents a saving of $23 million across five projects (3.3 per cent of total investment value).
Section 8.1.1
• A reduction in future wage inflation on major projects. Over the 10 years 2002 to 2012, WPI increased 44 per cent while wages agreed through greenfields increased 71 to 110 per cent. A differential of between 27 and 66 per cent (approximately 2.7 and 6.6 per cent per annum). This higher than average wage increase has implications for competitiveness of Australian resource and energy projects that compete globally for investment funds.
Section 8.1.1
• A reduction in actual or threatened industrial activity and the associated instability and uncertainty created. This has the potential to improve Australia’s position in competing globally for investment funds.
Section 8.1.2
a Share of total labour costs is based on current average earnings in the mining industry (approximately $130,000)
Source: KPMG analysis

© 2015 KPMG, an Australian partnership and a member firm of the KPMG network of independent member firms affiliated with KPMG International Cooperative (“KPMG International”), a Swiss entity. All rights reserved.
The KPMG name, logo and “cutting through complexity” are registered trademarks or trademarks of KPMG International.
Liability limited by a scheme approved under Professional Standards Legislation.
March 2015
Page 126
Macroeconomic impacts
As illustrated in Chart 9-1, an increase in both labour productivity and investment in the resources sector has a positive impact on GDP and employment. The impact of the reform scenarios on GDP is estimated to be between 0.8 and 2.0 per cent. This is equivalent, in current terms, to between $11.7 billion and $30.9 billion in GDP.
Chart 9-1: Impact on GDP and employment
Source: KPMG analysis
The impact of the reform scenarios on employment is estimated to be between 0.1 and 0.3 per cent. Based on current levels of employment, this is equivalent to between 14,000 and 36,000 jobs.
The labour productivity improvements have a number of potentially offsetting impacts. Specifically:
• As the workforce is more productive, the effective price of labour is lower. This encourages businesses to employ more workers. This is known as the substitution effect.
• Lower costs of production in the sector, due to a lower effective labour price, increases competitiveness which may stimulate additional demand for resources sector output. This additional demand results in an increase in demand for inputs to production, including both labour and capital. This is known as the output effect.
• As the workforce is more productive, fewer workers are required to produce each unit of output. This potentially results in a reduction in demand for labour relative to output and offsets the positive impacts above. This is known as the productivity effect.
The impact of the reform scenarios on employment is lower, relative to the impacts on GDP. This reflects the relative capital intensity of the resources sector.
The impact of the increase in resource sector investment and labour productivity on GDP components are illustrated in Chart 9-2.
2.0
0.3
0.8
0.1
0.0
0.5
1.0
1.5
2.0
2.5
Real GDP Employment
Cha
nge
(%)
Scenario 1 Scenario 2

© 2015 KPMG, an Australian partnership and a member firm of the KPMG network of independent member firms affiliated with KPMG International Cooperative (“KPMG International”), a Swiss entity. All rights reserved.
The KPMG name, logo and “cutting through complexity” are registered trademarks or trademarks of KPMG International.
Liability limited by a scheme approved under Professional Standards Legislation.
March 2015
Page 127
Chart 9-2: Impact on GDP components
Source: KPMG analysis
Employment and associated income flows through to a household consumption of between 0.7 and 1.8 per cent. The improved productivity, together with the direct increase in resources sector investment, has a positive impact on economy-wide investment of between 1.5 and 4.1 per cent. The reform scenarios also have a positive impact on trade. Export growth is largely attributable to additional activity in the resources sector as resources exports become more competitive globally. Imports are also higher as additional production inputs are required and demand for imported consumer goods increases in response to the growth in household consumption.
Industry impact
As discussed in the previous section, under the reform scenarios, resource sector activity increases in response to the increase in investment and productivity. A similar increase is seen in industries that supply the sector with inputs, as they face additional demand for their products as the resources sector activity increases. In particular, construction benefits from an increase in demand for its output, as the resources industry increases its investment in capital produced by this sector.
The industry distribution the GDP (value-added) and employment impacts are illustrated in Charts 9.3 and 9.4. The industry distributions highlight the inter-linkages through the Australian economy as resource sector investment and productivity increases.
1.8
4.1
1.5
2.1
0.7
1.5
0.6 0.8
-
0.5
1.0
1.5
2.0
2.5
3.0
3.5
4.0
4.5
Householdconsumption
Investment Exports Imports
Cha
nge
(%)
Scenario 1 Scenario 2
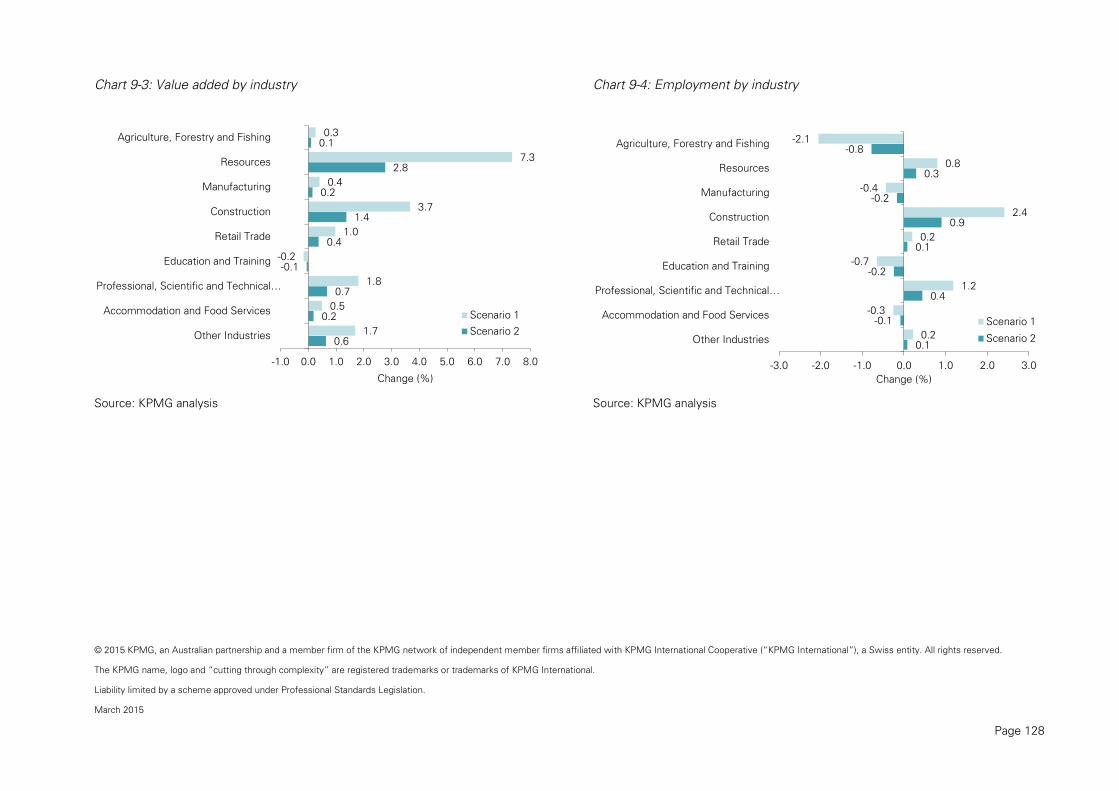
© 2015 KPMG, an Australian partnership and a member firm of the KPMG network of independent member firms affiliated with KPMG International Cooperative (“KPMG International”), a Swiss entity. All rights reserved.
The KPMG name, logo and “cutting through complexity” are registered trademarks or trademarks of KPMG International.
Liability limited by a scheme approved under Professional Standards Legislation.
March 2015
Page 128
Chart 9-3: Value added by industry
Source: KPMG analysis
Chart 9-4: Employment by industry
Source: KPMG analysis
0.3
7.3
0.4
3.7
1.0
-0.2
1.8
0.5
1.7
0.1
2.8
0.2
1.4
0.4
-0.1
0.7
0.2
0.6
-1.0 0.0 1.0 2.0 3.0 4.0 5.0 6.0 7.0 8.0
Agriculture, Forestry and Fishing
Resources
Manufacturing
Construction
Retail Trade
Education and Training
Professional, Scientific and Technical…
Accommodation and Food Services
Other Industries
Change (%)
Scenario 1
Scenario 2
-2.1
0.8
-0.4
2.4
0.2
-0.7
1.2
-0.3
0.2
-0.8
0.3
-0.2
0.9
0.1
-0.2
0.4
-0.1
0.1
-3.0 -2.0 -1.0 0.0 1.0 2.0 3.0
Agriculture, Forestry and Fishing
Resources
Manufacturing
Construction
Retail Trade
Education and Training
Professional, Scientific and Technical…
Accommodation and Food Services
Other Industries
Change (%)
Scenario 1
Scenario 2

© 2015 KPMG, an Australian partnership and a member firm of the KPMG network of independent member firms affiliated with KPMG International Cooperative (“KPMG International”), a Swiss entity. All rights reserved.
The KPMG name, logo and “cutting through complexity” are registered trademarks or trademarks of KPMG International.
Liability limited by a scheme approved under Professional Standards Legislation.
March 2015
Page 129
The value added impacts suggest that most industries benefit from the improvement in resources sector labour productivity and increase in investment. As expected, the primary impact is concentrated in the resources sector through the direct impacts on productivity and investment. The impact of the reform scenarios on resources sector value added is between 2.8 and 7.3 per cent. Some industries, such as construction and professional services, benefit through additional demand for goods and services that are inputs into resources sector production. In addition, sectors that depend on consumption or investment also benefit in response to an increase in demand for their goods and services. For example: retail trade value added impact is between 0.4 and 1 per cent. The positive benefits from increased economic activity to export-oriented or import competing industries (such as agriculture, education, manufacturing and accommodation services) are dampened somewhat as higher input prices and a higher exchange rate impacts on these industries competitiveness. Value added in the education and training industry declines slightly, likely due to the higher exchange rate influencing demand from international students.
Employment effects can be understood as generally following changes in output but with allowance for the different labour intensities in production. Industries that are more labour intensive, such as agriculture and manufacturing, experience larger employment impacts. In addition, these sectors are export-oriented (or import competing) and receive a smaller boost in economic activity. Accordingly, these sectors have reduced employment as jobs move into sectors that directly benefit from the boost to the resources sector.
Key findings and implications
Research and consultation suggests that there are a number of potential gains that could be achieved through reforms to Australia’s workplace relations framework. For the resources sector, these gains could primarily be achieved through improving the competitiveness of production and through increasing the attractiveness of Australia as a destination for foreign investment in expanding productive capacity.
In the short-term, reforms to the workplace relations framework could assist in facilitating immediate savings in the business costs associated with reductions in union visits and unfair dismissal claims. In the longer term, the additional flexibility and increased stability in the labour market contributes to continued growth in labour productivity and investment in the resources sector.
The growth in labour productivity and investment in the resources sector contributes to economy-wide growth in employment and economic activity in the Australian economy. As expected, the main impacts are concentrated in the resources sector. In addition, industries that supply the resources sector, such as construction in business services, benefit through additional demand from the resources sector growth. Associated with employment growth, households benefit through income growth. This flows through to household consumption and growth in industries that depend on consumption.

© 2015 KPMG, an Australian partnership and a member firm of the KPMG network of independent member firms affiliated with KPMG International Cooperative (“KPMG International”), a Swiss entity. All rights reserved.
The KPMG name, logo and “cutting through complexity” are registered trademarks or trademarks of KPMG International.
Liability limited by a scheme approved under Professional Standards Legislation.
March 2015
Page 130
Appendix A Industry definition
Subsector Industry Components
Resource extraction and services
• Coal mining
• Metal ore mining
• Exploration and other mining support services
• Oil and gas extraction
• Non-metallic mineral mining and quarrying
• Other mining support services
Resource-related manufacturing
• Industrial gas manufacturing
• Iron smelting and steel manufacturing
• Steel pipe and tube manufacturing
• Alumina smelting
• Other basic non-ferrous metal manufacturing
• Aluminium rolling, drawing and extruding
• Explosive manufacturing
• Iron and steel casting
• Alumina production
• Copper, silver, lead and zinc smelting and refining
• Non-ferrous metal casting
• Mining and construction machinery manufacturing
Resource-related construction
• Other heavy and civil engineering construction
• Structural and steel erection
• Site preparation

© 2015 KPMG, an Australian partnership and a member firm of the KPMG network of independent member firms affiliated with KPMG International Cooperative (“KPMG International”), a Swiss entity. All rights reserved.
The KPMG name, logo and “cutting through complexity” are registered trademarks or trademarks of KPMG International.
Liability limited by a scheme approved under Professional Standards Legislation.
March 2015
Page 131
Appendix B Previous economic analysis findings
Appendix Table B 1: Previous economic analyses of changes in workplace relations
Study Description Applicability Limitations
The Economic Effects of Industrial Relations Reforms since 1993157
Report prepared by Econtech for the Australian Chamber of Commerce (2007)
Analysis of the economic impact of reversal of all major workplace relations reforms in Australia since 1993.
The direct effect of the workplace relations arrangements were estimated based on recent studies by the OECD. These studies examine the impact of workplace relations policies and institutions on unemployment and labour productivity.
The analysis found that workplace relations reforms since 1993 (to WorkChoices) are estimated to have reduced the structural unemployment rate by approximately 1.77 percentage points. The percentage point reduction is comprised of:
• a 1.2 percentage point reduction in the unemployment rate associated with reduction in union density;
• a 0.3 percentage point reduction in unemployment associated with a shift from centralised to decentralised wage setting; and
• a 0.27 percentage point reduction in unemployment rate resulting from exempting smaller businesses from unfair dismissal laws.
The reforms are also estimated to have increased labour productivity by 1.4 per cent. This labour productivity impact is expected to exclude the liberalisation of unfair dismissal laws.
The analysis estimated that reversal of workplace relations reforms would result in a loss of potential output of 4.4 per cent in the long-term.
The analysis aims to measure the economic implications of a shift from a centralised and regulated process for setting wages and conditions, to a process that places greater emphasis on the specific circumstances facing the employer and employee. This is similar to the sentiment of the reforms proposed by AMMA.
The Econtech analysis does not consider the implications of the introduction of a High Income Threshold. This is a key component of the reforms proposed by AMMA.
157 Econtech 2007, The Economic Effects of Industrial Relations Reforms Since 1993, report prepared for the Australian Chamber of Commerce and Industry, July.

© 2015 KPMG, an Australian partnership and a member firm of the KPMG network of independent member firms affiliated with KPMG International Cooperative (“KPMG International”), a Swiss entity. All rights reserved.
The KPMG name, logo and “cutting through complexity” are registered trademarks or trademarks of KPMG International.
Liability limited by a scheme approved under Professional Standards Legislation.
March 2015
Page 132
Study Description Applicability Limitations
Economic Analysis of Building and Construction Industry Productivity: 2013 Update (2013)158
Report prepared for Master Builders Australia
Analysis of the impact on productivity of industry reforms, including:
• regulation of the industry by both the Building Industry Taskforce and its successor the Australian Building and Construction Commissioner (ABCC);
• workplace relations reforms in the years to 2006 and the Fair Work Building and Construction (FWBC) Amendment 2012; and
• recent developments in the industry reform process (abolishment of the ABCC and creation of the Office of the Fair Work Building Industry Inspectorate).
Case study and research based analysis estimated that the magnitude of productivity gains range from between 10 per cent and 21.1 per cent. The analysis adopted an assumed productivity gain of 9.4 per cent.
The analysis aims to measure the productivity implications associated with reforms to workplace relations regulations.
• Limited data availability for 2013 (which would include the effects of the FWBC) was not available and limited ability to isolate these impacts.
• Analysis is construction industry specific.
• Detail regarding method for establishing productivity impact assumption is not adequately disaggregated to enable comparison.
158 Independent Economics 2013, Economic Analysis of Building and Construction Industry Productivity: 2013 Update, report prepared for Master Builders Australia, August.

© 2015 KPMG, an Australian partnership and a member firm of the KPMG network of independent member firms affiliated with KPMG International Cooperative (“KPMG International”), a Swiss entity. All rights reserved.
The KPMG name, logo and “cutting through complexity” are registered trademarks or trademarks of KPMG International.
Liability limited by a scheme approved under Professional Standards Legislation.
March 2015
Page 133
Study Description Applicability Limitations
Economic Impact of Construction Industrial Relations Arrangements and Investment in Infrastructure – A New South Wales Perspective (2013)159 Report prepared for the Business Council of Australia
Review of workplace relations performance and changes in costs and productivity. Assessment of the NSW Government infrastructure program if industry relations and economic performance conditions diminished.
Analysis of the economic impact of industrial unrest, including:
• a scenario that assumes increased industrial unrest occurs and results in less effective use of both labour and capital resources (multi-factor productivity shock of 2 per cent);
• a scenario that increased industrial unrest results in employers acceding to an unfunded labour cost increase (labour cost shock of 2 per cent); and
• sensitivity analysis to test the impact of increasing the shock to 5 per cent and 10 per cent.
• Data linking workplace relations performance and economic performance are poor and insufficient to draw conclusions.
159 The Allen Consulting Group 2013, Economic Impact of Construction Industrial Relations Arrangements and Investment in Infrastructure – A New South Wales Perspective, report prepared for the Business Council of Australia, March.