workshop on advanced techniques for the … · mag. achim kamelger university of innsbruck,...
TRANSCRIPT

Workshop onAdvanced Techniques for the
Assessment of Natural Hazardsin Mountain Areas
5-7 JUNE 2000CONGRESS CENTRE IGLS
IGLS, INNSBRUCK, AUSTRIA
PROCEEDINGS
ORGANISED BY
SPACE APPLICATIONS INSTITUTE, JOINT RESEARCH CENTREEUROPEAN COMMISSION, ISPRA, ITALY
INSTITUTE FOR METEOROLOGY AND GEOPHYSICSUNIVERSITY OF INNSBRUCK, AUSTRIA
FEDERAL MINISTRY OF EDUCATION, SCIENCE, AND CULTURE, AUSTRIA

- 2 -
Organising Committee
Technical Programme Committee
Prof. Helmut RottDr. Thomas NaglerUniversity of Innsbruck, Institute for Meteorology and GeophysicsInnrain 52, A-6020 Innsbruck, AustriaTel: +43 (0)512 507-5455, Fax: +43 (0)512 507-2924, Email: [email protected]
Prof. Rudolf Winter, DirectorDr. Josef Aschbacher, Scientific Assistant to the DirectorSpace Applications InstituteEuropean Commission Joint Research Centre21020 Ispra (VA), ItalyTel: +39 0332 785968, Fax: +39 0332 789536, E-mail: [email protected]
Dr. Walter AmmannEidg. Institut für Schnee- und Lawinenforschung SLFFlüelstrasse 11, CH-7260 Davos Dorf, SwitzerlandTel: +41 (0)81 417 0231, Fax: +41 (0)81 417 0823, E-mail: [email protected]
Dr. Ad De RooSpace Applications Institute Joint Research Centre, ECTP263, Via E.FermiI-21020 Ispra (VA), ItalyTel: +39 0332 786240, Fax: +39 0332 785500, E-mail: [email protected]
Ministerialrat Dr. Kurt PersyFederal Ministry of Education, Science, and Culture, Vienna, AustriaRosengasse 4, A-1014, Vienna, Austria
Proceedings edited by:Prof. Helmut Rott,Dr. Thomas NaglerMag. Achim KamelgerUniversity of Innsbruck, Institute for Meteorology and GeophysicsInnrain 52, A-6020 Innsbruck, Austria
Co-Sponsors and Co-organisersSpace Applications Institute (SAI)European Commission Joint Research CentreMinistry of Education, Science and Culture, AustriaUniversity of Innsbruck, Institute for Meteorology and Geophysics
Special thanks to the sponsors of the evening receptions:Governor of Tyrol and Mayor of InnsbruckGeoVille Information Systems, Innsbruck, Austria

- 3 -
Table of Contents
Workshop Objectives 7
Summary of Sessions 7
Recommendations 9
Report on the Panel Discussion on Avalanche Hazard Management andResearch 10
Report on the Panel Discussion on Floods 13
Report on the Panel Discussion on New Techniques for LandslideHazard Management 16
The EUR-OPA major hazards agreement of the Council of Europe 20Françoise Tondre
Satellite and GIS
Satellite remote sensing for risk assessment in the Alps 24Mathias Schardt, U. Schmitt, K. Granica, and Heinz Gallaun
Internet GIS for disaster mitigation and civil defence in Tirol 29Bernd Noggler
Remote sensing and GIS technique in environmental impact assessmentand management of the Vikos–Aoos Greek mountainous park 31
Michael Petrakis, Basil Psiloglou, Iphigenia Keramitsoglou, C. Cartalis, and M. Lianou
EGAR project to tame the data jungle 32Kurt Ziegner
Avalanches
The avalanche winter 1999 in Switzerland – an overview 33Walter J. Ammann
New developments of the Avalanche Warning Service of the Tyrol forincreasing the quality of local avalanche warnings 36
Rudolf Mair
The application of the SAMOS - model for avalanche control 37Horst Schaffhauser, Peter Sampl, and Thomas Zwinger

- 4 -
Potential of microwave remote sensing for assessing critical snowproperties 38
Christian Mätzler
Detection of surface hoar with passive microwave sensors 42Giovanni Macelloni, Simonetta Paloscia, Paolo Pampaloni, Roberto Ruisi, MarcoTedesco, A. Cagnati, and M. Valt
Floods
Some recent strategies for flood risk mitigation in France 47Michel Lang
The Mesoscale Alpine Programme (MAP) An Initiative to improve FloodForecasting in Mountainous Terrain 48
Reinhold Steinacker and Manfred Dorninger
Flood simulation modelling and forecasting in mountain areas 52Ezio Todini
Assessing the Effects of Land use Changes on Floods in the Meuse andOder Catchment 53
Ad De Roo, Martijn Odijk, Guido Schmuck
Consequences of climate change effects on floods in mountain areas 57Hans-Peter Nachtnebel
Adaptation of a conceptual hydrological model to simulate runoff in twoAlpine river basins exposed to different climatic conditions 60
Martin Fuchs and Hans-Peter Nachtnebel
Runoff generation in mountainous areas and anthropogenic influence 61Paolo Burlando
Application of remote sensing and water balance modelling in alpineareas for flood hazard forecasting and control 62
Gudrun Lampart, Heike Bach, Marco Braun, Stefan Taschner, Ralf Ludwig, andWolfram Mauser
Strategic application of flood modelling for infrastructure planning andimpact assessment 65
Dinand Alkema, Angelo Cavallin, and Mattia de Amicis
The Regional Model of Hermagor district: Endogenous development andExogenous change Simulation 66
Meinhard Breiling

- 5 -
Three dimensional images of mountainous areas and river beds,observation of changes caused by natural hazards 69
Herwig Öttl
ERS SAR data and GIS mapping for the flood risk assessment in Klodzkoarea (Sudety Mts. Poland) 70
=ELJQLHZ�3HUVNL��=\JPXQW�+HOLDV]��6WDQLVáDZ�2VWDILF]XN��DQG�=ELJQLHZ�6QLHV]NR
The using of HYDROG-S as a rainfall – runoff model for flood forecastingin Odra river basin 71
Jalal H. Younis and Miloš Starý
From point data and cartography to the analysis of runoff and mass-movement processes in torrent catchment areas 72
Gerhard Markart, Bernhard Kohl, Herbert Pirkl, and B. Sotier
Synergistic use of synthetic aperture radar and optical satellite imagesfor monitoring the alpine snow cover 74
Thomas Nagler and Helmut Rott
Landslides
Some aspects of landslide hazards – prevention and prediction 75Hans Angerer
Experience with monitoring of landslides 79Hans-Rudolf Keusen and Kaspar Graf
Measuring subsidence with SAR interferometry applications of thepermanent scatterers technique 81
Alessandro Ferretti, Claudio Prati, and Fabio Rocca
Geometrical and dynamical parameters of several French Alps landslidesrevealed by differential SAR Interferometry 91
Christophe Delacourt, C. Carnec, B. Fruneau, C. Squarzoni, and P. Allemand
MUSCL – A European project on monitoring urban subsidence, cavitiesand landslides by means of remote sensing 92
Helmut Rott
Optical remote sensing for landslide investigations 96Javier Hervás
Natural Hazards in the Popocatépetl volcano zone (Mexico) 97Edgar Loyo, Antonio Razo, and David Sol
Mechanical processes and parameters controlling the structure of largesagging or sliding rock masses 98
- 6 -
Ewald Brückl and Miltiadis Parotidis
Geoelectrical multielectrode measurements for surveying andmonitoring of landslide areas 99
Robert Supper, B. Jochum, W. Seiberl, and R. Arndt
Application of the new Automatic Laser Remote Monitoring System(ALARM) for the continuous observation of the mass movement at theEiblschrofen rockfall area - Tyrol, Austria 100
Manfred Scheikl, Gerhard Poscher, and Helge Grafinger
Laser scanner monitoring – technical concepts, possibilities and limits 101Gerhard Paar, Bernhard Nauschnegg, and Andreas Ullrich
Monitoring of landslides in mountain areas by radar interferometry 102Dario Tarchi, Davide Leva, and Alois Sieber
The detection of surface movement using DInSAR: from urbansubsidence to landslides 103
Julie Boyle
Slope instability modelling using GIS in the thick loess terrain of NorthChina 104
Xingmin Meng, Edward Derbyshire, Don Thompson and Nigel Page
Controlled artificial triggering of debris flows – a (new) means of activerisk mitigation? 108
Michael Bonte, Jörg Trau, and Peter Ergenzinger
Rockfalls and rockslides in Madeira archipelago 109Domingos Rodrigues and Francisco Ayala-Carcedo
List of Participants 110

- 7 -
Workshop Objectives
The objective of this workshop was the review of the state of the art in the application ofadvanced techniques for natural hazard prevention and monitoring in mountainous areas.The focus was on integrative views of the technology expert community and the usercommunity in order to assure a better understanding of the problems on one hand and todevelop an increased acceptance of innovative technologies for operational applications onthe other hand. The workshop aimed at a broad exchange of knowledge and information,providing information on the latest technologies in order to improve the transfer from scienceto applications. The European Commission’s interest lies in the establishment of a network ofexperts, in order to provide a sound technical basis for the support of EU policies. Further,the topics of the workshop are of particular interest to the Global Monitoring of Environmentand Security (GMES) initiative.
Summary of Sessions
Session on Satellites and GIS for Hazard AssessmentIn oral presentations and posters the capabilities of satellite remote sensing and GIS forproviding basic data for risk assessment and the planning of protective measures wereintroduced. The techniques presented are of relevance for all three topical themes of theworkshop. On-line spatial data bases (GIS), containing detailed hazards maps, land usedata, and other relevant information, are becoming an important basis for hazardmanagement. Remote sensing was presented as an efficient tool to produce updated mapsof vegetation cover and land use for hazard assessment and planning of mitigationmeasures. The acquisition of high resolution digital elevation data is another importantapplication of airborne and satellite-based remote sensing (using interferometry, laseraltimetry, digital stereo cameras), which can be used as basis for a wide range of researchactivities and applications in hazard management.
Session on AvalanchesOn the operational side, experiences with avalanche protection measures and warningservices were reported for Switzerland and Tyrol, including lessons learned from theavalanche winter 1999. Taking into account the extraordinary situation and the high numberof people exposed to risk, the integral set of protection measures was in general quiteeffective. Shortcomings became available in Austria at the local scale, in particular regardinghazard mapping and the assessment of individual avalanche events. Research activities onnumerical modelling and simulation of avalanches were introduced as evolving means toassess protective constructions and to contribute to objective hazard mapping. As modelinput and for validation of avalanche simulations there is urgent need for accurate, spatiallydistributed information on physical properties and mass of the snowpack. Capabilities ofmicrowave sensors for measuring snowpack properties were presented, based on extensivefield research. However, in spite of the high sensitivity of microwaves in regard to severalsnow parameters, the capabilities of presently available remote sensing systems are not ableto meet the needs of numerical avalanche models. At present the main application of remotesensing would be the acquisition of high resolution elevation models and of land cover andvegetation information, which is required for avalanche hazard mapping and provides alsoboundary conditions for avalanche simulations.
Session on FloodsThe presentations covered various aspects of flood mapping and hazard assessment anddiscussed principles and applications of hydrological modelling and forecasting of floods. The

- 8 -
problem of quantitative rainfall forecasts was addressed as the main source of errors forflood forecasts. Initiatives towards improving the regional meteorological forecasts inmountainous regions were introduced, based on mesoscale numerical modelling and, fornowcasting, the combination of weather radar and geostationary meteorological satellitedata. Two papers were presented on effects of climate change for flood hazards in mountainareas, revealing somewhat diversified scenarios. In large basins the effects will very likely besmall, whereas for small basins at high altitudes an increase of floods may be possible,though the uncertainties of predicted trends of climate parameters are still high.
Flood zoning systems were presented as tools for flood risk assessment and mitigation.Such systems apply detailed mapping and are often based on GIS. Remote sensinginformation is used increasingly such as land cover type, soil and vegetation properties etc.Imaging radar evolves as an important tool for flood extent mapping in real time, both fromaircrafts and satellites. Very important are also very precise digital elevation data, whichpresently are obtainable only by means of airborne systems (Laser scanner, interferometry,digital stereo camera).
Session on landslidesThe session was opened with two presentations on operational activities of landslide hazardassessment and mitigation, pointing out the present status of observational systems andwarning services, and explaining requirements for improved information. Remote sensingmethods for landslide investigations were introduced in several oral presentations andposters. Techniques of spaceborne SAR interferometry for measuring millimetric terrainmotion were explained and applications were shown for urban areas and mountain slopes.Case studies of optical spaceborne and airborne remote sensing were presented forlandslide mapping and monitoring, providing an efficient tool for hazard assessment. Thisinformation complements geological and geographic information in GIS data bases for whichexamples on the management of natural hazards in landslide areas and volcanic zones wereshown.
Methods and applications of geophysical in-situ measurements and numerical modelling toanalyse subsurface properties of landslides were shown for large sagging rock-masses andlandslides in softrocks. Principles of new ground-based remote sensing techniques, laserscanning and radar interferometry, were explained and applications for monitoring the massmovements at the Eiblschrofen rockfall area near Schwaz, Tyrol, were presented. Thesepapers, and a special introduction on the geology of the Eiblschrofen area, on the rockfallevents of 1999 and on the protective measures were an excellent preparation for theexcursion to this rockfall site on the following day.

- 9 -
Recommendations
A number of recommendations were made during discussion in the various sessions and inparticular during the panel discussions. Detailed comments and recommendations for eachof the three topics can be found in the documentation of the panel discussions. In thefollowing section general recommendations are summarized, with emphasis on newobservational techniques.
• The disaster management community realizes the need for improved observationaltechniques, but is not fully aware of the capabilities of new techniques such as remotesensing. In order to close this gap of information the research community should be moreactive in promoting the research results and responding to the requirements of theoperational community.
• The possibilities and limits of new techniques should be specified as precisely aspossible for each application, in order to provide a sound basis for the right choice oftechnique and to avoid overselling.
• The proper use of new observation technologies, such as remote sensing, mitigatenatural risks needs profound knowledge on the basic physics of the hazard processes.Coupled basic research on processes and their observation in the field is seen as animportant basis for a successful risk mitigation policy.
• More joint programs of application demonstrations should be carried out inoperational environment to demonstrate the reliability of new techniques and to stimulatefurther technical improvements.
• The reliability, long-term continuity and fast delivery of satellite data are pre-conditions for the acceptance of space-based observation systems by the disastermanagement community. Agencies or companies which are planning and operatingsatellite missions should come up with long-term solutions if they want to have the dataused operationally for disaster applications.
• Complete and easy to use information systems are needed to take the rightmeasures in hazard situations. Therefore hazard management systems should integratedata from conventional information sources and remote sensing and rely also on the newcommunication technologies as a rapid and economic means for collecting anddistributing information.
• A better coordination of activities related to natural hazards mapping, monitoring andprevention within Europe is recommended. This includes, in particular, the exchange ofinformation and expertise within the EU member states, as well as quick access toinformation by other EU member states in case of natural disasters.

- 10 -
Report on the Panel Discussion on Avalanche Hazard Managementand Research
Discussion Chair:Walter J. Ammann, Swiss Federal Institute for Snow and Avalanche Research (SLF),Davos, Switzerland
Rapporteur:Peter Hoeller, Forstl. Bundesversuchsanstalt, Institut für Lawinenforschung,Innsbruck, Austria
Panel members:J. Aschbacher (SAI-JRC, Ispra, Italy), R. Mair (Lawinenwarndienst, TirolerLandesregierung, Innsbruck, Austria), C. Mätzler (Univ. Bern, Switzerland), H.Schaffhauser (Forstl. Bundesversuchsanstalt, Institut für Lawinenforschung,Innsbruck, Austria)
Key Question 1:
Which are the main lessons learnt from the avalanche situation in 1999 in theEuropean Alps in terms of:
• Risk development (settlements, mobility)
• Protection measures
Avalanche risk throughout the European Alps has been continuously growing. Major reasonsare the increased mobility, growing values exposed to risk and increased number of people,mainly tourists. In spite of this development, the integral set of protection measures includingavalanche warning, evacuation, hazard mapping, technical measures and silviculturalmeasures turned out to be quite effective in Switzerland during the exceptional avalanchesituation in winter 1999 (Ammann). In Austria at the local to regional scale majorshortcomings became apparent, in particular regarding hazard zonation and the assessmentof individual avalanche situations (Schaffhauser).
Key Question 2:
What are the implications on practical improvements?
Practical improvements are necessary for the whole set of protection measures. Cost-benefitand cost-effectiveness calculations will play an increasing importance in future investmentdecision making policy. Differences exist country by country. Switzerland e.g. willconcentrate on improving the avalanche warning and public awareness strategy (Ammann).For Austria the need to improve hazard mapping was clearly identified, using as far aspossible objective criteria (Schaffhauser). Event monitoring and prediction was mentioned asanother issue for improvement. Education of both safety personal and the public wasmentioned as an important organizational measure. Investment in education is a very cost-effective measure for mitigation of avalanche hazards. Defence constructions are costlymeans for protection and will never be able to guarantee 100 % safety. Though work towardsexpanding avalanche defence structures is going on in the Alpine countries, it was thegeneral view that other protective measures, mentioned above, will probably have priority inthe future, not least because of economical and ecological reasons.
- 11 -
Key Question 3:
What are the implications on research?
Statements to this question were widespread, ranging from basic snow physics to appliedresearch. Mätzler emphasized the need to understand basic physics for proper utilization ofnew technologies such as remote sensing and for advancing the understanding of snowmetamorphism and avalanche release. On the applied side, the need for improving theavalanche forecasts for specific events was stressed in several contributions to thediscussion.
Avalanche models are an important tool for risk management, but major improvements ofthese models are needed. At present it is not possible to rely on numerical models as a onlytool for risk management (Ammann). As model input and for validation of avalanchesimulations there is urgent need for accurate, spatially distributed information on physicalproperties and mass of the snowpack (Schaffhauser). In addition, experimental work isneeded to improve and verify the models. As another important topic of research, the effectsof meteorological conditions on the stability of the snow cover were identified.
Key Question 4:
Which measures should be taken to foster the transfer from science toapplication?
The statements to this question were widespread and mainly of generic nature. Cost/benefitwas mentioned as a main driver. New techniques will be adopted for operational servicesonly if the cost/benefit ratio is better than for the previous technique and the improvementcan justify the investment (Petrakis). More pilot projects, testing new technologies inoperational environment, should be funded to demonstrate the capabilities and costeffectiveness of new techniques (Jäger). The comment, that outstanding science will not besupported if there is nobody who will use the results, met with some opposition. Althoughscience has to be brought to the user, it is necessary to support both fundamental researchas well as applied sciences. Reiter stressed the importance of basic science, because thereis no real advancement in applied science without basic research. The real technologicaladvancements evolved from basic research which in the beginning was far off from anyapplication.
Also avalanche science cannot be simplified so far that everybody can use it. However,dissemination of new scientific results and education of the public are important to improvethe risk awareness (Nairz). KISS, keep it (research results, products) smart and simple, is agood rule to foster the acceptance of new scientific results (Mätzler).
Key Question 5:
What is the potential role of new technologies for avalanche warning in terms of:
• Fundamental research (avalanche initiation, avalanche dynamics, etc)
• Field observations (observers, automatic weather stations)

- 12 -
• Capabilities of remote sensing techniques for avalanche warning
• WWW, Internet
• Field and laboratory experiments
Amman and Schaffhauser explained the urgent need for spatially distributed information onthe snow cover which the conventional observation techniques are not able to deliver. Rottsees in principle three tasks for remote sensing: (i) basic research on snow physics,metamorphosis etc.; (ii) obtaining input data for avalanche simulation models and hazardmapping; (iii) input for real-time avalanche warning. Satellite data show considerablepotential for tasks (i) and (ii), but the repeat cycle and the limited sensitivity of themeasurements in respect to critical snow properties excludes operational real timeapplications with present sensors. For task (ii) the main application of spaceborne andairborne remote sensing at the present state of the art would be the acquisition of highresolution elevation models and of land cover and vegetation information. The capabilities formapping snow depth or water equivalent with high spatial resolution are not satisfactory,though future developments (e.g. at high radar frequencies) might be able to contribute tothis information need. For local avalanche warning and prediction the use of ground-basedremote sensing might also offer a solution.
Mätzler explained the trade off in remote sensing between high spatial resolution vs. hightemporal resolution. He is confident that even with quite low spatial resolution temporalchanges of snow properties in mountainous terrain can be derived at subpixels scale usingphysically based inversion algorithms, if close time sequences are available. R. Mairsuggested the increased use of WWW and Internet for distributing relevant information inreal time to local avalanche commissions which would improve the area-detailed avalanchewarnings.
Key Question 6:
Which measures should be taken to strengthen avalanche research?
Considerable expertise exists in various European countries. A better coordination of thisexpertise on a European level would strengthen the research activities and increase thechances for European Framework funding (Ammann). Aschbacher explained the EC initiativeGMES (Global Monitoring for Environment and Security) which aims at providing Europe withan independent information capability for global environment monitoring of environmentaltreaties (eg the Kyoto Protocol), risk management and environmental stress. One of thethree thematic pillars of GMES focuses on natural hazards, within which avalanche researchcould become a topic of further investigation. Other areas of interest are the prevention,monitoring and damage assessment of landslides, floods and forest fires.
Regarding the present situation in Austria, Schaffhauser addressed the urgent need toimprove the cooperation between basic research, applied research and operationalavalanche warning services. He believes that a centre of competence is needed as focalpoint for basic and application-oriented research which would result in accelerated transitionfrom research to applications. Ammann points out that in Switzerland there is presently atendency in the opposite direction, to separate science from operations and privatiseoperational services.
- 13 -
Report on the Panel Discussion on Floods
Discussion Chair:
A. De Roo (EC-DG JRC-SAI, Ispra, Italy)
Rapporteur:
D. Alkema (Univ. Milano, Italy).
Panel Members:
E. Todini (Univ. Bologna, Italy), M. Lang (Cemagref, France), P. Burlando (ETHZurich, Switzerland).
The following research questions have been discussed:
1. Can the quality of flood forecasting be improved, if yes, how?, if not, why not?2. Can we increase the lead time of flood warnings, if yes, how?, if not, why not?3. Which new advanced techniques are promising for flood prediction and how can they be
transferred to the user-community?4. Would there be a requirement for (inter-) national spatial planning policies to prevent or
reduce damages and casualties in the floodplains along the river courses?5. Did or will land use changes change the magnitude and frequency of floods?6. Will the currently expected climate change affect the magnitude and frequency of floods?
Flood Forecasting
Related to flood forecasting it was mentioned (Lang) that especially the quantitativeprecipitation forecasts needs to be improved. At present it can be forecasted whether it willrain, but not accurately enough how much it will rain. Todini mentioned that it is obvious thatwe should aim at increasing the lead time of a flood forecast and reduce the uncertainty ofthe forecast.
This uncertainty in the rainfall forecasts should be included by meteorologists in theirforecasts (Todini). Thus, a degree of uncertainty of the flood forecast can be provided to theend-users. Since too long, rainfall is only a by-product for meterologists. Hydrologists need toknow not only whether it will rain at a certain location, but also how much, together withuncertainty estimates. Burlando commented that the accuracy-uncertainty issue is an oldproblem. Meterologists and hydrologist still do not speak each others language, and shoulddiscuss in an inter-disciplinary way to find a common agreement on accuracy and acceptableuncertainty. Hydrologists need to explain better to meteorologists how important it is to havegood rainfall forecasts and uncertainty information to produce flood forecasts. End-users(water-authorities, civil protection authorities) however find it difficult to deal with uncertainty.Also there, hydrologists need to ‘educate’ the end-users that 100% accurate flood forecastscan never be made.
Using new advanced techniques
Traditionally, space techniques are used to derive land cover type and soil cover byvegetation, which both are used for flood estimation (Lampart, De Roo).

- 14 -
Also, the use of SAR data for flood extent mapping has been demonstrated as useful,although the frequency of the images is a problem (De Roo).
As presented in the papers of Öttl (DLR) and Perski (Univ Silesia) there are good possibilitiesnow to derive detailed Digital Elevation Models from SAR interferometry for catchmentflood simulations. For flood extent estimation the vertical accuracy of SAR interferometry isnot sufficient.
Strong efforts should be made to improve soil moisture estimates from space data, to serveas initial conditions for flood forecasting (Todini). It was commented (Öttl, DLR) that in orderto obtain better soil moisture estimates there is a need for radar satellites with lowerwavelengths (100-500 MHz). Rott (Innsbruck) commented that current efforts to estimate soilmoisture with SAR data have had little success, amongst others due to forest cover. Rottbelieves that in humid-temperate climates soil moisture can better be simulated thanobtained from presently available space data. In (semi-) arid climates there are betterpossibilities for SAR derived soil moisture estimates.
Burlando stated that it is important just to improve and integrate existing techniques to obtainbetter flood simulations. Further developments of new techniques will only result in smallprogress.
Rott commented that in many parts of the world where knowledge on new techniques islimited and only ground-based data are less available, a lot of progress could be made byjust using conventional space techniques.
Both Lang and Todini commented that building databases of large historic floods is useful toobtain flood hazard zones and to ‘replay’ historic events, to demonstrate the effect ofpossible wrong decisions.
Spatial Planning Policies
Lang stated that it is important first to set common standards in the different countries. Forexample, it has to be agreed that agricultural used areas may face flooding only with a (forexample) 20-year return period, urban areas only floods with a (for example) 50 (cellars) or100 year (ground floor) return periods. Lessons should be learned from historic floods anddifferent countries should learn from each other’s experiences.
An important issue and problem is that people tend to feel saver behind a dike or anotherflood protection structure. Behind these flood protection structures gradually thevulnerability is increased by building new houses etc. People and policy makers shouldremember that dikes may fail. There is a need for continued strict spatial planning policies inriver floodplains, even after the construction of protection measures, to keep the vulnerabilityto floods low. In general, we should give sufficient space to rivers.
There is also a tendency that while spatial planning policies fail to emerge, the insuranceindustry pays more attention to insurance of properties in flood prone areas. Premiums mayrise considerably in areas with higher flood risks. At present insurance premiums andsystems are different in each country, but probably there will be some unification in thefuture.
Effects of land use changes on floods
As stated already in the presentation of Burlando, a Swiss case study showed that land usechanges (urbanization) only affect hydrographs in smaller catchments. In larger catchmentsthe effects are dampened. This is in agreement with the findings of De Roo in the Meusecatchment for land use changes between 1975 and 1991.
Changes made to the river cross sections, dams, weirs or building in the floodplain andtherefore reducing the storage capacity of the river do influence flood risks downstream. Asstated above, in general, we should give sufficient space to rivers.

- 15 -
The effect of deforestation on the catchment hydrology has been discussed and is stillunclear. Probably the effects of deforestation on soil erosion, slope stability, ecology andwater quality are larger than the influence on floods. The feeling is that extreme floods inareas subject to large precipitation will continue to happen, with or without a forest cover(Burlando). Other storage factors in a catchment are much more important to floods than thecover-type (Todini).
Lang stated that the increased vulnerability along rivers and behind flood protectionmeasures is a worrying development, and is much more important than other flood factors.More attention should be paid to risk-education and smarter spatial planning.
Effects of climate change on floods
Todini mentioned that only in mid-latitudes in Europe GCM output can be transferred intoprecipitation maps. North of the UK and south of the Alps problems occur. Therefore, only inCentral Europe GCM’s can be used to assess the influence of climate change on floods.
In many cases the results of climate change studies are still ambiguous: often the 1xCO2
scenario result is closer to the 2xCO2 scenario than to the control scenario, whereas thecontrol scenario and 1xCO2 should be the same.
Results of studies showing the effects of climate change on floods are still locally valid only.Results obtained by Nachtnebel and Fuchs in Austria are different from results obtained byBurlando in Switzerland.
Lang mentioned that it is still difficult to distinguish effects of natural climate variability fromthe effect of climate change. Younis finds it too early to already see evidence for climatechange. Todini comments that analysis of Italian data clearly shows clear trends ofincreasing temperature, changes in the distribution of rainfall with seasons (closer tosummer: shifts from April to May, and to Early October instead of October/November), and adecrease in annual river discharge since 1923 of 30%
- 16 -
Report on the Panel Discussion on New Techniques for LandslideHazard Management
Discussion Chair:
H. Rott (Univ. Innsbruck, Austria)
Rapporteur:
A. Kamelger (Univ. Innsbruck, Austria)
Panel members:
H. Angerer (Wildbach- und Lawinenverbauung, Innsbruck, Austria); J. Hervas (SAI,DG-JRC, Ispra, Italy); F. Rocca (Politecnico Milano, Italy), K. Graf (GEOTEST,Switzerland)
The report takes into account also the discussions during the other sessions on the topiclandslides.
Key Questions Landslide Hazards
1. Which information needs for the assessment of landslide hazards cannot be met byconventional observation techniques ?
2. What are the capabilities of remote sensing techniques (SAR interferometry, optical) forlandslide monitoring ?
3. Which further developments of remote sensing techniques can be expected ?
4. What are the research priorities, as required for future operational use ?
5. Which measures can be taken to accelerate the transfer of new techniques from scienceto applications ?
Information needs for landslide hazard assessment
Landslide hazard management covers various aspects, including the assessment of thesusceptibility of a slope for failure and the prediction of the probability of a failure event.Landslide hazard zonation is usually related to the first task, whereas the predictivecalculation of a particular landslide event taking into account a triggering mechanism is verydifficult. Therefore the discussion focussed at various aspects of landslide hazard mappingand the monitoring of landslide characteristics, and only briefly addressed the problem ofevent prediction.
Usually reliable and detailed inventories on landslide risks and on the probability of failureare not available. However, in a particular risk situation public authorities want fast andaccurate analysis and reliable predictions of future behaviour of the landslide. But theinvestigations are very time consuming, whereas due to limited budget and pressure of timeexact analysis is often not possible (Graf). With reference to the Eiblschrofen rockfall,Angerer mentioned that long-term observational data and knowledge of the natural slopestability and of thresholds for failure were missed most urgently in the decision process onprotective measures.

- 17 -
Regarding the information needs, the requirements for hazard mapping with various levels ofdetail and for monitoring of active events were discussed. Hazard zonation is more or lessbased on mapping of terrain properties which are related to the stability of a slope. Therelevant information is traditionally taken from aerial photography and from geological fieldsurveys, if available. However, the basic information for hazard zonation is not satisfactoryeven in many regions of Europe, and the less in remote areas (Graf). Remote sensing mayoffer an economic means for landslide inventorying and for mapping characteristics oflandslide areas, such as information on morphology, structural geology, land cover, and highresolution topography. Very important is also sub-surface information which is in most casesnot available (Hervás). Surface observations, including remote sensing, can only provideindirectly hints on subsurface properties, but for accurate analysis geophysicalmeasurements and drillings are needed.
Regarding the real time monitoring of active landslide zones, remote sensing from aircrafts orsatellites is not the right tool because of the long repeat intervals of observation (Rott).Video-cameras are used for real-time monitoring and warning, but have limitations in case offog and rain, and during the night (Graf). Recent developments resulted in successfulapplication of ground-based remote sensing, such as laser-scanners (Paar) and radarinterferometry (Tarchi). A particular problem is real-time warning for remote sites (Graf).
Capabilities of existing remote sensing techniques
Airborne and spaceborne remote sensing with optical sensors is used since many years forproducing landslide inventory maps and for mapping factors related to the occurrence oflandslides such as surface morphology, structural and lithological properties, land cover, andtemporal changes of these factors (Hervás). These data are usually complementing theanalysis from air photos and field surveys, but in remote areas may be the only sources ofinformation. Another advantage of satellite-based remote sensing is the capability of repeatobservations which results in more frequent update of information on landslidecharacteristics than the conventional data sources (Hervás).
Spaceborne radar interferometry (INSAR) offers the possibility to map and monitor thedisplacement of slopes and, with the new permanent scatterer (PS) technique, even ofindividual objects. Major constraints for the application result from vegetation and fromunsuitable orientation of a slope relative to the radar illumination (Rott). The problem ofvegetation can be partly overcome by the PS technique, if stable objects such as houses etc.are located within these areas (Rocca). In comparison to ground based GPS or geodeticsurveys, INSAR provides area-extended information on slope motion and is also aneconomic means to detect and monitor unstable slopes over large regions.
Another important application of remote sensing is the generation of digital elevation models(DEMs) which is basic information for the characterization of slopes and for numericalmodelling of mass waste processes. There are various data sources for DEMs. Opticalstereo images with 10 m to 20 m spatial resolution (SPOT, ASTER, etc.) are used to provideDEMs with vertical accuracy of the order of 10 m to 20 m (depending on the steepness of theterrain). Similar accuracies are obtained with spaceborne INSAR. ERS INSAR is notapplicable for DEM production in steep mountains because of the low incidence angle of theradar beam, but the Shuttle Radar Topography Mission (SRTM), operating in February 2000,provided INSAR data over all land surfaces between 60° N and 56 °S (Rott). The dataavailability and pricing policy are not yet known. Accurate DEMs can be expected from thenew high resolution (1 to 4 m) optical satellite sensors. Other options are airborne INSAR

- 18 -
(spatial resolution up to 0.5 m) and airborne laser scanners. The decision for the selection ofa particular system will depend on data availability and costs.
Ground-based remote sensing with recently developed sensors, such as the laser scannerand INSAR offer the possibility for detailed real-time time monitoring of surface motion withhigh temporal resolution (Paar, Tarchi). The laser system, applied at Eiblschrofen, had anaccuracy for displacements measurements of one centimetre, the INSAR of a fewmillimetres.
Of importance for land slide studies and impact assessment, including the decision makingfor active events, are time series of historic data (Angerer, Graf). Multi-year satellite data withglobal coverage are available in archives, enabling retrospective studies of slope behaviour.
Further developments of remote sensing techniques
Advancements for inventorying, characterisation and monitoring of landslides can beexpected from further developments of analysis techniques for existing sensors, and fromsensors which are scheduled for the next years. In addition, requirements for thedevelopment of new sensors were discussed.
Regarding the INSAR application for existing satellite radar sensors, further research andapplication demonstration studies are needed to fully exploit the potential. In particular, thereis a need to investigate the application of the point scatterer technique in mountain regionsbecause the area extended analysis is hampered by vegetation at lower elevations (Rott).Longer wavelengths (e.g. L-band) might improve the application of INSAR in vegetated areasbecause of better penetration capabilities, but the applicability in forested areas is ratherunlikely (Rocca, Tarchi).
In the near future the capabilities of spaceborne INSAR may be reduced compared to thepresent situation where the SAR system on board of ERS is a powerful tool (Rocca). TheESA follow-on mission ENVISAT, scheduled for launch in 2001, will have a SAR on boardwhich is able to operate in many different modes. These capabilities will cause conflicts ofinterest, because INSAR requires repeat data from always the same mode. Rott mentionedthe possibility to bridge gaps in information by means of high resolution airborne SARs,though at higher costs. In addition, a SAR mission with interferometric capability is underreview at NASA. High resolution polarimetric SARs, such as the TerraSAR in preparation inEurope, are probably less suitable for interferometry, because of other mission priorities.Rocca pointed out that the flight of another ERS SAR might be possible at low cost enablingcontinuation of the INSAR activities. This would be of very high interest for all INSARapplications, enabling to use the available processing techniques and significantly increasingthe time series to study and monitor dynamic phenomena.
The high resolution (1 to 4 m) optical satellite sensors are just evolving, with several newsystems to be launched into space within the next few years. Significant research efforts willbe needed to adequately utilize this potential for hazard zonation and risk assessment(Hervás). In addition, some of these sensors will have in-flight stereo capability which willprovide the basis for high resolution DEMs.
Ground-based laser and interferometric remote sensing are comparatively new techniques,used so far only in a few pilot projects. It can be expected that further applications of thesetechniques will evolve in the near future, in particular for real time monitoring. In addition, theuse of stereo video-cameras might by of interest because they enable measurements inthree dimensions, though the accuracy is not comparable to laser and INSAR (Paar).

- 19 -
Research priorities
A key research issue for improving landslide hazard assessment, for estimating theprobability of a triggering event and for optimising protective measures is the improvement ofnumerical modelling of landslide mechanisms. In particular, improved knowledge of the roleof the geological structure, the lithological constitution and the impact of water is needed forlandslide analysis (Scheikl). Brückl stressed also the importance of better numerical modelsfor analysis and simulation of mass wastes. Input data to such models would mainly comefrom “classic” geophysical and geological field measurements, but remote sensing data couldbe useful for spatial analysis. Rocca confirmed the needs for intense efforts to improvelandslide process models which can also be used for better interpretation of observationaldata. This would also improve the decisions regarding hazard warnings and protectivemeasures because these activities have to rely on the interpretation of the observations.
On the remote sensing side, there is a need for further improvement of data analysistechniques and for applied research to improve the utilization of the remote sensingproducts. For example, methodologies should be developed to utilize the INSAR informationin models of slope stability (Rocca). For data processing emphasis should be on thedevelopment of robust and standardized techniques. INSAR developments are going in thisdirection, because the parameter measured is physically well defined. Standardisation ofanalysis techniques is more difficult for optical data because of the large variety of sensorsand the less direct inference of landslide properties. In particular in view of the new highresolution optical satellite sensors, efforts should be directed towards the development ofautomatic or semi-automatic standardized procedures for extraction of landslide parameters(Hervás). Regarding ground-based remote sensing, Paar mentioned the need for research inlidar signal analysis which would further enhance the application of these sensors.
Transfer from science to applications
Initiatives are needed from both sides, companies and universities or research institutes, toimprove and accelerate the development and transfer of new techniques. Scheikl pointed outthat companies should initiate more partnerships with the aim to solve specific problems.Thus the know how of the research institutions would be used in a problem-oriented andeffective way. As an example for a successful joint venture the fast development of theprocessing system for the ground-based laser scanner was mentioned (Paar, Scheikl). Paarpointed out the problem that software development at universities usually is not continuousand not well documented, and thus a lot of information is lost if a person leaves. This can beimproved if the development is directed towards specific applications in an early stage.Hervás and Paar stressed the need for commercial software development for operationaluse, which requires high investment costs.
Graf explained that new techniques will only be adopted if they are cost effective. This seemsto be the case for remote sensing techniques if applied for surveys at regional scales. Thecost effectiveness at the level of site investigations still has to be proven. Very important forthe operational user are the archives of remote sensing data to study the temporal evolutionof slope properties in case of risk of failure or for a posterior analysis of failure events. A newmethod would be quickly adopted by a company if it provides an advantage on the economicand/or competitive side (Graf).
Rocca pointed out the importance of reliability and continuity of remote sensing systems tobe adopted for operational purposes. For single satellite missions, even if they have powerfulsensors, the investment in data processing and data utilization techniques can hardly bejustified if they do not have a follow-on. The lack of continuity prohibited promisingoperational use of remote sensing in many cases.

- 20 -
The EUR-OPA major hazards agreement of the Council of Europe
FRANÇOISE TONDRE
Council of Europe, Executive Secretariat, EUR-OPA Major Hazards Agreement,F- 67075 STRASBOURG Cedex
Tel +33.3.88.41.26.16 Fax +33.3.88.4127.87 E-mail [email protected]
On 20 March 1987, the Council of Europe Committee of Ministers adopted Resolution (87) 2establishing the Council of Europe Open Partial Agreement on the prevention of, protectionagainst and organisation of relief in major natural and technological hazards, which is knownas the EUR- OPA Major Hazards Agreement.
This intergovernmental Agreement is both partial and open. It is partial in the sense that onlyinterested member States of the Council of Europe participate. It is open since anynon-member State may request to join it. The Council of Europe Committee of Ministers,sitting at the level of member States of the Agreement, decides on whether to grant thisrequest.
The Agreement counts to date 24 member States : Albania, Algeria, Armenia, Azerbaijan,Belgium, Bulgaria, Cyprus, France, Georgia, Greece, Italy, Lebanon, Luxembourg, Malta,Republic of Moldova, Monaco, Morocco, The Former Yugoslav Republic of Macedonia,Portugal, Russia, San Marino, Spain, Turkey, Ukraine. Japan has the status of observer. TheEuropean Commission, UNESCO, WHO and the Office for the Coordination of HumanitarianAffairs (OCHA) of the United Nations participate in the Agreement. The InternationalFederation of Red Cross and Red Crescent Societies is associated in its work.
The EUR-OPA Major Hazards Agreement main objectives are:
� on the one hand, to reinforce and promote co-operation between member States in amulti-disciplinary context to ensure better prevention, protection and organisation ofrelief in the event of major natural or technological disasters by calling upon presentday resources and knowledge to ensure an efficient and interdependent managementof major disasters;
� on the other hand, to use the Agreement as a suitable platform for co-operationbetween Eastern Europe, the South of the Mediterranean and Western Europe in thefield of major natural and technological disasters.
The activities carried out within the Agreement are situated at three levels :
� the political level with the periodical meetings of the Ministers of the Agreement andof the Committee of Permanent Correspondents;
� the scientific and technical level with
½ the “European Warning System”
½ the "European Network of Specialised Centres"
½ the “European Advisory Evaluation Committee for Earthquake Prediction”
� Specific programmes:
½ the EDRIM Programme: the definition and setting up of a permanenttelecommunications network between risk and crisis managers
½ the STRIM Programme : the implementation of a joint programme between theEuropean Commission, the European Space Agency and the Council of Europeto promote the use of space technologies (space telecommunications,observation of the earth from space, location systems) to aid risk management
½ The FORM-OSE Programme (the European training programme on risksciences): development of a training programme in risk sciences, from school

- 21 -
to university levels, including continuing education and sandwich training, tofoster a culture of risk prevention with special attention to new informationtechnologies.
� The European Warning System: The objective of the European Warning System(SAE) is to foster information and concertation between member States of theAgreement in the assistance provided to a State hit by a disaster. It concerns mainlyearthquakes of a magnitude higher than or equal to 6 on the Richter scale. TheEuropean Warning System is also used for other types of major disasters.
� The European Network of Specialised Centres (cf appended list of Centres): TheEuropean network of specialised Centres aims at implementing training, informationand research programmes in the field of major natural and technological hazards.
FORM-OSE PROGRAMME
At present priority is being given to training at school level and to training at university level:
� at school level, a European network of schools to promote the awareness of childrento risk prevention has been set up;
� at university level by means of specialised European Masters in Risk Sciences. AEuropean Master in Disaster Medicine, in co-operation with the EuropeanCommission, is scheduled for the new academic year 2000.
Other Masters are currently under preparation, for example:½ in the field of legal aspects of risk management by the European Centre in
Florival, Belgium;
½ in the field of geological risks at the initiative of the Strasbourg Centre onGeomorphological Risks;
½ a draft European Doctorate in Risk Sciences, which at a first stage focuses onsciences and space techniques applied to risk management. This doctorate isbased on a model already developed in the biotechnology field. It is part of ajoint programme by the European Commission and the EURO-STRIM project ofthe EUR-OPA Major Hazards Agreement.
EDRIM PROGRAMME (ELECTRONIC DISCUSSION FOR RISK MANAGEMENT)
The EDRIM programme is based on the use of the new information and communicationstechnologies and is aimed at setting up a permanent space telecommunications networkbetween national risk managers in order to foster international co-operation and assistancein decision-making in the field of risk management.
INTRANET links the national authorities responsible for risk management. This is level onein the piping/conveyer system. Level two is more complex and entails the knowledge (thedata processed) which is fed in to assist decision-making.
STRIM PROGRAMME (SPACE TECHNOLOGIES TO ASSIST RISK MANAGEMENT)
The Strim programme aims at using space technologies to assist risk management.
A series of large scale demonstration projects using equipment to complement othertechniques in the study of natural and technological hazards has been carried out between1994 and 1997 in terms of knowledge, prevention, emergency situations, post-crises.
Currently existing space based resources cover approximately 60% of the user needs. Thispercentage varies considerably according to the risk type and to the resource type (weather,observation …)

- 22 -
Based on synergy between the various partners and the pooling of “Greater Europe” spaceresources, STRIM fits neatly into the permanent telecommunications network betweennational risk managers, by:
� updating data in the “specialised layers” of geographical information systems andgeneral databases used in risk management and emergencies;
� inputting processed space imagery into the EDRIM network in order to aid decision-making;
� using space telecommunications systems enabling the EDRIM system to operateeven when traditional telecommunications systems are destroyed or saturated.
Considerable efforts have been undertaken using space equipment (remote sensing,observation, telecommunications, positioning etc.). The aim is to identify the ways in whichtechnological advances in this field may assist risk management (knowledge, prevention,emergencies, rehabilitation).
I propose to illustrate what I have just presented with the help of a concrete example uponwhich we are working in order to participate in the mechanism and to assist decision-makingthrough the precise theme of seismic risk which can be applied to other types of risks.
It stems from a request by the Committee of Ministers of the Council of Europe, supported bythe Ministerial meeting of the Agreement through its Resolution on the economic and socialconsequences of the recent earthquakes in Turkey and Greece, to help Greece and Turkeyoptimise seismic risk management following the earthquakes they suffered in 1999. I shalltake crisis management as an example.
We have a European Warning System based on a network of technical monitoring. Thanksto this European Warning System we can feed in the localisation and the magnitude of anearthquake. However, this does not provide the decision-maker with sufficient information toassist in the management of a crisis, the other countries not being familiar with the territory ofthe affected country.
We are in the process of selecting models for evaluating the damage caused. On the basisof data archived, our idea is to feed this data into the model or models which will be selected.It is a question of feeding in an evaluation of the area affected as far as victims, woundedpersons and material damage are concerned. A seminar will be held in Moscow from 29June to 1st July 2000 to examine the various models. However, the basic data archived isnot necessarily updated and therefore the level of error is high and we are trying to haverapid data determination.
In parallel, we feed in data emanating from observation of the earth from space and also datafrom ground observation. This information will update the data and will decrease the level oferror. Discussions are underway with the Russian authorities to obtain their military database.
In terms of prevention, we are in the process of testing systems for the elaboration of themapping of seismic risk areas so that States undertake the monitoring of high risk areas.These questions will be discussed at a seminar in Malta next September. A meeting will beheld in Toulouse next November to summarise the question of the models to assist decision-making.
So here we have a concrete example of the type of work we are carrying out.
We could examine during this workshop whether this type of methodology could be ofinterest to you in the field of mountain risks.
The system was set up in 1998 and 1999. A programme is currently in place betweenAthens, Madrid, Lisbon, Paris and Strasbourg within the framework of RIMS (RiskManagement Service), in co-operation with the European Commission and in particular withthe Joint Research Centre in Ispra and the Space Applicatons Institute with Jean-MeyerRoux and Guido Schmuck.
- 23 -
APPENDIX - EUROPEAN NETWORK OF SPECIALISED CENTRES OF THE AGREEMENT
EUROPEAN OR EURO-MEDITERRANEAN CENTRES
CEMEC European Centre for Disaster Medicine (San-Marino)
CUEBC European University Centre for the Cultural Heritage (Ravello, Italy)
AFEM European Natural Disasters Training Centre (Ankara, Turkey)
ECPFE European Centre on Prevention and Forecasting of Earthquakes (Athens, Greece),European Coordination Centre on Forest Fires (Athens, Greece)
EMSC European Mediterranean Seismological Centre (Bruyères-le-Châtel, France)1
CESG European Centre for Seismic and Geomorphological Hazards (Strasbourg, France)
ECGS European Centre for Geodynamics and Seismology (Walferdange, Luxemburg)
ICoD Euro-Mediterranean Centre on Insular Coastal Dynamics (Valletta, Malta)
OOE Monaco Scientific Centre, European Oceanological Observatory (Monaco)
ECNTRM European Centre of New Technologies for the Management of Natural andTechnological Major Hazards (Moscow, Russian Federation)
ISPU Higher Institute of Emergency Planning (Florival, Belgium)
CEISE European Centre for Research into Techniques for Informing the Population inEmergency Situations (Madrid, Spain)
ECTR European Interregional Educational Centre for Training Rescuers (Yerevan,Armenia)
GHHD European Centre on Geodynamical Risks of High Dams (Tbilisi, Georgia)
European Centre on Training and Information of Local and Regional Authorities and Population in theField of Natural and Technological Disasters (Baku, Azerbaijan)
CEPRIS Euro-Mediterranean Centre for Evaluation and Prevention of Seismic Risk (Rabat,Morocco)
CSLT European Centre for School Level Training on Risk Prevention (Sofia, Bulgaria)
CRSTRA Euro-Mediterranean Centre for Arid Zones (Ksar Chellala, Algeria)
TESEC European Centre of Technological Safety, (Kiev, Ukraine)
ECILS European Centre for the Vulnerability of Industrial Installations and Infrastructures,(Skopje, Former Yugoslav Republic of Macedonia)
CERU European Centre for Urban Risks, (Lisbon, Portugal)
ASSOCIATE EUROPEAN CENTRE
Associate European Centre on Flooding (Kishinev, Moldova)
1 -The European Mediterranean Seismological Centre in Bruyères-le-Châtel, France, performs servicefunctions for the European Warning System

Natural Hazards Workshop, 5 – 7 June 2000, Igls, AUSTRIA - SATELLITE AND GIS
- 24 -
Satellite remote sensing for risk assessment in the Alps
MATHIAS SCHARDT, U. SCHMITT, K. GRANICA, AND HEINZ GALLAUN
JOANNEUM RESEARCHInstitute of Digital Image Processing, Wastiangasse 6, A-8010 Graz, Austria
Tel +43 316-876-1754 Fax +43 316-876-1720 E-mail [email protected]
INTRODUCTION
The Alpine region is faced more and more by threats of various natural phenomena, whichpose an increasing hazard to many valleys. Landslides, mudflows, flooding and snowavalanches can be named exemplary. One of the most important aspects to be considered isthe vegetation cover and land use. Particularly forest have a high protection function. Theobservation of state and health of alpine land cover and land use and its change is,therefore, a very important task of the planning authorities. However, these tasks arerendered by some requirements, of which the area coverage and the difficult access in thehigh parts of the Alps can be considered as the most important ones. The use of aerialphotography can support these tasks, but is accompanied by some drawbacks as a lack interms of costs and large area coverage.
Nowadays satellite remote sensing can play a major role to support the planning andcontrolling of protection forests and land use in high alpine regions. Satellite remote sensingbased assessment of vegetation parameters has been shown to be operational in the past.In several applications it has been demonstrated that with these data it is possible todifferentiate forest parameters such as species composition, natural age classes and crowncover as well as vegetation categories outside of the forests such as alpine meadows andshrub vegetation.
The paper briefly outlines to what extend optical satellite remote sensing can provideimportant vegetation and land use parameters on regional scale in order to support theevaluation of natural risks (avalanches and flooding) and the planning of counter measures.As alpine forest plays an important role for minimising natural risks it will also be introducedto what extend remote sensing can deliver parameters required for managing and monitoringprotection forests. The presented results are derived from the following projects:
Inventory of alpine-relevant parameters for an alpine monitoring system using remotesensing data and GIS (ALPMON), EU - DG XII, CEO, 4th Framework Programme
Satellite based environmental monitoring of European forests (SEMEFOR), EU-DG XII, PilotProjects, 4th FP
Assessing forest - stand attributes by integrated use of high-resolution satellite imagery andlaser-scanner (HIGH-SCAN), EU - DG XII, CEO, 4th FP
CONTRIBUTION OF REMOTE SENSING METHODS
In several applications it has been demonstrated that with remote sensing data it is possibleto differentiate forest parameters as species composition, natural age and crown coverage(Schardt, 1997; Schardt & Schmitt, 1996; Granica et al. 2000; Ziegler et al. 2000) as well asvegetation parameters outside of forests (Waser et al., 2000; Paracchini & Folving, 1994) ona regional base.
In the frame of the above mentioned projects requirement studies were conducted in order toget knowledge on the vegetation and surface parameters needed for risk evaluation in alpineregions. The requirement studies were performed in close co-operation with nationaladministrations and the Alpine Convention. In the following section the needs of thecustomers and the role remote sensing techniques can play are briefly outlined:
Natural Hazards Workshop, 5 – 7 June 2000, Igls, AUSTRIA - SATELLITE AND GIS
- 25 -
REMOTE SENSING FOR AVALANCHE RISK ASSESSMENT
Empirical data from many years of observation (dating back more than a hundred years) areavailable for most of the sites situated on endangered zones. They are systematicallyregistered in the national avalanche cadastre. The tracks of avalanches have been closelyexamined and monitored. The parameters included in these research activities comprisesnow, topographical parameters and type, quality and roughness of vegetation cover andcomposition of tree stands (Kleemayer, 1993; Höller, 1998; Ammer et al, 1985; Meyer-Grass& Schneebeli, 1992).
To identify potential hazard zones it is necessary to apply the criteria which have beenderived from the measurement results, such as critical degree of crown closure, criticaldegree of gaps in the forest, etc., to larger areas. In order to adapt these criteria to regionalvariation, information is needed which covers all the variables which cause avalanches overextensive areas. Another requirement is that this information should be available in digitalform in a Geographical Information System in order to ensure that by means of automatedprocesses the different information levels can be integrated and cross-referenced.
So far, however, the kind of information that would fulfil the requirements outlined has notbeen available for larger areas. While adequate data has been compiled for some areas, it isgenerally too heterogeneous to permit the integration of data into other databases. Moreover,the data only covers small areas and is, thus, not easily applied to the analyses of largerareas. In opposition to conventional inventory methods satellite remote sensing data permitsthe compilation of some of the requested spatial parameters on a small scale in an effectivemanner. The parameters derivable from remote sensing data and the accessibleapproximate classification accuracy are outlined in the following:
Forest parameters:
� Coniferous: spruce:> 90% and larch 80-90%� Deciduous: > 90%� Mixed forests: 80-90%� Forest density, different thresholds in dependence of tree specie: 70-90% in
dependence of the threshold to be applied and tree species� Stand stability: can be derived by means of 3D laser scanner data with an satisfactory
accuracy
Vegetation parameters outside of forests:
Shrub land and alpine pastures: difficult to classify due to insufficient ground resolution ofavailable satellite images
Terrain morphology:
� Roughness of surface: can be derived by means of laser scanner with height aaccuracy of about 0.5 m
� Topographic parameters such as altitude, slope and aspect: can be derived fromavailable digital terrain models or by stereo satellite images with an accuracy of 5-10m for regions where digital terrain models are not available
REMOTE SENSING FOR WATER RUN OFF MODELLING (ASGI-MODEL)
All land use changes, irrespective of whether they are the result of set aside policies, ordamage to forests, e.g. uprooted trees due to gale-force winds, are likely to effect thehydrological cycle and the quality of the water. It is further stated that regional climaticchanges may also have an impact on the hydrologic balance of surface waters in CentralEurope. In alpine areas increases in temperatures are expected to affect snow melt periods

Natural Hazards Workshop, 5 – 7 June 2000, Igls, AUSTRIA - SATELLITE AND GIS
- 26 -
and also the altitudes up to which snow is likely to melt, which again is likely to represent anadditional hazard potential, as e.g. due to higher volumes of runoff.
Generally, precipitation-runoff-models (e.g. AGNPS - Agricultural Non-Point Source PollutionModel; GAME - GIS-supported run-off model based on precipitation events) are used todescribe run-off patterns as well as material displacement caused by erosion-inducingprecipitation in medium-scale catchment areas (Kleeberg & Becker, 1999 and Molnar &Kasper, 1998). They are employed to describe current water and material movement, topredict future movement patterns and to forecast specific events (floods).
One important aspect in the process of water run off modelling is data acquisition andprocessing as well as data preparation (analysis, filtering, regional adaptation), i.e. the entirerange of tasks from pre-processing to the development of files for model-specific parametersand records. One of the reasons for this emphasis on the availability of data is that many ofthe available models have proved unsuitable for practical applications because data was notsufficiently available on smaller scales. It would therefore be advantageous if in future onlymodels were used which can be easily adapted to any given catchment area and do notrequire lengthy and costly periods of data measurement and acquisition before each newapplication.
The ASGI model developed by the Bayerisches Landesamt für Wasserwirtschaft/Münchenand the University of the Bundeswehr/München can be applied for river catchment areas witha size of 1 km2 to several 1000 km2 and, thus, fulfils these requirements. ASGI is developedto calculate run off processes and solid matter fluxes in hydrological catchments with hightemporal and spatial resolution. For the ASGI model remote sensing is an effective tool todeliver necessary input vegetation parameters on a regional or catchment scale. Therequested parameters which can be assessed by means of remote sensing are listed in thefollowing:
Forest parameters:
� Coniferous: >90%� Deciduous: >90%� Mixed forests: 80-90%
Vegetation parameter outside of forests:
� Different qualities of alpine pastures: can be assessed considering the differentphenological development of different pasture types by using multitemporal/ seasonalsatellite images
Terrain morphology:
� Topography: see above
REMOTE SENSING FOR MANAGING AND MONITORING OF PROTECTION FORESTS
Alpine protection forests are exposed to immediate and considerable environmental threat.This is due to an aggressive development drive in the past, huge numbers of tourists as wellas environmental damage. Particularly protection forests have recently been subjected toparticularly damaging natural as well as anthropogenic influences. The catastrophic stormsof 1990 and 2000, the resultant, and lasting problem of the bark beetle, and global climaticchanges have weakened the resilience of alpine forests. The culminative effect of all thesefactors often proves disastrous, resulting in irreversible changes in the composition anddistribution of alpine forest cover. Far-sighted planning is necessary to ensure that preventivemeasures can be implemented by Forest Authorities and Nature Conservation. The successof such measures crucially depends on the availability of information about the spatialdistribution and the condition of alpine protection forests and their development dynamics.

Natural Hazards Workshop, 5 – 7 June 2000, Igls, AUSTRIA - SATELLITE AND GIS
- 27 -
The Forestry Services in Austria are responsible for these measures. For long term planningmost of them have installed a Geographical Information System (GIS) using different rasterand vector based data, but they do not have spatial information on the most relevant forestparameters at a smaller scale. Remote sensing methods have been shown to be operationalto deliver the following spatial information relevant for planning and monitoring of protectionforests:
Forest parameters:
� Coniferous forest into spruce, larch, stone pine: accessible accuracy see confusionmatrix in table 1
� Deciduous forest into alder and rest: accessible accuracy see confusion matrix table 1� Mixed forests: Accessible accuracy see confusion matrix table 1� Forest densities into 10-30%, 30-60% and more than 60%: accuracy see confusion
matrix in table 2� Natural Age Classes into culture/thicket, pole timber/timber and old timber: 70-80%� Forest boundary: >95%
Terrain morphology:
Roughness of surface and topography (see above)
Table 1:Stand Wise Verification of Forest Type.
Forest Type Spruce Larch La/ Spruce Mix Broadleaf Mpine AlderStands
UsersAccuracy
Mean ClassAccuracy
Spruce 32 32 100.0 86.36Larch 1 1 100.0 100.0La/ Spruce 11 66 1 1 79 83.54 91.02Mixed 1 1 35 11 1 49 71.43 84.33Broadleaf 25 1 26 96.15 82.80Mpine 2 2 100.0 83.33Alder 4 4 100.0 83.33ProducersAccuracy
72.73 100.0 98.51 97.2 69.44 66.67 66.67 193 85.49overall
Kappa coefficient: 0.81
Table 2.Stand Wise Verification Crown Closure Classes
CrownCover
0%-30%
30%-60%
60%-90% Stands
UsersAccuracy
MeanClassAccuracy
0%-30% 4 4 100.00 90.0030%-60% 1 24 1 26 92.31 92.3160%-90% 2 161 163 98.77 99.08Producersaccuracy
80.00 92.31 99.38 193 97.93overall
Kappa coefficient: 0.92
CONCLUSION
The planning of measures against natural risks demand a detailed and expanded inventoryand monitoring capacity. Remote sensing data represent a cost-efficient system that makesavailable initial parameters needed for regional risk assessment and even takes into accountchanges in vegetation cover and land use patterns over time (Schardt et al. 1998). Noadditional digitalisation is necessary to prepare data and classifications derived from satellite
Natural Hazards Workshop, 5 – 7 June 2000, Igls, AUSTRIA - SATELLITE AND GIS
- 28 -
images so that they can be directly entered into Geographical Information Systems andmodels. Although satellite classification cannot generate the same broad range of categoriesderived from an extensive air-photo interpretation or field survey, it has still been found to beof high value to the planning authorities, mainly because of its regional coverage andobtainable accuracy.
REFERENCES
AMMER, U.; MÖßMER, E.M.; SCHIRMER, R. (1985): Vitalität und Schutzbefähigung vonBergwaldbeständen im Hinblick auf das Waldsterben. Forstwissenschaftliches Centralblat 104(1085), pp. 122-137.
KLEEBERG, H.-B. & BECKER, M. (1999): ASGI-Dokumentation Bd. 1-3, Univ. d. BundeswehrMünchen, Inst. f. Wasserwesen und Bayerisches Landesamt f. Wasserwirtschaft, Sachgebiet 26 –BD., Fachplanung und Bewirtschaftung. Neubiberg, September 1999.
HÖLLER, P. (1998): Tentative investigations on surface hoar in mountain forests. Annals forglaciology 26/1998, pp. 31-34.
KLEEMAYER, K. (1993): Berechnung von Waldlawinenkarten mit GIS. Österreichische Forstzeitung7/1993, pp. 29,30.
MEYER-GRASS, M. & SCHNEEBELI, M. (1994): Les avalanches en foret et leur dependance auxcondition de la station, du peuplement et de la neige. Symposium International INTERPREVENT1992, Bern.
MOLNAR, T. & KASPAR, G. (1998): Parametermodelle und effektive Parameter zur Simulation vonWasserflüssen. Schwerpunktprogramm “Regionalisierung in der Hydrologie”. DFGForschungsvorhaben KL 342/16-6. Endbericht.
GRANICA, K.; SCHARDT M. & GALLAUN, H. (2000): Monitoring of Protection Forests by Means ofSPOT4 Satellite Data. Proceedings of 20th EARSEL-Symposium “A Decade of Trans-EuropeanRemote Sensing Cooperation”, 14 – 16 June 2000, Dresden, Germany.
LAATSCH W. (1976): Zur Struktur und Bewirtschaftung der Wälder im bayerischen Alpenraum, DieEntstehung von Lawinenbahnen im Hochgebirgswald. Forstw. Cbl. 96 (1977), 89-93.
PARACCHINI M. L. AND FOLVING S. (1994): Land use classification and regional planning in ValMalenco (Italian Alps): a study on the integration of remotely sensed data and digital terrain modelsfor thematic mapping. In Martin F. Price and D. Ian Heywood (Ed.): Mountain Environments &Geographic Information Systems.
SCHARDT, M.; & SCHMITT, U. (1996): Klassifikation des Waldzustandes für das Bundesland Kärntenmittels Satellitenbilddaten. Österreichische Zeitschrift für Vermessung & Geoinformation, Heft 1/96,84. Jahrgang 1996.
SCHARDT, M.; GALLAUN, H. & HÄUSLER, T. (1998): Monitoring of Environmental Parameters in theAlpine Regions by Means of Satellite Remote Sensing. Proceedings of the International ISPRS-Symposium on "Resource and Environmenal Monitoring, Local, Regional, Global, Commission VII,September 7-4, 1998, Budapest, Hungary.
SCHARDT, M. (1998): Erfassung forstlicher Parameter mittels Landsat/TM-Daten. AllgemeineForstzeitschrift/Der Wald 24/1998, pp. 1461-1463.
WASER, L.; CATALINI, M.; SCHARDT, M.; SCHMITT, U. & ZINI, E. (2000): Inventory of Alpine-Relevant Parameters for an Alpine Monitoring System Using Remote Sensing Data. Proceedingsof the XVIII ISPRS Congress, Amsterdam.
ZIEGLER, M.; KONRAD, H.; HOFRICHTER, J.; WIMMER, A.; RUPPERT, G.; SCHARDT, M. &HYYPPÄ, J. (2000): Assessment of Forest Attributes and Single-Tree Segmentation by Means ofLaser Scanning. Proceedings of SPIE, Vol. 4035, AeroSense 2000, Laser Radar Technology andApplications V, 26.-28. April 1998, Orlando, Florida.

Natural Hazards Workshop, 5 – 7 June 2000, Igls, AUSTRIA - SATELLITE AND GIS
- 29 -
Internet GIS for disaster mitigation and civil defence in Tirol
BERND NOGGLER
tiris–Systemgruppe, DVT-Daten-Verarbeitung-Tirol GmbH, Angerzellg. 1, A-6020 Innsbruck, AustriaTel 0512 508 3372 Fax 0512 508 3355 E-mail [email protected]
INTRODUCTION
The avalanches in Galtür and Valzur, the landslide in Schwaz and the landslip nearSchönwies in Tirol in 1999 have opened up new fields and new opportunities for tiris (GISdes Landes Tirol).
Experience has shown that there are at least three basic assumptions necessary before GIScan be efficiently incorporated into operational disaster management.
� The decision-makers in the operations centre must be fully aware of the possibilitiesoffered by GIS, ensuring routine implementation when a disaster occurs.
� Given the above knowledge, it must be possible for the operations centre personnelto see which information is available in which locality (e.g. tiris.gem database).
� The available digital data must be processed with the relevant algorithms, and bequickly accessible – well catered for using GIS on the Internet. The inclusion of digitaldata can then become commonplace when dealing with future disasters. Not only canthe required specific information for a given disaster be made available rapidly andwidely, it can also be updated frequently. The use of GIS maps on the Web has to besimple to use, clear and unequivocal – especially important given its use in high-stress situations.
GIS ON-LINE SERVICES (TIRIS – GEOGRAPHICAL SERVICES)
� Natural Hazards: The study of natural hazards enables access to all of the relevant,digitally available data in Tirol. The basic information is derived from the hazardouszone maps of the forestry services (for torrents, avalanches, mudslides and rockfalls), and the flood-risk maps of the local river authority. To ensure that these dataare operationally not only quickly available, but also specific to a given situation, theinformation is grouped into three categories; avalanches, water and earth. Abackground aerial photo is loaded initially as background information. Furtherinformation is displayed depending on the chosen scale of the image. A digitaldisaster map may then be superimposed.
� Address Location: For pinpointing a location, especially in populous districts, areasmay be searched for using the local place names. For this, the local names forhouses and local areas were established. The functions of public buildings (counciloffices, doctor’s surgeries etc.) and company descriptions (especially where involvedin tourism) are also available as additional attribute information. This information maybe searched using a text field, enabling the site of important buildings to be foundrapidly without prior knowledge of the address. As in the use of GIS for naturalhazards, it is possible to determine the longitude and latitude of every point. GPS canthen be used to enable emergency vehicles to locate the site very accurately.
REFERENCES
Niedertscheider, J. (2000): Naturgefahren Online, http://www.tirol.gv.at/tiris. In: Beiträge zum 5.Symposion zur Rolle der Informationstechnologie in der und für die Raumplanung, Band 1, S. 95 - 98.Noggler, B. (1999): Neue Medien im Katastrophen und Zivilschutz. In: roinfo, Tiroler Raumordnung,Heft 19, November 1999, S. 39 – 41.

Natural Hazards Workshop, 5 – 7 June 2000, Igls, AUSTRIA - SATELLITE AND GIS
- 30 -
Noggler, B. (2000): GIS im Katastrophen und Zivilschutz (Neue Medien im Internet). In: AngewandteGeographische Informationsverarbeitung XII, in press.
Riedl, M. (1999): Digitale Adressverortung für Tirol. In: roinfo, Tiroler Raumordnung, Heft 17, Juni1999, S. 37 – 39.

Natural Hazards Workshop, 5 – 7 June 2000, Igls, AUSTRIA - SATELLITE AND GIS
- 31 -
Remote sensing and GIS technique in environmental impactassessment and management of the Vikos–Aoos Greek
mountainous park
MICHAEL PETRAKIS, BASIL PSILOGLOU, IPHIGENIA KERAMITSOGLOU*, C. CARTALIS*,AND M. LIANOU
Institute of Environmental Research and Sustainable DevelopmentNational Observatory of Athens, P.O.Box: 20048, GR 118-10 Athens, Greece
Tel.: +30-1-3490114, 3490111, Fax: +30-1-3490113, E-mail: [email protected]*Remote Sensing and Image Processing Team,
Division of Applied Physics, Dpt. of Physics, University of Athens,Panepistimioupolis, Build. PHYS - V, GR - 15784, Athens, Greece
The Vikos-Aoos gorge in Northern Greece an area of 12600 Ha was designated in 1973 asNational Park in an effort of the Greek Government for the conservation of the rich in speciesfauna and flora of the park and the protection of the cultural heritage of the area. The Park isspreading from the canyon of Vikos (Voidomatis river) up to the banks of the main river ofAoos and the intermediate area of Tymphi mountain (Alt.: 2.497 m). The intensive geologicalformations and the structure of the area together with the high altitudes and low elevationareas have contributed to the creation of a unique variety of habitats where many importantbird, animal and plant species have found a natural resort to develop. The core of the park(approximately 3000 Ha) is spreading along the valley of Vikos river and its tributaries.
The greatest dangers of the area are land erosion, landslides, forest fires, grazing as well asthe illegal hunting which threaten the local flora and fauna. Other serious environmentalproblems are the impact of tourism development and the extreme geophysical conditionswhich make the construction and maintenance of the necessary infrastructure works (mainlyaccess routes and telecommunications) rather difficult.
The vast area of the park and the lack of route infrastructure constitute remote sensing asthe only means for monitoring the human activities in the area and their impact on theecosystem. The evolution analysis started by taking an as detailed as possible picture of theterritory covering at least the following items: horography and slopes, road networks, landcover and use, human settlements, tourist sites. The information was collected andorganised in a Geographic Information System (GIS) that constitutes the base for furtherevaluations and impact analysis.
The GIS input data (contour lines, rivers, elevation points, etc.) has been digitised from maps(1:50.000 scale) of the Army’s Geographical Service in order to create the basic informationlayers of the landscape, the aspects and the slopes. All these data were also collected forthe creation of the hydrological model of the area.
At the same time, satellite data analysis was performed for the production of extra GISinformation layers. Specifically, panchromatic high resolution images SPOT (1988) and IRS(1998) were used as well as Landsat images (resolution 30m) for the years 1991 and 1998.The greater area of the park was covered by an IRS WiFS satellite image of 1997, at thevisible and ultra-red light with a resolution of 180m. Satellite images have beengeoreferenced at the UTM-WGS84 projection system, and analysed - classified in order totake the necessary information.
All the results have been included in the produced maps, with a space-time evolution of allthe critical parameters and with the conclusions of the study. Through all this process isobvious the value of the Satellite Remote Sensing and the Geographic Information Systemfor the better management of a Mountain National Park.
Natural Hazards Workshop, 5 – 7 June 2000, Igls, AUSTRIA - SATELLITE AND GIS
- 32 -
EGAR project to tame the data jungle
KURT ZIEGNER
Landesforstdirektion, Amt der Tiroler Landesregierung,Bürgerstraße 36, A-6020 Innsbruck, Austria
Tel +43 512 508 4560 Fax +43 512 508 4505 Email [email protected]
Diverse forms of landuse (agriculture, forestry, tourism, etc.) and the variety of naturaldangers found in alpine areas (avalanches, floods, mudflows, etc.) make regional planningparticularly prone to conflicts. Many institutions have thus tried to develop approaches for asustainable and multifunctional use of these areas.
Earlier studies have led to a jungle of highly scattered and hardly related results. In theframework of the EGAR Project [EinzugsGebiete in Alpinen Regionen, which is German for‘catchment areas in alpine regions’] various local, provincial and federal authorities as well astechnical bodies in Germany, Italy and Austria try to co-operate on an interdisciplinary basisin order to deal with area planning issues in a more transparent and efficient way. The aim ofthe Project is to study two alpine areas, the Zillertal and the torrent areas between Garmisch-Partenkirchen and Oberammergau, and to collect and compare data about land uses andnatural dangers. Areas where uses and dangers clash impressively reveal existing andpotential conflicts.
Data evaluated in the course of the Project provide a valuable basis for a broad range ofarea-planning activities: hazard zone mapping, zoning, improved assessment of naturaldangers, identification of interrelations, transparent ranking of priorities, development ofmethods of collecting and evaluating data on natural areas at the regional planning level.Basic and large-scale processes are to be determined. Other important aspects of this cross-border Project are knowledge transfer and the use of synergies. EGAR will be a meaningfuland modern instrument for future planning tasks in South Tyrol, Bavaria and Austria.
GENERAL DATA:
Subsidisation by the European UnionPlanning period: 1998 to 2001Planning scale: 1 : 20,000 (Tyrol); 1 : 25,000 (Bavaria)Project area: 1,200 km² (Tyrol); 120 km² (Bavaria)
PARTICIPATING INSTITUTIONS:
Office of the Tyrolian Provincial Government (Provincial Forest Administration, agriculturalmanagement, water management including hydrographics and flood control measures, TIRIS[Tyrolian area planning information system], area planning)BMLFUW – Department IV, Water, of the Austrian Federal Ministry of Agriculture, Forestry,Environment and Water ManagementBMLFUW – Department V, Forestry, of the Austrian Federal Ministry of Agriculture, Forestry,Environment and Water ManagementForest Engineering Service on Torrent and Avalanche Control, regional headquarters for thewestern Lower Inn Valley, Geological UnitInnsbruck local building authorityBavarian State Office for Water ManagementAutonomous Province of Bolzano, South Tyrol (special unit for torrent and avalanche control)Schabl Geographic Information Systems, project co-ordination

Natural Hazards Workshop, 5 – 7 June 2000, Igls, AUSTRIA - AVALANCHES
- 33 -
The avalanche winter 1999 in Switzerland – an overview
WALTER J. AMMANN
Swiss Federal Institute for Snow and Avalanche Research SLF,Flüelastrasse 11, CH-7260 Davos-Dorf, Switzerland,
Tel +41 81 417 0111, Fax +41 81 417 0823, E-mail: [email protected]
The winter of 1998/99 was extraordinary in many ways in Switzerland. Three precipitationperiods accompanied by stormy north-westerly winds brought large amounts of snow to theSwiss Alps between January 27th and February 25th. During these 30 days the new snowamounts were over 500 cm, in particular on the northern flank of the Alps, i.e. more than theusual amount for the whole winter. In the central Bernese Oberland and in neighbouringareas the 30-day new snow amount attained a maximum periodicity of 80-100 years. Inmany parts of Wallis, Nordbünden and Unterengadin there was over 300 cm of new snow,corresponding to a periodicity of around 40 years.
The consequence of the unusual snowfalls was very widespread, intense avalanche activity.Approximately 1200 destructive avalanches occurred in the Swiss Alps during the winter of1998/99. About 3000 more occurred but caused no damage. Most avalanches occurred inparallel to the three intense precipitation events, in three periods of increasing intensityaround January 29th, February 9th, and February 22nd. The main determining factor for thelarge avalanche events in February 1999 were the intense snowfalls which lasted for almosta month, in conjunction with low air temperatures. Strong north-westerly winds led to theformation of large accumulations of drifted snow and further worsened the situation. Thestability of the snow cover was poor. The combination of these effects and a marked rise inair temperature led to the most intense avalanche activity of the winter between February20th and 23rd. The entire northern flank of the Alpine ridge and parts of Wallis andGraubünden were strongly affected. Local centres of very high avalanche activity were to befound in the Mattertal, Lötschental, Goms, Haslital, Uri, Glarnerland, and in the area Klosters-Davos-Zernez.
The two highest levels of the European avalanche danger scale were used for the first timeover longer periods of time since the introduction of the scale in 1993 (the level 'very high' on6 days). In mid-April 1999 the avalanche danger reached the level 'high' again. The Gotthardarea and the eastern part of the main Alpine ridge were particularly affected.
Intense avalanche activity causing damage to people and objects occurs approximatelyevery 10 years in the Swiss Alps. During the heaviest avalanche winter of the 20th century,in 1951, 98 people were killed, 73 in buildings. In February 1999, 28 people were caught ininhabited areas or on roads and 17 of these died (11 located in buildings). This number isrelatively small in comparison with earlier avalanche winters despite the fact that there weresignificantly more people in the mountains due to the growing development of leisure- andtourist activities. In 1999 lines of transport were mainly affected. As a result of intensedevelopment in alpine areas, interruption of transport, power and communication links hadgraver consequences than 50 years earlier and this should be weighted accordingly.Additionally, in the course of winter 1998/99, 77 tourist avalanches affected 131 snow sporttourists, of whom 19 were killed.
In addition to 17 avalanche victims, damages of over 600 million Swiss francs were caused.The direct damages induced by avalanches, snow pressure and snow loads amount toaround 440 million francs. The indirect damages due to financial losses in the tourist sector,loss of income in commerce, industry, power supplies and interruptions of road and railtransport are approximately 180 million francs.
The costs of the damages (over 600 million francs) of the 1999 avalanche winter are veryhigh. It is noteworthy however that the damages would have been very much higher withoutthe means of protection established in the past decades. Approximately 10 km of snowsupporting structures have been built annually since 1951. About 1.5 billion francs have been
Natural Hazards Workshop, 5 – 7 June 2000, Igls, AUSTRIA - AVALANCHES
- 34 -
invested in avalanche defence structures until present. In the context of integral avalancheprotection, road closures, evacuations, artificial avalanche release and improved avalanchewarning have been applied increasingly since 1951. The annual financial investments foravalanche protection and forestry projects culminated at around 70 million Swiss francs in1990 and have levelled out at approximately 40-50 million Swiss francs on an annual basissince.
Organisational means of protection have an important role - both for prevention and in acutesituations. As a result of the Swiss federal structure, these means are organised separatelyat the cantonal and communal levels. The authorities and the general public receive thenecessary information from the Swiss Federal Institute for Snow and Avalanche Research(SLF) in Davos. The institute’s avalanche warning service bases its information onmeasurements and model calculations from about 70 automatic snow and weather stations(IMIS network), on observations and measurements effected by around 80 observers, onsnow profiles, on measurements and data from the Swiss Meteorological Service (SMA) andfrom the German weather service - as well as on information delivered by local avalanchespecialists, mountain guides, security services and ski mountaineers.
In winter 1999 a snow and avalanche early warning was sent out for the first time on 6 days.This consists of a warning given out three days before major snow falls and the resultingavalanche activity. In addition to the national avalanche bulletin, regional avalanche bulletinswere made for central Switzerland and for north and central Graubünden. Analysis of theSLF avalanche warnings and of crisis management in the 5 most affected cantons show thatthe system of subsidiary for organisational means of coping with the extraordinary situationproved to be efficient. Further improvements must nevertheless be made in this field. Thevarious avalanche commissions are differently equipped with decision making support toolssuch as InfoBox, NXD2000 or IMIS stations, and these disparities should be reduced. Thelevel of qualification of the members of the avalanche commissions is also very variable andshould be improved. These analyses emphasised two important points: firstly, a completenetwork of avalanche specialists should be established, and secondly, an early warning andinformation system is required. The latter should guarantee exchange of information betweenthe numerous decision makers and information sources and also keep the public wellinformed. This system can also be used to counter other catastrophic situations such asfloods and storms.
In a small, densely populated country like Switzerland, land-use planning has an importantfunction for risk avoidance from natural hazards. The analysis of the application of avalanchehazard maps show that there are large discrepancies between the different cantons. In somepotentially endangered communes there are no avalanche hazard maps. The use of anavalanche cadastral map is not established in all cantons. Analysis of damages in Wallis forexample showed that ten buildings were affected in red hazard zones, and 109 in blue oryellow zones of avalanche hazard maps. In general, the avalanche cadastral and hazardmaps were used as an important basis for the planning of road closures and evacuations.
There is only sparse quantitative information on the size of the avalanche fractures. Manyavalanches had enormous fracture heights and widths, often corresponding to the totalpotential fracture area. This led to transgression of the zone limits on existing hazard maps,particularly around February 20th; in many cases the powder component of the avalanchestransgressed the limits. Multiple avalanche events led to lateral overflow of dams and smallor previously filled deviation dams were also overflowed. Multiple events must be weightedmore carefully in future risk assessments and in the planning of means of protection.Although land-use planning proved to fulfil its function satisfactorily on the whole, theanalysis showed that research is necessary for modelling flow avalanches and in particularcombined flow/powder avalanches.
Measurements of avalanche dynamics were effected on the SLF test site Vallée de la Sionne(canton Wallis). Speeds of up to 80 m/s at the front of the avalanche and around 110 m/s inthe avalanche were recorded using Doppler radar. These measurements show that

Natural Hazards Workshop, 5 – 7 June 2000, Igls, AUSTRIA - AVALANCHES
- 35 -
avalanche speeds in the avalanche track have been underestimated until present. For thefirst time these tests allow the validation of computer models being developed at SLF.
Inspection of many defence structures (snow supporting structures, wind fences, deviatingstructures, retention dams and avalanche galleries) during the winter allowed manyinteresting observations to be made. No large avalanches were triggered between snowsupporting structures - they fulfilled their function efficiently. Despite the fact that thesestructures were completely filled in many places, they withstood the very high loads.Damages to structures amount to 8 million francs and are relatively low. They occurredmainly in areas where avalanches flowed over the structures. Structures located on the endsof rows and in areas with strong snow gliding were found to be rather scarcely dimensioned(dimensions according to the BUWAL/WSL guidelines, 1990) and higher loads may have tobe considered in future. It should also be determined how the efficiency of defence structuresand the residual risks can be quantified - and by which criteria rezoning can be undertakenwhen defence structures are built according to the official guidelines. Avalanche galleriesalso proved to be very efficient, and were only overflowed laterally by very large avalanchesor in cases of multiple events. However, poorly dimensioned dams caused new hazards andimportant damages. Maintenance of the numerous defence structures must be ensured infuture, and this requires the appropriate organisation.
Artificial avalanche release had an important role in winter 1999. Regular triggering avoidedthe formation of large avalanches in many areas. The method was generally useful; however,there were also significant damages to buildings and diverse infrastructures, confirming thatthere is risk involved. The danger of artificially triggered avalanches being larger thanexpected or of not being triggered artificially but occurring later cannot be avoided.Estimation of possible extreme run-out areas and organisation of large-scale closures provedto be essential for avoiding damages, in particular in cases where avalanches reach valleybottoms. The result of artificial releases must be verified in order to make the method auseful instrument for increasing the safety of roads and infrastructures. If the result is notclear, it is very delicate to interrupt means of protection such as road closures. The securitystaff, including mine throwers and rocket shooters, must be well qualified and have attendedobligatory courses guaranteeing this.
The absence of avalanche fractures in forests in winter 1999 was particularly striking.Weather and snow cover conditions had a positive influence on the role of the forest. Hardlyany avalanches started in forests, even in potentially dangerous areas. The efficiency offorest structures cannot be established satisfactorily. One positive aspect for avalancheprotection is definitely the constantly increasing surface area of forests and their growingdensity.
The avalanches caused the formation of new potential dangers, for example, the presence oftrees in stream beds. Clearing avalanche debris timber is not always meaningful or possible.However, priority should be given to the clearing of river beds which threaten to be dammedby timber.
Finally, it appears that integral avalanche protection in the form of an optimal combination ofvarious preventive and crisis management systems was successfully put to the test inFebruary 1999. The last winter confirmed that complete protection is impossible due totechnical, economic and ecological limitations. Existing avalanche defence structures shouldbe completed wherever necessary. All efforts in this direction must therefore be pursued. Thelimited existing financial resources should be put to use in an optimal manner for integral riskmanagement, i.e. for protection strategies which include various different and complementarymethods of protection. Risk assessment methods and methods for the evaluation of theeconomic efficiency of means of protection have priority. Integral risk management should beapplied increasingly to other natural hazards such as floods and storms in future.
Natural Hazards Workshop, 5 – 7 June 2000, Igls, AUSTRIA - AVALANCHES
- 36 -
New developments of the Avalanche Warning Service of the Tyrolfor increasing the quality of local avalanche warnings
RUDOLF MAIR
Government Tyrol, Abt. Katastrophen- und Zivilschutz,Bozner Platz 6, A-6020 Innsbruck, Austria,
Tel +43 512 508 2250, E-mail [email protected]
The Avalanche Warning Service of the Tyrol created a measuring network of more than 30automatic weather-stations in the past few years. Right now those wireless transmitted dataform the most important basis for the evaluation of the current avalanche situation.Additionally to the meteorological data different stability analyses are another important basisfor the evaluation. The collected data are saved on a server and are accessible via ftp for allprospective customers (weather services, avalanche commissions, research institutes). Forthe visualisation of the data the Avalanche Warning Service of the Tyrol developed its ownsoftware, which was adapted to the needs of the local avalanche warning commissions. Dueto the enormously risen quantity of data, we decided to develop a data base (WISKIAvalanche), where all avalanche-related data are to be stored. In this data base an automaticquality control of all meteorological data is integrated, too. Thus WISKI Avalanche also offersthe basis for different process and prognosis models, which are tested and adapted by theAvalanche Warning Service of the Tyrol (project NAFT ’ New Avalanche ForecastingTechnologies ’). Since however improvements in the avalanche protection can’t be attainedexclusively by new measuring methods or models, the Avalanche Warning Service of theTyrol elaborated in co-operation with the University of Innsbruck a study plan for a post-graduate study called ’Natural Hazards Management’. Apart from those studies it isadditionally planned to offer special modules to relief organisations and avalanchecommissions.
Natural Hazards Workshop, 5 – 7 June 2000, Igls, AUSTRIA - AVALANCHES
- 37 -
The application of the SAMOS - model for avalanche control
HORST SCHAFFHAUSER, PETER SAMPL*, AND THOMAS ZWINGER**Institute for Avalanche and Torrent Research, Hofburg-Rennweg 1, A-6020, Austria
Tel: +43 512 573933, Fax: +43 512 573933-5250, E-mail: [email protected]
*AVL List GmbH, Hans-List-Platz 1, A-8020 Graz, AustriaTel: +43 316 787-439, Fax: +43 316 787-777, E-mail: [email protected]
** Department of Fluid Dynamics and Heat Transfer, Technical University Vienna, WiednerHauptstrasse 7/E322, A-1040 Wien, Austria
Tel: +43 1 58801-322-25 Fax:+43 1 58801-322-99, E-mail: [email protected]
Changes in economic and social behaviour of the west-European societies led to anincreasing and expanding of tourist recreation areas and ski resorts. As a consequence ofthat development traffic infrastructures, settlements and also human lives got more and morethreatened by avalanches. In this respect, the knowledge about the avalanche formation, itsdynamics and its behaviour in the whole catchment is of extreme importance. For this reasonthe SAMOS (Snow Avalanche Modelling and Simulation) model was developed for theMinistry for Agriculture and Forestry of Austria in cooperation with the Austrian Torrent andAvalanche Control, the Research Station for Combustion Machines (AVL) in Graz, theAustrian Institute for Avalanche and Torrent Research (FBVA) and the Department of FluidDynamics and Heat Transfer, University of Vienna.
The so called „Catastrophic-Avalanches“ are avalanches with a dense flow part and a highpowder snow component. The dense flow model is based on the granular model, in whichthe momentum is transferred by particle contacts and collisions. In the case of the powderpart the mathematical model based on the fundamental principles of fluid dynamics and theeffects of turbulence are taken into a two equation turbulence model. The two-dimensionalgranular flow model for the dense part and the three-dimensional turbulent powder partmodel are coupled by a simple transition model.
The model allows to assess protective constructions such as avalanche dams or retainingwalls as these enter the calculation by modifying boundary (terrain model) of initial (releasezone) conditions. Upper limits of pressures on constructions can be obtained by consideringdynamic avalanche pressure predicated by modelling.
The verification of results of avalanche simulation is an important goal in the frame ofresearch at the institute for Avalanche and Torrent research in Innsbruck.
Further research is strongly demanded for finding of correct input data for the release area(e. g. snow depth, density), criteria which may influences enormously the result of thesimulation.

Natural Hazards Workshop, 5 – 7 June 2000, Igls, AUSTRIA - AVALANCHES
- 38 -
Potential of microwave remote sensing for assessing critical snowproperties
CHRISTIAN MÄTZLER
Institute of Applied Physics, University of Bern,Sidlerstr. 5, CH-3012 Bern, Switzerland
Tel: +41 31 631 45 89, Fax: +41 31 631 37 65, email: [email protected]
The stability of snowpacks is largely controlled by microphysical properties. Since the typicalsize of snow structure is in the millimeter range, microwaves within this wavelength rangehave the potential to study and monitor snowpack properties relevant for avalanche forma-tion.
The potential of microwaves to see through clouds and their independence of daylight makesthem useful to monitor in adverse conditions. Furthermore, water is a special substance dueto its large dipole moment, leading to distinct microwave interactions for ice and liquid water.In contrast to point measurements, remote sensing methods give area of volume- averagedinformation. By these properties microwave remote sensing offers a new dimension in snowdiagnostics by two types of methods:
� Passive Sensing – Microwave Radiometry:Observables are brightness temperatures Ti ≅ ei⋅T (i = received polarisation, usuallylinear h and v) where ei is the emissivity (strongly variable for snowpacks: ei = 0.5 to1, with ev > eh, and by Kirchhoff’s law, ei = 1–ri, ri being the reflectivity), and T is theeffective temperature of ground and snow, often near 273 K.
� Active Sensing – Radar (including SAR, FMCW) and ScatterometryObservables are backscatter coefficients γji,, i = transmitted, j = received polarisation(or normalised radar cross section σ0
ji=cosθ⋅γji), range, speed, coherence and phase.
Radiometer, Radar
θ
antenna footprint
Fig 1: Geometry of microwave remote sensing of snowpack properties.
In order to study the potential of microwave remote sensing, the Institute of Applied Physics,partly in cooperation with partners (Snow and Avalanche Research Institute in Davos and theUniversity of Innsbruck) carried out snowpack experiments in alpine areas by active andpassive microwave sensors [1–8], accompanied by snowpack structural characterisation [8],and by modelling [9, 10]. This work revealed insight into the potential and limits of microwavemethods for use in remote sensing of snowpack properties (Table 1). The frequency-

Natural Hazards Workshop, 5 – 7 June 2000, Igls, AUSTRIA - AVALANCHES
- 39 -
dependent penetration depth (Figure 2) helps in the localisation of features within the pack.Dry seasonal snowpacks are usually transparent up to at least 10 GHz.
1 10 1002 5 20 500.1
1.0
10.0
100.0
1000.0
Dry Snow: density 300kg/m3temperature 270 K
pc=0.1mm
0.2
0.3
PenetrationDepth (m)
Frequency (GHz)
1 10 1002 5 20 50
0.010
0.003
3
0.3
0.03
1
0.1
W=0.05
0.01
Wet Snow
PenetrationDepth (m)
Frequency (GHz)
Fig 2: Microwave penetration depth dp in snow of density 300 kg/m3; in dry snow (top) dp dependsmainly on grain size, here expressed as correlation length pc, where pc≅0.1mm is typical forfine-grained snow and pc≅0.3mm for depth hoar, and in wet snow (bottom, with pc=0.3mm) dp
mainly depends on volumetric liquid water content W with typical values of 0.01 to 0.05.Computed from [9], in agreement with experiments [2, 8, 15].
The distinction between dry and wet snow appears to be easy, the liquid-water content in thesurface layer can be remotely sensed, and in case of rain on snow, information can beobtained on rain intensity. Information about the state of dry snow can be obtained becauseof the high sensitivity of microwave scattering on frequency, grain size and layering. Recentlydeveloped tools, such as the Microwave Emission Model of Layered Snowpacks (MEMLS),allow to evaluate quantitative relationships between snow parameters and observables.Links with snow-physical models (to simulate snowcovers in all details with meteorologicalinput data), such as the French model Crocus, have been established [11], and an extensionof MEMLS to include backscattering is in preparation [16]. Crocus and MEMLS werecombined to test the overall model with microwave observations. Qualitative agreement of
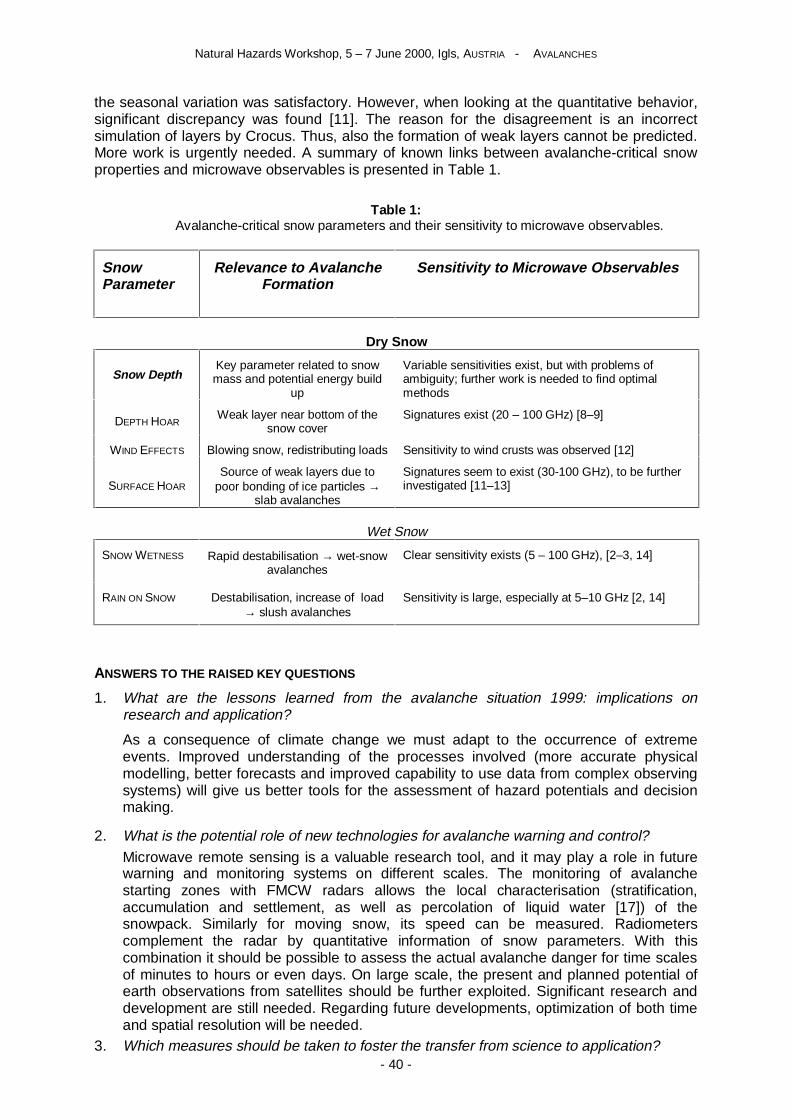
Natural Hazards Workshop, 5 – 7 June 2000, Igls, AUSTRIA - AVALANCHES
- 40 -
the seasonal variation was satisfactory. However, when looking at the quantitative behavior,significant discrepancy was found [11]. The reason for the disagreement is an incorrectsimulation of layers by Crocus. Thus, also the formation of weak layers cannot be predicted.More work is urgently needed. A summary of known links between avalanche-critical snowproperties and microwave observables is presented in Table 1.
Table 1:Avalanche-critical snow parameters and their sensitivity to microwave observables.
SnowParameter
Relevance to AvalancheFormation
Sensitivity to Microwave Observables
Dry Snow
Snow DepthKey parameter related to snowmass and potential energy build
up
Variable sensitivities exist, but with problems ofambiguity; further work is needed to find optimalmethods
DEPTH HOARWeak layer near bottom of the
snow coverSignatures exist (20 – 100 GHz) [8–9]
WIND EFFECTS Blowing snow, redistributing loads Sensitivity to wind crusts was observed [12]
SURFACE HOAR
Source of weak layers due topoor bonding of ice particles →
slab avalanches
Signatures seem to exist (30-100 GHz), to be furtherinvestigated [11–13]
Wet Snow
SNOW WETNESS Rapid destabilisation → wet-snowavalanches
Clear sensitivity exists (5 – 100 GHz), [2–3, 14]
RAIN ON SNOW Destabilisation, increase of load→ slush avalanches
Sensitivity is large, especially at 5–10 GHz [2, 14]
ANSWERS TO THE RAISED KEY QUESTIONS
1. What are the lessons learned from the avalanche situation 1999: implications onresearch and application?
As a consequence of climate change we must adapt to the occurrence of extremeevents. Improved understanding of the processes involved (more accurate physicalmodelling, better forecasts and improved capability to use data from complex observingsystems) will give us better tools for the assessment of hazard potentials and decisionmaking.
2. What is the potential role of new technologies for avalanche warning and control?Microwave remote sensing is a valuable research tool, and it may play a role in futurewarning and monitoring systems on different scales. The monitoring of avalanchestarting zones with FMCW radars allows the local characterisation (stratification,accumulation and settlement, as well as percolation of liquid water [17]) of thesnowpack. Similarly for moving snow, its speed can be measured. Radiometerscomplement the radar by quantitative information of snow parameters. With thiscombination it should be possible to assess the actual avalanche danger for time scalesof minutes to hours or even days. On large scale, the present and planned potential ofearth observations from satellites should be further exploited. Significant research anddevelopment are still needed. Regarding future developments, optimization of both timeand spatial resolution will be needed.
3. Which measures should be taken to foster the transfer from science to application?

Natural Hazards Workshop, 5 – 7 June 2000, Igls, AUSTRIA - AVALANCHES
- 41 -
Support activities in basic and applied research, in useful technical developments and ineducation.
REFERENCES
1. H. Rott, G. Domik, C. Mätzler, H. Miller, "Towards a SAR system for snow and land iceapplications", Proc. Workshop on Thematic Applications of SAR Data, Frascati, Italy 9-11September, 1985, ESA SP-257, p. 29-39 (1985).
2. C. Mätzler, "Applications of the Interaction of Microwaves with the Natural Snow Cover", RemoteSensing Reviews, Vol. 2, pp. 259-392 (1987).
3. C. Mätzler, "Passive microwave signatures of landscapes in winter", Meteorology and AtmosphericPhysics, Vol. 54, pp. 241-260 (1994).
4. T. Strozzi, A. Wiesmann and C. Mätzler, "Active microwave signatures of snow covers at 5.3 and 35GHz", Radio Science, Vol. 32, pp. 479-495 (1997).
5. C. Mätzler, T. Strozzi, T. Weise, D. Floricioiu and H. Rott, "Microwave snowpack studies made inthe Austrian Alps during the SIR-C/X-SAR experiment", Internat. J. Remote Sensing, Vol. 18, pp.2505-2530 (1997).
6. C. Mätzler, "Microwave properties of ice and snow", in B. Schmitt et al. (eds.) ”Solar System Ices”,Astrophys. and Space Sci. Library, Vol. 227, Kluwer Academic Publishers, Dordrecht, pp. 241-257(1998).
7. T. Strozzi and C. Mätzler, "Backscattering measurements of alpine snowcovers at 5.3 and 35 GHz",IEEE Transactions on Geoscience and Remote Sensing, Vol. 36, pp. 838-848 (1998).
8. A. Wiesmann, C. Mätzler and T. Weise, "Radiometric and structural measurements of snowsamples", Radio Science, Vol. 33, pp. 273-289 (1998).
9. A. Wiesmann, C. Mätzler, "Microwave emission model of layered snowpacks", Remote Sensing ofEnvironment, Vol. 70, No. 3, pp. 307-316 (1999). Also C. Mätzler and A. Wiesmann, "Extension ofthe Microwave Emission Model of Layered Snowpacks to Coarse-Grained Snow", Remote Sensingof Environment, Vol. 70, No. 3, pp. 317-325 (1999).
10. C. Mätzler, "Improved Born Approximation for scattering in a granular medium", J. Appl. Phys.,Vol. 83, No. 11, pp. 6111-6117 (1998).
11. A. Wiesmann, C. Fierz and C. Mätzler, "Simulation of microwave emission from physicallymodeled snowpacks", Annals of Glaciology, Vol. 31, in press (2000).
12. K. Steffen W. Abdalati and I. Sherjal, "Faceted crystal formation in the northeast Greenland low-accumulation region", J. Glaciol. 45, No. 149, 63-68 (1999).
13. C. Fierz, "Field observation and modelling of weak-layer evolution", Ann. Glaciol. 26, 7-13 (1999).14. C. Mätzler, E. Schanda, R. Hofer, W. Good, "Microwave signatures of the natural snow cover at
Weissfluhjoch", in A. Rango (ed.) Microwave remote sensing of snowpack properties, NASA Conf.Publ. 2153, pp. 203-223 (1980).
15. H. Rott, "Multispectral microwave signatures of the Antarctic ice sheet", in P. Pampaloni (ed.)"Microwave Radiometry and Remote Sensing Applications", pp. 89-101, VSP Utrecht (1989).
16. C. Mätzler, A. Wiesmann, T. Strozzi, "Simulation of microwave emission and backscattering oflayered snowpacks by a radiative transfer model, and validation by surface-based experiments",Proc. IGARSS 2000, Honolulu, Hawaii, July 24-28 (2000).
17. H. Gubler and M.Hiller, "The use of microwave FMCW radar in snow and avalanche research",Cold Regions Science and Technology, Vol. 9, pp. 109-119 (1984). H. Gubler, M. Hiller, P.Weilenmann, "New instruments and their possible use in avalanche warning". Proc. Symposium deChamonix 1991, p. 83-91, ANENA (1991).

Natural Hazards Workshop, 5 – 7 June 2000, Igls, AUSTRIA - AVALANCHES
- 42 -
Detection of surface hoar with passive microwave sensors
GIOVANNI MACELLONI, SIMONETTA PALOSCIA, PAOLO PAMPALONI, ROBERTO RUISI,MARCO TEDESCO, A. CAGNATI*, AND M. VALT*
CNR-IROE, Via Panciatichi 64, I-50127 Florence, ItalyTel +39 0554235205, Fax: +39 0554235290 Email: [email protected]
*Centro Sperimentale Valanghe e Difesa Idrogeologica, Arabba, Italy
Introduction
The capability of passive microwave sensors to monitor seasonal variation of snow cover hasbeen the subject of several experimental activities carried out with ground based and satellitesystems [1-5]. Moreover, the dielectric characteristics of several snow types have beeninvestigated by means of experiments and theoretical models and data are available atfrequencies up to 90 GHz [6]. Measurements carried out between 3 GHz and 90 GHz havepointed out the sensitivity of microwave emission to snow type and water equivalent. At thelower frequencies of the microwave band emission from a layer of dry snow is mostlyinfluenced by the soil conditions below the snow pack and by snow layering, while at thehigher frequencies the role played by volume scattering increases and emissivity appearssensitive to snow water equivalent [1, 5]. If snow melts, the presence of liquid water in thesurface layer determines an increase emissivity, especially at the higher frequency[6]. Theaverage spectra of brightness temperature Tb obtained by Schanda et al.[7] show that Tb ofdry and refrozen snow decreases with frequency whereas Tb of wet spring snow increases.In some cases the spectral behavior of wet snow shows a slight increase with frequency dueto the increasing effect of surface roughness [7, 8].
In this paper we discuss experimental results obtained in various test sites on Alpine regionsand theoretical results obtained with dense medium radiative theory (DMRT), with particularregard to the detection of surface hoar, which is of significant interest for the research inavalanche forecast. Indeed, if the hoar crystals are buried by a subsequent snowfall, theymay form a sliding layer for a slab avalanche release.
THE EXPERIMENT
Microwave radiometric measurements of snow packs were carried out on the Italian Alps andApennines at various dates in 1996, 1997 and 1999, and on various test sites with differentsnow covers. Several snow types were investigated, including dry snow at high and lowdensity, a typical spring situation with rounded particles and wet snow, showing at thesurface high density and a very low consistence, and lastly, a typical surface layer composedof big surface hoar crystals. In each test site the composition of the snow pack was analysedaccording to conventional methods. Remote sensing data were simultaneously collected, bymeans of a ground based Radiometer set (IROE) operating at three different microwavefrequencies: (37, 10 and 6.8 GHz) and in the thermal infrared (8-14 µm) band, at incidenceangles between 30 and 70 degrees. In situ contact measurements of snow wetness werecarried out with an electromagnetic probe.
THE EXPERIMENTAL RESULTS
The effect of surface hoar was studied on a site (Falcade, Italy) whose surface layer wascomposed of big crystals of hoar. Microwave emission was first measured on the undisturbednatural snow cover and then after removing the first layer containing the hoar crystals. Notethat surface hoar spectrum is well separated from that of wet snow, as we can see fromTable 1, which reproduces the differences between the brightness temperature at 10 and 37GHz.
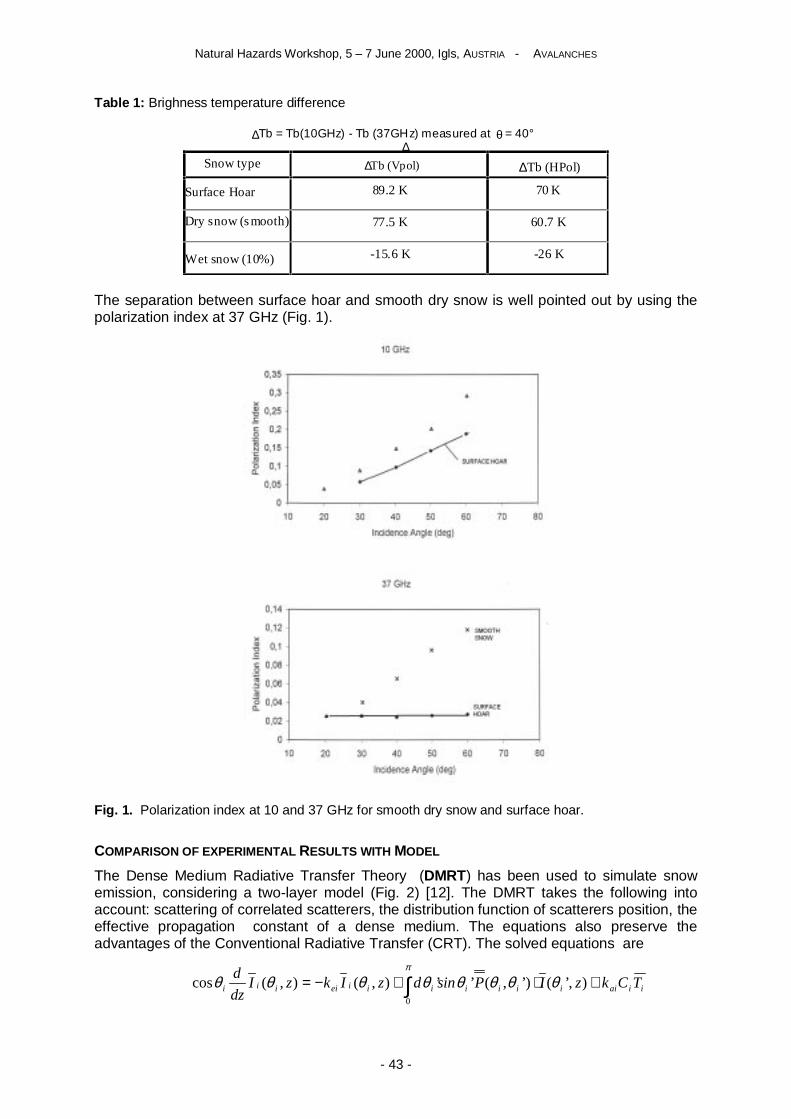
Natural Hazards Workshop, 5 – 7 June 2000, Igls, AUSTRIA - AVALANCHES
- 43 -
Table 1: Brighness temperature difference
∆∆Tb = Tb(10GHz) - Tb (37GHz) measured at θ = 40°
Snow type ∆Tb (Vpol) ∆Tb (HPol)
Surface Hoar 89.2 K 70 K
Dry snow (s mooth) 77.5 K 60.7 K
Wet snow (10%) -15.6 K -26 K
The separation between surface hoar and smooth dry snow is well pointed out by using thepolarization index at 37 GHz (Fig. 1).
Fig. 1. Polarization index at 10 and 37 GHz for smooth dry snow and surface hoar.
COMPARISON OF EXPERIMENTAL RESULTS WITH MODEL
TThe Dense Medium Radiative Transfer Theory (DMRT) has been used to simulate snowemission, considering a two-layer model (Fig. 2) [12]. The DMRT takes the following intoaccount: scattering of correlated scatterers, the distribution function of scatterers position, theeffective propagation constant of a dense medium. The equations also preserve theadvantages of the Conventional Radiative Transfer (CRT). The solved equations are
iiaiiiiiiiieiiii TCkzIPsindzIkzIdz
d +⋅+−= ∫ ),’()’,(’’),(),(cos0
θθθθθθθθπ

Natural Hazards Workshop, 5 – 7 June 2000, Igls, AUSTRIA - AVALANCHES
- 44 -
Fig. 2. Geometry of the problem.
where i=h or s respectively for the surface hoar and dry snow layers, θ=incidence angle,I =Stokes vector, ke=extinction coefficient, ka=absorption coefficient, T =thermometric
temperature, P = phase matrix, with boundary conditions:
),z(I)(T),z(I)(R),z(I sshshhhhhshh 000 =⋅+=−⋅==
),()(),( 0 szIRszI hhhhhh =⋅==− θθθπ
)0,()()0,()()0,( 11 =−⋅+=⋅==− zITzIRzI hhshssssshss θπθθθθπ
21212 )(),()(),( TCTdzIRdzI ssssssss ⋅+−=−⋅=−= θθπθθ
where R and T are, respectively, the reflectivity and transmissivity matrix of the Stokesvector. The model has been run using input parameters derived from ground measurements(see Table 2) and using particle radius a (the mean radius of the log-normal size particlesdistribution) as free parameter to fit experimental data. The model also takes into account thesurface roughness. The results are shown in Fig. 3 which compares the angular variations ofsimulated and measured brightness temperature. Note that, as expected, the equivalentradius of surface hoar (which it’s different from the radius computed considering the volumeoccupied by particles with a fixed radius) is much bigger than that of dry snow.
Table 2: Parameters used for simulation

Natural Hazards Workshop, 5 – 7 June 2000, Igls, AUSTRIA - AVALANCHES
- 45 -
Fig. 3: Simulation results and experimental data.
On the basis of the previous considerations, surface hoar con be separated by smooth dryand wet snow according to the following Table 3.
Table 3: Separability of snow types
Snow type Tb(10) – Tb (37) PI37 GHz (50o)
Smooth dry High High
Wet low (or < 0) Low
Surface Hoar High Low
CONCLUSIONS
The obtained results have shown the capability of a dual frequency microwave radiometer inseparating snow cover types from surface hoar. However, more experimental data and furtherinvestigations are necessary before establishing an operational procedure.
REFERENCES
[1] Hofer R., and C. Mätzler,1980, "Investigation of snow parameters by radiometry in the 3- to 60-mmwavelength region," J. Geophys. Res., vol 85, 453-460
[2] Stiles W.H., and F.T. Ulaby,1980, "The active and passive microwave response to snowparameters, 1: Wetness ", J. Geophys. Res., vol 85,1037-1059
[3] Stiles W.H., and F.T. Ulaby,1980, "The active and passive microwave response to snowparameters, 2: Water equivalent ", J. Geophys. Res., vol 85,1045-1049
[4] Mätzler C., Schanda H., and W. Good, 1982, "Toward the definition of optimum sensorspecification for microwave remote sensing of snow", IEEE Trans. Geosci. Remote Sensing,Vol.GE-20, 57-66
[5] Rott H., and K. Sturm, 1991, "Microwave Signature Measurements of Antarctic and Alpine Snow",in Proc. of 11th EARSeL Symposium, Graz, Austria,140-151
[6] Hallikainen M. T., F.T. Ulaby, and T.E. Van Deventer, 1987, "Extinction Behavior of Dry Snow in 18- to 90 GHz Range", IEEE Trans Geosci. Remote Sensing, Vol.GE-25, 737- 745
[7] Schanda E., C. Mätzler and K. Künzi,1983, "Microwave Remote Sensing of Snow Cover", Int. J.Remote Sensing, Vol. 4, p. 149-158
[8] H. Rott, "Private Communication", 1993.

Natural Hazards Workshop, 5 – 7 June 2000, Igls, AUSTRIA - AVALANCHES
- 46 -
[9] Mätzler C., "Microwave signatures of landscape in winter" Meteorology and Atmospheric Physics'Special issue on Physical Retrieval of Hydrological Variables from Space-based MicrowaveMeasurements’
[10] Mätzler C., and E. Schanda, 1984, "Snow mapping with active microwave sensors' , Int. J.Remote Sensing, 5, p. 409-422
[11] Kendra J.R., F.T. Ulaby and K. Sarabandi, 1994, ‘Snow probe for In Situ determination of wetnessand density’, IEEE Trans Geosci. Remote Sensing, GE-32, 1152- 1159
[12] Ya-Qiu Jin, 1993, ‘Electromagnetic scattering modelling for quantitative remote sensing’, WorldScientific Publishing
Natural Hazards Workshop, 5 – 7 June 2000, Igls, AUSTRIA - FLOODS
- 47 -
Some recent strategies for flood risk mitigation in France
MICHEL LANG
Cemagref Lyon, Hydrology-Hydraulic Department, Cemagref,3 bis quai Chauveau, F-69336 Lyon cedex 09, France
Tel 33 4 72 20 87 98 Fax 33 4 78 47 78 75 E-mail [email protected]
After the catastrophic flooding in Southern France (Grand-Bornand, July 1987; 23 deaths;Vaison-La-Romaine; Sept. 1992; 46 deaths; Aude, Nov. 1999; 35 deaths), society asks for abetter flood risk mitigation. Several French workshops dealt with this subject, with officialproceedings in 1999 (Cour des Comptes; Mission Dauge). The main conclusion is that theincreasing of damages is related to a higher exposure of land-use to flood hazard.
Several new legal tools for flood risk mitigation have been proposed in the eighties. A newsystem of property insurance against natural catastrophe has been created in 1982, with auniform premium rate and a system of reinsurance (for insurance companies) provided bythe French government. The flood warning system has been reorganised in 1984, with newreal time hydro-meteorological stations, a more efficient administrative procedure for floodalarm, and the improvement of the weather forecast. A new flood zoning system for land usehas been set up in 1982 and 1995, based on the analysis of the two component of riskanalysis: flood hazard delineation and mapping of the vulnerability to flooding.
Despite all these strategies, flood risk mitigation remains difficult to apply. One of the mainstakes is the acceptation of flood zoning plans by the public and the politicians. A methoddeveloped by Cemagref, called "Inondabilité", proposes to use the public participationmechanisms in the establishment of hazard and risk zoning. The definition of acceptablerisks (residual danger) should be connected to flood stakes and accepted by population.Many authors have pointed out the importance of an efficient property insurance system, withno adverse selection, providing incentives for prevention. Some recent proposals are relatedto a control of the effective measures of flood risk mitigation by population and are asking fora constraint upon the reimbursement after damages.
Several approaches allow the flood mapping and hazard delineation. The French Ministry ofEnvironment recommends the use of simple methods based of geomorphological analyses,without detailed statistical studies. Cemagref is involved into a European project (SPHERE),which main objective is devoted to the improvement of flood risk estimation by usingsystematic, paleoflood and historical data. The development of the culture of risk (memory ofpast floods, hazard maps, flood marks, information on typical damage and risk to life) is alsoa good way to improve the public awareness of flood hazard.

Natural Hazards Workshop, 5 – 7 June 2000, Igls, AUSTRIA - FLOODS
- 48 -
The Mesoscale Alpine Programme (MAP)An Initiative to improve Flood Forecasting in Mountainous Terrain
REINHOLD STEINACKER AND MANFRED DORNINGER
Institut für Meteorologie und Geophysik der Universität WienHohe Warte 38, A-1190 Vienna
Tel.: +43 1 3681137-1; Fax: +43 1 369 81271; e-mail: [email protected]
INTRODUCTION
The Mesoscale Alpine Programme (MAP) is an international initiative to better understandand predict severe weather, i. e. heavy precipitation and wind storms in mountainous areasto lessen its societal consequences. The official start of MAP dates back to 1995, when agroup of scientists and meteorological and hydrological institutions from 12 countries (AT,CH, CN, DE, FR, GR, HR, IT, SI, SP, UK, US) agreed to cooperate and to join their scientificefforts. It was clear from the beginning that a large field campaign was needed to full-fill thetasks which was only meaningful when making use of synergies with regard to personal andinstrumental resources. The field campaign was carried out in autumn 1999 during the MAPSpecial Observing Period (SOP) with its Operation Centre located at Innsbruck Airport. TheAlps were chosen as experimental area due to the extremely dense operationalhydrometeorological network, see e. g. the rain gauge stations in fig 1. The autumn seasonwas chosen due to the highest climatological probability for both, heavy precipitation andfoehn flows. Approximately 250 Scientists and technical staff were involved in this fieldexperiment with advanced instrumentation including several meteorological research aircraft
Fig. 1: Rain gauge stations operating in the Alpine area. Metadata collected by the MAP WorkingGroup on routine observing systems (WGROUND).
Natural Hazards Workshop, 5 – 7 June 2000, Igls, AUSTRIA - FLOODS
- 49 -
and advanced Radar, Lidar and Sodar technology. The evaluation phase of MAP will last toat least 2003. The estimated overall expenses for MAP are in the order of 15 MEuro, Austriawas able to contribute approximately 10 percent of this amount due to a generous funding bydifferent agencies like the Federal Ministry of Science and the Austrian Science Foundation.
THE SCIENTIFIC OBJECTIVES OF MAP
The scientific objectives as stated in the MAP Design Proposal (Binder, et al, 1996) read asfollows:
� To improve the understanding of orographically influenced precipitation events andrelated flooding episodes involving deep convection, frontal precipitation and runoff
� To improve the numerical prediction of moist processes over and in the vicinity ofcomplex topography, including interactions with land-surface processes
� To improve the understanding and forecasting of the life cycle of foehn-relatedphenomena, including their three-dimensional structure and associated boundarylayer processes
� To improve the understanding of three-dimensional gravity wave breaking andassociated wave drag in order to improve the parameterisation of gravity wave drageffects in numerical weather prediction and climate models
� To provide data sets for the validation and improvement of high-resolution numericalweather prediction, hydrological and coupled models in mountainous terrain
The first two objectives may be summarised as „Wet MAP“, the next two as „Dry MAP“.Several scientific projects within the programme focussed on the following topics:
P1 Orographic Precipitation MechanismsP2 Incident Upper-Tropospheric PV AnomaliesP3 Hydrological Measurements and Flood ForecastingP4 Dynamics of Gap FlowP5 Non-stationary Aspects of Foehn in a Large ValleyP6 Three-Dimensional Gravity Wave BreakingP7 Potential Vorticity BannersP8 Structure of the Planetary Boundary Layer over Steep Topography
It is nice to see that even between “dry” and “wet” Map projects a lot of interrelation can befound. Besides project P3 e. g. also P1, P2, P7 and P8 are related to flood forecasting.Upper tropospheric potential vorticity (PV) streamers are known since a while as precursorfeatures, inducing low tropospheric convergence, upward motion and precipitation. PVbanners at the edges and on the lee side of mountains have been discovered recently in highresolution numerical prediction models and are attributed to trigger convection. Hence, amore precise (mesoscale) prediction of PV finally allows a better forecast of heavyprecipitation and related floodings. The role of the planetary boundary layer over steeptopography, especially its energy and moisture budget in connection to soil state is wellknown to be important for hydrological modelling.
FIRST RESULTS FROM THE FIELD EXPERIMENT MAP-SOP
The atmosphere was very cooperative during the ten weeks SOP (7 September to 15November 1999). Virtually all phenomena intended to be studied, occurred more often thanclimatologically expected. Several heavy precipitation events were observed in the targetarea Lago Maggiore, where a series of experimental Radars (dual Doppler, polarising) wereinstalled. Daily precipitation sums of more than 400 mm were recorded which caused localflooding events. It was a surprise for most participating scientists that such amounts ofprecipitation does not need extreme and deep convection. It was rather caused by stationarymoderate convective cells, permanently fed by moist unstable air flow from the

Natural Hazards Workshop, 5 – 7 June 2000, Igls, AUSTRIA - FLOODS
- 50 -
Mediterranean. A further important result was the fact that each of the precipitation eventsobserved in Switzerland was predicted by the experimental real time runs of the very high (3km horizontally) resolution atmospheric model MC2 from Environment Canada, albeit with tolow amounts, but no false alarms were issued (see fig 2.).
7.
Fig. 2: Comparison of 24 hour forecast (black) versus observed (white) hourly precipitation amountsfor Switzerland during MAP-SOP. (Courtesy: R. Benoit, Environment Canada).
CONCLUSIONS AND OUTLOOK
The results of MAP with regard to heavy precipitation so far gives hope that within a fewyears from now, when the very high resolution atmospheric prediction models becomeavailable operationally, heavy precipitation events will be forecast on a short range with highaccuracy and coupled hydrological models may be used to predict floodings and extend theleading time for alerts. It should be kept in mind, however, that the predictability due to thechaotic nature of the atmosphere will act as a limiting factor also in future. In general weknow that the smaller the scale of the phenomenon, the shorter the time will be for asuccessful prediction. Whereas convection over homogeneous terrain is not predictable(what concerns location and timing !) more than several hours in advance, this range may beextended over complex terrain due to strong local forcing mechanisms (see fig 3.). Largerscale heavy precipitation events like the February 1999 (with catastrophic Avalanches inwestern Austria and northern Switzerland) and May 1999 (with severe flooding in northernSwitzerland, Bavaria and western Austria) will be well forecast a few days in advance. Toreduce the consequences of natural disasters in connection with precipitation by makingavailable the most advanced technologies for operational predictions, an intense cooperationof national and regional meteorological and hydrological services will be necessary in theAlpine region also in the future for the best benefit of its population.
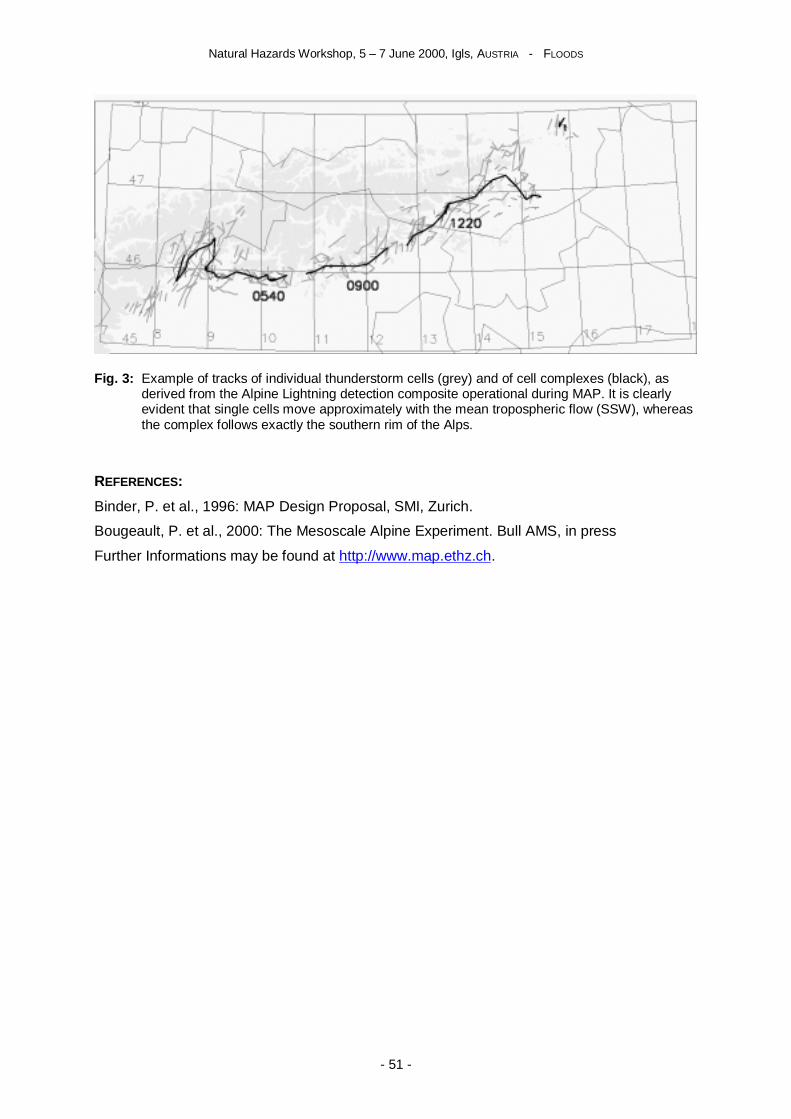
Natural Hazards Workshop, 5 – 7 June 2000, Igls, AUSTRIA - FLOODS
- 51 -
Fig. 3: Example of tracks of individual thunderstorm cells (grey) and of cell complexes (black), asderived from the Alpine Lightning detection composite operational during MAP. It is clearlyevident that single cells move approximately with the mean tropospheric flow (SSW), whereasthe complex follows exactly the southern rim of the Alps.
REFERENCES:
Binder, P. et al., 1996: MAP Design Proposal, SMI, Zurich.
Bougeault, P. et al., 2000: The Mesoscale Alpine Experiment. Bull AMS, in press
Further Informations may be found at http://www.map.ethz.ch.

Natural Hazards Workshop, 5 – 7 June 2000, Igls, AUSTRIA - FLOODS
- 52 -
Flood simulation modelling and forecasting in mountain areas
EZIO TODINI
Dipartimento di Scienze della Terra e Geologico Ambientali, University of Bologna,Via Zamboni 67, I-40126 Bologna, Italy
Tel +39 051 2094537 E-mail [email protected]
Flood forecasting is a way of reducing the uncertainty of decision-makers on the evolution offuture events, when trying to take important operational decisions that may affect life as wellas welfare of populations at risk. To be operational, flood forecasting requires to be timely,sufficiently accurate within pre-determined time horizons and to provide a measure ofuncertainty. Unfortunately, in mountain areas small and steep catchments are subject tointense short duration storms which allows only to accurately forecast floods within very shortforecasting horizons, not much longer than the catchment concentration time. Therefore,there is the need of accurately representing the rainfall runoff process transformation, whichalso requires the development of reliable snow accumulation-melting models, on the basis ofknown physical principles.
In the last decade many rainfall runoff models have been developed that capture theessential features of the soil replenishment with the consequent increase in the saturatedcontributing areas. The paper presents an overview of the latest available models togetherwith a discussion on their pros and cons. In addition, limited area meteorological models arebecoming more easily available and the quality of their products, particularly in terms ofquantitative precipitation forecasts, is noticeably improving. To this end, the paper describesdifferent techniques recently experimented in order to extend a reliable flood forecast beyondthe catchment physical horizon and at the same time to provide stakeholders with a measureof forecast reliability.

Natural Hazards Workshop, 5 – 7 June 2000, Igls, AUSTRIA - FLOODS
- 53 -
Assessing the Effects of Land use Changes on Floods in the Meuseand Oder Catchment
AD DE ROO, MARTIJN ODIJK, GUIDO SCHMUCK
SAI - Space Applications Institute Joint Research Centre, European CommissionTP263; I-20120 Ispra VA Italy; Email: [email protected]
Recently, dramatic flooding occurred in several regions of the world. To investigate thecauses of the flooding and the influence of land use, soil characteristics and antecedentcatchment moisture conditions, the distributed catchment model LISFLOOD has beendeveloped. LISFLOOD simulates runoff in large river basins. Two transnational Europeanriver basins are used to test and validate the model: the Meuse catchment (France, Belgiumand The Netherlands) and the Oder basin (The Czech Republic, Poland and Germany). Inthe Meuse and Oder catchment, land use change information over the past 200 years isprocessed at the moment. The LISFLOOD simulation model is used to simulate the effects ofthese land use changes on floods.
INFLUENCES OF LAND USE ON FLOODS
The hydrologic effects of land use changes have been thoroughly described by Calder(1993). The major changes in land use that affect hydrology are afforrestation anddeforestation, the intensification of agriculture, the drainage of wetlands, road constructionand urbanization. The most obvious influence of land use on the water balance of acatchment is on the evapotranspiration process (Calder, 1993). Different land use types havedifferent evapotranspiration rates, because different crops have different vegetation cover,leaf area indices, root depths and albedo. During storms, interception rates are different fordifferent land-use types. Although it is recognized, that interception losses represent asignificant net addition to catchment evaporative losses (Ward & Robinson, 1990), theinfluence of interception is noticeable only during small storms and influences only surfacerunoff rates: they are of minor importance in the largest storm and flood events (Calder,1993). Land use also influences the infiltration and soil water redistribution process, becauseespecially saturated hydraulic conductivity is influenced by plant roots and pores resultingfrom soil fauna (Ragab & Cooper, 1993). An extreme example is the influence of build upareas and roads on overland flow. Finally, land use influences surface roughness, whichcontrols overland flow velocity and floodplain flow rates.
THE LISFLOOD SIMULATION MODEL
To assess the influence of land use on flooding and to examine the major source areas ofrecent European floods, the distributed catchment model LISFLOOD is being developed (DeRoo, 1999; De Roo et al., 1999; Bates & De Roo, 2000; De Roo et al., 2000). LISFLOODsimulates runoff and flooding in large river basins as a consequence of extreme rainfall.LISFLOOD is a distributed rainfall-runoff model which takes into account the influence oftopography, precipitation amounts and intensities, antecedent soil moisture content, land usetype and soil type. LISFLOOD simulates flood events - typically with a 1.5 month durationand includes the pre-flood period of typically a 1 year duration - in catchments using variouspixel sizes (1 km or smaller) and with various time steps (1 hour or shorter). A flowchart ofthe model showing the main processes simulated in the model is shown in Figure 1. Digitalelevation data (75 m. and 1 km), Corine land use data, soil parameters from the EuropeanSoils Database (texture, soil depth, parent material, soil hydraulic parameters) and

Natural Hazards Workshop, 5 – 7 June 2000, Igls, AUSTRIA - FLOODS
- 54 -
meteorological parameters from the MARS Meteorological database (precipitation,temperature, vapour pressure, sunshine duration, wind speed, cloud cover) are used forinput data to run the model. To obtain information on seasonal changes of land cover,Normalized Difference Vegetation Index (NDVI) profiles were constructed for each CorineLand Cover Class, using a series of IRS-WIFS satellite images (180 m resolution) from 1998.LISFLOOD consists of a water balance model, run with a daily timestep, and a floodsimulation model, run with an hourly or 15 minute timestep. The flood model starts just a fewdays before a flood. Outputs from the water-balance model are used as input for the floodmodel.
Figure 1. Flowchart of the LISFLOOD water-balance, flood simulation and flood inundationmodel.
VALIDATION
Before we can apply LISFLOOD to simulate the effects of land use changes on floods, themodel needs to be validated. At present, LISFLOOD is being tested in the two pilotcatchments, the Meuse (32457 km2) and the Oder catchment (59162 km2). Both catchmentsare discretized into 1 km pixels. In the Meuse catchments, LISFLOOD is tested and appliedto 10 flood events: 5 for calibration, and 5 for validation. These flood events include the 1993and 1995 floods. For the Oder catchment, 3 historic floods are available for validation andtesting: summer 1977, summer 1985 and the summer 1997 flood. The water-balance modelis always run over the two years before the flood, so 1976-1977, 1984-1985 and 1996-1997.Because the validation has started recently, only preliminary results can be shown. For theMeuse catchment 58 stations with hourly rainfall data are used for the flood model and 33stations with daily meteorological parameters are used for water balance modelling.Preliminary results (before calibration! and further validations) show reasonable agreementbetween measured and simulated discharge and no conclusions can be made.
For the Oder catchment, currently 100 stations with daily and hourly rainfall are used for theflood model, and 90 rainfall stations and 18 stations with other meteorological parametersare used for water balance modelling. Initial results for the Oder catchment show that thesimulation of the flood hydrographs in the upstream section of the Oder and in the tributarycatchments is reasonably good, but the simulation of flood hydrographs in the downstreamsection of the main river Oder is a problem. During the 1997 Oder flood many dike breaksoccurred, and these, together with human influences such as water reservoir operations inthe Czech and Polish mountains, combine to complicate the simulation of the flood

Natural Hazards Workshop, 5 – 7 June 2000, Igls, AUSTRIA - FLOODS
- 55 -
hydrograph in the Oder river. Figure 2 shows a comparison of measured and simulateddischarge at Miedonia (Poland), close to the Czech border. In figure 2 and several otherhydrographs, the peak time is simulated earlier than measured. A possible explanation forthis might be storage of water in reservoirs during the initial phase of the flood. In the presentversion of LISFLOOD, reservoirs are not yet simulated.
THE EFFECT OF CATCHMENT LAND USE CHANGES ON FLOODS IN THE MEUSE AND ODERCATCHMENT
Although it has been discussed above that there are many uncertainties in parameterestimation to simulate the effects of land use changes on floods, and although the validationand testing of LISFLOOD are not yet completed, several simulations have been carried outwith LISFLOOD in the Meuse and Oder catchment. For the Oder catchment, CORINE landcover information of 1992 is available. Landsat MSS images of 1975 have been used toobtain a similar land cover classification of 1975. At the moment, work is ongoing to obtainrecent land use changes (CORINE 2000) and historic land use changes over the past 200years. Analysis showed that between 1975 and 1992 no major changes in land use occurredand therefore no hydrologic changes were simulated by the LISFLOOD model.
0
500
1000
1500
2000
2500
3000
0 48 96 144 192 240 288 336 384 432 480 528 576 624 672 720 768 816 864 912 960
time: hours since July 1 1997
dis
char
ge
(m3/
s)
measured simulated (LISFLOOD)
Figure 2. Measured and simulated discharge at Miedonia (Oder catchment, Poland), duringthe July 1997 flood. Measured data provided by IMGW, Wroclaw, Poland.
For the Meuse catchment, also CORINE 1975 and 1992 data were available. Also here, workis ongoing to obtain historic land use over the past 200 years (Stam & De Roo, 1999). In theMeuse catchment, there have been slight changes in land use between 1975 and 1992. Tosimulate the effect of land use changes on floods, the 1995 flood event has been simulatedboth with the 1992 land use and with the 1975 land use. Differences occur especially in theinitial conditions before the flood, obtained with the daily water-balance model. On average,soil moisture storage capacity just before the flood period is reduced from 210 mm using the1975 land use, to 198 mm using the 1992 land use: a decrease of 5.85%. When these initialconditions are used to run the flood simulation model, the peak discharge as a result of the1992 land use is 0.20 % higher than the peak discharge simulated using the 1975 land use.The total volume of water simulated during the flood is 4.06% larger. The peak water level atBorgharen is 1 cm higher when the 1992 land use is simulated as compared to the 1975landuse.

Natural Hazards Workshop, 5 – 7 June 2000, Igls, AUSTRIA - FLOODS
- 56 -
use1975 use1995 change (%)peak discharge (m3/s) 3099 3105 0.203total discharge (m3) 7.621E+09 7.930E+09 4.059cumulative evapotranspiration before the flood (mm) 485.83 428.84 -11.730initial soil moisture storage capacity (mm) 209.98 197.69 -5.853
Table 1. Hydrological changes in the Meuse catchment – simulated with the LISFLOODmodel - as a consequence of land use change
CONCLUSIONS
The influence of land use and land use changes on hydrological processes and processparameters is not yet well quantified. Therefore, simulating the effects of land use change onhydrology leads at present to results that carry quite a bit of uncertainty. Obvious effects arethat a forest cover will increase the evapotranspiration, and that urbanization will reduceevapotranspiration and infiltration and increase surface runoff. From simulations in this paperwith the LISFLOOD model, no changes in land use and thus hydrology are found in the Odercatchment between 1975 and 1992. In the Meuse catchment, land use has changed from1975 to 1992 such that the flood risk has become slightly larger. The initial soil moisturestorage capacity just before the flood is reduced by 12 mm (6%), the peak discharge isincreased by 0.2% and water level is 1 cm higher.
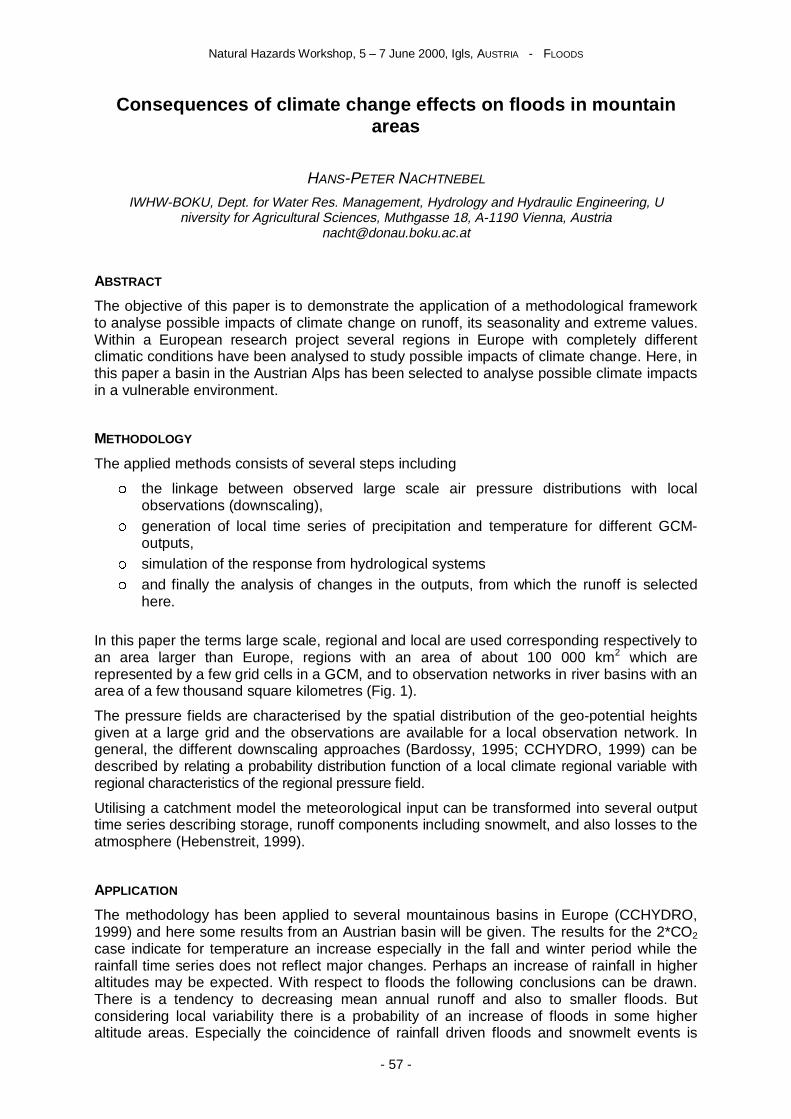
Natural Hazards Workshop, 5 – 7 June 2000, Igls, AUSTRIA - FLOODS
- 57 -
Consequences of climate change effects on floods in mountainareas
HANS-PETER NACHTNEBEL
IWHW-BOKU, Dept. for Water Res. Management, Hydrology and Hydraulic Engineering, University for Agricultural Sciences, Muthgasse 18, A-1190 Vienna, Austria
ABSTRACT
The objective of this paper is to demonstrate the application of a methodological frameworkto analyse possible impacts of climate change on runoff, its seasonality and extreme values.Within a European research project several regions in Europe with completely differentclimatic conditions have been analysed to study possible impacts of climate change. Here, inthis paper a basin in the Austrian Alps has been selected to analyse possible climate impactsin a vulnerable environment.
METHODOLOGY
The applied methods consists of several steps including
� the linkage between observed large scale air pressure distributions with localobservations (downscaling),
� generation of local time series of precipitation and temperature for different GCM-outputs,
� simulation of the response from hydrological systems� and finally the analysis of changes in the outputs, from which the runoff is selected
here.
In this paper the terms large scale, regional and local are used corresponding respectively toan area larger than Europe, regions with an area of about 100 000 km2 which arerepresented by a few grid cells in a GCM, and to observation networks in river basins with anarea of a few thousand square kilometres (Fig. 1).
The pressure fields are characterised by the spatial distribution of the geo-potential heightsgiven at a large grid and the observations are available for a local observation network. Ingeneral, the different downscaling approaches (Bardossy, 1995; CCHYDRO, 1999) can bedescribed by relating a probability distribution function of a local climate regional variable withregional characteristics of the regional pressure field.
Utilising a catchment model the meteorological input can be transformed into several outputtime series describing storage, runoff components including snowmelt, and also losses to theatmosphere (Hebenstreit, 1999).
APPLICATION
The methodology has been applied to several mountainous basins in Europe (CCHYDRO,1999) and here some results from an Austrian basin will be given. The results for the 2*CO2
case indicate for temperature an increase especially in the fall and winter period while therainfall time series does not reflect major changes. Perhaps an increase of rainfall in higheraltitudes may be expected. With respect to floods the following conclusions can be drawn.There is a tendency to decreasing mean annual runoff and also to smaller floods. Butconsidering local variability there is a probability of an increase of floods in some higheraltitude areas. Especially the coincidence of rainfall driven floods and snowmelt events is
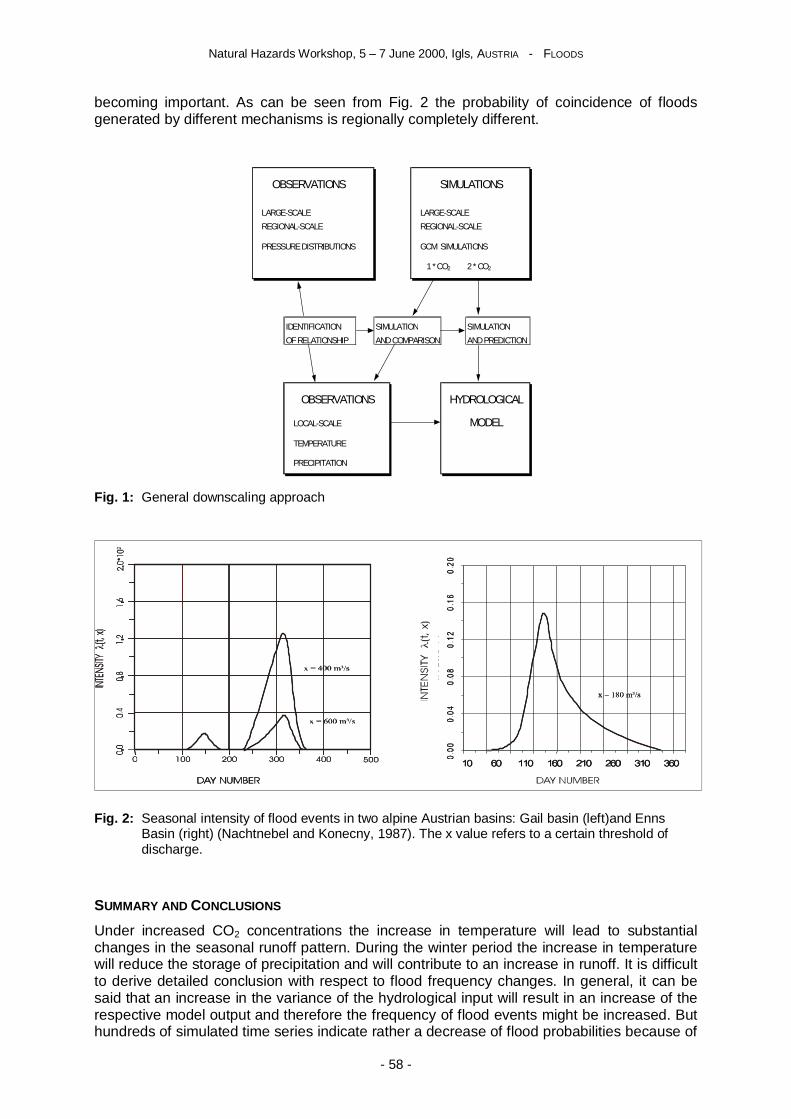
Natural Hazards Workshop, 5 – 7 June 2000, Igls, AUSTRIA - FLOODS
- 58 -
becoming important. As can be seen from Fig. 2 the probability of coincidence of floodsgenerated by different mechanisms is regionally completely different.
OBSERVATIONS SIMULATIONS
LARGE-SCALE LARGE-SCALE
REGIONAL-SCALE REGIONAL-SCALE
PRESSURE DISTRIBUTIONS GCM SIMULATIONS
1 * CO2 2 * CO2
IDENTIFICATION SIMULATION SIMULATION
OF RELATIONSHIP AND COMPARISON AND PREDICTION
OBSERVATIONS HYDROLOGICAL
LOCAL-SCALE MODEL
TEMPERATURE
PRECIPITATION
Fig. 1: General downscaling approach
Fig. 2: Seasonal intensity of flood events in two alpine Austrian basins: Gail basin (left)and EnnsBasin (right) (Nachtnebel and Konecny, 1987). The x value refers to a certain threshold ofdischarge.
SUMMARY AND CONCLUSIONS
Under increased CO2 concentrations the increase in temperature will lead to substantialchanges in the seasonal runoff pattern. During the winter period the increase in temperaturewill reduce the storage of precipitation and will contribute to an increase in runoff. It is difficultto derive detailed conclusion with respect to flood frequency changes. In general, it can besaid that an increase in the variance of the hydrological input will result in an increase of therespective model output and therefore the frequency of flood events might be increased. Buthundreds of simulated time series indicate rather a decrease of flood probabilities because of

Natural Hazards Workshop, 5 – 7 June 2000, Igls, AUSTRIA - FLOODS
- 59 -
larger evaporative losses and earlier snowmelt. In small catchments at higher altitudes anincrease in flood peaks may be possible.
ACKNOWLEDGEMENT
This work has been supported by the EU DG XII project ENV4-CT95-0133. The contributionsfrom the partners in the project, especially from K. Hebenstreit and W. Diernhofer are highlyappreciated.
REFERENCES
Bardossy, A., L. Duckstein and I. Bogardi (1995). Fuzzy rule based classification ofatmospheric circulation patterns. Intern. J. of Climatology, 15, pp 1087-1097.
CCHYDRO, (1999): Impact of Climate Change on River Basin hydrology Under DifferentClimatic Conditions, Final Report. ENV4-CT195-0133, IWHW-BOKU, Muthg. 18, A-1190Vienna, Austria.
Hebenstreit, K., (1999): Auswirkungen von Klimaänderungen auf die Hydrologie alpinerEinzugsgebiete. PhD Thesis, IWHW, Univ. for Agricultural Sciences, Vienna, Austria.
Nachtnebel, H.P. and Konecny, F., (1987): Risk analysis and time dependent flood models.J. of Hydrology, 91, 295-318.

Natural Hazards Workshop, 5 – 7 June 2000, Igls, AUSTRIA - FLOODS
- 60 -
Adaptation of a conceptual hydrological model to simulate runoff intwo Alpine river basins exposed to different climatic conditions
MARTIN FUCHS AND HANS-PETER NACHTNEBEL
Institute for Water Management, Hydrology and Hydraulic EngineeringUniversity of Agricultural Sciences, Vienna, Muthgasse 18, A-1190 Wien, Austria
Tel: 01 36006-5520; Fax: 01 36006-5549 email: [email protected]
The Enns basin in the Northern part and the Gail basin in the Southern part of the AustrianAlps are exposed to different climatic conditions, which have a strong effect on theirhydrological regimes. The Upper Enns basin, which is influenced by Atlantic climate, showsmoderate flood peaks caused by snowmelt or rainfall due to orographic blocking. In the Gailbasin the river regime is much more dynamic with extreme runoff peaks frequently occurringas a result of extensive rainfalls during the period of the Mediterranean precipitationmaximum in October and November. Although the basin area of both watersheds is of thesame magnitude (2100 km², 1400 km²) there is a significant difference in the statisticalparameters of the daily runoff values observed in the two basins. Compared to the Ennsbasin the daily runoff values observed in the Gail watershed are much more skewed andshow an autocorrelation that is significantly lower. To simulate daily runoff values in bothcatchments a lumped conceptual rainfall-runoff model, similar to the HBV-Model, wascalibrated and validated. The model showed very good performance in the Enns basin.However, in the Gail basin a systematic underestimation of extreme flood peaks was noticed.
The objective of the work presented in this paper was to improve the performance of theapplied conceptual model in the Gail basin. To achieve this task the following methodologywas applied:
� identification of the governing hydrological processes causing extreme runoff in thebasin.
� critical evaluation of the lumped model and its ability to simulate extreme runoff� improved representation of the physical processes in the model� discussion of the spatial and temporal characteristics of the hydrological processes
and implications for the model� modifications of the conceptual model, including the implementation of a non-linear
reservoir scheme and the substitution of the lumped model by a semi-distributedversion
The project results are in a better understanding of the hydrological processes leading toextreme runoff events in the Gail basin and a modified version of the conceptual model, thatis capable of reproducing these processes.
The conclusions drawn from this study indicate that, different from the Enns basin, in the Gailbasin the variability of precipitation in time and space is high and therefore plays a major rolein runoff generation. If the hydrological model is able to take this into account, the modelperformance can be improved significantly. Besides that, it is shown that the implementationof a non-linear instead of a linear storage scheme leads to a better representation of therunoff process and can result in further improvements of the model performance duringextreme runoff events.

Natural Hazards Workshop, 5 – 7 June 2000, Igls, AUSTRIA - FLOODS
- 61 -
Runoff generation in mountainous areas and anthropogenicinfluence
PAOLO BURLANDO
Institute of Hydromechanics and Water Resources Management, ETH Zurich,CH-8093 Zurich, Switzerland
Tel +41-1-6333812 Fax +41-1-6331061 Email [email protected]
Recent flood events causing major damages to society and economy have from time to timeclaimed for an evaluation of the effects that land-use changes may have on runoff generationmechanisms during intense storm events. This requires to setup modelling tools that aresuitable to the purpose. Among the requisites for suitability one could certainly list the explicitparameterisation of runoff generation as function of land-use, the distributed character inspace to account for local changes, and the model attitude to easy transfer from cacthmentto catchment.
This study intends to present some results from applications of an event-based distributedrainfall-runoff model, which is land-use oriented being the runoff generation module based onthe Soil Conservation Service – Curve Number (CN) infiltration method.
The latter provides indeed an easy computational framework to account for land-usechanges. As the method was developed with reference to North American agriculturalcatchments a transfer to areas characterised by other climatic and geographic conditions hasrequired some testing and modifications of the parameterisation scheme. The modification ofthe SCS-CN method has used results from previous field experiments and indicationsobtained by upscaling to match runoff observations at the scale of raster-based distributedrainfall-runoff models. An extensive digital database, covering most of the requiredinformation for parameterisation, has been used for the purpose. Validation tests carried outfor a couple of meso-scale catchments and subcatchments indicate the model as suitable tocapture observed flood events. The model has been thus used to simulate the behaviour ofsome catchments in mountainous and perimountainous regions of Switzerland using severalland-use scenarios,dating back to last century and accounting for plausible development ofland uses in the future.
As intuitively expected, the results so far obtained show that land-use changes areparticularly impacting the generation of runoff in the catchment when the extent of thechange is significant both in area coverage and quality of the change. Moreover, changesshould be spatially localised, in order to produce remarkable effects. For instance, doublingthe urbanised area in a prealpine small mesocale basin (~78 km2) produces peaksincrements that are smaller than or comparable to discharge error measurements or to theirsampling variance. The sparser is the character of increase of impervious areas, the lesssignificant is expected to be the effect on the peak flows and on the shape of the growthcurve inferred from these. Even in the case the impact of local changes shows to beremarkable at small scales (~1 km2), it normally becomes negligible as the basin areaincreases of some squared kilometers. Changes relevant to agricultural practice ordeforestation/afforestation show to be less impacting and sometimes favourable to reducingflood frequency. Finally, overall changes of quantiles, always range between a few percentand a maximum of ~15% , being also in this case comparable with the order of magnitude ofmeasurement errors.
ACKNOWLDEGEMENTS
The study has been carried out within the EU project “FRAMEWORK” (EU contract # ENV4-CT97-0529). The contribution of Richard Kuntner, PhD candidate at ETH Zurich, is greatlyacknowledged.

Natural Hazards Workshop, 5 – 7 June 2000, Igls, AUSTRIA - FLOODS
- 62 -
Application of remote sensing and water balance modelling inalpine areas for flood hazard forecasting and control
GUDRUN LAMPART, HEIKE BACH, MARCO BRAUN, STEFAN TASCHNER*, RALF LUDWIG*,AND WOLFRAM MAUSER*
VISTA GmbH - Remote Sensing in Geosciences Luisenstr.45, D-80333 Munich, GermanyTel.+49 89 52389802, Fax +49 89 [email protected]; http:\\www.vista-geo.de
*Institut für Geographie, Universität München, Luisenstr.37, D-80333 Munich, GermanyTel.+49 89 2180 6689, Fax +49 89 2180 6675
[email protected]; http:\\www.geographie.uni-muenchen.de
In the frame of the EU project RAPHAEL (Runoff and Atmospheric Processes for floodHAzard forEcasting and controL) remote sensing methods were applied for land surfacecharacterisation of alpine watersheds. The basic objective of the RAPHAEL project was touse coupled meteorological and hydrological models (see Fig. 1) at the regional scale inorder to improve flood forecasting in complex mountain watersheds, as the European Alps.Two watersheds were investigated, the Toce/Ticino catchment at the Southern border andthe Ammer catchment in the Northern boundary of the Alps.
Fig. 1: The concept of coupling meteorological and hydrological models.
The Toce catchment in Northern Italy (1500 km²) is characterised by extreme topographywith elevation ranging from 200 to 4600 m. Corresponding to the strong topographicallyinduced gradient of environmental conditions, also the land cover and surface properties arespatially highly variable. LANDSAT-TM data were used to observe and quantify the spatialheterogeneity of alpine areas. To analyse satellite data in this complex terrain specificprocessing steps were performed to correct the elevation dependent geometric distortion andto homogenise the spatially highly variable irradiance conditions and atmospheric influences(see Fig.2).

Natural Hazards Workshop, 5 – 7 June 2000, Igls, AUSTRIA - FLOODS
- 63 -
Fig. 2: Applied remote sensing methods for the determination of land use, albedo and LAI
To overcome the limits of the standard classification approaches like maximum likelihood inalpine areas, fuzzy logic methods were applied which make use of ecological rules. The ideaof the fuzzy logic classification in alpine areas is that the possibility for one land cover type isvarying with elevation and slope. These possibilities, which are spatially dependent on socalled geofactors, are combined with the maximum likelihood results from the satelliteanalyses using fuzzy logic rules. This new method improves the landuse classification from75% to 95% accuracy. Besides land use, also time-varying parameters such as albedo, andleaf area were determined from the satellite images.
Additionally a digital terrain model, a soil map and meteorological data form the data basisfor the calculation of the water balance of the Toce watershed using a SVAT model. Thewater and energy balance model PROMET was applied to calculate fluxes, latent heat andevapotranspiration. The estimation of these factors on a continuous-time basis is a basis forthe modelling of the soil moisture dynamics during interstorm periods, which defines theinitial state of the system prior to a possible flood (see Fig. 1).
The water balance calculations were performed on a hourly time interval. Thus, for any timeduring the model calculation information of the soil moisture distribution is available.Especially before heavy rainfall this information is important, because the soil moisturedetermines whether rainfall produces runoff or is stored in the soil layer. Using the PROMETwater balance model and satellite information it is possible to derive this information tocharacterise the status of a watershed prior to a flood event.
DEM30x30m
LANDSAT-TMRaw Data
Geometricallycorrected TM-
Data
Land Coverdependent Albedo
Land Cover dependentLeaf Area Index
Geometric Correction
Elevation, LocalSolar Incidence
Angle, Viewfactor &Shadow derived from
DEM
Atmosphericallycorrected TM-
Data
SlopederivedfromDEM
Elevation(DEM)
Fuzzy Logic Classification (ENPOC)
Atmospheric Correction
Digital Landuse Map
Knowledge Base(Membership Functions)
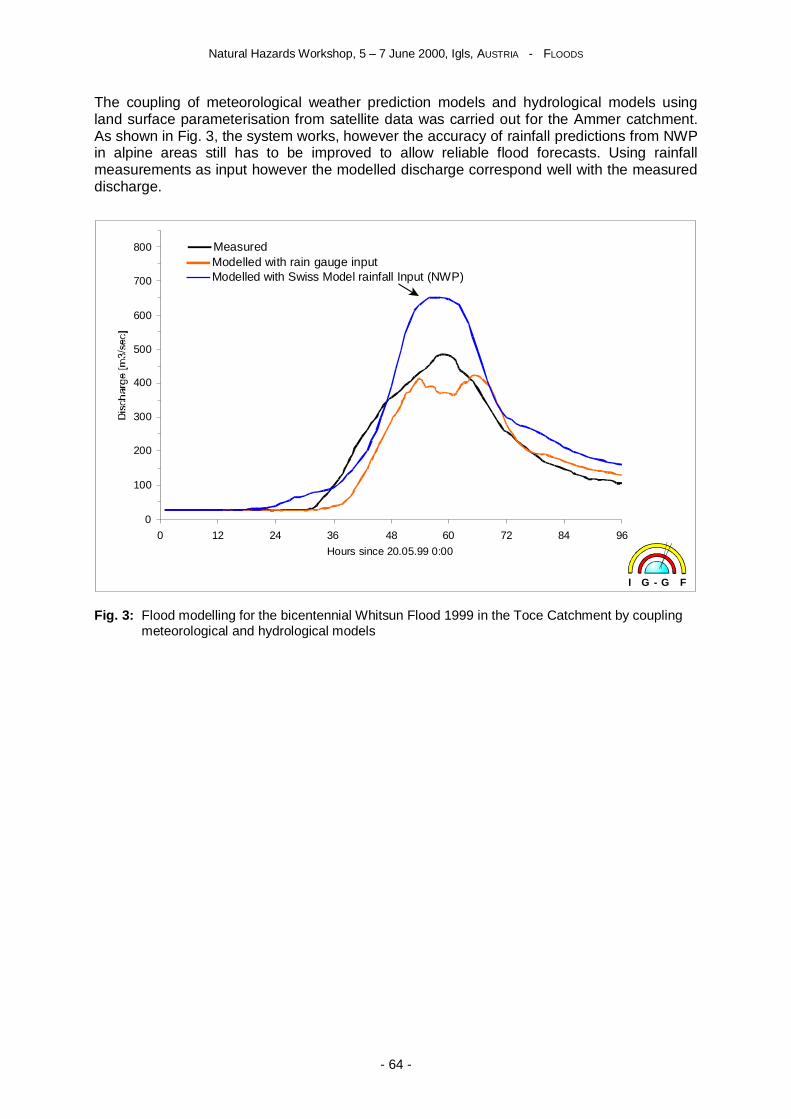
Natural Hazards Workshop, 5 – 7 June 2000, Igls, AUSTRIA - FLOODS
- 64 -
The coupling of meteorological weather prediction models and hydrological models usingland surface parameterisation from satellite data was carried out for the Ammer catchment.As shown in Fig. 3, the system works, however the accuracy of rainfall predictions from NWPin alpine areas still has to be improved to allow reliable flood forecasts. Using rainfallmeasurements as input however the modelled discharge correspond well with the measureddischarge.
Fig. 3: Flood modelling for the bicentennial Whitsun Flood 1999 in the Toce Catchment by couplingmeteorological and hydrological models
0
100
200
300
400
500
600
700
800
0 12 24 36 48 60 72 84 96
Hours since 20.05.99 0:00
MeasuredModelled with rain gauge inputModelled with Swiss Model rainfall Input (NWP)
I G - G F

Natural Hazards Workshop, 5 – 7 June 2000, Igls, AUSTRIA - FLOODS
- 65 -
Strategic application of flood modelling for infrastructure planningand impact assessment
DINAND ALKEMA, ANGELO CAVALLIN, AND MATTIA DE AMICIS
Dipartmento di scienze dell’ ambiente e del territorio, University of Milano – BicoccaPiazza della Scienza 1, I-20122 Milano, Italia
Tel. +39 02 644 744 27 [email protected]
This paper discusses the application of flood models for infrastructure planning and impactassessment. Flood modelling can be used to forecast how large embanked structures affectthe propagation characteristics of floodwaters during a flooding event. Change in thesecharacteristics will alter the risk of the flood on the structure itself and on the surroundingenvironment. Flood modelling can thus be included in the Environmental Impact Assessmentthat is usually required for these projects. Once it is clear that a new project will alter theflood propagation characteristics – and thus the flood-impact – flood models can be used tohelp designing the layout of the structure to minimise negative impact and to optimise thepositive effects.
The recent development of powerful flood-propagation models that can be applied tocomplex digital terrain models (DTM) allow to forecast the effects of new elevated structureson the flooding processes. Human land-cover alterations can be translated in changes of theDTM and of the surface friction coefficients. This will result in changes in the floodpropagation characteristics, such as the maximum height of the flood at a specific location ata certain time and the flow-velocity. Together with the season in which the flood occurs andthe duration of the event, these flood characteristics will have different effects on the varioustypes of land-use. With these models it is now possible to compare pre-project and the post-project impact to show which areas benefit (where impact decreases) and where impactincreases. The method can also be used to aid designing mitigation measures
The preliminary results of a case study near Trento (Italy) are presented as example for thepotential of strategic application of flood models. Trento is situated in valley of the river Adigethat is an example of a complex alpine valley system in which environmental componentsinteract within a limited space in a strongly dynamic way. On the alluvial plain the scarcespace is claimed for urban areas, industrial sites, infrastructure and agricultural activities(vineyards and orchards). In the same area the highly dynamic river Adige is constrained inits activity (and space) by dikes on either side. The area has a long history of flooding eventsbut still the area is developing in a rapid way and is of considerable economic importance onan international level due to the fact that it is the most important year-round trans-alpinetransport route connecting Italy with central Europe.
ACKNOWLEDGEMENTS:
This study is part of the project GETS (Geomorphology and Environmental ImpactAssessment to Transportation Systems) funded by the European Union (contract:ERBFMRX-CT97-0162) and is carried out in close collaboration with the AutonomousProvince of Trento.
Natural Hazards Workshop, 5 – 7 June 2000, Igls, AUSTRIA - FLOODS
- 66 -
The Regional Model of Hermagor district: Endogenous developmentand Exogenous change Simulation
MEINHARD BREILING
Best Environment Networks; Hartwig Balzen Gasse 3-2-2, A-1210 Wien, AustriaTel&Fax +43-1-2907853 [email protected]
During 1988 and 1993 statistical models of Hermagor district - a mountainous area with 800km² and 25,000 inhabitants, situated in Carinthia/Austria - were developed. The modelsshould be integrated to an overall model of Hermagor district (Breiling 1993) to anticipate themajor challenges for the regional development. Modelling is usually applied in a particularfield of expertise, e.g. to assess the probability or impacts of flooding or to forecast the timberharvest of the region, but not in comprehensive planning and related decision making. Theacceptable uncertainties of specialist models can easily reach unacceptable levels in anintegrated overall model of a region. Following topics with associated couples were importantfor our considerations to the model development:
1. Interest: economy and environment
2. Region: inside and outside
3. Change: observed and forecasted
4. Integration: complete or partial
5. Scenarios: bad and good
1. Interest: economy and environment
The basic idea is to describe socio-economic and environmental development parameters inparallel. For this purpose we develop three specialised models, one describes "economy"with help of an economic-demographic model, one explains "environment" with help of ahydrological model and a third one depicts the "economy-environment" interaction with helpof a land use model. Our first idea was to develop well functioning specialist models and thento integrate them in a quantitative way to the overall model. We succeeded to simulateimpacts in the case of the economic-demographic model (Breiling, Charamza 1994), butcould not come up with satisfying results in the case of the hydrological and land-use modelof the region, mainly because of reasons described under point 3.
2. Space: inside & outside
We differ between inside and outside of a region. The size of the region is determined fromthe beginning. Certain factors influence from within, others govern from outside. Ourspecialised models describe inside development and assume exogenous factors as stable intime. In the next stage we consider even a change of the exogenous factors and use globalclimate change scenarios. This change has an impact on all our specialised models. We caneither quantify an impact in one or all specialist models. Inside one can locally influence thesituation while outside an influence is negligible. The model shows also possibilities tocounteract an expected event from inside the region, while the cause of this event can restoutside.

Natural Hazards Workshop, 5 – 7 June 2000, Igls, AUSTRIA - FLOODS
- 67 -
3. Dynamics: observed & forecasted
In our case we use the period 1951 to 1991. All our data was recorded during this period.However, the intervals of taking data varied. In the case of population or land use data, newentries came only once in a decade, while hydrological and meteorological data was takenfrom daily records. Time series of a decade could either contain only 2 or a maximum of3653 data entries (in the case of precipitation and run off data). In the case of hydrologythere was only a 14 years period of overlapping of precipitation and run-off data available,too short to serve our concept. Based on the observation length of 40 years, forecasting maygive reliable results for half of this period or 20 years. Climate change scenarios with forecasthorizons of 50 years and more have to be adjusted to our local forecasting period.
4. Integration: complete or partial
While a specialist model forces the cause-effect relation in its own competence area, theintegrated model can show aggravating and trade off effects between several factors andevaluate the specialised model. The more specialised models we employ, the richer therange of alternatives we can choose from will be. Integration refers to different topics ofinterest and their spatial and dynamic significance. All data had to be related to Hermagordistrict and the period 1951 to 1991. A complete integration soon turned out to be anunachievable job. Nevertheless, we could see why the linking of different specialised modelsdid not work and what could be done to improve it. Finally, we were able to partially integratesome of our topics and to interpret the outcome in a more precise way than without the helpof modelling.
5. Scenarios
The aim of the overall model is to demonstrate under what condition a certain kind of a"good" or "bad" development can happen. One can test scenarios of scientists (for exampleglobal climate change research) or decision makers (wishes of local politicians) and combinetheir expectations in a future reference point. Can regional economic growth continue evenunder conditions of warming? Does the construction of more lifts for skiers pay off if there willbe a major warming in the next decades? Can the number of catastrophes increase as aconsequence of extreme weather events and decreased resilience of the local environment?Is additional safety provision necessary? Will there be enough money to finance safetyprovisions?
One can examine, if and under what conditions an endpoint can be reached. For example,we can simulate a reduction of the population with x% or a destabilisation of y% of land in zyears and describe ways how such a situation could happen. The outcome differed widelyaccording to our assumptions of certain parameters. Rather small events could aggravate tolarge costs. Even under conditions of a doubling of CO2 in the atmosphere landscapedestabilisation could be balanced by improved forest or water management.
In conclusion, integrated modelling can play a more important role. Planning can becomeincreasingly more powerful in giving appropriate information concerning the manyalternatives to a possible future. It helps to better manage complexity and to reduce surprise.While we cannot cover all topics that are relevant for the regional development in anintegrated model we will cover increasingly more topics once we have started to construct it.We can set larger or smaller regional borders or concentrate on a longer or shorter future.Our view on space and time scales will then become an equally important subject forintegration. The cause-effect relation is not limited to the same regional scale, but coverseverything from local to global. While threats may arise from the global scale, we should seeopportunities in the local one.

Natural Hazards Workshop, 5 – 7 June 2000, Igls, AUSTRIA - FLOODS
- 68 -
References:
Breiling, M. (1993). Die zukünftige Umwelt- und Wirtschaftsituation peripherer alpiner Gebiete.Dissertation, Inst. f. Landschaftsgestaltung, Universität für Bodenkultur, Wien. Endbericht FWFProjekt P8079SOZ.
Breiling, M. P. Charamza (1994). Localizing the threats due to changing climates - an interdisciplinaryapproach based on a local model of Hermagor district in the Eastern Alps. Conference: MountainEnvironments in Changing Climates, Davos. Editor M. Beniston; Routledge.
Natural Hazards Workshop, 5 – 7 June 2000, Igls, AUSTRIA - FLOODS
- 69 -
Three dimensional images of mountainous areas and river beds,observation of changes caused by natural hazards
HERWIG ÖTTL
German Aerospace Center (DLR), Oberpfaffenhofen, Postfach 1116, D-82234 Wessling, GermanyTel: +49-8153 282365, Fax: +49-8153-281465, email: [email protected]
Within the last decade, technological progress in microwave and optical remote sensingsystems for airborne and spaceborne applications permitted three dimensional observationsand drastically improved accuracies.
On one hand, single-pass SAR interferometry has been demonstrated with altitudeaccuracies of 1 m (airborne DLR experiment) and of 5 m (SRTM, X-SAR interferometer),while on the other hand electro-optical stereo cameras achieve resolutions of 5 m(spaceborne MOMS) and of 0,1 m to 0,3 m airborne HRSC in each of the 3 directions.
In case of natural hazards, change detection is of high importance and requires actually ahigh relative accuracy with respect to an existing (e.g. previously measured) DEM.
Spaceborne SAR interferometry ordinarily offers pixel sizes of 25 m x 25 m to 30 m x 30 mand altitude accuracies in the order of 5 m to 30 m. DLR’s airborne SAR interferometer offersa pixel size of 3 m x 3 m and an altitude accuracy of 1 m; spaceborne and airbornedifferential SAR interferometry permits the detection of local altitude changes in the cm rangewith reference to the unchanged surroundings. This might be sufficient to monitor thedevelopment of land slides or bulging volcano slopes, but it is certainly not sufficient formeasurements of river beds in connection with possible floods.
For this purpose, the newly built multispectral electro-optical stereo camera ADC might bethe right sensor. It was originally developed for interplanetary missions (HRSC) and latermodified for airborne photogrammetric applications. Due to its high accuracy (dm range), itwas already operated for city-DEMs (inventory, rural planning, telecommunications); forinstance, a complete new digitised map of Berlin has been created. Furthermore, some floodendangered riverbed sections of the Oder have been imaged and used for flood levelsimulations. Reliable run-off models and flood-endangered areas can probably be easieridentified if an accurate DEM is available.
Natural Hazards Workshop, 5 – 7 June 2000, Igls, AUSTRIA - FLOODS
- 70 -
ERS SAR data and GIS mapping for the flood risk assessment inKlodzko area (Sudety Mts. Poland)
ZBIGNIEW PERSKI, ZYGMUNT HELIASZ*, S7$1,6à$:�OSTAFICZUK*, AND ZBIGNIEWSNIESZKO
University of Silesia, Faculty of Earth Sciences, Bedzinska 60, PL-41-200 Sosnowiec, PolandTel +48 32 2918381 Fax +48 32 2915865 Email [email protected]
*Polish Academy of Sciences, Mineral and Energy Economy Research Institute, P.A.S.iK.G.,Ksiecia Janusza 64, PL-01-252 Warszawa, Poland
The catastrophic flood in 1997 affected almost 35 000 sq. km of densely populated arablelands. It turned the attention to the lack of modern techniques for supporting long termplanning of protective works against natural disasters. Such enormous floods provide also anopportunity to validate standardisation in techniques for flood –risk minimising in mountainareas. The cartographic and remote sensing data acquired during the flood event in 1997, ase.g. the acreage of affected areas and its changes, catchment run-off and other can be fedinto an area model, that will be used for zoning of endangered areas, for eco-geologicalsurveys, and for the landuse planning.
The satellite Synthetic Aperture Radar (SAR) instrument can collect data independently ofweather and light conditions: it is an excellent tool for tracking the catastrophic floodsparticularly since the weather during these periods is always overcast and rainy. The multi-temporal technique is normally used to identify and highlight the flooded areas. Thistechnique uses black and white intensity radar images of the same area taken on differentdates and assigns them to the red, green and blue colour channels in a colour image.Additional information about flood phenomena can provide the coherence map – a product ofSAR interferometric technique. Due to the sensitivity of the interferometric phase to temporalchanges the phase of the radar signal is usually totally degraded by a wet weather during thefirst phase of flood. However, the coherence images processed from couples of dataacquired before the flood and after the flood present a valuable tool for detecting theenvironmental changes. The changes can be clearly mapped using multitemporal coherencecomposition and in comparison with SAR intensity images. Repeat-Pass RadarInterferometry offers also the opportunity to estimate full 3D geographical information.Satellite DEM can be obtained very quickly and provide near real-time data about surfacemorphology. Despite low vertical accuracy this DEM is very useful for calculation of the sizeof catchment area, slope maps, landslide and slope-wash hazards. Combining the DEM withSAR intensity and coherence images allows evaluating the environmental changes in fluvialchannels, catchment area dynamics, erosional and depositional processes related to theflood.
The presented work is a part of ESA AO3 205 international project: “ ERS SAR Data for theMapping of Flood Damages Caused to the Environment in Odra River Area (South Polandand East Germany)” and is also financed from Research project 9T12B 027 15 of PolishState Committee for Scientific Research: “Dynamic assessment and forecasting of geologicalKD]DUGV�FDXVHG�E\�WKH�IORRG�RQ�WKH�EDVLV�RQ�1\VD�.áRG]ND�ULYHU��2VREáRJD��8SSHU��6RáD�DQGUpper San-Solinka”.

Natural Hazards Workshop, 5 – 7 June 2000, Igls, AUSTRIA - FLOODS
- 71 -
The using of HYDROG-S as a rainfall – runoff model for floodforecasting in Odra river basin
JALAL H. YOUNIS AND MILOŠ STARÝ*
Czech Hydrometeorological Institute "CHMI" Branch Ostrava, K Myslivne 1, CZ-708 00 Ostrava-Poruba, Czech Republic, Tel: +420-69-6900247, E-mail: [email protected]
*Technical University - VUT Brno, Tel: +420-5-41147770, E-mail: [email protected]
From the early beginning of civilisation floods as natural disastrous events have motivatedthe experts, citizens and others to understand and identify reasons for the occurrence ofthese floods. Also, man has recognised that as there is a heavy rain or storm or there is amelting of snow there should be a rise of the water stage in the river. Therefore, he hasalways tried to mitigate the destructive consequences of floods either by constructing dams,levees, ponds or enlarging the stream channel, etc. but during the second half of the lastcentury many hydrologists have developed models and programs to forecast flooding andwarning systems to give signal to the public that flood is coming.
In 1997 the biggest flood in the last century occurred in Odra river basin during a two weeksperiod from July 4th to 20th. This flood created a huge damage on the order of about 62 billion.þ� �&]HFK� &URZQV��� RU� ���� ELOOLRQ� 86'�� ��� GHDWKV�� ����� GDPDJHG� RU� GHVWUR\HG� KRXVHV�partial or total destruction of 1850 km of roads and 950 km of rail tracks. This heavy damageled the decision-makers to take a solid step in order to mitigate flood consequences and todevelop flood forecasting and flood warning systems. For this purpose the rainfall-runoffmodel HYDROG-S has been used in the Czech Hydrometeorological Institute – BranchOstrava, which is an upgrade version of the HYDROG model. This version is designed forsimulating rainfall-runoff processes and to give the operational forecast of the waterdischarge in the drainage network and above all the total runoff in the closing profile. It ispossible to use the model in river catchments with or without dam reservoirs. Input data arecausal antecedent rainfall and the forecasted one in the watershed and measured dischargein selected profiles of the stream, which serves for correction of the simulated discharge.
REFERENCES:
Stary, M.: HYDROG & HYDROG-S, Software for simulation, prediction and operative control ofoutflow from river basin. Hysoft Brno, 1991-2000.
Kubat, J.: Floods 1997/1998 in the Czech Republic; Hydrological Evaluation. NATO AdvancedResearch Workshop on Coping with Floods. Malenovice, 16 – 21 May 1999.
Natural Hazards Workshop, 5 – 7 June 2000, Igls, AUSTRIA - FLOODS
- 72 -
From point data and cartography to the analysis of runoff andmass-movement processes in torrent catchment areas
GERHARD MARKART, BERNHARD KOHL, HERBERT PIRKL*, AND B. SOTIER**Institute for Avalanche and Torrent Research, Federal Forest Research Station,
Rennweg 1 –Hofburg, A-6020 Innsbruck, AustriaTel +43-512-573933-5130, Fax +43-512-573933-5250, E-Mail: [email protected]
*Technisches Büro für Umweltgeologie und Geoökologie – GEOÖKO,Gentzgasse 17/1/6, A-1180 Wien, Austria, Tel & Fax +43-1-4796291 E-Mail: [email protected]
**Bernadette Sotier, Ecking, D-83083 Riedering, Germany Tel +49-8036-8192 [email protected]
For assessment of the main processes in torrent catchment areas, e.g. runoff characteristicsin cases of heavy rain and the formation of mass-movements, an interdisciplinary researchconcept was developed. This approach is based on three pillars:
In a first step the results of punctual investigations (Simulations of heavy rain, soil physicaldata...) and additional research on wider areas (Soil mapping, vegetation mapping,...) arejoined together. The outcome from the aggregation of this dense and detailed information isa surface-runoff-ratio-map. In this map classes of runoff coefficients are assigned to thedominant soil-vegetation complexes according to the results gained from the fieldexperiments. Simulation of heavy rain requires high effort. For minimisation of timeconsuming field experiments a data base comprising most of the results from rainsimulations in the eastern Alps has been established. Based on the information from thisdata base and knowledge about distribution of actual vegetation, pedological conditions, wayand intensity of cultivation in the catchment area the assessment of surface runoff in torrentcatchment areas in cases of heavy rain becomes possible.
Runoff processes do not only occur on the surface of the landscape, in reality they are three-dimensional processes. So in a second step a pseudo three-dimensional view wasconstructed on the basis of pedologic and vegetation maps, geologic, hydrogeologic andgeomorphologic maps, which allow description of runoff processes for a defined polygon ondifferent levels. Three main types form the basis:
Type 1: Predominantly surface runoff takes place. Only slight retention potential isascertained for the soil-vegetation complex.
Type 2: Runoff dominantly takes place as subsurface flow (within soil and/or uppermostweathered zone, < 2 m depth). For the soil-vegetation complex a certain retentioncapacity is assumed or derived from measured data.
Type 3: Due to geological conditions runoff predominantly takes place in the underground (>2 m up to > 100 m depth). Dominant retention potential in the underground, also thesoil-vegetation complex shows high retention capacity.
Besides the processes of runoff development mass movements and bedload formation arethe next process-complex of interest in torrent catchment areas. Similar to the runoff profiletypes a highly aggregated methodology was developed. Three process-types can be defined:
Type A: Mass movement in the rock, which may cause deep bedrock loosening. Thisprocess can be classified according to the mechanics as sliding (with base-dislocation plane) and deep-creeping (without base-dislocation plane).
Type B: Mass movements in soft-rocks, „landslides“ of soft-rocks (translation-/ rotationmovements) near the surface or soil-/ weathered zone on bedrock in different depth.
Type C: Linear and extensive erosion caused by heavy surface runoff and/or near surfacerunoff, bottom-/lateral erosion and further erosion phenomena.

Natural Hazards Workshop, 5 – 7 June 2000, Igls, AUSTRIA - FLOODS
- 73 -
The big advantage of the methods discussed (surface-runoff-ratio-map, runoff-profile-types-map, mass movement-process-type-map) is that they are independent from scale. Theyallow both: working on the overall view and going into detail on the local level. (125)

Natural Hazards Workshop, 5 – 7 June 2000, Igls, AUSTRIA - FLOODS
- 74 -
Synergistic use of synthetic aperture radar and optical satelliteimages for monitoring the alpine snow cover
THOMAS NAGLER AND HELMUT ROTT
Institut für Meteorologie und Geophysik, Universität Innsbruck, Innrain 52, A-6020 AUSTRIATel: ++43 512 507 5495 Fax: ++43 512 507 2924 Email: [email protected]
http://dude.uibk.ac.at/
Current information on the extent and properties of the snowpack are required for snowmeltrunoff forecasting and flood predictions. Satellite-borne sensors are able to provide synopticsnow cover data. Of particular interest for real-time runoff forecasting is Synthetic ApertureRadar (SAR) because of the ability to observe the earth surface through clouds. Methods forautomated snow mapping in mountain areas have been developed for (SAR) and highresolution optical satellite images. The information content of these two sensor types iscomplementary. SAR is sensitive to melting snow, but dry snow can hardly be detected inalpine areas due to the strong backscattering at the snow/ground interface. The SARalgorithm for classification of melting snow applies change detection, using the ratio of thebackscattering coefficients between SAR images with wet snow and reference images whichwere acquired during snow free conditions or with completely dry snow cover (Nagler andRott, 2000). Land use information from optical images is applied to mask out dense forestsfor which C-band SAR cannot be applied for snow mapping due to the limited penetration.Snow maps from optical sensors from previous years can be used to correct for dry snowareas at high elevations in spring. In general the insensitivity to dry snow is no problem forsnowmelt forecasting in Alpine basins, because for this application the temporal dynamics ofthe melting snow areas is essential which can be monitored by SAR.
Snow mapping algorithms were developed and tested with satellite data from the EuropeanERS SAR (C-band, VV polarisation, look angle 19 degrees), the Canadian Radarsat SAR (C-band, HH polarisation, look angle 40 degrees), and images from Landsat-5 Thematic Mapperand SPOT-3 and -4 HRV in the visible and near infrared. Time series of snow maps wereproduced for several drainage basins in the Austrian Alps and used as input for runoffmodelling during several snowmelt periods. In the research project HYDALP (Hydrology ofAlpine and High Latitude Basins), supported by the EC, methods for satellite data analysisand hydrological modelling were tested in drainage basins in the Austrian and Swiss Alps, inScotland and in Northern Sweden and applied runoff simulations and real time runoffforecasts (Rott et al., 1999; 2000). Fast data links and automated processing schemesenabled the generation of snow cover maps within few hours after the satellite overflight.These activities confirm the usefulness of the satellite snow cover maps for operationaltasks. During the snowmelt period the regular repeat capability of SAR is of particularimportance, but the optical sensors provide important synergistic information on total snowextent, albedo, and land use.
References:
Nagler T. and H. Rott, 2000: Retrieval of wet snow by means of multitemporal SAR data.IEEE Trans. Geosci. Vol 38, No 2, Mar 2000, 754-765.
Rott H. et al., 1999: HydAlp, a European project on the use of remote sensing for snowmeltrunoff modelling and forecasting. Proc. of IGARSS’99, IEEE Cat.Nr. 99CH36293, 1779-1782.
Rott H. et al, 2000: HYDALP, Hydrology of Alpine and High Latitude Basins, Final ReportInstitut für Meteorologie und Geophysik, Univ. Innsbruck, Mitteilung Nr. 4 (2000), 201 pp.

Natural Hazards Workshop, 5 – 7 June 2000, Igls, AUSTRIA - LANDSLIDES
- 75 -
Some aspects of landslide hazards – prevention and prediction
HANS ANGERER
WLV, Liebeneggstraße 11, A-6020 Innsbruck, AustriaTel +43 512 59612-0, [email protected]
The term natural hazard itself implies that a damage may occur and this damage is definedform an anthropocentric point of view. This results in a risk, either for human lives or formaterial values such as buildings, infrastructure etc. . We can only talk about natural hazardwhere the natural environment is being exploited or put to use by humans. What we demandof the natural environment changes continuously and at an ever accelerated pace as can besuch as the peri-urbanisation of some valleys; or the development of the traffic system andtourism, as well as the changes that have occurred in agriculture, to name but a few. Anumber of publications such as Bätzing (1993) or Messerli (1999) report on the future needsand developments of the alpine areas.
WITH REGARD TO THE RISKS OF NATURAL HAZARDS THE FOLLOWING CONCLUSIONS HAVE TO BEDRAWN:
1. New forms of exploitation lead to new areas of risk2. There is increasing sensitivity to natural hazards. Besides immediate damage caused
by natural catastrophes secondary economic damage e.g. interruption of traffic veins.3. Feedback to the natural hazards themselves due to exploitation or a change in
exploitation
As a consequence the future exploitation has to follow a carefully developed andcomprehensive land use planning with special emphasis on effectiveness. Generallyeffectiveness is understood as long lasting. Yet it is definitely more. In today’s senseeffectiveness requires an overall compatibility, i.e. economic, ecological and socialcompatibility. To keep it short and simple compatibility means:
⇒ to live of the interest rather than the capital or
⇒ to use the resources in such a way that all future generations will have the sameopportunity - economically as well as ecologically and socially.
To optimise a measure - and every form of exploitation is also a measure - with regard toeffectiveness is called effectiveness - or environmental risk management. This optimisingprocess has to be iterative (by means of a self-regulating circle); because the connection ofcause (A), effect (B) and measure (∆A) cannot be formulated analytically.
Although there is a great number of possible measures these can be categorised as follows:
A) Technical measures (environmental technology), basically 3 types:
1. Reduction of source strength, emissione.g. change of exploitation
2. Reduction of effect, and/or transmissiondecrease, turn around, transformation
3. Reduction of influence, and/or immissionprotection, displacement

Natural Hazards Workshop, 5 – 7 June 2000, Igls, AUSTRIA - LANDSLIDES
- 76 -
B) Non technical measures:
1. Compensation2. Material replacement, financial compensation3. Reduction of sensitivity4. and/or increase in sensitivity5. Adaptation of normative requirements6. Change in limiting values, protection targets
In our further considerations we will restrict ourselves to the area of emissions in connectionwith the topic of landslide hazards.
We know that the environment changes in the course of time regardless of exploitation. Thepresent instantaneous state of the environment can be observed on documented throughfieldwork. Future instantaneous states have to be predicted with the predictions basing onmodels of the development without exploitation or taking into consideration some measures.
As the first step towards recognising and evaluating landslide and erosion potentials relevantnatural processes in the respective area have to be recorded. Once past and presentprocesses have to be recorded this will lead us to recognise the processes which areresponsible for future changes, for hazards. Particularly in the field of mass movements wefind a hierarchy of processes, i.e. spatially superior mass movements of the same or asimilar kind of process (e.g. Talzuschübe) are decisive factors for the existence or thebeginning of local mass movements. Among other reasons our increased understanding ofthe processes has led us shift to a so-called "top-down" approach when dealing with massmovements and landslides . We follow this approach with regards to contents and structuresall the way to the necessary functional level of details as well as with regard to the context ofplace and time. As far as our planning requirements are concerned this approach includes aconsiderable effort on the level of regional planning which comprises process related,comprehensible records and evaluations of natural hazards as one important module.
On this level of planning we employ mainly the different methods of remote sensing in orderon the one hand, to produce models of the ground which have the utmost degree ofaccuracy. And on the other hand, the remote sensing data gained from satellite and aerialphotographs permit an evaluation focussing on special issues. The latter can providesequences of findings - sometimes improving as time passes - about the course of thedevelopment. These methods are also put to use when it comes to monitoring measures thatwere taken. As a matter of fact, the present methods of remote sensing can and do serve ascomparably inexpensive and timesaving operational systems of process recording andhazard detection. To employ these methods sensibly (according to JAKOB, 1996) one has to
⇒ formulate precisely the mission and goal of such a system
⇒ analyse the needs of the users
⇒ recognise hazard related changes and/or the factors responsible for the
changes
⇒ predict the future course of the changes
⇒ develop a concept for the employment of remote-sensing methods taking
into consideration needs and technical possibilities

Natural Hazards Workshop, 5 – 7 June 2000, Igls, AUSTRIA - LANDSLIDES
- 77 -
The goals of air-based recording of conditions and changes in natural as well as cultivatedareas can generally be divided into three groups:
1. Recording process types and conditions
Forms of mass movements (possibly including rates of deformations), structural patterns
(e.g. network of waters); condition of vegetation
2. Detecting hazards⇒ Immediate: the change has already occurred (e.g. blockage)
⇒ Medium term: Recognising relevant factors for future changes
⇒ Long term: recognising processes, which are responsible for future
changes
3. Planning and controlling hazard protection⇒ Set up a basis for planning
⇒ Plan and execute countermeasures
⇒ Check the efficiency of the implemented measures (technical and
biological)
4. Up to the time of planning the operation the users need such operational systems to be:⇒ Highly functional
⇒ Easy to understand and operate
⇒ Affordable
⇒ Well compatible with existing structures
⇒ Appropriate solution in relation to the given task
⇒ Reliability
From regional planning to the next lower planning level, local planning, there is a shift ininstruments. In torrent and avalanche control we use the term local planning level for areasthe size of an catchment area of a torrent. Just as in regional planning we still employ air-based methods of recording conditions and changes, in this case, however, complementedby mapping on a scale of 1:1000 to 1:10000. Whereas in regional planning we record slopeprocesses mainly based on the interpretations of aerial photographs mixed with existing dataand material from relevant literature, and check the process types through spot checking thearea, on a local level detailed maps are made. We produce process maps with processrelevant parameters, including geological, geo-morphological, and hydro-morphologicalstructures, sometimes even soil - and vegetation related criteria. Based on variousprecipitation and draining conditions we can deduce and forecast developments taking intoconsideration various conditions of the system. On this planning level hydro-graphic andhydrological methods and models gain increasing importance. Although great progress hasbeen made in the field of complex system interdependencies between underground andsoil/vegetation complex with regard to precipitation, draining, and erosive processes, atremendous amount of research still needs to be done and many aspects still remain to bedeveloped. The multidisciplinary stance must be given the utmost priority.
On the lowest planning level the above mentioned methods and instruments are joined by anincreasing number of geodetical, geophysical, and geotechnical methods. There is such awealth of methods that I cannot start to name them all. Besides, we will hear more aboutthem from true experts in the course of this day. In conclusion I would like to point out oncemore the importance of goal oriented project planning. Once the higher goals of a projecthave been clearly defined, the planning of the process itself should be interdisciplinary.Another vital requirement is an iterative work process, i.e. the planning itself has to be

Natural Hazards Workshop, 5 – 7 June 2000, Igls, AUSTRIA - LANDSLIDES
- 78 -
continuously evaluated with regard to new findings and to be adapted if and wherenecessary. Often, this is not popular with the clients, who want detailed planning with regardto time and money way in advance. It is our task as consultants, particularly as members ofthe Public Services, to convince our clients and/or the Public Administration that such aprocedure would be counter productive. Ideally the regional and local planning levels havealready provided their data, which does not only save time and money but also facilitate thedialogue with the client (= institution or person who is interested in benefiting from themeasures). It goes without saying that the top down method which is part of modernenvironmental risk management is also applied on this project related planning level.
REFERENCES
Bätzing W., et al. (1993). Der sozio-ökonomische Strukturwandel des Alpenraumes im zwanzigstenJahrhundert. Geogr. Bern. P26.
Jakob F. (1996): Luftgestützte Erfassung von Veränderungen im Natur- und Kulturraum (Monitoring):Interpraevent. Bd. 4.
Messerli P. (1999). Die Verstädterung der Alpen – neue Rahmenbedingungen für eine nachhaltigeNutzung?. Eidgenössische Forschungsanstalt für Wald, Schnee und Landschaft (Ed.): NachhaltigeNutzungen im Gebirgsraum. Forum für Wissen 1999,2, 70p.

Natural Hazards Workshop, 5 – 7 June 2000, Igls, AUSTRIA - LANDSLIDES
- 79 -
Experience with monitoring of landslides
HANS-RUDOLF KEUSEN AND KASPAR GRAF
Bereich Naturgefahren, GEOTEST AG, Birkenstrasse 15, CH-3052 Zollikofen, SwitzerlandTel +41 31 911 01 82 Fax +41 31 911 51 82 Email [email protected]
ABSTRACT
Systematic spatial and temporal monitoring of landslide-movement in the Swiss Alps is thebasis for an early-warning service in hazard and risk management. Suitable nearfield andfarfield measuring techniques are used to follow the behaviour and development of massmovement in order to provide authorities with ample information to avoid or minimisedamage. Measuring techniques involve borehole inclinometers and extensometers, tiltmeters and short-distance laser distometers on superstructures as well as simple wire-measurements in emergency situations. The most widely used technique for landslidemonitoring is laser distance and angle measuring over distances of up to 5 kilometers with anaccuracy of ±1mm +2ppm of the distance. High-precision, differential GPS measurements isless widely used, because of the often treacherous access of the slide areas. Moreover thesatellite accessibility in steep and densely forested, narrow valleys is often to poor foraccurate positioning. Three case histories with different dynamic characteristics in the SwissAlps are discussed: Long-term measurement of a 3-4*105 m3 rock mass in the Jungfrauregion; movement characteristics and prediction of large rock fall at Randa, Valais;acceleration and deceleration characteristics of 20*106 m3 landslide at Lauterbrunnen,Bernese Oberland.
The Upper Jurassic rock mass at the location Grätli - Schynige Platte, Jungfrau region issliding on a marly base with 26° inclination and speeds of 30 - 40 mm/a. Continuousmeasurements exist since 1929 and show a remarkably even movement consistent with aBingham plastic model of deformation with a damping effect. The Randa rockfall of 1991comprised a first event with a mass of 20*106 m3 and a second event of 10*106 m3 onemonth later predicted 5 days beforehand by an early-warning service including geodetic- andwire-measurements. The Lauterbrunnen landslide consists of a mass of moraine and alluvialdeposits with a thickness of up to 60 meters and a mass of about 20*106 m3 sliding on asteeply inclined rock surface. Movement is controlled largely by melt water flow in deepcarstic aquifers entering the base of the landslide. Early-warning service is provide here bylaser-measurements from a base on the opposite valley side. Actually (May 2000) the massis accelerating after a period of dormancy in winter and forced movement in spring-summer1999.
WARNING AND MONITORING SYSTEMS
Monitoring of natural mass movements includes all systematic observation and measuringtechniques suitable to describe the behaviour and evolution in order to provide an accurateearly warning system for an impending or possible slide or fall event. Such systems arementioned in the Swiss Forestry Law of 1991 as a means to protect society from loss of lifeand property and are as such subject to funding by the State. Monitoring aims to measurethe deformation and movement in space and time of unstable bodies of especially rock andsoil in order to find an accurate and true model for the assessment of the hazard potential.
An early warning network is always taken by the public as a shield against natural hazard.Therefore the responsibility lies heavily on the operator of such a system. Poorly installedand maintained early warning systems as well as misinterpretations of the data aredangerous and can have fatal and will cause legal actions.

Natural Hazards Workshop, 5 – 7 June 2000, Igls, AUSTRIA - LANDSLIDES
- 80 -
TYPES AND CHARACTERISTICS OF ROCK AND SOIL MOVEMENTS
We recognise to basic kinds of movement; the underlying physical principles will not bediscussed further.
• Slope creep: is the uniform or near uniform movement of rock and soil (ice) on aninclined surface (=slip surface, shear horizon). The driving forces of gravity and hydraulicpressure acting against the restraining forces of internal friction and cohesion are in anear equilibrium that will undergo short and long term changes.
• Spontaneous gravity sliding: after a phase of slope creep a rock or soil mass can besubject to catastrophic loss of cohesion/friction and enter a state of acceleratedmovement.
The recognition of the state of movement a rock or soil mass is in or the change it isundergoing is crucial for an early warning system.
PREDICTION OF SLIDE OR FALL HAZARD
The end-state development of landslides and rock falls shows a typical exponentialdeformation and accelerated movement. The time of rupture can be inferred by the inversevelocity function. The interpretation must however take into account the complexity andheterogeneity of the natural mass systems. This must also be considered when designing amonitoring system.
MONITORING METHODS
In order to select the suitable monitoring system for a given problem we have to answer arange of questions:
� how many monitoring points are needed to survey the whole sliding mass ?
� are the collected data representative for the whole movement ?
� is the full scale of mass movement covered by the observation ?
� is surface monitoring sufficient or are observations of internal deformation needed ?
� are the data accurate enough to observe significant changes in the development of amass movement ?
� is it safe to access the landslide for measurements (short / long term accessibility) ?
� is the survey to be conducted by local, non specialised personnel ?
� does early warning include automatic systems with data relay and/or automatic alarmdevices (sirens/red lights) ?
Monitoring often begins with emergency systems using simple manual and low frequencymeasurements. In general the early warning system has to provide data with a high accuracyas well as a high frequency in order to eliminate bias through external factors and enable thedescription of movement characteristics.

Natural Hazards Workshop, 5 – 7 June 2000, Igls, AUSTRIA - LANDSLIDES
- 81 -
Measuring subsidence with SAR interferometry applications of thepermanent scatterers technique
ALESSANDRO FERRETTI, CLAUDIO PRATI, AND FABIO ROCCA
Dipartimento di Elettronica ed InformazionePolitecnico di Milano, Piazza Leonardo da Vinci 32, 20133, Milano, Italy
Tel +39 02 2399 3573 Fax +39 02 2399 3413 [email protected] http://www.elet.polimi.it
ABSTRACT
Differential SAR interferometry is a recent and powerful tool to measure small motions of theterrain; the available measurements start from 1991, date of launch of the European satelliteERS-1. The spatial resolution is about 20X20m and the temporal resolution is a pass every35 days. Most of the earth surface has been monitored systematically first by ERS-1, then byERS-2 (launched in 1995) and it will be with the satellite ENVISAT to be launched in 2001,thus creating long and consistent series of data. In urban areas and where exposed rocksare visible, it is possible to identify numerous back scatterers that do not change theirsignature with time (the Permanent Scatterers) and therefore can be used as naturalmonuments to estimate the progressive motion of the terrain. The precision of themeasurement is a small fraction of a wavelength (5.6 cm) and millimetric motions areappreciable with good reliability. The atmospheric contribution is rather smooth spatially andindependent from take to take, so that it can be identified and removed from the data using aproper processing, provided that the density of the PS is high enough as it happens in urbanareas. Then, it is possible to obtain maps of subsidence with very high spatial sampling rate(more than 20 PS/km2, in urban areas) and high quality. After a short description of thepossibilities and limits of this technique, the paper will present results in Paris (France);results in Ancona, Camaiore, Pomona (US) have been discussed in other papers.
INTRODUCTION
The Synthetic Aperture Radar is a microwave imaging system of the earth surface [4]. It hascloud-penetrating capabilities because it uses microwaves. It has day/night operationalcapabilities because it is an active system. Finally, in its “interferometric configuration”, itallows accurate measurements of the radiation travel path because it is coherent.Measurement of travel path variations as a function of the satellite position and time ofacquisition allow to generate Digital Elevation Maps (DEM) and to measure centimetricsurface deformation of the terrain. A SAR imaging system from satellite (as ERS-1 andERS-2) is sketched in figure 1. A satellite carries a radar with the antenna pointed to theearth surface in the plane perpendicular to the orbit (the inclination of the antenna withrespect to the Nadir is called off-Nadir angle and usually ranges between 20 and 50 deg. (21deg. for ERS-1 and ERS-2) for the available systems.
Currently operational satellite SAR systems work at C band – 5.3GHz (the European ERS,the Canadian Radarsat, and the US Shuttle missions), L band - 1.2GHz (the Japanese J-ERS), and X band – 10GHz (the German-Italian X-SAR on the shuttle missions). In the caseof ERS, the illuminated area on the ground (antenna footprint) is about 5km in the along-track direction (also said azimuth direction) and about 100km in the across-track direction(also said ground range direction). The direction along the Line of Sight (LOS) is usuallycalled slant-range direction. The antenna footprint moves at the satellite speed (about7500m/s for ERS) along its orbit (a quasi-polar orbit for ERS-1 and ERS-2 that crosses theequator with an angle of 9 deg. at an elevation of about 800km). It forms a 100km wide stripon the earth surface with the capability of imaging a 450km long strip every minute.

Natural Hazards Workshop, 5 – 7 June 2000, Igls, AUSTRIA - LANDSLIDES
- 82 -
Satellite orbit
Plane perpendicularto the orbit
Antenna footprint
Slant rangeSlant range
AzimuthAzimuth
Ground rangeGround range
Strip-map
Off-nadirOff-nadir
Fig. 1: Description of a SAR system from satellite.
COMPLEX SAR IMAGES
A digital SAR image can be seen as a mosaic (i.e. a two-dimensional array formed bycolumns and rows) of small picture elements (pixels). A small area (resolution cell) of theearth surface is associated to each pixel. Each pixel carries amplitude and phase information(i.e. a complex number) of the microwave field back-scattered by all the scatterers (rocks,vegetation, building etc) within the correspondent resolution cell projected on the ground (seenext section on SAR resolution cell projection on the ground). Different columns of theimage are associated to different azimuth locations whereas different rows indicate differentslant range locations (see figure 1). Location and dimension of the resolution cell in azimuthand slant-range coordinates depend only on the SAR system characteristics. In the ERS-1and ERS-2 case the SAR resolution cell dimension is about 5 meters in azimuth and about9.5 meters in slant-range. The distance between adjacent cells is about 4 meters in azimuthand about 8 meters in slant range (SAR resolution cells are thus slightly overlapped both inazimuth and slant-range).
THE DETECTED SAR IMAGE
The detected SAR image contains a measurement of the amplitude of the radiationbackscattered toward the radar by the objects (scatterers) contained in each SAR resolutioncell. This amplitude depends more on the roughness than on the chemical composition of thescatterers on the terrain. Typically, exposed rocks and urban areas show strong amplitudewhereas smooth flat surfaces (like quiet water basins) show low amplitude since the radiationis mainly mirrored away from the radar. The detected SAR image is generally visualised bymeans of grey scale levels as shown in the example of figure 2. Bright pixels correspond toareas of strong backscattered radiation (e.g. urban areas), whereas dark pixels correspondto low backscattered radiation (e.g. quiet water basin).
THE PHASE SAR IMAGE
The radiation transmitted from the radar has to reach the scatterers on the ground and thento come back to the radar in order to form the SAR image (two ways travel distance).Scatterers at different distances from the radar (different slant range) introduce a differentdelay between transmission and reception of the radiation. Due to the almost pure sinusoidalnature of the transmitted signal, this delay is equivalent to a phase change betweentransmitted and received signals. The phase change is thus proportional to the two waystravel distance of the radiation divided by the transmitted wavelength.
However, due to the periodic nature of the signal, travel distances that differ by an integermultiple of the wavelength introduce exactly the same phase change. In other words thephase of the SAR signal is a measure of just the last fraction of the two ways travel distance

Natural Hazards Workshop, 5 – 7 June 2000, Igls, AUSTRIA - LANDSLIDES
- 83 -
smaller than the transmitted wavelength. In practice, due to huge ratio between theresolution cell dimension (in the order of a few meters) and wavelength (~5.6cm for ERS),the phase of a single SAR image looks random passing from one pixel to another and it is ofno practical utility.
SAR INTERFEROMETRY
A satellite based SAR can observe the same area from slightly different looking angles. Itcan be done simultaneously (two radar should be mounted on the same platform, as in therecent NASA/DLR/ASI survey SRTM) or at different times by exploiting repeated orbits. Thelatter is the case of ERS-1 and ERS-2. In that case, time intervals between observations of 1,35 or a multiple of 35 days are available. The distance between the two satellites in the planeperpendicular to the orbit is called “interferometer baseline” and its projection perpendicularto the slant range is called “perpendicular baseline”.
The SAR interferogram is generated by cross-multiplying pixel by pixel the first SAR imagetimes the second one complex conjugated. Thus, the interferogram amplitude is theamplitude of the first image times that of the second one, whereas its phase (calledinterferometric phase) is the phase difference between the two images.
Fig. 2: ERS SAR detected image of Milano (Italy). The image size is about 25km in ground range(vertical) and 25 km in azimuth (horizontal). Bright pixels correspond to areas of strongbackscattered radiation (e.g. buildings), whereas dark pixels correspond to low backscatteredradiation (e.g. quiet water basin).
TERRAIN ALTITUDE MEASUREMENT THROUGH THE INTERFEROMETRIC PHASE
Let us suppose to have only one dominant point scatterer that does not change in time ineach ground resolution cell. Then the interferogram phase would depend on the travel pathdifference only since the phase of the scatterers is cancelled by the difference. The variationof the travel path difference ∆r that results passing from one resolution cell to another has asimple expression (an approximation that holds for small baselines and resolution cells nottoo far apart) that depends on a few geometric parameters shown in figure 3:
1. the perpendicular baseline Bn
2. the radar-target distance R3. the displacement between the resolution cells along the perpendicular to the slant range
qs.The following approximated expression of ∆r holds:

Natural Hazards Workshop, 5 – 7 June 2000, Igls, AUSTRIA - LANDSLIDES
- 84 -
R
qBr Sn
2=∆The interferometric phase variation has thus the following expression (where λ is the SARwavelength):
R
qBr Sn
λπ
λπϕ 42 == ∆∆
The altitude of ambiguity is defined as the altitude difference qa that generates aninterferometric phase change of two-pi after interferogram flattening. The altitude ofambiguity is inversely proportional to the perpendicular baseline:
B
Rq
na 2
sinθλ=
In the ERS case with λ=5.6cm,θ =23deg., R=850km the following expression holds:
Bq
na
9300≈ meters
As an example, if a 100 meters perpendicular baseline is used, a two-pi change of theinterferometric phase corresponds to an altitude difference of about 93 meters. In principle,the higher is the baseline the more accurate is the altitude measurement since the phasenoise (see next section) is equivalent to a smaller altitude noise.
Fig. 3: Geometric parameters of a satellite interferometric SAR system.
PHASE UNWRAPPING AND DEM GENERATION
The flattened interferogram provides just a measurement of the relative terrain altitude that isambiguous. The phase variation between two points on the flattened interferogram providesa measurement of the actual altitude variation plus an integer number of altitude of ambiguity(equivalent to an integer number of 2⊥ phase cycles). The process that allows to add to theinterferometric fringes the correct number of altitude of ambiguity is called phaseunwrapping. There are several well-known phase unwrapping techniques that are notdiscussed here. However it should be noted here that usually phase unwrapping does nothave a unique solution and “a priori” information should be exploited to get the right solution[1].
Once the interferometric phases are unwrapped, an elevation map in SAR co-ordinates isobtained. As an example, the flattened interferogram and the relative DEM of Mt. Etna

Natural Hazards Workshop, 5 – 7 June 2000, Igls, AUSTRIA - LANDSLIDES
- 85 -
(Sicily, Italy) obtained through phase unwrapping and re-sampling are shown in figures 4, 5.
Fig. 4: Flattened interferogram of Mt. Etna generated from ERS tandem pairs. The perpendicularbaseline of 115 meters generates an altitude of ambiguity of about 82 meters.
Fig. 5: Perspective view of Mt. Etna as seen from North-East. The estimated vertical accuracy isbetter than 10 meters.
TERRAIN MOTION MEASUREMENT THROUGH THE INTERFEROMETRIC PHASE
Let us now suppose that some of the point scatterers on the ground slightly change theirrelative position in the time interval between two SAR observations (as, for example, in caseof subsidence, landslide, earthquake, etc.). In such cases the following additive phase term,independent of the baseline, appears in the interferometric phase, where d is the relativescatterer displacement projected on the slant range direction.
dd λπϕ 4=∆

Natural Hazards Workshop, 5 – 7 June 2000, Igls, AUSTRIA - LANDSLIDES
- 86 -
It is thus evident that after interferogram flattening, the interferometric phase contains bothaltitude and motion components:
dR
qBn
λπ
θλπϕ 4
sin4 +∆ =
Moreover, if a digital elevation model (DEM) is available, the altitude contribution can besubtracted from the interferometric phase (generating the so-called differential interferogram)and the terrain motion component can be measured [6]. In the ERS case with λ=5.6cm andassuming a perpendicular baseline of 150m (a rather usual value), the following expressionholds:
dq
22510
+∆ =ϕ
From this example it appears that the sensitivity of SAR interferometry to terrain motion ismuch larger than that to the altitude difference. A 2.8cm motion component in the slant rangedirection would generate a 2π interferometric phase variation. As an example, the map of theterrain deformation in Paris that occurred from 1992 to 1999, is shown in figure 6.
It should be pointed out that there are many different ways to get a differential interferogram:
1. With a single interferometric pair (two SAR images) and baseline close to zero: theinterferometric phase contains the motion contribution only (see equation (2)). No otherprocessing steps are required.
2 With a single interferometric pair (two SAR images) and baseline different from zero: theinterferometric phase contains both altitude and motion contributions (see equation (2)).
The altitude component has to be removed using a priori information or a Digital elevationmodel obtained from the data themselves.
Fig. 6: The map of the terrain deformation in Paris that occurred between 1992 and 1999. The maphas been generated by means of ERS interferometric images. Blue-green colours show stable areaswhereas areas subsiding with 4mm/year rate are shown in red.
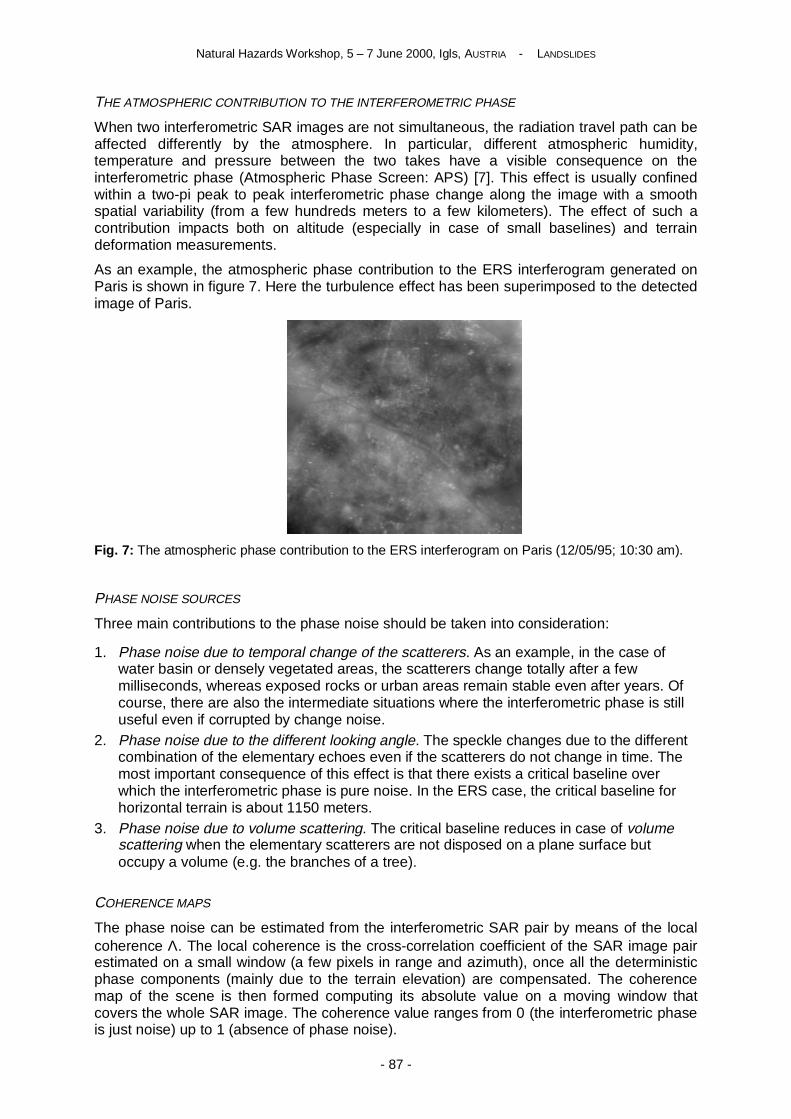
Natural Hazards Workshop, 5 – 7 June 2000, Igls, AUSTRIA - LANDSLIDES
- 87 -
THE ATMOSPHERIC CONTRIBUTION TO THE INTERFEROMETRIC PHASE
When two interferometric SAR images are not simultaneous, the radiation travel path can beaffected differently by the atmosphere. In particular, different atmospheric humidity,temperature and pressure between the two takes have a visible consequence on theinterferometric phase (Atmospheric Phase Screen: APS) [7]. This effect is usually confinedwithin a two-pi peak to peak interferometric phase change along the image with a smoothspatial variability (from a few hundreds meters to a few kilometers). The effect of such acontribution impacts both on altitude (especially in case of small baselines) and terraindeformation measurements.
As an example, the atmospheric phase contribution to the ERS interferogram generated onParis is shown in figure 7. Here the turbulence effect has been superimposed to the detectedimage of Paris.
Fig. 7: The atmospheric phase contribution to the ERS interferogram on Paris (12/05/95; 10:30 am).
PHASE NOISE SOURCES
Three main contributions to the phase noise should be taken into consideration:
1. Phase noise due to temporal change of the scatterers. As an example, in the case ofwater basin or densely vegetated areas, the scatterers change totally after a fewmilliseconds, whereas exposed rocks or urban areas remain stable even after years. Ofcourse, there are also the intermediate situations where the interferometric phase is stilluseful even if corrupted by change noise.
2. Phase noise due to the different looking angle. The speckle changes due to the differentcombination of the elementary echoes even if the scatterers do not change in time. Themost important consequence of this effect is that there exists a critical baseline overwhich the interferometric phase is pure noise. In the ERS case, the critical baseline forhorizontal terrain is about 1150 meters.
3. Phase noise due to volume scattering. The critical baseline reduces in case of volumescattering when the elementary scatterers are not disposed on a plane surface butoccupy a volume (e.g. the branches of a tree).
COHERENCE MAPS
The phase noise can be estimated from the interferometric SAR pair by means of the localcoherence Λ. The local coherence is the cross-correlation coefficient of the SAR image pairestimated on a small window (a few pixels in range and azimuth), once all the deterministicphase components (mainly due to the terrain elevation) are compensated. The coherencemap of the scene is then formed computing its absolute value on a moving window thatcovers the whole SAR image. The coherence value ranges from 0 (the interferometric phaseis just noise) up to 1 (absence of phase noise).

Natural Hazards Workshop, 5 – 7 June 2000, Igls, AUSTRIA - LANDSLIDES
- 88 -
THE PERMANENT SCATTERERS
Stable natural reflectors (Permanent Scatterers) can be identified from long temporal seriesof interferometric data [2,3]. They can be used in urban areas, like Paris or Pomona [6]showing subsidence effects. Two animations relative to the estimated displacement field inPomona since June 1992 are available on our web site:
http://www-dsp.elet.polimi.it/andrea/www/sar/pomona.htm.
One of the main difficulties encountered in Differential SAR interferometry applications is dueto temporal and geometric decorrelation. We have been able to identify single pixels (thePS’s) coherent over long time intervals and for wide look-angle variations. This allows one touse all ERS acquisitions relative to an area of interest. In fact when the dimension of the PSis smaller than the resolution cell, the coherence is good (the speckle is the same) even forimage pairs taken with baselines larger than the decorrelation one. Then, on those pixels,sub-meter DEM accuracy and millimetric terrain motion detection can be achieved, even ifthe coherence is low in the surrounding areas. Reliable elevation and deformationmeasurements can then be obtained on this subset of image pixels that can be used as a''natural'' GPS network.
RESULTS
An interesting case of subsidence, already studied using differential interferometry and othertechniques, is found in Paris. 61 ERS images were available. All were resampled on thesame master and 60 interferograms were obtained. After the initial selection of the PS set(about 3 PS/km2 were identified), phase increments between each PS and all the others lessthan 1 km apart were estimated. The range of normal baselines is about +/- 1100 m, whilethe maximum temporal baseline is more than 6 years. If a PS had a LOS velocity of, say, 2cm/yr and a residual elevation difference of 5 m with respect to a neighbouring scatterer,considered as a reference, its phase variations as a function of time and baseline would be a2D sinusoid. If now we accept, temporarily, the hypothesis of constant LOS velocity of eachpixel, then using a periodogram we can estimate both the residual elevation and the LOSvelocity difference of the pixels. This operation was carried out for all PS pairs less than 1kmapart, thus removing the effects of the residual elevation with respect to the average DEMand of the LOS velocity and estimating the unwrapped phase values. After estimation of bothelevation and mean velocity of the targets, time series analysis of the phase residues incorrespondence of each PS was carried out. The target is to identify possible non-linearmotion contributions. For each PS we carried out a temporal smoothing using a triangularfilter (300 days long) and we removed the low pass component. Phase residuals were thenspatially filtered using a moving average on a 2x2 km window. APS's were then interpolatedon the original regular grid and removed from each datum. It should be noted that each APSis actually the difference of the atmospheric component of the slave image and the APS ofthe master acquisition. Averaging the 60 APS's it was possible to get an estimation of themaster contribution and then of each single contribution. After APS removal it is possible toestimate not only the mean velocity field of the area but a displacement field as a function oftime, possibly interpolating the displacement maps on a regular temporal grid. In figure 8 wereport an example of non-linear motion of one pixel in Paris located in the area of Gare St.Lazaire where works for the construction of a new metro line created subsidence and heave.
The validation and an experimental estimates of the accuracy of the results have beencarried out by cross-correlating the dilation of the metallic building of La Cite des Scienceswith the temperatures in Paris. The result is shown in figure 9. The cross-correlationcoefficient is 0.92 showing that the accuracy of our measurements is better than 1mm.
CONCLUSIONS
We have shown that in urban areas Permanent Scatterers exist that allow to generateinterferograms on a sparse grid, even if the time lapse between the takes is many years long.

Natural Hazards Workshop, 5 – 7 June 2000, Igls, AUSTRIA - LANDSLIDES
- 89 -
The density of the PS’s, small enough to have sufficient phase stability with respect to thebaseline, was seen to be sufficient in urban areas to be able to estimate the atmosphericdisturbance (the APS) with a sufficient spatial resolution. Then, the estimated APS can beremoved from the interferometric phase, improving the DEM estimates and improving theestimate of the pixel motion. The long time lapse observations made available by thistechnique allow to estimate long term pixel motion with an accuracy that was previouslyattainable using optical techniques only.
Fig. 8: Time sequence relative to a single pixel located close to the Gare St. Lazaire (bluestar) where a new metro line created subsidence and heave. The time gap is due to theunavailability of ERS1 (geodetic phase); 1 cycle ambiguity is also shown.
Fig. 9: Dilation of the metallic Science Dome in La Villette detected with the PS technique(red triangles) is compared to the correspondent maximum daily temperature in Paris (solidline). The rms residual is 1.1 mm.
REFERENCES
[1] A. Ferretti, C. Prati and F. Rocca, ’’Multibaseline InSAR DEM Reconstruction: theWavelet Approach’’, IEEE Trans. Geosci. Remote Sensing, vol. 37, no. 2, pp. 705-715,Mar. 1999.
[2] A. Ferretti, C. Prati and F. Rocca, ’’Permanent Scatterers in SAR Interferometry’’,accepted for publication in IEEE Trans. Geosci. Remote Sensing , June 1999.
[3] A. Ferretti, C. Prati and F. Rocca, ’’Non-linear Subsidence Rate Estimation UsingPermanent Scatterers in Differential SAR Interferometry ’’, accepted for publication inIEEE Trans. Geosci. Remote Sensing.
[4] G. Franceschetti, R. Lanari, 1999, Synthetic Aperture Radar Processing, CRC Press,Boca Raton.
1996 1997 1998 1999
-10
-5
0
5
10
Time [year]
LOS
Dis
plac
emen
t [m
m]
PARIS Data Set - Pixel (3330,1203) - Time Series
Data Model
RMSE = 1.1 mm

Natural Hazards Workshop, 5 – 7 June 2000, Igls, AUSTRIA - LANDSLIDES
- 90 -
[5] G. Gambolati, G. Ricceri, W. Bertoni, G. Brighenti and E. Vuillermin, ’’MathematicalSimulation of the Subsidence of Ravenna,’’ Water Resour. Res., vol. 27, no. 11, pp.2899-2918, 1991.
[6] G. Peltzer, ’’Monitoring Ground Subsidence,’’ http://www.esrin.esa.it/esrin/eos/mon2.html
[7] S. Williams, Y. Bock and P. Pang, ’’Integrated satellite interferometry: Troposphericnoise, GPS estimates and implications for interferometric synthetic aperture radarproducts,’’ J. Geophys. Res., 103, B11, pp. 27.051-27.067, 1998.

Natural Hazards Workshop, 5 – 7 June 2000, Igls, AUSTRIA - LANDSLIDES
- 91 -
Geometrical and dynamical parameters of several French Alpslandslides revealed by differential SAR Interferometry
CHRISTOPHE DELACOURT, C. CARNEC*, B. FRUNEAU**, C. SQUARZONI, AND P. ALLEMAND
Laboratoire Dynamique de la Lithosphère, UCBL & ENSL,F-69622 Villeurbanne Cedex, France
Tel +33-472 44 84 13 Fax +33-472 44 85 93 E-mail : [email protected]
*BRGM – ARN, Marseille, France
**Université Marne la Vallée, France
The technique of differential SAR interferometry has been shown to lead to accurate large-scale surface displacements mapping. However, in the past, only isolated cases indicatingthe usefulness of SAR techniques in the detection of landslide movements have beenachieved. Indeed due to specificities of the studied phenomena, concerning environmentalconditions (high level of vegetation leading to decorrelation, atmospheric conditions),geometric constrains (slopes, visibility of the area), SAR parameters acquisitions (temporalsampling of images, spatial resolution, angle of incidence), or deformation rate of thelandslide, major limitations in the application of SAR interferometry occur.
All those limiting factors have been investigated on a test area of 50 km x 50 km located inthe French Massif of Mercantour strongly affected by slope motions. Despite those limitationsat least 3 landslides can be studied. 20 ERS images (acquired both in Tandem and icephase) have been used to process differential SAR interferograms.
Deformation fringes on two well-known landslides (“La Clapière” and “La Valette”), are clearlyevidenced on these differential interferograms. High precision maps of the deformation areahave been performed. Heterogeneities in the deformation field, at pixel scale, on the twolandslides have been detected and compared with field observations. We also compareaccuracy of deformation rate obtained by SAR interferometry with conventional geodeticmeasurements.
For the La “Clapière” landslide we then derived a model including both structuraldiscontinuities on the landslide and fringe pattern. The variation of the gradient ofdisplacement from the top to the bottom was introduced to further improve the fit betweenobserved and synthetic fringes in the eastern part of the landslide. It may be associated witha swelling of the topography above the ”barre d’Iglière” and is consistent with the mechanicalbehaviour of this layer, which holds back the upper part of the landslide.
Finally a third landslide (called “Poche”), not yet monitored, has been detected and mapped.

Natural Hazards Workshop, 5 – 7 June 2000, Igls, AUSTRIA - LANDSLIDES
- 92 -
MUSCL – A European project on monitoring urban subsidence,cavities and landslides by means of remote sensing
HELMUT ROTT
Institut für Meteorologie und Geophysik, Universität Innsbruck,Innrain 52, A-6020 Innsbruck, Austria.
Tel: +43 512 507 5455, Fax: +43 512 507 2924, E-mail: [email protected]
http://dude.uibk.ac.at/Projects/MUSCL/
Overview of the project MUSCL
MUSCL (Monitoring Urban Subsidence, Cavities and Landslides by remote sensing) is aShared Cost Action project within the 5th framework programme of the EC. It addresses twostrategic goals of the programme, namely the fight against major natural hazards, and theadvancement of the European capacity on Earth Observation technologies. The projectconsortium includes the following partners:
• Institute for Meteorology and Geophysics of the University of Innsbruck, Austria (projectcoordination)
• Dipartimento di Elettronica ed Informazione, Politecnico di Milano, Italy
• Dipartimento di Scienze della Terra, Universitá degli Studi di Milano, Italy
• Space Applications Institute, CEC-DG JRC, Ispra, Italy
• GEOTEST AG, Zollikofen, Switzerland.
The project, which started in March 2000, is aimed at improving the tools for the assessmentand mitigation of hazards which result from mass movements of unstable mountain slopesand excavations in urban areas. New techniques, based on Earth Observation from space,are developed and validated to improve the detection of hazard zones and to advance theunderstanding of mass wasting processes.
Figure 1 shows the basic concept of MUSCL. A main part of the project work deals with theimprovement of remote sensing methods for mapping and monitoring mass movements. Themain data sources are radar images of the European Remote Sensing satellites ERS-1 andERS-2, complemented by high resolution optical images. Spaceborne differential radarinterferometry (DINSAR) is used to measure surface displacements at the millimetre tocentimetre scale. The interferometric analysis methods, which have been developed andapplied to studies of landslides and urban subsidence in preparatory projects, are furtherimproved to enable the operational application for mapping small displacements in differentgeological and environmental settings. The developments take into account the needs ofpublic authorities and private companies which are involved in hazard management.
Research on the application of DINSAR, carried out at the Politecnico di Milano, led to thedevelopment of a technique to identify single pixels which are coherent over long timeintervals (permanent scatterers) (Ferretti et al., 1999; 2000). This technique has been appliedto monitoring subsidence in urban areas, using long time series of interferometric data, andwill be further exploited in the project MUSCL to prepare for operational use. The potential ofDINSAR to monitor slope motion in high Alpine areas has been demonstrated in a pilotstudies (Rott et al., 1999). The possibilities and limits of DINSAR for this application aresummarized in the next section of this paper. Complementary to DINSAR, opticalspaceborne and airborne remote sensing are used to study the potential of obtaining

Natural Hazards Workshop, 5 – 7 June 2000, Igls, AUSTRIA - LANDSLIDES
- 93 -
information for detection, mapping and monitoring landslides and for hazard assessment(Hervas et al., 1996). Optical techniques are particularly important in areas where DINSARcannot be applied due to temporal decorrelation of the phase of the backscattered signal.Special attention as is also paid to the integration of remote sensing and field basedmeasurements to optimise the synergistic use.
Another main of part of the project is concerned with the demonstration of applications of theEarth Observations techniques for studying and monitoring mass wasting phenomena invarious environments including coastal areas, high alpine terrain, alpine valleys, and urbanareas. These investigations will be based on extensive sets of Earth Observation data andon in situ measurements of geophysical and geological parameters which will also be used tovalidate the remote sensing methods. The test sites include deep-seated landslides in theAlps and Appennin mountains, areas of building collapse related to buried cavities, andsubsidence in urban areas due to changes of ground water level. The capabilities andconstrains of the different methods will be assessed. It is planned to come up with anintegrative information system for the detection of landslide hazard zones and for themonitoring of precursors to failure, based on remote sensing and conventional informationsources. The project activities are guided by the needs of users to ensure that the developedmethods and Earth Observation products are well suited for operational services ingeological hazard management and related application areas.
Figure 1: Flowline of MUSCL project activities
Customer Requirements
Case StudiesData
Existing MethodsImprovements of
Remote Sensing Methods
Application Demonstration
Assessmentby
Customers
OperationalStrategy
PromotionDocumentation
of Methods
Integration & ValidationRemote Sensing / In Situ

Natural Hazards Workshop, 5 – 7 June 2000, Igls, AUSTRIA - LANDSLIDES
- 94 -
On the application of SAR interferometry for monitoring slope movements
Pilot studies on the potential of SAR interferometry for detecting and monitoring slopemovements in Alpine areas have been carried out in a project of the National Programme forthe International Decade for Natural Disaster Reduction (IDNDR) of the Austrian Academy ofSciences (Rott et al., 1999; 2000). The feasibility of DINSAR for detecting and monitoringslope movements of the order of millimetres to centimetres per year could be demonstrated.For operational use it is important to know also the constraints of the method which aresummarized in the following.
An interferogram is generated by multiplication of the complex backscattering signal of twoSAR scenes which is characterized by power and phase (Rosen at al., 2000). The phaseshift between these two images is related to surface motion, as well as to other factors suchas topography and changes of atmospheric propagation properties. A precondition for thegeneration of an interferogram is the coherence of the signal phase of the two images. Themain limitations for the application of SAR interferometry on mountain slopes result from theSAR imaging geometry and from phase decorrelation. Regarding the SAR geometry, themain disturbing factors are (i) The insensitivity for motion in flight direction of the satellite:SAR interferometry is only sensitive to the motion component in direction of the radar beam.(ii) The geometric distortions due to the imaging geometry: on steep slopes facing the radarinterferometric analysis is often not possible due to foreshortening and layover, whereasbackslopes show the best applicability. (iii) The size of the observed target: if area-extendedanalysis is used, the extent of the slide should be at least of the order of several pixels, whichfor ERS SAR means about 200 m.
In order to detect very slow movements, time spans of the interferometric image pairs of atleast several months to a year are needed to obtain reasonably large phase shifts. Temporaldecorrelation of the phase causes the main limitations for the application of interferometryover long time spans. Based on the coherence analysis of about 40 ERS SAR scenes of theEastern Alps using images from several years, we found out that snow cover and densevegetation are the main reasons for decorrelation. If the surface is covered by snow, thephase decorrelates over long time intervals because of propagation differences resultingfrom changes of the depth and other properties of the snowpack. Therefore SAR data fromthe snow-free period should be used. Over dense vegetation, such as forests, cultivatedmeadows, or agricultural areas, the phase decorrelates comparatively fast. On the otherhand, surfaces which are sparsely vegetated or where scattered rocks protrude thevegetation show suitable coherence over annual intervals. Atmospheric propagation effects,which may result in phase shifts or reduce the coherence, were found to play only a minorrole, because the observed phenomena cover small areas and the displacement isdetermined relative to stationary surfaces close by.
So far the investigations on the use of DINSAR for slope motion monitoring in alpine areaswere based on area-extended interferometric analysis using no more than one or twointerferometric pairs per year. The present status of research shows clearly that spaceborneSAR interferometry is an excellent tool for detecting and monitoring mass movements abovethe tree-line and at other sparsely vegetated areas. Another option for deformationmeasurements is the analysis of the phase history of permanent scatterers using time seriesof many SAR images (Ferretti, et al., 1999). The feasibility of this approach for alpine areasis studied in the project MUSCL. Open questions are the availability of a sufficient number ofstable pixels and the possibility to obtain reasonable time sequences of images becausesnow cover may inhibit the application through a large part of the year. Interannual variability

Natural Hazards Workshop, 5 – 7 June 2000, Igls, AUSTRIA - LANDSLIDES
- 95 -
of the motion may also cause difficulties (Rott et al., 1999). However, it can be expected thatthis method will widen the applicability of DINSAR and enable the monitoring of surfacedisplacements also in inhabited alpine valleys where man made constructions should besuitable targets for the permanent scatterer technique. The new methodologicaldevelopments and the experiences from the case studies will be the basis for developing astrategy for the operational use of remote sensing in synergy with other information sourcesto improve the assessment and mitigation of landslide hazards.
References:Ferretti, A., C. Prati and F. Rocca, 1999. Permanent scatterers in SAR interferometry. Proc. of
IGARSS’99, Hamburg, Germany, IEEE Cat.Nr. 99CH36293, 1528-1530.
Ferretti, A., C. Prati and F. Rocca, 2000. Measuring subsidence with SAR interferometry: applicationof the permanent scatterer technique. In this report.
Hervás, J., Rosin, P.L., Fernández-Renau, A., Gómez, J.A. and León, C., 1996. Use of airborne multi-spectral imagery for mapping landslides in Los Vélez district, south-eastern Spain. In: Chacón, J.,Irigaray, C. and Fernández, T. (eds) Landslides, Balkema, Rotterdam, 353-361.
Rosen P.A., S. Hensley, I.R. Joughin, F.K. Li, S.N. Madsen, E. Rodriguez and R.M. Goldstein, 2000.Synthetic apertur radar interferometry. Proc. of the IEEE, 88, 333-382.
Rott H., B. Scheuchl, A. Siegel and B. Grasemann, 1999. Monitoring very slow slope movements bymeans of SAR interferometry: a case study from a mass waste above a reservoir in the Ötztal Alps,Austria. Geophysical Res. Letters, 26, 1629-1632, 1999.
Rott H., C. Mayer and A. Siegel, 2000. On the operational potential of SAR interferometry formonitoring mass movements in Alpine areas. Proc. of the 3rd European Conf. on SyntheticAperture Radar (EUSAR 2000), Munich, 23-25 May 2000, 43-46.

Natural Hazards Workshop, 5 – 7 June 2000, Igls, AUSTRIA - LANDSLIDES
- 96 -
Optical remote sensing for landslide investigations
JAVIER HERVÁS
Space Applications Institute, Joint Research Centre of the European CommissionI-21020 Ispra (VA), Italy
Tel: +39 0332 785229 Fax: +39 0332 789469 E-mail: [email protected]
Optical (visible-infrared) spaceborne and airborne remote sensing can be effectively used invarious landslide investigations including recognition and mapping, monitoring and hazardand risk assessment. To this end, a number of remotely sensed data and image processingtechniques can be employed depending on the task pursued, the type of landslides, theirsurface extent, their activity and land cover setting.
Automated textural segmentation methods based on the image texture spectrum can beapplied to discriminate landslide hummocky surfaces, scarps and vegetation and land coverpattern disruption due to slope movements, as a partial alternative to stereoscopic analysiswhen stereo images are not available. Lithological distinction using colour enhancement anddiscrimination techniques combined with edge enhancement has made possible to detectslid rock masses and hence identify old complex landslides in heavily eroded, low vegetatedterrain. In addition, generation of interactive 3D views of unstable areas from very high-spatial resolution satellite products derived, for example, from fusion of 30m-resolutionLandsat TM multispectral images and 2m-resolution KVR-1000 panchromatic images drapedover a high-resolution DEM can greatly help to delineate landslide boundaries.
Very recent experiments have shown that it is possible to derive slope motion vectors of pixelmagnitude from sequential digital aerial photographs using digital photogrammetry and crosscorrelation techniques. However, their application still appears to be restricted to specificground conditions, such as extensive rock outcrops and lack of major internal deformationwithin the landslide body. On the contrary, the application of image change detection andthresholding techniques to very-high resolution multitemporal imagery can be effectivelyused to map and monitor ground surface changes due to either new landslide occurrence orreactivation of existing landslides in a wide variety of terrain settings, at 1:10,000 andsomehow larger scales.
Land use and land use change maps, DEMs and linear geological structure maps can bederived from optical satellite imagery for input to GIS for assessing landslide hazard and riskat medium scales (1:25,000 to 1:50,000). Likewise, the above-mentioned 3D image products,as well as 3D image animations and user-defined simulated perspective views of landslidemaps overlaid to land use maps (derived from classification of multispectral satellite images)can also be employed to investigate and illustrate landslide hazard and risk to urbansettlements and infrastructure.
Advantages and constraints of spatial resolution, spectral and temporal coverage of mostpopular optical remote sensing systems used for landslide investigations are discussed, aswell as image pre-processing methods in mountainous areas. Examples of the application ofthe above-mentioned techniques on Landsat TM, SPOT XS and PAN, IRS 1C PAN,Daedalus ATM and simulated Ikonos-2 panchromatic imagery (derived from digital aerialphotographs) are illustrated for Alpine settings, Mediterranean low-vegetated areas andAtlantic volcanic islands.

Natural Hazards Workshop, 5 – 7 June 2000, Igls, AUSTRIA - LANDSLIDES
- 97 -
Natural Hazards in the Popocatépetl volcano zone (Mexico)
EDGAR LOYO, ANTONIO RAZO, AND DAVID SOL
CENTIA, Universidad de las Américas, Sta. Catarina Mártir, Cholula, Puebla, 72820 MéxicoTel. (+52) 22 29 26 53 Fax. (+52) 22 29 21 38 {is094427, lac, sol}@mail.udlap.mx
Volcanoes are a very important component in the geological description of the earth. Avolcano can modify the geographical description where it is localised when a volcanic eventarrives. An important activity is the observation of volcanic events to make predictions and toreduce a volcano impact hazard (eruption, volcanic ash) on the population. Around thePopocatépetl volcano (Mexico) there are about 200,000 persons spread in several towns.The volcano events can be identified and placed on a map with the towns and the roads tobe analysed to take a decision. Our first work has been the construction of a geographicaldatabase. The geographical data has been translated from the cartography of the volcanozone that has been produced and processed by the GIS group from the Polytechnic Institutein Mexico City. Some query samples has been modelled to find the towns and the roads witha high possibility of danger if a volcano event arrives. ArcView GIS tool has been used toprocess these queries and the query results has been read by an OpenGL application andvisualised in 3D. This first prototype will be used to build a real application. For a second stepwe will work with data from the satellite photos. The database will be modelled to use thegeographic data a to match it with descriptive data. The application will be used by the localgovernment and by a federal organism in Mexico to protect the population.

Natural Hazards Workshop, 5 – 7 June 2000, Igls, AUSTRIA - LANDSLIDES
- 98 -
Mechanical processes and parameters controlling the structure oflarge sagging or sliding rock masses
EWALD BRÜCKL AND MILTIADIS PAROTIDIS
Institute of Geodesy and Geophysics, Vienna University of Technology,Gusshausstrasse 27-29, A-1040 Wien, Austria
Tel: +43-1-58801-12820 [email protected]
The phenomenon of deep creep of large rock masses can be observed on many alpineslopes. Characteristic morphological features are a bulge at the toe of the slope(“Talzuschub”) and tensile or normal faults near the crest (“Bergzerreißung”). Both types ofdeformation belong to the same phenomenon, known as sagging (“Sackung”). Creep ratesmay vary from a few millimetres to several meters per year. Periods of high activity correlatewith periods of high precipitation and a high groundwater level. Many deeply creeping rockslopes stabilise by the process of sagging, however, there are also well known casesexhibiting a more or less unexpected transition to rapid and catastrophic sliding.
According to our conception the creeping rock mass develops by stress induced damage in afirst or initial phase. During this phase the deformation is quasi-continuous and no significantdiscontinuous deformation (sliding) may be observed on a macro scale. During later phasessliding may occur mainly on the basis of the damaged zone. Thus, by modelling the initialphase the extent of the damaged zone should correlate with the observed structures. In thispaper we report about our attempts to model the initial phase of the giant rockslide of Köfelsand the sagging rock masses of Lesachriegel and Gradenbach.
The structural information is mainly supplied by seismic measurements (refraction andreflection, P- and S-waves, diving wave tomography). Together with informations from directaccess and morphological considerations the following maps were constructed: actualtopography (DMT), sliding surface, and pre-failure topography. The observed P- and S-velocities supply the information on the elastic parameters. The porosity and density of thecompact and the creeping ("soft") rock masses are estimated by correlations. A significantdependence of the elastic moduli of "soft" rock masses on the overburden (or pressure)exists. Furthermore, estimates of the overall discontinuous and quasi-continuousdeformations and the angle of dilatancy are drived.
The process of the transition of compact to "soft" rock is controlled by a yield criterion. In afirst attempt to model this mechanical process we used a strength of material approach(Mohr-Coulomb, zero tensile strength). In a second approach we applied the principles offracture mechanics for subcritical crack growth with an explicit consideration of the porepressure, the dilatancy, and the dependence of the elastic moduli of the "soft" rock masseson the pressure. The gravitational stresses we calculated by the FE-method.
We present our results of the numerical modelling of the initial phase of Köfels, Lesachriegel,and Gradenbach. By sensitivity studies we identified the parameters controlling the process.The most important parameter to fit the calculated extent of "soft" rock to the observedstructures is the angle of internal friction. The angle of internal friction, determined by ourmethod of analysing the initial phase of a mass movement, could be significant for the furtherdevelopment of the mass movement.

Natural Hazards Workshop, 5 – 7 June 2000, Igls, AUSTRIA - LANDSLIDES
- 99 -
Geoelectrical multielectrode measurements for surveying andmonitoring of landslide areas
ROBERT SUPPER, B. JOCHUM, W. SEIBERL, AND R. ARNDT
Institute of Geophysics and Meteorology, University of Vienna,Althanstrasse 14, A-1090 Vienna, Austria
Tel +43 1 31336 8421 Fax +43 1 31336 775 Email: [email protected]
In Austria, as in other alpine regions, landslide hazards cause major financial problems andsevere destruction to property.
Geophysical ground-based surveys can be applied to obtain many parameters required forassessing landslide potential and activity. These methods and are not only effective in theearly reconnaissance stage, but may also be applied for detailed mapping purposes. Byconducting surface geophysics, such as DC multielectrode soundings, it is possible toinvestigate the water regime, to monitor active landslide zones, differentiating betweendisplaced and water saturated material on top and the solid bedrock. Landslides in softrocksresult in the derangement of soil and earth material and the development of an irregular slip-plane, and thus, rather large electrical contrasts are associated with these phenomena.
During recent years good results were obtained by using the new method of geoelectricalmultielectrode measurements. With conventional Schlumberger-soundings it was onlypossible to derive a horizontally layered subsurface model. As landslide areas are usual verycomplex in their composition no good results could be obtained with these measurements.Using new multielectrode equipments, detailed two- and three-dimensional models of thesubsurface can be generated.
In different examples the resolution and utility of geoelectrical measurements to delineatestructures in landslide areas will be shown.
The geoelectrical multielectrode method can also be used for monitoring purpose.
Within recent years we developed a new multielectrode system that allows to measure thefrequency dependency of the electrical resistivity (SIP). Moreover this system is constructedin a way that each electrode is a measurement instrument on its own. So if current is injectedat a certain point, simultaneous measurement of potential differences at all other stations arepossible. After one measurement cycle all data is transferred to a laptop computer andsaved. In a further development step the data could be forwarded to monitoring centres byusing mobile phones. Moreover it will be converted from galvanic coupling to inductivecoupling.

Natural Hazards Workshop, 5 – 7 June 2000, Igls, AUSTRIA - LANDSLIDES
- 100 -
Application of the new Automatic Laser Remote Monitoring System(ALARM) for the continuous observation of the mass movement at
the Eiblschrofen rockfall area - Tyrol, Austria
MANFRED SCHEIKL, GERHARD POSCHER, AND HELGE GRAFINGER
ILF Consulting Engineers ZT Ges.m.b.H., Framsweg 16, A-6020 InnsbruckTel +43 512 24 12 167 Email [email protected]
A new measuring system was developed to determine the deformation mechanisms at thedetachment front of the Eiblschrofen rockfall. A successful co-operation between the scannermanufacturer (Riegl – Horn, Austria), the software developer (Joanneum Research – Graz,Austria) and the project co-ordinator (I L F – Innsbruck, Austria) was realised. The acquiredand processed data have been and continue to be essential as a decision-making basis forthe emergency response team (Federal Service for Torrent and Avalanche Control –Innsbruck, Austria).
In order to solve such questions as the kinematic behaviour of the detachment front, an exactmeasuring system with high-resolution, which is observing both the entire area of thedetachment front as well as the rock areas below over a period of 24 hours, is needed. Dueto the potential danger inherent in the area, the presence of personnel at the measuringinstrument is to be minimised, and as a result an automatic system had to be developed.
The acquisition of data is based on run-time measurements of light pulses (~900 nm). Fromseveral measurements an average run-time value is calculated. The distance between thescanner and the measuring point is then determined, assuming a constant speed of light.Depending on the prevailing atmospheric conditions, a measuring accuracy of approx.2.5 cm at a resolution of 2 mm for individual measurings is to be taken into account. Theaccuracy can definitely be improved by means of frequent measurements, by the applicationof specific filters, and by the correlation against a target, the distance of which is well known.
A programmable control allows the definition of measuring surfaces, which can be scannedat a pre-set resolution. The correct positioning of the scanner is achieved over an internalabsolute reference system. A positioning accuracy of at least 0.01 gon is guaranteed.
The measurements of the Eiblschrofen detachment front were constantly analysed andchecked by comparison to other results from terrestrial and/or geotechnical measurements.
For the period between 07.09.1999 and 04.02.2000, the results basically revealed fivedifferent deformation zones separated by tectonic structures.
− The western detachment front exhibited deformations ranging from 7 cm to 11 cm(except for a few, minor local detachment areas).
− The central detachment front partially yielded negative deformation values, which inconnection with the orientation of the measuring surfaces can be explained as clearvertical movements.
− The western part of the eastern front showed deformations which correspond with thoseobserved at the western detachment front.
− The easternmost front is limited by pronounced tectonic structures and showeddeformations of up to 40 cm, with the maximum deformation occurring in October.
− The eastern and western foot of the detachment front were equipped with specialreflector boards and indicated deformations of approx. 1 - 2 cm.

Natural Hazards Workshop, 5 – 7 June 2000, Igls, AUSTRIA - LANDSLIDES
- 101 -
Laser scanner monitoring – technical concepts, possibilities andlimits
GERHARD PAAR, BERNHARD NAUSCHNEGG, AND ANDREAS ULLRICH*Institute of Digital Image Processing, JOANNEUM RESEARCH, Wastiangasse 6, A-8010 Graz.
Tel: +43 316 876-1716, Fax +43 316 876-1720, Email: [email protected]
*RIEGL Laser Measurement Systems GmbH, Riedenburgstraße 48, A-3580 Horn.Tel. (+43) 2982 4211, Fax (+43) 2982 4210, www.riegl.com, email [email protected]
Scanning laser imaging has turned out to be an essential component of geotechnical disastermonitoring. The available laser devices have reached a technological fitness for this class ofapplication just in the recent past. With a maximum range of more than 2 km to naturallyreflecting targets, a wide field-of-view, and a ranging accuracy of better than 2 cm safemonitoring of events like the Schwaz Rock Slide (Austria, Summer 1999) can beaccomplished.
We give an overview of state-of-art scanning laser imaging technology and show a conceptfor a largely automatic monitoring software environment: After sensor orientation a digitalimage of the surface to be monitored is registered to the geometry of the laser scanner. It isused for the selection of Regions of Interest (ROIs) which is done by the expert geologist. Ameasurement schedule is defined in addition which is executed around the clock by a PCcontrolling the scanning device. The measurements are fed into a data base. A typicalmeasurement rate is every hour for ROIs and twice a day for the entire monitoring area, bothwith a lateral resolution of better than 0.5 mrad. Using well adopted image processingmechanisms the measurements are enhanced in order to detect and remove falsemeasurements (e.g. caused by rain and fog), mask out vegetated regions as well ascompensate for atmospheric effects and subtle instabilities of the scanner platform. The latteris accomplished by additional scanning of reference targets mounted on stable ground off themonitoring area, which is done before and after each ROI measurement.
After these preparations, an evaluation of the statistical parameters of the ROImeasurements allows a direct analysis of the temporal behaviour of each ROI. Using thescanning results of the whole monitoring area it is further possible to visualise arealdeformations within arbitrary periods of time, making use of isoline plots. Volume loss causedby individual rock fall events can be evaluated accurately as well as material aggregations onheap areas.
All the results are immediately available, which makes the laser scanner monitoring avaluable tool for hazard prediction and risk evaluation. Such a system can be installed withinless than two days at any location having access to currency supply and mobile telephoneconnection.
We report on the operational state of the Schwaz Rock Slide monitoring system which wasestablished in a successful co-operation between the Scanner manufacturer (Riegl LaserMeasurement Systems GmbH – Horn, Austria), software development (Joanneum Research– Graz, Austria) and the main contractor (I LF – Innsbruck, Austria) who performed theintegration into the geodetic framework as well as the operation.
Practical experience will be emphasised. Future potential developments of the laser scannerhardware are sketched and the limits of the concepts are discussed, again on the basis ofthe Schwaz incidence.

Natural Hazards Workshop, 5 – 7 June 2000, Igls, AUSTRIA - LANDSLIDES
- 102 -
Monitoring of landslides in mountain areas by radar interferometry
DARIO TARCHI, DAVIDE LEVA, AND ALOIS SIEBER
Space Applications Institute –JRC-EC, TDP-SAI JRC, v. E. Fermi, I-21020 Ispra VA, TP 720, ItalyTel +39 0332 785143, Fax +39 0332 785772, Email [email protected]
SAR interferometry (InSAR) using spaceborne and airborne data has been a very interestingtechnique in the domain of remote sensing since few years. A typical application is themonitoring of ground displacement fields using SAR Differential Interferometric techniques(D-InSAR). D-InSAR from space has been proven to be a unique tool for monitoring grounddisplacements on wide areas but the features of the current missions, mainly in terms ofspatial resolution, incidence angle and revisit time, limit the application of the techniques tosmaller scale additional problem, often preventing the application of the technique. In thesecases D-InSAR from space can be complemented by the use of a ground based SARsystem. To this aim the mobile SAR system (LISA) of the Space Applications Institute of JRCis currently used in the monitoring of a landslide menacing the town of Schwaz, Austria, inthe frame of a collaborative Project between JRC and the Government of Tyrol. The arearecently experienced a series of critical events producing a fast movement of the wholeslope. A first series of measurements have been performed in October 1999 for a total periodof time of about one week. An operating frequency of 17 GHz is used providing a sensitivityto terrain displacement of about 1 mm, with a spatial resolution of 4 x 4 m. The monitoredarea has an extension of about 1 x 1 km and an average distance from the sensor of about1.5 km. The measurements allowed to detect a ground displacement field in a smaller areaof about 200 by 200 m and to follow the evolution of the phenomenon with tine. The obtainedresults are very positive and validate the approach in those cases where a continuosmonitoring over short period of times is necessary. In order to assess the performances ofthe technique over longer time intervals additional measurement campaigns are planned inthe coming months.

Natural Hazards Workshop, 5 – 7 June 2000, Igls, AUSTRIA - LANDSLIDES
- 103 -
The detection of surface movement using DInSAR: from urbansubsidence to landslides
JULIE BOYLE
National Remote Sensing Centre Limited, Delta House, Southwood Crescent, Southwood,Farnborough, Hampshire, GU14 0NL, UK
Tel: +44 1252 362070, Fax: +44 1252 375016, E-mail [email protected]
Differential SAR Interferometry (DInSAR) has been demonstrated to be useful for severaldifferent applications. In this case we demonstrate how the technique can be used to mapsmall-scale (millimetric) movement in the London region, and put forward the idea that asimilar technique could be used to detect small warning movements prior to landslides.
The London region is underlain by the London clay that exhibits seasonal shrink and swell.The results presented here show local and regional scale surface movements due tomovement in the London clay, tunnelling and possible ground water abstraction. Thismovement can lead to structural damage to buildings and infrastructure.
This technique could offer a remote sensing solution to landslide risk assessment, whichcould benefit several EU policies, and is a topic of the GMES initiative. The identification ofsmall movements in landslide risk zones could be used to spark a disaster warning systemand allow the area to be cleared, or monitored to reduce the risk to public and infrastructure.This technique would be most suited to urban or low vegetation regions orientated in adirection perpendicular to the satellite direction. A further pilot study would be recommendedto assess the suitability of this technique to mountainous regions.

Natural Hazards Workshop, 5 – 7 June 2000, Igls, AUSTRIA - LANDSLIDES
- 104 -
Slope instability modelling using GIS in the thick loess terrain ofNorth China
XINGMIN MENG, EDWARD DERBYSHIRE, DON THOMPSON AND NIGEL PAGE
Department of Geography, Royal Holloway, University of London, Egham, Surrey TW20 0EX, UKTel & Fax +44-1273-748919 Email [email protected]
INTRODUCTION
North China is characterised by high mountains and deeply incised valley systems as aresult of the influence of vigorous and continuing uplift of the Tibetan Plateau. Distinctivegeological, geomorphological and atmospheric conditions since about 2.6 Ma B.P. have ledto an accumulation of aeolian silts in the form of a thick drape, 440,000 km2 in area andfrequently over 100 m thick (but up to 520 m in places), resting on the mountainous pre-Pleistocene bedrock terrain. This is the Loess Plateau of North-central China.
The relative relief is high (200 - 700 m), with steep slopes (27° to 40°). The climate is semi-arid to sub-humid in type, with unpredictable annual precipitation totals (200 - 700 mm). Insome years, up to 70% of the annual total may be concentrated in the three months July,August and September, and up to 40% has been known to fall in a single storm (Derbyshireet al., 1991; 1995).
Deposition of loess by the process of free fall from the air results in generally low bulkdensities (high porosities). The North China loess consists mainly of silt-sized quartz, withminority feldspar and carbonate and some clay or clay-sized minerals playing a role incementation of the fabric. Such a constitution and fabric makes this loess metastable, i.e. itis a ‘collapsing soil’. When dry, as in extensive parts of this semi-arid region, its bulk strengthis sufficient to sustain almost vertical free-faces up to 20 m high. However, above criticalmoisture content, the loess loses most of its strength and various types of deformation occur,such as subsidence and landsliding (Derbyshire et al., 1997).
This combination of natural factors renders this region highly susceptible to catastrophicmass movements (Meng and Derbyshire, 1998).
Historical records include descriptions of countless disasters affecting the human population.Widespread damage to property is recorded, and more than 60,000 deaths in the twentiethcentury alone. Accelerating population growth and concomitant expansion in both industryand agriculture, especially since the 1950s, have aggravated the situation. In the pastdecade, more than one thousand large loess landslides have occurred in Gansu Province,killing over 2000 people (Feng, 1985).
Economic losses are enormous. For example, on 11 -12 August 1990, a heavy storm aroundTianshui city released 145mm of rain, with 74mm falling in the single hour 1100-1200. Sevenlandslides were triggered, one of the most serious failures occurring above a steel factory. Thefoot of the slope had been excavated during the construction of the factory, and the gentlesurface at the top of the slope had been under channel irrigation for many years. The landslideevent, with a length of 380 m, a width of 330 m and a sliding distance of 150m, lasted only afew seconds. It buried 6 of the 8 workshops in the factory. Remarkably, only seven peoplewere killed because a power failure had caused the workforce of 300 to take an early lunch!(Derbyshire, 1992). The direct loss arising from this event was 28 million Yuan (£2.6 million orUS$4 million).
In order to improve the control and management of the hazards generated by such loessinstability, the need for systematic research utilising advanced techniques to predict thespatial extent of such potential landslides is pressing. Between 1987 and 1994, a EuropeanUnion-Gansu Provincial Government funded collaborative research team that includedscientists from institutions in China, the United Kingdom, France, The Netherlands and
Natural Hazards Workshop, 5 – 7 June 2000, Igls, AUSTRIA - LANDSLIDES
- 105 -
Greece, carried out an extensive systematic investigation in the Lanzhou region. A range ofkey phenomena was investigated, including bedrock geology, distribution of Quaternarysediments, geomorphology, landslide distribution, land use, and the geotechnical propertiesof loess and bedrock. The final result of the research has recently been published in bookform. Based on the detailed products of this earlier research, this poster represents apioneering approach in the use of GIS in this region. It focuses on the southern slopes,named Gaolanshan, bounding the Lanzhou Basin. Geology, sinkhole distribution and slopegradient are analysed as fundamental factors controlling slope instability. The spatialanalysis function of the GIS software is used to generate a slope instability map.
SLOPE FAILURE FORMATIVE FACTORS AT THE GAOLANSHAN AREA AND SLOPE INSTABILITYMODELLING USING ARCVIEW GIS
Landslide formation in the loess region of North China is determined by a large number ofvariables, including geomorphology, geology, neotectonic activity, groundwater, slopestructural conditions, human activity, and others. As no single factor controls the slopefailures, multiple factors must be considered in any sort of slope instability analysis. Theselected study area presented here is of the order of 6 km2 in size and has rather distinctivegeomorphological and slope structural characteristics. The relative relief is locally as high as270 to 586 m, with the steepest slope gradients around 41°. Loess thickness varies between190 and 299 m, mainly mantling Neogene argillites. Between the loess and the bedrock, a 2to 7 m thick conglomerate layer (Wuquan conglomerate of late Pliocene age) is found,dipping to the south-west (into the slope) at 5°. The highest bedrock exposures are found atabout 290 m above the first terrace of the Yellow River. On the slopes where bedrock isexposed, the mantles of (colluvially reworked) loess are < 3 m thick. A total of 31 landslideshave been identified on these slopes, most having dimensions exceeding 250 by 500 m(Meng and Zhang, 1990). On the basis of site investigations, it is concluded that all suchrelatively large landslides occurred within the thicker loess deposits (> ca. 10 m). Thedominant factors affecting the slope instability in the Gaolanshan area are groundwater,slope gradient and geological conditions. Accordingly, three of these factors are consideredin this GIS modelling exercise.
GROUNDWATER AND SINKHOLES
Previous work has shown that groundwater conditions closely reflect the sinkhole distributionin this region. Some results of potential infiltration tests carried out on the Gaolanshan siteunder different types of land use indicated that the depth to which meteoric water penetratesinto the fabric of the loess is very limited, generally being less than 3m. Concentrated waterflows can lead to localised liquefaction and subsequent enlargement of the joints acting asthe main water-routing channels. Progressive enlargement ultimately leads to the formationof nearly vertical sinkholes leading into pipe systems that run sub-parallel to the surface ofthe slopes. This complex of sinkholes and pipes, known in China as loess karst, results invery high infiltration/permeability values many times greater than the rates measured inundisturbed samples. The depths at which these pipe systems occur generally coincide withabrupt changes in permeability, notably at the loess-bedrock contact zone. These subsurfacedrainage channels may reach diameters of more than 10 m, depths of more than 30 m, withsome individual pipes being several hundred metres long.
The pipe system in the loess slopes exerts a strong control on the location and concentrationof underground water. During rainfall events, the pipe systems efficiently transmit the waterthrough the loess, so that even parts of the basal loess layer become saturated. Liquefactionin this saturated zone may lead to catastrophic failure of the whole of the superincumbentmass. Where failure does not occur immediately, repetitive wetting during subsequentrainstorms progressively weakens the stable structure of the loess, while soluble salts withinthe loess are removed by through-flow, and the (predominantly carbonate) cementationbonds are progressively destroyed. The stability of the loess slope thus decreases
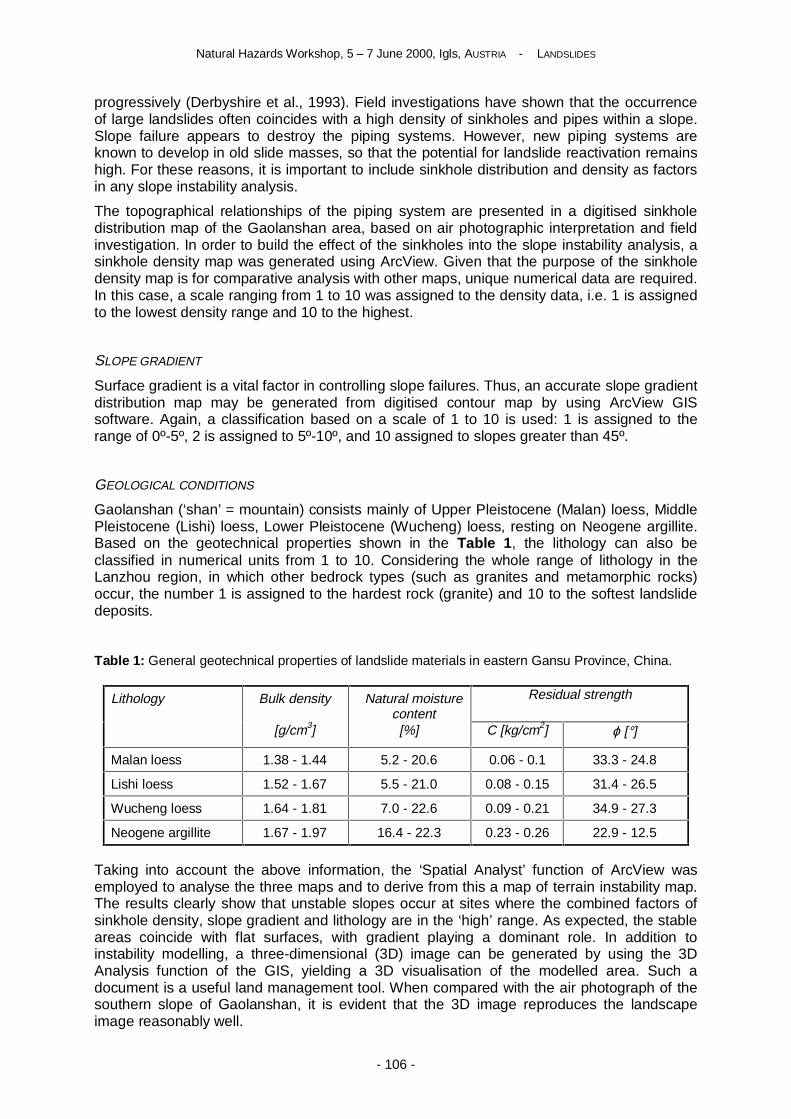
Natural Hazards Workshop, 5 – 7 June 2000, Igls, AUSTRIA - LANDSLIDES
- 106 -
progressively (Derbyshire et al., 1993). Field investigations have shown that the occurrenceof large landslides often coincides with a high density of sinkholes and pipes within a slope.Slope failure appears to destroy the piping systems. However, new piping systems areknown to develop in old slide masses, so that the potential for landslide reactivation remainshigh. For these reasons, it is important to include sinkhole distribution and density as factorsin any slope instability analysis.
The topographical relationships of the piping system are presented in a digitised sinkholedistribution map of the Gaolanshan area, based on air photographic interpretation and fieldinvestigation. In order to build the effect of the sinkholes into the slope instability analysis, asinkhole density map was generated using ArcView. Given that the purpose of the sinkholedensity map is for comparative analysis with other maps, unique numerical data are required.In this case, a scale ranging from 1 to 10 was assigned to the density data, i.e. 1 is assignedto the lowest density range and 10 to the highest.
SLOPE GRADIENT
Surface gradient is a vital factor in controlling slope failures. Thus, an accurate slope gradientdistribution map may be generated from digitised contour map by using ArcView GISsoftware. Again, a classification based on a scale of 1 to 10 is used: 1 is assigned to therange of 0º-5º, 2 is assigned to 5º-10º, and 10 assigned to slopes greater than 45º.
GEOLOGICAL CONDITIONS
Gaolanshan (‘shan’ = mountain) consists mainly of Upper Pleistocene (Malan) loess, MiddlePleistocene (Lishi) loess, Lower Pleistocene (Wucheng) loess, resting on Neogene argillite.Based on the geotechnical properties shown in the Table 1, the lithology can also beclassified in numerical units from 1 to 10. Considering the whole range of lithology in theLanzhou region, in which other bedrock types (such as granites and metamorphic rocks)occur, the number 1 is assigned to the hardest rock (granite) and 10 to the softest landslidedeposits.
Table 1: General geotechnical properties of landslide materials in eastern Gansu Province, China.
Lithology Bulk density Natural moisturecontent
Residual strength
[g/cm3] [%] C [kg/cm2] ϕ [°]
Malan loess 1.38 - 1.44 5.2 - 20.6 0.06 - 0.1 33.3 - 24.8
Lishi loess 1.52 - 1.67 5.5 - 21.0 0.08 - 0.15 31.4 - 26.5
Wucheng loess 1.64 - 1.81 7.0 - 22.6 0.09 - 0.21 34.9 - 27.3
Neogene argillite 1.67 - 1.97 16.4 - 22.3 0.23 - 0.26 22.9 - 12.5
Taking into account the above information, the ‘Spatial Analyst’ function of ArcView wasemployed to analyse the three maps and to derive from this a map of terrain instability map.The results clearly show that unstable slopes occur at sites where the combined factors ofsinkhole density, slope gradient and lithology are in the ‘high’ range. As expected, the stableareas coincide with flat surfaces, with gradient playing a dominant role. In addition toinstability modelling, a three-dimensional (3D) image can be generated by using the 3DAnalysis function of the GIS, yielding a 3D visualisation of the modelled area. Such adocument is a useful land management tool. When compared with the air photograph of thesouthern slope of Gaolanshan, it is evident that the 3D image reproduces the landscapeimage reasonably well.

Natural Hazards Workshop, 5 – 7 June 2000, Igls, AUSTRIA - LANDSLIDES
- 107 -
CONCLUSION
Comparison of the GIS results with slope failures mapped in the field and known to haveoccurred in the past few years (since 1994), demonstrates the fidelity of the modelledoutcome. Certainly, it is much more accurate than some traditional slope assessmentmethods based upon comparative criteria. We consider that this methodology has promisingpotential if applied to the whole of the landslide-susceptible region of Gansu Province andelsewhere, and that it has the potential to provide a much-improved basis for local andregional land management and planning work. When modelling a large area, the othervariable factors, such as geomorphology and climate (predominantly precipitation) mayreadily be built into the modelling.
REFERENCES
Derbyshire, E., Wang, J.T., Billard, A, Egels, Y., Jones, D.K.C., Kasser, M. Muxart, T. andOwen, L., 1991. Landslides in the Gansu loess of China. In: Okuda, S., Rapp, A., and Zhang,L. (eds) Loess: geomorphological hazards and processes. Catena, Supplement, 20: 119--145.
Derbyshire, E., 1992. Engineering in Quaternary sediments: case studies from westernEurope and eastern Asia. Quaternary Proceedings, 2: 33-48.
Derbyshire, E., Dijkstra, T.A., Billard, A., Muxart,T., Smalley, I.J. and Li, Y.J. 1993Thresholds in a sensitive landscape: the loess region of central China. In: Thomas, D.S.G.and Allison, R.J. (eds.) Landscape Sensitivity, John Wiley and Sons Limited, Chichester andNew York, 97-127.
Derbyshire, E., Van Asch, T., Billard, A. and Meng, X. M., 1995. Modelling the erosionalsusceptibility of landslide catchments in thick loess: Chinese variations on a theme by JanDe Ploey. Catena, 106: 1-18.
Derbyshire, E., Meng, X.M. and Dijkstra, T.A. 1997. Landslide in Lanzhou region, GansuProvince, China. In: Sassa, K. (ed.) International Symposium on landslide HazardAssessment, p 41-55. Kyoto University, Japan, ISBN 4-9900618-0-2.
Feng, X., 1985. Earthquake landslides in China. Proceedings of IVth InternationalConference and Field Workshop on Landslides, Tokyo, 339-346.
Meng, X.M. and Zhang, S.W., 1990. The characteristics and mechanism of Gaolanshanlandslides in Lanzhou city. Journal of Gansu Science, 2 (1), 48-53.
Meng, X.M. and Derbyshire, E. 1998. Landslides and their control in the Chinese LoessPlateau: models and case studies from Gansu Province, China. In: Maund, J.G andEddleston, M. (eds.). Geohazards in Engineering Geology. Geological Society, London,Engineering Geology Special Publications, 15, 141-153.
Natural Hazards Workshop, 5 – 7 June 2000, Igls, AUSTRIA - LANDSLIDES
- 108 -
Controlled artificial triggering of debris flows – a (new) means ofactive risk mitigation?
MICHAEL BONTE, JÖRG TRAU, AND PETER ERGENZINGER
B.E.R.G., Institut für Physische Geographie, Freie Universität Berlin,Malteser Str. 74-100, D-12249 Berlin, Germany,
Tel. +49 30 83870258, Fax +49 30 767806450 E-mail [email protected]
Micro-scale experiments to artificially trigger debris flows were conducted in the Lainbachbasin, Northern Limestone Alps, Germany. Controlled infiltration of additional water into theglacial tills of the test site released a debris flow of 65 m³. The boundary conditions for thisparticular site were examined by an elaborate monitoring effort. At a mean depth of 2 metresa shear-plane consisting of glaciolimnic clays was identified by geoelectric and georadarsounding, buried inclinometers, and coring. During the experiment pore–water pressures andgravimetric moisture contents were monitored. Although the water content rose dramaticallyby about 5% - close to the liquid limit of 22% - the pore-water pressures almost remainedconstant at a relatively high level. Due to the loss in cohesion yield stress decreased from 10to below 1 kPa and slope failure occurred.
An extensive monitoring effort at the site as well as a sound knowledge of thegeomorphological, hydrological, and geological setting of the test site was essential toanticipate the extent of the released flow. By artificially triggering a controllable minor debrisflow, the overall hazard of a foreseeable major, uncontrolled event could be reduced andtherefore related risk mitigated.

Natural Hazards Workshop, 5 – 7 June 2000, Igls, AUSTRIA - LANDSLIDES
- 109 -
Rockfalls and rockslides in Madeira archipelago
DOMINGOS RODRIGUES AND FRANCISCO AYALA-CARCEDO
C.C.B.G., University of Madeira, Praca do Município, Funchal, Portugal, [email protected]
INTRODUCTION
The Madeira archipelago is located in the Atlantic North 900 Km southwest of Lisbon. Theislands, Madeira, Porto Santo, Desertas and Selvagens are of volcanic origin, dating fromthe Miocene, interpreted as being “hot spots” (Mata 1996) formed by eruptive rocks, mainlybasalts and piroclastic materials.
Madeira island is the biggest with 728Km2 and 263 000 inhabitants. The orography ischaracterised by a strong relief with altitudes that surpass 1800m and an average altitude of700m. Average rainfall values are from 600 mm in the southern coast to 2900mm in areas ofhigh altitude, reaching 500mm/day during exceptional events.
NATURAL HAZARDS
Throughout the history of Madeira, natural disasters have claimed hundreds of victims andcaused material damage for the population of the island.
The natural hazards are flash floods, landslides from the most rapid rock falls and rock slidesto the slowest landslides and creep movements, storms and tsunamis caused by coastallandslides, like Penha D’Aguia, Cabo Girão, Ponta Delgada, Arco de S.Jorge, Lombo andDoca ( in Selvagem Grande island) .
There is also some evidence of giant landslides that happen during the evolution of theMadeira shield volcano.
ROCKFALLS AND ROCKSLIDES
Rockfalls and rockslides occur all over the archipelago mainly during the rainy season. Thebiggest events occur at the sea cliffs and in the river valleys.
In February 1991 a rockfall occurred at the 500m high cliff of Penha D’Àguia on the northcoast of Madeira island forming a platform of about 300m wide and 300m long with anapproximate volume of 1 800 000 cubic meters. A second rockfall took place in march1994 inthe same place.
These coastal rockfalls originate tsunamis that reach 5-8 meters high. In 1930 a rockfall atCabo Girão (500 m high cliff on south coast of Madeira island) generated a tsunami thatkilled 19 people in the nearby village of Câmara de Lobos.
A rockslide that happened on a coastal cliff of Selvagem Grande Island (in 1884) generateda wave that reached the south coast of Madeira causing floods.
A rockslide on the eastern slope of the Madelana river (1932) caused a natural dam formingtwo lakes. The subsequent collapse of the dam caused a flash flood that almost washedaway the village of Madalena do Mar.

Natural Hazards Workshop, 5 – 7 June 2000, Igls, Austria - List of Participants
- 110 -
List of ParticipantsAgerer Hubert DISektion Tirol Forsttechnischer Dienst für Wildbach- undLawinenverbauungLiebeneggstrasse 11A-6020 Innsbruck AustriaTel: ++43 (0)512 5961235, Fax: ++43 (0)512581216
Alkema Dinand Dr.Dip. di scienze dell' ambiente e del territorio Università diMilano - BicoccaPiazza della Scienza 1I-20122 Milano ItalyTel: ++39 02 64474405, Fax: ++39 02 64474400Email: [email protected]
Ammann Walter Dr.Eidg. Institut für Schnee- und Lawinenforschung SLFFlüelstrasse 11CH-7260 Davos Dorf SwitzerlandTel: ++41 (0)81 417 0231, Fax: ++41 (0)81 417 0823Email: [email protected]
Angerer Hans Dr.Geologische Stelle Forsttechnischer Dienst für Wildbach-und LawinenverbauungLiebeneggstrasse 11A-5020 Innsbruck AustriaTel: ++43 (0)512 5961235, Fax: ++43 (0)512581216Email: [email protected]
Appel FlorianInstitut für Geographie University of MunichHauptstrasse 60D-82234 Weßling GermanyTel: ++49 (0)8153 95012, Fax: ++49 (0)8153 95012Email: [email protected]
Aschbacher Josef DrSAI - Space Applications Institute Joint Research Centre,ECTP263I-20120 Ispra VA ItalyTel: ++39 0332 785968, Fax: ++39 0332 789536Email: [email protected]
Bauer Berthold Ao.Univ.PrDepartment of Geography University of ViennaUniversitaetstrasse 7A-1010 Vienna AustriaTel: ++43 (0)1 4277 48651, Fax: ++43 (0)1 4277 9486Email: [email protected]
Boyle JulieGeo-Information Market Development National RemoteSensing Centre LimitedDelta House, Southwood Crescent, SouthwoodGU14 0NL Farnborough Hampshire United KingdomTel: ++44 (0)1252 362070, Fax: ++44 (0)12552 375016Email: [email protected]
Breiling Meinhard Dr.DIBest Environment NetworksHartwig Balzen Gasse 3-2-2,A-1210 Vienna AustriaTel: ++43 (0)1 2907853, Fax: ++43 (0)1 2907853Email: [email protected]
Brueckl Ewald Prof.Institute of Geodesy and Geophysics Vienna University ofTechnologyGusshausstrasse 27-29A-1040 Vienna AustriaTel: ++43 (0)1-58801-12820Email: [email protected]
Buchauer Markus Mag.Ufficio Idografico Provincia di Bolzano Alto AdigeMendelstr. 33I-39100 Bolzano ItalyTel: ++39 0471414745Email: [email protected]
Burlando Paolo Prof.Inst. of Hydromechanics and Water ResourcesManagement ETH ZurichHIL G33.1 ETH HoenggerbergCH-8093 Zurich SwitzerlandTel: ++41 (0)1 6333812, Fax: ++41 (0)1 6331061Email: [email protected]
Burtscher RobertDepartment of Geography University of InnsbruckFranz Fischer Str. 31/10A-6020 Innsbruck AustriaTel: ++43 (0)512 584906, Fax: ++43 (0)512 584906Email: [email protected]
Casals-Carrasco PilarJRC/SAI/SSSA Joint Research Centre, ECJRC/SAI/SSSA unit, tp 261I-21020 Ispra VA ItalyTel: ++39 0332786286, Fax: ++39 03327 85461Email: [email protected]
Chesi Günter Prof. DI Dr.Institut für Geodäsie University of InnsbruckTechnikerstr. 13A-6020 Innsbruck AustriaTel: ++43 (0)512 507 6750, Fax: ++43 (0)512 507 2910Email: [email protected]
De Roo Ad Dr.SAI - Space Applications Institute Joint Research Centre,ECTP263I-20120 Ispra VA ItalyTel: ++39 0332 786240, Fax: ++39 0332 785500Email: [email protected]

Natural Hazards Workshop, 5 – 7 June 2000, Igls, Austria - List of Participants
- 111 -
Delacourt Christophe DrUMR-5570-Lab Dynamique de la lithosphère UCBL & ENSLyonBat 402 Boulevard du 11 NovembreF-69622 Villeurbanne FranceTel: ++33 (0)472 4484 13 / 90, Fax: ++33 (0)472 448593Email: [email protected]
Derbyshire Edward Prof.Department of Geography Royal Holloway (University ofLondon)Egham HillTW20 0EX EGHAM Surrey United KingdomTel: ++44 (0)1273 748919, Fax: ++44 (0)1273 748919Email: [email protected]
Drabek Ulrike DIInstitute of Hydraulics, Hydrology and Water RessourcesManagement Vienna University of TechnologyKarlsplatz 13/223A-1040 Vienna AustriaTel: ++43 (0)1 58801 22314, Fax: ++43 (0)1 58801 22399Email: [email protected]
Eberhardt Erik Dr.Engineering Geology ETH ZurichETH HoenggerbergI-8093 Zurich SwitzerlandTel: ++41 (0)1 633 2594, Fax: ++41(0)1 6331108Email: [email protected]
Erker Erhard Dr.Abt. V1 - Grundlagen Bundesamt f. Eich- undVermessungswesenSchiffamtsgasse 1-3A-1025 Vienna AustriaTel: ++43 (0)1 21176 3201, Fax: ++43 (0)1 21176 2224Email: [email protected]
Fechner Thomas Dipl-GeophDresdner Grundwasserforschungszentrum e.V.Meraner Str. 10D-1217 Dresden GermanyTel: ++49 (0)351 4050673, Fax: ++49 (0)351 4050679Email: [email protected]
Feurich Robert Dipl.Ing.Institut für Wasserbau University of InnsbruckTechnikerstraße 13A-6020 Innsbruck AustriaTel: ++43 (0)512 507 6947, Fax: ++43 (0)512 507 2912Email: [email protected]
Filaferro EnricoUfficio valanghe Regione Friuli - Venezia GiuliaVia Cotonificio, 125I-33100 Udine ItalyTel: ++39 043255 5870, Fax: ++39 043248 5782Email: [email protected]
Fischer Andrea Mag.Institute for Meteorology and Geophysics University ofInnsbruckInnrain 52A-6020 Innsbruck AustriaTel: ++43 (0)512 507 5499, Fax: ++43 (0)512 507 2924Email: [email protected]
Floricioiu Dana Dr.Institute for Meteorology and Geophysics University ofInnsbruckInnrain 52A-6020 Innsbruck AustriaTel: ++43 (0)512 507 5482Email: [email protected]
Fradelizio Gian LuigiDipto. Scienze della Terra - Sez. Geofisica Università degliStudi di MilanoVia Cicognara 7I-20129 Milano ItalyTel: ++39 02 236 98 401Email: [email protected]
Friedrich Reinhold DI Dr.Institute for Water Resources University of InnsbruckTechnikerstraße 13A-6020 Innsbruck AustriaTel: ++43 (0)512 507 6944, Fax: ++43 (0)512 507 2912Email: [email protected]
Fromm Reinhard Mag.Department of Avalanche Research Federal ForestResearch CentreHofburg - Rennweg 1A-6020 Innsbruck AustriaTel: ++43 (0)512 573933 5104, Fax: ++43 (0)512 5739335250Email: [email protected]
Fuchs MartinInstitute for Hydrology, Water Management and HydraulicEngineering University of Agricultural Sciences, ViennaMuthgasse 18A-1190 Vienna AustriaTel: ++43 (0)1 36006 5520, Fax: ++43 (0)1 36006 5549Email: [email protected]
Gabl Karl Dr.Regionalstelle Innsbruck Zentralanstalt für Meteorologieund GeodynamikFürstenweg 180A-6020 Innsbruck AustriaTel: ++43 (0)512 285 598, Fax: ++43 (0)512 285 626Email: [email protected]
Gaddo Mauro Ing.Ufficio Neve Valanghe e Meteo Provincia Autonoma TrentoVia Galilei 24 Via Vannetti 39I-38100 Trento ItalyTel: ++39 046149 7413, Fax: ++39 046123 8305Email: [email protected]

Natural Hazards Workshop, 5 – 7 June 2000, Igls, Austria - List of Participants
- 112 -
Ganz Tanja Flor Dipl.Ing.Institut für Wasserbau University of InnsbruckTechnikerstraße 13A-6020 Innsbruck AustriaTel: ++43 (0)512 507 6949, Fax: ++43 (0)512 507 2912Email: [email protected]
Gattermayr Wolfgang DrHydrology Amt der Tiroler LandesregierungHerrengasse 1-3A-6020 Innsbruck AustriaTel: ++43 (0)512 508 4251, Fax: ++43 (0)512 508 4205Email: [email protected]
Geisler Andreas Mag.Abt. Umweltwissenschaften/Department of EnvironmentalResearch Federal Ministry of Education, Science, andCultureRosengasse 4A-1014 Vienna AustriaTel: ++43 (0)1 53120 7153, Fax: ++43 (0)1 53120 6205Email: [email protected]
Geist ThomasInstitute of Geography University of InnsbruckInnrain 52A-6020 Innsbruck AustriaTel: ++43 (0)512 507 -5428Email: [email protected]
Graf Kaspar Dr.GEOTEST AGBirkenstrasse 15CH-3052 Zollikofen SwitzerlandTel: ++31 (0)911 0182, Fax: ++31 (0)911 5182Email: [email protected]
Grießer EstherInstitute for Meteorology and Geophysics University ofInnsbruckInnrain 52A-6020 Innsbruck AustriaTel: ++43 (0)512 507 5499, Fax: ++43 (0)512 507 2924Email: [email protected]
Heliasz ZygmuntMineral and Energy Economy Research Institute PolishAcademy of SciencesWybickiego 7PL-30950 Cracow PolandTel: ++48 (0)12 6322435Email: [email protected]
Heller Armin Dr.Department of Geography University of InnsbruckInnrain 52A-6020 Innsbruck AustriaTel: ++43 (0)512 507 5411, Fax: ++43 (0)512 507 2895Email: [email protected]
Hertl Andreas Mag.Institute of Geography University of InnsbruckInnrain 52A-6020 Innsbruck AustriaTel: ++43 (0)512 507 5418, Fax: ++43 (0)512 507 2895Email: [email protected]
Hervas Javier Dr.Space Applications Institute Joint Research Centre, ECEuropean CommissionI-21020 Ispra VA ItalyTel: ++39 0332 785229, Fax: ++39 0332 789469Email: [email protected]
Hoffmann Christian DrGeoVille GmbHMuseumstr. 11A-6020 Innsbruck AustriaTel: ++43 (0)512 562022 11, Fax: ++43 (0)512 5620 2122Email: [email protected]
Hofmann DieterDepartment of Geography University of InnsbruckBrunnholzstr. 63A-6068 Mils AustriaTel: ++43 (0)676 6137319Email: [email protected]
Höller Peter Dr.Institut für Lawinen-und Wildbachforschung Federal ForestResearch CentreHofburg - Rennweg 1A-6020 Innsbruck AustriaTel: ++43 (0)512 573933 5106, Fax: ++43 (0)512 5739335250Email: [email protected]
Jäger Susanne Dr.Projektdirektion Raumfahrt German Aerospace Center(DLR)Königswinterer Str. 522-524D-53227 Bonn GermanyTel: ++49 (0)228 447 220, Fax: ++49 (0)228 447 747Email: [email protected]
Jenewein StephanDepartment of Geography University of InnsbruckKirchwald 306A-6100 Seefeld AustriaTel: ++43 (0)521 22561Email: [email protected]
Kamelger Achim Mag.Institute for Meteorology and Geophysics University ofInnsbruckInnrain 52A-6020 Innsbruck AustriaTel: ++43 (0)512 507 5499Email: [email protected]

Natural Hazards Workshop, 5 – 7 June 2000, Igls, Austria - List of Participants
- 113 -
Kaser Georg Prof.Department of Geography University of InnsbruckInnrain 52A-6020 Innsbruck AustriaTel: ++43 (0)512 507 5407, Fax: ++43 512 507 2895Email: [email protected]
Keiler MargrethDepartment of Geography University of InnsbruckInnrain 52A-6020 Innsbruck AustriaTel: ++43 (0)512 507 5417Email: [email protected]
Kohl Bernhard Mag.Institute of Avalanche and Torrent Research AustrianFederal Forest Research CenterHofburg – Rennweg 1A-6020 Innsbruck AustriaTel: ++43 (0)512 573933 5132, Fax: ++43 (0)512 5739335250Email: [email protected]
Kubu Gerhard DIWater Resources Management VerbundplanParkring 12A-1010 Vienna AustriaTel: ++43 (0)1 53605 54832, Fax: ++43 (0)1 53605 154832Email: [email protected]
Kuhn Michael Prof.Institute for Meteorology and Geophysics University ofInnsbruckInnrain 52A-6020 Innsbruck AustriaTel: ++43 (0)512 507 5450, Fax: ++43 512 507 2924Email: [email protected]
Lackinger Bernhard Prof. Dr.Institut für Geotechnik und Tunnelbau University ofInnsbruckTechnikerstrasse 13A-6020 Innsbruck AustriaTel: ++43 (0)512 507 6675, Fax: ++43 (0)512 507 2996Email: [email protected]
Ladstädter Richard Dipl.-Ing.Institute of Applied Geodesy Graz University of TechnologySteyrergasse 30A-8010 Graz AustriaTel: ++43 (0)316 873-6336, Fax: ++43 (0)316 873 6337Email: [email protected]
Lambrecht Astrid Dr.Institute for Meteorology and Geophysics University ofInnsbruckInnrain 52A-6020 Innsbruck AustriaTel: ++43 (0)512 507 5499Email: [email protected]
Lampart GudrunRemote Sensing Vista GmbHLuisenstr. 45D-80333 München GermanyTel: ++49 (0)89 5238 9803, Fax: ++49 (0)89 5238 9804Email: [email protected]
Landl BarbaraInstitute for Meteorology and Geophysics University ofInnsbruckInnrain 52A-6020 Innsbruck AustriaTel: ++43 (0)512 2282135Email: [email protected]
Lang Michel Dr.Hydrology Hydraulic Department Cemagref3 bis quai Chauveau, Cedex 09F-69336 Lyon FranceTel: ++33 (0)472 208798, Fax: ++33 (0)4 7847 7875Email: [email protected]
Leva Davide Ing.Space Applications Institute Joint Research Centre, ECVia E. FermiI-21020 Ispra VA ItalyTel: ++39 0332 789314 or ++39 0347 2338522, Fax: ++390332 785776Email: [email protected]
Lippsky LianeNaturwissenschaften (VIII/A/5) Federal Ministry ofEducation, Science, and CultureRosengasse 4A-1014 Vienna AustriaTel: ++43 (0) 1 53120 6395, Fax: ++43 (0)1 531 20 816395Email: [email protected]
Lizzero LucidoUfficio valangheVia cotonificio, 127I-33100 Udine ItalyTel: ++39 0432 555871, Fax: ++39 0432 485782Email: [email protected]
Mair Rudolf Mag.Avalanche Warning Service of the Tyrol Amt der TirolerLandesregierungEd. Wallnöferplatz 1A-6020 Innsbruck AustriaTel: ++43 (0)512 508 2250Email: [email protected]
Markart Gerhard Dr.Institute of Avalanche and Torrent Research AustrianFederal Forest Research CenterHofburg - Rennweg 1A-6020 Innsbruck AustriaTel: ++43 (0)512 573933 5130, Fax: ++43 (0)512 5739335250Email: [email protected]

Natural Hazards Workshop, 5 – 7 June 2000, Igls, Austria - List of Participants
- 114 -
Mätzler Christian Prof.Institute of Applied Physics University of BernSidlerstrasse 5CH-3012 Bern SwitzerlandTel: ++41 (0)31 631 4589, Fax: ++41 (0)31 631 3765Email: [email protected]
Mayer Christoph Dr.Institute for Meteorology and Geophysics University ofInnsbruckInnrain 52A-6020 Innsbruck AustriaTel: ++43 (0)512 507 5495Email: [email protected]
Mayr Georg Dr.Institute for Meteorology and Geophysics University ofInnsbruckInnrain 52A-6020 Innsbruck AustriaTel: ++43 (0)512 507 5459Email: [email protected]
Mazzola MauroUfficio Neve Valanghe e Meteo Provincia Autonoma TrentoVia Galilei 24 Via Vannetti 39I-38100 Trento ItalyTel: ++39 046149 7413, Fax: ++39 046123 8305Email: [email protected]
Meisina Claudia Dr.Department of Earth Science University of PaviaVia Ferrata 1I-27100 Pavia PV ItalyTel: ++39 0382 505831, Fax: ++39 0382 505890Email: [email protected]
Meissl Gertraud Dr.Department of Geography University of InnsbruckInnrain 52A-6020 Innsbruck AustriaTel: ++43 (0)512 507 5428, Fax: ++43 (0)512 507 2895Email: [email protected]
Mondre Erwin Dr.Austrian Space AgencyGarnisongasse 7A-1090 Vienna AustriaTel: ++43 (0)1 403 8177, Fax: ++43 (0)1 405 8228Email: [email protected]
Moran AndrewDepartment of Geography University of InnsbruckKranewitterstr. 20A-6020 Innsbruck AustriaTel: ++43 (0)512 365433Email: [email protected]
Nachtnebel Hans-Peter Univ.Prof.Dept. for Water Management, Hydrology and HydraulicEng. University for Agricultural SciencesMuthg. 18A-1190 Vienna AustriaTel: ++43 (0)1 36006 5500, Fax: ++43 (0)1 36006 5549Email: [email protected]
Nagler Thomas Dr.Institute for Meteorology and Geophysics University ofInnsbruckInnrain 52A-6020 Innsbruck AustriaTel: ++43 (0)512 507 5495, Fax: ++43 (0)512 507 2924Email: [email protected]
Nairz Patrick DIAvalanche Warning Centre Tirol Land TirolBoznerplatz 6A-6020 Innsbruck AustriaTel: ++43 (0)512 508 2251Email: [email protected]
Ng Felix Dr.Mathematical Institute24-29 St. GilesOXI 3LB Oxford UKTel: ++44 (0)1865 270518Email: [email protected]
Niedertscheider Klaus MagHydrology Amt der Tiroler LandesregierungHerrengasse 1-3A-6020 Innsbruck AustriaTel: +43 (0)512 508 4251, Fax: ++43 (0)512 508 4205Email: [email protected]
Noggler Bernd Mag.tiris dvt-Daten-Verarbeitung-TirolAngerzellgasse 1A-6020 Innsbruck AustriaTel: ++43 (0)512 508-3372, Fax: ++43 (0)512 508 3355Email: [email protected]
Oberparleiter CarmenInstitute for Meteorology and Geophysics University ofInnsbruckAufhofnerstr. 9I-39031 Bruneck Bozen ItalyTel: ++39 0474 551195, Fax: ++39 0474 551195Email: [email protected]
Oitzl StefanInstitute for Meteorology and Geophysics University ofInnsbruckInnrain 52A-6020 Innsbruck AustriaEmail: [email protected]
Öttl Herwig DIGerman Aerospace Center (DLR)DLR-Oberpfaffenhofen Postfach 1116D-82234 Wessling GermanyTel: ++49 (0)8153 282365, Fax: ++49 (0)8153 28 1465Email: [email protected]
Paar Gerhard DIDigital Image Processing Joanneum ResearchWastiangasse 6A-8010 Graz AustriaTel: ++43 (0)316 876 1716, Fax: ++43 (0)316 876 1720Email: [email protected]

Natural Hazards Workshop, 5 – 7 June 2000, Igls, Austria - List of Participants
- 115 -
Pasuto Alessandro Dr.I.R.P.I. National Research CouncilC.so Stati Uniti, 4I-35127 Padova ItalyTel: ++39 049 8295803, Fax: ++39 049 8295827Email: [email protected]
Perski Zbigniew PhDDepartment of Geological Mapping University of SilesiaBedzinska 60PL-41200 Sosnowiec PolandTel: ++48 (0)32 2918381 420Email: [email protected]
Petrakis Michael Dr.Institute for Environmental Reserach and SustainableDevelopment National Observatory of AthensThission, PoBox 20048GR-11810 Athens GreeceTel: ++30 (0)1 3490114 or 3490111, Fax: ++30 (0)13490113Email: [email protected]
Petrini-Monteferri Frederic Dipl-Geogr.GeoVille GmbHMuseumstrasse 11A-6020 Innsbruck AustriaTel: ++43 (0)512 562021 0, Fax: ++43 (0)512 562021 22Email: [email protected]
Pfeffer Karin Mag.Geographical Sciences/Physical Geography UtrechtUniversityHeidelberglaan 8NL-3508 TC Utrecht The NetherlandsTel: ++31 (0)30 2533915, Fax: ++31 (0)30 2531145Email: [email protected]
Pichler Helmut Prof.Dr.Institute for Meteorology and Geophysics University ofInnsbruckInnrain 52A-6020 Innsbruck AustriaTel: ++43 (0)512 507 5452, Fax: ++43 (0)512 507 2924Email: [email protected]
Pietranera LucaEarth Observation Telespazio S.p.A.Via Tiburtina 965I-00156 Roma ItalyTel: ++39 06 40796213Email: [email protected]
Rabus Bernhard DrDeutsches Fernerkundungsdatenzentrum GermanAerospace Center (DLR)OberpfaffenhoffenD-82234 Wessling GermanyTel: ++49 (0)8153 28 2895Email: [email protected]
Rack Wolfgang Mag.Institute for Meteorology and Geophysics University ofInnsbruckInnrain 52A-6020 Innsbruck AustriaTel: ++43 (0)512 507 5482Email: [email protected]
Reiter Franz Mag.Institut für Geologie und Paläontologie University ofInnsbruckInnrain 52A-6020 Innsbruck AustriaTel: ++43 (0)512 507 5596Email: [email protected]
Reiter Wolfgang MR. Dr.Naturwissenschaften (VIII/A/5) Federal Ministry ofEducation, Science, and CultureRosengasse 4A-1014 Vienna AustriaTel: ++43 (0) 1 53120 6350, Fax: ++43 (0)1 531 20 816395Email: [email protected]
Riccabona Florian DI.Abt. Forstplanung Landesforstdirektion TirolBürgerstrasse 36A-6020 Innsbruck AustriaTel: ++43 (0)512 508 4552, Fax: ++43 (0)512 508 4545Email: [email protected]
Riedl ClaudiaInstitute for Meteorology and Geophysics University ofInnsbruckInnrain 52A-6020 Innsbruck AustriaTel: ++43 (0)512 507 5499, Fax: ++43 (0)512 507 2924Email: [email protected]
Rocca Fabio Prof.Elettronica ed Informazione Politecnico di MilanoPiazza Leonardo da Vinci 32I-20133 Milano ItalyTel: ++39 02 2399 3573, Fax: ++39 02 2399 3413Email: [email protected]
Rodrigues DomingosMadeira UniversityPraca do Municipio9000 Funchal PortugalTel: ++351 291 705392, Fax: ++351 291 705399Email: [email protected]
Rott Eugen Dr.Botanik University of InnsbruckSternwartestraße 36A-6020 Innsbruck AustriaTel: ++43 (0)512 507 5940, Fax: ++43 (0)512 507 2715Email: [email protected]

Natural Hazards Workshop, 5 – 7 June 2000, Igls, Austria - List of Participants
- 116 -
Rott Helmut Dr.Institute for Meteorology and Geophysics University ofInnsbruckInnrain 52A-6020 Innsbruck AustriaTel: ++43 (0)512 507 5455, Fax: ++43 (0)512 507 2924Email: [email protected]
Sailer Rudolf Mag.Austrian Institute for Avalanche and Torrent ResearchFederal Forest Research CentreHofburg - Rennweg 1A-6020 Innsbruck AustriaTel: ++43 (0)573933 5118, Fax: ++43 (0)512 573933 5250Email: [email protected]
Sanna Sebastiano Dr.Servizio delle manutenzioni Direzione regionale delleforesteVia del Cotonificio, 125I-33100 Udine ItalyTel: ++39 043255 5685, Fax: ++39 043255 5757Email: [email protected]
Schaffhauser Horst Dr.Austrian Institute for Avalanche and Torrent ResearchFederal Forest Research CentreHofburg - Rennweg 1A-6020 Innsbruck AustriaTel: ++43 (0)512 573933 5102, Fax: ++43 (0)512 5739335250Email: [email protected]
Schardt Mathias Dr.Joanneum ResearchInstitut für Digitale Bildverarbeitung Wastiangasse 6A-8010 Graz AustriaTel: ++43 (0)316 876 1754, Fax: ++43 (0)316 876 1720Email: [email protected]
Scheikl Manfred Mag.Geologie – Geoinformatik ILF - Consulting EngineersFramsweg 16A-6020 Innsbruck AustriaTel: ++43 (0)512 2412 167, Fax: ++43 (0)512 267828Email: [email protected]
Schöberl Friedrich Dr. DIInstitut für Wasserbau University of InnsbruckTechnikerstraße 13A-6020 Innsbruck AustriaTel: ++43 (0)512 507 6950, Fax: ++43 (0)512 507 2912Email: [email protected]
Silvano Sandro Dr.I.R.P.I. National Research CouncilC.so Stati Uniti, 4I-35127 Padova ItalyTel: ++39 049 8295803, Fax: ++39 049 8295827Email: [email protected]
Sol David Dr.Computer Science UDLAPSta. Catarina MartirMX-72820 Cholula Puebla MexicoTel: ++52 2229 2653, Fax: ++52 22 29 2138Email: [email protected]
Spedding Nick Dr.Department of Geography University of AberdeenElpinstone RoadAB24 3UF Aberdeen UKTel: ++44 (0)1224 272328, Fax: ++44 (0)1224 272331Email: [email protected]
Steinacker Reinhold Prof.Institute for Meteorology and Geophysics University ofViennaHohe Warte 38A-1190 Vienna AustriaTel: ++43 (0)1 368 11371, Fax: ++43 (0)1 369 81271Email: [email protected]
Stötter Johann Prof.Department of Geography University of InnsbruckInnrain 52A-6020 Innsbruck AustriaTel: ++43 (0)512 507 5403Email: [email protected]
Strasser RudolfDepartment of Geography University of InnsbruckHöttinger Au 76A-6020 Innsbruck AustriaTel: ++43 (0)676 4735880Email: [email protected]
Stuefer Martin Dr.Institute for Meteorology and Geophysics University ofInnsbruckInnrain 52A-6020 Innsbruck AustriaTel: ++43 (0)512 507 5454, Fax: ++43 (0)512 507 2924Email: [email protected]
Supper Robert Mag.Department of Geophysics Geological Survey of AustriaUZAII, Althanstraße.14A-1090 Vienna AustriaTel: +43 (0)1 31336 8421, Fax: ++43 (0)1 31336 775Email: [email protected]
Tarchi Dario DrTDP - Space Applications Institute Joint Research Centre,ECVia. E. FermiI-21020 Ispra VA ItalyTel: ++39 0332 785143, Fax: ++39 0332 785772Email: [email protected]

Natural Hazards Workshop, 5 – 7 June 2000, Igls, Austria - List of Participants
- 117 -
Taschner StefanIGGF Institute of Geography University of MunichLuisenstr. 37D-80333 Munich Bayern GermanyTel: ++49 (0)89 2180 6690Email: [email protected]
Tedesco Marco Dr.Remote Sensing Department CNR-IROE-Institute ofResearch on Electromagnetic WavesVia Panciatichi 64I-50127 Firenze Fi ItalyTel: ++39 055 4235 213, Fax: ++39 055 4235 290Email: [email protected]
Todini Ezio Prof.Dipartimento di Scienze della Terra e Geologico AmbientaliUniversity of BolognaVia Zamboni, 67I-40126 Bologna Bologna ItalyTel: ++39 051 2094537Email: [email protected]
Tondre FrançoiseEUR OPA Major Hazards Agreement Council of EuropeBoulevard de L’orangerieF-67075 Strasbourg Cedex FranceTel: ++33 3 88 412616, Fax: ++33 3 88 412787Email: [email protected]
Trau JoergB.E.R.G., Dept. of Physical Geography Free University ofBerlinMalteser Strasse 74-100D-12249 Berlin Berlin GermanyTel: ++49 (0)30 83870258, Fax: ++49 (0)30 76706450Email: [email protected]
Wagner AnnetteLehrstuhl für Geographie Ludwig-Maximilians-Universität,MünchenRuffinistrasse 8, 80637 MünchenD-80333 Munich Bayern GermanyTel: ++49 (0)89 164572Email: [email protected]
Weber Ute Dipl.-Geoph.GeoVille GmbHMuseumstr. 11A-6020 Innsbruck AustriaTel: ++43 (0)512 5620210, Fax: ++43 (0)512 5620 2122Email: [email protected]
Wegmuller Urs Dr.Gamma Remote SensingThunstrasse 130CH-3074 Muri Bern SwitzerlandTel: ++41 (0)31 9517005, Fax: ++41 (0)31 9517008Email: [email protected]
Willenberg HeikeEngineering Geology ETH ZurichETH HoenggerbergCH-8093 Zurich SwitzerlandTel: ++41 (0)1 633 3190, Fax: ++41 (0)1 633 1108Email: [email protected]
Wunderle Stefan Dr.Department of Geography University of BerneHallerstr. 12CH-3012 Berne SwitzerlandTel: ++41 (0)31 631 8553Email: [email protected]
Younis Jalal H. Dr.Hydrology Czech Hydrometeorological InstituteK Myslivne 1CZ-70800 Ostrava Ostrava - Poruba Czech RepublicTel: ++42 (0)69 6900247, Fax: ++42 (0)69 6910289Email: [email protected]
Zachl UlrikeInstitute for Meteorology and Geophysics University ofInnsbruckInnrain 52A-6020 Innsbruck AustriaTel: ++43 (0)512 507 5455, Fax: ++43 (0)512 507 2924Email: [email protected]
Ziegner Kurt DI.Landesforstdirektion Amt der Tiroler LandesregierungBürgerstraße 36A-6020 Innsbruck AustriaTel: ++43 (0)512 508 4560, Fax: ++43 (0)512 508 4505Email: [email protected]
Zingerle Christoph Mag.Ufficio Idrografico Priovincia di Bolzano Alto AdigeVia Mendola 33I-39100 Bolzano Bolzano ItalyTel: ++39 047141 4766Email: [email protected]
Zucca Francesco Dr.Department for Earth Sciences University of PaviaVia Ferrata 1I-27100 Pavia PV ItalyTel: ++39 0382 505838, Fax: ++39 0382 505890Email: [email protected]