workshop on the vistula and tlsza river basins 1975
TRANSCRIPT

WORKSHOP ON THE VISTULA AND TlSZA RIVER BASINS 11-13 FEBRUARY 1975 ANDRAS SZOLL~SI-NAGY, EDITOR APRIL 1876 CP-76-5


WORKSHOP ON THE
11-13 FEBRUARY 1975
ANDRAS SZ~LL~SI-NAOY, EDITOR APRIL 1976
The viewe expressed are those of the contributors and not necessarily those of the Institute.
The Institute assumes full responsibility for minor editorial changes made in grammar, syntax, or wording, and trusts that these modifications have not abused the sense of the writers' ideas.
International Institute for Applied Systems Analysis 2361 Laxenburg, Austria


PREFACE
This is the written version of presentations that were delivered in February 1975 at tllr IIASA Workshop on the Vistula and Tisza River Basins. The contributions reproduced here were prepared by IIASA scholars and by our guests, sc ie~~t i s t s from Hungarian and Polish research institutions.
In accordance with the results of the IIASA Planning Conference in June 1973, the Water Project has focused its attention on specific universal methodological problems of water re- sources development and optimal operation. Large-scale demonstrations or problems ar~(] methods of river basin management reprcsent an important part of this research program. The Tisza and Vistula case studies provide an excellent framework for discussing the practical significance of methodological developments.
A number of our IIASA colleagues have helped in getting these Proceedings into print. T o all, my sincere thanks.
Zdiislaw Kaczmarek


TABLE OF CONTENTS
Preface . . . . . . . . . . . . . . . . . . . . . . Agenda . . . . . . . . . . . . . . . . . . . . . . . List of Participants . . . . . . . . . . . . . . . . The Vistula River Project
Aleksander Laski, Janusz Kindler . . . . . . . Systems Analysis Basis of Water Management in the Tisza River Valley
Istvsn Bogsrdi, B6la Csod6, G6za ~ a n k 6 . . . . River Basin Network Modelling and Its Application to the Tisza River Basin
Pave1 Koryavov, Igor Belyaev . . . . . . . . . A Review of Conflict Resolution Models in Water Resources Management
Anthony R. Ostrom . . . . . . . . . . . . . . . An Optimal Adaptive Prediction Algorithm for Real-Time Forecasting of Hydrologic Time Series
Andras Szollosi-Nagy . . . . . . . . . . . . . Algorithms for the Stochastic Inflow-Nonlinear Objective Water Reservoir Control Problem
John Casti . . . . . . . . . . . . . . . . . .
Page
iii
vii
ix


AGENDA
February 11, 12, and 13, 1975
Wodak Conference Room S c h l o s s Laxenburg
Tuesday, February 1 1
10: 00 I n t r o d u c t i o n
10:15 Welcome t o IIASA
S e s s i o n I
IIASA Moderator
10:45 T h e w a t e r r e s o u r c e s e x p e r t s f r o m P o l a n d a c q u a i n t u s w i t h t h e problems o f t h e V i s t u l a River b a s i n , w i t h t h e mathe- m a t i c a l models used and w i t h t h e r e s u l t s a l r e a d y o b t a i n e d .
14:OO Discuss ion on t h e V i s t u l a Basin
S e s s i o n I1
IIASA Moderator
2. Kaczmarek
H. R a i f f a
Y. Rozanov
E. Wood
15:OO D e s c r i p t i o n and Problem Formulat ion f o r t h e T i s z a River V a l l e y I. O r l o c i
Models Proposed f o r t h e T i s z a River V a l l e y I. Bogardi
16:15 Discuss ion on t h e T i s z a River b a s i n

Wednesday, February 12
Session I11
Moderator J. Rindler
9:00 River Basin Network Modelling and its Application to the Tisza River Basin; P. Koryavov, discussion I. Belyaev
9:45 An Outline on the Possible Use of Conflict Resolution Techniques for Water Resources Problems; discussion A. Ostrom
Session IV
Moderator I. Bogardi
11:OO An Optimal Adaptive Prdiction Algorithm for Real-Time Forecasting of Hydrological Time Series; discussion A. Szollosi-Nagy
11:45 Algorithms for the Stochastic Inflow - Nonlinear Objective Water Reservoir Con- trol Problems: discussion J. Casti
12:30 Water Quality Models and Their Applica- tion in Complex Water Resources Manage- ment; discussion J. Schmidt
Thursday, February 13
Session V
IIASA Moderator I. Gouevsky
9:00 General discussion; formulation of short-term research programmes with the Polish and Hungarian groups (long term programmes are already established).
10:45 Continuation of discussion of short-term research programs
Session VI
IIASA Moderator Z. Kaczmarek
14:OO Continuation of the general discussion
15:OO Summary of the Workshop Z. Kaczmarek
15:30 Close
LIST OF PARTICIPANTS
I. Bogardi Water Resources Center (VIKOZ ) National Water Authority Alkotmany utca 29 Budapest V Hungary
Wieslaw Ciesielski Hydroprojekt Swietokrzyska 12 Warsaw Poland
B. Csodo Water Computing Center (VSZSZI) National Water Authority Alkotmany utca 29 Budapest V Hungary
R. Fisher Central Water Planning Unit Reading Bridge House Reading, Berks. U.K.
Janusz Kindler Warsaw Technical University Department of Environmental Engineering P1. J. Robotniczej 1 War saw Poland
Aleksander Lask Hydroporjekt Swietokrzyska 1 2 War saw Poland
I. Orloci National Water Authority (OVH) Fo utca 48-50 Budapest I Hungary
F. Scholler Lower Austrian Water Authorities

LIST OF PARTICIPANTS (from IIASA)
Belyaev
Casti
Gouevsky
Gros
Kaczmarek
Koryavov
Levien
Ostrom
Raif f a
Rozanov
Schmidt
Stehf est
Szollosi-Nagy
Wood

The Vistula River Project
Aleksander Laski and Janusz Kindler
1. INTRODUCTION
The control and utilization of water has a long history in Poland. Compared with many other European countries, nature has bestowed on Poland limited water resources and great variability of their occurrence. This has forced the population to learn early the importance of rational water management. Initially, water resources management was concerned predominantly with flood control, river navigation, and hydroelectric power production. The period following World War 11, however, saw a distinct shift toward multiple-purpose water projects designed to meet the needs of growing population, industrial development and urbanization.
Poland is a socialist country where planning is the basic instrument for management of the economy. National planning implies that central governmental bodies draw up guidelines for all aspects of the social and economic development of the country as a whole. The starting point for an overall plan is a projection of the principal macroeconomic categories such as GNP, national income, amount of foreign trade, individual and collective consumption, and output of the basic economic sectors. During planning, there is a continuous two-way exchacge of information between the lower organizational levels and the central planning agencies. This is a dynamic process leading by successive approximations to the formulation of the overall plan for social, regional and economic development. It is important that the reader recognize at the outset that the water planning and management activities discussed in this paper should be seen in the broad context of the national planning process.
The first long-term national water resources development plan was drafted by the Polish Academy of Sciences in the years 1953-1956 (time horizon of 1975). The plan was then twice revised in the early 60s by the National Water Authority, and the time horizon extended to 1985. By 1968, it became clear that the water situation, particularly in the Vistula River Basin which covers about 54% of the country's area, required special attention. Preliminary long-term projections developed by the Planning Commission and the Polish Academy of Sciences indicated that the state of water availability in the basin was not compatible with future demands. In 1968, comprehensive studies were initiated with the assistance of the United Nations Development Program and the United Nations itself, under the name of the "Vistula River Project" ("Planning Comprehensive

Development of the Vistula River System"). On the Polish side, "Hydroprojekt," a firm of consulting engineers, was charged with preparation of the project and its coordination with numerous cooperating agencies.
The goal of the project was to formulate a water resources development (investment) program capable of meeting demands projected to the years 1985 and 2000. It was assumed that the project would make use of all possible improvements in the methodology of designing and operating large-scale and complex water resource systems (application of mathematical techniques, computer simulation, and the like). Continuous revision and verification of plans is unavoidable in a rapidly expanding economy; the value of an operational tool for quick evaluation of the consequences to water management of some new development concepts and alternatives cannot be exaggerated.
2. DESCRIPTION OF THE BASIN
2 The Vistula River Basin has a total area of 194,000 km , of which 168,000 km2 lies within Poland (see Figure 1 ) . On the south is the Carpathian mountain range with its highest peak at 2663 m. The average altitude of the basin is 270 m, and most of the area (55%) lies between 100 and 200 m above the Baltic Sea level. The topography and geology of the basin account for the fact that all the more significant potential storage sites are in the Carpathian region. This region is also marked by a comparatively high precipitation of about 800 mm (mean annual value). The average annual precipitation in the basin amounts to about 600 nun, while the lowest in Central Poland is less than 500 mm. Mean values of evaporation fluctuate from 390 to 520 nun annually. The relative humidity varies from 76% in the south to 84% in the north.
The climatic conditions are characterized by frosty winters (December-March), when the temperature may drop to -300 C, and sunny summers (June-August), with temperatures ranging from 150 C to 30° C. Spring and autumn are transition periods typical for the continental climate. The atmospheric conditions, however, show great variability when the same seasons or even months of different years are compared.
In 1969, the population of the Vistula River Basin was about 19.5 million, giving a density of about 112 inhabitants per km2. The rural population then accounted for about 53%, but this percentage has diminished each year. Of the population employed in the basin, about 35% were engaged in agriculture, 25% in industry, 10% in construction, and 30% in transportation, trade, finance, education, health service, public administration and other services.

Figure 1. Vistula River Basin.
Although about 68% of t h e t o t a l n a t i o n a l i n d u s t r i a l p roduc t ion o r i g i n a t e s i n t h e V i s t u l a Basin, t h e r e i s a d i s t i n c t c o n c e n t r a t i o n of i n d u s t r y i n t h e sou the rn r eg ion of Katowice and Cracow, and i n t h e r eg ion of Warsaw and Lodz. The f i r s t one i n p a r t i c u l a r i s a huge i n d u s t r i a l conglomerat ion which grew up around t h e Upper S i l e s i a Coal Basin. The b a s i n r anks among t h e r i c h e s t i n t h e world and i t s c o a l r e s e r v e s a r e e s t ima t ed a t 70 b i l l i o n t ons . Other r e s o u r c e s of importance i n t h e b a s i n a r e su lphu r , z i n c , n a t u r a l g a s , gypsum and v a r i o u s b u i l d i n g m a t e r i a l s .
The a r e a under c u l t i v a t i o n i n 1969 was 65% of t h e t o t a l b a s i n , and t h e medium f e r t i l e s o i l s of p o s t g l a c i a l o r i g i n a r e dominant. The p r i n c i p a l c r o p s a r e g r a i n (58.9741, p o t a t o e s ( 1 9 % ) , f odde r (13 .7%) and sugar b e e t s ( 4 % ) . I r r i g a t i o n p r a c t i c e s a r e a t p r e s e n t l i m i t e d t o t h e g r a s s l ands producing hay, which is t h e p r i n c i p a l c a t t l e fodder . The f o r e s t s amount t o about 26% of t h e b a s i n a r ea . Coal-based thermal power c o n s t i t u t e s approximately 97% of Po l and ' s t o t a l g e n e r a t i o n of e l e c t r i c i t y and about 94% of i t s t o t a l i n s t a l l e d c a p a c i t y .
On t h e whole, t h e V i s t u l a River Basin (see F igu re 1 ) is a r eg ion of r a p i d l y deve lop ing economy wi th a l a r g e number and v a r i e t y of problems con f ron t i ng wa t e r management. A t p r e s e n t , t h e most impor tan t of them a r e wate r supply f o r t h e popu l a t i on ,

industry and agriculture; water pollution control, and flood control.
3. THE RIVERS AND WATER RESOURCES
The Vistula River may be divided into three main reaches. The Upper Vistula stretches from the Sola River 280 km north along the main stem to its confluence with the San River. Although the so-called Carpathian tributaries are characterized by great variability of flow, and the flood hazard is very high here (summer floods induced by rainfall), they are most important as a source of good-quality water for the highly industrialized southern part of the basin. The catchment area of the Upper Vistula amounts to about 27% of the entire basin, but the mean annual flow in the Vistula below the outlet of the San River approximates 40% of the mean annual flow discharged to the Baltic Sea. Implementation of a long-term program of reservoir construction on the Carpathian tributaries has been going on for several years. The program also includes a system of water transfer installations. On the main stem of the river, upstream from Cracow, there are three low-head barrages provided with navigation locks. They are the first elements of a future waterway intended primarily for transportatton of coal and various bulk commodities to the industrial plants (among them, coal-burning thermal power plants) located in the lower reaches of the Vistula. The problem of water pollution is severe in the Upper Vistula.
The Middle Vistula is a 270-km reach between the San and Bug Rivers. It is a virtually undeveloped river, except for some river training works and flood levees. The river channel is typical for large lowland rivers, with numerous branches, islands and shoals which practically exclude its use as a navigation waterway. The Middle Vistula, however, has already attracted a considerable number of large industrial plants and high-capacity thermal power plants. During the low-flow periods, which sometimes last for several weeks, water supply and pollution control problems are acute. In contrast to the Carpathian tributaries, most serious floods occur here in the early spring as a consequence of rapid snow-melt. The flooding phenomena are further aggravated by ice jams damning up the river. The catchment area of the Middle Vistula occupies about 21% of the entire basin.
The Lower Vistula extends 391 km from the Narew River confluence to the Bay of Gdansk. Its resources are considerably augmented by the waters of the Narew and the Bug tributaries, whose catchment area (predominantly agricultural) amounts to about 32% of the entire basin. The relatively deep valley of the Lower Vistula makes possible the construction of a cascade of multiple-purpose barrages; the first of them has already been constructed at Wloclawek. Although the barrage heads are comparatively small (less than 10 m), streamflow rates are

s u f f i c i e n t l y h i g h f o r economica l ly a t t r a c t i v e development o f t h e hydropower p o t e n t i a l o f t h e r i v e r . Among o t h e r i m p o r t a n t g o a l s a r e t h e development o f n a v i g a t i o n and s t a b i l i z a t i o n o f w a t e r l e v e l s f o r numerous m u n i c i p a l and i n d u s t r i a l i n t a k e s . The f l o o d phenomena have c h a r a c t e r i s t i c s s i m i l a r t o t h o s e o f t h e Middle V i s t u l a .
An i m p o r t a n t f a c t o r is t h a t t h e t o t a l p o t e n t i a l r e s e r v o i r s t o r a g e c a p a c i t y w i t h i n t h e V i s t u l a Bas in is less t h a n a b o u t 15% of t h e mean annua l r u ~ , o f f . O p p o r t u n i t i e s a r e l i m i t e d , ? e r e f o r e , t o w i t h i n - t b . ~ - ~ e a r s t o r a g e and f low r e g u l a t i o n . A t p r e s e f l t r t o t a l copse r -va t ion r e s e r v o i r volume i n t h e b a s i n amounts t o 1200 X L l l l o n m-' ( a b o u t 4 % o f t h e mean a n n u a l r u n o f f ) .
Some of t h e c h a r a c t e r i s t i c V i s t u l a River f lows a r e p r e s e n t e d i n t h e f o l l o w i n g t a b l e .
Profile
- - - - - - - - - - - - - - - - - - -- - - - -
Krakow
Sandomierz
warszawa
TOZOW
area Catchment I Minimum 1% flow
NQ - 3
(m / s ) . - - - - - - - - - - - - - - - - - - -
14.1
44.7
110.0
229.0
Me an annual flow -
3 (m / s )
. - - - - - - - - - . - - - - - - - - -
84.0
274.0 ' 541.0
961 .O
Maximum 1% flow
K2
- -- - - -- - -- - - --
3400.0
6120.0
7820.0
9130.0
Irregularity rate - WQ NQ --
Any a n a l y s i s o f p o t e n t i a l development and o p e r a t i n g a l t e r n a t i v e s i n t h e r i v e r b a s i n r e q u i r e s e s t i m a t e s o f t h e f u t u r e u n c o n t r o l l e d f lows a t numerous gauging s t a t i o n s and c o n t r o l sites. These u n c o n t r o l l e d f l o w s a r e t h e r e s o u r c e s t o b e r e g u l a t e d and a l l o c a t e d t o v a r i o u s w a t e r u s e r s . I n t h e " V i s t u l a R i v e r P r o j e c t " , t h e q u a n t i t y and t h e d i s t r i b u t i o n o f f u t u r e f l o w s were assumed t o e q u a l mean monthly f l o w s r e c o r d e d a t o v e r 100 gaug ing s t a t i o n s f o r t h e f i f t e e n - y e a r p e r i o d from 1951 t o 1965. While t h e r e a r e gauges t h a t have r e c o r d s o v e r more t h a n 100 y e a r s , i n a c c u r a t e o r incomple te i n f o r m a t i o n t h r o u g h o u t t h e b a s i n p rec luded t h e a d o p t i o n o f a l o n g e r h i s t o r i c a l r e c o r d . The p o t e n t i a l l i m i t a t i o n s o f u s i n g o n l y t h e r e l a t i v e l y s h o r t h i s t o r i c a l r e c o r d a r e a t l e a s t p a r t i a l l y o f f s e t by t h e f a c t t h a t t h e 1951-1965 p e r i o d was a r e l a t i v e l y d r y one. T h i s was a s c e r t a i n e d i n a s p e c i a l s t u d y , t a k i n g advan tage o f much l o n g e r h i s t o r i c a l t r a c e s t h a t e x i s t f o r some gaug ing s t a t i o n s t h r o u g h o u t t h e b a s i n .
To comply w i t h " V i s t u l a R i v e r P r o j e c t " r e q u i r e m e n t s , a n

assessment of availabl,? ground-water resources included (1 ) a regional ground-water study of the entire basin, and (2) a study of 47 localities where water supply shortages existed or would exist in the near future. These localities were selected on the basis of previous water management planning studies. The regional study estimated the available ground-water resources in the basin at approximately 50 million m3/day. According to the hydrogeological conditions prevailing iq the individual parts of the basin, water supply yield per one km varies from 40 to 1000 m3/day (the mean for the entire basin is 273 m3Iday).
The quality of water resources should be viewed in !lght of the official regulations in force in Poland. dt t?e time of Project preparation, there were four acceptable water-quality standards, each pertaining to a general-use category, which defined the maximum permissible concentration for a large number of water quality parameters. The reference flows for all water- quality analyses are the statistical means from all recorded minimum annual flows. To illustrate the magnitude of the water-quality problems: in 1969 about 80% of the main stem of the Vistula and about 40% of the total length of the major tributaries were below the lowest acceptable water-quality standard. It is evident that the target quality levels estab- blished for each reach of the Vistula River System were not being met then, and cannot be met now or in the future without additional investments in waste-water control facilities.
4. PLANNING STRATEGY
Optimization of an investment policy in multiple-purpose and multi-reservoir water control systems is an intricate and complex problem. Since conventional water resources planning procedures cannot provide a comparison of a large number of alternative investment programs, it was decided at the outset that maximum possible use would be made of mathematical techniques and digital computer facilities.
Major difficulties in the Vistula River Basin are caused by:
- The numerous interrelated water requirements of virtually all branches of the national economy;
- Social demands and environmental protection requirements exerting a distinct influence on the objectives of water use;
- The different formal procedures by which water resources are distributed to various users, expressed by a variety of technical and adminis- trative arrangements for water management;
- The special character of water resources development

investments (high capital outlays and time- consuming design and construction);
- Delays in implementing a water resources develop- ment program not compatible with the overall social and economic development of the country.
A starting point for methodological studies was a proposal made by the Institute of Environmental Engineering, Warsaw Technical University, for a spatial and problem-oriented decomposition of the system. Such a decomposition was justified by the exceptional size of the Vistula River Basin, the large number of users, the complicated system structure, and the limited computer facilities available at that time. It was decided, therefore, to decompose the basin spatially into 13 subsystems (see Figure 2). Each of these represents an area whose economic structure is as uniform as possible, which is of homogeneous hydrological nature, and which creates similar hydraulic engineering problems.
Figure 2. Topology of subsystems.
With regard to problem-oriented decomposition, the proposal-- in conformity with the special character of water management in Poland--was directed mainly toward the problem of water supply for the population, agriculture and industry; toward water

pollution control; and toward independent investigation of the most rational solutions for flood control.
The list of water control objectives identified in the "Vistula River Project" included:
1) Water supply to the population, agriculture and industry;
2) Maintenance of the minimum acceptable flows (established via a detailed study of the environ- mental effects of various minimum flows);
3) Water pollution control;
4) Flood control;
5) Development of recreational facilities;
6) Development of hydropower production and inland navigation, taking into consideration the effectiveness of alternative power production and transport modes.
The target values of all water control objectives have been established by the specialized agencies (1 4 ministries in collaboration) for two levels of future development, 1985 and 2000. The common base for all projections has been the national long-term development plan. Final compilation, critical evaluation and preparation of these data has been assigned to the National Water Authority and its agencies, especially the "Hydroprojekt" previously mentioned. The total water requirements are shown in Figure 3.
Awareness of the fact that some control objectives will not be covered by mathematical modelling led to the necessity for post-optimization analyses and formulation of program proposals based on interpretation of the results of all Project investigations.
The Project was elaborated in the years 1968-1972 in the following steps:
- Formulation of the so-called "program card" and delineation of major methodological assumptions;
- Preparation of basic information and its transfor- mation into project data;
- Development of mathematical models;
- Preparation of input data for these models;
- Simulation of water resources allocation in each subsystem, and analysis of investment alternatives;

- E v a l u a t i o n of s i m u l a t i o n r e s u l t s and c h o i c e of a c c e p t a b l e s o l u t i o n s ;
- D e f i n i t i o n o f t h e most r a t i o n a l s o l u t i o n and f o r m u l a t i o n o f t h e inves tment program f o r t h e V i s t u l a River Bas in .
Figure 3. Total water requirements.
The fundamental a ssumpt ion which u n d e r l i e s t h e p l a n n i n g s t r a t e g y i s t h a t t h e inves tment program a l t e r n a t i v e s - - i n c l u d i n g r e s e r v o i r s i t e s , w a t e r t r a n s f e r r o u t e s , d i v e r s i o n s and s i z e s o f a l l h y d r a u l i c e n g i n e e r i n g u n d e r t a k i n g s - - a r e reduced t o a f i n i t e s e t D i j by subsystems i and v a r i a n t s j . D i f f e r e n t s i z e s a t t h e same l o c a t i o n s have been a n a l y s e d v i a s e p a r a t e v a r i a n t s . P o t e n t i a l l i m i t a t i o n s o f t h i s approach a r e , i n t h e c a s e o f t h e V i s t u l a B a s i n , a lmos t comple te ly o f f s e t by t h e f a c t t h a t development o p p o r t u n i t i e s a r e u n f o r t u n a t e l y q u i t e r e s t r i c t e d , owing t o t o p o g r a p h i c and g e o l o g i c a l c o n d i t i o n s .
The p r imary t h r u s t of mode l l ing a c t i v i t i e s was d i r e c t e d toward development o f t h e s o - c a l l e d Water Resources Management Model. Once each inves tment v a r i a n t was d e f i n e d f o r a g i v e n subsystem, i t s performance was e v a l u a t e d by a s i m u l a t i o n - o p t i m i z a t i o n p rocedure ( W R M Model) t o a l l o c a t e each o f t h e 1 8 0

monthly f l o w s on r e c o r d t o each w a t e r u s e ( t a r g e t v a l u e s f o r 1985 and 2 0 0 0 c o r r e s p o n d i n g t o c o n t r o l o b j e c t i v e s ( 1 ) and ( 2 ) and hydropower p r o d u c t i o n ) . When a n a l l o c a t i o n f e l l s h o r t of t h e t a r g e t , i t was d e f i n e d a s a d e f i c i t a l l o c a t i o n . Each d e f i c i t was weighted by a p e n a l t y f a c t o r r e f l e c t i n g t h e r e l a t i v e p r i o r i t y o f e a c h w a t e r u s e o v e r a l l o t h e r u s e r s .
A t t h e beg inn ing of t h e V i s t u l a s t u d y , t h e i n t e n t i o n was t o e s t i m a t e t h e s e p e n a l t y f a c t o r s i n monetary t e r m s . The q u e s t i o n t o b e answered was how h igh t h e economic l o s s e s would b e i f some o f t h e w a t e r demands were n o t s a t i s f i e d o r a t l e a s t n o t f u l l y s a t i s f i e d . C a p i t a l o u t l a y s and o p e r a t i o n c o s t s f o r a g i v e n inves tment a l t e r n a t i v e were t o b e compared w i t h l o s s e s d u e t o p o s s i b l e wa te r s h o r t a g e s and t h o s e b e n e f i t s which c o u l d b e e v a l u a t e d i n monetary t e r m s . E v a l u a t i o n of e v e r y inves tment a l t e r n a t i v e was t o be made a c c o r d i n g t o t h e formula:
where
J = c a p i t a l o u t l a y s f o r w a t e r r e s o u r c e s inves tment
R = o p e r a t i o n c o s t s
S = l o s s e s due t o w a t e r d e f i c i t s
E = measurab le economic b e n e f i t s ( e . g . hydropower p r o d u c t i o n , a v e r t e d f l o o d l o s s e s , o v e r a l l economic promotion of a g i v e n r e g i o n ) .
U n f o r t u n a t e l y , t h e p r e l i m i n a r y s t u d i e s showed t h a t f o r many w a t e r u s e r s t h e r e i s no way of a s s e s s i n g l o s s e s due t o w a t e r d e f i c i t i n comparable u n i t s . Moreover, a t l e a s t some of them c o u l d n o t be e x p r e s s e d s t r i c t l y i n monetary t e r m s and t h e i r comparison w i t h c o s t s (J and K ) and b e n e f i t s (E) proved t o b e i n f e a s i b l e . T h i s f a c t f o r c e d t h e V i s t u l a p l a n n e r s t o modify t h e approach o r i g i n a l l y con templa ted .
An a t t e m p t was made, t h e r e f o r e , t o d e f i n e t h e h i e r a r c h y o f w a t e r u s e r s by a sys tem of w e i g h t s t o b e used i n t h e s i m u l a t i o n a n a l y s i s o f w a t e r r e s o u r c e s a l l o c a t i o n i n each inves tment v a r i a n t con templa ted . A n a l y s i s o f t h e J , K and E f a c t o r s was c o n s e q u e n t l y s h i f t e d t o t h e n e x t phase o f p o s t - o p t i m i z a t i o n a n a l y s i s .
The sys tem of w e i g h t s f i n a l l y adop ted i s based on t h e r e l a t i o n s h i p between t h e u n i t p r o d u c t i o n c o s t s o f a g i v e n
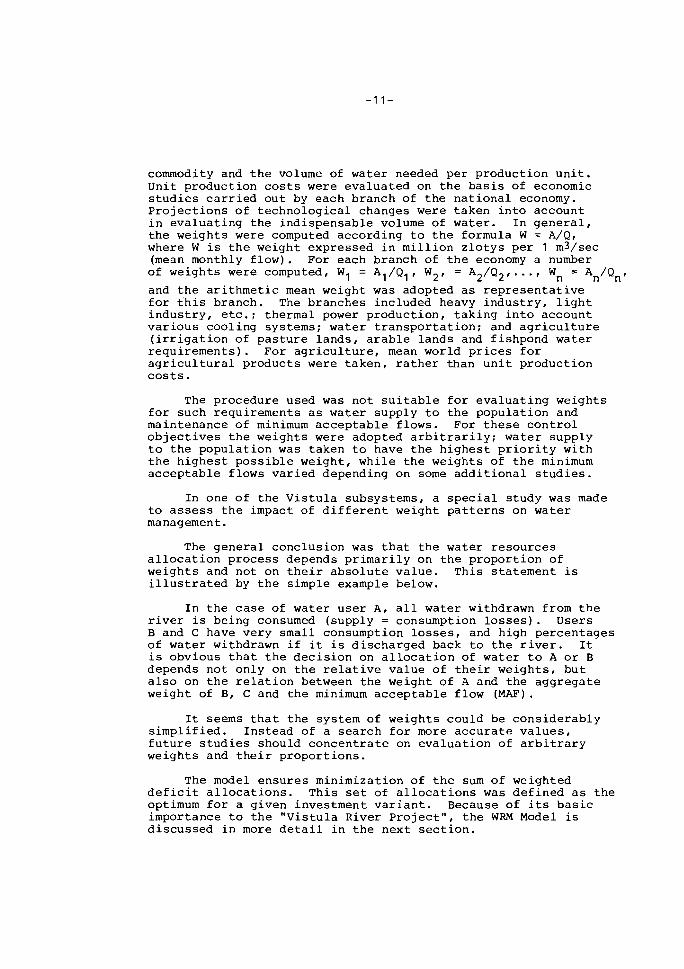
commodity and t h e volume of w a t e r needed p e r p r o d u c t i o n u n i t . U n i t p r o d u c t i o n c o s t s were e v a l u a t e d on t h e b a s i s o f economic s t u d i e s c a r r i e d o u t by each b ranch o f t h e n a t i o n a l economy. P r o j e c t i o n s o f t e c h n o l o g i c a l changes were t a k e n i n t o a c c o u n t i n e v a l u a t i n g t h e i n d i s p e n s a b l e volume of w a t e r . I n g e n e r a l , t h e w e i g h t s were computed a c c o r d i n g t o t h e formula W = A/Q, where W is t h e we igh t e x p r e s s e d i n m i l l i o n z l o t y s p e r 1 m3/sec (mean monthly f l o w ) . For each b ranch o f t h e economy a number o f w e i g h t s were computed, W1 = A1/Q1, W 2 , = A Z / Q 2 , . . . , Wn = An/Qn,
and t h e a r i t h m e t i c mean weigh t was adop ted a s r e p r e s e n t a t i v e f o r t ' h i s b ranch . The b r a n c h e s i n c l u d e d heavy i n d u s t r y , l i g h t i n d u s t r y , e t c . ; t h e r m a l power p r o d u c t i o n , t a k i n g i n t o a c c o u n t v a r i o u s c o o l i n g systems; w a t e r t r a n s p o r t a t i o n ; and a g r i c u l t u r e ( i r r i g a t i o n o f p a s t u r e l a n d s , a r a b l e l a n d s and f i s h p o n d w a t e r r e q u i r e m e n t s ) . F o r a g r i c u l t u r e , mean wor ld p r i c e s f o r a g r i c u l t u r a l p r o d u c t s were t a k e n , r a t h e r t h a n u n i t p r o d u c t i o n c o s t s .
The p rocedure used was n o t s u i t a b l e f o r e v a l u a t i n g w e i g h t s f o r such r e q u i r e m e n t s a s w a t e r s u p p l y t o t h e p o p u l a t i o n and main tenance o f minimum a c c e p t a b l e f lows . For t h e s e c o n t r o l o b j e c t i v e s t h e w e i g h t s were adop ted a r b i t r a r i l y ; w a t e r s u p p l y t o t h e p o p u l a t i o n was t a k e n t o have t h e h i g h e s t p r i o r i t y w i t h t h e h i g h e s t p o s s i b l e w e i g h t , w h i l e t h e w e i g h t s o f t h e minimum a c c e p t a b l e f l o w s v a r i e d depending on some a d d i t i o n a l s t u d i e s .
I n one o f t h e V i s t u l a subsys tems , a s p e c i a l s t u d y was made t o a s s e s s t h e impact o f d i f f e r e n t weight p a t t e r n s on w a t e r management.
The g e n e r a l c o n c l u s i o n was t h a t t h e w a t e r r e s o u r c e s a l l o c a t i o n p r o c e s s depends p r i m a r i l y on t h e p r o p o r t i o n o f w e i g h t s and n o t on t h e i r a b s o l u t e v a l u e . T h i s s t a t e m e n t i s i l l u s t r a t e d by t h e s imple example below.
I n t h e c a s e o f w a t e r u s e r A , a l l w a t e r withdrawn from t h e r i v e r i s b e i n g consumed ( supp ly = consumption l o s s e s ) . Users B and C have v e r y s m a l l consumption l o s s e s , and h i g h p e r c e n t a g e s o f w a t e r withdrawn i f it i s d i s c h a r g e d back t o t h e r i v e r . It i s o b v i o u s t h a t t h e d e c i s i o n on a l l o c a t i o n o f w a t e r t o A o r B depends n o t o n l y on t h e r e l a t i v e v a l u e o f t h e i r w e i g h t s , b u t a l s o on t h e r e l a t i o n between t h e we igh t o f A and t h e a g g r e g a t e we igh t of B, C and t h e minimum a c c e p t a b l e f l o w (MAF).
It seems t h a t t h e sys tem of w e i g h t s c o u l d be c o n s i d e r a b l y s i m p l i f i e d . I n s t e a d o f a s e a r c h f o r more a c c u r a t e v a l u e s , f u t u r e s t u d i e s s h o u l d c o n c e n t r a t e on e v a l u a t i o n o f a r b i t r a r y w e i g h t s and t h e i r p r o p o r t i o n s .
The model e n s u r e s m i n i m i z a t i o n o f t h e sum o f we igh ted d e f i c i t a l l o c a t i o n s . T h i s s e t o f a l l o c a t i o n s was d e f i n e d a s t h e optimum f o r a g i v e n i n v e s t m e n t v a r i a n t . Because o f i t s b a s i c impor tance t o t h e " V i s t u l a River P r o j e c t " , t h e WRM Model is d i s c u s s e d i n more d e t a i l i n t h e n e x t s e c t i o n .

It should be noted that the WRM Model has been used to evaluate the potential investment variants within each separate subsystem. Since each subsystem affects the flows available for use in downstream subsystems, and is subjected to regulated flows from upstream subsystems, some means had to be found for incorporating within each subsystem some consideration of the neighboring subsystems. The problem was solved by analysing all subsystems sequentially, starting with the one farthest upstream. To allow for downstream needs, it was judged that it would be sufficient to establish a monthly target of the mean annual flow at the boundary with the neighboring downstream subsystem. Deficits in flows at this location were weighted and included in an objective function to be minimized. Before proceeding to the next subsystem, the previously analysed investment variants were carefully inspected, and those incapable of meeting high-weighted target demands within 5% tolerance were excluded from further analysis. Regulated monthly outflows from the upper subsystem were next used as an input to the lower subsystem. Again it must be stressed that potential limitations of this approach are, to a large extent, offset by a finite number of intensively studied development (investment) opportunities. Altogether, 148 investment variants were analysed in this way--46 for the time horizon of 1985 and 102 for the year 2000.

In parallel with the WRM Model, four mathematical models were developed to assess the characteristics and the outputs of the hydro-electric power plants planned in the basin. The first POWDYN Model (dynamic programming) was developed to determine the optimal operating policy, optimum firm power, installed capacity and optimum monthly releases from the storage reservoirs when the latter are operated only for energy production. The releases (outputs of this model) were afterwards taken as target values for the hydro-electric water used in the WRM Model. The second POWREC Model (simulation) computes the energy outputs for each of the 15 years of the simulation period, using for each reservoir the optimum releases derived from the WRM Model. As a result of the simulation, a new firm power value, as well as a newly installed capacity of each storage power plant, was determined. These figures were next used for evaluating the economic effects of the hydro-electric power plants planned at the various storage reservoirs in each development alternative. Two other hydro-power simulation models have been developed for optimizing the installed capacities and energy outputs of the low-head hydro-power plants on the Lower Vistula, due consideration being given to their thermal alternatives.
The analytical phase of the work concerned with flood control has concentrated on developing a mathematical model to simulate flood wave propagation in order to assess the value of flood damage reduction for the various investment alternatives. The assessment was based on the cumulative frequency distribution curves of the losses with and without the planned storage reservoirs and flood protective levees. In the first attempt, a flood routing model based on the Saint Venant equations of motion was developed, but the difficulties encountered in adjusting this model to the hydrographs of the reference waves forbade its general application. Finally, the flood propagation computations were carried out by using a simplified model, a modification of the SSARR Model (Rockwood, 1968).
In the analysis of water quality regulation, the project study has focused on estimating the cost of required treatment for the future augmented stream flows at various control profiles throughout the river system analysed. The results have shown that flow augmentation, resulting from implementation of the contemplated investment program, does not appreciably alter the required wastewater treatment costs. This permitted separating the analysis of water quality regulation from that of water quantity control (except for the minimum acceptable flows which were explicitly incorporated in the WRM Model). The studies on water quality have started with a survey of all pollution sources currently discharging more wastewater per day than 1000 m 3
(with a 500 m3/day rate for the chemical and food industries). Wastewater discharge projections have taken into account changes in industrial technologies, as far as these can be anticipated. Analysis of wastewater treatment alternatives included determination of the stream's assimilative capacity and

assessment of various treatment facilities, as well as mechanical, chemical and biological treatment installations, combined regional treatment plants, effluent storage resefvoirs, and the like.
It has already been mentioned that except for some local traffic and the Lower Vistula waterway, inland navigation in the basin is largely undeveloped. Following evaluation of the potential demand for water transport in the years 1985 and 2000 (respectively 44 and 79 million tons per year), numerous alternatives of waterway development were analysed. They included river training works in parallel with river canalization by a cascade of barrages. Alternatives took into account not only different engineering facilities, but also the type of traffic which moves only locally, as distinct from traffic involving longer distances. Depending on the type of traffic, trucking and rail transport served as the alternative transport modes considered for evaluation of the relative effectiveness of water transport. The additional costs of extra warehouse and standby rail facilities, for use during the winter when the Vistula is frozen, were also taken into account in the economic analysis.
The last water control objective to be briefly mentioned is the development of water-based tourism and recreation. Overall social and economic development, as well as the increase of per capita income in Poland, fosters continuous growth of demand for recreational facilities. Evaluation of the recre- ational value of the contemplated development (investment) alternatives involved a checklist of site characteristics, such as the local physical factors and the distance of the site from centres of population. Each item on the checklist was rated in points according to its value as a recreational feature. The points for all items were then totalled and the site was ranked in one of four classes, from "special" through "very good", "poor" to "inferior".
It can be seen from the foregoing that the potential development (investment) alternatives have been subjected to the screening process predominantly with the aid of the WRM Model. The next phase of the so-called "post-optimization analysis" was restricted to investment alternatives which survived the screening process, at the same time taking account of the results of all other studies carried out within the framework of the Project. At this point in the investigation, final recommendations on flood control storage capacities were formulated. All the basin-wide investment alternatives had also been assessed for their economic feasibility. The economic analysis (net present value approach) had taken into consideration (1) capital requirements, with due regard for the cost of capital immobilization during construction; (2) annual charges, including operation and maintenance, replacement and capital repair costs, interest on capital invested and amortization;

( 3 ) measurable benefits, including primarily power production, flood control, navigation, and promotion of regional development; and (4) agricultural losses due to elimination of permanently inundated land (storage reservoirs).
Final formulation of the basin-wide investment program has been carried out taking account of the different possible levels of capital expenditure. Therefore, two alternative programs have been formulated for the target year of 1 9 8 5 , two for 2000 and two for the ultimate development of the basin's water resources. The programs were so arranged that the highest reviewing authority, the Planning Commission of the Council of Ministers, could make the final choice before presenting the program for Government approval. Some of the key elements of the proposed investment programs are shown in Figure 1. Figure 4 shows the projected water deficits before and after implemen- tation of the program.
Figure 4. Total deficits in the Vistula system.
Further work in 1 9 7 2 - 1 9 7 4 and current studies have led to improved methodology, increased precision of analysis, and an enlarged research field.
The Vistula Basin was again examined in 1 9 7 3 - 1 9 7 4 for alternative technical solutions. The work was based on modified

r u l e s p l a c i n g more emphasis on a l i m e n t a t i o n of t h e V i s t u l a River f low. Data on water needs were updated a c c o r d i n g t o changes i n o v e r a l l development p l a n s . The c h a r a c t e r i s t i c s of a v a i l a b l e wate r r e s o u r c e s w e r e based on mean 10-day f l o w d a t a i n s t e a d o f monthly v a l u e s . The number o f subsystems i n t h e V i s t u l a Basin was l i m i t e d t o t h r e e i n s t e a d o f t h e e a r l i e r 14. T h i s was ach ieved by t h e u s e o f more powerful computers and o r g a n i z a t i o n o f d a t a s t o r a g e i n d i s c f i l e s w i t h d i r e c t a c c e s s t o p a r t i c u l a r r e c o r d s .
S i m i l a r work i s be ing c a r r i e d o u t f o r t h e Odra River Basin. I t i s expec ted t h a t t h e g e n e r a l wa te r development p l a n f o r t h e whole c o u n t r y w i l l b e p repared b e f o r e t h e end of 1975, based on system a n a l y s i s methodology.
On t h e b a s i s of t h e V i s t u l a P r o j e c t , t h e examina t ion o f s m a l l e r r i v e r b a s i n s o r c o u n t r y r e g i o n s was begun, w i t h more d e t a i l e d d a t a on r e s o u r c e s and wate r demands. The inves tment program, f i x e d i n b a s i c s t u d i e s , g i v e s g e n e r a l d i r e c t i o n s f o r r e g i o n a l a n a l y s e s . The work a l r e a d y under taken must d e f i n e o p t i m a l paramete rs of r e g i o n a l development e lements ; F i g u r e 5 g i v e s examples of t h r e e r e g i o n a l systems b e i n g s t u d i e d a t t h e p r e s e n t t i m e .
A L T E R N A I I V E SOLUTIONS
WATER USER
Figure 5 . Examples of regional water resources systems.

5. WATER RESOURCES MANAGEMENT MODEL
It has already been mentioned that conventional techniques are inadequate for planning and formulating complex water resource systems such as the Vistula River System. Unfortunately, it may never be possible to take all the many variables, inputs and outputs fully into account in a systematic manner. Assump- tions and simplifications will continue to be necessary. Nonetheless, application of the system approach provides water resource planners with a much better set of tools than were available 10 to 15 years ago.
The work described in this section was an attempt to develop and apply a simulation (optimization) methodology directed primarily at the allocation of available water to various uses. It was the product of joint efforts by a mathe- matical modelling group comprising experts from Poland and from Water Resources Engineers, 1nc.l
The methodological work was first organized around a basic scheme proposed by the Institute of Environmental Engineering of Warsaw Technical University. The so-called Three-Step Method is composed of three computer programs which are applied sequentially in order to: (1) determine a set of target releases for individual reservoirs in the system, (2) develop operating rules for the reservoirs given the inflow hydrology and the target outflows, and (3) determine the optimal allocation of available water to all water uses considered in the model, given the operating rules from (2). Steps (1) and (3) were based on the Out-of-Kilter Algorithm, which is a special-purpose linear programming method derived from network flow theory. Step (2) was based on the method developed by Kornatowski (1969), employing stochastic-dynamic programming. Details of the Three-Step Method are described by Kaczmarek et al. (1971). The programs were made operational on the Polish- made Odra 1204 and 1304 computers; however, they could not be combined into a single program because of the limited capacity of the machines available at that time. Under the circumstances, implementation of the method was rather difficult and attention was focused on the development of the so-called Single-Step Method (referred to as the WRM Model). That method utilizes the Out-of-Kilter Algorithm to solve water resource allocation problems in a complex multi-reservoir system. First, the physical system is represented by a node-arc network in which arcs are inserted for all river reaches, demands, supplies, return flows, etc. An arc is, therefore, defined as any link connecting two nodes. Figure 6 illustrates an example of such a network derived from Figure 6a. Nodes portray the reservoirs, non-storage junction, control and balance profiles. Since the
'water Resources Engineers, Inc., Walnut Creek, California, USA, sub-contracted by the UN for mathematical modelling assistance to the Vistula River Project.

network shown i n F igure 6 is only a s p a t i a l r e p r e s e n t a t i o n of t h e problem, it must be expanded t o i nc lude t ime cons ide ra t i ons . This is accomplished by in t roducing t h e s t o r a g e a r c s . For mul t i -per iod a n a l y s i s t h e f i n a l s t o r a g e from one per iod becomes t h e i n i t i a l s t o r age f o r t h e next per iod and s o on. The one- per iod network may be thought of a s being expanded i n t o t h e t h i r d dimension with i n t e r connec t ion of t ime p lanes by t h e s t o r a g e a r c s .
I n t h e c a s e of t h e V i s tu l a WRM Model, t h e "bes t " a l l o c a t i o n i n each month has been determined, hedging a g a i n s t f u t u r e requirements i n t h e three-dimensional network by covering a t o t a l of s i x l a y e r s (1+5 months) . Ca l cu l a t i ons have shown t h a t under s p e c i f i c V i s tu l a Basin cond i t i ons ( r a t h e r low s t o r a g e c a p a c i t i e s i n comparison t o t h e mean annual f l o w s ) , t h e r e i s no need t o cover more t han s i x t ime per iods . I n o t h e r words, a more d i s t a n t f u t u r e e x e r t s n e g l i g i b l e i n f luence on t h e r e s e r v o i r r e l e a s e s i n a month a c t u a l l y taken f o r a n a l y s i s . Therefore , t h e model is f i r s t used t o s o l v e t h e six-month a l l o c a t i o n problem a t t h e beginning of t h e s imu la t ion pe r iod ; cons ide r ing t h e f i r s t -month s o l u t i o n a s v a l i d , it moves on t o span t h e second through seventh month, and s o on. The f i n a l r e s u l t of t h e s imula t ion c o n s i s t s i n t h e aggrega t ion of a l l t h e f i r s t -month s o l u t i o n s . I n o rde r t o make s o l u t i o n s more r e a l i s t i c , on ly t h e f i r s t -month water s u p p l i e s t o t h e system were used a s h i s t o r i c a l s t reamflow r a t e s . The median monthly f lows from t h e e n t i r e per iod on record were taken a s water s u p p l i e s i n t h e remaining f i v e months.
One of t h e main advantages of t h e WRM Model i s t h a t r e s e r v o i r ope ra t ing p o l i c i e s need no t be s p e c i f i e d a p r i o r i , and complex methods t o determine such p o l i c i e s a r e avoided. The r e s e r v o i r r e l e a s e s a r e genera ted dynamically according t o t h e demand s i t u a t i o n and a v a i l a b l e inf low p r e d i c t i o n s . This f a c t o r t a k e s on inc reas ing s i g n i f i c a n c e i n mu l t i - r e se rvo i r systems. Moreover, i nco rpo ra t ion of new r e s e r v o i r s o r demands dur ing s imula t ion p re sen t no d i f f i c u l t i e s a s ope ra t ing r u l e s need no t be modified.
I t is a l s o important t h a t t h e non l inea r pena l ty func t ions can be represented i n t h e model by a number o f p a r a l l e l a r c s , wi th each a r c denot ing a l i n e a r i z e d segment of t h e non l inea r curve. S i m i l a r l y , c a n a l s w i th pumping c o s t s may be incorpora ted .
A s i n p u t , t h e WRM Model r e q u i r e s a network a s shown i n F igure 6b i n which, f o r each a r c , t h e fo l lowing informat ion must be s p e c i f i e d : ( 1 ) source node number, ( 2 ) s i n k node number, ( 3 ) lower bound f o r flow i n t h e a r c , ( 4 ) upper bound f o r f low i n t h e a r c , and (5 ) pena l ty c o s t a s soc i a t ed wi th u n i t f low d e f i c i t i n t h e a r c . To make t h e network continuous over time and space , and e x t r a node t o accommodate n e t balance i s added. This is t h e so-ca l led balance node t o and from which a l l demands ( o r consumption l o s s e s ) and water s u p p l i e s a r e routed . I d e n t i f i c a t i o n of a r c t ypes and d e f i n i t i o n s of t h e i r lower and upper bounds may be found i n t h e F i n a l Report on t h e

LEGEND: a WATER SUWLV ARCS 2 WATER FLOW ARCS n*- C@4YlWTlVE LOSS ARCS
INTER- SUBSYSTEM FlELAMNS
0 NETWORK NODES
STWAGE RESERVCYRS
Figure 6. Node-arc network.
V i s t u l a R i v e r P r o j e c t ( 1 9 7 2 ) . B e s i d e s t h e o b j e c t i v e f u n c t i o n , which i s t o min imize t h e sum o f p e n a l t i e s a s s o c i a t e d w i t h n o t m e e t i n g t h e demands and minimum f l o w r e q u i r e m e n t s i n t h e r i v e r , t h e m a t h e m a t i c a l s t r u c t u r e o f t h e WRM Model c o m p r i s e s t h r e e sets o f c o n s t r a i n t e q u a t i o n s . One se t r e q u i r e s t h a t c o n t i n u i t y b e s a t i s f i e d a t a l l nodes i n t h e ne twork. The r e m a i n i n g two sets d e s c r i b e t h e lower and uppe r bounds on f l o w i n a l l a r c s i n t h e ne twork. Thus i n p r i n c i p l e t h e r e i s o n e e q u a t i o n f o r e a c h node and two e q u a t i o n s f o r e a c h a r c . F o r t h e f i n e r p o i n t s o f p rob lem f o r m u l a t i o n , t h e r e a d e r i s r e f e r r e d t o t h e F i n a l R e p o r t o n t h e V i s t u l a R i v e r P r o j e c t (1972) and t o t h e p a p e r by King e t a l . ( 1 9 7 1 ) . D e t a i l s o f t h e O u t - o f - K i l t e r A l g o r i t h m h a v e been p r e s e n t e d by F u l k e r s o n ( 1 9 6 1 ) , Ford and F u l k e r s o n (19621, and Durb in and Kroenke ( 1 9 6 7 ) . It s h o u l d b e n o t e d t h a t a f t e r c o m p l e t i o n o f t h e UN/UNDP V i s t u l a R i v e r P r o j e c t , t h e WRPl Model was c o n s i d e r a b l y improved by t h e "Hydropro jek t " p r e v i o u s l y men t ioned . The compute r programs a r e now o p e r a t i o n a l on t h e IBM 360/50 System, and t h e y a r e b e i n g u s e d f o r a s i m i l a r s t u d y o n o p t i m a l deve lopmen t o f w a t e r r e s o u r c e s i n t h e P o l i s h p a r t o f t h e Odra R i v e r B a s i n .

References
Durbin, E.P., Kroenke, D.M. (1967), The Out-of-Kilter Algorithm, a Primer, Rand Corporation Publication RM-5472-PR.
Ford, L.R., Jr., Fulkerson, D.R. (1962), Flows in Networks, Princeton Univ. Press.
Fulkerson, D.R., (1 961 ) , An Out-of-Kilter Method for Minimum Cost Flow Problem, J o u r . S o c . A p p l i e d I n d u s t r i a l M a t h e m a t i c s , Volume 9, No. 1 (March) .
Hydroprojekt, Consulting Engineers (1972), Planning Comprehensive Development of the Vistula River System, Final Report, War saw.
Jedrysik, M., Laski, A., Zielinski, J. (1971), General Description of the Vistula Project and Basic Planning Data, in P r o c e e d i n g s o f t h e Warsaw Sympos ium o n M a t h e m a t i c a l M o d e l s i n H y d r o l o g y , International Association of Hydrological Sciences Publication No. 101, UNESCO, Paris pp. 1058-1071.
Kaczmarek, Z. , Krajewski, K. (1970), Mathematical Model of Water Management Balance for Optimization of the Investment Program of Water Management in the Vistula River Basin, Publication of the Warsaw Technical University, Institute of Environmental Engineering.
Kaczmarek, Z., Krajewski, K., ~ornatowski, T., Filipkowski, A., Kindler, J., Kebler, D.F. (1971), The Multi-Step Method for Simulation and Optimization of Vistula River Planninq Alternatives, in P r o c e e d i n g s o f t h e Warsaw S y m p o s i u m o n M a t h e m a t i c a l M o d e l s i n H y d r o l o g y , International Association of Hydrological Sciences Publication No. 101, UNESCO, Paris pp. 1072-1 077.
Kibler, D.F., King, I.P. (1972), Mathematical Models for Planning the Development of the Vistula River Basin, Poland. Water Resources Engineers, Inc., Walnut Creek, California.
King, I.P., Filimowski, J., Kindler, J. (1971), The Out-of-Kilter Algorithm as a Single-Step Method for Simulation and Optimization of Vistula River Planning Alternatives, in P r o c e e d i n g s o f t h e Warsaw S y m p o s i u m o n M a t h e m a t i c a l M o d e l s i n H y d r o l o g y , International Association of Hydrological Sciences Publication No. 101, UNESCO, Paris pp. 1078-1085.
Kornatowski, T., (1969), Basis of Optimal Management of a Single Storage Reservoir, Publication of the Warsaw Technical University.

Systems Analys i s Bas i s of Water Management
i n t h e T i s za River Val ley
1stvSn ~ o g s r d i , ~ 6 l a CsodS, and G6za Hank6
1 . INTRODUCTION
The T i s za i s t h e second-grea tes t r i v e r i n Hungary. I t d r a i n s h a l f of t h e land i n t h e coun t ry . More broad ly cons ide r ed , t h e catchment a t p r e s e n t is shared by f i v e c o u n t r i e s , namely Czechoslovakia , t h e S o v i e t Union, Rumania, Hungary and Yugo- s l a v i a .
Water management i n t h e T i s za Val ley is of g r e a t i n f l u e n c e i n t h e economic and s o c i a l development o f Hungary. Furthermore, problems due t o bo th exces s ive abundance and sho r t age of wate r a r e aggrava ted by p o l l u t i o n .
Convent ional eng inee r i ng o r economic methods a r e v i r t u a l l y i n e f f e c t i v e f o r d e s c r i b i n g i n q u a n t i t a t i v e t e r m s t h e behavior of a complex n a t u r a l , economic and s o c i a l system such a s t h e T i s za River Basin. The methods of systems a n a l y s i s , on t h e o t h e r hand, appear s u i t e d f o r so lv ing t h e fundamental problems of wate r management i n t h e Tisza Val ley , f o r p rov id ing op t imal c o n t r o l o f t h e p r e s e n t system, and f o r d e l i n e a t i n g t h e s t r a t e g y of water development. Th i s paper has been compiled i n p r e p a r a t i o n f o r s o l u t i o n s t o water management problems and wate r development s t r a t e g y .
Chapter 2 d e s c r i b e s t h e n a t u r a l , socio-economic and wate r management c o n d i t i o n s p r e v a i l i n g i n t h e T i s za River System. I n Chapter 3 a rev iew i s presen ted of t h e systems a n a l y s e s p repared t h u s f a r on t h e Hungarian p a r t o f t h e T i s za Val ley . The r e s u l t s a r e n o t o n l y of t h e o r e t i c a l i n t e r e s t , b u t have been a p p l i e d i n p r a c t i c e . Based on t h e in format ion compiled i n t h e preceed ing two c h a p t e r s and on i n t e r n a t i o n a l expe r i ence s r e l a t e d t o systems a n a l y s i s , Chapter 4 sugges t s some system models t h a t approach t h e e x p e c t a t i o n s of p r a c t i c e . Fu r the r s t u d i e s a r e needed t o p e r f e c t t h e models.
2 . DESCRIPTION OF THE SYSTEM
2.1 Na tu r a l c o n d i t i o n s i n t h e T i s za River Basin
The wa t e r s from t h e e a s t e r n p a r t of t h e Carpa th ian Basin a r e c o l l e c t e d and conveyed t o t h e Danube by t h e T i s za River , t h e l a r g e s t l e f t -hand t r i b u t a r y of t h e Danube. The catchment a r e a

o f t h e a l m o s t 1,000-km-long r i v e r is around 157,000 kmL ( s e e F i g u r e 1 ) . The catchment c a n b e d i v i d e d i n t o two p a r t s ; on t h e one s i d e t h e r e is a mountain r a n g e bounding t h e c a t c h - ment and r i s i n g t o e l e v a t i o n s o f 2,000 m. F u r t h e r t h e s l o p e s o f t h e b lock o f mounta ins a t t h e c e n t e r o f t h e ca tchment have e l e v a t i o n s up t o 1 ,800 m. These two form t h e mountain a r e a . On t h e o t h e r s i d e t h e r e a r e t h e G r e a t P l a i n s o f a b o u t 80,000 km w i t h e l e v a t i o n s below 200 m. The l a t t e r p a r t compr i ses 51% of t h e ca tchment . A e r i a l d i s t r i b u t i o n o f t h e ca tchment a c c o r d i n g t o c o u n t r i e s is shown i n Tab le 1 .
CZECHOSLOVAKIA
-.- NATIONAL
Figure 1 . Morphology o f the Tisza River Basin.

Table 1. Territorial distribution of the Tisza River catchment by countries.
Catchment area Percentage from Percentage from
Country thousands total plains the whole area of of km2 part of the catchment the country
Hungary 46.2 29.6 5 6 50
Rumania 72.0 46.0 24 30
USSR 12.7 8.1 4 insignificant
Czechoslovakia 15.5 9.9 4 12
Yugoslavia 10.0 6.4 12 4
Total
Around 30% of t h e e n t i r e ca tchment , and 56% of t h e G r e a t P l a i n s i s s i t u a t e d i n t h e t e r r i t o r y o f Hungary. More t h a n one- h a l f o f t h e t e r r i t o r y of Hungary l i e s i n t h e T i s z a River Bas in . The c l i m a t e o f t h e b a s i n i s b a s i c a l l y c o n t i n e n t a l i n c h a r a c t e r , b u t a t t i m e s i s i n f l u e n c e d by a i r c u r r e n t s o f Medi te r ranean and A t l a n t i c o r i g i n . It i s owing t o t h i s p e r i o d i c i n f l u e n c e t h a t a r e g u l a r a l t e r n a t i o n is o b s e r v a b l e between t h e wet and d r y y e a r s , e v e r y decade hav ing two o r t h r e e a r i d and two o r t h r e e wet y e a r s .
The a v e r a g e p r e c i p i t a t i o n i n t h e G r e a t P l a i n s i s l e s s t h a n 600 mm, and even less t h a n 500 mm i n a l a r g e p a r t o f t h e a r e a ; t h e minimum observed was 458 nun. The a v e r a g e r a i n f a l l i n t h e growing season r a n g e s from 300 mm t o 350 nun. The d i s t r i b u t i o n o f p r e c i p i t a t i o n o v e r t h e y e a r i s c h a r a c t e r i z e d by a peak i n June and a low i n January.
T y p i c a l o f t h e c o n t i n e n t a l c h a r a c t e r o f t h e c l i m a t e i n t h e G r e a t P l a i n s i s t h e wide r a n g e o f t e m p e r a t u r e f l u c t u a t i o n s be- tween - 3 0 ' ~ and +40°c . The a v e r a g e number o f s u n s h i n e hours i s i n e x c e s s o f 2,000 o v e r a l a r g e p a r t o f t h e p l a i n s . Three- q u a r t e r s of t h e s u n s h i n e hours o c c u r i n t h e summer h a l f - y e a r . Taking a n a v e r a g e o v e r 50 y e a r s , t h e d i f f e r e n c e between p o t e n t i a l e v a p o r a t i o n and p r e c i p i t a t i o n i s 175 mrn i n t h e c e n t r a l r e g i o n o f t h e p l a i n s , w h i l e t h e a r i d i t y f a c t o r , namely t h e r a t i o o f p o t e n t i a l e v a p o r a t i o n and p r e c i p i t a t i o n , which i s of fundamental impor tance t o a g r i c u l t u r a l p r o d u c t i o n , r a n g e s from 1.2 t o 1 .4 .
The Hungarian p a r t o f t h e T i s z a River Bas in r e c e i v e s t h e l e a s t p r e c i p i t a t i o n and t h e g r e a t e s t number o f s u n s h i n e h o u r s i n t h e e n t i r e catchment . High summer t e m p e r a t u r e s t o g e t h e r w i t h ex tended d r y p e r i o d s f r e q u e n t l y r e s u l t i n d r o u g h t s . Also,

t h e a r e a i s o f t e n exposed t o i n u n d a t i o n by f l o o d s and undra ined r u n o f f wa te r . I n t h e T i s z a River Bas in , owing t o c l i m a t e , topog- raphy , and f u r t h e r t o w a t e r budge t c o n d i t i o n s , t h e a v e r a g e r u n o f f volume i s 2 5 . 5 km3/year, w h i l e t h e s p e c i f i c r u n o f f p e r km2 i s 16 .2 l i t / s e c .
The main wa te r c o u r s e o f t h e r i v e r sys tem i s t h e T i s z a River which o r i g i n a t e s i n t h e Nor th -Eas te rn C a r p a t h i a n s and d i s c h a r g e s a t T i t e l i n t o t h e Danube. The major l e f t - h a n d t r i b - u t a r i e s a r e t h e Szamos, t h e Maros and t h e Koros R i v e r s , w h i l e t h e r i g h t - h a n d t r i b u t a r i e s a r e t h e Bodrog, t h e ~ e r n s d , t h e s a j 6 and t h e Zagyva R i v e r s ( s e e F i g u r e 2 ) .
NGHT )(IVIO MY .. - -- U 6 B R - -- nunour - - - - - - VUG4JSLAWA
\ 1 LEFT HAUD DANK R U W A CZECW)6LOVAIIA
() LEFT HIND TRISUTUIV
Figure 2. Profile o f the 'Iisza River.
A f t e r t h e s t e e p headwater s e c t i o n s i n t h e mounta ins , t h e s l o p e o f t h e r i v e r s d e c r e a s e s a b r u p t l y on t h e p l a i n s , r emain ing g e n e r a l l y below 0.1% and even below 0.02% o v e r long s e c t i o n s . As a consequence, f l o o d waves r u s h i n g down t h e mountains over - t a k e e a c h o t h e r and a r e super imposed i n t h e p l a i n s . C h a r a c t e r - i s t i c d a t a on t h e f low reg imes have been compiled i n T a b l e 2 .

Table 2. Characteristic data of rivers in the Tisza Basin.
Range Mean dis- Ratio Mean annual River Section of High charges of
Low runoff stages 3
m Isec excess cm flows 10' m31year
Tisza Tokaj 1,056 4,000 464 5 3 76 14.6
Szolnok 1,141 3,820 546 65 59 17.2
Szeged 1,240 4,700 810 95 4 9 25.1
Szamos Csenger 839 1,350 120 15 90 3 -8
Bodrog ~elsoberecki 651 1,300 120 4 325 3.7
saj6 Fels6zsolca 486 520 32 2 217 1 .O
H;rmas-~br6s Torkolat 1,181 1,330 67 4 333 2 -1
Maros ~ a k 6 658 1,800 160 22 82 5 .O
The d i f f e r e n c e between t h e h i g h e s t and l o w e s t s t a g e s , t h a t i s , t h e r a n g e o f s t a g e f l u c t u a t i o n s , i s from 10 m t o 12 m over t h e Hungar ian r e a c h of t h e T i s z a R i v e r . Even a l o n g t h e p l a i n r e a c h e s of t h e t r i b u t a r i e s , t h i s r a n g e i s a s wide . a s 7 m t o 8 m. I t i s i n t e r e s t i n g t o n o t e t h a t a s a consequence of human a c t i v i - t i e s d u r i n g t h e p a s t 150 y e a r s , t h e r a n g e of s t a g e f l u c t u a t i o n s h a s widened c o n s i d e r a b l y , t h e r i s e i n s t a g e s o v e r t h e Szolnok- Szeged s e c t i o n o f t h e T i s z a River be ing around 5 m t o 6 m. Over t h e upper r e a c h e s of t h e T i s z a River t h e f l o o d d i s c h a r g e may be t a k - a a s around 100 t i m e s a s l a r g e a s t h e d r y wea ther f l o w , whereas on t h e lower r e a c h t h i s r a t i o i s around 50. On t h e t r i b u t a r i e s , t h e r a t i o may a t t a i n t h e magnitude of s e v e r a l hundred.
The w a t e r regime i n t h e r i v e r system is u s u a l l y c o n t r o l l e d by p r e c i p i t a t i o n of A t l a n t i c o r i g i n , a s w e l l a s by t h e wa te r accumulated i n t h e snow-pack d u r i n g t h e w i n t e r . The d i s t r i b u t i o n o f monthly r u n o f f v a l u e s over t h e y e a r ( s e e F i g u r e 3) i n d i c a t e s a t t h e same t i m e t h e c h a r a c t e r i s t i c a n n u a l s t a g e hydrograph. Normally t h e s t a g e s s t a r t t o r i s e i n March when t h e r i v e r i s s t i l l f r o z e n o v e r . Under t h e combined e f f e c t o f m e l t i n g snow and i c e , and s p r i n g r a i n s , s t a g e s i n t h e r i v e r s r i s e r a p i d l y . I n t h e T i s z a River Bas in t h e h i g h e s t annua l s t a g e s o c c u r u s u a l l y around t h e midd le o f March, b u t may be de layed f r e q u e n t l y t o t h e end of A p r i l o r t h e beg inn ing of May. A t Szeged, i n t h e down-stream p a r t of t h e ca tchment , t h e g r e a t e s t annua l r u n o f f i n A p r i l may a t t a i n 14% of t h e annua l average . High s t a g e s a r e u s u a l l y f o l - lowed by a r a p i d r e c e s s i o n . From May t o October t h e d i s c h a r g e i n t h e T i s z a River and i t s t r i b u t a r i e s w i l l u s u a l l y d e c r e a s e c o n t i n u o u s l y , c a u s i n g f r e q u e n t d i f f i c u l t i e s i n meet ing t h e wa te r demands. I n September and October e x t r e m e l y low d i s c h a r g e s a r e common.

2 - 0 7 , I r month
Figure 3. Average distribution o f water resources and water demands of the central part o f the Tisza basin.
C h a r a c t e r i s t i c v a l u e s of t h e wate r regime ove r t h e Hungarian s e c t i o n of t h e Tisza River a r e i l l u s t r a t e d i n F igu re 4 . A s can be pe r ce ived , f l ood d i s c h a r g e s i n t h e T i s za River a r e more o r less t h e same i n magnitude ove r t h e upper and lower Hungarian r eaches , i n c o n t r a s t t o t h e mean and d r y weather d i s c h a r g e s , which i n c r e a s e g r a d u a l l y downstream.
The sediment c o n c e n t r a t i o n i n t h e Tisza River i s i n g e n e r a l t h r e e t o f i v e t i m e s a s g r e a t a s i n t h e Danube and, consequent ly , r e g a r d l e s s of t h e cons ide r ab ly sma l l e r d i s c h a r g e s , t h e annua l ave r age sediment t r a n s p o r t is of t h e same o r d e r of magnitude (20-22 m i l l i o n t ons /yea r ) a s i n t h e Danube. The bed l oad t r a n s - p o r t , on t h e o t h e r hand, is no more t h a n 30% t o 50% of t h a t i n t h e Danube.
Ar r i v ing a t t h e p l a i n s , t h e f low v e l o c i t y and t r a c t i v e f o r c e i n t h e t r i b u t a r i e s i s g r e a t l y reduced and t h u s t h e c o a r s e s e d i - ment i s d e p o s i t e d s o t h a t t h e t r i b u t a r i e s a r e of p r a c t i c a l l y no i n f l u e n c e on t h e sediment compos i t ion i n t h e T i s za River . The ~ a j 6 and t h e Maros Rivers a r e excep t i ons t o t h i s r u l e . The i r s l o p e s a t t h e i r con f luences t o t h e T i s za River a r e s t e e p enough t o b u i l d long g r a v e l and c o a r s e sand b a r s i n t h e T i s za channe l .

BODROG 5I9
I O K A J
ZAGYVA SZOLNOK
Figure 4. The hydrological profile of the Tisza River within the borders o f Hungary.
The ex t reme n a t u r a l c o n d i t i o n s i n t h e G r e a t P l a i n s demon- s t r a t e a l r e a d y t h e n e c e s s i t y o f d e l i b e r a t e w a t e r management i n t h i s r e g i o n . The g e n e r a l l y imperv ious s o i l s and t h e v i r t u a l l y h o r i z o n t a l t e r r a i n c a l l f o r t h e a r t i f i c i a l d r a i n a g e o f r a i n w a t e r , whereas w a t e r s h o r t a g e s owing t o t h e a r i d c h a r a c t e r of t h e c l i m a t e emphasize t h e importance of i r r i g a t i o n . The n e c e s s i t y o f con- t r o l l i n g damages by f l o o d s r u s h i n g down from t h e su r round ing mounta ins , o f p o l l u t i o n c o n t r o l and o f c o n s e r v i n g t h e l i m i t e d wa te r s u p p l i e s h a s focused a t t e n t i o n on comprehensive wa te r management e x t e n d i n g t o t h e e n t i r e T i s z a River Bas in .
2 . 2 Economic C o n d i t i o n s
Water management i n t h e T i s z a River Bas in h a s been o f funda- menta l i n f l u e n c e on t h e economic c o n d i t i o n s n o t o n l y i n t h e T i s z a Region i t s e l f , b u t a l s o on t h e n a t i o n a l economy a s a whole jn Hungary. Under t h e s o c i a l i s t sys tem, t h e s i g n i f i c a n c e o f wa te r management i n t h e economic l i f e i n t h e c o u n t r y h a s f u r t h e r i n - c r e a s e d .
The importance o f t h e r e g i o n s tems from a combina t ion o f s e v e r a l f a c t o r s . T h i s r e g i o n accommodates 4 0 % of t h e 1 0 m i l l i o n

i n h a b i t a n t s o f Hungary. T h i s i s t h e r e g i o n where 4 2 % o f t h e n a t i o n a l p r o p e r t y is c o n c e n t r a t e d . The r e g i o n compr i ses o n e - t h i r d o f t h e a r a b l e l a n d s o f t h e c o u n t r y , p roduc ing more t h a n 50% of t h e t o t a l a g r i c u l t u r a l p r o d u c t . The c o n d i t i o n s f o r a g r i c u l t u r a l p r o d u c t i o n a r e among t h e most f a v o u r a b l e w i t h i n t h e C a r p a t h i a n Bas in . Animal husbandry is w e l l developed b u t t h e f o d d e r s u p p l y is s t i l l inadequa te . The s h a r e o f p o p u l a t i o n employed i n a g r i c u l t u r e (30%) i s above t h e a v e r a g e f o r t h e coun- t r y .
A dense network o f r a i l w a y s and r o a d s h a n d l e s l a r g e volumes o f e a s t - w e s t t r a n s p o r t a t i o n . F u r t h e r economic development depends, however, t o a c o n s i d e r a b l e e x t e n t on t h e g r a d u a l development o f a waterway network and t h e c o n n e c t i o n t o i n l a n d and t r a n s i t w a t e r t r a f f i c .
G e o g r a p h i c a l l y , t h e Hungarian p a r t o f t h e T i s z a River Basin c a n be subd iv ided i n t o s e v e r a l d i s t r i c t s , which w i l l be d e s c r i b e d s u b s e q u e n t l y , p roceed ing from t h e North t o t h e Sou th . The Upper T i s z a Region i s l a r g e l y c o i n c i d e n t w i t h t h e ca tchment above t h e Tokaj s e c t i o n . The economy i n t h i s d i s t r i c t i s p redominan t ly a g r i c u l t u r a l i n c h a r a c t e r , c a t t l e and hog r a i s i n g be ing t y p i c a l of t h e an imal husbandry. Gardens and o r c h a r d s r e p r e s e n t an o u t s t a n d i n g l y h i g h p r o p o r t i o n i n t h e d i s t r i c t , occupying a b o u t 10% of t h e a r a b l e a r e a . I n d u s t r y h a s developed f i r s t o f a l l i n t h e major towns and i s engaged main ly i n food p r o c e s s i n g . I n t h e s o u t h e r n p a r t s o f t h e d i s t r i c t t h e n a t u r a l g a s produced i s o f c o n s i d e r a b l e importance t o t h e n a t i o n a l economy and h a s c o n t r i b - u t e d t o t h e modern iza t ion o f some t h e r m a l power s t a t i o n s .
The Nor the rn I n d u s t r i a l Region c o m p r i s e s t h e mountain and h i l l y a r e a s e x t e n d i n g from t h e e a s t e r n f o o t h i l l s o f t h e ~ s e r h 6 t r a n g e t o t h e v a l l e y o f t h e T i s z a R i v e r . T h i s a r e a accommodates 15% of t h e i n d u s t r y o f Hungary. (The i n d u s t r i a l c e n t e r s a r e c o n c e n t r a t e d i n t h e c o a l b a s i n s and around p roduc ing i n d u s t r i e s . ) The brown-coal mines and open-cas t l i g n i t e e x t r a c t i o n p r o v i d e t h e f u e l f o r t h e network o f t h e r m a l s t a t i o n s i n t h e a r e a . I r o n and s t e e l m e t a l l u r g y and t h e machine i n d u s t r y a r e a l r e a d y i m p o r t a n t , w h i l e t h e chemica l i n d u s t r y i s i n a s t a g e o f r a p i d development . I n t h e Nor the rn I n d u s t r i a l Region, a g r i - c u l t u r e p l a y s a secondary r o l e , e x p e c t f o r t h e wine r e g i o n o f Tokaj which i s a l s o o f h i s t o r i c a l i n t e r e s t .
The C e n t r a l T i s z a Region l i e s on t h e r i g h t - h a n d s i d e o f t h e c e n t r a l T i s z a r e a c h and e x t e n d s down t o t h e mouth o f t h e ~ o r o s R i v e r . The d i s t r i c t i s b a s i c a l l y a g r i c u l t u r a l i n c h a r a c t e r w i t h d e v e l o p i n g i n d u s t r y . Bes ides fa rming , c a t t l e and hog r a i s i n g a r e o f g r e a t economic importance. R e g a r d l e s s o f t h e l a r g e s c a l e development d u r i n g t h e p a s t d e c a d e , t h e r o l e o f i n d u s t r y i s s t i l l i n f e r i o r t o t h a t o f a g r i c u l t u r e . Along w i t h heavy i n d u s t r y , t h e development o f t h e c h e m i c a l i n d u s t r y i n t h i s r e g i o n i s r e l a t e d t o t h e n a t u r a l g a s s u p p l i e s found h e r e .
The Sou th-Eas te rn G r e a t P l a i n s a r e comprised o f t h e v a l l e y o f t h e Koros R i v e r s and a r e a s t o t h e South. The d i s t r i c t i s

predomina t ly a g r i c u l t u r a l i n c h a r a c t e r , t h e s h a r e of plough- l a n d s b e i n g above t h e a v e r a g e f o r t h e c o u n t r y . Bes ides c e r e a l s and maize, t h e p r o d u c t i o n of i n d u s t r i a l c r o p s i s s i g n i f i c a n t . Vege tab le p roduc t ion i n h o t houses s u p p l i e d w i t h n a t u r a l t h e r m a l w a t e r s is of o u t s t a n d i n g importance. Animal husbandry i n t h e d i s t r i c t c o n s i s t s mainly of hog r a i s i n g . I n accordance w i t h t h e a g r i c u l t u r a l c h a r a c t e r , t h e f o o d s t u f f s i n d u s t r y i s developed v i g o r o u s l y . The n a t u r a l g a s and pe t ro leum r e s o u r c e s found i n t h e a r e a a r e o f g r e a t i n d u s t r i a l s i g n i f i c a n c e .
The e a s t e r n h a l f of t h e a r e a between t h e Danube and t h e T i s z a River be longs t o t h e catchment o f t h e l a t t e r . The a r e a i s of p r i m a r i l y a g r i c u l t u r a l c h a r a c t e r w i t h c o n s i d e r a b l e f r u i t and g r a p e p roduc t ion . Some l i g h t i n d u s t r y has s e t t l e d i n t h e a r e a and t h e e x t r a c t i o n o f pe t ro leum i s under way.
Regarding t h i s background t h e s p e c i a l importance o f d e l i b e r a t e wate r management i n t h e T i s z a River Basin w i l l be r e a d i l y a p p r e c i - a t e d a s e s s e n t i a l t o t h e development of t h e n a t i o n a l economy, a s w e l l a s f o r t h e improvement of t h e l i v i n g s t a n d a r d o f t h e popu- l a t i o n . The avo idance o f wa te r r e l a t e d damages, p r o v i s i o n s f o r a d e q u a t e s u p p l i e s t o meet t h e growing w a t e r demands o f i n d u s t r y , o f a g r i c u l t u r e and of t h e s e t t l e m e n t s , a s w e l l a s t h e p r o t e c t i o n o f t h e p o p u l a t i o n from p o l l u t i o n a r e i m p o s s i b l e , u n l e s s t h i s p a r t i c u l a r branch of t h e n a t i o n a l economy i s developed a t a r a t e commensurate w i t h t h e g e n e r a l development o f t h e economy.
2.3 D e s c r i p t i o n o f Water Management
2.3.1 Damage C o n t r o l
2 Of t h e 93,000 km a r e a o f Hungary, 25% i s p r o t e c t e d from i n u n d a t i o n by l e v e e s of 4,200 km i n a g g r e g a t e l e n g t h . The g r e a t e r p a r t of t h i s a r e a , namely 18,000 km2, i s l o c a t e d i n t h e T i s z a V a l l e y .
Comprehensive f l o o d c o n t r o l development i n t h e Grea t P l a i n s was s t a r t e d a l o n g t h e T i s z a River i n 1846. To a p p r e c i a t e t h e volume o f work invo lved , it should be no ted t h a t i n Hungary t h e 18,000 km2 of f l o o d p l a i n s i n t h e T i s z a V a l l e y a r e p r o t e c t e d by a system of l e v e e s e x t e n d i n g o v e r 2,900 km l e n g t h ( F i g u r e 5 ) . The e x t e n t of l e v e e c o n s t r u c t i o n and r e l a t e d f l o o d w a t e r regu- l a t i o n on t h e T i s z a River i s shown i n Tab le 3.
A s a consequence o f f l o o d w a t e r r e g u l a t i o n performed i n t h e i n t e r e s t of a c c e l e r a t i n g t h e passage of f l o o d s , t h e t o t a l l e n g t h o f t h e r i v e r was reduced from 1,419 t o 966 km. The approx imate ly 1 ,000 km l e n g t h o f t h e Hungarian r e a c h was s h o r t e n e d t o 597 km. By c u t t i n g 114 overdeveloped bends, new c h a n n e l s e c t i o n s x r e excava ted t h a t a r e over 136 km i n t o t a l l e n g t h . A s a r e s u l t o f r e g u l a t i o n work, t h e s l o p e of t h e r i v e r became s t e e p e r , and a s a consequence t h e t r a v e l t ime of f l o o d s was reduced. Diking was of c o n s i d e r a b l e i n f l u e n c e on water-conveying c o n d i t i o n s . The w a t e r s f lowing e a r l i e r o v e r t h e f l o o d p l a i n s have been c o n f i n e d

t o t h e f l o o d bed between t h e l e v e e s . The c o n d i t i o n s of s e d i - ment t r a n s p o r t and channe l development were modif ied a s r e f l e c t e d by e x t e n s i v e s cou r ing and deepening of t h e channe l . Low water s t a g e s dec r ea sed by 2 m on t h e average , whi le f l o o d s t a g e s d i s - p l a y a g e n e r a l l y i n c r e a s i n g t r e n d (Table 4 ) .
Figure 5. Reclaimed areas in the Tisza Valley.
A f t e r exp lo r i ng t h e c a u s e s o f t h e s e phenomena we have con- c luded t h a t t h e me t eo ro log i ca l e lements t r i g g e r i n g t h e f l o o d s have remained e s s e n t i a l l y unchanged i n t h e T i s za River catchment over t h e per iod under s t udy , bu t t h e f a c t o r s c o n t r o l l i n g runof f have s u f f e r e d a p p r e c i a b l e changes. I n t h e upstream mountain p a r t o f t h e catchment , c o n d i t i o n s have a l s o a l t e r e d cons ide r ab ly , a consequence of which i s t h a t t h e t imes of con- c e n t r a t i o n have become s h o r t e r a l ong t h e headwater r e aches . Owing t o t h e hydrometeoro log ica l ly nonuniform c h a r a c t e r o f t h e upstream subcatchments , t h e a r e a l development o f t h e f l ood waves i s h i g h l y v a r i a b l e and t h e f l ood c o n t r i b u t i o n o f t h e a r e a d r a ined d i r e c t l y by t h e main r e c i p i e n t i s inadequa te t o compensate f o r t henc

e f f e c t s . The r e s u l t of t h e s e i n t r i c a t e r e l a t i o n s h i p s has been termed t h e f lood exposure , d e f i n e d a s t h e p r o d u c t o f t h e h e i g h t of overbank s t a g e s and t h e i r d u r a t i o n , t h a t is, c m x number o f days . The v a r i a t i o n o f t h i s c h a r a c t e r i s t i c a l o n g t h e r i v e r is i n d i c a t i v e o f t h e a d v e r s e e v o l u t i o n o f f l o o d exposures . I t w i l l be observed t h a t whereas t h e f l o o d exposures t e n d t o d e c r e a s e a l o n g t h e upper Hungarian s e c t i o n of t h e T i s z a River , t h e y have been i n c r e a s i n g c o n s i d e r a b l y down-stream of t h e Zagyva River .
The p r e s e n t f l o o d s a f e t y c r e a t e d by a tremendous e f f o r t i n t h e T i s z a V a l l e y h a s been t h u s s u c c e s s i v e l y reduced by t h e env i ronmenta l changes accompanying economic e v o l u t i o n i n t h e catchment . T h i s d e t e r i o r a t i o n must be o f f s e t by advanced, com- p l e x w a t e r management and environment c o n s e r v a t i o n measures.
Table 3. C h a r a c t e r i s t i c d a t a of r i v e r t r a i n i n g .
Length of r i v e r Lengths Number Lengths Average s l o p e
R ive r b e f o r e a f t e r of of of b e f o r e a f t e r r i v e r d r a i n i n g c u t s bending c u t s r i v e r d r a i n i n g
km km km c u t s km cmlkm
T i s z a 2
1 ,419 966 136 114 589 3.7 6
Maro s 1
8 6 50 - 13 14 24 - HQrmas-Koros 234 9 1 3 4 39 177 2 5.7
Ket tos-K6ros 2
84 37 2 5 15 70 4 8
FehCr-KorBs 3 126 6 7 2 5 8 1 84 - -
Fekete-Karos 166 90 26 6 1 102 - - ~ e b e s - ~ t 3 r ~ s ' 162 8 6 5 3 24 129 - - Bere t ty6
3 269 91 51 46 229 - -
Sz am0 s 3
187 108 - 3 6 - - - Bodrog
1 84 50 - 8 - 3.5 -
'over t h e Hungarian r each
20ver t h e t o t a l l eng th
30ver t h e r e g u l a t e d r each .

Table 4 . Area protected from floods and peak stages.
Year Protected area in the percentage Peak stage i n Szeged of the whole flood-plain cm
About 4 5 % of t h e t e r r i t o r y o f Hungary, i n c l u d i n g t h e f l o o d p l a i n , i s exposed t o i n u n d a t i o n by undrained r u n o f f and by r i s i n g groundwater . Almost 80% o f t h i s a r e a is l o c a t e d i n t h e catchment o f t h e T i s z a River . A t p r e s e n t , a c a n a l network of o v e r 25,000 km t o t a l l e n g t h and pumping s t a t i o n s w i t h an aggre- g a t e d i s c h a r g i n g c a p a c i t y of c l o s e t o 500 m3/sec a r e a v a i l a b l e f o r p r o v i d i n g d r a i n a g e t o t h e s e w a t e r s . Although t h i s is t h e r e g i o n w i t h t h e d r y e s t c l i m a t e i n t h e c o u n t r y , t h e s o i l and topography a r e a d v e r s e enough t o c a u s e minor o r major i n u n d a t i o n damages a l m o s t e v e r y y e a r .
Although t h e f l o o d and d r a i n a g e c o n t r o l sys tems i n t h e T i s z a V a l l e y have been developed a t a c c e l e r a t i n g r a t e s d u r i n g t h e p a s t decades , t h e e x t e n t and c o n t r o l c a p a c i t y t h e r e o f h a s s t i l l n o t a t t a i n e d t h e l e v e l commensurate t o t h a t of t h e s o c i o - economic development. T h i s has been demons t ra ted s t r i k i n g l y by t h e f l o o d i n 1970. Exper iences ga ined d u r i n g t h i s f l o o d and t h e advances i n techno-economic c o n d i t i o n s have been t a k e n i n t o c o n s i d e r a t i o n i n d e l i n e a t i n g t h e t r e n d s o f f u r t h e r develop- ment.
I n t h e c o u r s e of improvement work on t h e f l o o d c o n t r o l system envisaged up t o 1985, t h e l e v e e s w i l l be r e i n f o r c e d by a b o u t 100 m i l l i o n m3 of e a r t h t o o f f e r r e l i a b l e p r o t e c t i o n a g a i n s t t h e f l o o d s of 1% p r o b a b i l i t y . Along a r e a s o f h i g h

socio-economic v a l u e (u rban a r e a s , i n d u s t r i a l p l a n t s ) t h e 150-years f l o o d and, e x c e p t i o n a l l y , t h e 1000-years f l o o d , h a s been adop ted a s t h e d e s i g n c r i t e r i o n , w h i l e a l o n g l e s s v a l u a b l e a r e a s t h e 50-to-80-year f l o o d h a s been adop ted a s t h e d e s i g n c r i t e r i o n .
I n t h e d r a i n a g e sys tems , t h e m o d e r n i z a t i o n o f e x i s t i n g s t r u c t u r e s w i l l be accompanied by i n c r e a s i n g t h e d e n s i t y o f t h e c a n a l network w i t h s p e c i a l emphasis t o t h e minor c a n a l s i n t h e fa rming o p e r a t i o n s . Along w i t h t h e s e a v a r i e t y o f c o n t r o l l e d d r a i n a g e methods is env i saged . These compr i se t h e c r e a t i o n o f around 400 m i l l i o n m3 s t o r a g e volume f o r t h e r u n o f f w a t e r s which w i l l be made a v a i l a b l e f o r subsequen t u s e s .
2 .3 .2 Water U s e s
Under t h e extreme n a t u r a l c o n d i t i o n s d r o u g h t d i s a s t e r s a r e n o t uncommon i n t h e T i s z a V a l l e y w i t h damages e x t e n d i n g normal ly t o t h e e n t i r e p l a i n p a r t o f t h e ca tchment . To i l l u s t r a t e t h e e x t e n t o f a r i d i t y , it i s of i n t e r e s t t o n o t e t h a t i n t h e p e r i o d from May t o August t h e number o f r a i n l e s s d a y s e x c e e d s 12 i n e v e r y t h i r d y e a r and 20 i n e v e r y t e n t h y e a r . I r r i g a t i o n develop- ment i n t h e T i s z a V a l l e y was s t a r t e d i n 1950 f o l l o w i n g t h e l a r g e - s c a l e r e o r g a n i z a t i o n of a g r i c u l t u r e and by 1973 260,000 h e c t a r e s had been equipped f o r i r r i g a t i o n .
Water s u p p l y h a s become i n c r e a s i n g l y t h e f a c t o r c o n t r o l l i n g t h e method of p r o d u c t i o n i n t h e a g r i c u l t u r a l o p e r a t i o n s . Be- s i d e s t h e l a r g e s c a l e u s e o f mechan ica l equipment , i n c r e a s i n g emphasis i s p laced on t h e a p p l i c a t i o n o f c o o r d i n a t e d machine f l e e t s f o r t h e complex methods o f p r o d u c t i o n . F e r t i l i z e r i s a p p l i e d a t t h e a v e r a g e r a t e o f 590 k g / h e c t a r e . I n t h e deve lop- ment programs o f a g r i c u l t u r e , t h e i n t r o d u c t i o n o f i r r i g a t i o n i s c o n s i d e r e d p r e f e r a b l e o v e r a t l e a s t 18% of t h e a r a b l e l a n d s up t o 1985. Along w i t h i r r i g a t i o n , t h e c o n s t r u c t i o n o f f i s h ponds is a l s o e n v i s a g e d , e s p e c i a l l y i n s a l i n e a r e a s s u p p o r t i n g poor c r o p s . The p r e s e n t pond a r e a o f 16,000 h e c t a r e s w i l l be i n c r e a s e d t o 26,000 t o 28,000 h e c t a r e s .
A l a r g e number of i n h a b i t a n t s grouped i n a l o o s e housing p a t t e r n is c h a r a c t e r i s t i c o f t h e s e t t l e m e n t s i n t h e G r e a t P l a i n s . I n t h e s e , r u r a l wa te r supp ly i s prov ided t o 56% of t h e p o p u l a t i o n . The s i t u a t i o n i n t h e f i e l d of sewerage and w a s t e t r e a t m e n t i s l e s s f a v o r a b l e , and a t p r e s e n t no more t h a n 16% of t h e a r e a i n - h a b i t e d is s e r v e d by sewers . I n p r o s p e c t i v e development pro- grams o f t h e n a t i o n a l economy, it is e n v i s i o n e d t h a t by 1985 t h e r u r a l w a t e r s u p p l y w i l l be extended t o 85% o f t h e p o p u l a t i o n and sewer f a c i l i t i e s t o a l m o s t 60%.
The a n n u a l f r e s h w a t e r demand o f i n d u s t r y i n t h e T i s z a V a l l e y i s c u r r e n t l y around 1 x l o 9 m3, and it i s expec ted t o d o u b l e by 1985. The r a t e o f r e c y c l i n g i s 57%. Owing t o t h e g r a d u a l e x h a u s t i o n and i n s u f f i c i e n c y o f l o c a l s u p p l i e s , t h e s u c c e s s i v e l y growing r u r a l , u rban and i n d u s t r i a l w a t e r demands w i l l be met by t h e c o n s t r u c t i o n of r e g i o n a l w a t e r works.

Over t h e Hungarian s e c t i o n of t h e T i s z a V a l l e y , t h e s l o p e o f t h e r i v e r s is i n a d e q u a t e t o make wate r power development a t t r a c t i v e . The power s t a t i o n i n c o r p o r a t e d i n t h e Kiskore Bar rage h a s an i n s t a l l e d c a p a c i t y of 45 mw and produces about 180 m i l l i o n kwh of h y d r o e l e c t r i c power i n a n a v e r a g e y e a r .
The u n c a n a l i z e d s e c t i o n s o f t h e T i s z a River and i t s t r i b - u t a r i e s a r e n a v i g a b l e o n l y a t c e r t a i n t i m e s of t h e y e a r . I n t h e r i v e r system, t h e waterway, s u i t e d f o r n a v i g a t i o n by v e s s e l s up t o about 1,500 t o n s , is 300 km long , b u t it is l i t t l e used owing p r i m a r i l y t o t h e absence o f a c o n n e c t i o n t o t h e Danube. Waterway development w i l l b e s e r v e d by t h e c a n a l i z a t i o n o f t h e T i s z a River and by t h e c o n s t r u c t i o n of a Danube-Tisza Canal . The l a t t e r w i l l p r o v i d e a l i n k between t h e waterways i n t h e T i s z a V a l l e y and t h e Trans-European Danube-Main-Rhine waterway.
The a v e r a g e r u n o f f volume c a r r i e d by t h e T i s z a River p a s t t h e Szeged gauge i s 25.109 m3, more t h a n 95% of which o r i g i n a t e s i n t h e u s t r e a m c o u n t r i e s . The annua l r u n o f f r a n g e s from 11 t o 5 50.109 m . I n an a v e r a g e y e a r 52% o f t h e t o t a l r u n o f f is con- veyed d u r i n g t h e w i n t e r h a l f y e a r , b u t i n ex t reme c a s e s t h i s may i n c r e a s e t o a s much a s 75%.
One of t h e g r a v e s t problems f a c i n g wate r management i n Hungary is t h a t t h e bu lk , a lmos t t h r e e - q u a r t e r s , of t h e w a t e r demand a r i s e s i n t h e T i s z a V a l l e y , whereas i n t h e c r i t i c a l August p e r i o d t h e a v a i l a b l e s u p p l i e s i n t h i s r e g i o n a r e o n l y o n e - f i f t h o f t h e s u r f a c e w a t e r r e s o u r c e s o f t h e c o u n t r y .
The c h a r a c t e r and peak v a l u e of t h e a n n u a l d i s t r i b u t i o n o f wa te r demands i n t h i s r e g i o n a r e governed i n g e n e r a l by i r r i g a t i o n u s e s . I n t h i s r e s p e c t , knowledge of t h e r u n o f f p a t t e r n i n t h e growing season is of paramount importance ( F i g u r e 6 ) . Ac tua l wa te r u s e s a r e i n f l u e n c e d a l s o by more o r less random e f f e c t s , s o t h a t b o t h wate r demands, and t h e s u p p l i e s a r e j u s t i f i e d t o b e r e g a r d e d a s random v a r i a b l e s . Consequent ly a n i n v e s t i g a t i o n h a s been s t a r t e d on t h e development of s t o c h a s t i c w a t e r b a l a n c e methods.
I n t h e p e r i o d from 1970 t o 1985 t h e o v e r a l l a n n u a l wa te r demands a r e expec ted t o i n c r e a s e 2 t o 2.5 t i m e s , t h e r a t e o f i n - c r e a s e i n t h e growing season b e i n g 1 . 5 t o 2 - fo ld . From t h e s t u d y on t h e a r e a l and temporal d i s t r i b u t i o n of wa te r s u p p l i e s and de- mands w e concluded t h a t a s i d e from t h e growing season t h e n a t u r a l wa te r s u p p l i e s a r e a t p r e s e n t g e n e r a l l y s u f f i c i e n t t o m e e t demands. During t h e growing season , however, t h e e q u i l i b r i u m of t h e w a t e r b a l a n c e can b e main ta ined even under t h e p r e s e n t con- d i t i o n s by means of t h e e x i s t i n g 200 m i l l i o n m3 s t o r a g e volume. The wate r s h o r t a g e r e f l e c t e d by t h e w a t e r b a l a n c e f o r t h e growing season compiled f o r 1975 on t h e b a s i s o f d a t a c o r r e l a t e d w i t h t h e upstream c o u n t r i e s i s composed of t h e monthly d a t a f o r t h e i n d i v i d u a l subcatchments (Tab le 5 ) . By around 1985 it w i l l

become n e c e s s a r y t o augment t h e p r e s e n t s u p p l i e s by a b o u t 1 x 1 0 ~ m3 t o i n c r e a s e t h e s u p p l i e s d u r i n g t h e growing season i n d r o u g h t y e a r s .
. . . . i 2 s (O 15 20 30 40 eo so
OURATION. DAYS
Figure 6. Dry weather flows of different duration and frequency a
recurrence in the Tisza River during the irrigation season lf at Szeged.
Table 5. Water balance in the Szeged section of the Tisza River, May-September, 1975.
3 million m /5months
Water resources of 80% duration 4,810
Water left in the channel 900
Net water demand 2,640
Storage 660
Available 2,330
Water Deficiency 400
Remark: Values refer to the whole catchment upstream of Szeged.

The major p r o j e c t s t o be r e a l i z e d under t h e T i s z a River c a n a l i z a t i o n programme ( F i g u r e 7 ) and t h e more e f f i c i e n t o p e r a t i o n o f t h e wate r supp ly systems w i l l make a d d i t i o n a l wa te r r e s o u r c e s a v a i l a b l e f o r u s e . The f i r s t b a r r a g e on t h e T i s z a River was i n a u g u r a t e d i n 1954 a t T i s z a l o k . By means o f t h i s p r o j e c t , d i v e r s i o n a t t h e r a t e of 60 m 3 / s e c was made t o i r r i g a t e 150,000 h e c t a r e s , f o r supp ly ing f i s h ponds and f o r t r a n s f e r r i n g wate r t o t h e Koros Val ley ; moreover 55 m i l l i o n kwh of h y d r o e l e c t r i c power have become a v a i l a b l e a n n u a l l y a t 14 mw peak c a p a c i t y and a 130 km long r i v e r s e c t i o n was opened t o n a v i g a t i o n . A t t h e same t i m e t h e p o s s i b i l i t y was c r e a t e d f o r meet ing growing wate r demands i n t h e a r e a o f Debrecen town.
An impor tan t s t e p i n t h e c a n a l i z a t i o n o f t h e Hungarian T i s z a River i s t h e Kiskore Barrage, where o p e r a t i o n was s t a r t d i n 1973. I n t h e u l t i m a t e s t a g e o f development , 400 m i l l i o n m 5 of w a t e r w i l l be s t o r e d between t h e f l o o d l e v e e s and t h i s s t o r a g e c o n t r i b u t e s t o balanced runof f c o n d i t i o n s i n t h e r i v e r . The d i s - c h a r g e a v a i l a b l e f o r d i v e r s i o n from t h e r i v e r w i l l be i n c r e a s e d by 175 m3/sec. T h i s w i l l be used f o r i r r i g a t i n g 300,000 h e c t a r e s , f o r s u p p l y i n g 12,000 h e c t a r e s o f f i s h ponds, and t o m e e t con- s i d e r a b l e i n d u s t r i a l wa te r demands. A t t h e power s t a t i o n , 100 m i l l i o n kwh of electr ic power a r e produced a n n u a l l y . The b a r r a g e w i l l make permanent n a v i g a t i o n p o s s i b l e over a 120 km long r i v e r r e a c h and t h e r e s e r v o i r w i l l c r e a t e f a v o r a b l e c o n d i t i o n s f o r r e c r e a t i o n and wate r s p o r t s .
The Csongr6d Bar rage , on which d e s i g n work is under way, t h e Upper-Tisza Bar rage , t o be r e a l i z e d by t h e t u r n o f t h e c e n t u r y , and t h e Novi-Betshey Bar rage , under c o n s t r u c t i o n i n Yugoslavia , w i l l complete t h e c a n a l i z a t i o n o f t h e T i s z a River . I n t h e i n t e r e s t o f runof f c o n t r o l , a number of a d d i t i o n a l s t o r a g e r e s e r v o i r s a r e n e c e s s a r y i n p l a i n and h i l l y a r e a s a l i k e , and w a t e r t r a n s f e r from t h e Danube w i l l become e s s e n t i a l ( F i g u r e 7 ) . I n t h e T i s z a Val ley f low augmentat ion system t h u s deve loped , t h e p r o j e c t s of wa te r u t i l i z a t i o n and damage c o n t r o l w i l l be com- b ined o r g a n i c a l l y , c r e a t i n g t h u s t h e p o s s i b i l i t i e s f o r o p t i m a l f low regime c o n t r o l t o meet v a r i a b l e , complex demands.
Changes i n wate r q u a l i t y a r e t a k e n a l s o i n t o c o n s i d e r a t i o n a l o n g w i t h t h e q u a n t i t y c h a r a c t e r i s t i c s of w a t e r r e s o u r c e s i n t h e T i s z a V a l l e y . The wate r i n t h e T i s z a River upstream of t h e Bodrog and downstream of t h e Zagyva River is q u a l i f i e d " c l e a n " ( C l a s s I ) . Of t h e t r i b u t a r i e s t h e wate r i n some s e c t i o n s of t h e Tur Creek and t h e Koros R i v e r s i s c l e a n , t h e rest be ing more o r less p o l l u t e d . The S a j 6 , t h e ~ e r n h d , t h e Bodrog and t h e Szamos R i v e r s a r e g r e a t l y p o l l u t e d . I n Hungary l e g a l r e g u l a t i o n s and economic i n c e n t i v e s s e r v i n g t h e i n t e r e s t of p o l l u t i o n c o n t r o l have r e s u l t e d i n r e t a r d i n g t h e f a s t r a t e of p o l l u t i o n i n t h e r e c i p i e n t s For s t o p p i n g f u r t h e r p o l l u t i o n and f o r improving wate r q u a l i t y i n t h e r e c i p i e n t s f u r t h e r e f f e c t i v e measures a r e c o n s i d e r e d neces- s a r y .

DANLl BE - - 7
TISZALOKI , BARRAGE q
Figure 7. Schematical drawing of water management projects contemplated in the Tisza Valley.
3 . EARLIER SYSTEMS ANALYSES
3.1 N e c e s s i t y of Systems Analyses
I n t h e T i s z a V a l l e y t h e sys tems approach i s war ran ted by t h e n e c e s s i t y o f s o l v i n g t h e f o l l o w i n g problems o f major i m - p o r t a n c e :
1 ) The n a t u r a l f l o w regime i n t h e system i s unbalanced i n space and t i m e a l i k e . Water s h o r t a g e s occur a t a number o f p o i n t s , w h i l e s i m u l t a n e o u s l y water i s a v a i l a b l e i n abundance a t o t h e r p l a c e s . The s u p p l i e s a r e lowes t a t t i m e s o f g r e a t e s t demands.
2 ) I n t h e T i s z a Val ley , f l o o d s w i t h i n u n d a t i o n p o t e n t i a l o c c u r e v e r y t h i r d y e a r on t h e average .
3 ) The undrained r a i n w a t e r i n t h e p l a i n s c a u s e s c o n s i d e r a b l e damage i n t h e s p r i n g season t o bo th a g r i c u l t u r e and b u i l d i n g s .
4 ) Cons ider ing t h e e n t i r e r i v e r b a s i n , human i n t e r f e r e n c e w i t h t h e n a t u r a l f low regime and r e g i o n a l development

have brought about the following consequences in the Hungarian part of the Tisza Valley:
- higher floods occur with greater frequency,
- the flow available in the rivers decreases, and
- the waters are increasingly polluted.
5) The value of the areas protected from floods and from undrained rainwater has increased in the wake of economic growth.
6) The demand for domestic, industrial and irrigation water, as well as for recreation, has increased rapidly.
The above conflicting interests are stimulated by complex natural and economic processes which occur often with a random character in space and time alike. It is already considered desirable to control the system as far as possible in a manner to minimize the adverse social-economic consequences of these conflicts. The same principle applies to future development as well.
For adjusting the water supplies in space and time to the demands of the water users, the key factors of a water manage- ment system, namely the major water projects were realized during the past decades in the Tisza Valley. The provision and distribution of water for domestic, industrial and irrigation uses, and the avoidance of water damages (from flood control, drainage) have been identified as their primary purposes.
With the construction of the second barrage and the reali- zation of the connecting network of irrigation canals (Figure 71, the system has developed into a complex one which a few years ago called for the introduction of systems analyses for the guidance, supervision and control of the water volumes handled.
3.2 Control Model of the System
3.2.1 Water Management
The water distribution model of the Tisza Valley Water Management System (see D6vid and Szigy6rtc-5, 1973) has been developed with the aim of meetina the demands of asrfcultural water ises by the most ef f icientawater distribution decisions. The objective is to adjust the water supplies which are variable in time, space, volume and quality to the similarly variable user demands in the system, and to ensure the fastest drainage under the prevailing requirements relying for these purposes on the appropriate mathematical models. The units of the model system developed thus far do not comprise the entire existing physical system but extentl only to the irrigation sections involved in the ~iszalok irrigation project.

Depending on t h e c o n d i t i o n s of w a t e r d i s t r i b u t i o n , two b a s i c modes a r e d i s t i n g u i s h e d i n t h e o p e r a t i o n of t h e wate r management systems t o be s i m u l a t e d i n t h e model. These modes a r e r e f e r r e d t o a s normal and r e s t r i c t i v e o p e r a t i o n . Normal o p e r a t i o n i s p r a c t i c e d when t h e s u p p l i e s a v a i l a b l e and t h e conveying c a p a c i t y of t h e system a r e adequa te f o r meet ing t h e demands. I n t h e r e s t r i c t i v e mode of o p e r a t i o n d i v e r s e c o n s t r a i n t s must be i n t r o d u c e d because t h e s u p p l i e s and/or t h e conveying c a p a c i t y is i n a d e q u a t e t o meet t h e p r e v a i l i n g demand. The normal mode of o p e r a t i o n is p r e v a l e n t v i r t u a l l y o v e r t h e e n t i r e l e n g t h of t h e o p e r a t i o n p e r i o d . I n t h e r e l a t i v e l y r a r e r e s t r i c t i v e mode of o p e r a t i o n t h e o p t i m a l u s e of w a t e r s u p p l i e s assumes s p e c i a l s i g n i f i c a n c e i n w a t e r management.
The f i r s t component o f t h e model system compr i ses t h e s e t o f programs of wate r d i s t r i b u t i o n i n upstream c o n t r o l l e d i r r i g a - t i o n s e c t i o n s , by which t h e i n t a k e g a t e i s c o n t r o l l e d a t a r a t e , a t i n t e r v a l s n o t s h o r t e r t h a n 30 minu tes , t o meet t h e i r r i g a t i o n demand i n t h e s e c t i o n w i t h o u t undue wate r l o s s e s .
The second component of t h e model system s e r v e s t o c o n t r o l w a t e r d i s t r i b u t i o n i n t h e ~ i s z a l o k I r r i g a t i o n P r o j e c t . For bo th modes o f o p e r a t i o n t h e p r o c e s s o f w a t e r conveyance i s d e s c r i b e d by t h e d i s t r i b u t i o n of wa te r volumes r e q u i r e d o r conveyed d u r i n g d i s c r e t e , independent i n t e r v a l s , d i s r e g a r d i n g v a r i a t i o n s i n d i s - c h a r g e w i t h i n t h e s e p e r i o d s o f t ime .
The e n t i r e wate r conveyance system i s r e s o l v e d i n t o s e c t i o n s ( l i n e s ) w i t h each s e c t i o n - p r i n c i p a l c a n a l o r r e a c h forming a l i n e a l o n g which conveyance can be c o n t r o l l e d . I n t h e model t h i s system i s r e p r e s e n t e d by an o r i e n t e d network f o r t h e mathe- m a t i c a l d e s c r i p t i o n r e q u i r i n g t h e f o l l o w i n g c o n s t a n t s :
- t h e maximum c a p a c i t y o f t h e i n d i v i d u a l l i n e s a t t h e e n t r a n c e and d e p a r t u r e p o i n t s t h e r e o f ,
- t h e wate r l o s s e s a l o n g t h e l i n e s ,
- t h e f u n c t i o n s t x v ( v ) r e p r e s e n t i n g t h e conveyance t ime i n - -
t h e i n d i v i d u a l l i n e s , where ( x , y ) i s t h e symbol of t h e l i n e , V i s t h e wate r volume conveyed d u r i n g a p a r t i c u l a r p e r i o d of t i m e , t is t h e conveyance t i m e .
T h i s l a t t e r q u a n t i t y i s needed f o r t h e normal model o n l y .
I n t h e normal model t h e o b j e c t i v e f u n c t i o n and t h e t h r e e c o n s t r a i n t s r e p r e s e n t t h e f o l l o w i n g r e s t r i c t i o n s concern ing t h e w a t e r volumes t o be conveyed a l o n g t h e i n d i v i d u a l l i n e s :
- Even t h e h i g h e s t v a l u e o f t h e conveyance t i m e s a long t h e i n d i v i d u a l l i n e s should be t h e lowes t p o s s i b l e .
- The c o n d i t i o n s r e p r e s e n t e d by t h e c a p a c i t y l i m i t s should be observed.

- The c o n t i n u i t y c r i t e r i a a t t h e j u n c t i o n p o i n t s shou ld be s a t i s f i e d .
- The demand a l o n g t h e i n d i v i d u a l l i n e s should be met.
The r e s u l t of t h e computat ion-- the " p o t e n t i a l flow'' o b t a i n e d b e f o r e t h e l a s t s t e p of s u c c e s s i v e approx imat ion- -y ie lds f o r t h e i n d i v i d u a l l i n e s of t h e network t h e d i s c h a r g e s t o b e i n t r o d u c e d and t o be removed d u r i n g a p a r t i c u l a r p e r i o d of t ime .
The c o n s t r a i n t s i n t h e r e s t r i c t i v e model r e p r e s e n t sub- s t a n t i a l l y t h e f i r s t t h r e e r e q u i r e m e n t s of t h e normal model and an a d d i t i o n a l r e s t r i c t i o n i s imposed t o e n s u r e t h e o b s e r v a t i o n of a s p e c i f i e d p r i o r i t y sequence i n t h e computat ion of t h e "poten- t i a l f lows" p e r m i t t i n g t h e demands t o be met (by an o u t - o f - k i l t e r a l g o r i t h m ) by t h e i r s u p e r i m p o s i t i o n a l o n g t h e i n d i v i d u a l l i n e s .
A t p r e s e n t , t h e o p e r a t i n g i n s t r u c t i o n s a r e de te rmined f o r 12 hour p e r i o d s (dayt ime and n i g h t o p e r a t i o n ) by t h e models. The d a t a and r e s u l t s a r e t r a n s m i t t e d between t h e i r r i g a t i o n s e c t i o n s and t h e computer c e n t e r by t e l e t y p e . Development work i s under way on t h e model w i t h t h e o b j e c t i v e of c o n t r o l l i n g f lows i n t h e T i s z a and Koros V a l l e y s s i m u l t a n e o u s l y . A m u l t i - s t a g e , s t o c h a s t i c programming model h a s been compiled f o r t h e optimum d e s i g n and c o n t r o l of a system c o n s i s t i n g o f mul t i -purpose , s e r i e s - c o n n e c t e d s t o r a g e r e s e r v o i r s ( s e e Prekopa and I j j a s , 1974) .
Three r e s e r v o i r s a r e c o n s i d e r e d i n t h i s model, two of which, t h e ~ i s z a l o k and Kiskore , have f i x e d c a p a c i t i e s , whi le t h e c a p a c i t y o f t h e t h i r d , t h e Csongrsd, is a d e c i s i o n v a r i a b l e . The d i f f e r e n t k i n d s of wa te r demand a r e i n t r o d u c e d a c c o r d i n g t o u t i l i z a t i o n a s wate r volumes a v a i l a b l e a t t h e " t a p s " o f t h e i n d i v i d u a l r e s e r v o i r s . I n t h e model t h e c o n t r o l p e r i o d is r e s o l v e d i n t o d i s c r e t e i n t e r v a l s ; a t t h e beg inn ing o f t h e o p t i - m i z a t i o n p r o c e s s f u l l r e s e r v o i r s a r e assumed, and t h e c o n t r o l p e r i o d i s t e r m i n a t e d a t t h e n e x t h i g h wate r p e r i o d . The v a r i a t i o n i n r e s e r v o i r s t a t e s t h u s s u b s t a n t i a l l y f o l l o w s a r e g e n e r a t i o n p r o c e s s . I n each r e s e r v o i r and i n each p e r i o d , t h e v a r i a t i o n s of s t o r a g e volumes a r e r e s t r i c t e d by imposing lower and upper l i m i t s on t h e wate r l e v e l s ( p e r m i t t i n g a f l u c t u a t i o n of about 30 cm). The c o n s t r a i n t s on t h e d e t e r m i n i s t i c b a s i c model o f decomposed s t r u c t u r e r e p r e s e n t t h e h y d r o l o g i c and c a p a c i t y r e s t r i c t i o n s , a s w e l l a s t h e c r i t e r i a s p e c i f i e d f o r t h e s t o r a g e volumes. The d e c i s i o n v a r i a b l e s comprise t h e w a t e r volumes r e l e a s e d from t h e i n d i v i d u a l r e s e r v o i r s f o r d i v e r s e purposes . The o b j e c t i v e func- t i o n o f t h e l i n e a r model r e p r e s e n t s t h e d e s i r a b i l i t y of maximum u t i l i z a t i o n of t h e wate r volumes r e l e a s e d o v e r t h e e n t i r e c o n t r o l p e r i o d , r e d u c i n g t h e b e n e f i t a t t a i n e d by t h e c o n s t r u c t i o n c o s t s of t h e r e s e r v o i r (o f unknown c a p a c i t y ) t o b e r e a l i z e d . The m u l t i - s t a g e c h a r a c t e r of t h e s t o c h a s t i c programming model com- p i l e d on t h e f o r e g o i n g b a s i s e n s u r e s t h e dynamic n a t u r e of p r o c e s s c o n t r o l . I n accordance w i t h t h e p r i n c i p l e fundamental t o t h e s t o c h a s t i c model, t h e c o n t r o l p o l i c y i s n o t d e c i d e d upon f i r m l y a t t h e beg inn ing of t h e c o n t r o l s t a g e of t h e p r o c e s s , a l t h o u g h t h e d e c i s i o n i s adopted i n a n t i c i p a t i o n o f t h e e n t i r e c o n t r o l p e r i o d .

A f u r t h e r model h a s been fo rmula ted f o r t h e o p t i m a l d i s t r i b u t i o n o f t h e w a t e r r e s o u r c e s i n f l u e n c e d by t h e T i s z a l o k and Kisk6re B a r r a g e s (see Prekopa and I j j a s , 1 9 7 4 ) . The ob- j e c t i v e o f t h e model i s t o d e t e r m i n e a way o f d i s t r i b u t i n g w a t e r volumes a r r i v i n g i n , and s t o r e d above, Kiskore from which t h e h i g h e s t b e n e f i t s w i l l a c c r u e t o t h e n a t i o n a l economy, t a k i n g i n t o c o n s i d e r a t i o n t h e mul t i -purpose u s e s o f w a t e r , e a c h o f which may r e s u l t i n d i f f e r e n t economic b e n e f i t s . Concerning i t s c h a r a c t e r , t h i s model i s a d e t e r m i n i s t i c one w i t h mixed ( l i n e a r and dynamic) programming. The d i s t r i b u t i o n o f s u p p l i e s a v a i l a b l e w i t h i n a s i n g l e t i m e p e r i o d - - t h e d e t e r m i n a t i o n o f t h e o p t i m a l d i s t r i b u t i o n of t h e s u p p l i e s o v e r s e v e r a l t i m e i n t e r v a l s w i t h i n t h e f u l l c o n t r o l p e r i o d is computed by a dynamic pro- gramming model. The l i n e a r programming model i s used f o r d e t e r - mining t h e o p t i m a l s u b p o l i c y , t h e v a r i a b l e s o f which a r e t h e w a t e r volumes c l a s s i f i e d a c c o r d i n g t o l o c a t i o n and purpose o f use . These l a t t e r i n c l u d e a g r i c u l t u r e , communal and i n d u s t r i a l s u p p l i e s , t r a n s f e r s t o o t h e r sys tems , peak-load g e n e r a t i o n and power p r o d u c t i o n i n o f f -peak p e r i o d s . The c o n s t r a i n t s i n t h e model r e p r e s e n t t h e f o l l o w i n g r e s t r i c t i o n s :
- t h e h y d r o l o g i c a l r e s t r i c t i o n s on t h e w a t e r s u p p l i e s t h a t can be a l l o c a t e d ,
- t h e t e c h n i c a l ( c a p a c i t y ) r e s t r i c t i o n s on wa te r u s e s ( d i v e r s i o n s ) ,
- t h e a c t u a l u s e s must n o t exceed t h e demands.
The o b j e c t i v e f u n c t i o n o f t h e l i n e a r model is:
where
k is t h e number o f v a r i a b l e s ; Vi i s t h e w a t e r volume used f o r a p a r t i c u l a r purpose;
Bi i s t h e n e t economic b e n e f i t p e r u n i t volume used
f o r a p a r t i c u l a r purpose. T h i s is g i v e n by t h e s l o p e o f t h e l i n e a r s e c t i o n o f t h e l i n e a r i z e d b e n e f i t func- t i o n s .
The o p t i m a l o p e r a t i o n s t r a t e g y o f t h e b a r r a g e s i s d e t e r - mined i n t h e model by dynamic programming, assuming t h a t s t o r a g e i n t h e r e s e r v o i r c a n assume c e r t a i n d i s c r e t e v a l u e s o n l y . The model i s o p e r a t e d t o produce t h e maximum n e t economic b e n e f i t w h i l e s t a r t i n g from any a c t u a l c o n d i t i o n t h e w a t e r l e v e l i n t h e r e s e r v o i r p roceeds t o a p a r t i c u l a r c o n d i t i o n w i t h i n t h e c o n t r o l p e r i o d o f t h e model.

The s t a t e v a r i a b l e o f t h e dynamic programming model i s t h u s t h e s t o r a g e volume, whereas t h e d e c i s i o n v a r i a b l e i s t h e change t h e r e o f . For any p a r t i c u l a r change i n s t o r a g e volume, t h e o p t i m a l d i s t r i b u t i o n i s de te rmined by t h e l i n e a r model. For o p e r a t i n g t h e dynamic programming model t h e i n f l o w d i s - c h a r g e s and t h e wate r demands must be p r e d i c t e d f o r t h e e n t i r e c o n t r o l p e r i o d , b u t t h e d e c i s i o n concern ing t h e o p t i m a l s t r a t e g y c a n be p e r f e c t e d s t e p by s t e p i n accordance w i t h t h e s i t u a t i o n a c t u a l l y deve loped , and w i t h o c c a s i o n a l m o d i f i c a t i o n s i n t h e w a t e r demand and d i s c h a r g e f o r e c a s t s . By u s i n g t h e s e t o f models i n f o r m a t i o n i s o b t a i n e d on t h e o p t i m a l v a r i a t i o n i n s t o r a g e , a s w e l l a s on t h e wate r volumes a v a i l a b l e f o r u t i l i z a t i o n i n t h e v a r i o u s r e g i o n s .
3.2.2 Damage Aversion
The d r a i n a g e o f r a i n w a t e r a s a component o f w a t e r damages c a n be d e s c r i b e d by a c o n c e p t u a l - p h y s i c a l model whose s t a g e s i n c l u d e s h e e t f low, d e p r e s s i o n s t o r a g e , t h e development o f pond-chains and e v e n t u a l l y c h a n n e l f low. The a c t u a l p h y s i c a l phenomena i n t h e i n d i v i d u a l s t a g e s a r e d e s c r i b e d by mathemat ica l r e l a t i o n s i n accordance w i t h t h e c h a r a c t e r o f f low. T h i s s e t o f mathemat ica l e q u a t i o n s , where t h e e x p r e s s i o n s d e s c r i b i n g t h e i n d i v i d u a l s t a g e s a r e i n t e r r e l a t e d , forms t h e mathemat ica l model o f t h e p r o c e s s . The c o n c e n t r a t i o n o f s u r f a c e r u n o f f i s r e p r e s e n t e d by two models. The f i r s t , named t h e EXPRE model ( s e e K i e n i t z , 1 9 7 2 ) , y i e l d s t h e volume of r u n o f f from r a i n f a l l , whereas t h e second, t h e DRAINAGE model ( s e e K i e n i t z , 1969) , h a s been conce ived t o t r a n s f o r m undra ined r a i n w a t e r i n t o a r u n o f f hydrograph.
3 .3 Development Models of t h e System
3.3.1 Water Management
A dynamic model h a s been compiled f o r p l a n n i n g long-term development o f w a t e r r e s o u r c e s management ( s e e D6vid e t a l . , 1 9 7 4 ) . Socio-economic e v o l u t i o n i s accompanied by a n i n c r e a s e i n t h e r e s p o n s i b i l i t i e s of w a t e r management. A growing s h a r e of r e s o n r c e s must be expended f o r e s t a b l i s h i n g and m a i n t a i n i n g t h e b a l a n c e between t h e n a t u r a l s u p p l y and t h e s o c i a l demands f o r w a t e r . The p o t e n t i a l u s e s of t h e s e s u p p l i e s , however, i n g e n e r a l a r e l i m i t e d . The dynamic model conce ived f o r p l a n n i n g long-term development o f w a t e r management i s n o t i n t e n d e d t o promote t h e most e f f i - c i e n t u s e of r e s o u r c e s o v e r l o n g p e r i o d s i n socio-economic systems w i t h l i m i t e d r e s o u r c e s b u t i n p a r t i c u l a r s t a g e s o f development. I n any p a r t i c u l a r p e r i o d and i n any g i v e n c a t c h - ment, such a s t h e T isza-Val ley , o r subcatchment (economic d i s - t r i c t ) t h e demands f o r f r e s h w a t e r o r f o r damage c o n t r o l r e s u l t i n g from t h e socio-economic e v o l u t i o n env isaged can be met by t h e fundamental w a t e r management f u n c t i o n s , such a s r u n o f f c o n t r o l , w a t e r p r o d u c t i o n and supply , was te wate r t r e a t m e n t . For t h e s e a c t i v i t i e s t h e r e s o u r c e s ( f u n d s , manpower, energy and wate r

s u p p l i e s ) a r e made a v a i l a b l e t o wate r management by t h e s o c i e t y and by n a t u r e , r e s p e c t i v e l y . For t h e j u s t i f i e d development o f t h e b a s i c wate r management a c t i v i t i e s c o n s i d e r e d , t h e f o r e g o i n g r e s o u r c e s must be combined i n t h e a p p r o p r i a t e manner. Where t h e r e s o u r c e s a r e adequa te a s r e g a r d s bo th t h e i r q u a n t i t y and t h e i r d i s t r i b u t i o n among t h e b a s i c a c t i v i t i e s , f o r r e a l i z i n g t h e b a s i c wate r management a c t i v i t i e s r e q u i r e d , t h e r e a r e no o b s t a c l e s t o t h e r e a l i z a t i o n o f t h e socio-economic e v o l u t i o n con templa ted . On t h e o t h e r hand, where t h e amount o f r e s o u r c e s is less t h a n r e q u i r e d , t h e b a s i c a c t i v i t i e s o f wa te r management w i l l be i n c a p a b l e of meet ing t h e demands of s o c i e t y . I n such c a s e s a l o s s , whose magnitude depends on t h e e x t e n t o f wa te r s h o r t a g e , w i l l a c c r u e which r e s u l t s , w i t h a c e r t a i n t i m e l a g , i n s lowing down t h e r a t e o f economic e v o l u t i o n and p o p u l a t i o n growth. The magnitude o f t h e l o s s depends on t h e q u a n t i t y of r e s o u r c e s a v a i l a b l e and t h e i r d i s t r i b u t i o n among t h e b a s i c a c t i v i t i e s . The a l l o c a t i o n o f t h e s e r e s o u r c e s comprises t h e development s t r a t e g y . I n t h e dynamic development model o f w a t e r management it is assumed t h a t t h e r e s o u r c e s needed f o r i d e a l development a r e n o t f u l l y a v a i l a b l e . Ac tua l development i s c o n t r o l l e d by t h e r e s o u r c e s a c t u a l l y a v a i l a b l e and by t h e development s t r a t e g y adopted. The l o s s e s i n income and i n popu- l a t i o n growth r e p r e s e n t e d by t h e d i f f e r e n c e between t h e i d e a l and t h e a c t u a l development a r e t h e model o u t p u t f o r a p o t e n t i a l a l t e r n a t i v e , t h a t is, a p a r t i c u l a r set o f r e s o u r c e s i n combinat ion w i t h a p a r t i c u l a r development s t r a t e g y . Each development a l t e r - n a t i v e c o n s i s t i n g o f a set of r e s o r u c e s and of a development s t r a t e g y i n v o l v e s a l o s s v a l u e , i n d i c a t i n g t h e e x t e n t o f f a i l u r e i n r e a l i z i n g t h e development con templa ted . The o p t i m a l a l t e r n a t i v e i s t h e one r e s u l t i n g i n t h e s m a l l e s t l o s s . The model can b e per - f e c t e d t o f i n d t h e optimum s o l u t i o n from a v e r y g r e a t number o f a l t e r n a t i v e s which a r e a u t o g e n e r a t e d . S t o c h a s t i c pa ramete rs c a n a l s o b e i n c l u d e d . An a l g o r i t h m can be i n c o r p o r a t e d which makes it p o s s i b l e t o r e t u r n t o t h e i d e a l c o n d i t i o n once any l o s s s i t u a t i o n is o b t a i n e d , by t h e l a r g e s c a l e e x p e n d i t u r e o f r e s o u r c e s . A t t h e same t i m e , hydro-economic a n a l y s e s a r e a d v i s a b l e f o r t h e a s e x a c t a s p o s s i b l e f o r m u l a t i o n o f t h e i n t e r r e l a t i o n s between social -economic e v o l u t i o n and wate r management development.
A s t u d y h a s been performed on t h e s i g n i f i c a n c e o f r u n o f f c o n t r o l i n t h e T i s z a catchment (see SzAsz, 1 9 7 4 ) , w i t h t h e o b j e c t i v e o f e s t i m a t i n g t h e r e g u l a t i n g impact o f r e s e r v o i r s , s t o r a g e o p p o r t u n i t i e s and wate r t r a n s f e r s bo th i n Hungary and abroad , on t h e e v o l u t i o n o f d r y weather f lows , w i t h a l lowance f o r t h e growth i n demands accompanying socio-economic e v o l u t i o n . The v a r i a t i o n s i n t h e d r y weather s u p p l i e s a r e examined on t h e T i s z a River and i t s t r i b u t a r i e s a l o n g t h e i r Hungarian s e c t i o n . With c o n t r o l s adopted i n t h e b o r d e r c r o s s - s e c t i o n s and down- s t r e a m of t h e c o n f l u e n c e o f t r i b u t a r i e s , t h e changes o f s u p p l i e s a r e e s t i m a t e d o v e r an annua l c y c l e by monthly i n t e r v a l s , con- s i d e r i n g a l s o t h e modifying i n f l u e n c e s a l o n g t h e upstream s e c t i o n s . The growth of w a t e r demands is s p e c i f i e d a s a boundary c o n d i t i o n and w i t h a l lowance t o s t o r a g e o p p o r t u n i t i e s , a s w e l l a s t o wate r t r a n s f e r s w i t h i n t h e catchment it is d e s i r e d t o f i n d t h e p o t e n t i a l h i g h e s t l e v e l o f meet ing wate r demands from s u p p l i e s a v a i l a b l e w i t h i n t h e catchment .

Rela ted t o t h e i n v e s t i g a t i o n s on t h e w a t e r management system i n t h e T i s z a Val lev . a s e c t o r i a l d e v e l o ~ m e n t model h a s been -. . -. . - - - - - - - - . ~ ~ . - - ~~ -
e l a b o r a t e d w i t h th;' t i t l e : "integratedL w a t e r management and economic paramete rs f o r d e s c r i b i n g t h e a c t i v i t i e s i n wate r manage- ment" ( s e e Salamin and Barna, 1972) . For p a r t i c u l a r ca tchments , f o r a s i n g l e catchment , o r s e v e r a l subcatchments t h e a c t i v i t i e s of wa te r management a r e ana lyzed f o r t h e i r e f f e c t i v e n e s s i n p r o v i d i n g s u p p l i e s f o r v a r i o u s demands, p r o t e c t i n g human l i f e and p r o p e r t y from wate r damages and f o r t h e e f f e c t o f wa te r management i n t e r f e r e n c e s performed, i n t h e i n t e r e s t of t h e f o r e - go ing , (on o t h e r b ranches of t h e economy). The r e l e v a n t pa ramete rs and r e l a t i o n s h i p s a r e ana lyzed i n b u i l d i n g a s e t o f models by which t h e d i v e r s e p r o c e s s e s a r e d e s c r i b e d i n bo th space and t i m e .
3.3.2 Flood C o n t r o l
The o b j e c t i v e s of a system model compiled f o r d e t e r m i n i n g t h e o p t i m a l a l l o c a t i o n o f f l o o d c o n t r o l development e x p e n d i t u r e s ( s e e ~ e s z g n a e t a l . , 1972) i s t o d e t e r m i n e t h e e x t e n t o f i m - p rov ing t h e p r o t e c t i o n of l e v e e s a l o n g t h e i n d i v i d u a l s e c t i o n s . These may i n c l u d e s e v e r a l s e c t i o n s a l o n g t h e same w a t e r c o u r s e o r i n d i v i d u a l s e c t i o n s a long s e v e r a l wa te r c o u r s e s . The f l o o d p l a i n p a r t s p r o t e c t e d by t h e i n d i v i d u a l l e v e e s e c t i o n s may be- come inunda ted i f t h e f l o o d s t a g e on a p a r t i c u l a r r i v e r s e c t i o n i s h i g h e r than t h e v a l u e c r i t i c a l f o r c o n t r o l . Higher s t a g e s i n v o l v e g r e a t e r a r e a s exposed t o i n u n d a t i o n and a s a r u l e l o n g e r i n u n d a t i o n p e r i o d s . The damages t o p r o p e r t y i n t h e a r e a and t h e l o s s e s i n p r o d u c t i o n ( o p e r a t i o n ) i n c r e a s e p a r a l l e l w i t h t h e a r e a inunda ted and w i t h t h e d u r a t i o n o f i n u n d a t i o n . The economic l o s s e s compr i se a l s o t h e c o s t s o f f l o o d f i g h t i n g and r e s c u e . The o b j e c t i v e o f t h e model i s t o i n d i c a t e t h e e x t e n t of l e v e e r e i n f o r c e m e n t a l o n g t h e i n d i v i d u a l s e c t i o n s c o n s i d e r e d and o v e r t h e p e r i o d ana lyzed i n a manner t o r e s u l t i n a t o t a l c o s t com- p a r a b l e t o t h e a v a i l a b l e r e s o u r c e s and t o maximize t h e p o t e n t i a l n e t b e n e f i t of f l o o d c o n t r o l over t h e p e r i o d s t u d i e d .
F u r t h e r system models have been a p p l i e d i n s e v e r a l r e g i o n s o_f t h e Hungarian p a r t o f t h e T i s z a v a l l e y a s t o o l s i n making f l o o d c o n t r o l development d e c i s i o n s . Examples f o r t h e s e a r e t h e f l o o d c o n t r o l s t u d i e s on t h e Upper-Tisza River ( s e e V I K O Z , 1974a) and i n t h e Koros River System (see VIKOZ, 1974b) . The o b j e c t i v e o f t h e s e s t u d i e s was t o f i n d a l e a s t - c o s t s o l u t i o n by which t h e d e g r e e o f p r o t e c t i o n s p e c i f i e d f o r t h e a r e a ( 1 % and 0 . 5 % ) c a n b e r e a l i z e d . I n t h e s e systems models, a l lowance h a s been made f o r o t h e r p o s s i b l e e n g i n e e r i n g methods b e s i d e s l e v e e improvement, i n c l u d i n g r e t e n t i o n s t o r a g e beyond t h e boundary, emergency s t o r a g e a l o n g t h e r i v e r s , e t c .
4. MODELS PROPOSED FOR THE TISZA VALLEY WATER MANAGEMENT SYSTEM
Chapte r 2 d e s c r i b e d t h e p r e s e n t wa te r management system i n t h e T i s z a Val ley . I t concluded t h a t bo th e x c e s s i v e abundance and s c a r c i t y o f w a t e r p r e s e n t problems i n t h e o p e r a t i o n t h e r e o f .

A t t e n t i o n h a s t o be focused on t h e s o l u t i o n of two fundamental problems:
a ) how t o c o n t r o l i n t h e b e s t p o s s i b l e way t h e p r e s e n t system, and
b) how t o deve lop wate r management i n t h e system i n o r d e r t o comply w i t h t h e development o f t h e n a t i o n a l economy envisaged o r p r e d i c t e d .
Chapte r 3 p o i n t e d o u t t h a t s e v e r a l i n i t i a t i v e s have been t a k e n i n Hungary towards t h e a p p l i c a t i o n o f sys tems p lann ing . Usefu l i n f o r m a t i o n h a s been ga ined f u r t h e r from i n t e r n a t i o n a l e x p e r i e n c e s on t h e mode l l ing o f wa te r management sys tems ( s e e H a l l and Dracup, 1970; James and Lee, 1971; Buras , 1972; d e Neuf- v i l l e , 1970; d e N e u f v i l l e and s t a f f o r d , 1971) . The r e s u l t s a t t a i n e d t h u s f a r under t h e j o i n t r e s e a r c h programme of t h e Hungarian Nat iona l Water A u t h o r i t y and t h e U n i v e r s i t y o f Airzona have a l s o c o n t r i b u t e d t o a r e a l i s t i c and a t t h e same t i m e s c i e n t i f - i c a l l y founded a n a l y s i s of t h e T i s z a V a l l e y System ( s e e Fogel and Bogsrd i , 1974; VIKOZ, 1 9 7 4 ~ ) .
The ' soundness ' o f a sys tems model i s b e l i e v e d t o depend on i t s answers t o t h e f o l l o w i n g t h r e e p o i n t s :
1 ) Does it r e p r e s e n t t h e o b j e c t i v e s o f t h e a c t u a l system, d o e s it d e s c r i b e t r u l y t h e n a t u r a l , economic, e t c . con- d i t i o n s under which t h e system i s t o be o p e r a t e d ?
2 ) Does it t a k e i n t o account t h e u n c e r t a i n t i e s owing t o n a t u r a l c o n d i t i o n s ( f l o o d s , d r o u g h t s , e t c . ) and t o sampling p r a c t i c e s ( s h o r t n e s s of r e c o r d s ) r e l a t e d t o t h e system?
3) Is a s o l u t i o n p o s s i b l e ?
I n t h e p r e s e n t c h a p t e r a n a t t e m p t h a s been made a t t h e p r o p o s a l o f models which meet more o r less t h e above t h r e e p o i n t s . The a c t u a l problem h a s i n v a r i a b l y been adopted a s t h e s t a r t i n g p o i n t o f t h e a n a l y s i s and t h e optimum p o s s i b l e method h a s been sought f o r i t s s o l u t i o n . These methods, however, a r e n o t a lways complete and c a l l f o r c o n s i d e r a b l e r e s e a r c h work owing t o t h e complex i ty o f t h e problem.
I n t h e p receed ing c h a p t e r s it was demons t ra ted i n d e t a i l t h a t i n t h e Hungarian T i s z a Val ley System t h e f l o o d c o n t r o l subsystem c o n s i s t s predominant ly o f t h e f l o o d l e v e e s . Conse- q u e n t l y , i n t h i s p a r t i c u l a r system f l o o d c o n t r o l and t h e o t h e r b ranches of wa te r management can be c o n s i d e r e d s e p a r a t e l y a s r e g a r d s bo th c o n t r o l and development. I t should be obv ious t h a t t h i s s e p a r a t e t r e a t m e n t i s n o t p o s s i b l e i f t h e e n t i r e b a s i n o f t h e T i s z a R i v e r , o r a subcatchment t h e r e o f is a n a l y z e d , where m u l t i p u r p o s e v a l l e y s t o r a g e c a n be r e a l i z e d .

With t h e f o r e g o i n g c o n s i d e r a t i o n s i n mind, t h e systems models proposed w i l l be i n t r o d u c e d i n t h e f o l l o w i n q s r o u ~ i n a : The optimum c o n t r o l of t h e p r e s e n t system w i l l be i r e a t e ; f i r s t by o u t l i n i n g t h e models f o r t h e o p t i m a l o p e r a t i o n of w a t e r management ( e x c l u d i n g f l o o d c o n t r o l ) and w a t e r damage a v e r s i o n . I n t h e second p a r t t h e development model of t h e system w i l l be c o n s i d e r e d d e a l i n g a g a i n w i t h t h e models of w a t e r management and wate r damage a v e r s i o n .
~t should b e no ted t h a t t h e models w i l l be p r e s e n t e d i n a s i m p l i f i e d form, o m i t t i n g t h e mathematical d e t a i l s . None of t h e models has been a p p l i e d y e t t o t h e e n t i r e system, and s o f a r o n l y c a l c u l a t i o n s have been ~ e r f o r m e d . A number o f t h e o r e t i c a l problems a w a i t t o b e s o l v e d i n connec t ion w i t h each of t h e f o u r models b e f o r e t h e i r p r a c t i c a l a p p l i c a t i o n becomes p o s s i b l e .
4 .1 Optimum C o n t r o l Model of t h e P r e s e n t System
4 .1 .1 Optimum c o n t r o l o f t h e wate r management system (exc lud ing f l o o d c o n t r o l )
The purpose o f t h e model i s t o e s t a b l i s h a mode o f o p e r a t i o n f o r t h e w a t e r management system s i t u a t e d i n t h e Hungarian p a r t of t h e T i s z a River catchment .
Symbols and D e f i n i t i o n s
The p r i n c i p a l e lements i n t h e w a t e r management system model a r e t h e r e s e r v o i r s kR, t h e r i v e r s e c t i o n s i, a s w e l l a s t h e re- l a t e d w a t e r supp ly and i r r i g a t i o n d i s t r i c t s , and t h e d r a i n a g e s e c t i o n s . The f o l l o w i n g model i s o p e r a t e d on a monthly t ime s c a l e . I t should be noted t h a t t h e r e s e r v o i r s invo lved i n t h e system a r e mos t ly channe l inpoundments, whose s t o r a g e volumes a r e i n g e n e r a l s i g n i f i c a n t l y s m a l l e r t h a n t h e monthly r u n o f f volume. T h e r e f o r e it i s cons idered d e s i r a b l e t o o p e r a t e t h e s e on a ten-day t i m e i n t e r v a l b a s i s , f o r which purpose t h e develop- ment o f a ten-day t i m e s c a l e model would be n e c e s s a r y .
R e s e r v o i r s
Opera t ion and c o n t r o l o f t h e r e s e r v o i r s i s p o s s i b l e on t h e b a s i s of each of t h e f o u r d e c i s i o n v a r i a b l e s :
Re lease : x ( k R , t ) : t h e w a t e r volume t o be r e l e a s e d from t h e r e s e r v o i r e kR i n t h e month t,
Water T r a n s f e r : y ( k R , i , t ) : t h e wat-r volume t o be t r a n s - f e r r e d from t h e r e s e r v o i r kR t o t h e r i v e r s e c t i o n i i n t h e month t ,

I n d u s t r i a l Withdrawal: v (kR, t) : t h e water volume d i v e r t e d from t h e r e s e r v o i r kR i n t h e month t ,
I r r i g a t i o n withdrawal : z (kR, t) : t h e wate r volume d i v e r t e d f o r i r r i g a t i o n from t h e r e s e r v o i r kR i n t h e month t.
R i v e r S e c t i o n s
The r i v e r s e c t i o n s c a n be c o n t r o l l e d on t h e b a s i s o f t h r e e d e c i s i o n a l t e r n a t i v e s :
Water T r a n s f e r : y ( i t ) : t h e wate r volume t r a n s f e r r e d from r i v e r s e c t i o n i t o r i v e r s e c t i o n j i n t h e month t ,
I n d u s t r i a l Withdrawal: v ( i , t ) : t h e wate r volume d i v e r t e d f o r i n d u s t r i a l purposes a long r i v e r s e c t i o n i i n t h e month t ,
I r r i g a t i o n Withdrawal: z ( i , t ) : t h e wate r volume d i v e r t e d f o r i r r i g a t i o n a l o n g r i v e r s e c t i o n i i n t h e month t.
The s t a t e v a r i a b l e is t h e n a t u r a l i n f l o w t o t h e r e s e r v o i r kR ( q ( k R , t ) ) , o r t o t h e r i v e r s e c t i o n i ( q ( i , t ) ) i n t h e month t.
It should be no ted t h a t s t a t e v a r i a b l e s a r e random v a r i a b l e s c o r r e l a t e d i n t i m e and space a l i k e .
W a t e r Demands
Domestic and i n d u s t r i a l w a t e r demands i n t h e month t a r e c o n s i d e r e d d e t e r m i n i s t i c . Thus domes t ic wate r demand i n t h e month t i n t h e d i s t r i c t connected t o t h e r i v e r s e c t i o n w i l l be denoted by w ( i , t ) , whereas i n t h e c a s e of t h e r e s e r v o i r kR w i l l be w ( k R , t ) ; s i m i l a r l y , i n d u s t r i a l wa te r demand i n t h e r e s e r v o i r kR w i l l b e u ( k R , t ) .
The i r r i g a t i o n water demand i n t h e month t i s a t ime-dependent random v a r i a b l e . Thus t h e demand f o r i r r i g a t i o n wate r i n t h e month t a l o n g t h e r i v e r s e c t i o n i w i l l be denoted by r ( i , t ) and i n t h e c a s e of r e s e r v o i r kR w i l l be r ( k R , t ) .
L o s s e s
It i s a p p r e c i a t e d t h a t wa te r s h o r t a g e , undrained r a i n w a t e r and wate r p o l l u t i o n may n o t o n l y c a u s e economic l o s s e s t o which a monetary v a l u e can be a s s i g n e d , b u t a l s o i n d i r e c t l o s s e s which a r e d i f f i c u l t t o make t a n g i b l e . The s o c i a l l o s s e s owing t o t h e s e wate r r e l a t e d problems a r e a l s o impor tan t and i n t a n g i b l e i n c h a r a c t e r . I n t h e p r e s e n t model t h e t a n g i b l e economic l o s s e s o n l y w i l l be c o n s i d e r e d . F u r t h e r i n v e s t i g a t i o n is needed b e f o r e t h e s e i n t a n g i b l e l o s s e s can be inc luded i n t h e system model. For t h i s a n a l y s i s economic l o s s e s w i l l be grouped a s fo l lows :

a ) The economic l o s s e s r e s u l t i n g from i n a d e q u a t e domes t ic w a t e r s u p p l y w i l l be c o n s i d e r e d of i n f i n i t e magnitude.
b ) The economic l o s s e s r e s u l t i n g from inadequa te i n d u s t r i a l wa te r s u ~ ~ l v a r e a s fo l lows :
LP ( i , t ) : t h e economic l o s s owing t o inadequa te i n d u s t r i a l supp ly i n t h e r e g i o n p a r t a i n i n g t o t h e r i v e r s e c t i o n i i n t h e month t , and
LP ( k R , t ) : t h e economic l o s s owing t o inadequa te i n d u s t r i a l supply from t h e r e s e r v o i r kR i n t h e month t.
Moreover, f o r each r i v e r s e c t i o n i:
Likewise, i n t h e c a s e of t h e r e s e r v i o r k r :
C ) The economic l o s s e s owing t o undra ined r a i n w a t e r a r e :
L D ( i , t ) : t h e economic l o s s owing t o undra ined r a i n w a t e r i n t h e a r e a p e r t a i n i n g t o t h e r i v e r s e c t i o n i i n t h e month t ,
LD [undra ined ( i , t) ; q ( i , t ) 1 : depends on t h e o c c u r r e n c e of undrained r a i n w a t e r , a s an e v e n t and on t h e d i s - c h a r g e i n t h e r i v e r .
d ) The economic l o s s e s owing t o ) a r e d e f i n e d a s fo l lows :
L i t : t h e economic l o s s i n t h e a r e a p e r t a i n i n g t o r i v e r s e c t i o n i i n t h e month t and
L I ( k R , t ) : t h e same i n t h e c a s e o f t h e r e s e r v o i r kR i n t h e month t . Moreover, f o r e a c h r i v e r s e c t i o n :

Likewise i n t h e c a s e o f t h e r e s e r v o i r kR:
e l The env i ronmenta l l o s s e s , such a s wa te r p o l l u t i o n , d e t e r i o r a t i o n of r e c r e a t i o n o p p o r t u n i t y , l andscape b e a u t y , a r e r e -
garded a s t a n g i b l e l o s s e s , w i t h ' monetary t e r n s a s s i g n e d a s f o l l o w s :
L R ( i , t ) : t h e env i ronmenta l l o s s a l o n g r i v e r s e c t i o n i i n t h e month t ,
L R ( k R , t ) : t h e same a l o n g r e s e r v o i r kR i n t h e month t .
Accord ing ly f o r a r i v e r s e c t i o n :
L R ( i , t ) = LR {; [ q ( i , t ) + q ( i + 1, t ) ] } o t h e r w i s e .
I n t h e c a s e of a r e s e r v o i r
L R ( ~ R , t ) = LR[S (kR, t ) ] o t h e r w i s e ,
where
s ( k R , t ) i s t h e wa te r volume s t o r e d i n t h e month t .
The l o s s e s mentioned under c ) , d) and e ) a r e random v a r i a b l e s because o f t h e random c h a r a c t e r o f p r e c i p i t a t i o n o c c u r r e n c e , wa te r demands and wate r r e s o u r c e s . The symbols a r e i n d i c a t e d s c h e m a t i c a l l y i n F i g u r e 8 .

+ 4 (i,t) Natural Inflow
I Irrigation Water
$ x (kR,t) Release w (i,t) 1 Drinking Water
f-- z(i,t) w (kR,t) J Requirement
Irrigation Withdrawal u(i,t) ] Industrial Water
v(i,t) u(kR,t) ,/ Requirement - v g R , t ) } Industrial Withdrawal
w ( i t ) Drinking Water c w(kR,t)} Withdrawal - y ( i t ) 4 y (kR,t) Water Transfer
Figure 8. Notations for the system model of optimum control.

The O b j e c t i v e Func t ion
The o b j e c t i v e f u n c t i o n minimizes t h e e x p e c t e d v a l u e o f t h e sum o f economic l o s s e s owing t o i n a d e q u a t e i n d u s t r i a l and i rr i - g a t i o n w a t e r supp ly , t o undra ined r a i n w a t e r and t o env i ronmenta l damages f o r a l l r e s e r v o i r s , f o r a l l r i v e r s e c t i o n s and f o r a l l d i s t r i c t s r e l a t e d t h e r e t o , o v e r t h e e n t i r e y e a r .
S i n c e it i s p e r m i s s i b l e t o assume t h a t a l l r e s e r v o i r s c a n be f i l l e d c o m p l e t e l y by each March, a p e r i o d of f i n i t e l e n g t h , namely T = 12 months, c a n be t a k e n i n t o c o n s i d e r a t i o n . T h i s i m p l i e s t h a t any d e c i s i o n c o n c e r n i n g any month a f f e c t s t h e p o t e n t i a l economic l o s s e s o n l y up t o t h e n e x t March. The demands f o r domes t i c wa te r s u p p l y must be met i n e a c h d i s t r i c t and i n e a c h p e r i o d , s i n c e a n economic l o s s o f i n f i n i t e magni tude h a s been a s s i g n e d t h e r e t o . The p r o d u c t i o n o f h y d r o e l e c t r i c power i s of secondary importance i n t h e system and h a s t h e r e f o r e been o m i t t e d i n t h e o b j e c t i v e f u n c t i o n . Accord ing ly t h e o b j e c t i v e f u n c t i o n t a k e s t h e f o l l o w i n g form:
m 12 L(T) = 1 1 E [ L P ( i , t ) + L D ( i , t ) + L I ( i , t ) + L R ( i , t ) 1 + min
i = l t=T
where
m i s t h e t o t a l number of r e s e r v o i r s and r i v e r s e c t i o n s w i t h i n t h e system,
T i s t h e t i m e of o p t i m i z a t i o n , 1 < T < 11,
E i s t h e symbol of t h e expec ted v a l u e i n accordance w i t h t h e wa te r demands r and undra ined r a i n w a t e r .
The s o l u t i o n of t h e o b j e c t i v e f u n c t i o n y i e l d s t h e v e c t o r o f o p t i m a l c o n t r o l : o p t x ( t = T + 1 ) , o p t y ( t = T + 1 ) , o p t z ( t = T + 1 ) and o p t v ( t = T + 1 ) . O p t i m i z a t i o n i s s t a r t e d i n t h e month o f March and i n t h e f i r s t s t e p it i s p o s s i b l e t o f i n d t h e o p t i m a l p o l i c y f o r A p r i l .
S t a r t i n g i n t u r n from t h e a c t u a l s i t u a t i o n i n A p r i l , o p t i m i - z a t i o n is a g a i n performed and a new p o l i c y i s found f o r May. I n o t h e r words, i n t h e c o u r s e of o p t i m i z a t i o n t h e r e s u l t r e l a t e d t o t h e f i r s t month must o n l y be r e a l i z e d i n e a c h c a s e . I n t h e f i r s t s t e p , no h y d r o l o g i c a l f o r e c a s t i s assumed i n t h e op t imi - z a t i o n model. I n t h e second s t e p , however, it i s p o s s i b l e t o i n c l u d e a monthly f o r e c a s t i n t h e model, u s i n g t h e Bayes method.

C o n s t r a i n t s
1 ) The c o n s t r a i n t s f o r t h e r i v e r s e c t i o n s a r e e s s e n t i a l l y t h e c o n t i n u i t y e q u a t i o n s :
2 ) The s t o r a g e e q u a t i o n f o r a l l r e s e r v o i r s is:
3 ) The c o n s t r a i n t s c o n c e r n i n g r e s e r v o i r s i z e a r e :
s ( k R , t ) > min S ( k R , t ) I
s ( k R , t ) < max S ( k R , t ) -
4 ) The c o n s t r a i n t on wa te r r e l e a s i n g c a p a c i t y is:
5 ) The c o n s t r a i n t on wa te r t r a n s f e r c a p a c i t y is:
x ( i o r kR, t ) < rnax y ( i o r kR) -
6 ) The c o n s t r a i n t s on wi thdrawal c a p a c i t i e s a r e :
z (i o r kR, t ) < max z (i o r kR) ,
v ( i o r k R , t ) < max v ( i o r kR) .
7 ) The lower l i m i t of d r y weather f low ( t h e o b l i g a t o r y d i s c h a r g e t o b e r e t a i n e d i n t h e channe l f o r s a n i t a r y o r o t h e r purposes ) i s

8 ) I n t e r n a t i o n a l o b l i g a t i o n s :
q ( a t t h e downstream boundary,
t) 2 min q ( a t t h e downstream boundary.
The Necessary Data , Paramete rs and F u n c t i o n s
I n t h e Hungarian T i s z a V a l l e y system c o n s i d e r e d , t h e t o t a l number of r e s e r v o i r s and r i v e r s e c t i o n s i n c l u d e d i s around 30, t h a t is m 30. Of t h i s t o t a l number, f i v e a r e r e s e r v o i r s and 25 a r e r i v e r s e c t i o n s . The number o f wa te r t r a n s f e r s i s f o u r t o f i v e , t h e number of d i v e r s i o n s 30, t h e number o f s t a t e v a r i a b l e s is a b o u t 15.
D e c i s i o n V a r i a b l e s
D i s c r e t e p o s s i b l e v a l u e s o f t h e d e c i s i o n v a r i a b l e s x , y , v and z must be s p e c i f i e d f o r each r e s e r v o i r and r i v e r s e c t i o n ( f o r a l l m v a l u e s ) , f o r example, i n m i l l i o n m3/month.
S t a t e V a r i a b l e s
For e a c h s t a t e v a r i a b l e q (i, t) , t h e t y p e o f d i s t r i b u t i o n (p robab ly log-normal) must be s p e c i f i e d t o g e t h e r w i t h t h e paramete rs t h e r e o f , w i t h t h e f i r s t - o r d e r s e r i a l c o r r e l a t i o n c o e f f i c i e n t s f o r t h e s u c c e s s i v e months, a s w e l l a s w i t h t h e c r o s s - c o r r e l a t i o n m a t r i x ( s p a t i a l dependence a t t h e boundary of t h e s y s t e m ) .
Water Demands
The demand f o r domes t ic supply w ( i , t ) , i n d u s t r i a l supp ly u ( i , t) and i r r i g a t i o n wate r r (i ,t) must be s p e c i f i e d f o r a l l d i s t r i c t s .
The i r r i g a t i o n wate r demands can be expressed presumably i n t h e form of f i r s t - o r d e r Markov c h a i n s . According t o t h e i n v e s t i g a t i o n s t h u s f a r i r r i g a t i o n wate r demand f o l l o w s normal d i s t r i b u t i o n i n each month. Consequent ly , t h e paramete rs of t h e d i s t r i b u t i o n s and t h e c o r r e l a t i o n c o e f f i c i e n t s p ( i , i + 1 ) a r e needed.
Loss Func t ions
To be s p e c i f i e d a r e f o r e a c h month and d i s t r i c t :
- l o s s e s owing t o inadequa te i n d u s t r i a l supp ly f o r t h e r i v e r s e c t i o n s LP (i, t ) , f o r t h e r e s e r v o i r s LP (kR, t) ; t y p i c a l LP l o s s f u n c t i o n s a r e shown i n F i g u r e 9.

- Losses L ~ ( i , t ) owing t o i n a d e q u a t e i r r i g a t i o n w a t e r ; a t y p i c a l LI l o s s f u n c t i o n i s i l l u s t r a t e d i n F i g u r e 1 0 .
- Losses owing t o undra ined r a i n w a t e r f o r each r i v e r s e c t i o n LD (i, t ) and f o r e a c h r e s e r v o i r LD(kR, t ) ; t y p i c a l LD l o s s f u n c t i o n s a r e shown i n F i g u r e 1 1 .
- env i ronmenta l l o s s e s f o r e a c h r i v e r s e c t i o n L R ( i , t ) and f o r each r e s e r v o i r L R ( k R , t ) ; t y p i c a l LR l o s s f u n c t i o n s a r e shown i n F i g u r e 1 2 .
I t i s c o n c e i v a b l e t h a t l i n e a r l o s s f u n c t i o n s c a n be produced f o r t h e i n d i v i d u a l s e c t i o n s .
Figure 9. Typical loss function owing to industrial water shortage.
WATER DEFICIENCY, r (i,t )-z (i,t) Figure 10. Typical irrigation loss function.

MONTHLY FLOW q(i,t)
Figure 11. Typical loss function owing to undrained precipitation.
RESERVOIRS
JULY+ AUGUST
CRlT S(t)
h -. .- u
RIVER REACHES
JULY + AUGUST
>z Z W W I
CRlT q(i,t) MONTHLY FLOW q(i,t)
Figure 12. Typical environmental loss functions.

Constraints
I n accordance w i t h t h e c o n s t r a i n t s mentioned above, t h e f o l l o w i n g c o n s t r a i n t s must be s p e c i f i e d f o r e a c h r i v e r s e c t i o n and/or r e s e r v o i r :
S t o r a g e l i m i t s : min S ( k R , t ) max S ( k R , t ) Water r e l e a s e : max x (kR, t ) Water t r a n s f e r : max y (i o r kR) I r r i g a t i o n wi thdrawal : max z (i o r kR) I n d u s t r i a l wi thdrawal : max v ( i o r kR) O b l i g a t o r y f low: min q ( i , t ) I n t e r n a t i o n a l : min q ( a t t h e downstream boundary) .
4 . 1 . 2 Optimum Damage C o n t r o l
One of t h e most impor tan t f u n c t i o n s of t h e T i s z a V a l l e y System i s t o minimize a s f a r a s p o s s i b l e t h e l o s s e s caused by undra ined r a i n w a t e r and by f l o o d i n u n d a t i o n s . For reduc ing t h e damages by undrained r a i n w a t e r , d r a i n a g e s e c t i o n s have been e s t a b l i s h e d , where t h e e x c e s s r a i n w a t e r i s c o l l e c t e d by a system of d r a i n a g e c a n a l s and d i s c h a r g e d e i t h e r by g r a v i t y o r by pumping s t a t i o n s i n t o t h e r e c i p i e n t s . I t i s t h e r e f o r e i m p o r t a n t t o d e t e r m i n e t h e o p t i m a l c o n t r o l f o r t h e o p e r a t i o n o f t h e d r a i n a g e systems. I n t h i s domain models have been a p p l i e d t h u s f a r t o t h e minor p h y s i c a l system invo lved o n l y .
A t t i m e s of f l o o d s on t h e T i s z a River t h e o p e r a t i o n of t h e system of f l o o d l e v e e s , t h a t i s , f l o o d f i g h t i n g , i s o f t e n a technico-economic a c t i v i t y i n v o l v i n g c o n s i d e r a b l e r e s p o n s i b i l i t y and m o b i l i z i n g which i s i n f l u e n c e d by s o c i a l and p o l i t i c a l con- s i d e r a t i o n s a s w e l l (see The 1 9 6 5 F l o o d . . . ) . S u c c e s s f u l f l o o d f i g h t i n g o p e r a t i o n s on t h e T i s z a River may a v e r t f l o o d damages amounting t o b i l l i o n s of Hungarian f o r i n t s . I n t h e c o u r s e of f l o o d f i g h t i n g o p e r a t i o n s , temporary measures a r e implemented t o i n c r e a s e t h e p r o t e c t i o n of t h e l e v e e s , t h e a r e a s endangered a r e evacua ted and i n t h e c a s e of i n u n d a t i o n s r e s c u e work i s o r g a n i z e d .
Ac tua l f l o o d f i g h t i n g work i s founded on f l o o d f o r e c a s t s . A f o r e c a s t i n g system of v a r y i n g d e g r e e s of a c c u r a c y i s a v a i l a b l e f o r a l l f l o o d l e v e e s e c t i o n s i n t h e c o u n t r y . The e a r l i e s t f o r e - c a s t i s e v i d e n t l y t h e l e a s t a c c u r a t e , b u t t h e f l o o d f i g h t i n g c e n t e r ( n a t i o n a l o r r e g i o n a l ) must r e g a r d t h i s a l r e a d y i n d e c i d i n g on t h e o p t i m a l d i s t r i b u t i o n o f f l o o d f i g h t i n g m a t e r i a l s ( f o r example, sand bags) , equipment ( f o r example, e a r t h machines) and l a b o u r , and on t h e means of e v a c u a t i o n among t h e l e v e e s e c t i o n s . I t i s of i n t e r e s t t o n o t e t h a t a l o n g t h e lower r e a c h e s of t h e T i s z a River t h e f i r s t f o r e c a s t i s i s s u e d around t e n days b e f o r e t h e f l o o d e v e n t . I t should be r e a l i z e d t h a t t h e p r o t e c t i o n of t h e f l o o d l e v e e s can be improved c o n s i d e r a b l y i n t e n d a y s i f t h e r e s o u r c e s a r e employed a p p r o p r i a t e l y f o r a t t a i n i n g t h e h i g h e s t d e g r e e o f damage r e d u c t i o n .

F o r e c a s t s c o v e r i n g a g r a d u a l l y s h o r t e r l e a d t ime w i t h a h i g h e r a c c u r a c y a r e r e c e i v e d c o n t i n u o u s l y ( f o r example, e v e r y second d a y ) a t t h e f l o o d f i g h t i n g c e n t e r . The e a r l i e r d e c i s i o n s may b e conf i rmed o r modi f i ed a c c o r d i n g l y . The o b j e c t i v e o f t h e sys tems model i s t o d e t e r m i n e w i t h due a l lowance t o t h e f o r e c a s t s , t h e sequence o f o p t i m a l d e c i s i o n s c o n c e r n i n g t h e d i s t r i b u t i o n o f f l o o d f i g h t i n g and e v a c u a t i o n r e s o u r c e s . I n t h e c a s e of a b s o l u t e l y r e l i a b l e f o r e c a s t s t h e model i s a c o n v e n t i o n a l problem o f o p e r a t i o n s r e s e a r c h ; b u t a c t u a l l y t h i s c o n d i t i o n i s r a r e l y s a t i s f i e d . Consequent ly , owing t o t h e i n e v i t a b l e u n c e r t a i n - t i es o f f l o o d f o r e c a s t s d u r i n g a p a r t i c u l a r f l o o d , t h e o b j e c t i v e f u n c t i o n h a s t h e purpose o f minimizing t h e d i f f e r e n c e between t h e expec ted f l o o d l o s s e s which c a n be a v e r t e d by f l o o d f i g h t i n g and e v a c u a t i o n on t h e one hand, and t h e c o s t s o f f l o o d f i g h t i n g and e v a c u a t i o n work, on t h e o t h e r . The model c a n be conce ived a s an a l g o r i t h m o f s t o c h a s t i c , dynamic programming. I n t h e c a s e of a few, f o r example one o r two l e v e e s e c t i o n s and f o u r t o f i v e f o r e c a s t s , o r , f o r example a number o f l e v e e s e c t i o n s and a s i n g l e f o r e c a s t , t h e dynamic programming model c a n be o p e r a t e d w i t h a n a c c e p t a b l e computer t i m e r e q u i r e m e n t . But i n more complex c a s e s ( s e v e r a l l e v e e s e c t i o n s and f o u r t o f i v e f o r e c a s t s f o r e a c h ) t h e t i m e r e q u i r e m e n t i n c r e a s e s s h a r p l y .
4.2 Development Model o f t h e System
4.2.1 Development Model o f t h e Water Management System (Exc lud ing Flood Damage C o n t r o l )
I n c o n t r a s t t o t h e model concerned w i t h c o n t r o l l i n g t h e p r e s e n t sys tem t h e f o l l o w i n g development model i s r e l a t e d t o a s p e c i f i c p a r t o f t h e Hungarian T i s z a V a l l e y System. T h i s sub- system compr i ses an economic d i s t r i c t o f a b o u t 8 ,000 t o 10,000 km i n a r e a i n t h e n o r t h e r n p a r t of Hungary. Owing t o t h e complex i ty of t h e whole T i s z a V a l l e y System, no a t t e m p t h a s been made a t e x t e n d i n g t h i s development model t o t h e e n t i r e a r e a . The ob jec - t i v e o f t h e s t u d y is, however, t o p r o v i d e p l a n n i n g d a t a f o r t h e development o f t h e comple te system. It i s s u g g e s t e d t o a t t a i n t h i s f i n a l o b j e c t i v e a l o n g two approaches :
- development of models f o r t h e i n d i v i d u a l subsystems and s u b s e q u e n t l y combining them t o s t u d y t h e comple te system,
- t h e p e r f e c t i o n o f development models r e p r e s e n t i n g t h e comple te system, which i n t h e i r p r e s e n t form a r e a p p l i - c a b l e t o d e t e r m i n i n g t h e p r i n c i p a l long- range develop- ment s t r a t e g i e s ( s e e D6vid e t a l . , 1 9 7 4 ) .
The model s u g g e s t e d h e r e may c o n s e q u e n t l y be r e g a r d e d a s t h e f i r s t s t e p a l o n g t h e f i r s t approach .
The sys tem i s bounded on t h e ups t ream s i d e by t h e n a t i o n a l boundary, w h i l e on t h e downstream s i d e by t h e economic d i s t r i c t . I n t h e a r e a c o n s i d e r e d b o t h i n d u s t r i a l ( m e t a l l u r g y , min ing , c h e m i c a l i n d u s t r y , e t c . ) and a g r i c u l t u r a l a c t i v i t i e s a r e i n t e n - s i v e . The p o p u l a t i o n d e n s i t y i s h i g h e r t h a n t h e a v e r a g e f o r

Hungary. To t h e mountain p a r t s of t h e system impor tan t env i ron- mental i n t e r e s t s a r e a t t a c h e d . Both e x c e s s abundance and s c a r c i t y o f wa te r p r e s e n t problems i n t h e system f o r t h e fo l low- i n g two main r e a s o n s :
a ) Regional development i s accompanied by growing wate r demands and p r o p e r t y v a l u e s i n t h e p r o t e c t e d f l o o d p l a i n s i n c r e a s e s t e a d i l y .
b ) A s a consequence of f a c t o r s u n c o n t r o l l a b l e by t h e system, an a d v e r s e change has occur red i n t h e hydro- l o g i c a l i n p u t ( i n £ low) . A s a r e s u l t , major f l o o d s occur a t s h o r t e r i n t e r v a l s and t h e dry-weather f low has decreased . The wate r e n t e r i n g a c r o s s t h e upstream boundary i s more p o l l u t e d t h a n b e f o r e .
These a d v e r s e f a c t o r s a r e expec ted t o p r e v a i l i n t h e f u t u r e a s w e l l . Consequent ly , t h e need a r i s e s f o r a long-term wate r management development s t r a t e g y i n which r e g i o n a l development i s harmonized w i t h t h e n e c e s s a r y wate r management development. Although t h e f l o o d c o n t r o l and t h e wate r management s t r a t e g i e s a r e i n t e r r e l a t e d , it a g a i n w i l l be presumed t h a t t h e s e a r e i n - dependent , e x c e p t f o r t h e r e s e r v o i r s which s e r v e f l o o d r e t e n t i o n purposes a s w e l l . The o b j e c t i v e of t h e system model is, con- s e q u e n t l y , t h e d e t e r m i n a t i o n of t h e wate r r e s o u r c e s management s t r a t e g y .
Regional Development i n t h e System
1 ) Planned development i n t h e s e c t o r s c o n s i d e r e d ( s e t t l e - ment. i n d u s t r v . a a r i c u l t u r e and environment ~ r o t e c t i o n ) : The development o b j e c t i v e s must be e n t e r e d b; r e g i o n s i n t h e f i r s t s t e p a s i n p u t d a t a d i s t r i b u t e d o v e r t ime. Consequent ly , t h e expec ted l e v e l of development must be d e f i n e d f o r each s e c t o r . S t a r t i n g from t h e s e r e g i o n a l development i n p u t d a t a w e want t o f i n d t h e o p t i m a l development s t r a t e g y of wate r management which may a c t a s feedback on r e g i o n a l development. I t i s a l s o con- s i d e r e d d e s i r a b l e t o i n c l u d e development t r e n d s o t h e r t h a n t h e o r i g i n a l l y plannea ones i n t h e c o u r s e of a s e n s i t i v i t y a n a l y s i s .
Water demands: S t a r t i n g from t h e development d a t a regarded b e f o r e a s i n p u t q u a n t i t i e s , wa te r demands must be p r e d i c t e d f o r t h e v a r i o u s s e c t o r s and r e g i o n s . For t h i s purpose m u l t i v a r i a t e r e g r e s s i o n models appear a p p l i c a b l e . These models must r e f l e c t among o t h e r s t h e e f f e c t s of p o t e n t i a l changes i n t echnology ( f o r example, s u r f a c e i n s t e a d of s p r i n k l i n g i r r i g a t i o n , t h e i n t r o - d u c t i o n of a wa te r s a v i n g c o o l i n g system, e t c . ) and t h e e f f e c t s of w a t e r p r i c e s . A s a f i r s t s t e p , f o r e c a s t s based on p r e s e n t t e c h n o l o g i e s ( a t l e a s t a s f a r a s wate r i s concerned) and on t h e p r e s e n t wa te r p r i c e system a r e l i k e l y t o be used i n t h e model.

3 ) Wastewater p r o d u c t i o n : A s i n t h e p receed ing para - g raph , f o r e c a s t i n g models must be developed c o n c e r n i n g t h e volumes o f was tewate r produced i n t h e i n d i v i d u a l s e c t o r s and r e g i o n s . Here a g a i n a l lowance must be made f o r changes i n t echno logy and t h e e f f e c t s of economic i n c e n t i v e s ( p o l l u t i o n c h a r g e s and f i n e s ) .
4 ) P o s s i b l e development i n wa te r management: The a n a l y s e s must be ex tended t o t h e f o l l o w i n q major a l t e r n a t i v e s : s u r f a c e f low, r e s e r v o i r s , g round-wate r , wa te r t r a n s f e r and w a t e r r e u s e . The p o s s i b l e d i s t r i b u t i o n i n s p a c e of t h e s e s o u r c e s of s u p p l y must be d e s c r i b e d i n t e r m s of q u a n t i t a t i v e and q u a l i t y d a t a .
C o n s t r u c t i o n o f t h e Model
I n c o n s t r u c t i n g t h e model it i s sugges ted t o o b s e r v e t h e f o l l o w i n g sequence of s t e p s :
a ) The o b j e c t i v e of t h e model is t o meet t h e r e q u i r e m e n t s of r e g i o n a l development f o r wa te r management a t t h e minimum p o s s i b l e c o s t . It shou ld be no ted t h a t a n o t h e r o b j e c t i v e f u n c t i o n is t h e o r e t i c a l l y a l s o a p p l i c a b l e . I t i s c o n c e i v a b l e t h a t by minimizing t h e sum of economic l o s s e s owing t o wa te r s h o r t a g e and t h e development c o s t , a more e x a c t d e f i n i t i o n o f t h e o b j e c t i v e c a n be formu- l a t e d , b u t a model of t h i s k ind i s l i k e l y t o become t o o complex t o be s o l v e d i n t h i s p a r t i c u l a r system. I t i s n o t in tended t o r e s t r i c t s t u d i e s t o t h e s o l u t i o n of t h e o b j e c t i v e f u n c t i o n d e f i n e d above, p rov ided we succeed i n f o r m u l a t i n g t h e a c t u a l o b j e c t i v e of system development by a model which i s more e x a c t y e t s t i l l a c c e s s i b l e t o s o l u t i o n .
b ) The u n i t c o s t is r e p r e s e n t e d by t h e f o l l o w i n g sum of t h e annua l c o s t s
where
C1 a r e t h e c o s t s of w a t e r a c q u i s i t i o n and con- veyance ( inves tment and o p e r a t i o n ) ,
C 2 a r e t h e c o s t s of was tewate r t r e a t m e n t ,
C3 a r e t h e i n d i r e c t c o s t s of p r o d u c t i o n ( f o r example, t h e i n t r o d u c t i o n of a wa te r s a v i n g t echno logy r e s u l t s i n h i g h e r c o s t s of pro- d u c t i o n ) .
C ) The i n p u t t o t h e system model
The i n p u t v e c t o r i s composed of t h e f o l l o w i n g p a r t s :

- t h e h y d r o l o g i c a l i n p u t a l o n g t h e boundary o f t h e a r e a c o n s i d e r e d ,
- t h e r e g i o n a l development o b j e c t i v e s , a s i n p u t d a t a ,
- u n i t c o s t d a t a .
d ) Formulat ion o f t h e p o s s i b l e a l t e r n a t i v e s
A network o f noda l p o i n t s must be drawn up, w i t h noda l p o i n t s r e p r e s e n t i n g r e g i o n s o f w a t e r demands and s u p p l i e s . I n g e n e r a l t h e w a t e r demand i n a p a r t i c u l a r r e g i o n c a n be met from s e v e r a l p o i n t s of s u p p l y .
e ) The o u t p u t o f t h e system model
- t h e development s t r a t e g y o f w a t e r management,
- t h e h y d r o l o g i c a l o u t p u t , t h u s t h e volume and q u a l i t y of wa te r l e a v i n g t h e system.
f ) E v a l u a t i o n o f t h e p o s s i b l e a l t e r n a t i v e s
I n o r d e r t o f o r m u l a t e t h e o p t i m a l w a t e r management s t r a t e g y of t h e system o p e r a t i n g under complex p h y s i c a l , economic and s o c i a l c o n d i t i o n s it i s s u g g e s t e d t o s o l v e t h e problem i n two s t e p s , u s i n g two d i f f e r e n t models.
Model I
he ore tic ally t h i s shou ld be a r e l a t i v e l y s i m p l e model, comparable , f o r example, t o a l i n e a r programming model. Accord- i n g l y , l e t C . . be t h e u n i t c o s t (C, + C2 + C ) of mee t ing t h e
11 3 w a t e r demand a t p o i n t j from t h e supp ly p o i n t i. The problem t h e n i s t o minimize t h e f o l l o w i n g o b j e c t i v e f u n c t i o n :
where
m i s t h e number o f supp ly p o i n t s , n i s t h e number o f demand p o i n t s , x i j i s t h e w a t e r volume conveyed from s u p p l y p o i n t i
t o demand p o i n t j .
Al though a number of a ssumpt ions a r e invo lved i n t h e above model, it h a s been a p p l i e d s u c c e s s f u l l y i n s e v e r a l c a s e s f o r p l a n n i n g r e g i o n a l w a t e r management systems. One o f t h e most i m p o r t a n t b a s i c assumpt ions i s t h e u s e o f l i n e a r c o s t f u n c t i o n s . I n i t s fundamental form t h i s model o p e r a t e s , a s w i l l be r e c a l l e d , w i t h t h e f o l l o w i n g two sets of c o n s t r a i n t s :

t h a t is , t h e t o t a l wa te r demand d must be met a t t h e p o i n t j , and 1
t h a t i s , t h e supply (Si) a v a i l a b l e a t p o i n t i cannot be overdrawn.
However, owing t o t h e n a t u r e o f t h e problem, f u r t h e r c o n s t r a i n t s must a l s o be t a k e n i n t o c o n s i d e r a t i o n :
3 ) Water q u a l i t y c o n s t r a i n t s .
4 ) Hydrau l ic c o n s t r a i n t s , f o r example, t h o s e a r i s i n g from t h e c o n t i n u i t y e q u a t i o n ( s i n c e t h e supply p o i n t s a r e n o t independent , b u t a r e r e l a t e d h y d r o l o g i c a l l y , f o r example, r i v e r s e c t i o n s ) .
Bes ides t h e above f o u r k i n d s o f c o n s t r a i n t s t h e s t o c h a s t i c c h a r a c t e r o f t h e system must a l s o be a l lowed f o r i n t h e model. I n f a c t t h e wate r s u p p l i e s Si and t h e water demand a r e b o t h random v a r i a b l e s of g i v e n d i s t r i b u t i o n . I n view o f t h i s it can be s e e n t h a t a r a t h e r compl ica ted s t o c h a s t i c l i n e a r programming a l g o r i t h m c o u l d b e used f o r s o l v i n g model I .
Cons ider ing d i f f e r e n t t i m e h o r i z o n s , f o r example, 1990, 2000, 2010, s o l u t i o n s which can b e r e a l i z e d by t h e l o w e s t c o s t can be de te rmined on t h e b a s i s of t h e expec ted v a l u e . I n t h e model t h e annua l d a t a on water s u p p l i e s and demands a r e used and o p t i m a l development i s a l s o expressed i n t e r m s o f annua l d a t a . Model I i s r e g a r d e d a p r e l i m i n a r y , i n f o r m a t i v e , s o - c a l l e d " s c r e e n i n g " model, t h e s o l u t i o n o f which i s checked and improved by means o f a f u r t h e r , more e x a c t model 11.
Model I1
The d e t a i l e d d e s c r i p t i o n and method of s o l u t i o n o f model I1 a r e n o t y e t a v a i l a b l e . However, t h i s model i s b e l i e v e d t o be n e c e s s a r i l y a dynamic one, which u s e s a monthly t i m e s c a l e , a n a l y z e s a f i n i t e t ime h o r i z o n and y i e l d s t h e o p t i m a l s t r a t e q y w i t h i n a t i m e hor izon . Model I1 s t a r t s from t h e r e s u l t s of model I , u s i n g t h e s e a s i n p u t d a t a and s e e k s s o l u t i o n s which can be r e a l i z e d a t t h e l o w e s t c o s t d i s c o u n t e d t o p r e s e n t v a l u e . Owing t o i t s complex i ty , model I1 i s expec ted t o be a s i m u l a t i o n model.

4.2.2 The Development Model o f Damaqe C o n t r o l
I n t h e T i s z a V a l l e y , damage c o n t r o l i m p l i e s t h e combina t ion o f d r a i n a g e and f l o o d c o n t r o l a c t i v i t i e s . N e v e r t h e l e s s t h e f o l l o w i n g system model i s concerned e x c l u s i v e l y w i t h t h e deve lop- ment o f f l o o d c o n t r o l . For d r a i n a g e development a model formu- l a t e d on s i m i l a r c o n s i d e r a t i o n s b u t o f a d i f f e r e n t c h a r a c t e r i s needed.
From C h a p t e r s 1 and 2 it w i l l be r e a l i z e d t h a t i n t h e Hungarian p a r t o f t h e T i s z a V a l l e y t h e p o t e n t i a l development o f f l o o d c o n t r o l c o n s i s t s main ly of t h e improvement o f t h e l e v e e system. The o t h e r e n g i n e e r i n g and economic methods o f f l o o d c o n t r o l , such a s s t o r a g e , c h a n n e l r e g u l a t i o n , e t c . and f l o o d p l a i n zoning, r e s p e c t i v e l y , a r e of p o t e n t i a l i n t e r e s t o u t s i d e o f t h e system, i n t h e t e r r i t o r y o f t h e ups t ream c o u n t r i e s . W e w ish , however, t o i n c l u d e t h e impact o f t h e s e measures i n t h e development model of t h e Hungarian f l o o d c o n t r o l sys tem. A s w i l l be demons t ra ted t h i s can be accomplished by t h e a p p r o p r i a t e chang ing o f t h e h y d r o l o g i c a l i n p u t .
B a s i c C r i t e r i a (see ~ b g a r d i , 1972a, 1972b)
The system under c o n s i d e r a t i o n shou ld be d i v i d e d i n t o s e c t i o n s and each o f them can be r e p r e s e n t e d by a p a r t i c u l a r gage con- c e r n i n g b o t h t h e peak f l o o d s t a g e h and t h e f l o o d exposure w ( d u r a t i o n ) . T h i s i m p l i e s t h a t t h e peak s t a g e , o r t h e s t a g e and d i s c h a r g e hydrographs a l o n g any p o i n t of t h e s e c t i o n c a n be t r a n s f e r r e d unanimously t o t h e gaug ing s e c t i o n . The p r o t e c t i o n o f each l e v e e s e c t i o n t o f l o o d s t a g e H and d u r a t i o n W i s assumed t o b e known.
De te rmina t ion o f T r a n s i t i o n F u n c t i o n s
The t r a n s i t i o n f u n c t i o n s r e l a t e t o each o t h e r , t h e s u c c e s s i v e l e v e e s e c t i o n s p roceed ing downstream. Accord ing ly , t o t h e s t a g e o r exposure on t h e gauge o f any j - t h s e c t i o n a s t a g e o r exposure c a n be a s s i g n e d on t h e j + 1- th gauge.
where
h . , w . a r e t h e s t a g e and exposure ( d u r a t i o n ) , r e s p e c - t i v e l y on t h e j - t h gauge,
H J o j , HB . a r e t h e minimal p r o t e c t i o n s a g a i n s t f l o o d l e v e l 01
o f t h e r igh t -hand and l e f t - h a n d l e v e e s e c t i o n s , r e s p e c t i v e l y a l o n g t h e j - t h r i v e r s e c t i o n ,

W J o j , WB a r e t h e minimal p r o t e c t i o n s a g a i n s t exposure 0 j
( d u r a t i o n ) of t h e r igh t -hand and l e f t - hand l evee s e c t i o n s , r e s p e c t i v e l y , a long t h e j - t h r i v e r s e c t i o n .
I n connec t ion w i th Eqs. ( 1 ) and (21 , two fundamental c a s e s a r e d i s t i n g u i s h e d , depending upon whether a b reach i n t h e l e v e e occu r s o r n o t on t h e j - t h l e v e e s e c t i o n . I n t h e absence of a l e v e e breach on t h e j - t h s e c t i o n t h e s t a g e and exposure on t h e j + l - t h s e c t i o n a r e c o n t r o l l e d a lone by t h e hyd rau l i c c o n d i t i o n s of t h e f l o o d bed between t h e l e v e e s . I n such c a s e s bo th s t a g e s and exposures a r e determined by s imple gauge r e l a t i o n s h i p s .
I f t h e r e i s a b reach on t h e j - th l e v e e s e c t i o n , t hen lower s t a g e s and l o a d s w i l l e v i d e n t l y occur a l ong t h e downstream s e c t i o n j + 1 , t han could be expec ted from t h e s imple gauge r e l a t i o n s h i p . Allowance must be made f o r t h e water volume con- veyed a s a consequence of t h e breach i n t h e f l o o d p l a i n r a t h e r t han between t h e l e v e e s . Under a g iven set of f l ood bed and f l o o d p l a i n c o n d i t i o n s , a t a g iven f l ood hydrograph, hyd rau l i c c o n s i d e r a t i o n s i n combinat ion w i t h t h e known p r o t e c t i o n of t h e s e c t i o n w i l l y i e l d t h e t ime to of t h e breach , f u r t h e r t h e hydro- g raph of t h e d i s cha rge Q k ( t ) e n t e r i n g t h e f l ood p l a i n . Deducting
from t h e s t reamflow be fo re t h e breach t h e d i s c h a r g e a c r o s s t h e l a t t e r , t h e s t reamflow and t h e hydrograph Q , ( t ) t h e r eo f con- veyed downstream i n t h e channe l a r e ob t a ined . Once t h e d i s cha rge hydrographs Qf( t ) remaining i n t h e channe l over t h e s e c t i o n j i s known, t h e peak s t a g e and exposure a long t h e j + l - t h s e c t i o n can be determined from gauge r e l a t i o n s .
Eqs. ( 1 ) and ( 2 ) a r e t h e r e f o r e w r i t t e n f o r f u r t h e r two c a s e s e ach
f Z n ( w j ) a s w i th f l n
f 2 s ( w j ) a s w i th f l
where i n a d d i t i o n t o t h e symbols exp la ined be fo r e , f l n and f 2 n a r e
t h e t r a n s i t i o n f u n c t i o n s i n t h e absence of a b reach , whi le f l s and
£ z s a r e t h e t r a n s i t i o n f u n c t i o n s i n t h e c a s e of a breach.

The Determinat ion o f t h e Loss F u n c t i o n s
I n c o n n e c t i o n w i t h t h e t r a n s i t i o n f u n c t i o n s it h a s been s t a t e d a l r e a d y t h a t f o r a g iven s e t o f c o n d i t i o n s it is p o s s i b l e t o de te rmine t h e hydrograph Q k ( t ) of d i s c h a r g e s e n t e r i n g t h e f l o o d p l a i n th rough a breach. For a p a r t i c u l a r hydrograph Q k ( t ) , t h e s i z e o f t h e a r e a inundated w i l l be c o n t r o l l e d by t h e topography i n t h e f l o o d p l a i n . The v a l u e o f t h e a r e a inunda ted d u r i n g t h e f l o o d wave ( o r t h e damages caused by i n u n d a t i o n ) a r e r e l a t e d t o t h e paramete rs r e s u l t i n g i n t h e b reach a s
where R; i s t h e l o s s caused a l o n g t h e j - t h s e c t i o n by a s i n g l e J
i n u n d a t i o n a t t h e f l o o d wave and p r o t e c t i o n paramete rs invo lved i n t h e r e l a t i o n s h i p . The f l o o d wave paramete rs h; and w; a r e
J J random v a r i a b l e s and w i t h t h e r e l e v a n t r e c o r d s a v a i l a b l e it i s p o s s i b l e t o f i n d t h e i r j o i n t d i s t r i b u t i o n :
where f 4 is t h e j o i n t d e n s i t y f u n c t i o n o f h and w j j '
The magnitude of t h e expec ted annua l damage a l o n g t h e j - t h s e c t i o n i s o b t a i n e d by summing t h e p r o d u c t s o f t h e c o r r e s p o n d i n g p j and R v a l u e s :
j 1 f
A s i n t h e c a s e o f t h e t r a n s i t i o n f u n c t i o n s , Eq. ( 7 ) is w r i t t e n f o r t h e two c a s e s d i s t i n g u i s h e d above. I n t h e absence of a b reach t h e r e is e v i d e n t l y no damage, s o t h a t i n Equ. ( 9 ) t h e lower l i m i t o f t h e i n t e g r a l i s p r a c t i c a l l y t h e p r o b a b i l i t y v a l u e p j o a t which such v a l u e s of h . , w a r e expec ted which c a u s e no
I j f a i l u r e , t h a t i s , damage on t h e s e c t i o n . Consequent ly , i n t h i s r a n g e t h e i n t e g r a l ( 9 ) assumes 0 v a l u e .
I n t h e c a s e o f a b reach , a s mentioned b e f o r e , t h e magnitude of t h e damage i s determined by examining t h e a r e a inunda ted . The d e s c r i p t i o n o f t h e r e l e v a n t i n v e s t i g a t i o n would exceed t h e scope of t h e p r e s e n t paper and it w i l l be no ted o n l y t h a t t h e l o s s e s c a n be e s t i m a t e d on t h e b a s i s o f a 1 :10,000 s c a l e map by c o n s i d e r i n g uns teady f low. The r e l e v a n t computa t ions can be performed on a computer.

The Dete rmina t ion o f C o s t F u n c t i o n s
With t h e p a r a m e t e r s mentioned i n c o n n e c t i o n w i t h t h e t r a n - s i t i o n and l o s s f u n c t i o n s t h e development c o s t s o f e a c h s e c t i o n a r e g i v e n by t h e c o s t f u n c t i o n s . No c o s t s a r i s e u n l e s s it is d e s i r e d t o improve t h e p r o t e c t i o n o f t h e l e v e e s o v e r t h e p r e s e n t v a l u e s Ho and Wo. The c o s t o f development c o v e r t h e j - t h i s e c t i o n is t h u s e x p r e s s e d by t h e f o l l o w i n g f u n c t i o n
The c o s t s o b t a i n e d by Eq. ( l o ) , which a r e n o n r e c u r r i n g c o s t s , a r e m u l t i p l i e d by t h e d i s c o u n t f a c t o r d f o r comparing them w i t h t h e expec ted a n n u a l l o s s e s
where C i s t h e a n n u a l c o s t . j
De te rmina t ion of t h e O b j e c t i v e Func t ion
The o b j e c t i v e f u n c t i o n r e f e r s t o t h e d e t e r m i n a t i o n o f t h e sys tem development a t which t h e sum of t h e expec ted annua l l o s s e s and o f t h e development c o s t s i s minimum. For e a c h s e c t i o n j o f t h e sys tem a development a l t e r n a t i v e i s assumed ( H ,..., H . 1 ' ~ 1 1, W j , .. . , H n , W n ) and t h u s a development a l t e r n a t i v e i s o b t a i n e d - f o r
t h e system. For t h e most ups t ream s e c t i o n t h e expec ted a n n u a l l o s s L1 k s found from Eqs. ( 7 ) and ( 9 ) , t o g e t h e r w i t h t h e a n n u a l
c o s t C1 a c c o r d i n g t o Eqs. (1 0 ) and (1 1 ) .
With t h e h e l p of t h e t r a n s i t i o n f u n c t i o n s , Eqs. ( 3 ) t o (61, t h e computa t ion i s r e p e a t e d f o r t h e s u c c e s s i v e downstream s e c t i o n s 2 t o n. The L C. v a l u e s t h u s o b t a i n e d a r e summed:
j 1 I
where K is t h e v a l u e o f t h e o b j e c t i v e f u n c t i o n p e r t a i n i n g t o i
t h e i - t h development a l t e r n a t i v e of t h e system. The computa t ion i s t h e n r e p e a t e d f o r a d d i t i o n a l development a l t e r n a t i v e s . If t h e

number o f development a l t e r n a t i v e s by s e c t i o n s i s b and t h e number o f s e c t i o n s i s n , t h e n t h e computa t ion must be r e p e a t e d bn- t imes f o r t h e system.
The o b j e c t i v e f u n c t i o n becomes a c c o r d i n g l y
I ( H j i , W . . ) 3 1 = min K i
where
I i s t h e symbol o f t h e o p t i m a l development a l t e r n a t i v e f o r t h e system,
H j i , W j i a r e t h e d e g r e e s of development o v e r t h e j - t h s e c t i o n
p e r t a i n i n g t o t h e i - t h system-development a l t e r n a t i v e .
The compute r ized s o l u t i o n o f t h e problem d e s c r i b e d c a n be performed by s t o c h a s t i c dynamic programming.
REFERENCES
~ o g d r d i , I. (19721, "Flood C o n t r o l Under S p e c i a l Hungarian Con- d i t i o n s , " I C I D E i g h t h Congress , Varna, B u l g a r i a .
~ o g d r d i , I . ( 1 9 7 2 ) , "Flood C o n t r o l , " L e c t u r e Notes , UNESCO, Pos t - Gradua te T r a i n i n g Course i n Hydrology, Budapest .
Buras , N . ( 1 9 7 2 ) , S c i e n t i f i c AZZoca t ion o f Water R e s o u r c e s , E l s e v i e r , Amsterdam.
Ddvid, L., F . Sz ida rovszky , and L. Ducks te in , ( 1 9 7 4 ) ; "Dynamic Model f o r Long-Term Development o f Water Resources Management" ( i n E n g l i s h ) , F IP Working Conference on Modeling and S i m u l a t i o n of Water Resources Systems, U n i v e r s i t y o f Ghent , Ghent, Belgium.
Ddvid, L., and Z . S z i g y d r t 6 ( 1 9 7 3 ) , " C o n t r o l o f Water D i s t r i - b u t i o n i n t h e Water Management System of t h e Hungar ian S e c t i o n o f t h e T i s z a River" ( i n Hungarian and R u s s i a n ) , EVM-GESZ-73 Symposium, Leningrad.
Dggen, I . (1 974) , "Water Resources Management" ( i n Hungar ian) , Pos t -g radua te L e c t u r e Notes , ~ a n k o n y v k i a d 6 , Budapest .
Dggen, I. ( 1 9 7 4 ) , " U t i l i z a t i o n o f t h e T i s z a River i n Hungary and Water Management C o o p e r a t i o n o f t h e c o u n t r i e s s h a r i n g t h e T i s z a V a l l e y " ( i n H u n g a r i a n ) , Vizugy i ~ o z l e m 6 n y e k , 2.
Dggen, I . ( 1 9 7 2 ) , Economic F o u n d a t i o n s o f Water Management ( i n H u n g a r i a n ) , ~ a n k o n y v k i a d 6 , Budapest .

~ Q g e n , I. ( 1 972) , "Hydroeconomics" ( i n Hungar i an ) ; Pos t -Gradua te L e c t u r e No tes , ~ a n k o n y v k i a d 6 , Budapes t .
"The 1965 F lood o n t h e Danube and t h e 1970 F lood i n t h e T i s z a V a l l e y " ( i n Hungar i an , w i t h summaries i n f o r e i g n l a n g u a g e s ) , s p e c i a l numbers o f Vizi igyi K8zlem6nyek.
F o g e l , M. , and I. B o g s r d i , (1 974) , " C o o p e r a t i v e R e s e a r c h Between t h e VIKbZ (Hungary) and t h e U n i v e r s i t y o f Ar i zona (USA) ," I F I P Working C o n f e r e n c e o n Model ing and S i m u l a t i o n o f Water R e s o u r c e s Sys t ems , Ghen t , Belgium.
H a l l , W.A., and J.A. Dracup ( 1 9 7 0 ) , Water Resources Sys tems Eng ineer ing , McGraw H i l l , New York.
I n s t i t u t e f o r ~ y d r a u l i c P l a n n i n g (19741, " p r e l i m i n a r y R e p o r t o n t h e Csongr6d B a r r a g e ( i n H u n g a r i a n ) , Budapes t .
J ames , L.D., and R.R. Lee ( 1 9 7 1 ) , Economics o f Water Resources Planning. PlcGraw H i l l , New York.
K i e n i t z , G . ( 1 972) , "EXPRE Model f o r E s t i m a t i n g Undra ined Runoff Volume f rom P r e c i p i t a t i o n " ( i n Hungar i an ) , VITUKI Con- f e r e n c e , Budapes t .
K i e n i t z , G . ( 1 9 6 9 ) , " O p e r a t i o n o f D r a i n a g e Sys t ems and Problems R e l a t e d t o Improving t h e i r E f f i c i e n c y ( i n H u n g a r i a n ) , T h e s i s f o r t h e C a n d i d a t e ' s T i t l e , Budapes t .
"The K i s k 6 r e B a r r a g e " ( i n ~ u n g a r i a n , w i t h summaries i n f o r e i g n l a n g u a g e s ) . V i z u g y i KEzZem6nyek (1 973) .
~ e s z g n a , Gy., J. Szgp, and J. Varga ( 1 9 7 2 ) , "Dynamic Model f o r t h e Op t ima l A l l o c a t i o n o f F lood C o n t r o l Development Funds ( i n I i u n g a r i a n ) , VSZSZI R e p o r t , Budapes t .
d e N e u f v i l l e , E . , and J . R . S t a f f o r d ( 1 9 7 1 ) , "Sys tems A n a l y s i s f o r E n g i n e e r s and Managers." McGraw ill, New York
d e N e u f v i l l e , R., " C o s t - e f f e c t i v e n e s s A n a l y s i s o f C i v i l E n g i n e e r i n g Sys tems: New York C i t y ' s P r imary Water S u p p l y , " Opera t ions Research , 18, 5 ( 1 9 7 0 ) .
P r e k o p a , A * , and I. I j j a s ( 1 9 7 4 ) , "Opt imal O p e r a t i o n C o n t r o l o f C o o p e r a t i n g R i v e r B a r r a g e s w i t h Al lowance f o r t h e M u l t i - P u r p o s e U s e o f S t o r a g e Water" ( i n H u n g a r i a n ) , R e s e a r c h R e p o r t , Budapes t U n i v e r s i t y o f Technology.
S a l a m i n , P . , and A. Barna ( 1 9 7 2 ) , "Uniform P a r a m e t e r s f o r D e - s c r i b i n g Water Management and Economic A c t i v i t i e s " ( i n H u n g a r i a n ) , E x p e r t i s e , a u d a p e s t .
~ z 6 s z , I. ( 1 9 7 4 ) , " S i g n i f i c a n c e o f Runoff C o n t r o l i n t h e T i s z a R i v e r B a s i n " ( i n H u n g a r i a n ) . VIKOZ Comprehensive Repor t .

VIKOZ Comprehensive Report (1 974a) , "Study on Flood Control Development in the KGros Valley" (in Hungarian), !lanuscript, Budapest.
VIKOZ Comprehensive Report (1974b), "Flood Control Development along the Upper Tisza River'' (in Hungarian), Manuscript, Budapest.
VIKOZ (1974c), "Technico-Economic Study on the ~ajduhsts;~ Multi-Purpose Water Resources System," VIROZ-University of Arizona (USA) , Budapest.
VIK~Z Comprehensive Report (1974d), "Study on Meeting the Water Demands in the Tisza Valley" (in ~ungarian), Budapest.
VIKOZ Comprehensive Report (1 974e) , "Effect on Hungary of Water Management Development in the Tisza Valley" (in ~ungarian), Budapest.

River Basin Network Modelling and Its A p p l i c a t i o n
t o t h e T i s z a River Basin
Pave1 Koryavov and I g o r Belyaev
1 . INTRODUCTION
Computer s i m u l a t i o n of complex dynamic systems combined w i t h decis ion-making methods i s becoming one o f t h e main t e c h n i q u e s f o r systems d e s i g n , and i s an impor tan t g o a l of t h e IIASA Water Resources P r o j e c t . I n t h i s p a p e r , p o s s i b l e v a r i a n t s o f r e g i o n a l development under t h e c o n d i t i o n of a wa te r d e f i c i t a r e ana lyzed .
An e s s e n t i a l b lock o f a s i m u l a t i o n system i s t h a t which r e p r e s e n t s t h e r i v e r b a s i n and i t s development p e r s p e c t i v e s . Models of t h i s block should beg in by s e l e c t i n g r e a s o n a b l e water- u s e a l t e r n a t i v e s . By u s i n g t h e model p r e s e n t e d i n t h i s paper , it i s p o s s i b l e t o c o n s i d e r t h e problem of r e g i o n a l water r e s o u r c e s u s e i n aggrega ted indexes . I f t h e exogenous f a c t o r s , i . e . wea ther p r e d i c t i o n and runof f i n a r i v e r b a s i n , a r e g i v e n , p lann ing e x p e r t s can s t u d y t h e consequences of d i f f e r e n t measures. The model c a n a l s o be used t o s o l v e o p t i m i z a t i o n problems; it h a s been a p p l i e d t o a c o n c r e t e s i t u a t i o n , t h a t of t h e Hungarian p a r t of t h e T i s z a River Basin.
2 . NETWORK MODEL OF A RIVER BASIN
The e n t i r e r i v e r b a s i n system may be i l l u s t r a t e d by a n o r i e n t e d g raph (wi thou t c y c l e s ) o r network ( s e e F i g u r e 1 ) . T h i s g raph i s n o t a t r e e because of t h e a r t i f i c i a l c h a n n e l s and wate r l i n e s t h a t a l l o w t h e removal of water from one p o i n t of t h e r i v e r and i t s r e t u r n t o a n o t h e r .
The network nodes a r e p o i n t s d e n o t i n g t h e f o l l o w i n g :
- D i f f e r e n t r u n o f f a r e a s cor responding t o each t r i b u t a r y c o n s i d e r e d ;
- L o c a t i o n s where t r i b u t a r i e s e n t e r , and t h o s e o f r e s e r v o i r s and o t h e r h y d r o t e c h n i c a l c o n s t r u c t i o n s on t h e r i v e r and i t s t r i b u t a r i e s ;
- Loca t ion of wa te r i n t a k e by and r e t u r n from t h e u s e r s .
One of t h e c o n d i t i o n s f o r u s i n g t h e model is t h a t t h e l e n g t h of t h e r i v e r r e a c h ( i . e . t h e d i s t a n c e between a d j a c e n t

nodes ) b e l e s s t h a n t h e d i s t a n c e t h e r i v e r f l o w s d u r i n g t h e t i m e i n t e r v a l c o n s i d e r e d . T h i s c r i t e r i o n r e s t r i c t s t h e number o f nodes and t h e i r l o c a t i o n s .
D i r e c t e d a r c s c o n n e c t nodes and i n d i c a t e t h e d i r e c t i o n o f t h e w a t e r f l o w ( F i g u r e 2 ) . Some v a l u e o f Fii i s a s s i g n e d t o
e a c h o f t h e a r c s c o n n e c t i n g nodes i and j ; Fii is e q u a l t o t h e -2
volume o f t h e w a t e r f l o w from node i t o node j d u r i n g t i m e i n t e r v a l t. Nodes may b e d i v i d e d i n t o t h o s e w i t h b o t h i n g o i n g and o u t g o i n g a r c s ( f o r which a b a l a n c e e q u a t i o n c a n b e w r i t t e n ) , and f i c t i t i o n s nodes w i t h e i t h e r i n g o i n g o r o u t g o i n g a r c s .
Nodes w i t h i n g o i n g a r c s d e n o t e t h e w a t e r o u t f l o w from t h e r i v e r sys tem ( i - e . non- re tu rn l o s s e s of w a t e r and t r a n s f e r o f w a t e r t o a n o t h e r r e g i o n ) . Fio d e n o t e s t h e o u t f l o w from t h e
sys tem t h r o u g h t node i. Nodes w i t h o u t g o i n g a r c s i n d i c a t e t h e w a t e r i n f l o w t o t h e r i v e r sys tem, which c o u l d b e f rom p a r t s o f t h e r i v e r b a s i n , t r i b u t a r i e s , c h a n n e l s o r s u r f a c e s , o r from a n underground i n f l o w . I n f l o w t o t h e sys tem th rough node i i s d e n o t e d by Foi.
FIGURE 2
FIGURE 3
Figures 1-3. Network flow diagram of the storage process.

Volumes of wa te r s t o r e d i n t h e network nodes W i ( t ) w i l l be c o n s i d e r e d phase v a r i a b l e s o f t h e system, where 1 = number of nodes and t = number of t i m e i n t e r v a l s . For each node w e w i l l have t h e f o l l o w i n g b a l a n c e e q u a t i o n :
where
F ~ i , i = volume of water i n f l o w t o t h e r i v e r system th rough t h e a r c s e n t e r i n g node i,
F . = volume of wate r o u t f l o w from t h e r i v e r l l r i system th rough t h e out-going a r c s of node i,
d u r i n g t i m e i n t e r v a l t .
The phase v a r i a b l e s Wi a r e s u b j e c t t o t h e f o l l o w i n g c o n s t r a i n t s :
For t h e nodes d e n o t i n g r e s e r v o i r l o c a t i o n s ,
'i max = maximum s t o r a g e c a p a c i t y ,
'i min = minimum volume of water t o be s t o r e d .
'i max i s d e f i n e d by t h e s t o r a g e c a p a c i t y of t h e r e s e r v o i r ,
and Wi min by such f a c t o r s a s t r a n s p o r t a t i o n , ecology and
r e c r e a t i o n .
- For a l l o t h e r network nodes, Wi min - 'i max = 0, and
t h e dynamic e q u a t i o n ( 1 ) can be reduced t o a b a l a n c e e q u a t i o n t h a t d e s c r i b e s c o n s e r v a t i o n of wa te r f low i n a node; t h a t i s ,

Values F ( i , j $ 0 ) a r e t h e c o n t r o l v a r i a b l e s t h a t r e p r e s e n t e i t k a r t h e amount o f w a t e r s u p p l i e d t o u s e r s o r t h e f l o w a l o n g t h e r i v e r , t r i b u t a r y , o r c h a n n e l . When t h e node i s n o t a s t o r a g e node, t h e s e v a r i a b l e s may b e found by u s i n g t h e f low b a l a n c e e q u a t i o n ( 3 ) . Values F ig can be found a u t o m a t i c a l l y s i n c e t h e y a r e e i t h e r functions of t h e ingo ing l o s s e s , o r g i v e n v a l u e s ( i f t h e y r e p r e s e n t t h e w a t e r t r a n s f e r r e d form one r e g i o n t o a n o t h e r ) . Also, Fio c a n be a c o n t r o l v a r i a b l e i f t h e consumer makes u s e of t h e t o t a l amount o f wa te r o b t a i n e d from t h e r i v e r b a s i n . Values F i j ( t ) a r e s u b j e c t t o t h e f o l l o w i n g c o n s t r a i n t s :
where
+ d i j = c i t y o r i r r i g a t i o n a r e a ( C I A ) demand o r
maximum c a p a c i t y o f t h e r i v e r r e a c h , t r i b u t a r y , o r c h a n n e l ;
d i j = minimum amount o f wa te r needed f o r u s e r s ' i n d u s t r i a l a c t i v i t y , f o r t r a n s p o r t a t i o n a l o n g t h e r i v e r , t r i b u t a r y o r c h a n n e l , o r f o r p r e s c r i b e d s a n i t a r y and e c o l o g i c a l s t a n d a r d s .
L e t u s c o n s i d e r a few examples ( F i g u r e s 1 , 2 and 3 ) . F i g u r e 1 shows t h e s t o r a g e node. Areas shown may b e d e f i n e d a s f o l l o w s :
F i -~ , i = volume o f w a t e r coming from t h e upper f low o f node i - 1 ;
Fi, i+l = volume o f w a t e r f lowing t o downstream node i a l a l o n g t h e r i v e r bed;
F k r i = volume of i n f l o w from t r i b u t a r y node i ;
= volume o f w a t e r s u p p l i e d from node i t o t h e u s e r s ( c i t i e s and i r r i g a t i o n sys tems) i n node S;
Fo i = volume of s u r f a c e and underground i n f l o w from which t h e volume o f evapora ted w a t e r i s s u b t r a c t e d ; Foi should b e g i v e n on t h e b a s i s o f w a t e r f o r e c a s t .
These d e f i n i t i o n s may a l s o b e a p p l i e d when i is a s t o r a g e node, because when f u l l s t o r a g e c a p a c i t y i s reached , t h i s node w i l l work a s a node t h a t t r a n s f e r s w a t e r .

3. USE OF THE NETWORK MODEL
We see that the functioning of the river can be illustrated in the form of a dynamic system with discrete time. The description of our model is based on integral characteristics that are valid independent of time and space scales. To find the integral characteristics of the water flow, we should solve corresponding hydrodynamic problems. In models of this type, it is possible to use an average value of the river reach capacity and to neglect some transfer processes such as, for example, flood propagation along the river. It is therefore necessary to consider a long time interval, that is, one that is (at least) longer than the time needed for water to flow from one node to the next.
Let us consider our model with the given control variables Fji(t) that allow us to solve the following boundary value problem: find all phase variables and their functions entering in balance equations (as non-return losses) at any time interval t for given Foi(t). Thus, the model can be used as a simulation system.
By changing in some way the control variables Fji(t) and the constraints (i.e. the distribution of water among users and the conditions of basin functioning) we can estimate the results of the decisions made. An important feature of the application of our model is that it permits investigation of critical situations. For this, we will use a procedure that resembles a game in which one of the players is Nature.
The values of Foi(t) (i.e. the "nature factor") pose difficulties. Those responsible for planning water resources development should consider this factor. Through the process of man-machine analysis, we can identify new storage sites and their volumes. The planners have at their disposal normative costs of hydroconstructions as well as estimates of the economic effects of water use on the city and irrigation areas and industry. They can thus use our model to obtain various types of information that would allow a comparison of decision variants for the water resources system.
Note that our model is rough and can be used only for first-stage analysis to eliminate non-compatible variants. Nevertheless, it has a few advantages. Since the time and space intervals can be altered over a broad range, it is easy to match the model with those of industry, cities and irrigation systems, using the same time interval.
The model could be used for operational control. When meteorologic and hydrologic forecasts change, the model makes it possible to estimate easily the required changes in the structure of water allocation. It is thus an essential block of the general simulation system.

The model can also be used for solving optimization prob- lems. An interesting problem is that of finding the control variables that minimize damage from overflow and damage to users from water shortage. The objective function then will have the form:
N M L t min = I 1 p i t - Fki ( + I PZi(Eir (t) , I
where
t Pli = function of losses due to shortage of
water supply for users,
t PZi = function of losses caused by overflow,
M = number of users,
L = number of river reaches,
N = number of time intervals.
Solutions to optimization problems should be given the form t t t of the functions Pli and PZi, and values F . (t) and dki(t).
0 1
4. CHARACTERISTICS OF THE TISZA RIVER BASIN
The Tisza River Basin has been selected as a case study for the application of the network flow approach. The Tisza River is a main left-side tributary of the Danube. The basin is 976 km long, and has a total area of 156,000 km2 as well as a complex relief. About half of the river is in flat territory that is bounded on the north, the east and the south-east by the Carpathian Mountain range. The climate in the basin is temperate continental; the average yearly temperature ranges from 3O to 90 C in the northern part, and from 8O to 110 C in the southern part. The vegetative period varies from 166 to 236 days. The basin's total annual precipitation is 1200-1400 mm in the hilly parts and 550-580 on the plains.
A network flow diagram for the Hungarian part of the Tisza River Basin is shown in Figure 4. Nodes and arcs in the figure have the following meanings:


S P E C I F I C A T I O N r a z s
@ - TRIWTARIES Ri = TRIMARIES I Ri = 1 R, PO
F, r FLOW ALONG REACUES a . STORAGES Ei . WERFLOW
dl - C I A (CITY A W IRRIGATION AREA) DEMANDS
= CITIES U, C I A SHORTAGES
r, . C I A RETURNS
= lRRIG*TION AREA hi = c I A L O s s ~ S
0 . REACH ENDS S1 s REQJLAR FLOY FROM STORAGE
% - SPILL -WAY FLDW CITY A N IRRIGATION
O = AREA LOSSES
Figure 4. Network flow diagram of the Tisza River Basin.

Nodes : = t r i b u t a r i e s (i = 0 , 1 , ..., 101,
= T i s z a s o u r c e , 0
R1 = V i s e u ,
R2 = I z a ,
R3 = T e r e s v a ,
R4 = Borzava,
R5 = Szamos,
R6 = Bodrog,
R7 = S a j 6 ,
R8 = Koros,
Rg = Maros
R1 0 = Danube
s t o r a g e s (i = 24, 27, 37) , 24 = Besha,
27 = T i s z a l o k ,
37 = Kiskore ;
c i t i e s (i = 23, 39, 44, 48, 491,
23 = Fehgrgyarmet ,
29 = Debrecen
39 = Szolnok,
44 = Szeged,
48 = P o l g b r ,
49 = Csongrdd;
i r r i g a t i o n a r e a s (i = 31, 41 ) , 31 = T i s z a l o k ,
41 = Koros sys tem;
r e a c h e n d s (i = 0 , 1 , 2 , ..., 19) ( e n d s o f r e a c h e s a r e l o c a t e d a t s p e c i f i c p o i n t s where e i t h e r t h e t r i b u t a r i e s e n t e r o r t h e u s e r s t a k e o r r e t u r n t h e w a t e r ) ;
CIA l o s s e s ( t h e s e nodes a r e n o t marked by numbers because t h e y a r e used o n l y t o i n d i c a t e t h e e n d s o f t h e a r c s ) ;
Arcs :
Ri = t r i b u t a r y i n f l o w s (i = 1 , 2 , . . . , l o ) , I i

9 = flows along reaches (i = 1,2,..-,18), i
E~ = overf lows (i = 1 ,2,. . . ,18 ) , di = C I A demands (i = 1,2,. . . ,8), mi = C I A shortages (i = 1,2,. . . ,8), r . = C I A returns (i = 1,2,. . . ,8) , Ai = C I A losses (i = 1,2, ..., 81, S1 = regular flow from storage,
S2 = spillway flow from storage.
The distribution of water resources in the Tisza River Basin is extremely nonuniform in time and space. This causes floods (in the spring period) and droughts (in the summer-autumn period). The seasonal runoff for the various tributaries and rivers during a mean of the wet years is given in Table 1.
Table 1. Runoff in the Tisza River Basin for the average wet 3 year (km ) .
Rivers and
T r i b u t a r i e s
T i s z a Source
Viseu
I z a
Teresva
~ o r ^ i a v a
Szamos
Bodrog
Cz i su l A l b
~ i j r i j s
Maros
Danube
I d e n t i - f i e r s i n Fig. 4
RD
R1
R2
R3
R4
R5
R6
R7
R8
R9
R10
Months
X I I - I
.05
.2
.1
.22
.06
.43
.35
.16
.02
.55
4.0
V I I I - I X
.16
.47
.16
.94
.15
.22
.10
.08
.O1
-27
10.0
X-XI
.1
.31
.11
.62
.13
.43
.35
.15
-02
.55
8 .O
11-111
.1
.42
-26
.36
.13
1.3
1.0
.5
.03
.83
12.0
IV-V
.42
2.5
.42
1.3
.50
1.3
1.0
-43
.04
1.1
28.0
V I - V I I
.21
.83
.42
.83
-29
.64
-57
.24
.08
2.2
18.0

There are many hydrotechnic constructions in the Tisza River Basin; the two main types are reservoirs and dikes (or levees) . The total reservoir volume is 0.6 km3, and the total length of the dikes about 4,000 km. Add'tional reservoirs with a total capacity of about I kmf are, of necessity, under construction, and the dike system is being improved. Large-scale investments in development and construction of water resources units are related to growth plans for industry, agriculture and cities in all countries located in the Tisza River Basin, since growth leads to increasing amounts of pollutants in the basin and thus presents problems of water quality.
There are several reasons for our analysis of the Tisza River Basin. These are:
- The basin's physical structure (geology, topography, hydrology) is known;
- Three main problems of water resources exist in the basin: shortages of water during the dry period, floods produced by rainfall during the spring and the summer, and water quality;
- The data are available (it appears that most of the necessary data could be supplied to IIASA by the Hungarian National Water Authority);
- The river basin is international (Czechoslovakia, Hungary, Romania, USSR and Yugoslavia have parts of their territories within the basin).
5. OPTIMIZATION PROBLEM FOR THE TISZA RIVER BASIN
This paper considers the following two aspects of the problem of water resources control in the Tisza River Basin:
- Water distribution among consumers at different time intervals (seasons) during a one-year period;
- Prevention or reduction of overflow during a flood period (i.e. a decrease in flood damage).
Water quality, navigation, and recreation are not considered, although these three factors could easily be taken into account by introducing restrictions in the form of:
t F: 2 Pi min

where
t Fi min = minimum flow permitted in a reach,
t i min = minimum volume of water permitted in a
storage reservoir.
t Estimates of the values F. 1 min and Wi min can be made from
submodels for water quality, navigation and recreation.
To minimize both water shortage and overflow, we need an objective function written in the form:
where
t pYi (ui) = function of losses due to shortage of water for users,
Pt (E. 1 = function of losses caused by overflow. 21 I
Defining these functions is a problem not considered in this paper. We shall assume that these functions are given as convex functions of their arguments, and can be approximated by a broken line, as shown in ~igure 5. The objective function to be minimized will then take the form:
t t t 1 (vjl Ejl Yj2 Ej2)
j = 1 ,

t t t t B i l l Bi2, yjlt yj2r (1 = 1,.-.,8 i
are given coefficients. This minimization is subject to constraints related to the phase variables shown in Table 2. When necessary, the number of terms in the broken-line approximations can be increased.
Figure 5. Function of losses due to (a) water shortage and (b) overflow.

T a b l e 2 . C o n s t r a i n t s o f t h e m i n i m i z a t i o n .
t t t t t t t F1 = Ro + R1 + R2 + R3 + R4 - E l 1
t t t t F; = F1 + Y l - d; + El - E2 ,
t t t t F: = F~ + r l + E~ - E) ,
t t t F t = F: + R5 + E3 - E4 4
t t t t t F 5 = F 4 + S 1 + S 2 + E4 - E: ,
t t t t t F:
t = F: + wi - d 2 + w: - d 4 + E~ - E~ - + ~ 2 7
t t t t t t F ; = F + R + a 3 - d 3 + E g - E 7 ,
6 7
8 t ~ k , F~ = F: + r3 + E) -
t t F: = F~ + r4 + E~ - E: ,
t t t t t t = F g + E - E l O - 137 + M 3 7 ,
F1 0
t t t F ~ : = F~~ + r2 + 110 - E , ~ ,
t t t t F1; = F l l + W 5 - d 5 + E
1 1 - E t 2 ,
t t t t F 1 3 = F 1 2 + r5 + E 1 2 - E13 ,
t t t F1: = F13 + W 6 - d 6 + E13 - E : ~
,
t t t t t ~~k = F~~ + R~ + r6 + u 8 - d g + E~~ - E~~ ,
t t t t t t F ~ : = F ~ ~ - R ~ + ~ ~ + w ~ - d 7 + E ~ ~ - ~ ~ ~ ,
t t t t F 1 7 = F16 + r7 + r7 + E16 - E17 ,
F18 = F17 + R1O + E17 - E18 '

t E: = Eil t Ei2 1 (1 = 1r21...r18) . t t t
W . = wil + oi2 . (1 = 1.2... . .8) . A: = at dt
1 0 i i = 1r2r...r8)
F; 1 Ft i rnin (i = 1.2.....18)
t t EilrEi2 > 0 (i = 1.2.....18) . wil .wi2 > 0 (i = 1.2.....18) . dE 2 w: 2 o (i = 1.2.... .8) . rf > o 1 - (i = 1.2... . .8)
t t > Wi 2 Wi min 'i max - (i = 25.27.37)
t > , : L o 1
'1 max -
s g 1 0 1
t t Ii rnax 2 Ii 2 O (i = 25.27.37) . t > M t > O
Mi max - 1 - (i = 25.27.37) .
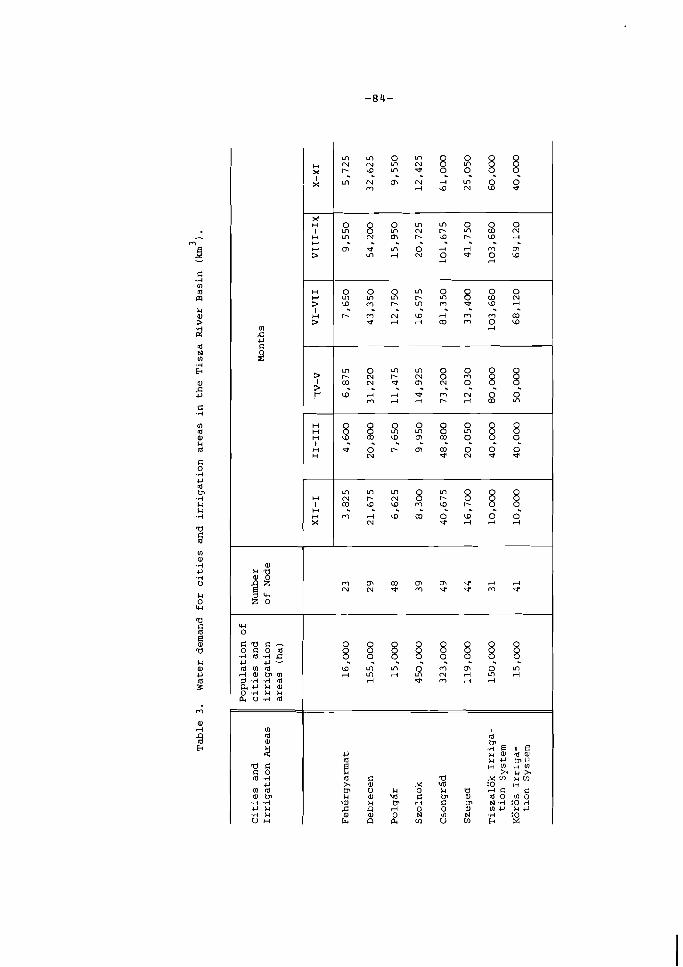
m m o m m N 8 4 r . o y T q ? $ e m ~ m ~ m
m d w C u S $
a $ : ? S % N 0 0 m . . . ? . o p . w - ?
m 4 ~ 0 e o w m c r m 0 4 4 m m
4 rl
4 4 4 4 8 R . o " , r - Y " , T ' D , r l
e 4 d C O m o w p m N w 4 m m C 0
4
; W E ; X " 8 8 . . . . - 9 . . W c r W N O O
m 4 4 r - 4 C O m
8 8 4 4 8 4 8 8 . o " O , ' D , = ! " O , ? ? O - e o w m
N $ 8 % g
m w - ? I q r $ 8 8 8 m w c n o w 0 0
N - 4 4 4
m .c 4J
e
x
X
H I H H
;I
"
;I
=1 H H
H 1 H H X
a, : 2 9 u z 0
W 0
C'(1 C - o c o m .A m .A
4J m m m u 4 0 m m 3 .A .A m a 0 L! m 0 .A L! L! P, u.4 m
m m o ) m m * 4 4 N N * m q * m *
~ m m o m m o m 8 8 8 8 8 8 8 8 . . . . . . 4 m d ~ 1 ~ 4 m . -
4 * m r ( . -

m C +J
0 r:
z z
c .rl +J
IT .rl U H
a m m P) m
.rl m +J 0 .rl U U a:
H X I
X
X H
I H H
2
H
2
? z
H H H I H H
H I H m X
N N W W W W N W . . . . . . . .
w w r - r - m m a a . . . . . . . .
m a r - ~ w w m m . . . . . . . .
m m m m m m w w . - . . . . - .
m m m m m m w w . . . . . . . .
N N N N N N r l r l . . . . . . . .
m m m a m ~ r l r l N N e m e e m O
+J
a a 2 d C h 0 Ln
.rl +J C m o IT .rl
.rl +J 0. u m
U m H .rl
U m c a x u h P) x \m :o H I T 0 U o U a - l U \ m C I J I m m
\ Q U I T r l C m N : O
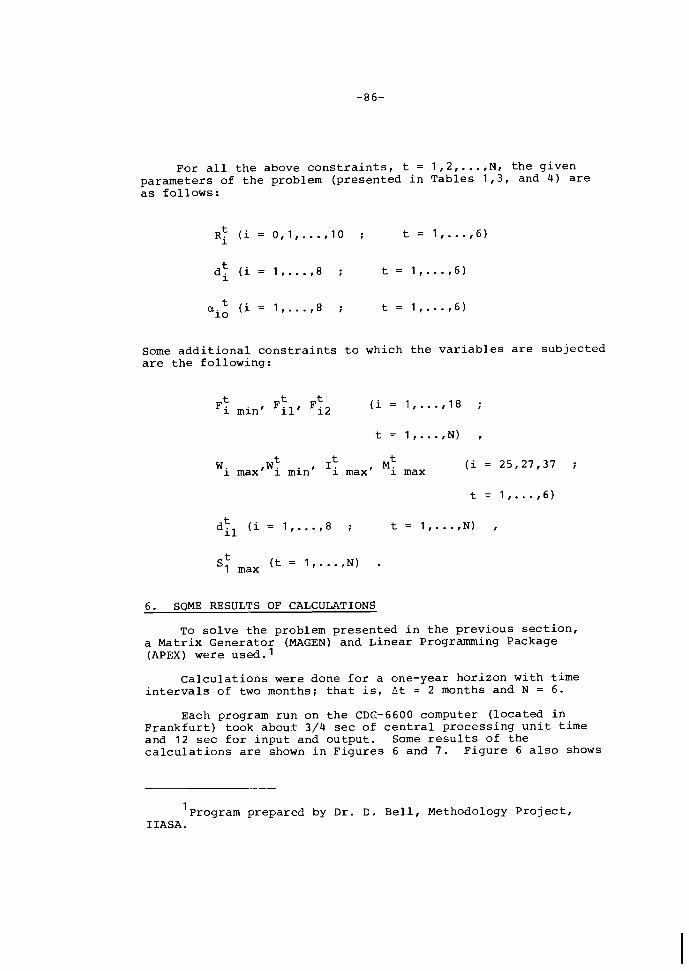
For a l l t h e above c o n s t r a i n t s , t = 1 , 2 , ..., N , t h e g i v e n p a r a m e t e r s of t h e problem ( p r e s e n t e d i n T a b l e s 1 , 3 , and 4 ) a r e a s f o l l o w s :
Some a d d i t i o n a l c o n s t r a i n t s t o which t h e v a r i a b l e s a r e s u b j e c t e d a r e t h e f o l l o w i n g :
W. t t t
M. (i = 25,27,37 ; 1 maxrWi min' 'i max' 1 max
t = 1 , ..., 6)
6. SOME RESULTS OF CALCULATIONS
To s o l v e t h e problem p r e s e n t e d i n t h e p r e v i o u s s e c t i o n , a M a t r i x G e n e r a t o r (MAGEN) and L i n e a r Programming Package (APEX) were used . l
C a l c u l a t i o n s were done f o r a one-year h o r i z o n w i t h t i m e i n t e r v a l s of two months; t h a t is , A t = 2 months and N = 6.
Each program r u n on t h e CDC-6600 computer ( l o c a t e d i n F r a n k f u r t ) took a b o u t 3/4 s e c of c e n t r a l p r o c e s s i n g u n i t t i m e and 12 s e c f o r i n p u t and o u t p u t , Some r e s u l t s of t h e c a l c u l a t i o n s a r e shown i n F i g u r e s 6 and 7 . F i g u r e 6 a l s o shows
'program prepared by D r . D . B e l l , Methodology P r o j e c t , I IASA.

Figure 6. Flows and overflows along the Tisza River.
TIME INTERVALS
Figure 7. Variation with time of the volume of stored water.

the flows and overflows along the Tisza River for six time intervals. For example, it can be seen that storage in node 37 (between arcs 9 and 10) accumulates overflow in the third time interval (April-May), and can release water downstream during the fifth time interval (August-September) to cover water supply.
Figure 7 shows that the volume of water in the reservoirs varies in a reasonable way: reservoirs were empty before the flood which began in the second time interval (February- March). At that time, flood water accumulated in the reservoirs (see Figure 7) and there was no overflow. In the next time interval (April-May), the reservoirs in nodes 25 and 27 could not accumulate flood water coming from upstream, and overflow occurred. The reservoir in node 37 was able to accumulate the water coming from upstream and there was no overflow downstream from this node.
Two observations on Figures 6 and 7 can be made. First, data used in the calculations are for a wet year; thus, there were no shortages in water supply for the users. Second, it became clear from the calculations that the maximum capacities of reservoirs W. , max were too small to influence flow distribution along the river, or to offer protection from overflows during the one-year period. Physically, the second fact can be explained as follows. The arc that represents flow in a reach at time interval t of duration At could be defined as an integral
where
- F: is the discharge in a reach.
We could also introduce an average discharge at time interval t. That is,
and hence,

L e t u s i n t r o d u c e t h e r a t i o
According t o o u r c a l c u l a t i o n s , c o n t r o l o f t h e f low i n a r i v e r b a s i n by r e s e r v o i r s c a n be done i f :
s . . = O(1) ; 1 3
(1 4 )
it c a n n o t be done i f :
7 . INITIAL DATA FOR THE MODEL
The g e o g r a p h i c , h y d r o l o g i c and economic i n f o r m a t i o n needed f o r some mathemat ica l models r a r e l y e x i s t i n a u s e f u l form i n which it c a n be a p p l i e d . Thus p r e l i m i n a r y a n a l y s i s and h a n d l i n g o f i n i t i a l d a t a a r e e s s e n t i a l ; b u t p r e l i m i n a r y a n a l y s i s o f t e n canno t be done w i t h c e r t a i n f o r m a l i z e d methods.
To b u i l d a model, it is n e c e s s a r y t o know t h e g e o m e t r i c s t r u c t u r e o f t h e network, and t o choose t h e p r o p e r g r a p h i c p o i n t s t h a t r e p r e s e n t a p a r t i c u l a r w a t e r economy system. Geographic i n f o r m a t i o n , and e s p e c i a l l y geograph ic maps, a r e t h e b a s i s f o r t h e network d iagram i n F i g u r e 4. To c o n s t r u c t o u r model o f t h e T i s z a River Bas in w a t e r r e s o u r c e s , l a r g e - s c a l e maps were used [ I ] , and a l l t h e l i m i t a t i o n s imposed by n a t u r a l c o n d i t i o n s and human a c t i v i t y were c o n s i d e r e d .
I n p u t d a t a f o r o u r model a r e volumes o f r u n o f f o f t h e T i s z a River ( R ) and i t s t r i b u t a r i e s (R1 , R 2 , . . . , R I 0 ) accord ing
0
t o two-month t i m e p e r i o d s s t a r t i n g w i t h December ( t , , t 2 , . . . , tn ) . I n t h e h i g h l a n d s o f t h e b a s i n (compr i s ing 19 p e r c e n t o f t h e t e r r i t o r y ) , t h e r e is a g r e a t i n f l u e n c e o f f l o w from s m a l l w a t e r c o u r s e s . There a r e no h y d r o l o g i c measurements f o r t h i s p a r t o f t h e r i v e r b a s i n . We r e l i e d m o s t l y on t h e c o n c r e t e r e s u l t s o f measurements, e x c l u d i n g t h o s e o f t h e h i g h l a n d s .
Data from [2] were used a s a b a s i s f o r t h e c a l c u l a t i o n o f

r u n o f f . The p rocedure used f o r t h e s e c a l c u l a t i o n s i s a s f o l l o w s :
- Those h y d r o l o g i c s t a t i o n s on t h e t r i b u t a r i e s were s e l e c t e d where it was p o s s i b l e t o d e s c r i b e r u n o f f i n t o d i scharge-gaug ing s t a t i o n s c l o s e t o t h e T i s z a R i v e r , and t o o b s e r v e f o r a s u f f i c i e n t l y l o n g p e r i o d .
- The normal annua l d i s c h a r g e was de te rmined u s i n g a mean annua l d i s c h a r g e f o r e v e r y s t a t i o n .
- Those y e a r s were s e l e c t e d i n which t h e a n n u a l r u n o f f was e q u a l t o ( o r g r e a t e r t h a n ) t h a t f o r t h e a v e r a g e t o t a l o b s e r v a t i o n t ime .
- We c o n s t r u c t e d a mean monthly f l o w f o r each s t a t i o n f o r a number o f wet y e a r s .
- Data were a n a l y z e d , t a k i n g i n t o c o n s i d e r a t i o n some of t h e c o n d i t i o n s f o r r u n o f f g e n e r a t i o n f o r e a c h y e a r .
T a b l e s 4 and 5 g i v e d a t a f o r 1 7 h y d r o l o g i c a l s t a t i o n s on t h e t r i b u t a r i e s o f t h e T i s z a R i v e r , and f o r one s t a t i o n on t h e T i s z a R i v e r i t s e l f . We have made some c o r r e c t i o n s t o t h e d a t a f o r d i scharge-gaug ing s t a t i o n s s i t u a t e d f a r from t h e r i v e r bed; f o r example, we have n o t t a k e n i n t o c o n s i d e r a t i o n t h e r u n o f f o f t h e Zagyva and Eger R i v e r s .
0ng o f t h e most compl ica ted problems w e e n c o u n t e r e d i s t h e d e t e r m i n a t i o n o f v a l u e s F . and Fi2. Network d e s c r i p t i o n s
1 1 of t h e r i v e r s o u r c e s were s i m p l i f i e d ; we assumed t h a t t h e r e i s a l i m i t t o t h e number o f c r o s s i n g s o f volumes o f w a t e r .
Based o n o u r e x e r c i s e , t h e f o l l o w i n g p r o c e d u r e f o r c a l c u l a t i n g F . and F12 c a n be used .
11
1 ) Using n a v i g a t i o n a l and t o p o g r a p h i c maps, d e t e r m i n e t h e minimal ( o v e r t h e p a r t - l e n g t h x ) c r o s s - s e c t i o n s o f t h e r i v e r bed ( A r ) and f l o o d l a n d s w i t h i n t h e b o u n d a r i e s o f t h e a r t i f i c i a l d i k e s ( A d ) f o r e a c h p a r t o f t h e r i v e r . These e l e m e n t s may n o t have uniform l o c a t i o n s .
2 ) Determine t h e i n c l i n a t i o n s o f t h e w a t e r s u r f a c e (Ah2/Ax and Ahd/Ax), on t h e assumpt ion t h a t w a t e r e n t i r e l y f i l l s t h e r i v e r bed and f l o o d l a n d s . These i n c l i n a t i o n s a r e t h e r e s u l t o f t h e morphometric p e c u l i a r i t i e s o f t h e r i v e r bed and f l o o d l a n d s .
3 ) The f o l l o w i n g o p e r a t i o n s c a n b e made, based on water l e v e l and d i s c h a r g e measurements:
- Check whether t h e c a l c u l a t e d w a t e r s u r f a c e i n c l i n a t i o n s a r e maximal o v e r a l l d a t a obse rved . A s a g e n e r a l

3
rl w - m
d f
a,
a, w
m Ll
a~ O f
5"- Ll
U I
E 2 g 5 w s
$ $ 4 2 U m a,
.rl z n u
C
.rl U
u
0 a h x
w 0 G
U 0
w m w o o r l 0) - m W Q W r n Q - ~ ~ ~ Q W ~ ~ N ~ P N N N O O ~ - W ~ O 0 0 - m r - m m m . . ~ " ~ ~ I ? ~ W P " " " r l r l d d d d d d m o m o o 0 o d d d l r ; " -
A A
g ~ ~ ; ~ g m - ~ - r l o m ~ ~ ~ w ~ ~ m -
. + - I N o ~ w w w m r l m ~ r l m m o ~ w . - - c r l - r l - q m ~ m m ~ m ~ ~ - - . . . . - ? T ? m . . ?
rl rl 2 rl rl rl m r l ~ m ~ r l ~ m ~ v ~ o c ~ rl rl m 0
N
Q m v 0 1 N O - o Q m m m N P q O Q P m P P q . m m . . 01 w
rl rl T ? T ? - N O r l Q q rl rl
rl
9 rl
.rl m RI Ll x .rl x w d 0 U U C .n .n a,
~l r l m m ~l $ 5 % : : % d rl .rl ~ G U E a , a , \ a , . r l - r h ~ o o o m l o 9 a , : o . n > ~ a a , ~ m a (0
2 2 2 s i o r l m a . o \ a , m o ~ o c o m m u h 9 G U ( O h m m ~ a , : o d x \ o \ m
r l m a r l 9 a n u a 1 a , . r l . r l o r m . r 1 9 m % G 2 2 $ \ I Y : 2 2 Y X z n m n x u s n ~ u ~ ~ c m x m ~ m ~ w m ~ ~
m :o :o
m M V)
m m m a, :o
m x u w O G 4 4
h
m 4J
9 a n > d 2 s
m = r = = = r z r : 1 0 , : . N u n u = : m m m ..I m .A :8 .?I rl n e m e E m
m m m o :o :o u u L l 0
m w :o :o M m m w > rl L O G O a m u a,
X M X a m g m n N O MI S U L O L ~ U ~ R ~ a , a , a , m m m u L l X m L l L l m rd
W J X ~ U I X W N U ~ U ~ ~ ~ X P

r u l e , obse rved i n c l i n a t i o n s a r e q u a n t i t a t i v e l y l e s s t h a n t h o s e o b t a i n e d on t h e b a s i s o f morphometric d a t a ;
- Check whether w a t e r s u r f a c e i n c l i n a t i o n s ( a s c a l c u l a t e d and/or c o r r e c t e d ) a r e a c c e p t a b l e on t h e b a s i s o f t h e a c t u a l i n f o r m a t i o n . C a l c u l a t e maximum p o s s i b l e s t r e a m v e l o c i t i e s V 2 , Vd, and
w a t e r d i s c h a r g e s Q 2 , Qd, t a k i n g i n t o a c c o u n t t h e
roughness o f t h e f l o o d l a n d s and t h e r i v e r bed;
- On t h e b a s i s o f a v a i l a b l e o b s e r v a t i o n s , compare measured v a l u e s V 2 , Vd, Q2 and Qd w i t h p o s s i b l e
maximum v a l u e s i n t h e c o r r e s p o n d i n g r a n g e s ;
- Check whe the r v a l u e s Q 2 , Qd ( a s c a l c u l a t e d and /o r
c o r r e c t e d ) a r e a c c e p t a b l e .
4 ) C o n s i d e r hydrographs f o r t h e v a l u e s Q2 and Qd.
A c t u a l volumes of w a t e r ( E i l , Ei2) were de te rmined
f o r a l l s e a s o n s and f o r e a c h p a r t of t h e r i v e r by d i r e c t c a l c u l a t i o n o f d a i l y wa te r d i s c h a r g e s .
5 ) C o n s t r u c t t h e r e l a t i o n s h i p s o f Eil and Ei2.
6) I d e n t i f y t h e v a l u e s Fil and Fi2 f o r e a c h t i m e i n t e r v a l
by e x t r a p o l a t i n g t h e f u n c t i o n s Eil = f ( F i ) and
Ei2 = g ( F i ) .
There a r e i n d i r e c t t e c h n i q u e s f o r F i 2 e v a l u a t i o n t h a t a r e based on h i s t o r i c a l d a t a o f o v e r f l o w and w a t e r b a l a n c e i n v e s t i g a t i o n s . E s s e n t i a l d i f f i c u l t i e s a r i s e i n d e t e r m i n i n g w a t e r r e s o u r c e d a t a , and i n p a r t i c u l a r i n o b t a i n i n g v a l u e s d: and t A
A . t h a t c h a r a c t e r i z e w a t e r b a l a n c e among t h e v a r i o u s u s e r s .
I f t h e l o c a t i o n s of network nodes d o n o t p r o v i d e t h e i n f o r m a t i o n , t h e s e a r c h f o r t h e u s e r s of t h e T i s z a Rive r w a t e r i s a complex problem. Water demands i n t h e T i s z a Rive r Bas in a r e due t o u rban a c t i v i t i e s , i n d u s t r y , a g r i c u l t u r e , n a v i g a t i o n , f i s h i n g , and s o on. From s t a t i s t i c a l d a t a f o r t h e p e r i o d 1930 t o 1970 it is known t h a t w a t e r from t h e Szeged r a n g e o f t h e T i s z a R i v e r c h a r a c t e r i z e s t h e lower r e a c h e s of t h e Maros r i v e r .
A l l d a t a f o r t h e Hungar ian p a r t of t h e T i s z a Rive r Bas in r e f e r t o t h e T i s z a b e t c h r a n g e . F i n a l a l l o c a t i o n o f t h e network nodes c o r r e s p o n d i n g t o w a t e r consumers i n t h e network d iagram ( F i g u r e 4 ) a r e based on [ 3 ] .
Thus, d a t a on a n n u a l and i n some c a s e s monthly w a t e r amounts a r e known f o r t h e Hungarian p a r t o f t h e T i s z a Rive r B a s i n .

To a r r i v e a t r a t i o n a l a l l o c a t i o n among w a t e r u s e r s , we used a s i m p l i f i e d procedure:
- Annual w a t e r consumption was d i v i d e d i n p r o p o r t i o n t o t h e p o p u l a t i o n i n 1970, a g r i c u l t u r a l a r e a s i n 1970 and i n d u s t r i a l o u t p u t (based on COMECON s t a n d a r d s ) ;
- Monthly consumption was c a l c u l a t e d u s i n g d a t a from [41. Note t h a t i n i t i a l c h a r a c t e r i s t i c s f o r l a r g e u n i t s ( c i t i e s , i r r i g a t i o n a r e a s , e t c . ) were o b t a i n e d by u s i n g a g g r e g a t e d a t a of s m a l l u n i t s ( abou t 40 t o w n s ) .
Only towns such a s Szeged, Szolnok and Debrecen c o u l d be c o n s i d e r e d l a r g e i n d u s t r i a l c e n t e r s ; a l l o t h e r towns have been c o n s i d e r e d c i v i l consumption u n i t s .
The d a t a used r e f e r t o t h e w a t e r r a n g e s and c h a r a c t e r i z e o n l y a n n u a l wa te r consumption. I n o u r model w e c o n s i d e r e d w a t e r consumption o n l y f o r t h e T i s z a R i v e r ; d a t a were r e c a l c u l a t e d by t r a n s f o r m i n g a n n u a l i n t o monthly w a t e r consumption f i g u r e s .
To comple te t h e second p a r t of t h e e x e r c i s e , we i n v e s t i g a t e d a v a i l a b l e d a t a f o r s e v e r a l w a t e r r a n g e s : ~ g h o n y , which i n c l u d e s mouth r e g i o n s of t h e ~ i i r , Szamos and Kraszna R i v e r s : Taskony, which i n c l u d e s t h e Hungarian p a r t of t h e S a j 6 and t h e Herngd River b a s i n s ; and Midszent , which c h a r a c t e r i z e s t h e Koros system t r i b u t a r i e s .
Data were g e n e r a l i z e d i n o r d e r t o o b t a i n i n f o r m a t i o n f o r w a t e r r a n g e s .
For o u r model, we used i n f o r m a t i o n on t h e T i s z a l o k and Kiskore r e s e r v o i r c a p a c i t i e s and on d i s c h a r g e s of v a r i o u s c h a n n e l s [ @ I . Using d a t a on o v e r f l o o d s and t h e r e s u l t i n g damages, we o b t a i n e d approx imate damages f o r e a c h r i v e r p a r t .
Water r e s o u r c e p lann ing w i l l c e r t a i n l y improve a s more d e t a i l e d and p r e c i s e d a t a become a v a i l a b l e
Refe rences
[ I ] A t l a s of Danubian C o u n t r i e s , b s t e r r e i c h e s O s t - und Sudosteuropa I n s t i t u t , Vienna, A u s t r i a , 1973.
[2] Annual Repor t s o f t h e Hungarian Hydrographic S e r v i c e , N a t i o n a l Water A u t h o r i t y , Budapest , Hungary, 1968 and 1970.
[3 ] Genera l Scheme of Complex Use of Water Resources , T i s z a R i v e r Bas in , N a t i o n a l Water A u t h o r i t y , Budapest , Hungary, 1973.


A Review of C o n f l i c t R e s o l u t i o n Models
i n Water Resources Management
Anthony R. Ostrom
1 . INTRODUCTION
I n problems concerned w i t h t h e a l l o c a t i o n o f w a t e r r e s o u r c e s a l o n g a r i v e r b a s i n , c e r t a i n c h a r a c t e r i s t i c s a r e o f t e n p r e s e n t . These i n c l u d e m u l t i p l e o b j e c t i v e s , m u l t i p l e i n t e r e s t s , u n c e r t a i n - t y , and a g r e a t d e a l of s u b j e c t i v e i n f o r m a t i o n . The te rm m u l t i p l e i n t e r e s t s r e f e r s t o t h e p u b l i c o r p r i v a t e i n t e r e s t g roups upon which a d e c i s i o n impac ts . These cou ld be l o c a l a u t h o r i t i e s , env i ronmenta l g roups , a n i n d u s t r y , o r a r e g i o n a l government, each w i t h i t s own p r e f e r e n c e s f o r v a r i o u s w a t e r management s t r a t e g i e s . We would l i k e t o i n c l u d e t h e s u b j e c t i v e p r e f e r e n c e s o f t h e s e g roups e x p l i c i t l y i n o u r a n a l y s i s . S i n c e we a r e o f t e n f a c e d w i t h c o n f l i c t i n g o b j e c t i v e s (e .g . , n a t i o n a l economy v e r s u s r e g i o n a l development) when p l a n n i n g w a t e r r e s o u r c e s sys tems , we would a l s o l i k e t o i n c l u d e i n t h e a n a l y s i s an e x p l i c i t s t a t e - ment of t h e s e o b j e c t i v e s ( s e e Mera, 1967) . By u n c e r t a i n t y we mean n o t o n l y hydro log ic u n c e r t a i n t y , b u t a l s o t h e s t r a t e g i c u n c e r t a i n t y r e l a t e d t o p l a n n i n g i n a n environment where t h e r e a r e opposing o r competing i n t e r e s t g roups whose development p l a n s a r e unknown t o t h e o t h e r i n t e r e s t g roups .
S e v e r a l approaches have been proposed f o r look ing a t prob- lems of c o n f l i c t r e s o l u t i o n . Game t h e o r y (von Neuman and Morgen- s t e r n , 1947) and b a r g a i n i n g (Kahan and Rapoport , 1974) a r e o f t e n s u g g e s t e d , and Rogers ( 1 969) h a s used a game t h e o r e t i c a n a l y s i s f o r t h e p l a n n i n g o f w a t e r r e s o u r c e s development on t h e border o f I n d i a and Bangladesh. Although m u l t i p l e i n t e r e s t s and s e v e r a l o b j e c t i v e s were i n c l u d e d i n Rogers ' f o r m u l a t i o n , u n c e r t a i n t y was n o t c o n s i d e r e d e x p l i c i t l y . Other approaches f a l l i n t o t h e l o o s e c a t e g o r y o f m u l t i - o b j e c t i v e programmingl ( s e e Cohon and Marks, 1973; Major, 1969; and Monarchi e t a l . , 1973) . These a u t h o r s have a t t e m p t e d t o g e n e r a t e a p r o c e s s f o r c o n s t r u c t i n g t h e t r a d e o f f f u n c t i o n between m u l t i p l e o b j e c t i v e s . Other work (Vermuri, 1974) h a s been d i r e c t e d towards f i n d i n g a s c a l a r v a l u e o f a v e c t o r o b j e c t i v e f u n c t i o n . A l l t h e above models i g n o r e t h e u n d e r l y i n g p r e f e r e n c e s of t h e d e c i s i o n m a k e r ( s ) and t h e s u b j e c t i v e i n f o r m a t i o n a v a i l a b l e from r e l e v a n t i n t e r e s t g roups .
' s e e t h e i l l u s t r a t i v e l i s t o f r e f e r e n c e s , and , i n p a r t i - c u l a r , a rev iew a r t i c l e on m u l t i o b j e c t i v e programming by Cohon and Marks (1 975) .

Looking a t w a t e r r e s o u r c e s from a h i g h e r - l e v e l p o l i t i c a l v i e w p o i n t , Haefe le (1971, 1973) h a s proposed ' v o t e t r a d i n g ' a s a mechanism f o r a n a l y z i n g r e l a t i v e p r e f e r e n c e s f o r s e v e r a l compet ing i s s u e s . One such i s s u e might be a i r q u a l i t y , and H a e f e l e shows how a i r and wate r q u a l i t y might be t r a d e d o f f i n a s o - c a l l e d democra t i c v o t i n g s e s s i o n ( s e e a l s o R u s s e l , Spof fo rd and H a e f e l e , 1972) . Metagame a n a l y s i s , a s o u t l i n e d by Howard ( 1 9 6 8 ) , a l l o w s u s t o d e a l w i t h r e l a t i v e p r e f e r e n c e s f o r outcomes of a s i n g l e i s s u e where t h e r e a r e s e v e r a l competing i n t e r e s t s . The purpose of t h i s a n a l y s i s is t o p r e d i c t a s t a b l e outcome where p r e f e r e n c e s depend upon p e r c e p t i o n s o f opponen ts ' p o s s i b l e c o u n t e r - s t r a t e g i e s . (We w i l l d i s c u s s t h i s approach i n more d e t a i l below.) None o f t h e above t e c h n i q u e s h a n d l e u n c e r t a i n t y i n a r i g o r o u s f a s h i o n . Dec i s ion a n a l y s i s ( P r a t t , R a i f f a and S c h l a i f e r , 1 9 6 5 ) , however, p r o v i d e s u s w i t h a frame- work t o c o n s i d e r a l l t h e c h a r a c t e r i s t i c s o f a c o n f l i c t problem ( m u l t i p l e o b j e c t i v e s , m u l t i p l e i n t e r e s t s , s u b j e c t i v e i n f o r m a t i o n and u n c e r t a i n t y ) w i t h i n one r a t i o n a l framework.
It i s t h e l a s t two t e c h n i q u e s mentioned above, metagame a n a l y s i s and d e c i s i o n a n a l y s i s , t h a t w i l l be d i s c u s s e d and com- pared i n t h i s paper . For b o t h t e c h n i q u e s a s imple example o f w a t e r q u a l i t y management w i l l be i l l u s t r a t e d . I n a d d i t i o n , f o r t h e metagame approach , we w i l l examine t h e problem o f develop- ment on a n i n t e r n a t i o n a l r i v e r b a s i n where two c o u n t r i e s have oppos ing i n t e r e s t s .
2. FIETAGAME ANALYSIS
Cons ider t h e s i m p l e c o n c e p t u a l model o f w a s t e w a t e r t r e a t - ment i n F i g u r e 1 . Three c i t i e s a r e l o c a t e d n e a r a r i v e r and e a c h h a s two o p t i o n s f o r t r e a t i n g i t s m u n i c i p a l w a s t e w a t e r s . They c a n e i t h e r t r e a t o r n o t t r e a t t h e i r w a s t e effluent^.^ ( I n p r a c t i c e t h i s is r a t h e r u n l i k e l y ; t h e c i t i e s would have t h e c h o i c e of t r e a t i n g a t v a r i o u s d e g r e e s of e f f i c i e n c y , and s o t h e s e l e v e l s would, i n r e a l i t y , need t o be r e p r e s e n t e d by a much l a r g e r set of d i s c r e t e o p t i o n s . ) L e t u s r e p r e s e n t t h e two d i s - c r e t e o p t i o n s by 0 and 1: 1 means t h a t t h e w a s t e s a r e t r e a t e d , and 0 t h a t t h e y a r e n o t t r e a t e d . W e now s p e c i f y a l l p o s s i b l e outcomes depend ing on t h e a c t i o n o f each c i t y .
OUTCOMES
CITY 1 0 1 0 0 1 0 1 1
CITY 2 0 0 1 0 1 1 0 1
CITY 3 0 0 0 1 0 1 1 1
L The example i s a d a p t e d from Hipe l e t a l . , 1974.

DO HIT TREAT I 0 1
OPTIONS: TREAT I1 1 DD NOT TREAT 10 1
Figure 1. Conceptual model o f municipal wastewater treatment along a river basin: metagame approach.
L e t u s examine t h e p r e f e r e n c e s o f each c i t y f o r any a r b i - t r a r y outcome. For example, d o e s c i t y 1 , n o t t r e a t i n g , p r e f e r a n outcome where a t l e a s t one o f t h e o t h e r c i t i e s t r e a t s t o a n outcome where a l l c i t i e s t r e a t ? We c a l l any outcome t h a t w e wish t o examine a ' p a r t i c u l a r outcome' ; a n example o f t h e r e l a t i v e p r e f e r e n c e s o f c i t y 1 f o r t h e p a r t i c u l a r outcome ( 1 , 1 , 1 ) i s shown i n F i g u r e 2 . C i t y 1 p r e f e r s outcomes ( 0 , 1 , 1 ) and ( 0 , 1 , 0 ) t o t h e p a r t i c u l a r outcome ( 1 , 1 , 1 ) , and d o e s n o t p r e f e r t h e remain ing outcomes. I n o t h e r words, t h e s e p r e f e r e n c e s i n d i c a t e t h a t c i t y 1 wants a t l e a s t one c i t y t o c l e a n up t h e r i v e r , b u t under t h e f o l l o w i n g two c o n d i t i o n s : a ) c i t y 1 o r 3 shou ld n o t ' g o it a l o n e , and b ) c i t y 2 shou ld d o a t l e a s t a s much a s c i t y 1 ( i f n o t more) .
Such p r e f e r e n c e s (which c o u l d be o b t a i n e d by q u e s t i o n i n g c i t y o f f i c i a l s ) a r e n o t a l t o g e t h e r u n r e a l i s t i c . C i t y 1 d o e s n o t want t o l e a v e c i t y 3 ( a s m a l l e r n e i g h b o r ) t o c l e a n up t h e r i v e r a l o n e b u t would p r e f e r c i t y 2 ( a l a r g e r c o m p e t i t o r f o r e x t e r n a l t o h e l p . A t t h e same t i m e c i t y 1 wants t o avo id a s f a r a s p o s s i b l e pay ing t h e h i g h c o s t s of was te w a t e r t r e a t m e n t . I n a s i m i l a r f a s h i o n , p r e f e r e n c e s t r u c t u r e s c o u l d be examined f o r c i t i e s 2 and 3 i n r e l a t i o n t o t h e ' p a r t i c u l a r outcome' we have chosen .

CITY 1 PREFERENCES
OUTCOMES CITY 1 PARTICULAR
PREFERRED BY CITY 1
OUTCOME
OUTCOMES NOT PREFERRED
BY CITY 1
3 1 1
UNILATERAL IMPROVE- MENT BY CITY 1 i O
t INESCAPABLE SANCTIONS BY CITIES 2 AND/OR 3
Figure 2. Outcomes preferred and not preferred by city 1 in relation to the particular outcome (1,1,1).
L e t u s c o n c e n t r a t e , however, on c i t y 1 p r e f e r e n c e s a s shown i n F i g u r e 2 . I f c i t y 1 chooses t o n o t t r e a t ( i . e . , moving t o t h e p r e f e r r e d outcome ( 0 , 1 , 1 ) , we t e rm t h i s a ' u n i l a t e r a l i m - provement ' by c i t y 1 . ( R e c a l l t h a t we a r e n o t r e f e r r i n g h e r e t o a n improvement i n wa te r q u a l i t y , b u t t o t h e o c c u r r e n c e of a move t o a n outcome t h a t c i t y 1 p r e f e r s r e l a t i v e t o t h e p r e v i o u s o u t - come.) We now a s k t h e q u e s t i o n : i s t h i s new outcome ' s t a b l e ' , i . e . , i s one o f t h e o t h e r c i t i e s l i k e l y t o a c t s o a s t o move t o a l e s s p r e f e r r e d outcome f o r c i t y 1 ? I n t h e c a s e ( 0 , 1 , 1 ) , c i t i e s 2 and 3 c o u l d t a k e ' i n e s c a p a b l e s a n c t i o n s ' a g a i n s t c i t y 1 by moving t o e i t h e r ( 0 , 0 , 0 ) o r ( 0 , 0 , 1 ) , b o t h o f which a r e l e s s p r e f e r r e d by c i t y 1 t h a n ( 1 , 1 , 1 ) . The s a n c t i o n s r e f e r t o a s i m p l e r e f u s a l t o t r e a t t h e i r was tes . So, i n our example, a u n i l a t e r a l improvement by c i t y 1 d o e s n o t r e s u l t i n a s t a b l e outcome. T h i s shows t h a t a s f a r a s c i t y 1 i s concerned , o u t - come ( 1 , l , I ) i s s t a b l e : any move by c i t y 1 i s l i k e l y t o produce a l e s s p r e f e r r e d outcome. Hence, it i s i n c i t y 1 ' s i n t e r e s t t o make no f u r t h e r improvement.
The a n a l y s i s f o r t h e outcome ( 1 , 1 , 1 ) i s r e p e a t e d f o r c i t i e s 2 and 3 and a g a i n f o r a l l p o s s i b l e ' p a r t i c u l a r outcomes. ' The purpose o f t h e approach i s t o p r e d i c t t h e s t a b i l i t y o f each o u t - come i n r e l a t i o n t o t h e p r e f e r e n c e s of a l l i n t e r e s t g roups

s imul taneous ly . The ' s t a b l e equ i l i b r i um ' t h a t we have l ea rned from game theo ry i s extended t o t h e concept of a 'metaequi l ib - r i um, ' i . e . , an o v e r a l l equ i l i b r i um depending upon what each c i t y pe rce ives t h e o t h e r c i t i e s w i l l do i n t h e l i g h t of t h e o t h e r c i t i e s ' p r e f e r ences .
A second example of metagame theo ry a p p l i e d t o water r e sou rce s management has been o u t l i n e d i n Hipel e t a l . (1974). The approach t hey adopted i n ana lyz ing c o n f l i c t s on an i n t e r - n a t i o n a l r i v e r ba s in ( i l l u s t r a t e d i n F igu re 3) was a s fol lows:
1 . Cons t ruc t an o b j e c t i v e func t i on f o r each i n t e r e s t group ( i n H i p e l ' s example, Canada and t h e U S A ) ;
2 . Generate two p a r t i c u l a r outcomes by i n t e g e r pro- gramming ;
3. Tes t each p a r t i c u l a r outcome f o r s t a b i l i t y us ing metagame a n a l y s i s ;
4. I f t h e outcome i s u n s t a b l e , i nc lude an increment of s i d e payment i n t h e o b j e c t i v e func t i on ;
5. Repeat i n t e g e r program, s t a b i l i t y a n a l y s i s and s t e p 4 u n t i l a s t a b l e outcome occurs .
1. POWER 3.POWER 2.FLOOO PRO-
TECTION 4.FL000 I SMALL) 5.F LOO0 LARGE I
CANADA ------ ------ USA I - INTERNATlONM
BORDER
6.POWER(SMALL 1 mHTIAL 7. POWERl MEO.
8.POVJER I LARGE 1
9. FLOOD 1O.MULTIPUR POSE
Figure 3. Alternatives for reservoir development along an international river basin.

The a p p l i c a t i o n was a b l e t o p r e d i c t e x a c t l y how much s i d e payment was r e q u i r e d t o produce a m u t u a l l y p r e f e r r e d outcome f o r t h e USA and Canada i n d e v e l o p i n g a n i n t e r n a t i o n a l r i v e r b a s i n l y i n g on t h e b o r d e r o f t h e two c o u n t r i e s .
The a n a l y s i s i n b o t h examples has been based on t h r e e s i m p l i f i c a t i o n s : t h e u s e o f a d i s c r e t e d e c i s i o n r u l e ( i . e . , t r e a t o r n o t t r e a t ) , t h e i g n o r i n g of h y d r o l o g i c u n c e r t a i n t y , and t h e c o n s i d e r a t i o n o f o n l y one time per iod . ' To add r e a l i s m t o t h e w a t e r q u a l i t y example, such a n a n a l y s i s shou ld be ex tended t o i n c l u d e p r e f e r e n c e s f o r v a r i o u s t r e a t m e n t e f f i c i e n c i e s , and f o r chang ing t r e a t m e n t l e v e l s o v e r t ime . There a r e o t h e r g e n e r a l d i f f i c u l t i e s w i t h t h e approach. The p r e f e r e n c e s o f e a c h i n t e r e s t g roup may be such t h a t no outcome is s t a b l e and a q u a n t i t a t i v e d e f i n i t i o n o f r e l a t i v e s t a b i l i t y i s needed t o compare ' a lmos t s t a b l e ' outcomes. Fur the rmore , t h e r e may be c o m p u t a t i o n a l prob- lems when we s e a r c h f o r a s t a b l e s o l u t i o n where t h e r e a r e a l a r g e number o f outcomes f o r c o n s i d e r a t i o n .
3 . D e c i s i o n A n a l y t i c Model
Cons ider a g a i n a s imple c o n c e p t u a l model o f w a t e r q u a l i t y management a l o n g a r i v e r b a s i n ( s e e F i g u r e 4 ) . A s w i t h t h e metagame model d i s c u s s e d p r e v i o u s l y , we w i l l l ook a t p r e f e r e n c e s o f each c i t y f o r s t r a t e g i e s f o r w a s t e wa te r t r e a t m e n t . The d i f - f e r e n c e s from t h e p r e v i o u s approach a r e t h a t :
- The t r e a t m e n t l e v e l f o r each c i t y i s c o n t i n u o u s ;
- Hydrologic u n c e r t a i n t y is c o n s i d e r e d e x p l i c i t l y ;
- The r i s k c h a r a c t e r i s t i c s o f t h e d e c i s i o n makers a r e i n c o r p o r a t e d i n t h e model;
- M u l t i p l e o b j e c t i v e s a r e handled i n a s t r a i g h t f o r w a r d f a s h i o n .
The i n t e r e s t g roups i n t h e example a r e t h e two c i t i e s and t h e r e g i o n a l a u t h o r i t y . Each c i t y i i s concerned a b o u t t h e q u a l i t y o f w a t e r (x i ) f lowing p a s t and t h e c o s t ( z i ) o f w a s t e
- -
w a t e r t r e a t m e n t , depending upon e f f i c i e n c i e s (y i ) of t r e a t m e n t -
p l a n t s . The r e g i o n a l a u t h o r i t y i s concerned n o t o n l y a b o u t q u a l i t y o f w a t e r a t t h e downstream p o l i t i c a l b o r d e r , t o t a l t r e a t m e n t c o s t s (which it may have t o s u b s i d i z e ) , and e q u i t y o f t r e a t m e n t by b o t h c i t i e s .
D e c i s i o n a n a l y s i s p r o v i d e s a framework f o r i n c l u d i n g a l l t h e s e c o n s i d e r a t i o n s w i t h i n one c o n c e p t u a l model. The u n i f y i n g d e v i c e is t h e s i n g l e - a t t r i b u t e u t i l i t y f u n c t i o n , ( F i s h b u r n , 1 9 6 8 ) , a monotonic f u n c t i o n o f p e o p l e s ' p r e f e r e n c e s w i t h t h e p r o p e r t y t h a t i t s expec ted v a l u e i s a g u i d e f o r d e c i s i o n making (von Neuman and Plorgenstern, 1947) .

Figure 4. Conceptual model o f municipal wastewater treatment along a river basin: decision analysis approach.
The assessment and v e r i f i c a t i o n o f u t i l i t y f u n c t i o n s w i l l n o t be d i s c u s s e d h e r e a s it i s w e l l t r e a t e d i n t h e l i t e r a t u r e ( s e e Keeney, 1969, and Meyer and P r a t t , 1 9 6 8 ) . An example of u t i l i t y assessment is p r e s e n t e d i n Gros and Ostrom (1975) who c o n s i d e r a ' r i s k - a v e r s e ' e x p o n e n t i a l f u n c t i o n f o r bo th wate r q u a l i t y (BOD) and o p e r a t i o n a l was te wate r t r e a t m e n t c o s t s ( r e f e r t o F i g u r e 5 ) . Both s i n g l e - a t t r i b u t e u t i l i t y f u n c t i o n s u were o f t h e form
where
a = r i s k - a v e r s i o n paramete r ,
z = a t t r i b u t e ( e . g . , c o s t o f waste t r e a t m e n t ) ,
Z max = maximum c o n c e i v a b l e v a l u e of t h e a t t r i b u t e z .

UTILITY t
\ z Zmax
WAS€ WATE R, TREATMENT COSTS ($/hour)
Figure 5. Risk-averse utility functions for water quality and wastewater treatment costs.
The m u l t i a t t r i b u t e u t i l i t y f u n c t i o n u . ( x z . ) i s a weighted 1 i ' 1
sum ( o r p r o d u c t ) o f a s i n g l e - a t t r i b u t e f u n c t i o n - - t h e w e i g h t s a r e d e r i v e d from t h e same assessment p r o c e s s t h a t d e t e r m i n e s t h e v a l u e o f t h e r i s k a v e r s i o n pa ramete r a .
The problem was t o f i n d t h e set o f P a r e t o - a d m i s s i b l e s o l u t i o n s , i . e . , p o l l u t i o n c o n t r o l s t r a t e g i e s t h a t made it i m p o s s i b l e t o meet t h e p r e f e r e n c e s o f one c i t y w i t h o u t f a i l i n g t o meet t h o s e o f a n o t h e r . T h i s ' P a r e t i a n ' approach h a s been wide ly d i s c u s s e d i n t h e w a t e r r e s o u r c e s l i t e r a t u r e ( s e e Dorfman and Jacoby , 1972; Ostrom, 1974; and Wood, 1974) . Such a p p l i - c a t i o n s , w h i l e c o n s i d e r i n g impac t s o f v a r i o u s d e c i s i o n s on s e v e r a l i n t e r e s t g r o u p s , d i d n o t , however, t r e a t t h e q u e s t i o n o f u n c e r t a i n t y i n a r i g o r o u s f a s h i o n .
Using o p t i m a l c o n t r o l t h e o r y , Gros and Ostrom (1975) found o p t i m a l t r a j e c t o r i e s o f was te w a t e r t r e a t m e n t f o r a number of c i t i e s on a r i v e r b a s i n by maximizing expec ted u t i l i t y expressed a s a n i n t e g r a l ,

where u ( x , z ) i s t h e m u l t i a t t r i b u t e u t i l i t i e s f u n c t i o n o v e r q u a l i t y x and c o s t s z a t each c i t y , and p ( q ) i s t h e p r o b a b i l i t y d i s t r i b u t i o n of t h e random s t reamf low, q . The o p t i m i z a t i o n i s s u b j e c t t o t h e t e c h n o l o g i c a l c o n s t r a i n t s r e p r e s e n t i n g BOD decay and t r a n s p o r t a t i o n phenomena. Minimum q u a l i t y l e v e l s w e r e n o t s p e c i f i e d ; r a t h e r t h e y w e r e i n c l u d e d i m p l i c i t l y a s a p a r t o f t h e o b j e c t i v e f u n c t i o n by i n c o r p o r a t i n g them i n t h e u t i l i t y a s s e s s m e n t p r o c e s s .
The purpose o f t h i s t y p e of a n a l y s i s i s t w o f o l d : d e s c r i p - t i v e l y it g e n e r a t e s a set o f n o n - i n f e r i o r a l t e r n a t i v e s and shows t h e i m p a c t s on e a c h i n t e r e s t g roup . ~t t h e n remains f o r t h e d e c i s i o n maker t o choose among n o n - i n f e r i o r a l t e r n a t i v e s . I f many o f t h e a l t e r n a t i v e s a r e p o l i t i c a l l y i n f e a s i b l e t h e n t h e a n a l y s i s c a n p r e d i c t t h e outcome o f a d e c i s i o n p r o c e s s . There a r e o b v i o u s d i f f i c u l t i e s i n t h i s approach , p a r t i c u l a r l y w i t h r e g a r d t o s e l e c t i o n o f r e p r e s e n t a t i v e i n t e r e s t g roups , a s s e s s m e n t o f u t i l i t y f u n c t i o n s , e v a l u a t i o n o f s c a l i n g w e i g h t s and r i s k - a v e r s i o n p a r a m e t e r s , and c o n s t r u c t i o n o f a m u l t i a t t r i b u t e u t i l i t y f u n c t i o n ( s e e Keeney, 1 9 6 9 ) . N e v e r t h e l e s s , t h e d e c i s i o n a n a l y s i s i s o n e o f t h e few frameworks a v a i l a b l e f o r combining t h e l a r g e amount o f s u b j e c t i v e i n f o r m a t i o n f rom many s o u r c e s t h a t w e o f t e n wish t o i n c l u d e i n o u r d e c i s i o n p r o c e s s .
W e have c o n s i d e r e d o n l y two examples from a growing f a m i l y o f c o n f l i c t - r e s o l u t i o n m ~ d e l s . ~ The metagame approach a l l o w s u s t o d e a l w i t h c o n f l i c t i n g p r e f e r e n c e s f o r d i s c r e t e s t r a t e g i e s t h a t a r e s u b j e c t t o ' u n i l a t e r a l improvements ' and ' i n e s c a p a b l e ' s a n c t i o n s by oppos ing i n t e r e s t s . The a n a l y s i s g i v e s u s t h e means f o r a s s e s s i n g a s t a b l e outcome, b u t o n l y i f w e c a n r e a l i s - t i c a l l y e x p r e s s t h e p r e f e r e n c e s f o r s t r a t e g i e s and c o u n t e r - s t r a t e g i e s i n a n u n c e r t a i n environment . The model c a n n o t be used a l o n e : it must be a p p l i e d i n c o n ~ u n c t i o n w i t h a n o p t i m i - z a t i o n model whose purpose is t o g e n e r a t e outcomes f o r t h e p r e f e r e n c e (metagame) a n a l y s i s . Although t h e metagame a n a l y s i s s e a r c h e s f o r a ' m e t a e q u i l j b r i u m ' by a n a l y z i n g s t a t i c p r e f e r e n c e s o f oppos ing i n t e r e s t s , it d o e s n o t d e a l w i t h r e p e a t e d c o n f l i c t s o v e r t ime .
The d e c i s i o n a n a l y t i c approach i s a n improvement o v e r t h e metagame a n a l y s i s because it a l l o w s t h e m o d e l l e r t o i n c l u d e a g r e a t d e a l more s u b j e c t i v e i n f o r m a t i o n i n t h e model: p r e f e r e n c e s , r i s k a v e r s i o n , t r a d e o f f s between o b j e c t i v e s and u n c e r t a i n t y c a n a l l be t r e a t e d i n a r i g o r o u s f a s h i o n . The u s e f u l n e s s o f t h e approach depends l a r g e l y on t h e a c c u r a c y o f t h e a s s e s s m e n t p r o c e s s and t h e d e g r e e o f d e t a i l needed t o s p e c i f y t h e t e c h n o l o g i c a l re- l a t i o n s . More work, however, i s needed o n t h e a s s e s s m e n t p r o c e s s and t h e development o f n u l t i a t t r i b u t e u t i l i t y f u n c t i o n s .
3 ~ e e t h e r e f e r e n c e s f o r a n i l l u s t r a t i v e l i s t o f such models .

REFERENCES: AN ILLUSTRATIVE LIST
Games a n d Metagames
H i p e l , K . W . , R.K. Ragade , a n d T.E. Unny ( 1 9 7 4 ) , "Metagame A n a l y s i s o f Water R e s o u r c e s C o n f l i c t s , " J o u r n a Z of t h e Hydrau Z i c s D i v i s i o n , ASCE, 10q, No. HYIO.
Howard, N . ( 1 9 6 8 ) , "Some Deve lopmen t s i n t h e T h e o r y a n d A p p l i - c a t i o n o f Metagames ," Whar ton S c h o o l , U n i v e r s i t y o f P e n n s y l v a n i a , P h i l a d e l p h i a , P e n n s y l v a n i a .
Kahan, J . , a n d A. R a p o p o r t ( 1 9 7 4 ) , " T e s t s o f t h e B a r g a i n i n g S e t a n d K e r n e l Models i n T h r e e P e r s o n Games, " i n Came Theo ry a s a Theo ry of C o n f l i c t R e s o Z u t i o n , e d . A. R a p o p o r t , R e i d e l , Amsterdam, 11 9-1 60,
R o g e r s , P. ( 1 9 6 9 ) , "A Game T h e o r y Approach t o t h e P r o b l e m s o f I n t e r n a t i o n a l R i v e r B a s i n s , " Water R e s o u r c e s R e s e a r c h , 5, 749-761.
Von Neumann, J . , a n d 0. M o r g e n s t e r n , 1947 . Theo ry of Games a n d Economic B e h a v i o r , P r i n c e t o n U n i v e r s i t y P r e s s , P r i n c e t o n , New J e r s e y .
M u l t i o b j e c t i v e P l a n n i n g
Cohon, J . , a n d D. Marks ( 1 9 7 3 ) , " M u l t i o b j e c t i v e S c r e e n i n g Mode l s a n d Water R e s o u r c e s I n v e s t m e n t , " Water R e s o u r c e s R e s e a r c h , 9 , 826-837. -
Cohon, J . , a n d D. Marks ( 1 9 7 5 ) , "A Review a n d E v a l u a t i o n o f M u l t i o b j e c t i v e Programming T e c h n i q u e s , " Water R e s o u r c e s R e s e a r c h , 2, 208-220.
M a j o r , D ( 1 9 6 9 ) , " B e n e f i t C o s t R a t i o s f o r P r o j e c t s i n M u l t i p l e - O b j e c t i v e I n v e s t m e n t P r o g r a m s , " Water R e s o u r c e s R e s e a r c h , 5 , 1174-1178. -
Mera, K . ( 1 9 6 7 ) , " T r a d e Of f b e t w e e n A g g r e g a t e E f f i c i e n c y and I n t e r r e g i o n a l E q u i t y , " Q u a r t . J. Econ . , 8 1 , 658-674. -
M o n a r c h i , D., C. K i s i e l , a nd L. D u c k s t e i n (1 973 ) , " I n t e r a c t i v e M u l t i o b j e c t i v e Programming i n Water R e s o u r c e s : A C a s e S t u d y , " Water R e s o u r c e s R e s e a r c h , 9, 837-850.
D e c i s i o n T h e o r y
F i s h b u r n , P.C. ( 1 9 6 8 ) , " U t i l i t y T h e o r y , " Man S c i . , 14 , 335-378. - Keeney , R.L. ( 1969 ) " M u l t i d i m e n s i o n a l U t i l i t y F u n c t i o n s : T h e o r y ,
A s s e s s m e n t a n d A p p l i c a t i o n , " T e c h n i c a l R e p o r t No. 43 , O p e r a t i o n s R e s e a r c h C e n t e r , M.I .T . , Cambr idge , M a s s a c h u s e t t s .

Meyer, R.R., and J.W. P r a t t ( 1 9 6 8 ) , "The C o n s i s t e n t Asses smen t and F a i r i n g o f P r e f e r e n c e F u n c t i o n s , " IEEE. T r a n s a c t i o n s on Sys tems and C y b e r n e t i c s , Vol . SSC-4, 270-278.
P r a t t , J . W . , H. R a i f f a , and R.O. S c h l a i f e r ( 1 9 6 5 ) , I n t r o d u c t i o n t o S t a t i s t i c a l D e c i s i o n Theory, I lcGraw-Hill , New York.
P a r e t i a n A n a l y s i s
Dorfman, R., and J a c o b y ( 1 9 7 2 ) , "An I l l u s t r a t i v e Model o f R i v e r B a s i n P o l l u t i o n C o n t r o l , " i n Models f o r Managing R e g i o n a l Water Q u a l i t y , Harvard P r e s s , Cambridge , M a s s a c h u s e t t s , 84-141.
F i e r i n g , M.B. ( 1 9 7 4 ) , "Mathemat i ca l Model o f a P r o t o t y p e Water Sys t em," i n t e r n a l p a p e r , I n t e r n a t i o n a l I n s t i t u t e f o r A p p l i e d Sys t ems A n a l y s i s , Laxenburg , A u s t r i a .
Gros , J . ( 1 9 7 4 ) , "A P a r e t i a n E n v i r o n m e n t a l Approach t o Power P l a n t S i t i n g i n New Eng land , " Ph.D. T h e s i s , Harva rd Uni- v e r s i t y , Cambridge, M a s s a c h u s e t t s .
Gros , J. , and T. Ostrom (1 975) , "A D e c i s i o n A n a l y t i c Approach t o R i v e r B a s i n P o l l u t i o n C o n t r o l , " RM-75-9, I n t e r n a t i o n a l I n s t i t u t e f o r A p p l i e d Sys t ems A n a l y s i s , Laxenburg , A u s t r i a .
Ost rom, A. ( 1 9 7 4 ) , " E q u i t y C o n s i d e r a t i o n s i n F i e r i n g ' s P r o t o - t y p e Water Sys t em," i n t e r n a l p a p e r , I n t e r n a t i o n a l I n s t i t u t e f o r A p p l i e d Sys t ems A n a l y s i s , Laxenburg , A u s t r i a .
Wood, E. ( 1 9 7 4 ) , "A R e v i s i t t o t h e P r o t o t y p e Water Sys t em," i n t e r n a l p a p e r , I n t e r n a t i o n a l I n s t i t u t e f o r A p p l i e d Sys t ems A n a l y s i s , Laxenburg , A u s t r i a .
V o t e T r a d i n q
H a e f e l e , E.T. ( 1 9 7 1 ) , "A U t i l i t y Theory o f Z e p r e s e n t a t i v e Government, American Economic Review, - 61 , 3 , 3 5 0 f f .
H a e f e l e , E.T, R e p r e s e n t a t i v e Government and E n v i r o n m e n t a l Manage- ment , J o h n s Hopkins P r e s s , B a l t i m o r e , Mary land , 117-134.
R u s s e l l , C.S . , W.O. S p o f f o r d , and E.T. H a e f e l e (19721, "Env i ron - m e n t a l Q u a l i t y Management i n M e t r o p o l i t a n A r e a s , " p r e s e n t e d a t t h e I n t e r n a t i o n a l Economics A s s o c i a t i o n Mee t ing , Copen- hagen , J u n e 1972.


An Optimal Adaptive Prediction
Algorithm for Real-Time
Forecasting of Hydrologic Time Series
Andras Szollosi-Nagy
1. INTRODUCTION
In order to achieve effective control of water resource systems, one must know the future behaviour of the inputs to the particular systems. This is the ancient challenging task of the human being, because man's encounter with the prediction problem is as old as civilization itself.
The first successful scientific attack dates back to the early 1940's when Wiener and Kolmogorov solved the problem in- dependently for the case of linear dependent stationary pro- cesses, which requires solution of the Wiener-Hopf equation. In 1966, Eagleson et al. [4] were the first to apply this tech- nique for runoff prediction. Their paper initiated the ava- lanche of articles dealing with the various tricky modifications of Wiener's procedure for practical hydrologic forecasting problems (see e.g. [6], [22] and [241 ) . The classical Wiener- ~ o p f technique, however, has some serious drawbacks: it can be applied only for strictly linear and time invariant systems with stationary input/output processes. Some efforts had been made to extend the theory (see e.g. [7]); due to the computa- tional burden, however, they practically failed. Additional difficulties were raised by the use of spectral factorization, and from a practical point of view, by the necessity of using a relatively large computer to store all the data.
Obviously, for real-time operation of water resource sys- tems, small computers are preferable. Hence, our prediction algorithms must be suited for these small computers. But how? The answer is simple: using recursive prediction algorithms in which there is no need to store all the past measurements for the purpose of predicting the future behaviour of the time series in question. Moreover, these algorithms would offer the following advantages:
(1) The treatment of the information of each measure- ment in a sequential manner allows for on-line implementation (e.g. by means of data acquisition by automatic measurement devices connected in real- time mode with a central processor); and
(2) Time variable parameters and different types of disturbances can easily be treated.

Hence, a s u i t a b l e p r e d i c t i o n scheme should p r e f e r a b l y s a t i s f y t h e f o l l o w i n g requ i rements :
(1) It should b e mathemat ica l ly t r a c t a b l e ;
( 2 ) It should be e a s i l y implemented f o r r e l a t i v e l y s m a l l computers ;
( 3 ) It should be g e n e r a l l y a p p l i c a b l e ;
4 I t should y i e l d an 'optimum' p r e d i c t i o n ;
(5) It should b e a d a p t a b l e t o v a r y i n g env i ronmenta l c o n d i t i o n s ;
( 6 ) It should y i e l d an a c c e p t a b l e convergence.
The h y d r o l o g i c p r e d i c t i o n schemes used nowadays u n f o r t u - n a t e l y g e n e r a l l y f a i l t o m e e t one o r more of t h e s e requ i rements .
I n t h e e a r l y 1 9 6 0 ' s R.E. Kalman [ l o ] developed a n o p t i m a l s e q u e n t i a l e s t i m a t i o n t e c h n i q u e , u s u a l l y r e f e r r e d t o a s t h e Kalman f i l t e r , which h a s proved ex t remely u s e f u l i n d e a l i n g w i t h t h e d e s c r i p t i o n of s t o c h a s t i c a l l y e x c i t e d dynamic systems. The Kalman f i l t e r i n g t e c h n i q u e i s based on t h e s t a t e space , t i m e domain f o r m u l a t i o n of t h e p r o c e s s e s i n v o l v e d , and w i t h s l i g h t m o d i f i c a t i o n s o f f e r s a p rocedure a s a c a n d i d a t e f o r s a t i s f y i n g t h e above r e q u i r e m e n t s of a s u i t a b l e h y d r o l o g i c p r e d i c t i o n scheme.
I n t h i s paper we b r i e f l y o u t l i n e t h e b a s i s of t h e Kalman f i l t e r i n g t e c h n i q u e and propose a s i m p l e s ta te - space-based model f o r t h e r e c u r s i v e a d a p t i v e e s t i m a t i o n of t h e impulse r e s p o n s e of a h y d r o l o g i c system. D i s c r e t e t i m e models a r e c o n s i d e r e d . The proposed a l g o r i t h m s can. b e a p p l i e d t o s l i g h t l y non- l inear and t i m e v a r y i n g sys tems u s i n g a p r o p e r moving d a t a window. Having o b t a i n e d t h e o p t i m a l t i m e v a r y i n g impulse r e s p o n s e ( s ) , t h e well-known t e c h n i q u e s c a n b e used f o r p r e d i c t i n g t h e o u t p u t p r o c e s s (es) .
2. STATE-SPACE REPRESENTATION OF HYDROLOGIC PROCESSES
Cons ider a w a t e r r e s o u r c e system ( F i g u r e 1 1 , t h e behav iour which, e v o l v i n g on t h e d i s c r e t e - t i m e se t T = I t k : k = 0 , 1 , 2 , ... 1 , c a n be d e s c r i b e d by
' I n t h i s r e s p e c t , t h e r e a d e r i s r e f e r r e d t o t h e ex t remely r i c h l i t e r a t u r e , e . g . [ I ] , [ 1 6 ] , [18] and [20] .

where x(tk) is the n-vector of the states of the system at the
discrete time tk € T; y(tk) is the s-vector of control variables
or known system inputs; ~ ( t ) is the r-vector of uncertain k disturbances 'driving' the system; g(tk) is the m-vector of
measurements on the system; v(tk) is the m-vector of uncertain
disturbances corrupting the observations; and A and T are certain functionals characterizing the properties of that par- ticular system. Eq. (1) is called the state equation, and Eq. (2) the measurement equation (as the measurement noise v(-) is sometimes referred to as measurement uncertainty, whyle some components of w(*), or the entire ~ ( 0 ) itself, might be referred to as model uncertainty). Considering the simple example of a reservoir system consisting of n reservoirs, ~ ( t ~ )
might be sought as a vector composed of the values of the amount of stored water of each reservoir at time tk; !(tk) as a vector
. . . - of water releases (control variables); w(tk) as the vector of
natural (uncontrolled stochastic) inflows to the reservoirs, and z(tk) as the vector of measured outflows from the reservoirs.
MEASUREMEN1 NOISE
_V ( I k )
CONTROL VARIABLES '('k)
UKONTROLLED RANDOM ~ ( ' k ) DISTURBANCES
H Y D R O L O G I C A L
( W A T E R R E S O U R C E S I
P R O C E S S
I
MEASURE- MENTS
Figure 1. Hydrologic process identification.

I n t h i s c a s e , t h e s t a t e v e c t o r x_(-) r e f e r s t o a c t u a l p h y s i c a l s t a t e s , namely t o t h e amount of s t o r e d w a t e r i n t h e system; b u t , a s w i l l b e shown l a t e r , it is n o t a t a l l n e c e s s a r y t o a s s o c i a t e t h e s t a t e v e c t o r w i t h " p h y s i c a l " s t a t e s . I n o t h e r words, one can choose amongst d i f f e r e n t t y p e s of s t a t e v a r i a b l e s t o d e s c r i b e t h e same p r o c e s s .
Dea l ing w i t h t h e above t y p e o f models, one must d e t e r m i n e t h e s t r u c t u r e of t h e system, i n o t h e r words, t h e f u n c t i o n a l s d and T. T h i s i s t h e problem o f system i d e n t i f i c a t i o n 1181. Having i d e n t i f i e d t h e system, t h e n e x t s t e p i s t o f i n d t h e ' b e s t ' p r e d i c t i o n of t h e s t a t e v e c t o r (which may sometimes c o n t a i n t h e o u t p u t p r o c e s s depending upon t h e c h o i c e o f t h e s t a t e v a r i a b l e s ) L > 0 t i m e p e r i o d s ahead , based upon knowledge of t h e measurement on t h e system a t tk
where L i s t h e l e a d t i m e of t h e p r e d i c t i o n , R d e n o t e s t h e p re - d i c t i o n a l g o r i t h m s , and t h e c i r c u m f l e x r e f e r s t o t h e p r e d i c t e d ( e s t i m a t e d ) v a l u e . Obviously, t h e goodness of p r e d i c t i o n must b e e v a l u a t e d th rough a g i v e n l o s s ( c o s t ) f u n c t i o n , L (. ) . Now, t h e p r e d i c t i o n problem can b e fo rmula ted a s f o l l o w s : g i v e n t h e s e t of measurements Z k = { z ( t i ) : i = 1 , 2 , ..., k ) , f i n d and
e s t i m a t e i ( t k + L I Z k ) of ~ ( t ~ + ~ ) , L > 0 , s u b j e c t t o t h e c o n d i t i o n
t h a t t h i s e s t i m a t i o n ( p r e d i c t i o n ) minimizes t h e chosen l o s s f u n c t i o n .
W e ment ion i n advance t h a t t h e i d e n t i f i c a t i o n and p r e d i c - t i o n a l g o r i t h m s w i l l be imbedded h e r e i n t o t h e same g e n e r a l a d a p t i v e a l g o r i t h m s .
I n t h i s paper w e c o s i d e r l i n e a r lumped parameter wa te r r e s o u r c e systems whereQand T a r e l i n e a r f u n c t i o n a l s . I n o t h e r words, t h e p r o c e s s e s a r e assumed t o b e r e p r e s e n t e d by t h e l i n e a r v e c t o r d i f f e r e n c e e q u a t i o n
where, beyond t h e v a r i a b l e s a l r e a d y d e f i n e d , gk G g ( t k + l , t k ) i s t h e n x n n o n s i n g u l a r s t a t e t r a n s i t i o n m a t r i x which, i n t h e c a s e of an unforced system, maps t h e s t a t e v e c t o r from t i m e tk
t o t h e s t a t e v e c t o r a t t i m e tk+l; Lk & r ( t k ) i s t h e n x r system
n o i s e c o e f f i c i e n t m a t r i x , and A k 2 L ( t k ) i s t h e n x s c o n t r o l
m a t r i x . Note t h a t i n g e n e r a l t h e s e m a t r i c e s a r e t i m e v a r y i n g .

As for the stochastic model uncertainty w (tk), without loss of
generality it is assumed to be a Gaussian white noise sequence with zero mean
and covariance matrix
where denotes the expected value operator, T the matrix transposition, dkj the Kronecker delta, and gk 2 Q(tk+l,tk) the r x r noise covariance matrix, i.e. y(tk) 2' N(g, Qk) .
- - . .
Also, it is assumed that the measurement equation (cf. Eq. ( 2 ) ) is linear and has the form
Here kIk 2 g(tk) is the m x n measurement matrix, and the measurement uncertainty y(tk) is also assumed to be a Gaussian
white sequence with zero mean
and covariance matrix
where the m x m noise covariance matrix gk 2 g(tk) is assumed to be positive-def inite. That is, y (tk) 2' N (2, Rk) . Moreover,
it is assumed that the noise processes are uncorrelated with one another, i.e.

F u r t h e r , we w i l l u t i l i z e t h e s e p a r a t i o n theorem (see e.g . Bryson and Ho [ 2 ] ) which s t a t e s t h a t , f o r l i n e a r systems w i t h q u a d r a t i c c o s t f u n c t i o n s and s u b j e c t t o a d d i t i v e w h i t e Gaussian n o i s e i n p u t s , t h e optimum s t o c h a s t i c c o n t r o l l e r i s r e a l i z e d by c a s c a d i n g a n op t imal e s t i m a t o r ( p r e d i c t o r ) w i t h a d e t e r m i n i s t i c optimum c o n t r o l l e r (F igure 2 ) . According t o t h i s p r i n c i p l e , t h e o p t i m a l s t o c h a s t i c c o n t r o l of a water r e s o u r c e system c a n b e decoupled i n t o two p a r t s . Now, w e c o n c e n t r a t e on t h e f i r s t problem, t h e s t a t e e s t i m a t i o n / p r e d i c t i o n problem. T h e r e f o r e , t h e terms i n Eq. (1) and ( 4 ) c o n s i s t i n g of t h e c o n t r o l f u n c t i o n u ( - ) w i l l b e o m i t t e d from now on.
figure 2. Separation principle.
I I I OPTIMAL STOCHASTIC CONTROL I & ( t k ) I I
I
L I N E A R I
1 - ~ ( t k ) I PROCESS - x ( t k )
One can a r g u e a b o u t t h e b a s i c assumpt ions of t h e n o i s e p r o c e s s e s be ing Gaussian w h i t e sequences w i t h known c o v a r i a n c e m a t r i c e s . I n p a r t i c u l a r , it i s hard t o s a y t h a t t h e l a t t e r v a l u e s a r e known i n d e a l i n g w i t h h y d r o l o g i c t i m e series. To overcome t h i s d i f f i c u l t y , an a d a p t i v e n o i s e c o v a r i a n c e m a t r i x a l g o r i t h m w i l l b e i n t r o d u c e d . A s f o r hand l ing ' c o l o r e d ' n o i s e s , i f t h e s t a t e v e c t o r might be p r o p e r l y augmented w i t h t h e de- pendent p a r t of t h e p r o c e s s e s , t h e r e s u l t i n g r e s i d u a l i s a w h i t e sequence ( f o r d e t a i l s see P o r e b s k i [151) .
I I I I I i ( t , o I - I
I I
I A D A P T I V E ' I I I I I I - V ( t k ) I I L ------ ---------_I
MEASLIREMENT NOISE
- I I I
CONTROLLER - v DY NAMlCS
I
w

It is a well-known fact that the autoregressive (AR) models and moving-average (MA) models, or their combinations, the ARMA and ARIMA models, have found a fruitful application area in describing the behaviour of hydrologic time series. There are tremendous amounts of literature to prove this; however, almost each paper offers a different approach for handling the models. It can be shown that all those time series models could be included, as special cases, under the umbrella of the general state space model. As an example, consider the mth dimensional discrete-time autoregressive model pth order, ARm (p) :
where, beyond the known notations, the matrices 8 . (. ) and fi ( ) 1
contain the AR parameters, and the vector
y(.) = Iyl(-1, y2(.), . . . ,y,,,(.) l T represents m (possibly corre- - lated) water resource processes such as runoff, soil moisture content, water use, BOD, DO, toxic materials in the water, etc., depending upon the objective of the study. For the sake of notational simplicity initial conditions are ignored and the p = 2 case is considered here. For the state space represen- tation of the ARm(2) process we define the state vector as
and, using the AR parameter matrices, define the following matrices:

Then the state space model
is completely equivalent to the ARm(2) model. That this is
really a special case is seen when the above state space model is compared with Eq. ( I ) ) and (5). A similar formulation can be obtained for MA,ARMA, processes. It should be noted again, however, that the above state space formulation of an AR process is not unique, in the sense that if another form is chosen for the state vector the matrices 2 , r , H will change but the input- output behaviour of the system will not. In other words, the choice of a particular set (2, T I H) corresponds to the choice of a coordinate system [20]. ow ever, the proper choice of the state vector has great significance from the point of view of practical computations on the one hand, and of system control- ability and observability on the other L21.1.
3. THE ADAPTIVE SEQUENTIAL PREDICTION ALGORITHMS
Assume that a prior estimate i(tkltk-l) of the system state
x(t ) is given at time tk which is based on previous measure- k ments up to tk-l. Then we seek an updated estimate 2(tk(tk)
which takes into account the new measurement z(tk) at time tk.
(For the notattons and timing see Figure 3 . ) Consider the updated estimation as being the linear combination of the pre- vious state and the new (noisy) measurement
-., - where IZk 2 K(tk) and Kk K(tk) are time varying weighting
matrices as yet unspecified. As a matter of fact, we wish to minimize, in a certain sense, the prediction error
Substituting Eq. (5) into Eq. (6) and utilizing the properties of the noise process, it can readily be seen that Eq. (6) will be an unbiased estimation only if = ; - skHk. Hence, the state estimation i(tkl tk) , using the new measurement z(tk), is

where gk is s t i l l u n s p e c i f i e d , and t h e i n i t i a l c o n d i t i o n a t
t = to f o r t h e s t a t e e s t i m a t i o n i s g i v e n by
Figure 3. Discrete timing diagram.
3 k-l d g ( t k l t k - l )
-Ok-1
As 3 measure of t h e goodness of t h e e s t i m a t i o n , we u s e t h e n x h c o v a r i a n c e m a t r i x g ( . ) of t h e p r e d i c t i o n e r r o r
which i s o b v i o u s l y s p e t r i c , and i t s t r a c e i s t h e mean s q u a r e l e n g t h of t h e v e c t o r x ( . ) . I ts i n i t i a l c o n d i t i o n i s g i v e n by
A - ...... T 5
. . tk.. tk tk.1 ' ' k+l
- 0 k
T g (tol to) = Et (x (to) - g ( t o ) ( x ( t o ) - g (to) 1
= v a r t x ( t o ) l = g ( t o ) .
i k . 1 i ( t k+ l lk+ l ) - i ( b l t k )
Qk.1

It can also easily be seen that the covariance matrix of f (tkl tkl can be projected from that of g(tkl tk-ll as
Now, we define the loss function as the following quadratic form:
where S is any positive semi-definite matrix; for the sake of simplicity let = I, the identity matrix. Having defined the loss function we seek that estimate %(t t ) of g(tk)--in other
kl k words, that form of the yet unspecified gk--which minimizes
the expected loss (or Bayesian risk)
Since Bk is the trace of the error covariance matrix (cf. Eq.
(9)) the problem is to minimize the Euclidean norm 1 P(tkl tk) 1 I of g (tkl tk) , i.e. the length of the estimation error vector. Using the properties of matrix derivatives, it can be seen that the weighting matrix Kk can be obtained from
which is referred to as the Kalman gain matrix. Now, the next step is the extrapolation of the state variable. Consider the one-step-ahead case, when .t = 1. In the process model, Eq: ( 4 1 , w(-) is a white noise sequence, so no more information on it is contained in g(. ) ; thus the best prediction of w(.) that can be

made from z(.) is its mean value, i.e. 0. Consequently, the one-step-a6ead prediction of the state vector, given observa- tions up to tk, is
The propagation of prediction errors, i.e. P (t t 1 + P (tk+= 1 tk) , can be determined by computing the pre-
kl k dicted error covariance matrix as
Using Eq. (12) and (4) and utilizing the fact that the predic- tion error and model error are independent of each other, we obtain
Using the formulas in the order of Eq. (12), (131, then with k: = k + 1 in (ll), (8) and (10) the celebrated Kalman filter is obtained. The algorithms should be used sequentially, k = 1,2, ..., starting with the given initial conditions at time to. The complete algorithms, together with the initial condi-
tions, are summarized in Table 1. Kalman has shown that the algorithms are convergent and stable [ill.
Up to this point, we assumed that the noise covariance matrices Qk, R at time tk are known in the estimation algo- -k ~ -
rithms. But in dealing with water resource time series, this is far from being true; it is necessary to predict Qk and Rk based upon measurements at the previous stage. Hence, to take into account the changing structure of uncertainties, an adaptive algorithm should be constructed for estimating the noise covariances, starting with arbitrary initial guesses. Since the noise covariance matrix R(t ) is assumed to be independent k ~ -
of time, the one-step-ahead prediction of it is
2 ~ t might be mentioned that the same algorithms are obtain- ed by maximizing the a posteriori probability P ( X Z ) where -*I-k
Xk = {x(ti) : i = 1,2, ..., k) and Zk is as before. For a detail-
ed discussion, consult Sage [16].

S y s t e m M o d e l ~ I t ~ + ~ l = Fk ? I t k ) + c k ! IFk) , ! I t k ) - , N ( g . Q k l
M e a s u r e m e n t M o d e l z l t k l = Ck : I t k ) + y ( t k l , ! I t k ) " N l g . E k l
I n i t i a l C o n d l t l o n s E l l l t o l I = & r o l = S i t o t o l
, $ l l x l t o ) - ?( ( to) ) (:It,) - = var l x i t o ) i = ? i t o ) = ~ ' t , ( t , l
o t h e r A s s u r n p t l o n E( ! I tk l " l t 1 1 = g , V k . 3
S t a t e P r e d l c t l o n s l t k + , Itk, = 5k ; l t k t k )
Predicted E r r o r C o v a r l a n c e M a t r l x
L ( t k + l ( t k l = P k ! ? l t k t k ) .; + Ik Ok !;f
P r e d i c t o r G a l n A l g o r l t h m
= P ( t k + l ( t k i H : + ~ ~ H ~ + ~ ! ( t k + l ( t k l !:+I ' ~ k ~ 1 l - l
S t a t e E s t l m a t l o n Using t h e New
Ir tk+, t k + l ) = I l t k + l I t k ) + B k + l l ' ( L k + , ) - n k + l l i t k + : t k ) l
M e a s u r e m e n t
E r r o r Covarlance M a t r l n A l g o r i t h m
? i t k + l j t k + l ~ = I! - x k + l ! k + l ) ? l t k + l ( t k ~ 1; - !k+l ! k + , i T + K k + i R k + l .
Table 1. Discrete Kalman fdter algorithms.
For the sequential estimation of g(. ) Sage and Husa [17] developed a suboptimal adaptive estimation algorithm:
where
2 (tk) = 5 (t*) - H~ ( t k 1 tk-l)

is known as the 'innovation sequence' (Kailath [ 9 ] for the sub- optimal estimator. The innovation process u ( . ) is a white noise seque:ce; i.e. heuristically there is no information left in U_ ( - ) if x ( * ) is an optimal estimation (Mehra [ 121 ) . A similar expFession can be obtained for the adaptive estimator of the model noise covariance. Sage and Husa have also shown in their paper cited that the suboptimal estimation rapidly converges to the optimal one when tk is increasing. It should
be mentioned that there are numerous adaptive algorithms ([la, 121) on the market, but for our purpose the above seems to be the most effective, at least from a computational point of view.
4. ADAPTIVE PREDICTION OF LINEAR HYDROLOGIC SYSTEMS
It is well known (see e.g. Dooge [3]) that a fairly large class of hydrologic systems (e.g. rainfall excess/surface run- off, runoff/runoff transformations of flood routing, etc.) can be described by a convolution type of model
where u(t) is the input of the system (either controllable or not), h(t) is the impulse response of the system and y(t) is the output process; the asterisk denotes the convolution. In practice, however, we have only noise corrupted measurements
where v(t) is an unknown noise process (Figure 4). Hence for linear time invariant lumped systems
m
where in case of physically realizable systems the upper bound of the integration is t. Note that although the system was assumed linear, in case of slight non-linearities, the noise process v(.) might be sought as a term including those 'small' non-linear disturbances.
Considering discrete-time systems with finite memory q, Eq. (17) can be written as

and by d e f i n i n g t h e v e c t o r s
Eq. (18) becomes
Figure 4. Linear system model.
Thi s equa t i on c a n be looked upon a s a measurement equa t i on f o r t h e above-def i ned s t a t e v e c t o r 5 (. ) : c f . Eq. ( 5 ) . The miss ing s t a t e equa t i on can a l s o be in t roduced wi thout much d i f f i c u l t y . It was assumed t h a t t h e system i s t ime i n v a r i a n t ; i .e . i t s i m - p u l s e r e sponse h ( . ) does n o t change w i t h t i m e . Using t h e s t a t e v e c t o r de f i ned above, t h i s s t a t emen t can be formula ted a s

which p l a y s t h e r o l e of t h e s t a t e equa t ion .
Although it was assumed t h a t t h e system i s t r u l y t ime v a r i a n t , it should be s t r e s s e d t h a t t h e above formula t ion can be used f o r d e s c r i b i n g s l i g h t l y t ime v a r i a n t systems which, due t o seasona l changes, a r e most common i n hydrology. This concept i s i l l u s t r a t e d i n F igu re 5 where t h e system behaviour i s cons idered t o be time i n v a r i a n t w i th in a we l l de f ined ' d a t a window.' Th i s d a t a window, of course , i s of a moving type. A s t o t h e l e n g t h of t h e moving d a t a window, it i s e s s e n t i a l l y equa l t o t h e memory of t h e system and might be e s t ima ted from c r o s s - c o r r e l a t i o n a n a l y s i s of t h e i npu t /ou tpu t p rocesses . The moving d a t a window c r e a t e s t h e b a s i s of t h e s e q u e n t i a l p red ic - t i o n .
- TIME
Figure 5. Time varying measurement sequence with moving data window.
If we assume t h a t t h e no i s e sequence v ( t k ) is Gaussian . -
whi te w i th v ( t k ) % N ( O , R k ) , then it i s s t i l l an open ques t i on
how t o determine i t s var iance . This can be done by t h e adap t ive a lgo r i t hm of Saga and Husa p r ev ious ly d i s cus sed , o r even more e a s i l y because of t h e s p e c i a l s t r u c t u r e of t h e s t a t e space model. The s p e c i a l i t i e s a r e ik = 2, r = 0, and hence t h e s t a t e pred ic - t i o n i s -k

and the predicted error covariance matrix is in the form of
Since v(-) is a zero mean white noise sequence, the optimal one-step-ahead Bayes (minimum variance) prediction of the out- put process, based upon observations up to tk, is
The complete sequential prediction algorithms are summarized in Table 2. Note that to use the recursive algorithms, the initial conditions e(to), var {g(to)) and Ro must be specified
(or rather assumed).
P r o c e s s M o d e l " i t k r l 1 = " t k )
M e a s u r e m e n t M o d e l Z i t k ) = - H k & i t k ) + " i t k ] , v i t 1 i N i o . l i k l
I n l t r a l Conditions x i t o ) = e i ~ ( t , l l , e l t o ) = uar ~ i t , l 1
S t a t e Prediction ~ i t k t l 1 t k l = q ( t k t k l
- 8
O u t p u t P r e d i c t r o n - I
z i t k t l t k l = t ik z i t k t k '
P r e d i c t e d E r r o r P i t k r l I t k ) = P i t t I C o v a r i a n c e M a t r i x k l k
Predictor G a i n A l g o r i t h n
B ~ + ~ = ! i t k t k ) HE+, isktl ? i t k t k ) cTA1 + ~ ~ 1 - l
s t a t e E s t i r n a t r o n U s l n g t h e New
i ( t k + l I t k t l ) = i i t k t k ) + s ~ + ~ i L ( t k t l ) - H ~ + ~ X i t k t k ) I
M e a s u r e m e n t
Error C o v a r i a n c e M a t r i x A l g o r i t h m ~ [ t ~ + , J t ~ + ~ ) = 11 - I ~ + ~ ~ ~ + ~ ) ~ ( t ~ / t ~ 1 - E ~ + ~ ~ ~ + ~ l ~ + ik+, .
M e a s u r e m e n t N O l s e Algorithm 'kt1 =
I t k Rk ' Y ( t k + l ' . T ( t k + l l - !k+l ~ ~ ~ k ( ~ k ~ ! E + l ]
I n n o v a t i o n s V ( t k t l i = Z i t k + l l - ' ( t A l g o r i t h m
Table 2. Discrete suboptimal adaptive prediction algorithms.

I n o r d e r t o i l l u s t r a t e t h e u t i l i t y of t h e proposed a lgo- r i t h m s , a s i m u l a t i o n e x e r c i s e was e l a b o r a t e d . A g i v e n impulse r e s p o n s e was assumed, and u s i n g t h a t and a n a r b i t r a r y i n p u t sequence, t h e o u t p u t p r o c e s s was c a l c u l a t e d t h r o u g h t h e s i m p l e d i s c r e t e c o n v o l u t i o n . Then a Gauss ian w h i t e n o i s e sequence was g e n e r a t e d w i t h z e r o mean and v a r i a n c e 0.1. T h i s sequence was t h e n added t o t h e o u t p u t p r o c e s s ; t h e r e s u l t i n g n o i s e c o r - r u p t e d sequence and t h e o r i g i n a l i n p u t sequence were f u r t h e r ana lyzed t o see whether t h e a l g o r i t h m d o e s o r d o e s n o t g i v e ' back ' t h e impulse r e s p o n s e assumed. A s a n example F i g u r e 6 shows t h e s i t u a t i o n concern ing a p a r t i c u l a r o r d i n a t e o f t h e impulse response . The c o n s t a n t l i n e ( a ) means t h e ' t r u e ' t h i r d o r d i n a t e o f t h e impulse r e s p o n s e , h3, w h i l e c u r v e ( b ) shows
i t s e s t i m a t e d v a l u e s u s i n g t h e p r i o r knowledge ( i f it is a v a i l - a b l e ) o f t h e v a r i a n c e ; c u r v e ( c ) shows how i t s e s t i m a t e d v a l u e s e v o l v e when t h e r e i s no p r i o r knowledge, i . e . a n i n i t i a l g u e s s f o r t h e v a r i a n c e had been c o n s i d e r e d and t h e a d a p t i v e n o i s e v a r i a n c e e s t i m a t i o n t e c h n i q u e was used. I t i s c l e a r from t h e f i g u r e t h a t whatever t h e i n i t i a l g u e s s is, t h e e s t i m a t i o n p rocedure i s convergen t a s t h e number o f measurement d a t a i n - c r e a s e s . The h i s t o r y of t h e a d a p t i v e s e q u e n t i a l n o i s e v a r i a n c e e s t i m a t i o n is d e p i c t e d i n F i g u r e 7 . I n f a c t , t h e same conc lu - s i o n migh t b e drawn.
:::I ! ! : ! ; ; ; ; , , ; ; ; : ; : :
0.0 0 50 100 150 l k
Figure 6. Sequential estimation of the 3rd impulse response ordinate, h3.

Figure 7. Adaptive suboptimal sequential estimation o f the noise variance.
5. SUMMARY AND CONCLUSIONS
The paper outlined the state space formulation of hydro- logic/water resource systems. Prediction algorithms have been proposed which satisfy the requirements of the suitable predic- tion scheme laid down in the introduction since:
(1) Using time domain formulation, the usual frequency- domain-based computations can be avoided on the one hand and the problem becomes mathematically tractable on the other;
(2) Due to the recursiveness of the algorithms the scheme can easily be implemented even for small computers and be applicable for real-time on-line forecastirlq, always taking into consideration the newest informa- tion gathered;
( 3 ) Due to the state space formulation, it is generally applicable to most general hydrologic time series (water quantity and/or quality); thus the joint handling/prediction of multidimensional time series (which might include some economic data) becomes feasible even in the presence of different kinds of uncertainties;

( 4 ) The algorithms give optimal prediction in Bayes' sense (Bayesian minimum variance estimators);
(5) The requirement of adaptivity to changing environ- mental conditions is fulfilled, as through a moving data window slight modifications in the model param- eters are allowed;
(6) The algorithms are convergent and stable under very general conditions.
To illustrate the above properties, an example was presented using simulated data. The results obtained indicate the practical applicability of the proposed procedure.
As a final remark, it might be mentioned that the proce- dure can be extended to include the identification/prediction of stochastic non-linear hydrologic system. This could be done, for example, by augmenting the state vector with the or- dinates of the higher-order impulse responses and then taking advantage of the non-linear filtering techniques. But a lot of effort still remains to be made in the future towards the solution of these problems.

References
Aoki, M., O p t i m i z a t i o n o f S t o c h a s t i c S y s t e m s , Academic Press, New York, 1967.
Bryson, E.E., and Y.C. Ho, A p p l i e d Op t ima l C o n t r o l , Blaisdell, Waltham, ?lass., 1969.
Dooge, J.C.I., L i n e a r T h e o r y o f H y d r o l o g i c S y s t e m s , USDA Tech. Bulletin No. 1468, Washington, D.C., October 1973.
Eagleson, P.S., R. Mejia and F. March, Computation of Optimum Realizable Unit Hydrograph, Water R e s o u r c e s R e s e a r c h , 2, 4 (1966).
Harrison, P.J. and C.F. Stevens, A Bayesian Approach to Short-Term Forecasting, A p p l . Res . Q u a r t . , 2 , 4 (1971 ) .
Hino, M., Analytic Solution of Wiener-Hopf Equation for Runoff Prediction, Proc . IAHR X I I I t h Congr . , Kyoto, 1969.
Ivakhnenko, A.G., and V.G. Lapa, C y b e r n e t i c s and F o r e c a s t i n g T e c h n i q u e s , Elsevier, New York, 1967.
Jazwinski, A.H., Adaptive Filtering, Au toma t i c a , 5 (1 969) , 475-485.
Kailath, T., An Innovations Approach to Least-Squares Estimation - Part I: Linear Filtering in Additive White Noise, IEEE T r a n s . A u t o m a t i c C o n t r o l , AC-13 (1968), 646-655.
Kalman, R.E., A New Approach to Linear Filtering and Prediction Problems, J . B a s i c , Eng., 82D (March, 1960), 35-45.
Kalman, R.E., New Methods in Wiener Filtering Theory, Proc . F i r s t Symp. on E n g i n e e r i n g A p p l i c a t i o n o f Random F u n c t i o n T h e o r y and P r o b a b i l i t y (ed. J.L. Bogdanoff and F. Kozin) , Wiley , New York, 1963.
Mehra, R.K., On the Identification of Variances and Adaptive Kalman Filtering, Proc . 1969, J o i n t A u t o m a t i c C o n t r o l C o n f . (19691, 494-505.
Miller, R.W., Asymptotic Behaviour of the Kalman Filter with Exponential Aging, AIAA J o u r n a l , 9 , 4 (1971), 767-768.

N a y l o r , T.H. and T.G. S e a k s , Box - Jenk in s Methods : An A l t e r n a t i v e t o E c o n o m e t r i c Mode l s , I n t . S t a t . Rev . , 40 , 2 ( 1972 ) 123-137. -
P o r e b s k i , W . , Kalman I n v e r s e F i l t e r w i t h Discrete Time O b s e r v a t i o n s , B u l l . d e l 'Academia Po l o n a i s e d e s S c i . , 12 , - 20, 1 ( 1 9 7 2 ) , 15-19.
S a g e , A.P. , Optimum S y s t e m s Con t ro l , P r e n t i c e - H a l l , Englewood C l i f f s , N . J . , 1968 .
S a g e , A.P. a n d G.W. Husa , A d a p t i v e F i l t e r i n g w i t h Unknown P r i o r S t a t i s t i c s , Proc . 1 9 6 9 J o i n t A u t o m a t i c C o n t r o l C o n f . , 1 9 6 9 , 760-769.
S a g e , A.P. a n d J . L . Melsa, S y s t e m I d e n t i f i c a t i o n , Academic P r e s s , New York , 1971 .
S a w a r a g i , Y . , Y . S u n a h a r a a n d T . Nakamizo, S t a t i s t i c a l D e c i s i o n T h e o r y i n A d a p t i v e C o n t r o l S y s t e m s , Academic P r e s s , New York , 1967 .
Schweppe , F .C. , U n c e r t a i n Dynamic S y s t e m s , P r e n t i c e - H a l l , Englewood C l i f f s , N . J . , 1973 .
S o r e n s o n , H.W., C o n t r o l l a b i l i t y a n d O b s e r v a b i l i t y o f L i n e a r , S t o c h a s t i c , T i m e - d i s c r e t e C o n t r o l S y s t e m s , i n Advances i n C o n t r o l S y s t e m s ( e d . C.T. L e o n d e s ) , Academic P r e s s , New York , 5 ( 1 9 6 8 ) , 95-158.
S z o l l o s i - ~ a g y , A . , P r e d i c t i n g t h e D i s c h a r g e Time S e r i e s o f S m a l l R i v e r s a n d B r o o k s Us ing W i e n e r ' s T h e o r y o f E x t r a p o l a t i o n , Proc . ICID 1 1 t h European R e g i o n a l C o n f . , R:1.3/10, B u d a p e s t , 1973 .
Urbanek , K . , L e c t u r e s on P r e d i c t i o n T h e o r y , L e c t . N o t e s o n Math. NO. 44 , S p r i n g e r , B e r l i n , 1967 .
V i s c a i n o , A. a n d J. B r i b i e s c a , A S t a t i s t i c a l Method t o S e a r c h f o r a R a i n f a l l - R u n o f f R e l a t i o n s h i p , Proc . I n t . Symp. on Hydro logy , F o r t C o l l i n s , C o l . , 1967 .

Algorithms for the Stochastic
Inflow-Nonlinear Objective Water Reservoir
Control Problem
John Casti
1. INTRODUCTION
In an earlier IIASA internal paper (Casti, 1974) and private
communication to the author (Dantzig, 1975), algorithms to
determine the optimal control of a water reservoir network with
stochastic inflows and nonlinear utilities have been proposed.
Both studies utilize a dynamic-programming type approach, coupled
with approximations of one kind or another, in order to yield a
computational algorithm in which the bulk of the calculation is
carried out by efficient (and rapid) network flow algorithms.
The purpose of this note is to present a synthesis of the work
in these papers and to spell out the precise steps of an
algorithm in sufficient detail to enable a computer program to
be constructed.
2. BASIC PROBLEM
Before considering our algorithm, let us briefly review
the basic water reservoir control problem. We are given m
reservoirs connected in some type of network configurations by
various branches (rivers, tributaries, etc.). At the beginning
of each time period t, reservoir i contains an amount of water
uit i = 1,2, ..., m, to be released from each reservoir in order that some measure of utility of the water released is maximized,
subject to various constraints. For a single stage process,
this problem is not too difficult; however, the real problem is complicated by being a multistage process with the added feature
of having stochastic inflow at each reservoir at each time due
to rainfall and underground water run-off. In addition, the

various utility functions for each reservoir are often nonlinear,
thereby precluding any direct application of linear programming
procedures. Consequently, other approaches are required.
In order to formulate our problem in mathematical terms,
let
si(t) = amount of water available in reservoir i
at time t,
u.(t) = amount of water released from reservoir i 1
at time t,
ri(t) = external inflow to reservoir i at time t
(stochastic quantity) i = 1,2, ..., m, t = 0,1, ..., T.
Clearly, the dynamics of each reservoir are described by the
equation
where Ii is the subset of {1,2, ..., m} consisting of those reservoirs which input water to reservoir it and B represents
j the fraction of water released from reservoir j which is not
absorbed by the network before it reaches reservoir i,
0 5 Bj < 1, i = 1,2 ,..., m. Let us assume that there is a certain cost associated with
releasing an amount of water ui available at reservoir i.
Following Casti (1974), we assume this cost is expressible by
the convex function @.(u.), i = 1,2, ..., m. i.e. The total 1 1
objective function is
m - J l r ~ m - 1 $k(~k)
k= 1
Since the quantities ri(t) in (1) are random variables with
distribution function dGi(r), our optimization problem may

be formulated as
min ~ [ J I
over all control sequences {ul (t), ..., um(t), t = 0,1,...,T-11,
where s (t) and u (t) are related by (1) and the constraints
are satisfied. Here k? denotes the expected value relative to the distribution function dGi(r), while the quantities pi(t)
represent certain minimal demands for water which must be met
by release from reservoir i, i = 1,2, ..., m. We tackle this problem by dynamic programming. Let
ft(slr...,sm) = expected value of J when the process
has T-t time periods remaining, is in
state (sl , . . . , s 1 and an optimal policy m is pursued, t = 0,1, ..., T.
Then it is an easy application of the principle of
optimality to see that ft satisfies the functional equation

where $k(sk) represents the cost of terminating the process
with water level sk in reservoir k.
Our next objective is to make approximations in Eq. (4) so
that it will be possible to utilize network flow algorithms to
effect the minimization over the u's for fixed values of
sl ,...,S rl ,...,rm. This means that both the individual m reservoir costs @ . (u. ) and the "next stage" return ft+, (a, , a2 , .. . ,
1 1
am) must be judiciously approximated. The heart of our methods
is in the selection of approximations for these quantities that
not only preserve accuracy, but also enable us to apply network
flow techniques for solution of the minimization over the u's.
The first approximation is to replace the individual
reservoir costs by piecewise linear functions. Since we have
assumed each Qi is a convex function of its argument with
@i(0) = 0, we have
Hence, in each segment of the form ui ~ ~ ~ l ~ , j = ~ , l , . . . ,
the function @i is linear.
Our second approximation is in "policy space", i.e. we 0 guess an operating policy u (s lr...rSm; t) and use this policy
to determine a return function from the relations (4) and (5).
This is a type of approximation well-suited to taking advantage
of experience and "seat-of-the-pants" operating rules for
reservoir systems. In addition, it can be shown that the
algorithm described below will monotonically improve (in the
sense of the criterion (2)) the current policy as the iteration
procedure progresses. Thus, we have a systematic method for
improving any existing policy.
Having fixed an approximation to the policy u, our last

approx imat ion i s t o t h e o p t i m a l v a l u e f u n c t i o n
By v i r t u e of t h e c r i t e r i o n ( 2 ) and t h e s t r u c t u r e of t h e b i , it i s n o t d i f f i c u l t t o see t h a t t h e f u n c t i o n f t + l (., ...,a ) i s
s e p a r a b l e i n i t s arguments , i . e .
where t h e f u n c t i o n s yi w i l l be convex r e l a t i v e t o t h e
v a r i a b l e ui ( h e r e we u s e a i = si - u i ( s l 1 . . . , s m ; t ) + ri + j
1 ~ j u j ( s l , . . . , s m ; t ) . Again we may approximate t h e y ' s by
p i e c e w i s e l i n e a r f u n c t i o n s , t h e r e b y g i v i n g f t + l ( * , . . . , * ) t h e
d e s i r e d l i n e a r s t r u c t u r e . C l e a r l y , t h e p r e v i o u s approx imat ion
t o t h e $i w i l l b e used t o approximate f T ( a l , . . . , a m ) , w h i l e f o r t < T - 1 , approximat ion a l g o r i t h m s i n t h e DYGAM
computer program may be employed.
3. THE ALGORITHMS
W e s h a l l p r e s e n t two a l t e r n a t i v e a l g o r i t h m s i n t h i s s e c t i o n .
The f i r s t w i l l be based d i r e c t l y upon t h e p o l i c y s p a c e i d e a
p r e s e n t e d above, w h i l e t h e second i s based upon i d e a s i n t r o d u c e d
i n Dantzig (1975) . I n b o t h c a s e s , t h e pr imary o b j e c t i v e is t o
r e d u c e t h e c a l c u l a t i o n t o a l e v e l a t which a lmos t a l l t h e work
is done by t h e e f f k i e n t network f low a l g o r i t h m s .
3.1 A l t e r n a t i v e I ( P o l i c y Space I t e r a t i o n )
The s t e p s i n t h i s a l g o r i t h m a r e t h e fo l lowing :

1. Approximate the functions @i(ui) by piecewise linear
functions as in (6) ;
0 2. Guess an initial policy u (sl,...,sm;t) for all
sll...,sm1 t = 0,1, ..., T-1; 3. Determine the approximate optimal value functions
0 ft (sl ,.. . ,sm) by iterating the relation (4) for t =
0,1,. . . ,T-1, using the initial function (5) ; 0
4. Approximate each function ft(al1...,am) by piecewise
linear functions of al1...,am as in (7); 1
5. Determine the up-dated policy estimate u (sl, ..., sm;t) as that function which minimizes
Notice that for each fixed set of values for S~,...,S~,
rl1...,r t, this is a network flow problem since the @k m' are convex. This step is carried out for all t = 0,1, ..., T-1, and all S~,S~,.-.,S~. (Remark: for computational purposes,
it may be better to let the si vary only over the regions
(sl,O ,..., 01, (0,s2,0 ,..., 0) ,..., (0,O ,..., O,sm) and then 1 interpolate the values of u (sll...l~ ) for non-lattice points.
1 Having obtained the next policy u , return to step 3 and continue until convergence.
3.2 Alternative I1
In this approach (which follows Dantzig, 1975) we note that

the optimal release policy iu:(t), t = 0.1. ..., T-I, T = 1.2, ..., m) is equivalent to knowledge of the optimal levels {sl (t) I. Hence,
we reformulate the problem in terms of water levels only. That
is, the function ft (sl,. . . ,sm) satisfies
when the optimal policy is used at time t, or, equivalently,
when we have optimal water levels at time t+l (here the random
quantities ri are implicitly included in the term s.(t+l))
and the functions $k are determined from the $k. The problem,
of course, is that the optimal levels si(t+l) (for fixed ri)
are not known and must be determined. To accomplish this task,
the following algorithm is proposed:
0. Let t = t-1 and (t+l) , . . . , sm (t+l)
i=l
- - 1. Fix a value of the water levels, say sl (t) ,..., sm(t);
2. Fix a value of the random parameters ri(t);
3. Solve the network-flow problem of minimizing
over all ui (t) 5 ui(t) 2 "(t). where si (t+l) is given
by (1);
4. Change the random variables to new levels and repeat
steps 2 to 4, forming expected values according to the
probability distribution dG (r) ;


5. Change to a new set of water levels si (t) and repeat step 3 until all levels have been considered;
6. Approximate the function ft(s l,...,sm) by a piecewise
multilinear form (using DYGAM subpackage), let t+t - 1 ,
and return to step 1.
3.3 Remarks
a) At step 1 , in view of the separable form of the objective
function, it will again probably be best to use only
water levels of the form (sl,O, ..., O), (0,s 2,...,0), etc. This will save on computing time by cutting down the
number of cases, while still yielding sufficient
information to make the approximation in step 6 accurate
if the si grid is fine enough.
b) In the approximation of step 6, some experimentation
will probably be necessary to determine how many pieces
should be taken in the "piecewise" multilinear form.
The usual trade-off between fewer pieces and high-order
terms versus more pieces and lower order approximations
needs to be examined. Generally speaking, however, it
is preferable to take several low-order pieces.
References
[ I ] Casti, J. (1974), A Network Flow-Dynamic Programming Algorithm
for Complex Water Reservoir Problems, Internal paper,
International Institute for Applied Systems Analysis,
Laxenburg, Austria.
[ 2 ] Dantzig, G. (1975), Notes on Network Flow, Linear Programming,
a n d Stochastic Programming Models for a River Basin,
Private communication, International Institute for
Applied Systems Analysis, Laxenburg, Austria.
