world academy 31 july 2009 intentional intervention in the ... · intentional intervention in the...
TRANSCRIPT

Intentional interventionin the climate system
Climate science and perspectives on deployment
Ken CaldeiraCarnegie Institution Dept of Global Ecology
Stanford University Dept. of Environmental Earth System [email protected]
World Academy31 July 2009

GeoengineeringWhat does it mean?
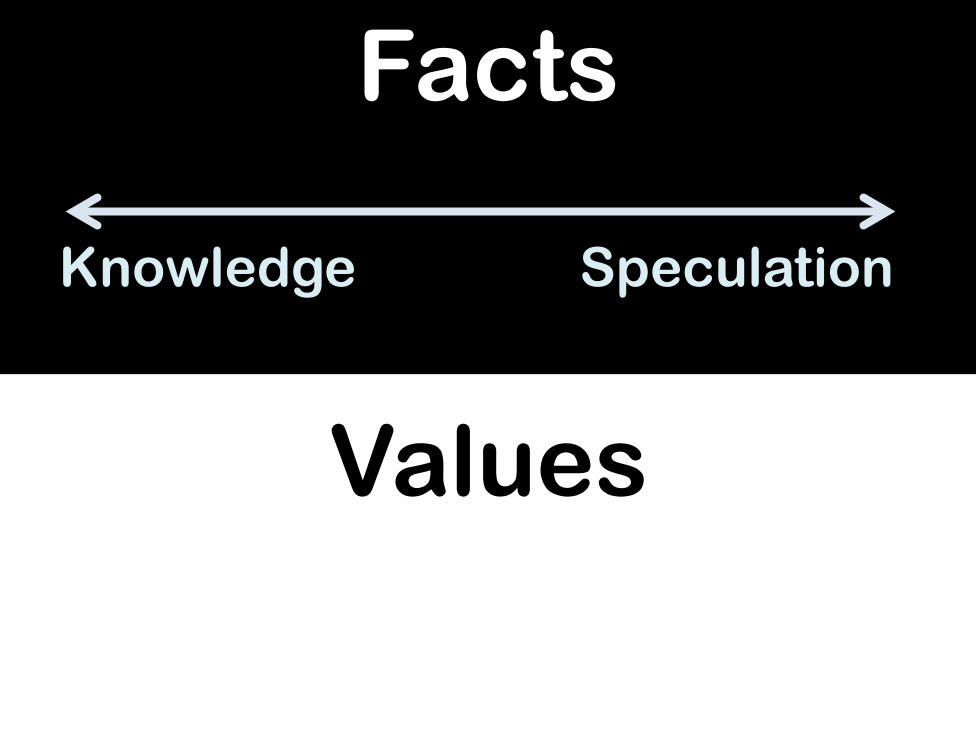
Facts
Values
Knowledge Speculation
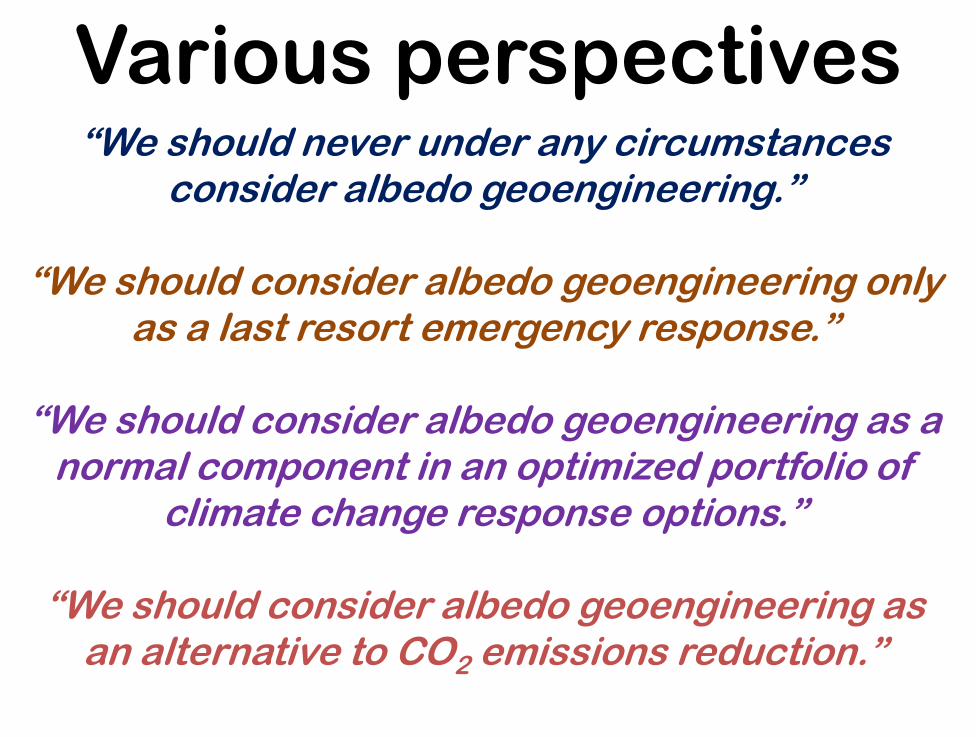
Various perspectives“We should never under any circumstances
consider albedo geoengineering.”
“We should consider albedo geoengineering only as a last resort emergency response.”
“We should consider albedo geoengineering as a normal component in an optimized portfolio of
climate change response options.”
“We should consider albedo geoengineering as an alternative to CO2 emissions reduction.”
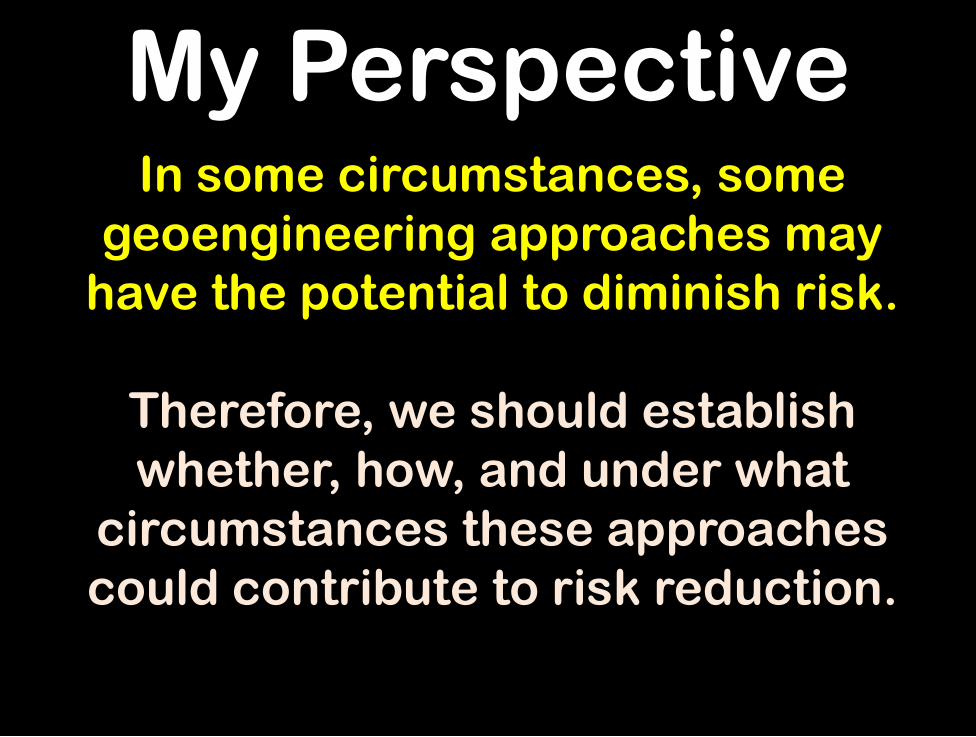
My PerspectiveIn some circumstances, some
geoengineering approaches mayhave the potential to diminish risk.
Therefore, we should establish whether, how, and under what
circumstances these approaches could contribute to risk reduction.
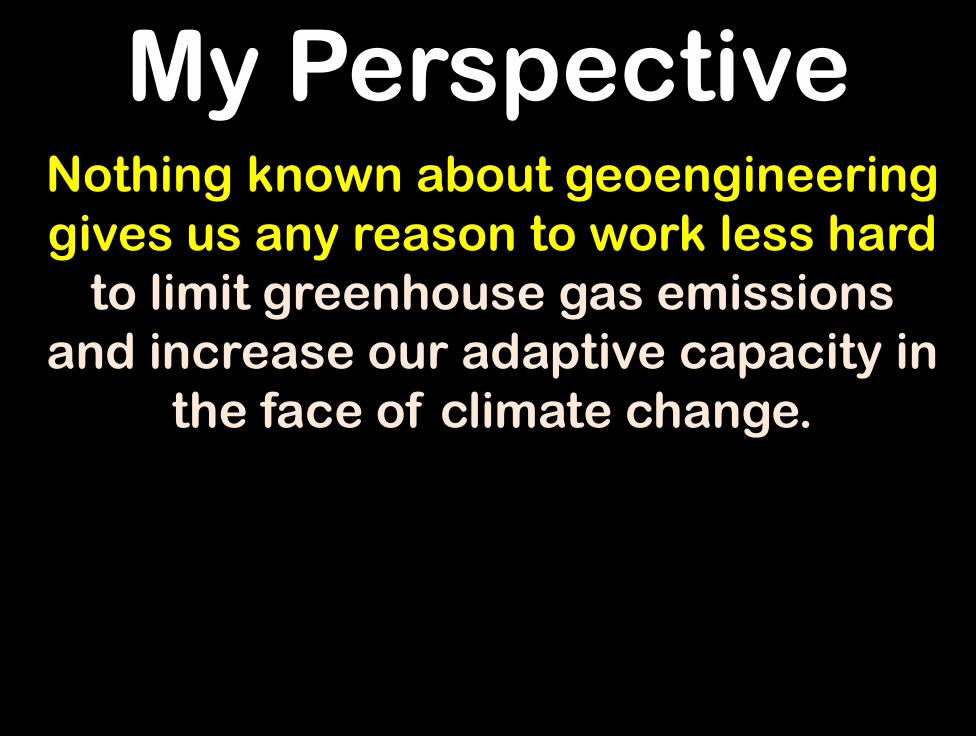
My PerspectiveNothing known about geoengineering gives us any reason to work less hard
to limit greenhouse gas emissions and increase our adaptive capacity in
the face of climate change.

CO2emissions
CO2 inatmosphere
Rain, winds,temperature,
etc
Humans andecosystems
Demand forenergy
Demand forgoods
and services
Desire forimprovedwell-being
Conservation
Ca
rbo
n n
eu
tral
en
erg
y
RemoveCO2 from
atmosphere
Directly intervenein climate system
AdaptationImproving well-being without damaginghumans and ecosystems
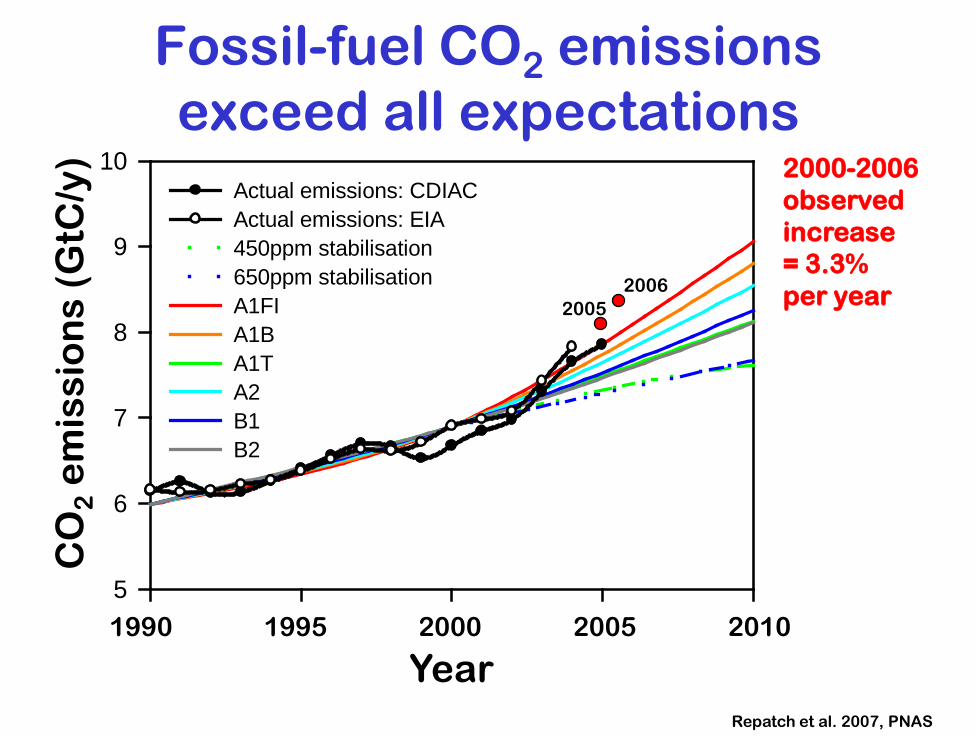
Repatch et al. 2007, PNAS
5
6
7
8
9
10Actual emissions: CDIACActual emissions: EIA450ppm stabilisation650ppm stabilisationA1FI A1B A1T A2 B1 B2
2000-2006 observed increase= 3.3% per year2006
2005
CO
2e
mis
sio
ns
(GtC
/y)
1990 20102000 20051995
Fossil-fuel CO2 emissionsexceed all expectations
Year
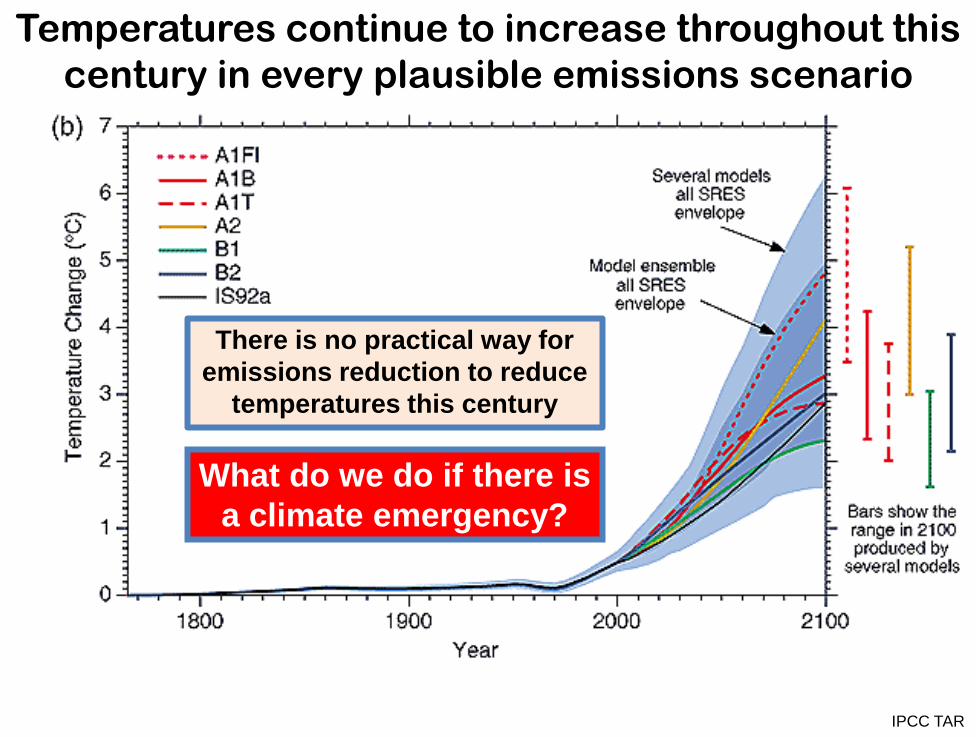
Temperatures continue to increase throughout thiscentury in every plausible emissions scenario
IPCC TAR
There is no practical way for emissions reduction to reduce
temperatures this century
What do we do if there is a climate emergency?

Preventing further warming requires near-zero emissions
Temperaturestabilizationscenarios
Requiredcumulativeemissions
Matthews and Caldeira 2008
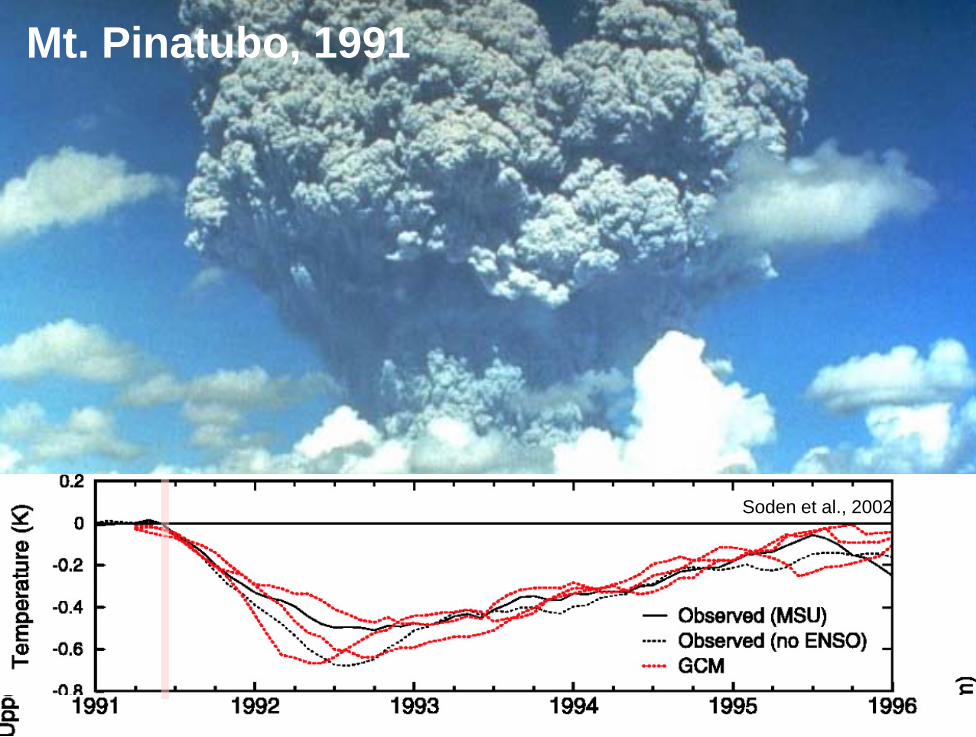
Volcanoes caused global cooling by putting small particles in the stratosphere
Mt. Pinatubo, 1991
Soden et al., 2002
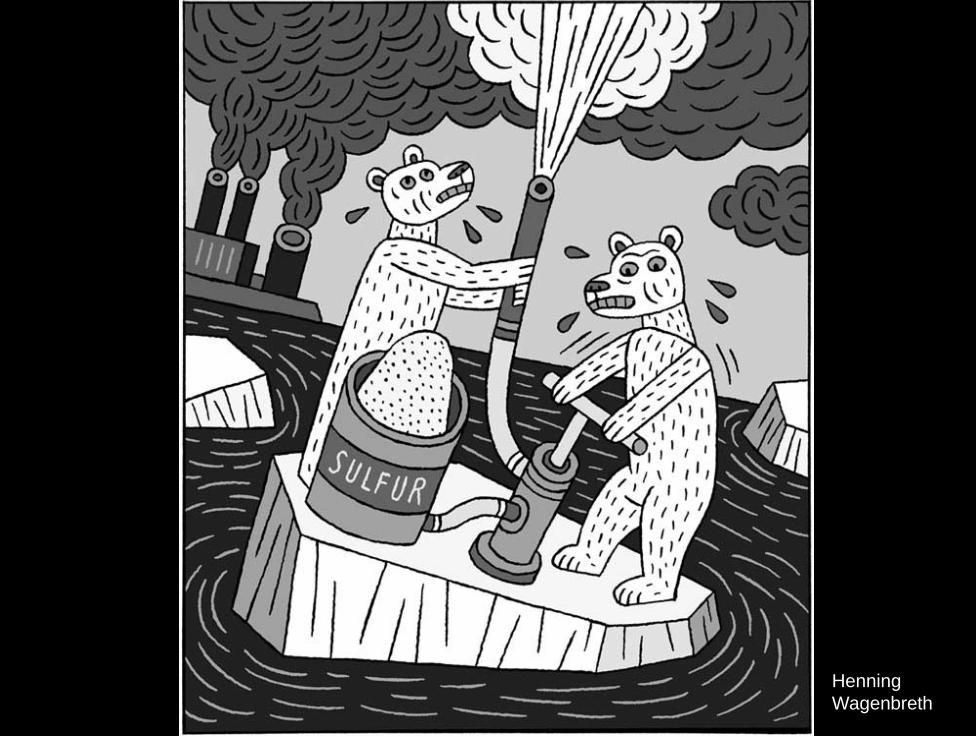
HenningWagenbreth

Direct intervention approaches could cool Earth within years
with deflection of sunlight
Matthews and Caldeira (2007)
www.environmentalsociety.ca
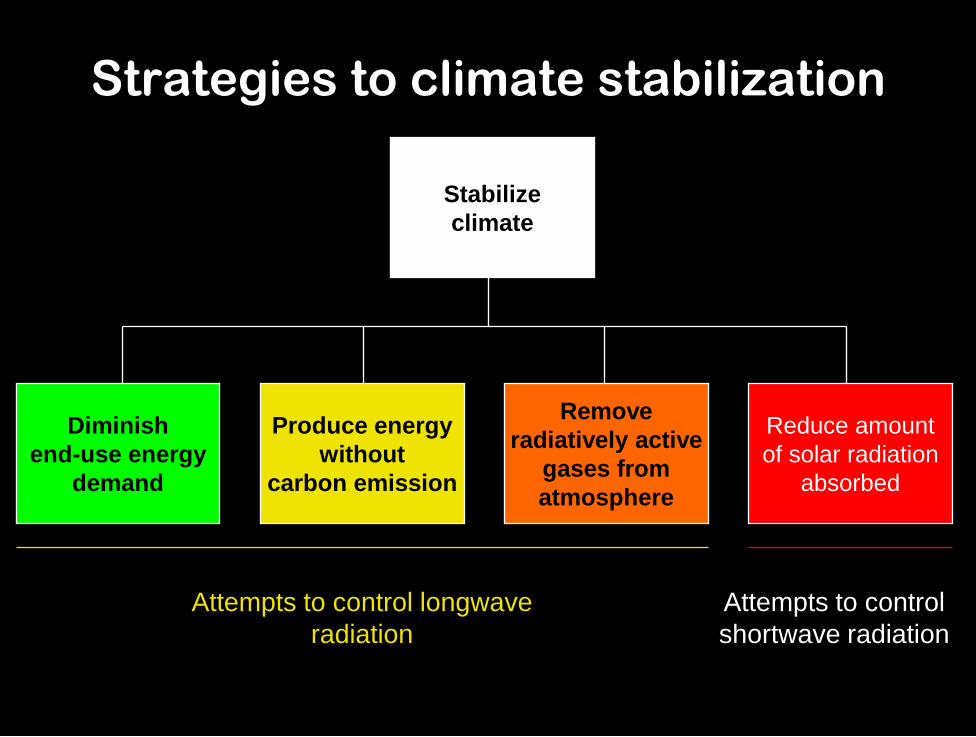
Strategies to climate stabilization
Stabilizeclimate
Removeradiatively active
gases fromatmosphere
Produce energywithout
carbon emission
Diminishend-use energy
demand
Reduce amountof solar radiation
absorbed
Attempts to control longwave radiation
Attempts to control shortwave radiation

A taxonomy of climate intervention options
Climate intervention
Increase longwave radiation to space
Increase heat storage
Decrease absorption of shortwave radiation
Diminish atmospheric greenhouse gases
Diminish cirrus clouds
Increase vertical ocean mixing
Space-based
Stratosphere
Troposphere
Surface
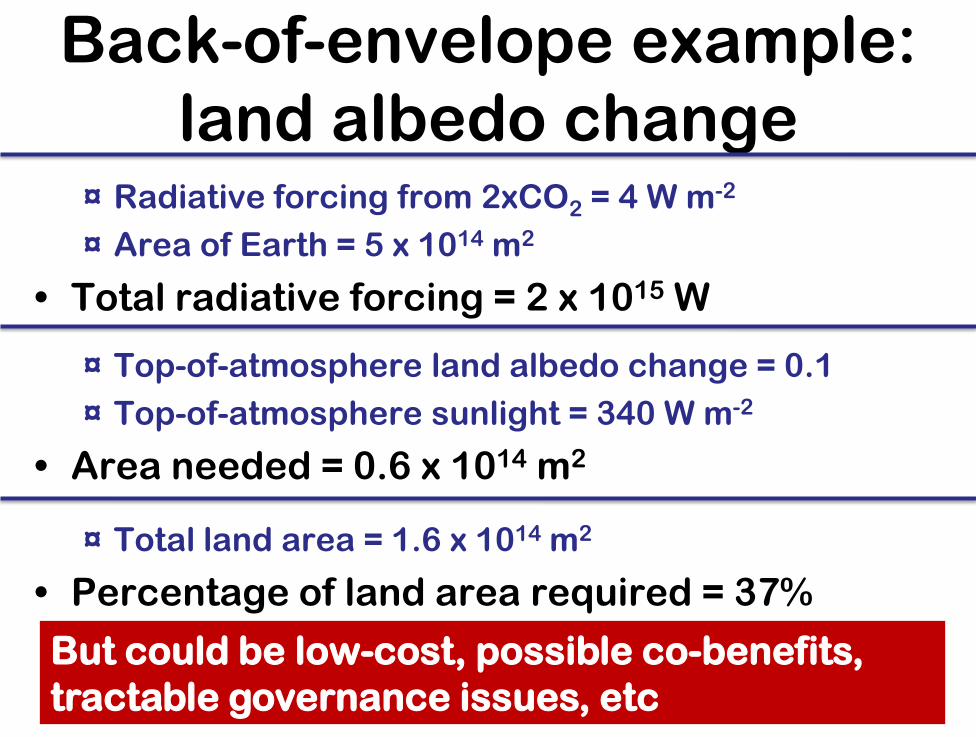
Back-of-envelope example: land albedo change
¤ Radiative forcing from 2xCO2 = 4 W m-2
¤ Area of Earth = 5 x 10¹⁴ m2
• Total radiative forcing = 2 x 10¹⁵ W
¤ Top-of-atmosphere land albedo change = 0.1¤ Top-of-atmosphere sunlight = 340 W m-2
• Area needed = 0.6 x 10¹⁴ m2
¤ Total land area = 1.6 x 10¹⁴ m2
• Percentage of land area required = 37%
But could be low-cost, possible co-benefits, tractable governance issues, etc
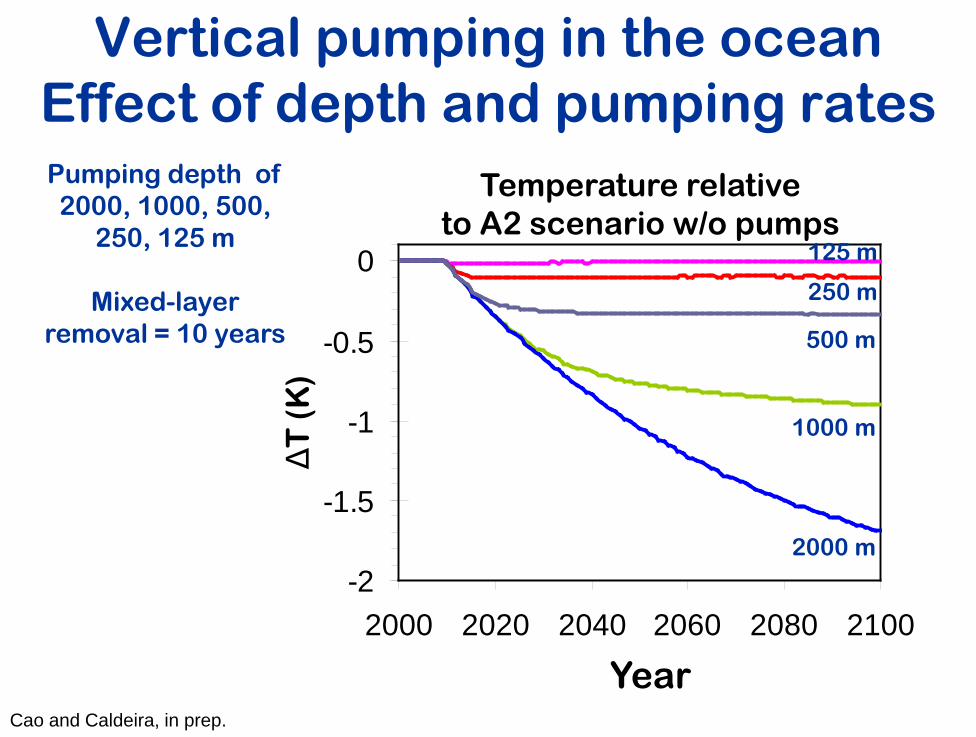
Vertical pumping in the oceanEffect of depth and pumping ratesPumping depth of 2000, 1000, 500,
250, 125 m
Mixed-layer removal = 10 years
-2
-1.5
-1
-0.5
0
2000 2020 2040 2060 2080 2100
4i
Temperature relativeto A2 scenario w/o pumps
ΔT
(K
)
Year
2000 m
1000 m
500 m
250 m
125 m
Cao and Caldeira, in prep.
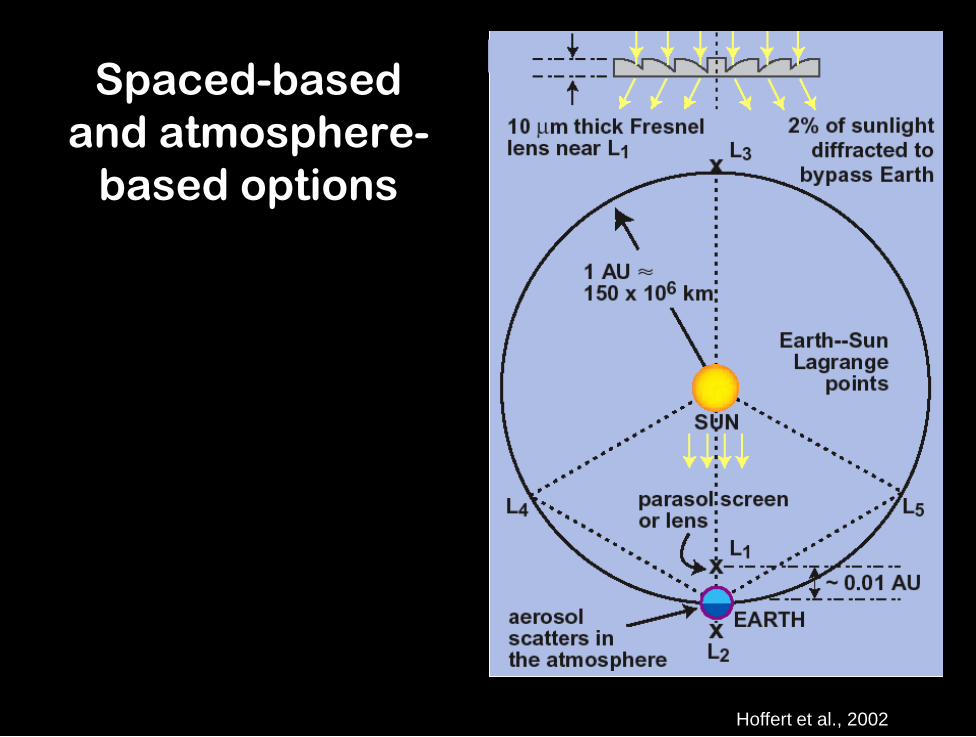
Spaced-basedand atmosphere-
based options
Hoffert et al., 2002
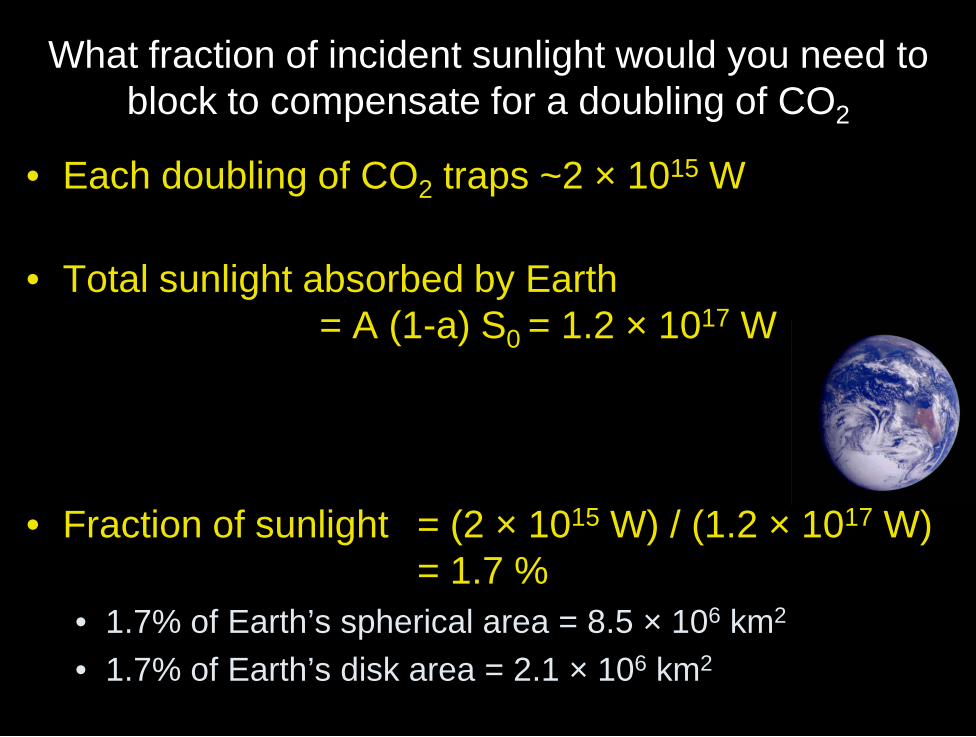
What fraction of incident sunlight would you need to block to compensate for a doubling of CO2
• Each doubling of CO2 traps ~2 × 10¹⁵ W
• Total sunlight absorbed by Earth = A (1-a) S0 = 1.2 × 10¹⁷ W
• Fraction of sunlight = (2 × 10¹⁵ W) / (1.2 × 10¹⁷ W)= 1.7 %
• 1.7% of Earth’s spherical area = 8.5 × 10⁶ km2
• 1.7% of Earth’s disk area = 2.1 × 10⁶ km2
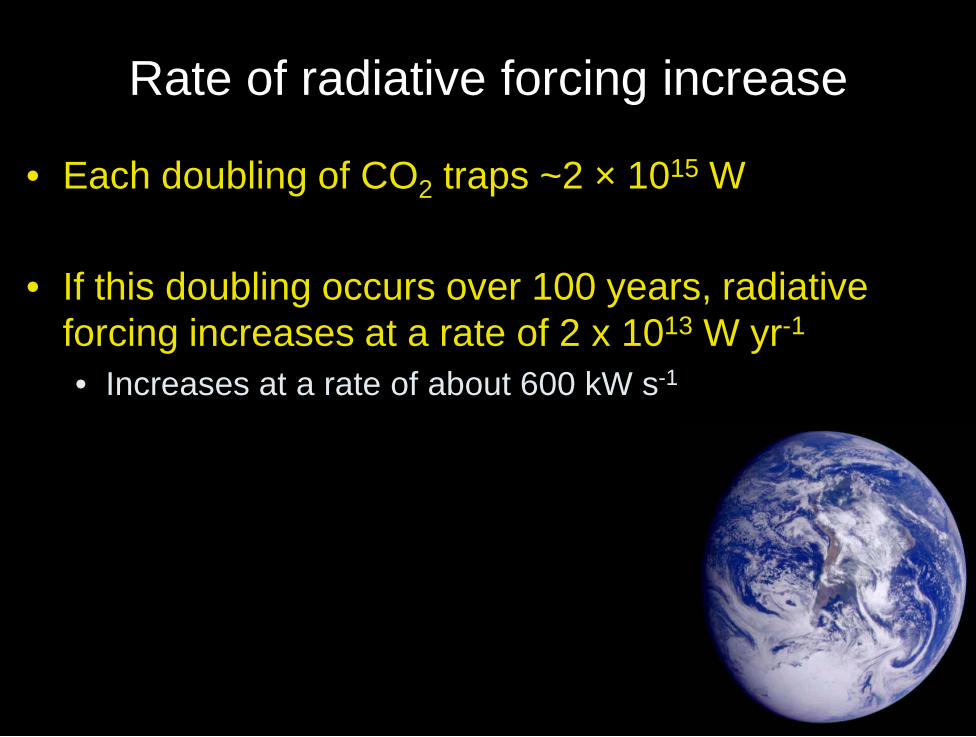
Rate of radiative forcing increase
• Each doubling of CO2 traps ~2 × 10¹⁵ W
• If this doubling occurs over 100 years, radiative forcing increases at a rate of 2 x 10¹³ W yr-1
• Increases at a rate of about 600 kW s-1

How fast would we need to build a space-based system to compensate for rate of increase of
greenhouse gases?
• Average solar radiation absorption per unit disk areanormal to direction of sun = (1 – a) S0 = 940 W m-2
• Need to increase at rate of 2 x 10¹³ W yr-1 normal to direction of sun
= 2,000 km2 yr-1
= 2.4 km2 hr-1
= 670 m2 s-1
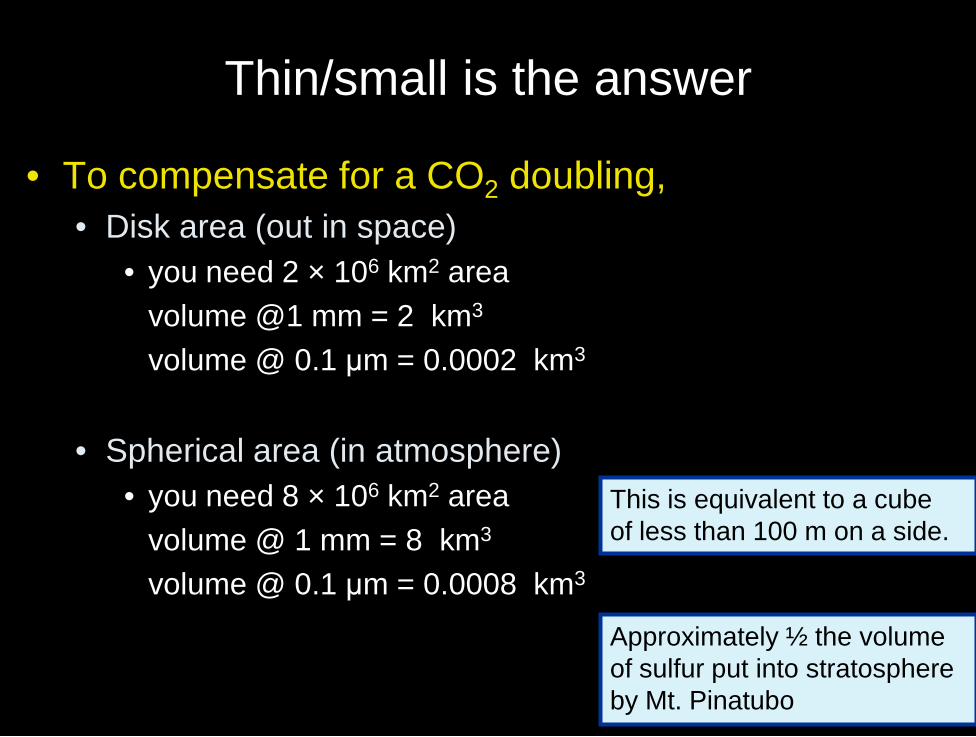
Thin/small is the answer
• To compensate for a CO2 doubling, • Disk area (out in space)
• you need 2 × 10⁶ km2 areavolume @1 mm = 2 km3
volume @ 0.1 μm = 0.0002 km3
• Spherical area (in atmosphere)• you need 8 × 10⁶ km2 area
volume @ 1 mm = 8 km3
volume @ 0.1 μm = 0.0008 km3
This is equivalent to a cube of less than 100 m on a side.
Approximately ½ the volume of sulfur put into stratosphere by Mt. Pinatubo

Back-of-envelope example: stratospheric aerosols
¤ Top-of-atmosphere sunlight = 340 W m-2
• Area needed to block 2 x 10¹⁵ W = 6 x 10¹² m2
¤ Particle size = 10-7 m
• Volume needed = 6 x 10⁵ m3
¤ Residence time in stratosphere = 3 x 10⁷ s
• Injection rate = 0.02 m3 s-1
But presents major governance issues, more easily turned off rapidly, etc
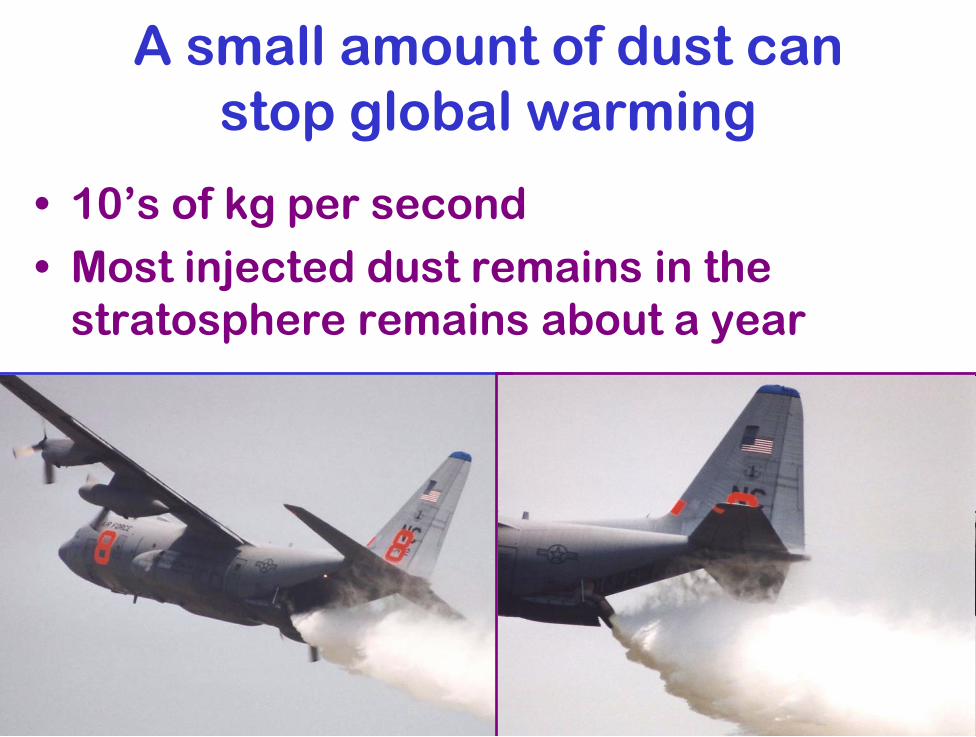
A small amount of dust canstop global warming
• 10’s of kg per second• Most injected dust remains in the
stratosphere remains about a year

Engineering options for placing aerosols in stratosphere
• “Smokestack to the stratosphere”• Skinny pipe/hose, ground to ~25 km-high HAA (DoD)
• Artillery (shooting barrels of particles into stratosphere)• “…surprisingly practical” – NAS Study, 1992
• High-altitude transport aircraft• “Condor/Global Hawk, with a cargo bay”• Half-dozen B-747s deploy 106 tonnes/year of engineered aerosol; towed
lifting-lines/bodies for height-boosting the sprayer-dispenser an additional 5-10 km above normal cruising ceilings
• Other options• Anthropogenic (mini-)volcanoes• Tethered (set-of-)lifting-body – a high-tech kites
Courtesy Lowell Wood

There are a range of strategiesStratospheric dust
From volcanoes, we know it basically works
From volcanoes, we know it doesn’t cause an immediate global disaster
Could be deployed cheaply without any leaps in technology
Scalable to high amounts of cooling
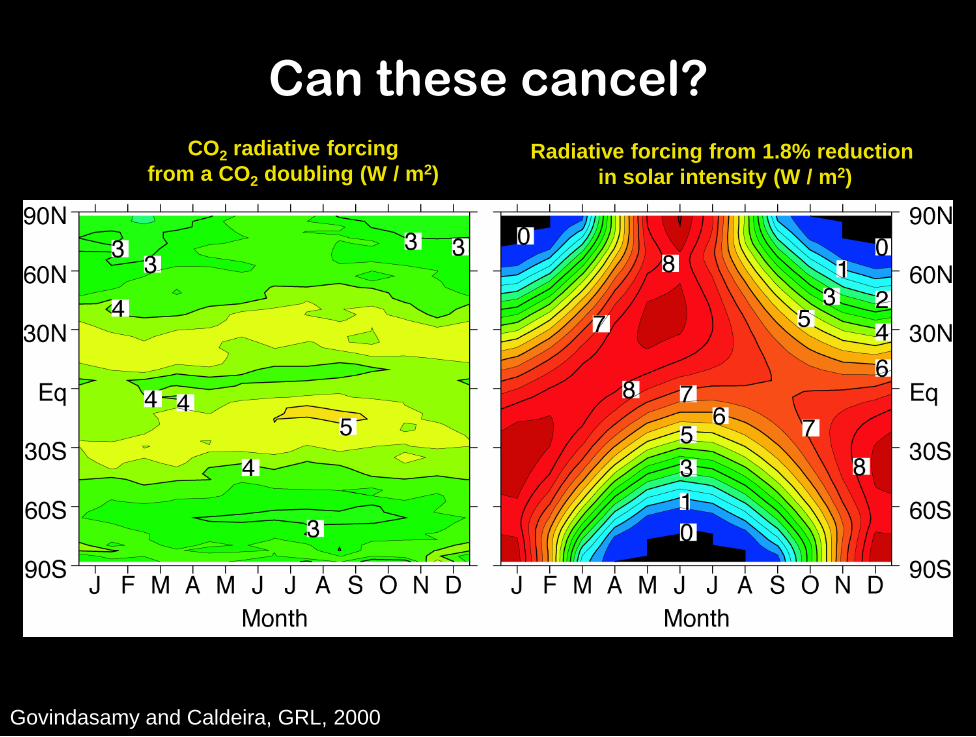
Can these cancel?CO2 radiative forcing
from a CO2 doubling (W / m2)Radiative forcing from 1.8% reduction
in solar intensity (W / m2)CO2 radiative forcing
from a CO2 doubling (W / m2)Radiative forcing from 1.8% reduction
in solar intensity (W / m2)
Govindasamy and Caldeira, GRL, 2000

Model results for temperatureΔTemperature Statistical significance
2xC
O2
2xC
O2
min
us
1.8
4%
su
n
Caldeira and Wood, 2008
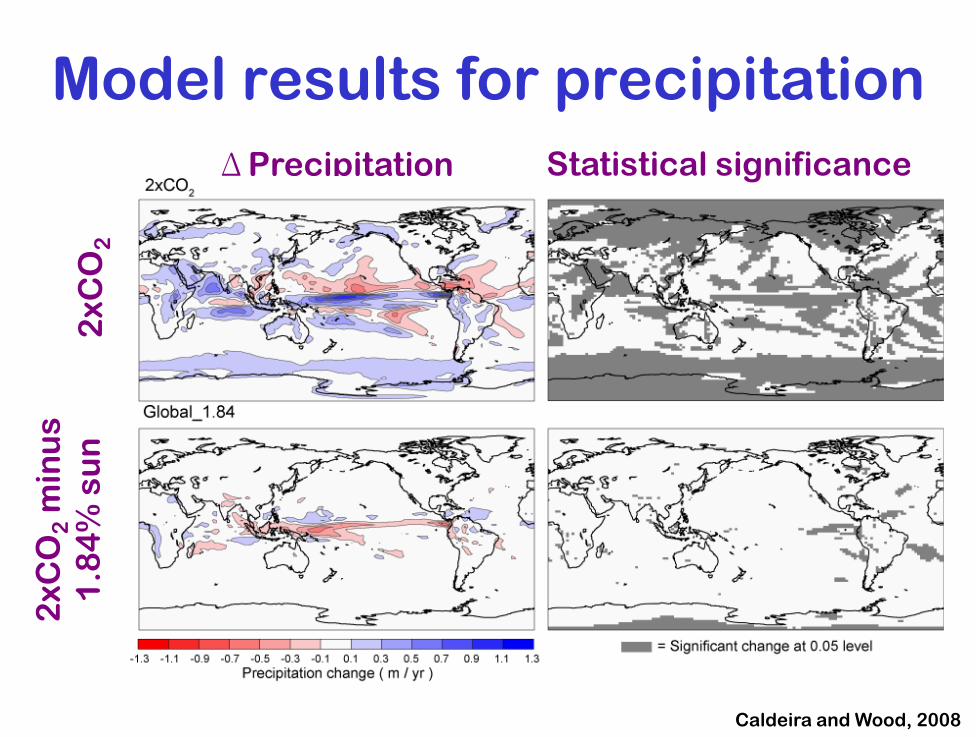
Model results for precipitationΔPrecipitation
2xC
O2
2xC
O2
min
us
1.8
4%
su
n
Caldeira and Wood, 2008
Statistical significance

Caldeira and Wood, 2008
Deflecting 1.8% of sunlight reduces but does not eliminate simulated temperature and precipitation change caused by a doubling of atmospheric CO2content
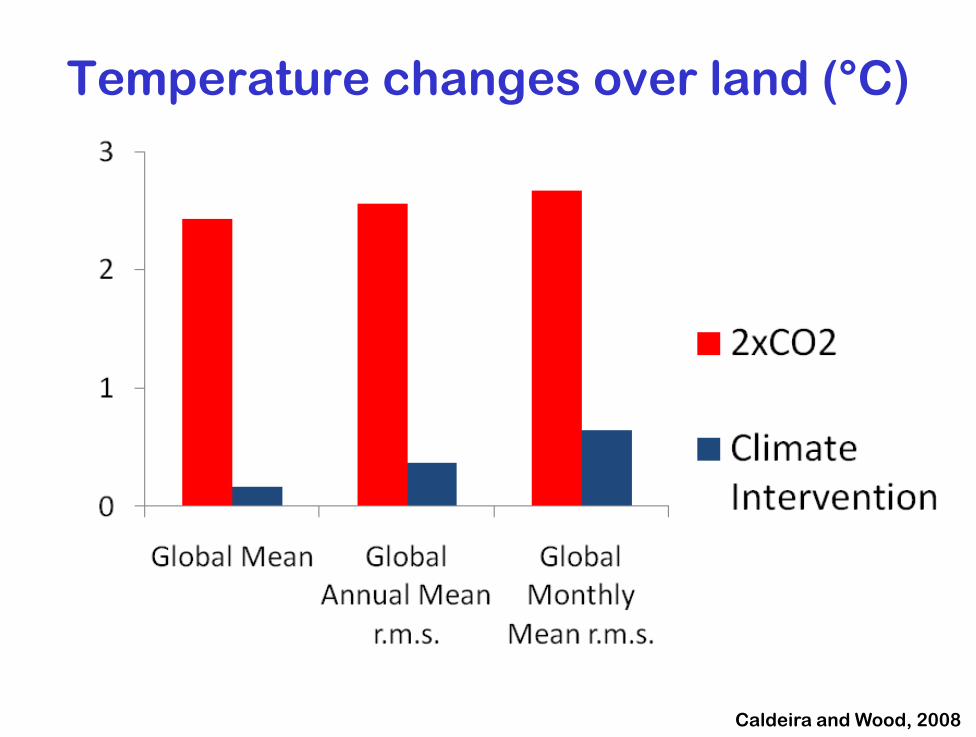
Temperature changes over land (°C)
Caldeira and Wood, 2008

Precipitation changes over land (m/yr)
Caldeira and Wood, 2008
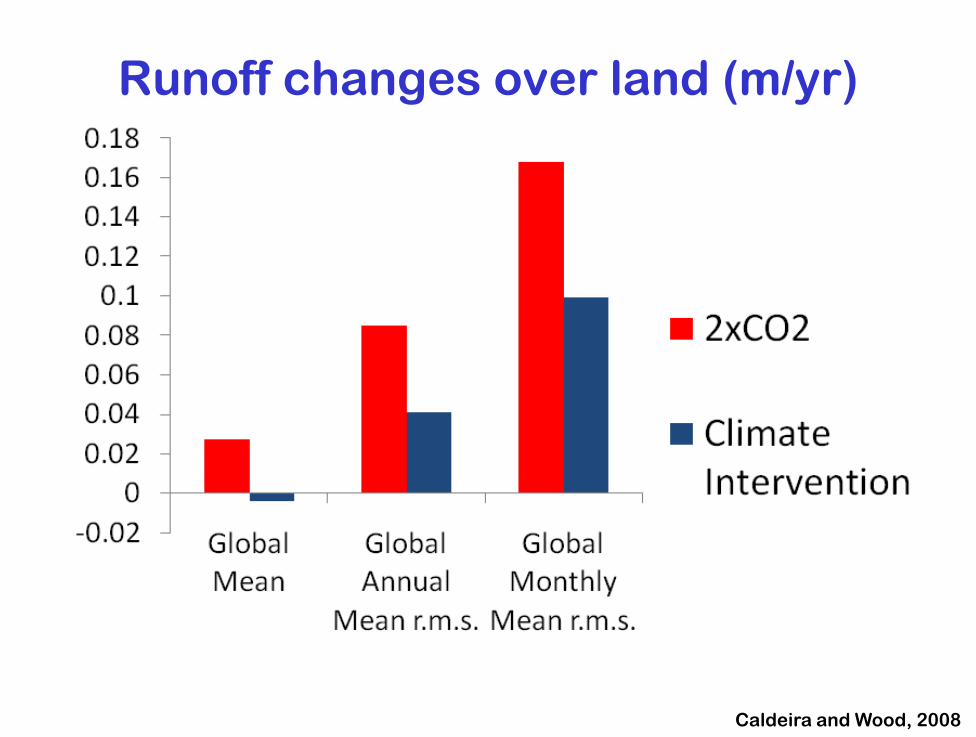
Runoff changes over land (m/yr)
Caldeira and Wood, 2008

What could be achieved with an optimized system?
But won’t the reduction in solar radiation hurt the biosphere?
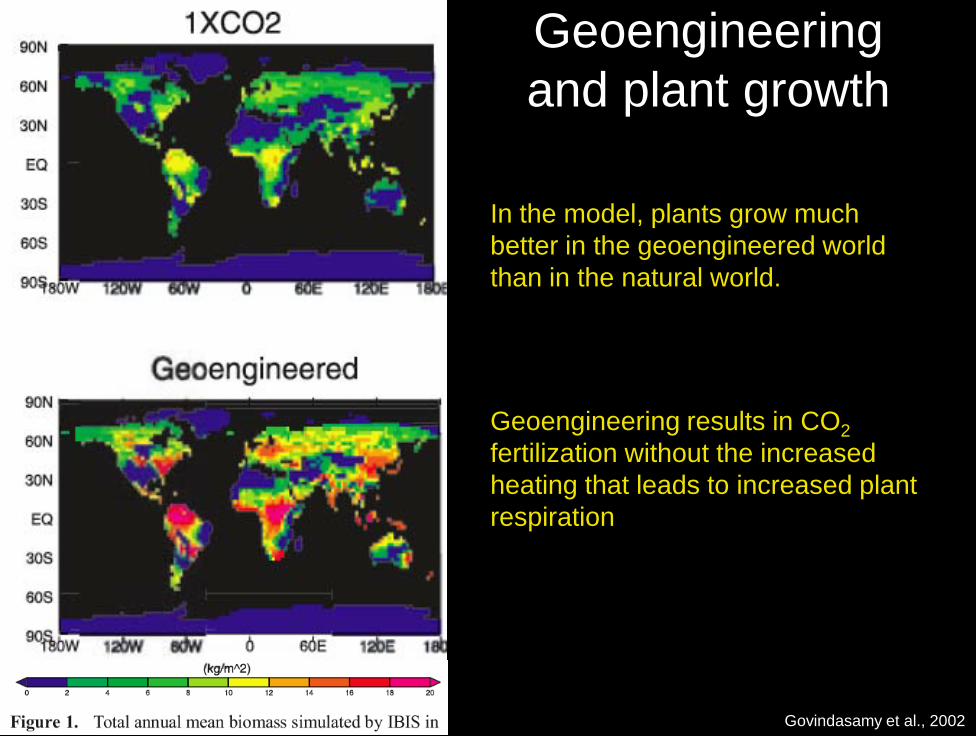
Geoengineeringand plant growth
In the model, plants grow much better in the geoengineered world than in the natural world.
Geoengineering results in CO2fertilization without the increased heating that leads to increased plant respiration
Govindasamy et al., 2002
How fast would we feel the climate effects?
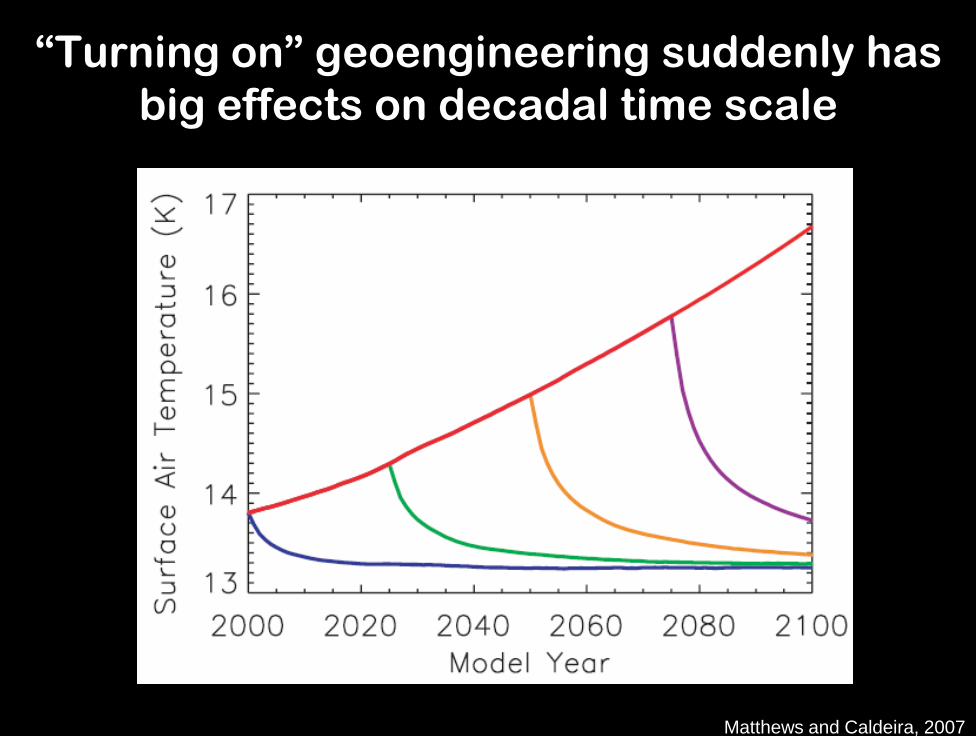
“Turning on” geoengineering suddenly has big effects on decadal time scale
Matthews and Caldeira, 2007
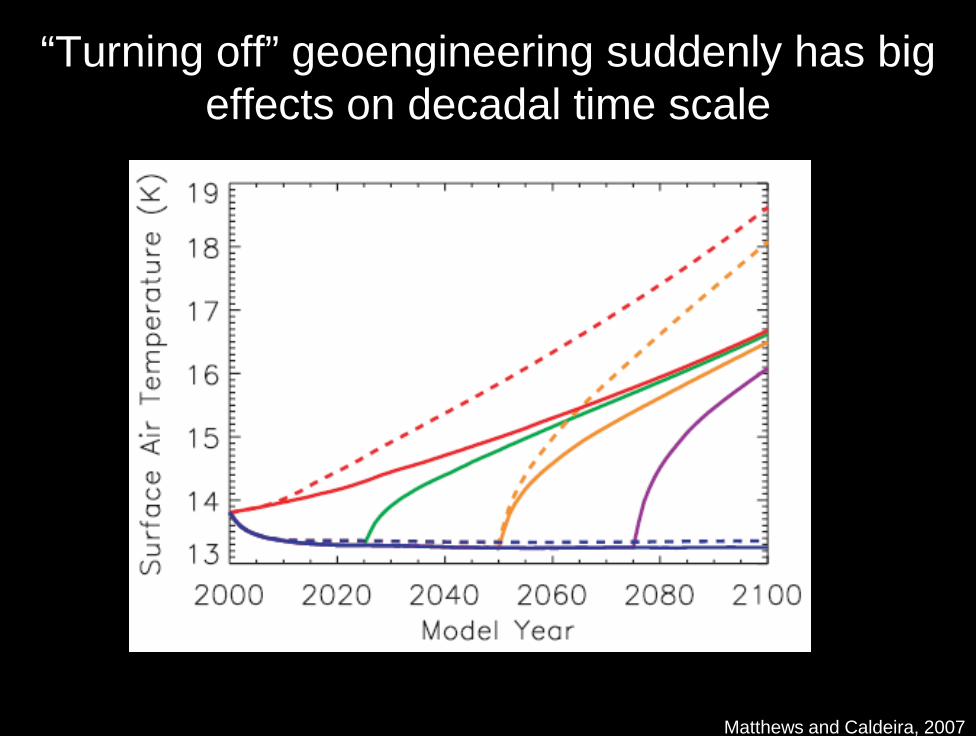
“Turning off” geoengineering suddenly has big effects on decadal time scale
Matthews and Caldeira, 2007
Would regional-scale climate interventionbe possible?

Both geoengineering cases remove ~0.37% of total solar insolation

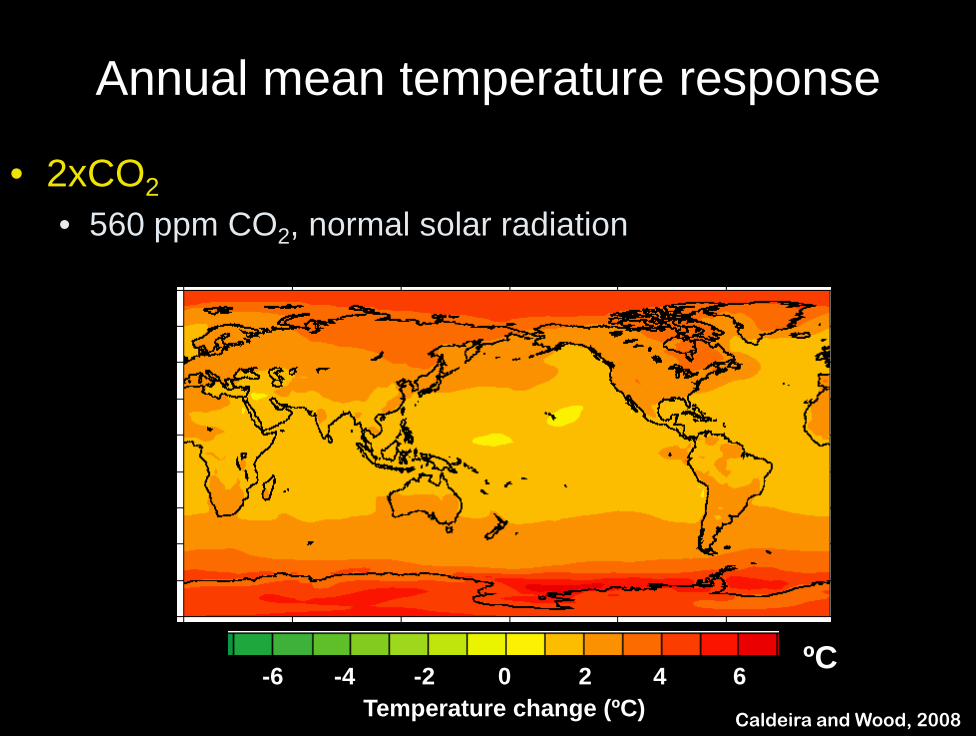
Annual mean temperature response
• 2xCO2• 560 ppm CO2, normal solar radiation
Temperature change (ºC)0 2 4 6-6 -4 -2 ºC
Caldeira and Wood, 2008

Annual mean temperature response
• Geo71.25• 560 ppm CO2, 25% solar reduction north of 71ºN
Temperature change (ºC)0 2 4 6-6 -4 -2 ºC
Caldeira and Wood, 2008
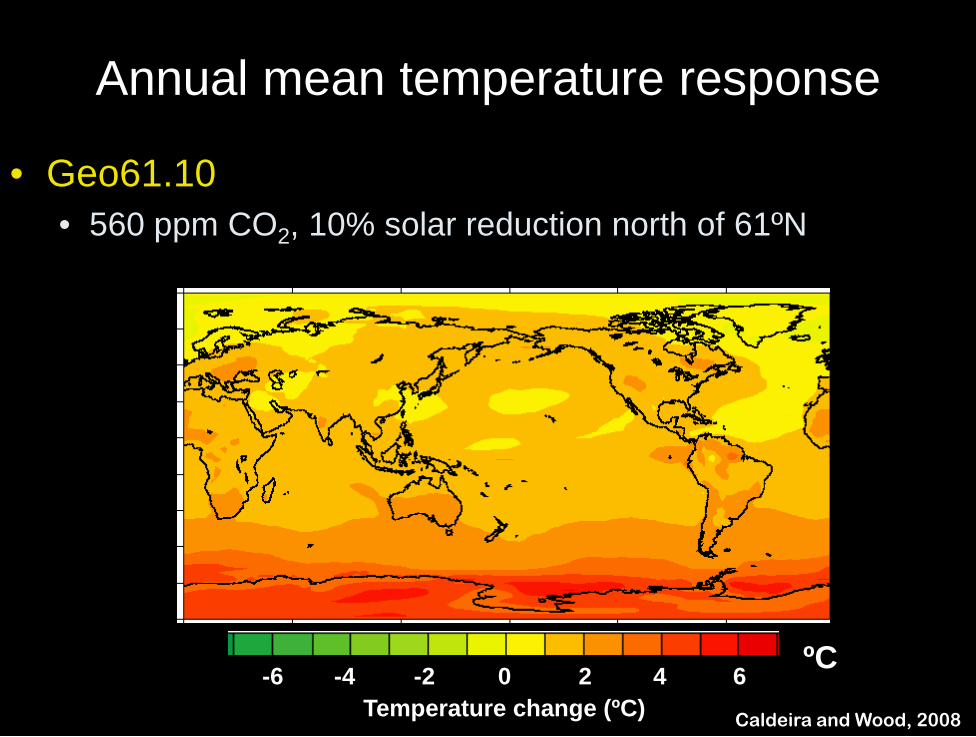
Annual mean temperature response
• Geo61.10• 560 ppm CO2, 10% solar reduction north of 61ºN
Temperature change (ºC)0 2 4 6-6 -4 -2 ºC
Caldeira and Wood, 2008
Annual mean temperature response
• 2xCO2• 560 ppm CO2, normal solar radiation
Temperature change (ºC)0 2 4 6-6 -4 -2 ºC
Caldeira and Wood, 2008

Observed September sea-ice
NASA

Modeled September sea-ice
Pre-industrial (280 ppm) 2 x CO2 (560 ppm)
Caldeira and Wood, 2008
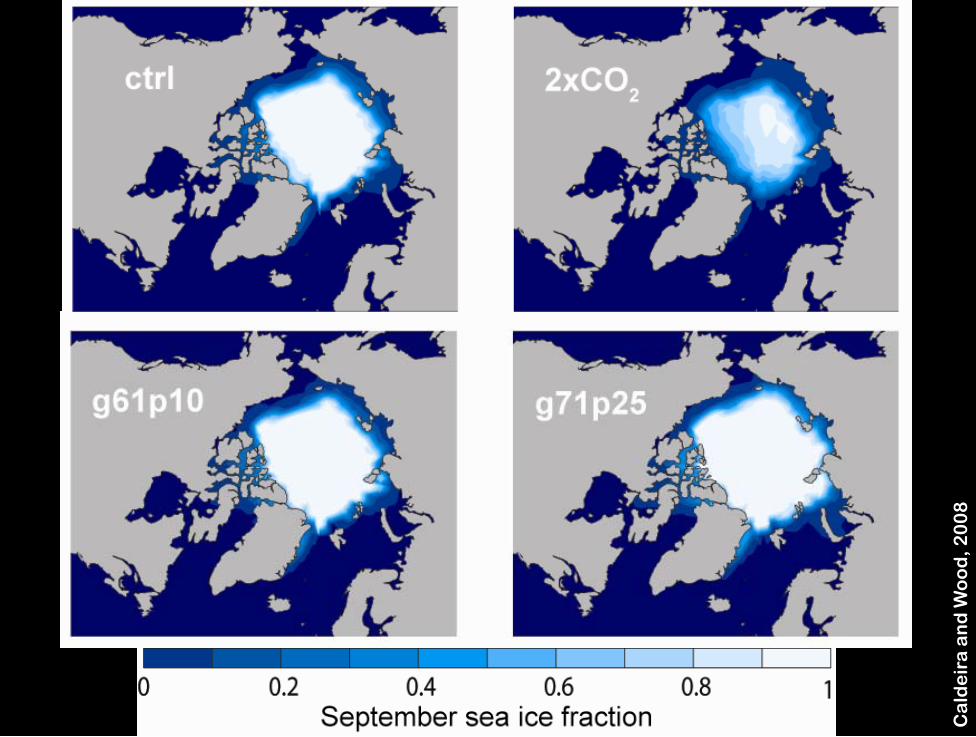
Modeled September sea-ice
Ca
lde
ira
an
d W
oo
d, 2
00
8
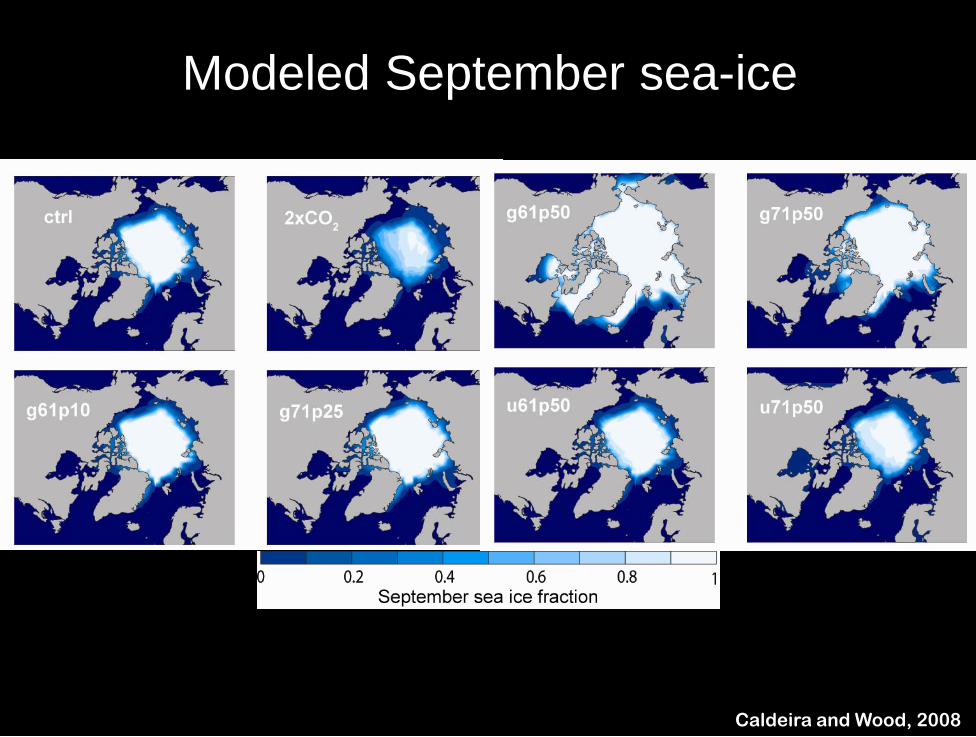
Modeled September sea-ice
Caldeira and Wood, 2008

Arctic geoengineering reverses temperature effects but not increased precipitation
Caldeira and Wood, 2008
Ozone
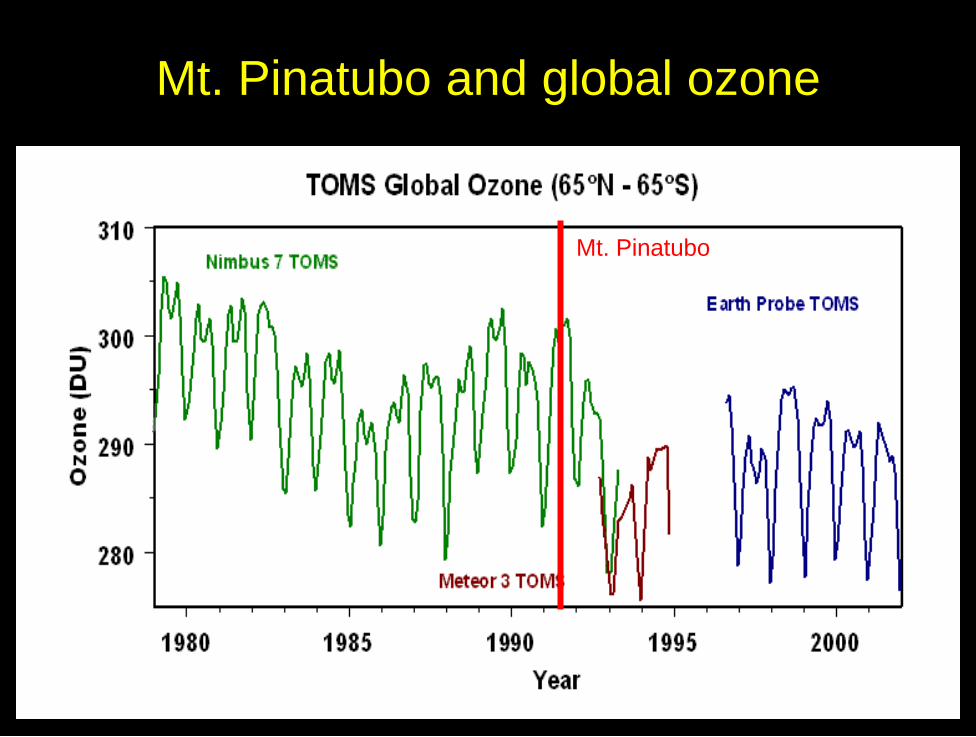
Mt. Pinatubo and global ozone
Mt. Pinatubo
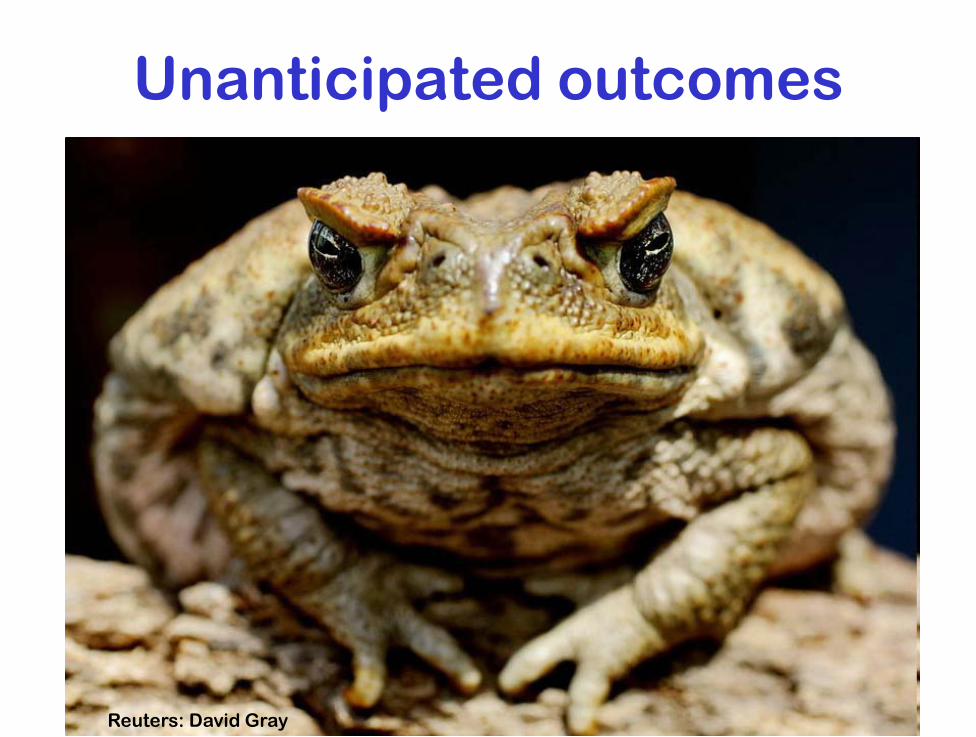
Unanticipated outcomes
Reuters: David Gray
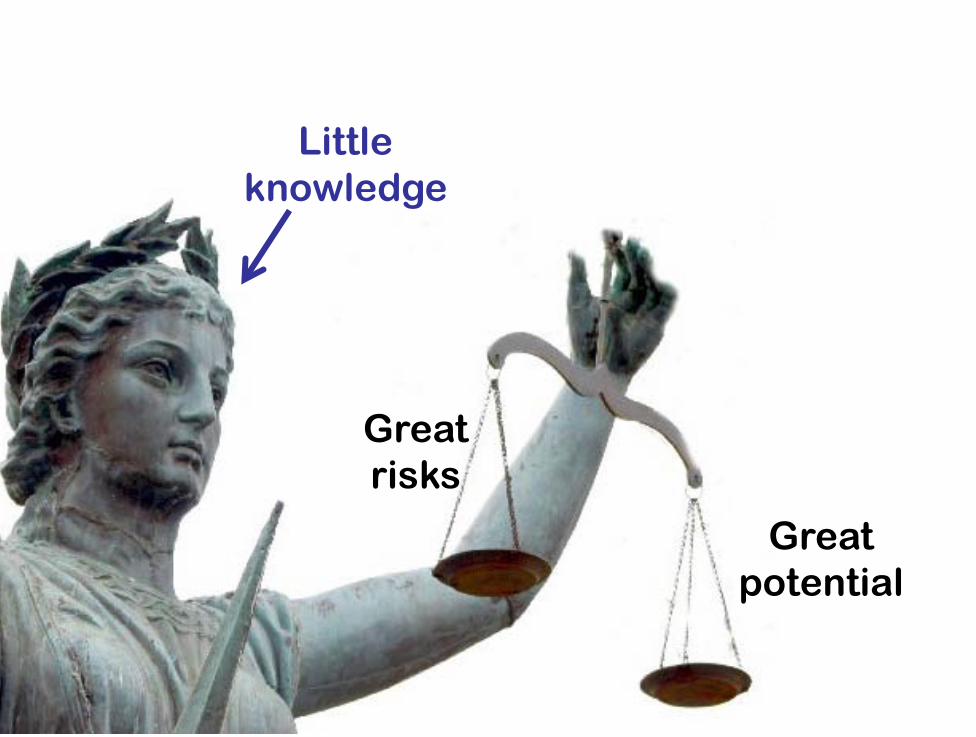
Greatrisks
Greatpotential
Littleknowledge
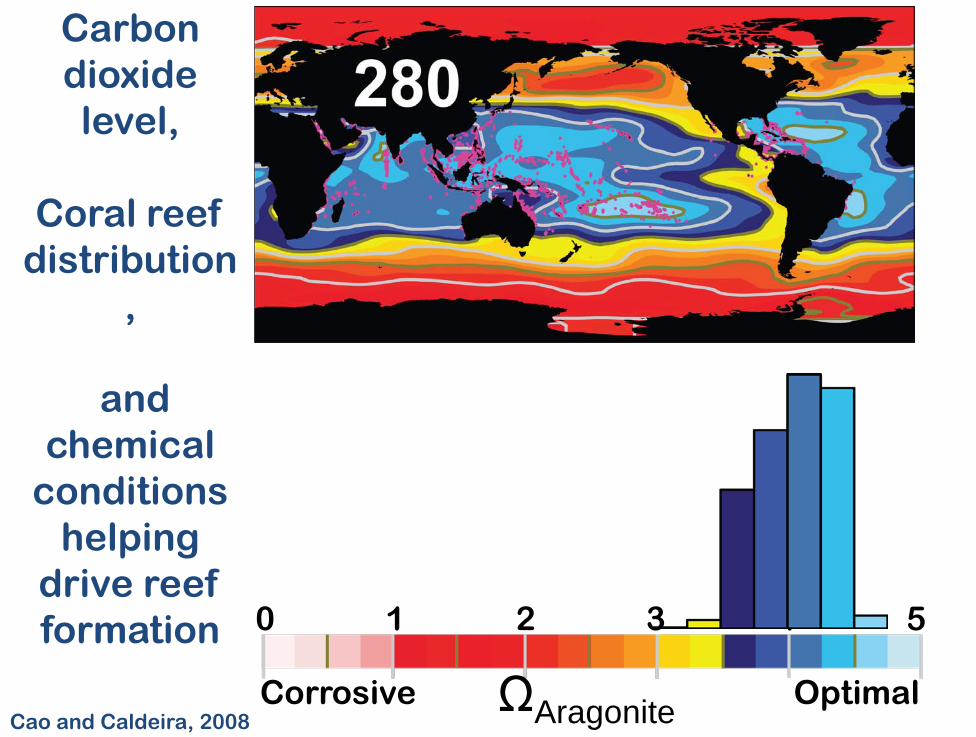
0 1 2 3 4 5
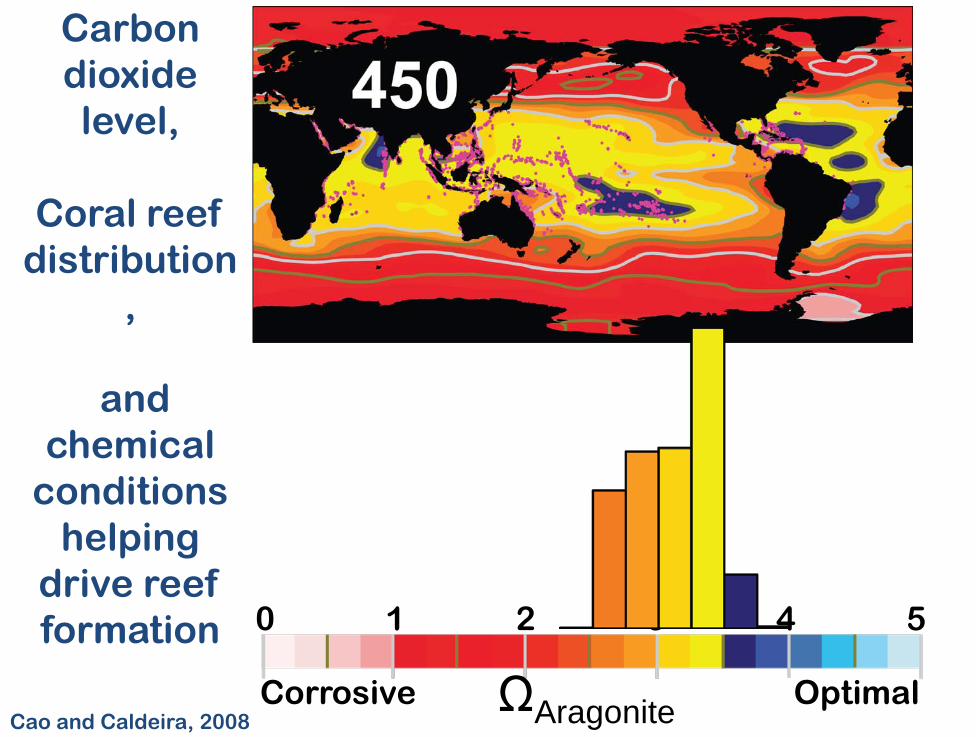
Corrosive OptimalΩAragonite
Carbon dioxide level,
Coral reef distribution
,
and chemical
conditions helping
drive reef formation
Cao and Caldeira, 2008

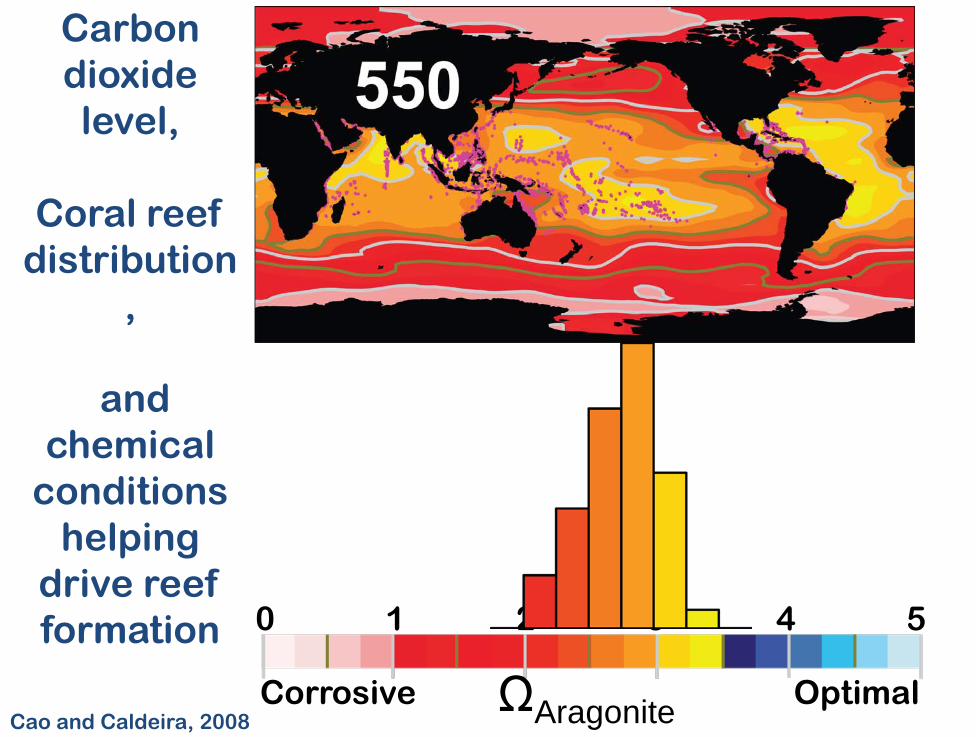
0 1 2 3 4 5
Corrosive OptimalΩAragoniteCao and Caldeira, 2008
Carbon dioxide level,
Coral reef distribution
,
and chemical
conditions helping
drive reef formation
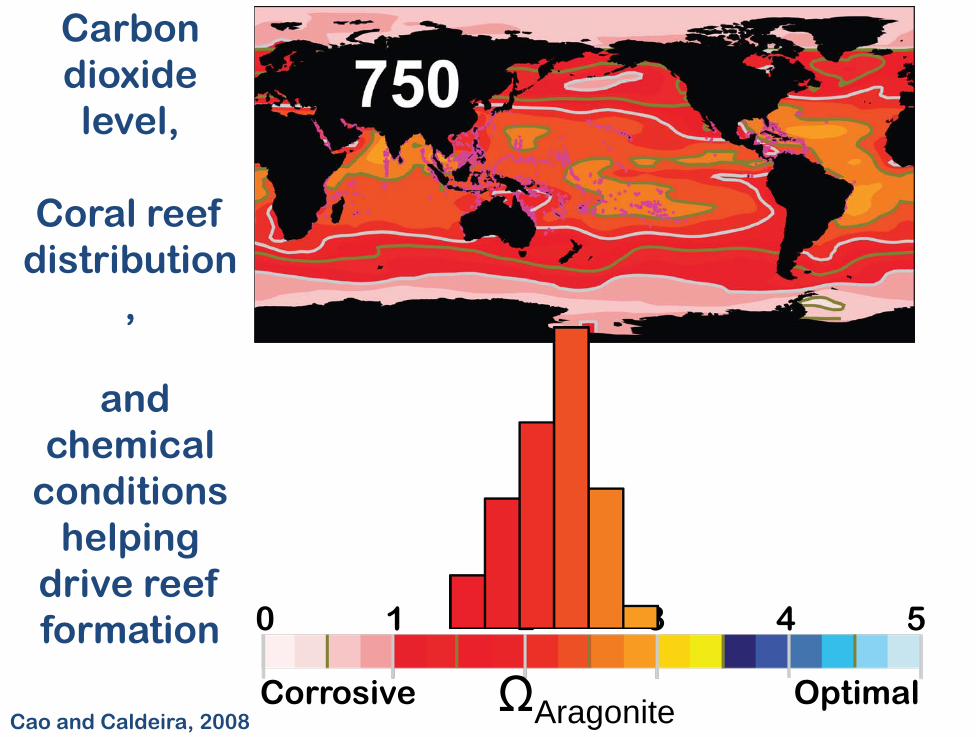
0 1 2 3 4 5
Corrosive OptimalΩAragoniteCao and Caldeira, 2008
Carbon dioxide level,
Coral reef distribution
,
and chemical
conditions helping
drive reef formation
0 1 2 3 4 5
Corrosive OptimalΩAragoniteCao and Caldeira, 2008
Carbon dioxide level,
Coral reef distribution
,
and chemical
conditions helping
drive reef formation

0 1 2 3 4 5
Corrosive OptimalΩAragoniteCao and Caldeira, 2008
Carbon dioxide level,
Coral reef distribution
,
and chemical
conditions helping
drive reef formation
0 1 2 3 4 5
Corrosive OptimalΩAragoniteCao and Caldeira, 2008
Carbon dioxide level,
Coral reef distribution
,
and chemical
conditions helping
drive reef formation

Questions
• What are the range of possible feasible means of intervening in the climate system?– What are the advantages and
disadvantages of each method?
Questions
• How can science and technology be advanced to rapidly and cost-effectively provide useful assessments for people who will need to make decisions about intentional climate intervention?

Questions
• How could one predict the effects of large-scale geoengineering attempts, and what new science is required to improve these predictions?– To what extent can small-scale
geoengineering pilot studies provide useful information about the impacts of large-scale geoengineering efforts?
Questions
• How long would it take to fully understand the extent to which a geoengineering attempt does in fact affect the climate?– What can be done to counteract adverse
effects of climate interventions?
Issues
• Governance and regulation– National level– International level
• Research and development– Lab tests and computer modeling– Field tests
two online discussion groups• http://groups.google.com/group/geoengineering
– Broad ranging discussion involving interested public
• http://groups.google.com/group/climateintervention
– More focused discussion, oriented towards academics
Conclusions• Investigation of the climate effects of various climate
intervention approaches is in its infancy
• Preliminary results indicate that a high-CO2 world with climate intervention would be more similar to the pre-industrial world than would be a high-CO2 world without geoengineering
• The Earth System is notoriously complex, and one can assume that tinkering with it on a global scale will produce unanticipated outcomes