world agricultural supply united states department...
TRANSCRIPT

United StatesDepartment ofAgriculture
Office of theChief Economist
World AgriculturalSupplyAnd Demand EstimatesAgricultural Marketing ServiceEconomic Research ServiceFarm Service AgencyForeign Agricultural Service
WASDE-351 Approved by the World Agricultural Outlook Board June 11, 1999
NOTE: Because planting of spring crops is still underway in the Northern Hemisphere andremains several months away in the Southern Hemisphere, these projections are highlytentative. Substantial variation may result from weather developments, economic factors,and policy changes. National Agricultural Statistics Service (NASS) forecasts are used forU.S. winter wheat. For other U.S. crops, the March 31 NASS Prospective Plantings report isused for planted acreage, and methods used to project harvested acreage and yield arenoted on each table.
WHEAT: Projected U.S. 1999/2000 ending stocks are down slightly from last month due toa reduction of 3 million bushels in forecast winter wheat production. The projected pricerange is unchanged at $2.60 to $3.10 per bushel.
Projected global 1999/2000 wheat production is down slightly from last month, as smallerprospective crops in Canada, Turkey, Ukraine, and Russia more than offset larger crops inthe EU and Pakistan. Prolonged wet conditions have cut planting prospects in Canada,while unusually cold weather in May reduced prospective production in Ukraine and Russia. The EU crop is up from last month because of favorable growing conditions in France andlarger area in Germany. Preliminary harvest results indicate Pakistan's yields are higherthan expected earlier. Global 1999/2000 imports are little changed from last month, ashigher Brazilian imports are offsetting lower imports by Pakistan. Export prospects are downfor Canada and Turkey because of reduced production, but larger prospective exports forArgentina and Ukraine are offsetting.
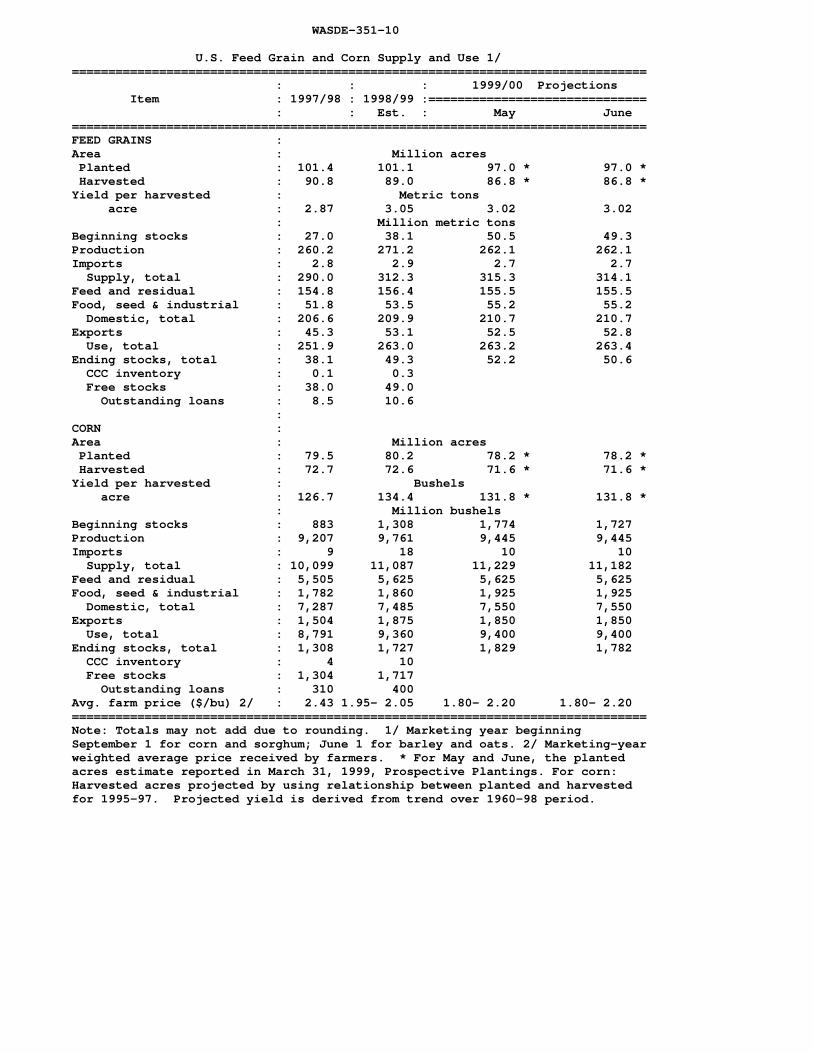
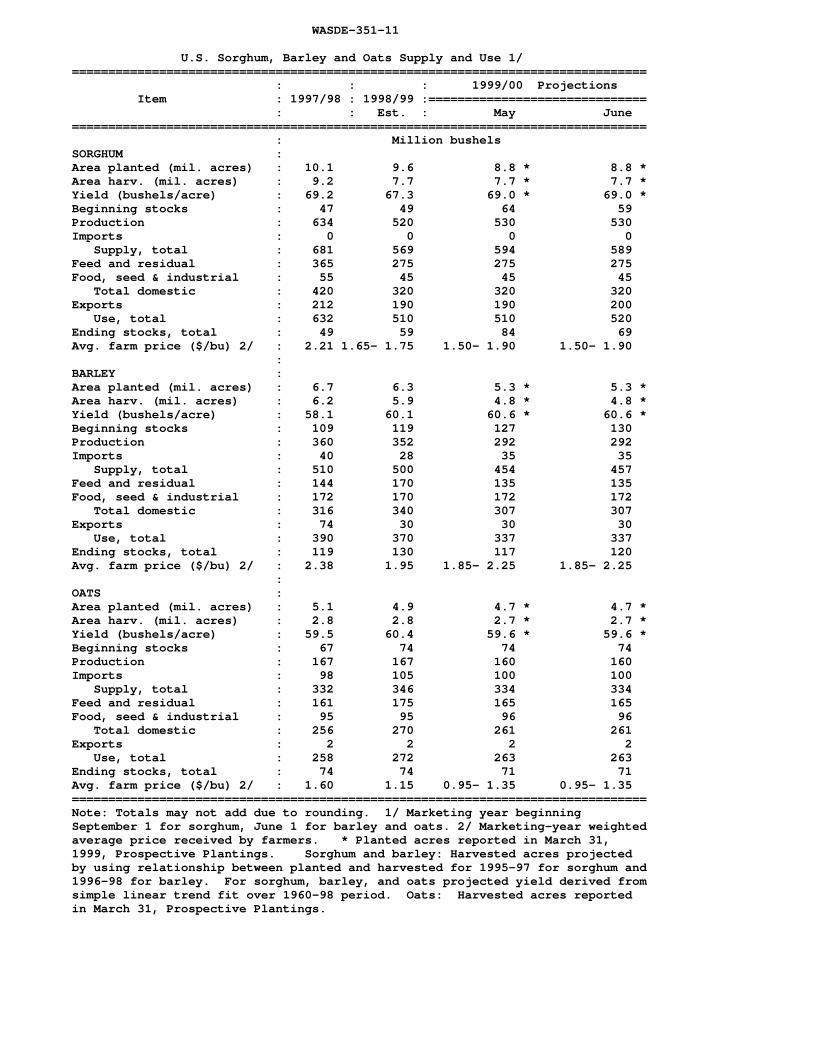
COARSE GRAINS: U.S. 1999/2000 supply and use projections for corn and the other feedgrains are little changed from last month. Lower ending stocks of corn are due to smallerbeginning stocks. The projected corn price is unchanged at $1.80 to $2.20 per bushel.
Forecast 1998/99 ending stocks of corn are down 47 million bushels from last month asexports are up 50 million bushels and imports up 3 million bushels. Forecast U.S. cornexports are higher because of larger imports for Mexico, Egypt, and South Korea andreduced exports by China.
Global 1999/2000 coarse grain supply and use projections are down slightly from last month,

WASDE-351-2
largely due to smaller prospective barley and corn crops in Russia and Ukraine. Unusuallycold weather in May cut production prospects in both countries.
RICE: Except for a slight rise in projected imports and stocks, no other changes are madeto U.S. supply and use for 1999/2000. Imports and ending stocks for 1998/99 are eachraised slightly from a month ago. The season-average price in 1998/99 is raised 20 centsper cwt on each end to $8.75 to $8.95 per cwt because of higher than expected prices inrecent months.
Global 1999/2000 rice production, consumption, and ending stocks are raised from a monthago. World production for 1998/99 is up 2.6 million tons, primarily because of upwardadjustments for India and Bangladesh. India’s 1998/99 crop is estimated at a record 84million tons, an increase of 1 million tons from last month. Rice production in Bangladesh for1998/99 is estimated at a record 19.1 million tons, up 1.3 million tons from last month. Riceproduction in 1998/99 is also raised in Argentina, Australia, and Peru. Mexico’s 1998/99crop is lowered from a month ago. Global consumption and ending stocks for 1998/99 areup this month, due mostly to the larger crop estimates for India and Bangladesh.
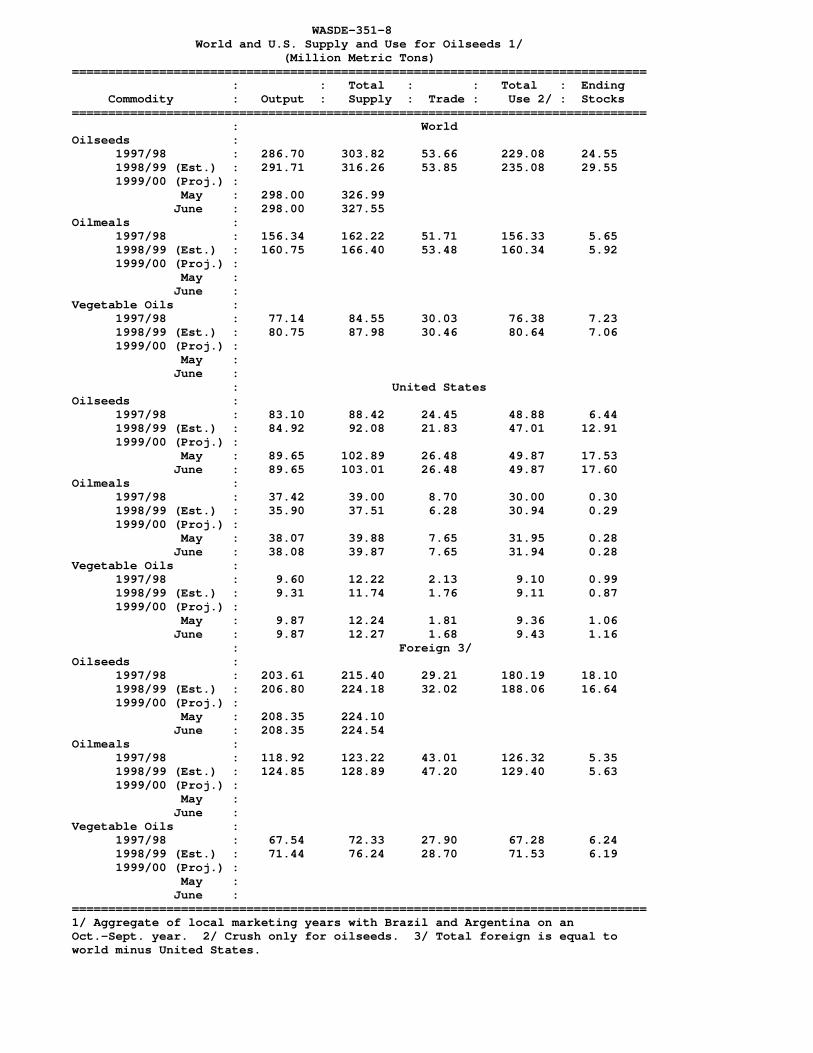
OILSEEDS: U.S. oilseed supply and use prospects for 1999/2000 are little changed thismonth. Prospects still point to a record carryover in 1999/2000 of 17.6 million tons for alloilseeds, with soybean ending stocks forecast at 11.7 million tons or 595 million bushels. The most significant changes this month are a lower soybean oil export forecast and a largerbuildup in soybean oil carryover stocks. Stocks are forecast to reach about 2.0 billionpounds, up 0.2 billion from last month and 0.7 billion from 1998/99. Sharply higherestimates for Malaysian palm oil production for 1998/99 and prospects for a large gain in1999/2000 are expected to offer stiff competition for soybean oil exports in the monthsahead. A cut in India’s oilseed crops for 1998/99 is supporting strong vegetable oil importsand moderating the initial impact of the surge in palm oil production on soybean oil exports.
For 1998/99, U.S. export prospects for both soybean oil and soybean meal are reduced,while domestic use prospects are increased. The main factor cutting U.S. meal exports thismonth is a reduction in China’s forecast imports of 0.3 million tons, to 2.5 million tons. Turkey’s imports are reduced also, while small increases are made for the EU and someEast Asian countries. Slight cuts to soybean and soybean meal exports from South Americahelp to moderate the impact of lower import demand on U.S. exports.
Soybean producer prices for 1999/2000 are unchanged this month at $3.95 to $4.75 perbushel, but are below 1998/99's revised estimate of $5.00 per bushel. Soybean oil pricesare revised down 1.5 cents per pound to 16.5 to 19.5 cents for 1999/2000 compared to aseason-average price of 20.25 cents for 1998/99. Soybean meal prices for 1999/2000 areunchanged from last month at $120 to $140 per short ton.
Global 1999/2000 oilseed production prospects are unchanged this month at 298 millionmetric tons. Global 1998/99 production is reduced 0.5 million tons to 291.7 million tons,mainly reflecting cuts to foreign peanut and sunflowerseed production. World soybeanproduction, at 157.2 million tons in 1998/99, is essentially unchanged as reductions inArgentina, Paraguay, and Italy are offset by an increase of 0.5 million tons in India’s

WASDE-351-3
soybean crop.
SUGAR: Projected 1999/2000 season-beginning stocks of U.S. sugar are reduced 162,000short tons, raw value, due to changes in 1998/99.
U.S. sugar production in fiscal year 1998/99 is estimated at 8.1 million short tons, up slightlyfrom last month and 1 percent above 1997/98. Beet sugar production is increased 50,000tons, based on larger than expected output this spring. Cancellation of the May tranche ofTariff Rate Quota (TRQ) sugar reduces estimated imports by 165,000 tons. Non-TRQimports are increased 25,000 tons, based on importers’ purchases. Domestic consumptionis increased 50,000 tons, to 10.025 million tons, because of larger than expected deliveriesin April. Exports are increased 25,000 tons, reflecting the pace to date. The season-endingstocks-to-use ratio is 14.3 percent, compared with last month’s 16.0 percent.
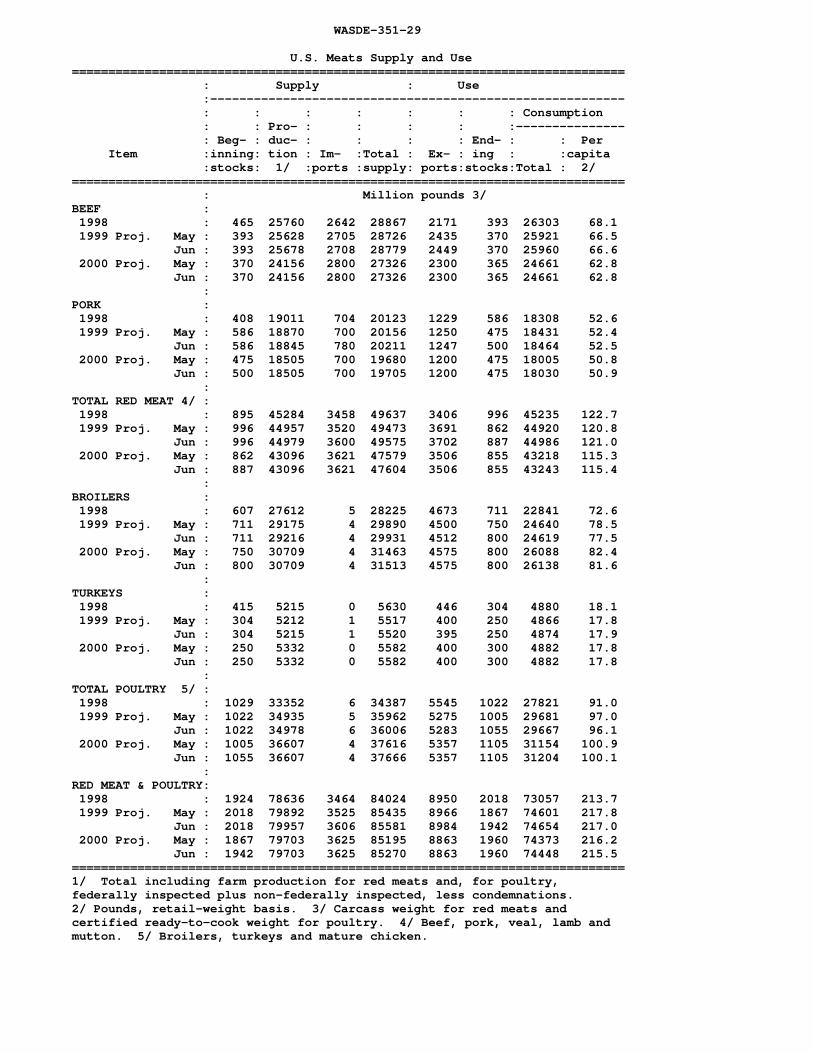
LIVESTOCK, POULTRY, AND DAIRY: Forecast U.S. red meat production for 1999 is raisedfractionally from last month. Higher than expected cattle slaughter in the second quarter ismore than offsetting lower than expected hog slaughter. The Hogs and Pigs report releasedon June 25 will provide further information for evaluating pork production prospects. First-quarter 1999 broiler production is revised up, but forecasts for the remainder of the year areunchanged from last month. Forecast 1999 ending stock levels for pork and broilers areincreased from last month.
The hog price forecast is lowered, reflecting continued large meat supplies and expectationsof higher pork imports.
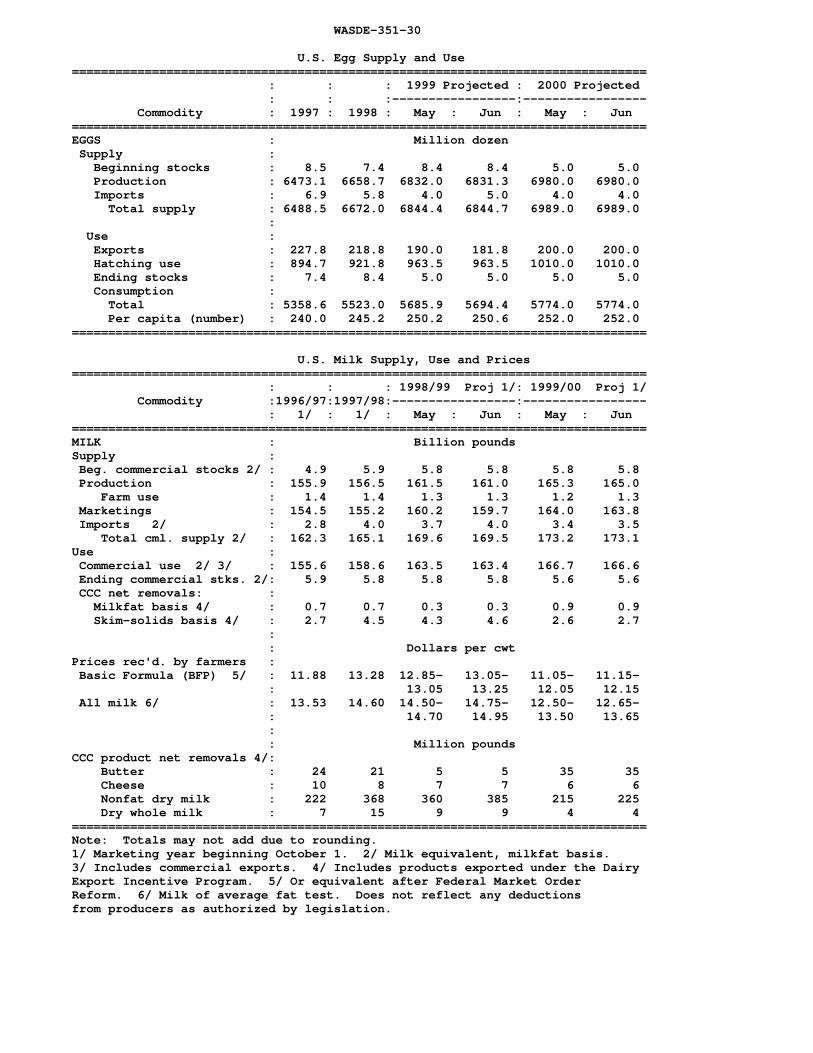
Strong dairy product prices and a fractionally slower forecast growth in milk production leadto an increase in milk price forecasts for 1998/99 and 1999/2000. CCC net removals areforecast higher than last month due the recently announced rollover of the Dairy ExportIncentive Program.
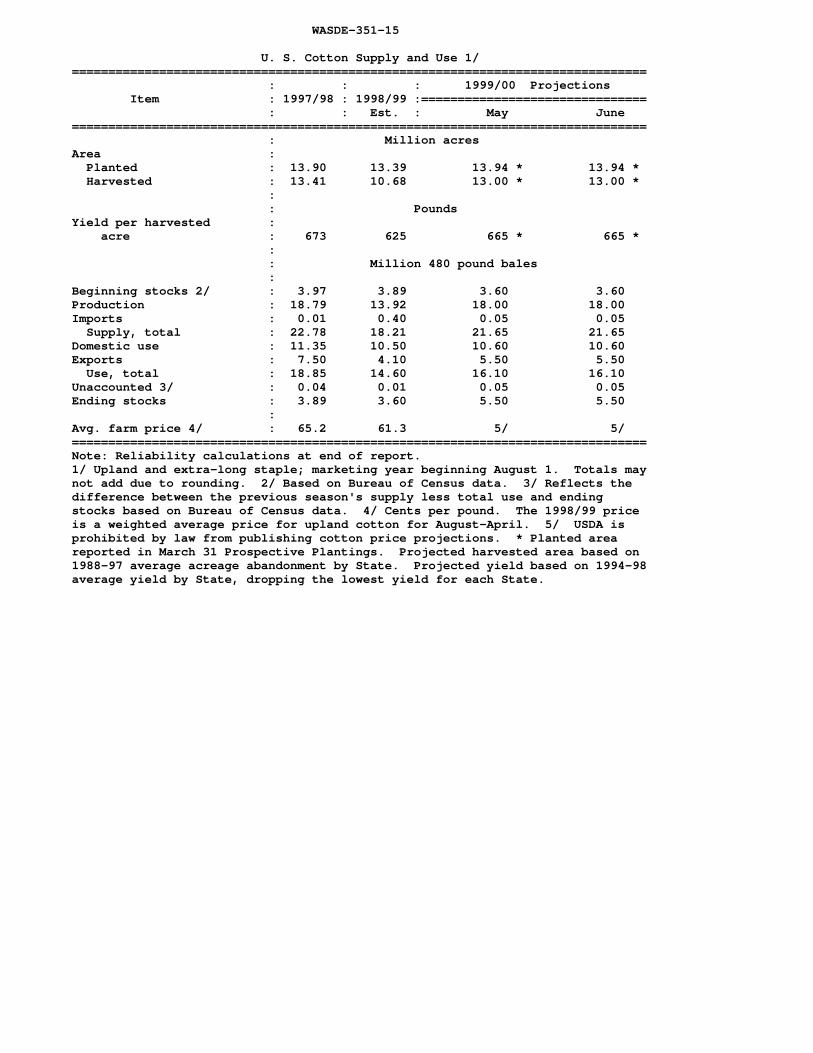
COTTON: There are no changes in this month’s U.S. balance sheets for 1998/99 and1999/2000.
World cotton projections for 1999/2000 show slightly higher beginning and ending stocks,due to changes for the 1998/99 marketing year. No changes are made in 1999/2000 worldprojections for production, consumption, and trade.
World cotton estimates for 1998/99 include lower beginning stocks, higher production, andslightly lower trade and ending stocks, due to adjustments in the estimates for severalcountries. Production is raised for China and Brazil, but reduced for Argentina, India, andTurkey. Consumption increases in India, Pakistan, Turkey, and Uzbekistan are offset byreductions for Nigeria, the Philippines, and other countries.
Approved by the Secretary of Agriculture and the World Agricultural Outlook Board, Gerald A. Bange,Chairperson, (202) 720-6030. This report was prepared by the Interagency Commodity Estimates Committees.

WASDE-351-4
Committee members are listed on page 5.
APPROVED:
I. MILEY GONZALEZACTING SECRETARY OF AGRICULTURE
* * * * * * * * * * *
The next issue of this report will be released 8:30 a.m. ET on July 12, 1999.

WASDE-351 - June 11, 1999
TABLE OF CONTENTS
Page
Highlights . . . . . . . . . . . . . . . . . . . . . . . . . . . . . . 1Interagency Commodity Estimates Committees . 5World & U.S. Supply & Use for Grains. . . . . . . . . 6World & U.S. Supply & Use for Cotton. . . . . . . . . 7World & U.S. Supply & Use for Oilseeds . . . . . . 8U.S. Wheat Supply & Use . . . . . . . . . . . . . . . . . . 9U.S. Wheat Supply & Use by Class . . . . . . . . . . 9U.S. Feed Grain & Corn Supply & Use . . . . . . . 10U.S. Sorghum, Barley &
Oats Supply & Use . . . . . . . . . . . . . . . . . . . . . 11U.S. Rice Supply & Use. . . . . . . . . . . . . . . . . . . 12U.S. Soybeans & Products Supply & Use . . . . . 13U.S. Sugar Supply & Use . . . . . . . . . . . . . . . . . 14U.S. Cotton Supply & Use . . . . . . . . . . . . . . . . 15World Wheat Supply & Use . . . . . . . . . . . . . . . . 16
Page
World Coarse Grains Supply & Use. . . . . . . . . . . 18World Corn Supply & Use . . . . . . . . . . . . . . . . . . 20World Rice Supply & Use . . . . . . . . . . . . . . . . . . 22World Soybean Supply & Use . . . . . . . . . . . . . . . 23World Soybean Meal Supply & Use. . . . . . . . . . . 24World Soybean Oil Supply & Use . . . . . . . . . . . . 25World Cotton Supply & Use . . . . . . . . . . . . . . . . 26U.S. Quarterly Animal Product Production. . . . . . 28U.S. Quarterly Prices for Animal Products. . . . . . 28U.S. Meats Supply and Use. . . . . . . . . . . . . . . . . 29U.S. Egg Supply & Use . . . . . . . . . . . . . . . . . . . . 30U.S. Milk Supply, Use & Prices . . . . . . . . . . . . . . 30Reliability Tables . . . . . . . . . . . . . . . . . . . . . . . . . 31Metric Conversion Factors . . . . . . . . . . . . . . . . . 34Electronic Access and Subscriptions . . . . . . . . . . 35
INTERAGENCY COMMODITY ESTIMATES COMMITTEES
Wheat: Gerald R. Rector, Chairperson, WAOBFrank Gomme, FAS; Ralph Tapp, AMS; Bradley Karmen, FSA; Mack Leath, ERS.
Rice: Andrew C. Aaronson, Chairperson, WAOBAmy Burdett, FAS; Ralph Tapp, AMS, Eugene Rosera, FSA; Nathan Childs, ERS.
Feed Grains: Gerald R. Rector, Chairperson, WAOBAlan Riffkin, FAS; Phillip W. Sronce, FSA; Ralph Tapp, AMS; Allen Baker, ERS.
Soybeans, Cottonseed and Oils: Jim L. Matthews, Chairperson, WAOBPatrick Packnett, FAS; Mark Ash, ERS; Ralph Tapp, AMS; Phillip W. Sronce, FSA.
Cotton: Carol Skelly, Chairperson, WAOBPriscilla Joseph, FAS; Wayne Bjorlie, FSA; Ross Griffith, AMS; Leslie Meyer, ERS.
Sugar: John Love, Chairperson, WAOBStephen Hammond, FAS; Scott Sanford, FSA; Stephen Haley, ERS
Meat Animals: Shayle Shagam, Chairperson, WAOBLisa Hardy-Bass, FAS; Susan Olson, AMS; Ron Gustafson, ERS; Scott Sanford, FSA.
Poultry: Shayle Shagam, Chairperson, WAOBMonica Castillo, FAS; Milton Madison, ERS, Ralph Tapp, AMS.
Dairy: Shayle Shagam, Chairperson, WAOBArthur Coffing, FAS; John R. Mengel, AMS; James Miller, ERS; Daniel Colacicco, FSA.

WASDE-351-6 World and U.S. Supply and Use for Grains 1/ Million Metric Tons=============================================================================== : : Total : : Total : Ending Commodity : Output : Supply : Trade 2/ : Use : Stocks=============================================================================== : : WorldTotal grains 3/ : 1997/98 : 1,875.82 2,169.17 250.79 1,841.58 327.58 1998/99 (Est.) : 1,848.32 2,175.89 243.86 1,847.52 328.37 1999/00 (Proj.) : May : 1,845.83 2,172.17 252.71 1,862.64 309.53 June : 1,840.08 2,168.45 252.35 1,860.31 308.14Wheat : 1997/98 : 609.88 723.72 122.75 584.57 139.15 1998/99 (Est.) : 587.94 727.09 116.21 589.43 137.66 1999/00 (Proj.) : May : 572.39 709.40 121.96 591.76 117.65 June : 570.10 707.76 121.46 589.79 117.97Coarse grains 4/ : 1997/98 : 880.55 1,008.94 101.05 873.37 135.58 1998/99 (Est.) : 878.20 1,013.78 103.93 871.53 142.25 1999/00 (Proj.) : May : 884.68 1,027.27 107.25 882.39 144.89 June : 880.21 1,022.46 107.39 881.52 140.95Rice, milled : 1997/98 : 385.40 436.50 26.98 383.65 52.85 1998/99 (Est.) : 382.18 435.03 23.72 386.56 48.46 1999/00 (Proj.) : May : 388.76 435.50 23.50 388.50 47.00 June : 389.76 438.22 23.50 389.00 49.22 : : United StatesTotal grains 3/ : 1997/98 : 333.94 379.70 76.35 244.63 58.72 1998/99 (Est.) : 347.10 411.77 84.49 250.64 76.65 1999/00 (Proj.) : May : 330.23 413.83 86.54 249.82 77.47 June : 330.14 412.51 86.80 249.82 75.89Wheat : 1997/98 : 67.53 82.19 28.32 34.21 19.66 1998/99 (Est.) : 69.41 91.74 28.58 36.80 26.37 1999/00 (Proj.) : May : 61.09 90.04 31.30 35.11 23.64 June : 61.01 89.96 31.30 35.11 23.55Coarse grains 4/ : 1997/98 : 260.43 290.37 45.25 206.97 38.15 1998/99 (Est.) : 271.55 312.68 53.14 210.27 49.28 1999/00 (Proj.) : May : 262.38 315.73 52.50 211.05 52.18 June : 262.38 314.47 52.76 211.05 50.67Rice, milled : 1997/98 : 5.98 7.13 2.78 3.45 0.90 1998/99 (Est.) : 6.14 7.35 2.78 3.58 1.00 1999/00 (Proj.) : May : 6.76 8.06 2.74 3.67 1.65 June : 6.76 8.08 2.74 3.67 1.67===============================================================================1/ Aggregate of local marketing years. 2/ Based on export estimate. Seeindividual commodity tables for treatment of export/import imbalances. 3/Wheat, coarse grains and milled rice. 4/ Corn, sorghum, barley, oats, rye,millet and mixed grains (for U.S. excludes millet and mixed grains).

WASDE-351-7 World and U.S. Supply and Use for Grains, Continued 1/ Million Metric Tons=============================================================================== : : Total : : Total : Ending Commodity : Output : Supply : Trade 2/ : Use : Stocks=============================================================================== : : Foreign 3/Total grains 4/ : 1997/98 : 1,541.88 1,789.47 174.44 1,596.96 268.86 1998/99 (Est.) : 1,501.22 1,764.12 159.37 1,596.88 251.73 1999/00 (Proj.) : May : 1,515.60 1,758.34 166.17 1,612.82 232.06 June : 1,509.93 1,755.94 165.55 1,610.49 232.25Wheat : 1997/98 : 542.34 641.53 94.44 550.36 119.49 1998/99 (Est.) : 518.53 635.35 87.64 552.63 111.29 1999/00 (Proj.) : May : 511.30 619.36 90.66 556.65 94.01 June : 509.10 617.81 90.16 554.69 94.42Coarse grains 5/ : 1997/98 : 620.12 718.57 55.80 666.40 97.43 1998/99 (Est.) : 606.65 701.10 50.79 661.26 92.97 1999/00 (Proj.) : May : 622.31 711.55 54.75 671.34 92.71 June : 617.84 707.99 54.64 670.47 90.28Rice, milled : 1997/98 : 379.42 429.36 24.20 380.20 51.95 1998/99 (Est.) : 376.04 427.67 20.94 382.99 47.46 1999/00 (Proj.) : May : 382.00 427.43 20.76 384.83 45.35 June : 383.00 430.14 20.76 385.33 47.56===============================================================================1/ Aggregate of local marketing years. 2/ Based on export estimate. Seeindividual commodity tables for treatment of export/import imbalances. 3/Total foreign is equal to world minus United States. 4/ Wheat, coarse grainsand milled rice. 5/ Corn, sorghum, barley, oats, rye, millet and mixedgrains. World and U.S. Supply and Use for Cotton 1/ Million 480-lb. bales=============================================================================== : : Total : : Total : Ending Commodity : Output : Supply : Trade 2/ : Use : Stocks=============================================================================== : : World 1997/98 : 91.60 129.78 26.61 88.51 40.85 1998/99 (Est.) : 84.35 125.20 23.60 84.71 41.08 1999/00 (Proj.) : May : 87.00 128.23 25.00 86.50 41.73 June : 87.00 128.08 25.00 86.50 41.58 : United States 1997/98 : 18.79 22.78 7.50 11.35 3.89 1998/99 (Est.) : 13.92 18.21 4.10 10.50 3.60 1999/00 (Proj.) : May : 18.00 21.65 5.50 10.60 5.50 June : 18.00 21.65 5.50 10.60 5.50 : Foreign 3/ 1997/98 : 72.81 107.00 19.11 77.16 36.96 1998/99 (Est.) : 70.43 106.99 19.50 74.21 37.48 1999/00 (Proj.) : May : 69.00 106.58 19.50 75.90 36.23 June : 69.00 106.43 19.50 75.90 36.08===============================================================================1/ Marketing year beginning August 1. 2/ Based on export estimate. 3/ TotalForeign is equal to world minus United States. See global cotton tables fortreatment of export/import imbalances.
WASDE-351-8 World and U.S. Supply and Use for Oilseeds 1/ (Million Metric Tons)=============================================================================== : : Total : : Total : Ending Commodity : Output : Supply : Trade : Use 2/ : Stocks=============================================================================== : WorldOilseeds : 1997/98 : 286.70 303.82 53.66 229.08 24.55 1998/99 (Est.) : 291.71 316.26 53.85 235.08 29.55 1999/00 (Proj.) : May : 298.00 326.99 June : 298.00 327.55 Oilmeals : 1997/98 : 156.34 162.22 51.71 156.33 5.65 1998/99 (Est.) : 160.75 166.40 53.48 160.34 5.92 1999/00 (Proj.) : May : June : Vegetable Oils : 1997/98 : 77.14 84.55 30.03 76.38 7.23 1998/99 (Est.) : 80.75 87.98 30.46 80.64 7.06 1999/00 (Proj.) : May : June : : United StatesOilseeds : 1997/98 : 83.10 88.42 24.45 48.88 6.44 1998/99 (Est.) : 84.92 92.08 21.83 47.01 12.91 1999/00 (Proj.) : May : 89.65 102.89 26.48 49.87 17.53 June : 89.65 103.01 26.48 49.87 17.60Oilmeals : 1997/98 : 37.42 39.00 8.70 30.00 0.30 1998/99 (Est.) : 35.90 37.51 6.28 30.94 0.29 1999/00 (Proj.) : May : 38.07 39.88 7.65 31.95 0.28 June : 38.08 39.87 7.65 31.94 0.28Vegetable Oils : 1997/98 : 9.60 12.22 2.13 9.10 0.99 1998/99 (Est.) : 9.31 11.74 1.76 9.11 0.87 1999/00 (Proj.) : May : 9.87 12.24 1.81 9.36 1.06 June : 9.87 12.27 1.68 9.43 1.16 : Foreign 3/Oilseeds : 1997/98 : 203.61 215.40 29.21 180.19 18.10 1998/99 (Est.) : 206.80 224.18 32.02 188.06 16.64 1999/00 (Proj.) : May : 208.35 224.10 June : 208.35 224.54 Oilmeals : 1997/98 : 118.92 123.22 43.01 126.32 5.35 1998/99 (Est.) : 124.85 128.89 47.20 129.40 5.63 1999/00 (Proj.) : May : June : Vegetable Oils : 1997/98 : 67.54 72.33 27.90 67.28 6.24 1998/99 (Est.) : 71.44 76.24 28.70 71.53 6.19 1999/00 (Proj.) : May : June : ===============================================================================1/ Aggregate of local marketing years with Brazil and Argentina on anOct.-Sept. year. 2/ Crush only for oilseeds. 3/ Total foreign is equal toworld minus United States.

WASDE-351-9 U.S. Wheat Supply and Use 1/=============================================================================== : : : 1999/00 Projections Item : 1997/98 : 1998/99 :============================== : : Est. : May June===============================================================================Area : Million acres Planted : 70.4 65.9 63.0 * 63.0 * Harvested : 62.8 59.0 55.4 * 55.1 *Yield per harvested : Bushels acre : 39.5 43.2 40.5 * 40.7 * : Million bushelsBeginning stocks : 444 722 969 969Production : 2,481 2,550 2,245 2,242Imports : 95 98 95 95 Supply, total : 3,020 3,371 3,309 3,305Food : 917 915 925 925Seed : 93 87 90 90Feed and residual : 248 350 275 275 Domestic, total : 1,257 1,352 1,290 1,290Exports : 1,040 1,050 1,150 1,150 Use, total : 2,298 2,402 2,440 2,440Ending stocks : 722 969 869 865 CCC inventory : 94 129 Free stocks : 628 840Avg. farm price ($/bu) 2/ : 3.38 2.65 2.60- 3.10 2.60- 3.10=============================================================================== U.S. Wheat by Class: Supply and Use=============================================================================== Year beginning : Hard : Hard : Soft : : : June 1 : Winter : Spring : Red : White : Durum :Total ===============================================================================1998/99 (estimated) : Million bushelsBeginning stocks : 307 220 80 90 26 722Production : 1,182 487 443 298 141 2,550 Supply, total 3/ : 1,490 762 523 397 200 3,371Domestic use : 608 262 298 98 87 1,352Exports : 445 245 100 220 40 1,050 Use, total : 1,053 507 398 318 127 2,402 Ending stocks Jun : 437 255 125 79 73 969 May : 447 250 125 74 73 969===============================================================================Note: Totals may not add due to rounding. 1/ Marketing year beginning June 1. 2/ Marketing-year weighted average price received by farmers. 3/ Includesimports. * For May and June, planted acres reported in March 31, 1999,Prospective Plantings. Harvested acres and yield for spring wheat (includingdurum) projected using harvested-to-planted ratios and yields by State for1996-1998. For June, winter wheat harvested acreage and yield reported in June11 Crop Production.
******************************************************************************* ** ** Wheat-by-class projections for 1990/00 will first be published ** in the July 12 WASDE. ** ** *******************************************************************************
WASDE-351-10 U.S. Feed Grain and Corn Supply and Use 1/=============================================================================== : : : 1999/00 Projections Item : 1997/98 : 1998/99 :============================== : : Est. : May June===============================================================================FEED GRAINS :Area : Million acres Planted : 101.4 101.1 97.0 * 97.0 * Harvested : 90.8 89.0 86.8 * 86.8 *Yield per harvested : Metric tons acre : 2.87 3.05 3.02 3.02 : Million metric tonsBeginning stocks : 27.0 38.1 50.5 49.3Production : 260.2 271.2 262.1 262.1Imports : 2.8 2.9 2.7 2.7 Supply, total : 290.0 312.3 315.3 314.1Feed and residual : 154.8 156.4 155.5 155.5Food, seed & industrial : 51.8 53.5 55.2 55.2 Domestic, total : 206.6 209.9 210.7 210.7Exports : 45.3 53.1 52.5 52.8 Use, total : 251.9 263.0 263.2 263.4Ending stocks, total : 38.1 49.3 52.2 50.6 CCC inventory : 0.1 0.3 Free stocks : 38.0 49.0 Outstanding loans : 8.5 10.6 :CORN :Area : Million acres Planted : 79.5 80.2 78.2 * 78.2 * Harvested : 72.7 72.6 71.6 * 71.6 *Yield per harvested : Bushels acre : 126.7 134.4 131.8 * 131.8 * : Million bushelsBeginning stocks : 883 1,308 1,774 1,727Production : 9,207 9,761 9,445 9,445Imports : 9 18 10 10 Supply, total : 10,099 11,087 11,229 11,182Feed and residual : 5,505 5,625 5,625 5,625Food, seed & industrial : 1,782 1,860 1,925 1,925 Domestic, total : 7,287 7,485 7,550 7,550Exports : 1,504 1,875 1,850 1,850 Use, total : 8,791 9,360 9,400 9,400Ending stocks, total : 1,308 1,727 1,829 1,782 CCC inventory : 4 10 Free stocks : 1,304 1,717 Outstanding loans : 310 400Avg. farm price ($/bu) 2/ : 2.43 1.95- 2.05 1.80- 2.20 1.80- 2.20===============================================================================Note: Totals may not add due to rounding. 1/ Marketing year beginningSeptember 1 for corn and sorghum; June 1 for barley and oats. 2/ Marketing-yearweighted average price received by farmers. * For May and June, the plantedacres estimate reported in March 31, 1999, Prospective Plantings. For corn:Harvested acres projected by using relationship between planted and harvestedfor 1995-97. Projected yield is derived from trend over 1960-98 period.
WASDE-351-11 U.S. Sorghum, Barley and Oats Supply and Use 1/=============================================================================== : : : 1999/00 Projections Item : 1997/98 : 1998/99 :============================== : : Est. : May June=============================================================================== : Million bushelsSORGHUM :Area planted (mil. acres) : 10.1 9.6 8.8 * 8.8 *Area harv. (mil. acres) : 9.2 7.7 7.7 * 7.7 *Yield (bushels/acre) : 69.2 67.3 69.0 * 69.0 *Beginning stocks : 47 49 64 59Production : 634 520 530 530Imports : 0 0 0 0 Supply, total : 681 569 594 589Feed and residual : 365 275 275 275Food, seed & industrial : 55 45 45 45 Total domestic : 420 320 320 320Exports : 212 190 190 200 Use, total : 632 510 510 520Ending stocks, total : 49 59 84 69Avg. farm price ($/bu) 2/ : 2.21 1.65- 1.75 1.50- 1.90 1.50- 1.90 :BARLEY :Area planted (mil. acres) : 6.7 6.3 5.3 * 5.3 *Area harv. (mil. acres) : 6.2 5.9 4.8 * 4.8 *Yield (bushels/acre) : 58.1 60.1 60.6 * 60.6 *Beginning stocks : 109 119 127 130Production : 360 352 292 292Imports : 40 28 35 35 Supply, total : 510 500 454 457Feed and residual : 144 170 135 135Food, seed & industrial : 172 170 172 172 Total domestic : 316 340 307 307Exports : 74 30 30 30 Use, total : 390 370 337 337Ending stocks, total : 119 130 117 120Avg. farm price ($/bu) 2/ : 2.38 1.95 1.85- 2.25 1.85- 2.25 :OATS :Area planted (mil. acres) : 5.1 4.9 4.7 * 4.7 *Area harv. (mil. acres) : 2.8 2.8 2.7 * 2.7 *Yield (bushels/acre) : 59.5 60.4 59.6 * 59.6 *Beginning stocks : 67 74 74 74Production : 167 167 160 160Imports : 98 105 100 100 Supply, total : 332 346 334 334Feed and residual : 161 175 165 165Food, seed & industrial : 95 95 96 96 Total domestic : 256 270 261 261Exports : 2 2 2 2 Use, total : 258 272 263 263Ending stocks, total : 74 74 71 71Avg. farm price ($/bu) 2/ : 1.60 1.15 0.95- 1.35 0.95- 1.35===============================================================================Note: Totals may not add due to rounding. 1/ Marketing year beginningSeptember 1 for sorghum, June 1 for barley and oats. 2/ Marketing-year weightedaverage price received by farmers. * Planted acres reported in March 31,1999, Prospective Plantings. Sorghum and barley: Harvested acres projectedby using relationship between planted and harvested for 1995-97 for sorghum and1996-98 for barley. For sorghum, barley, and oats projected yield derived fromsimple linear trend fit over 1960-98 period. Oats: Harvested acres reportedin March 31, Prospective Plantings.

WASDE-351-12 U.S. Rice Supply and Use 1/ (Rough Equivalent of Rough and Milled Rice)=============================================================================== : : : 1999/00 Projections Item : 1997/98 : 1998/99 :============================== : : Est. : May June===============================================================================TOTAL :Area : Million acres Planted : 3.13 3.35 3.58 * 3.58 * Harvested : 3.10 3.32 3.55 * 3.55 *Yield per harvested : Pounds acre : 5,897 5,669 5,831 * 5,831 * : Million hundredweight Beginning stocks 2/ : 27.2 27.7 30.4 30.7 Production : 183.0 188.1 207.0 207.0 Imports : 9.2 9.8 9.8 10.0 Supply, total : 219.4 225.5 247.2 247.7 Domestic & residual 3/ : 106.5 109.8 112.6 112.6 Exports, total 4/ : 85.2 85.0 84.0 84.0 Rough : 26.1 26.0 15.0 15.0 Milled (rough equiv.) : 59.1 59.0 69.0 69.0 Use, total : 191.7 194.8 196.6 196.6 Ending stocks : 27.7 30.7 50.6 51.1Avg. farm price ($/cwt) 5/ : 9.70 8.75- 8.95 6.00- 7.00 6.00- 7.00 :LONG GRAIN : Harvested acres (mil.) : 2.31 2.61 Yield (pounds/acre) : 5,391 5,430 Beginning stocks : 14.1 14.3 22.0 22.2 Production : 124.5 141.6 150.0 150.0 Supply, total 6/ : 146.6 164.5 180.3 181.0 Domestic & Residual 3/ : 62.5 71.8 73.5 73.5 Exports 7/ : 69.7 70.5 67.0 67.0 Use, total : 132.2 142.3 140.5 140.5 Ending stocks : 14.3 22.2 39.8 40.5 : :MEDIUM & SHORT GRAIN : Harvested acres (mil.) : 0.79 0.71 Yield (pounds/acre) : 7,369 6,548 Beginning stocks : 12.1 12.3 7.4 7.4 Production : 58.5 46.4 57.0 57.0 Supply, total 6/ : 71.8 59.9 65.9 65.6 Domestic & Residual 3/ : 44.0 38.0 39.1 39.1 Exports 7/ : 15.5 14.5 17.0 17.0 Use, total : 59.5 52.5 56.1 56.1 Ending stocks : 12.3 7.4 9.8 9.5===============================================================================Note: Totals may not add due to rounding. 1/ Marketing year beginning August1. 2/ Includes the following quantities of broken kernel rice (typeundetermined) not included in estimates of beginning stocks by type (in mil.cwt): 1996/97-0.6; 1997/98-1.0; 1998/99-1.0. 3/ Residual includes unreporteduse, processing losses and estimating errors. Use by type may not add to totalrice use because of the difference in brokens between beginning and endingstocks. 4/ Includes rough rice and milled rice exports. Milled rice exportsare converted to an equivalent rough basis. 5/ Marketing-year weighted average price received by farmers. 6/ Includes imports. 7/ Exports by type of riceare estimated. * Planted acres reported in March 31, 1999 ProspectivePlantings. Harvested acres projected using harvested-to-planted ratios byState and type of rice for 1994-98. Projected yield is calculated using theolympic average (high and low years excluded) for 1994-98 weighted by State andtype of rice.

WASDE-351-13 U.S. Soybeans and Products Supply and Use (Domestic Measure) 1/=============================================================================== : : : 1999/00 Projections Item : 1997/98 : 1998/99 :=============================== : : Est. : May June===============================================================================SOYBEANS: : Million acresArea : Planted : 70.0 72.4 73.1 * 73.1 * Harvested : 69.1 70.8 72.0 * 72.0 * : : BushelsYield per harvested : acre : 38.9 38.9 40.0 * 40.0 * : : Million bushels :Beginning stocks : 132 200 430 430Production : 2,689 2,757 2,880 2,880Imports : 5 6 5 5 Supply, total : 2,826 2,963 3,315 3,315Crushings : 1,597 1,560 1,635 1,635Exports : 870 770 930 930Seed : 86 88 86 86Residual : 72 115 _3/ 69 69 Use, total : 2,626 2,533 2,720 2,720Ending stocks : 200 430 595 595Avg. farm price ($/bu) 2/ : 6.47 5.00 3.95- 4.75 3.95 - 4.75 : : : Million poundsSOYBEAN OIL: :Beginning stocks : 1,520 1,382 1,295 1,295Production : 18,143 17,550 _4/ 18,395 18,395Imports : 60 63 55 55 Supply, total : 19,724 18,995 19,745 19,745Domestic : 15,264 15,400 15,650 15,750Exports : 3,077 2,300 2,300 2,000 Use, total : 18,341 17,700 17,950 17,750Ending stocks : 1,382 1,295 1,795 1,995Average price (c/lb) 2/ : 25.84 20.25 18.00- 16.50- : 21.00 19.50 : : Thousand short tonsSOYBEAN MEAL: :Beginning stocks : 210 218 275 275Production : 38,171 36,807 _4/ 38,825 38,825Imports : 56 50 50 50 Supply, total : 38,437 37,075 39,150 39,150Domestic : 28,889 30,100 30,700 30,700Exports : 9,330 6,700 8,200 8,200 Use, total : 38,219 36,800 38,900 38,900Ending stocks : 218 275 250 250Average price ($/s.t.) 2/ : 185.54 135.00 120.00- 120.00- : 140.00 140.00===============================================================================Note: Reliability calculations at end of report. 1/ Marketing year beginning September 1 for soybeans; October 1 for soybean oiland meal. 2/ Prices: soybeans, marketing year weighted average price received by farmers; for oil, simple average of crude soybean oil, Decatur; for meal,simple average of 48 percent, Decatur. 3/ Supply estimates and reported usethrough February, coupled with USDA's March 1 stocks estimate, indicate anabove-average residual. 4/ Based on October year crush estimate of 1,555million bushels. *Planted acres are reported in March 31 ProspectivePlantings. Harvested acres based on normal planted-to-harvested ratio. Projected yield based on U.S. trends since the mid-1980's.

WASDE-351-14 U.S. Sugar Supply and Use 1/====================================================================== : : : 1999/00 Projections Item : 1997/98 : 1998/99 :====================== : : Estimate : May June ====================================================================== : 1,000 short tons, raw valueBeginning stocks 2/ : 1,488 1,679 1,629 1,467 Production 2/3/ : 8,020 8,126 8,400 8,400 Beet sugar : 4,389 4,275 4,530 4,530 Cane sugar 4/ : 3,631 3,851 3,870 3,870 Imports 2/ : 2,163 1,887 NA NA TRQ 5/ : 1,729 1,247 NA NA Other 6/ : 434 640 725 725 Total supply : 11,671 11,692 NA NA :Exports 2/7/ : 179 200 175 175 Domestic deliveries 2/ : 9,815 10,025 10,150 10,150 Domestic food use : 9,672 9,798 9,953 9,953 Other 8/ : 143 227 197 197 Miscellaneous 9/ : (2) 0 0 0 Use, total : 9,992 10,225 10,325 10,325 Ending stocks 2/ : 1,679 1,467 NA NA :Stocks to use ratio : 16.8 14.3 NA NA======================================================================1/ Fiscal years beginning Oct 1. Includes Puerto Rico. 2/ Historical data are from FSA, "Sweetener Market Data" except 1997/98 imports from U.S. Customs Service. 3/ Projections for 1999/2000 are based on analyses by the Interagency Commodity Estimates Committee for sugar. 4/ Production by state for 1998/99 (projected 1999/2000):FL 2,132 (2,025); HI 350 (330); LA 1,260 (1,400); TX 106 (100); PR 3 (15). 5/ Actual arrivals under the tariff rate quota (TRQ) with lateentries, early entries, and TRQ overfills assigned to the fiscal yearin which they actually arrived. The 1998/99 TRQ includes a forecast 65,000 tons shortfall. 6/ Quota exempt imports (for reexport, for polyhydric alcohol, sugar syrup under USHTS 1702904000, and high-duty). 7/ Mostly reexports. 8/ Transfer to sugar containing products for reexport, for nonedible alcohol, and feed. 9/ Residual.
METRIC CONVERSION FACTORS 1 Hectare = 2.4710 Acres 1 Kilogram = 2.205 Pounds--------------------------------------------------------------------- 1 Metric Ton : = Domestic Unit * Factor---------------------------------------------------------------------Wheat & Soybeans : = bushels * .027216Rice : = cwt * .045359Rapeseed & Sunflowerseed : = cwt * .045359Corn, Sorghum & Rye : = bushels * .025401Barley : = bushels * .021772Oats : = bushels * .014515Sugar : = short tons * .907185Cotton : = 480-lb bales * .217720---------------------------------------------------------------------
WASDE-351-15 U. S. Cotton Supply and Use 1/=============================================================================== : : : 1999/00 Projections Item : 1997/98 : 1998/99 :=============================== : : Est. : May June=============================================================================== : Million acresArea : Planted : 13.90 13.39 13.94 * 13.94 * Harvested : 13.41 10.68 13.00 * 13.00 * : : Pounds Yield per harvested : acre : 673 625 665 * 665 * : : Million 480 pound bales :Beginning stocks 2/ : 3.97 3.89 3.60 3.60Production : 18.79 13.92 18.00 18.00Imports : 0.01 0.40 0.05 0.05 Supply, total : 22.78 18.21 21.65 21.65Domestic use : 11.35 10.50 10.60 10.60Exports : 7.50 4.10 5.50 5.50 Use, total : 18.85 14.60 16.10 16.10Unaccounted 3/ : 0.04 0.01 0.05 0.05Ending stocks : 3.89 3.60 5.50 5.50 :Avg. farm price 4/ : 65.2 61.3 5/ 5/===============================================================================Note: Reliability calculations at end of report.1/ Upland and extra-long staple; marketing year beginning August 1. Totals maynot add due to rounding. 2/ Based on Bureau of Census data. 3/ Reflects thedifference between the previous season's supply less total use and endingstocks based on Bureau of Census data. 4/ Cents per pound. The 1998/99 price is a weighted average price for upland cotton for August-April. 5/ USDA isprohibited by law from publishing cotton price projections. * Planted areareported in March 31 Prospective Plantings. Projected harvested area based on 1988-97 average acreage abandonment by State. Projected yield based on 1994-98average yield by State, dropping the lowest yield for each State.
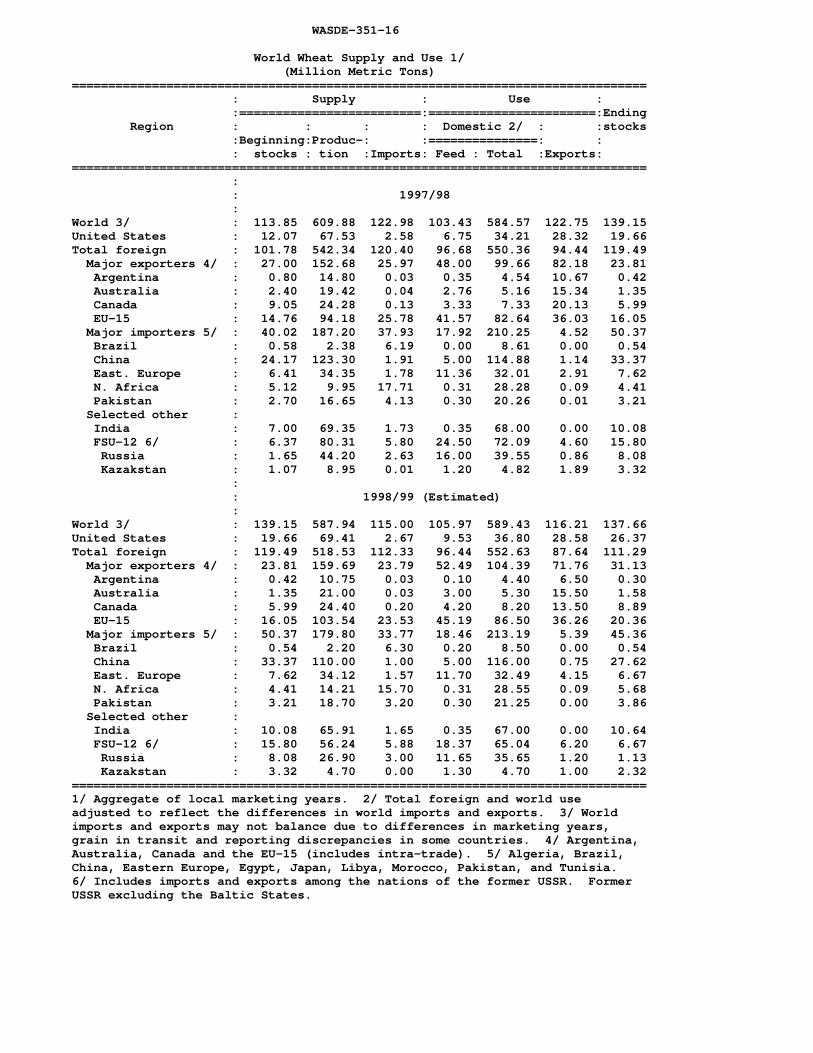
WASDE-351-16 World Wheat Supply and Use 1/ (Million Metric Tons)=============================================================================== : Supply : Use : :=========================:=======================:Ending Region : : : : Domestic 2/ : :stocks :Beginning:Produc-: :===============: : : stocks : tion :Imports: Feed : Total :Exports:=============================================================================== : : 1997/98 :World 3/ : 113.85 609.88 122.98 103.43 584.57 122.75 139.15United States : 12.07 67.53 2.58 6.75 34.21 28.32 19.66Total foreign : 101.78 542.34 120.40 96.68 550.36 94.44 119.49 Major exporters 4/ : 27.00 152.68 25.97 48.00 99.66 82.18 23.81 Argentina : 0.80 14.80 0.03 0.35 4.54 10.67 0.42 Australia : 2.40 19.42 0.04 2.76 5.16 15.34 1.35 Canada : 9.05 24.28 0.13 3.33 7.33 20.13 5.99 EU-15 : 14.76 94.18 25.78 41.57 82.64 36.03 16.05 Major importers 5/ : 40.02 187.20 37.93 17.92 210.25 4.52 50.37 Brazil : 0.58 2.38 6.19 0.00 8.61 0.00 0.54 China : 24.17 123.30 1.91 5.00 114.88 1.14 33.37 East. Europe : 6.41 34.35 1.78 11.36 32.01 2.91 7.62 N. Africa : 5.12 9.95 17.71 0.31 28.28 0.09 4.41 Pakistan : 2.70 16.65 4.13 0.30 20.26 0.01 3.21 Selected other : India : 7.00 69.35 1.73 0.35 68.00 0.00 10.08 FSU-12 6/ : 6.37 80.31 5.80 24.50 72.09 4.60 15.80 Russia : 1.65 44.20 2.63 16.00 39.55 0.86 8.08 Kazakstan : 1.07 8.95 0.01 1.20 4.82 1.89 3.32 : : 1998/99 (Estimated) :World 3/ : 139.15 587.94 115.00 105.97 589.43 116.21 137.66United States : 19.66 69.41 2.67 9.53 36.80 28.58 26.37Total foreign : 119.49 518.53 112.33 96.44 552.63 87.64 111.29 Major exporters 4/ : 23.81 159.69 23.79 52.49 104.39 71.76 31.13 Argentina : 0.42 10.75 0.03 0.10 4.40 6.50 0.30 Australia : 1.35 21.00 0.03 3.00 5.30 15.50 1.58 Canada : 5.99 24.40 0.20 4.20 8.20 13.50 8.89 EU-15 : 16.05 103.54 23.53 45.19 86.50 36.26 20.36 Major importers 5/ : 50.37 179.80 33.77 18.46 213.19 5.39 45.36 Brazil : 0.54 2.20 6.30 0.20 8.50 0.00 0.54 China : 33.37 110.00 1.00 5.00 116.00 0.75 27.62 East. Europe : 7.62 34.12 1.57 11.70 32.49 4.15 6.67 N. Africa : 4.41 14.21 15.70 0.31 28.55 0.09 5.68 Pakistan : 3.21 18.70 3.20 0.30 21.25 0.00 3.86 Selected other : India : 10.08 65.91 1.65 0.35 67.00 0.00 10.64 FSU-12 6/ : 15.80 56.24 5.88 18.37 65.04 6.20 6.67 Russia : 8.08 26.90 3.00 11.65 35.65 1.20 1.13 Kazakstan : 3.32 4.70 0.00 1.30 4.70 1.00 2.32===============================================================================1/ Aggregate of local marketing years. 2/ Total foreign and world useadjusted to reflect the differences in world imports and exports. 3/ Worldimports and exports may not balance due to differences in marketing years,grain in transit and reporting discrepancies in some countries. 4/ Argentina,Australia, Canada and the EU-15 (includes intra-trade). 5/ Algeria, Brazil,China, Eastern Europe, Egypt, Japan, Libya, Morocco, Pakistan, and Tunisia. 6/ Includes imports and exports among the nations of the former USSR. Former USSR excluding the Baltic States.
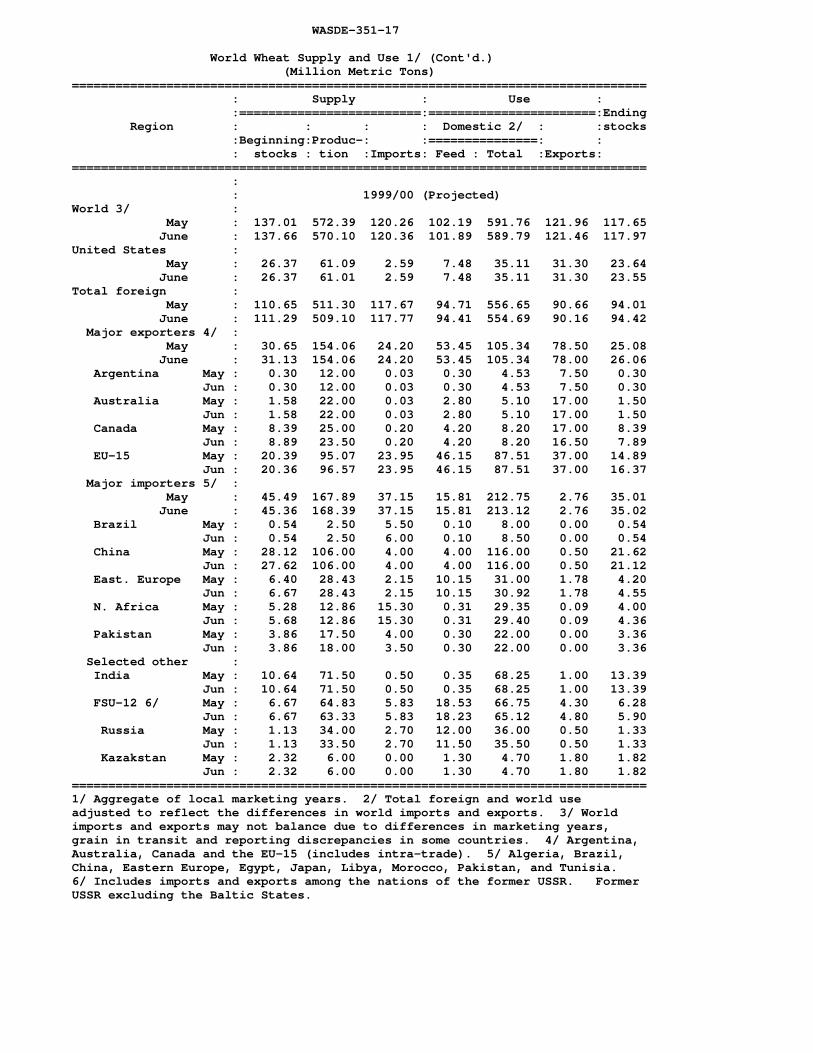
WASDE-351-17 World Wheat Supply and Use 1/ (Cont'd.) (Million Metric Tons)=============================================================================== : Supply : Use : :=========================:=======================:Ending Region : : : : Domestic 2/ : :stocks :Beginning:Produc-: :===============: : : stocks : tion :Imports: Feed : Total :Exports:=============================================================================== : : 1999/00 (Projected)World 3/ : May : 137.01 572.39 120.26 102.19 591.76 121.96 117.65 June : 137.66 570.10 120.36 101.89 589.79 121.46 117.97United States : May : 26.37 61.09 2.59 7.48 35.11 31.30 23.64 June : 26.37 61.01 2.59 7.48 35.11 31.30 23.55Total foreign : May : 110.65 511.30 117.67 94.71 556.65 90.66 94.01 June : 111.29 509.10 117.77 94.41 554.69 90.16 94.42 Major exporters 4/ : May : 30.65 154.06 24.20 53.45 105.34 78.50 25.08 June : 31.13 154.06 24.20 53.45 105.34 78.00 26.06 Argentina May : 0.30 12.00 0.03 0.30 4.53 7.50 0.30 Jun : 0.30 12.00 0.03 0.30 4.53 7.50 0.30 Australia May : 1.58 22.00 0.03 2.80 5.10 17.00 1.50 Jun : 1.58 22.00 0.03 2.80 5.10 17.00 1.50 Canada May : 8.39 25.00 0.20 4.20 8.20 17.00 8.39 Jun : 8.89 23.50 0.20 4.20 8.20 16.50 7.89 EU-15 May : 20.39 95.07 23.95 46.15 87.51 37.00 14.89 Jun : 20.36 96.57 23.95 46.15 87.51 37.00 16.37 Major importers 5/ : May : 45.49 167.89 37.15 15.81 212.75 2.76 35.01 June : 45.36 168.39 37.15 15.81 213.12 2.76 35.02 Brazil May : 0.54 2.50 5.50 0.10 8.00 0.00 0.54 Jun : 0.54 2.50 6.00 0.10 8.50 0.00 0.54 China May : 28.12 106.00 4.00 4.00 116.00 0.50 21.62 Jun : 27.62 106.00 4.00 4.00 116.00 0.50 21.12 East. Europe May : 6.40 28.43 2.15 10.15 31.00 1.78 4.20 Jun : 6.67 28.43 2.15 10.15 30.92 1.78 4.55 N. Africa May : 5.28 12.86 15.30 0.31 29.35 0.09 4.00 Jun : 5.68 12.86 15.30 0.31 29.40 0.09 4.36 Pakistan May : 3.86 17.50 4.00 0.30 22.00 0.00 3.36 Jun : 3.86 18.00 3.50 0.30 22.00 0.00 3.36 Selected other : India May : 10.64 71.50 0.50 0.35 68.25 1.00 13.39 Jun : 10.64 71.50 0.50 0.35 68.25 1.00 13.39 FSU-12 6/ May : 6.67 64.83 5.83 18.53 66.75 4.30 6.28 Jun : 6.67 63.33 5.83 18.23 65.12 4.80 5.90 Russia May : 1.13 34.00 2.70 12.00 36.00 0.50 1.33 Jun : 1.13 33.50 2.70 11.50 35.50 0.50 1.33 Kazakstan May : 2.32 6.00 0.00 1.30 4.70 1.80 1.82 Jun : 2.32 6.00 0.00 1.30 4.70 1.80 1.82===============================================================================1/ Aggregate of local marketing years. 2/ Total foreign and world useadjusted to reflect the differences in world imports and exports. 3/ Worldimports and exports may not balance due to differences in marketing years,grain in transit and reporting discrepancies in some countries. 4/ Argentina,Australia, Canada and the EU-15 (includes intra-trade). 5/ Algeria, Brazil,China, Eastern Europe, Egypt, Japan, Libya, Morocco, Pakistan, and Tunisia. 6/ Includes imports and exports among the nations of the former USSR. FormerUSSR excluding the Baltic States.

WASDE-351-18 World Coarse Grain Supply and Use 1/ (Million Metric Tons)=============================================================================== : Supply : Use : :=========================:=======================:Ending Region : : : : Domestic 2/ : :stocks :Beginning:Produc-: :===============: : : stocks : tion :Imports: Feed : Total :Exports:=============================================================================== : : 1997/98 :World 3/ : 128.40 880.55 99.12 580.82 873.37 101.05 135.58United States : 27.01 260.43 2.94 154.98 206.97 45.25 38.15Total foreign : 101.39 620.12 96.18 425.84 666.40 55.80 97.43 Major exporters 4/ : 9.07 67.31 1.78 36.45 46.68 22.08 9.40 Argentina : 1.11 24.67 0.01 7.50 9.62 13.75 2.41 Australia : 0.67 9.49 0.00 4.49 5.69 3.34 1.14 Canada : 4.85 25.12 1.52 19.88 23.44 3.75 4.30 Major importers 5/ : 27.91 206.72 63.13 172.65 234.97 22.55 40.24 EU-15 : 12.21 109.38 16.38 74.32 97.64 18.13 22.20 East. Europe : 5.17 58.57 1.31 41.58 52.97 3.32 8.75 Japan : 2.22 0.20 21.00 16.24 20.66 0.00 2.76 Mexico : 3.70 23.01 7.98 16.20 31.44 0.50 2.75 Southeast Asia : 1.24 13.18 3.23 11.42 16.11 0.60 0.94 South Korea : 0.86 0.35 7.60 6.06 8.31 0.00 0.50 Selected other : China : 46.54 114.65 1.54 93.83 129.42 6.20 27.10 FSU-12 6/ : 3.43 67.90 1.24 36.15 57.15 3.15 12.26 Russia : 1.20 40.85 0.57 20.94 33.79 1.55 7.27 Ukraine : 1.13 15.46 0.01 6.85 12.24 1.09 3.26 : : 1998/99 (Estimated) :World 3/ : 135.57 878.20 102.74 573.67 871.53 103.93 142.25United States : 38.15 271.55 2.98 156.55 210.27 53.14 49.28Total foreign : 97.42 606.65 99.77 417.12 661.26 50.79 92.97 Major exporters 4/ : 9.40 60.23 1.79 35.71 45.80 16.82 8.79 Argentina : 2.41 18.45 0.01 7.08 9.20 9.70 1.98 Australia : 1.14 8.57 0.00 3.95 5.13 3.50 1.08 Canada : 4.30 26.50 0.77 20.27 23.71 3.42 4.44 Major importers 5/ : 40.24 198.82 61.00 170.82 233.94 26.88 39.24 EU-15 : 22.20 104.86 16.57 72.73 96.23 23.50 23.90 East. Europe : 8.75 51.10 0.69 40.00 51.24 3.08 6.22 Japan : 2.76 0.15 20.34 16.34 20.74 0.00 2.50 Mexico : 2.75 24.40 7.86 16.79 32.54 0.10 2.38 Southeast Asia : 0.94 15.85 2.55 12.49 17.54 0.20 1.61 South Korea : 0.50 0.49 7.41 5.71 7.91 0.00 0.48 Selected other : China : 27.10 135.65 2.85 95.80 131.35 3.05 31.20 FSU-12 6/ : 12.26 37.94 1.84 25.98 45.59 1.75 4.70 Russia : 7.27 18.95 1.30 13.45 25.60 0.20 1.72 Ukraine : 3.26 10.45 0.00 6.03 11.12 1.07 1.53===============================================================================1/ Aggregate of local marketing years. 2/ Total foreign and world useadjusted to reflect the differences in world imports and exports. 3/ Worldimports and exports may not balance due to differences in marketing years,grain in transit and reporting discrepancies in some countries. 4/ Argentina,Australia, Canada, and South Africa. 5/ Eastern Europe, the EU-15 (includesintra-trade), Non-EU Western Europe, Mexico, Japan, South Korea, Taiwan, and Southeast Asia (includes Indonesia, Malaysia, Philippines, and Thailand). 6/ Includes imports and exports among the nations of the former USSR. FormerUSSR excluding the Baltic States.

WASDE-351-19 World Coarse Grain Supply and Use 1/ (Cont'd.) (Million Metric Tons)=============================================================================== : Supply : Use : :=========================:=======================:Ending Region : : : : Domestic 2/ : :stocks :Beginning:Produc-: :===============: : : stocks : tion :Imports: Feed : Total :Exports:=============================================================================== : : 1999/00 (Projected)World 3/ : May : 142.59 884.68 102.92 578.70 882.39 107.25 144.89 June : 142.25 880.21 103.12 577.93 881.52 107.39 140.95United States : May : 50.53 262.38 2.82 155.63 211.05 52.50 52.18 June : 49.28 262.38 2.82 155.63 211.05 52.76 50.67Total foreign : May : 92.06 622.31 100.10 423.08 671.34 54.75 92.71 June : 92.97 617.84 100.30 422.31 670.47 54.64 90.28 Major exporters 4/ : May : 8.44 62.33 1.30 35.66 46.11 18.69 7.27 June : 8.79 61.73 1.29 35.56 46.06 17.98 7.78 Argentina May : 1.88 20.12 0.01 7.38 9.49 10.81 1.71 Jun : 1.98 20.12 0.01 7.38 9.50 10.80 1.81 Australia May : 0.93 7.91 0.01 3.78 4.99 3.20 0.66 Jun : 1.08 7.81 0.00 3.68 4.88 3.20 0.81 Canada May : 4.44 25.85 1.03 20.09 23.83 3.73 3.76 Jun : 4.44 25.35 1.03 20.09 23.88 3.03 3.91 Major importers 5/ : May : 39.23 195.12 61.90 170.03 233.38 27.45 35.43 June : 39.24 194.85 62.61 170.80 233.80 28.24 34.66 EU-15 May : 23.87 102.15 16.93 72.58 95.96 24.27 22.73 Jun : 23.90 102.28 16.98 72.61 96.11 24.29 22.76 East. Europe May : 6.22 51.12 0.90 38.74 49.81 2.98 5.46 Jun : 6.22 50.72 0.90 38.34 49.43 3.76 4.66 Japan May : 2.51 0.16 20.24 16.24 20.64 0.00 2.27 Jun : 2.50 0.16 20.24 16.24 20.64 0.00 2.26 Mexico May : 2.40 25.08 7.94 17.58 33.39 0.10 1.93 Jun : 2.38 25.08 8.23 17.90 33.65 0.10 1.93 Southeast Asia May : 1.61 14.26 2.65 12.04 17.62 0.10 0.80 Jun : 1.61 14.26 2.65 12.59 17.62 0.10 0.80 South Korea May : 0.48 0.49 7.96 6.31 8.41 0.00 0.52 Jun : 0.48 0.49 8.31 6.56 8.76 0.00 0.52 Selected other : China May : 30.70 141.10 3.00 99.60 135.55 4.05 35.20 Jun : 31.20 141.10 3.00 99.60 135.55 4.05 35.70 FSU-12 6/ May : 4.59 50.62 0.78 27.06 46.72 2.59 6.68 Jun : 4.70 46.82 0.74 25.95 45.55 2.59 4.11 Russia May : 1.55 28.90 0.25 14.30 26.40 1.05 3.25 Jun : 1.72 26.20 0.25 13.30 25.45 1.05 1.67 Ukraine May : 1.59 13.05 0.00 6.48 11.54 1.26 1.84 Jun : 1.53 11.95 0.00 6.38 11.37 1.26 0.85===============================================================================1/ Aggregate of local marketing years. 2/ Total foreign and world useadjusted to reflect the differences in world imports and exports. 3/ Worldimports and exports may not balance due to differences in marketing years,grain in transit and reporting discrepancies in some countries. 4/ Argentina,Australia, Canada, and South Africa. 5/ Eastern Europe, the EU-15 (includesintra-trade), Non-EU Western Europe, Mexico, Japan, South Korea, Taiwan, andSoutheast Asia (includes Indonesia, Malaysia, Philippines, and Thailand). 6/ Includes imports and exports among the nations of the former USSR. FormerUSSR excluding the Baltic States.

WASDE-351-20 World Corn Supply and Use 1/ (Million Metric Tons)=============================================================================== : Supply : Use : :=========================:=======================:Ending Region : : : : Domestic 2/ : :stocks :Beginning:Produc-: :===============: : : stocks : tion :Imports: Feed : Total :Exports:=============================================================================== : : 1997/98 :World 3/ : 93.11 573.62 71.16 406.90 580.22 72.19 86.52United States : 22.43 233.86 0.22 139.83 185.09 38.21 33.22Total foreign : 70.68 339.76 70.93 267.06 395.13 33.97 53.30 Major exporters 4/ : 3.20 26.90 0.10 9.04 13.64 13.40 3.16 Argentina : 0.75 19.36 0.00 4.80 6.35 12.15 1.61 South Africa : 2.45 7.54 0.10 4.24 7.29 1.25 1.55 Major importers 5/ : 13.61 100.88 47.42 94.45 132.54 12.76 16.62 EU-15 : 3.28 38.60 10.22 30.69 38.82 8.91 4.38 Japan : 0.93 0.00 16.42 11.80 15.90 0.00 1.45 Mexico : 2.45 16.93 4.38 7.01 21.76 0.50 1.50 Southeast Asia : 1.24 12.98 3.23 11.23 15.91 0.60 0.94 South Korea : 0.86 0.09 7.53 6.05 7.98 0.00 0.50 Selected other : China : 45.00 104.30 0.28 91.00 117.41 6.17 26.00 FSU-12 6/ : 1.11 10.70 0.33 5.37 8.48 0.82 2.84 Russia : 0.16 2.70 0.19 1.55 2.49 0.00 0.56 : : 1998/99 (Estimated) :World 3/ : 86.52 592.59 71.96 407.78 581.64 72.50 97.47United States : 33.22 247.94 0.46 142.88 190.13 47.63 43.87Total foreign : 53.30 344.65 71.51 264.90 391.51 24.87 53.61 Major exporters 4/ : 3.16 20.30 0.85 8.60 13.20 8.70 2.41 Argentina : 1.61 14.00 0.00 4.40 6.00 8.50 1.11 South Africa : 1.55 6.30 0.85 4.20 7.20 0.20 1.30 Major importers 5/ : 16.62 93.44 46.27 92.00 130.68 11.34 14.30 EU-15 : 4.38 34.50 10.66 29.21 37.29 8.61 3.63 Japan : 1.45 0.00 16.00 12.10 16.20 0.00 1.26 Mexico : 1.50 17.50 4.75 7.00 22.25 0.10 1.40 Southeast Asia : 0.94 15.65 2.55 12.30 17.34 0.20 1.61 South Korea : 0.50 0.08 7.25 5.65 7.35 0.00 0.48 Selected other : China : 26.00 124.00 0.35 93.00 117.35 3.00 30.00 FSU-12 6/ : 2.84 5.39 0.76 4.31 6.97 0.50 1.52 Russia : 0.56 0.80 0.65 1.15 1.85 0.00 0.16===============================================================================1/ Aggregate of local marketing years. 2/ Total foreign and world useadjusted to reflect the differences in world imports and exports. 3/ Worldimports and exports may not balance due to differences in marketing years,grain in transit and reporting discrepancies in some countries. 4/ Argentina and South Africa. 5/ Eastern Europe, the EU-15 (includes intra-trade), Non-EUWestern Europe, Mexico, Japan, South Korea, Taiwan, and Southeast Asia(includes Indonesia, Malaysia, Philippines, and Thailand). 6/ Includesimports and exports among the nations of the former USSR. Former USSRexcluding the Baltic States.

WASDE-351-21 World Corn Supply and Use 1/ (Cont'd.) (Million Metric Tons)=============================================================================== : Supply : Use : :=========================:=======================:Ending Region : : : : Domestic 2/ : :stocks :Beginning:Produc-: :===============: : : stocks : tion :Imports: Feed : Total :Exports:=============================================================================== : : 1999/00 (Projected)World 3/ : May : 97.92 601.49 71.09 416.09 595.94 74.70 103.47 June : 97.47 600.49 71.44 416.47 596.39 75.20 101.58United States : May : 45.06 239.91 0.25 142.88 191.78 46.99 46.46 June : 43.87 239.91 0.25 142.88 191.78 46.99 45.26Total foreign : May : 52.86 361.58 70.84 273.21 404.16 27.71 57.01 June : 53.61 360.58 71.19 273.58 404.61 28.21 56.31 Major exporters 4/ : May : 2.31 23.50 0.10 8.60 13.20 10.45 2.26 June : 2.41 23.50 0.10 8.60 13.20 10.45 2.36 Argentina May : 1.11 15.50 0.00 4.40 6.00 9.50 1.11 Jun : 1.11 15.50 0.00 4.40 6.00 9.50 1.11 South Africa May : 1.20 8.00 0.10 4.20 7.20 0.95 1.15 Jun : 1.30 8.00 0.10 4.20 7.20 0.95 1.25 Major importers 5/ : May : 14.30 95.68 46.84 93.94 133.08 11.24 12.50 June : 14.30 95.18 47.19 94.54 133.23 12.04 11.40 EU-15 May : 3.63 36.03 10.91 30.34 38.42 8.71 3.44 Jun : 3.63 35.53 10.91 30.34 38.42 8.71 2.94 Japan May : 1.26 0.00 15.90 12.00 16.10 0.00 1.06 Jun : 1.26 0.00 15.90 12.00 16.10 0.00 1.06 Mexico May : 1.40 18.50 4.75 7.75 23.00 0.10 1.55 Jun : 1.40 18.50 4.75 7.75 23.00 0.10 1.55 Southeast Asia May : 1.61 14.06 2.65 11.85 17.42 0.10 0.80 Jun : 1.61 14.06 2.65 12.40 17.42 0.10 0.80 South Korea May : 0.48 0.09 7.65 6.10 7.70 0.00 0.52 Jun : 0.48 0.09 8.00 6.35 8.05 0.00 0.52 Selected other : China May : 29.50 130.00 0.25 96.50 121.25 4.00 34.50 Jun : 30.00 130.00 0.25 96.50 121.25 4.00 35.00 FSU-12 6/ May : 1.52 8.21 0.16 4.72 7.27 0.70 1.91 Jun : 1.52 7.71 0.16 4.72 7.27 0.70 1.41 Russia May : 0.16 2.00 0.05 1.15 1.85 0.00 0.36 Jun : 0.16 1.80 0.05 1.15 1.85 0.00 0.16===============================================================================1/ Aggregate of local marketing years. 2/ Total foreign and world useadjusted to reflect the differences in world imports and exports. 3/ Worldimports and exports may not balance due to differences in marketing years,grain in transit and reporting discrepancies in some countries. 4/ Argentina and South Africa. 5/ Eastern Europe, the EU-15 (includes intra-trade),Non-EU Western Europe, Mexico, Japan, South Korea, Taiwan, and Southeast Asia (includes Indonesia, Malaysia, Philippines, and Thailand). 6/ Includesimports and exports among the nations of the former USSR. Former USSRexcluding the Baltic States.

WASDE-351-22 World Rice Supply and Use (Milled Basis) 1/ (Million Metric Tons)=============================================================================== : Supply : Use : :=========================:===================: Ending Region : : : : : : stocks :Beginning:Produc-: : Total 2/: : : stocks : tion :Imports: Domestic: Exports :=============================================================================== : : 1997/98 :World 3/ : 51.10 385.40 24.52 383.65 26.98 52.85United States : 0.87 5.98 0.29 3.45 2.78 0.90Total foreign : 50.23 379.42 24.23 380.20 24.20 51.95 Major exporters 4/ : 10.65 120.55 0.00 104.24 15.54 11.41 Thailand : 0.71 15.05 0.00 8.60 6.37 0.79 Vietnam : 0.00 18.87 0.00 15.10 3.78 0.00 Major importers 5/ : 5.87 48.78 13.85 61.83 1.41 5.25 Indonesia : 1.53 30.63 6.08 36.04 0.00 2.20 Selected other : China : 25.56 140.49 0.26 135.85 3.73 26.72 Japan : 3.25 9.12 0.46 9.20 0.57 3.05 : : 1998/99 (Estimated) :World 3/ : 52.85 382.18 22.97 386.56 23.72 48.46United States : 0.90 6.14 0.31 3.58 2.78 1.00Total foreign : 51.95 376.04 22.66 382.99 20.94 47.46 Major exporters 4/ : 11.41 121.45 0.00 106.45 14.35 12.06 Thailand : 0.79 14.30 0.00 8.70 5.50 0.89 Vietnam : 0.00 18.50 0.00 15.00 3.50 0.00 Major importers 5/ : 5.25 52.25 10.57 61.38 1.21 5.49 Indonesia : 2.20 32.10 2.50 35.20 0.00 1.60 Selected other : China : 26.72 133.00 0.30 136.75 1.75 21.52 Japan : 3.05 8.15 0.75 9.20 0.40 2.35 : : 1999/00 (Projected)World 3/ : May : 46.74 388.76 23.50 388.50 23.50 47.00 June : 48.46 389.76 23.50 389.00 23.50 49.22United States : May : 0.99 6.76 0.31 3.67 2.74 1.65 June : 1.00 6.76 0.32 3.67 2.74 1.67Total foreign : May : 45.74 382.00 23.19 384.83 20.76 45.35 June : 47.46 383.00 23.18 385.33 20.76 47.56===============================================================================1/ Aggregate of local marketing years. 2/ Total foreign and world useadjusted to reflect the differences in world imports and exports. 3/ Worldimports and exports may not balance due to differences in some countries. 4/ India, Pakistan, Thailand, and Vietnam. 5/ Brazil, Hong Kong, Indonesia, Iran, Iraq, Ivory Coast, Nigeria, Philippines, Saudi Arabia, the EU-15(includes intra-trade) and Non-EU Western Europe.

WASDE-351-23 World Soybean Supply and Use 1/ (Million Metric Tons)=============================================================================== : Supply : Use : :=========================:=======================:Ending Region : : : : : :stocks :Beginning:Produc-: : Domestic : : : stocks : tion :Imports: Crush : Total :Exports:=============================================================================== : : 1996/97World 2/ : 17.53 132.19 36.24 115.34 135.58 36.91 13.47United States : 4.99 64.78 0.24 39.08 42.43 24.00 3.59Total foreign : 12.53 67.41 36.00 76.26 93.15 12.91 9.88 Major exporters 3/ : 10.02 41.27 1.20 31.49 33.82 11.26 7.40 Argentina : 4.22 11.20 0.30 11.05 11.56 0.75 3.40 Brazil : 5.80 27.30 0.90 19.90 21.64 8.36 4.00 Major importers 4/ : 1.76 16.40 27.43 31.32 43.25 0.56 1.78 EU-15 : 0.82 1.14 15.31 14.67 16.09 0.35 0.84 Japan : 0.55 0.15 5.04 3.81 5.11 0.00 0.64 China : 0.00 13.22 2.27 8.69 15.30 0.20 0.00 : : 1997/98 (Estimated)World 2/ : 13.47 157.73 39.94 126.96 149.38 40.39 21.38United States : 3.59 73.18 0.14 43.46 47.78 23.69 5.44Total foreign : 9.88 84.55 39.81 83.49 101.60 16.70 15.94 Major exporters 3/ : 7.40 54.69 2.35 33.40 36.52 14.37 13.55 Argentina : 3.40 19.20 1.45 13.00 13.77 3.23 7.05 Brazil : 4.00 32.50 0.90 19.90 22.15 8.75 6.50 Major importers 4/ : 1.78 18.27 30.20 35.62 47.59 0.93 1.73 EU-15 : 0.84 1.57 16.88 16.34 17.71 0.75 0.82 Japan : 0.64 0.15 4.87 3.72 5.02 0.00 0.63 China : 0.00 14.73 2.94 10.73 17.50 0.17 0.00 : : 1998/99 (Projected)World 2/ : May : 20.83 157.19 38.65 129.48 152.24 38.64 25.78 June : 21.38 157.18 38.45 129.36 152.78 38.55 25.68United States : May : 5.44 75.03 0.16 42.46 47.97 20.96 11.70 June : 5.44 75.03 0.16 42.46 47.97 20.96 11.70Total foreign : May : 15.39 82.16 38.49 87.02 104.28 17.68 14.08 June : 15.94 82.16 38.28 86.91 104.81 17.59 13.98 Major exporters 3/ : May : 13.00 52.70 1.90 37.80 40.40 15.45 11.75 June : 13.55 52.40 1.50 37.50 40.47 15.30 11.68 Argentina May : 7.05 18.50 0.90 16.00 16.77 3.30 6.38 Jun : 7.05 18.30 0.90 16.00 16.77 3.30 6.18 Brazil May : 5.95 31.00 1.00 21.20 22.93 9.65 5.37 Jun : 6.50 31.00 0.60 21.00 23.10 9.50 5.50 Major importers 4/ : May : 1.73 17.50 29.25 34.32 46.11 0.70 1.67 June : 1.73 17.30 29.61 34.37 46.26 0.70 1.67 EU-15 May : 0.82 1.74 15.62 15.52 16.77 0.52 0.89 Jun : 0.82 1.54 15.83 15.52 16.77 0.52 0.89 Japan May : 0.63 0.16 4.60 3.54 4.84 0.00 0.55 Jun : 0.63 0.16 4.60 3.54 4.84 0.00 0.55 China May : 0.00 13.80 3.45 10.30 17.07 0.18 0.00 Jun : 0.00 13.80 3.45 10.30 17.07 0.18 0.00===============================================================================1/ Data based on local marketing years except Argentina and Brazil which areadjusted to an October-September year. 2/ World imports and exports may notbalance due to differences in local marketing years and to time lags betweenreported export and imports. Therefore, world supply may not equal world use. 3/ Argentina, Brazil and Paraguay. 4/ Japan, China, and EU, Mexico, andSoutheast Asia (includes Indonesia, Malaysia, Philippines, and Thailand).
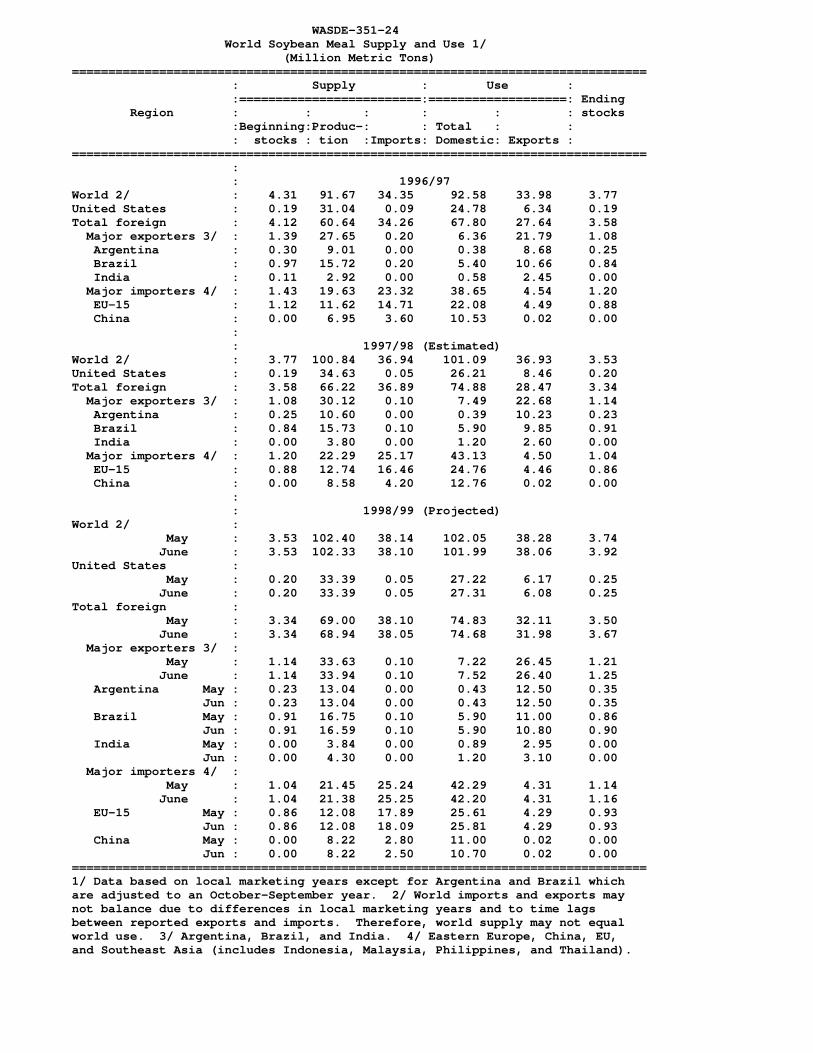
WASDE-351-24 World Soybean Meal Supply and Use 1/ (Million Metric Tons)=============================================================================== : Supply : Use : :=========================:===================: Ending Region : : : : : : stocks :Beginning:Produc-: : Total : : : stocks : tion :Imports: Domestic: Exports :=============================================================================== : : 1996/97World 2/ : 4.31 91.67 34.35 92.58 33.98 3.77United States : 0.19 31.04 0.09 24.78 6.34 0.19Total foreign : 4.12 60.64 34.26 67.80 27.64 3.58 Major exporters 3/ : 1.39 27.65 0.20 6.36 21.79 1.08 Argentina : 0.30 9.01 0.00 0.38 8.68 0.25 Brazil : 0.97 15.72 0.20 5.40 10.66 0.84 India : 0.11 2.92 0.00 0.58 2.45 0.00 Major importers 4/ : 1.43 19.63 23.32 38.65 4.54 1.20 EU-15 : 1.12 11.62 14.71 22.08 4.49 0.88 China : 0.00 6.95 3.60 10.53 0.02 0.00 : : 1997/98 (Estimated)World 2/ : 3.77 100.84 36.94 101.09 36.93 3.53United States : 0.19 34.63 0.05 26.21 8.46 0.20Total foreign : 3.58 66.22 36.89 74.88 28.47 3.34 Major exporters 3/ : 1.08 30.12 0.10 7.49 22.68 1.14 Argentina : 0.25 10.60 0.00 0.39 10.23 0.23 Brazil : 0.84 15.73 0.10 5.90 9.85 0.91 India : 0.00 3.80 0.00 1.20 2.60 0.00 Major importers 4/ : 1.20 22.29 25.17 43.13 4.50 1.04 EU-15 : 0.88 12.74 16.46 24.76 4.46 0.86 China : 0.00 8.58 4.20 12.76 0.02 0.00 : : 1998/99 (Projected)World 2/ : May : 3.53 102.40 38.14 102.05 38.28 3.74 June : 3.53 102.33 38.10 101.99 38.06 3.92United States : May : 0.20 33.39 0.05 27.22 6.17 0.25 June : 0.20 33.39 0.05 27.31 6.08 0.25Total foreign : May : 3.34 69.00 38.10 74.83 32.11 3.50 June : 3.34 68.94 38.05 74.68 31.98 3.67 Major exporters 3/ : May : 1.14 33.63 0.10 7.22 26.45 1.21 June : 1.14 33.94 0.10 7.52 26.40 1.25 Argentina May : 0.23 13.04 0.00 0.43 12.50 0.35 Jun : 0.23 13.04 0.00 0.43 12.50 0.35 Brazil May : 0.91 16.75 0.10 5.90 11.00 0.86 Jun : 0.91 16.59 0.10 5.90 10.80 0.90 India May : 0.00 3.84 0.00 0.89 2.95 0.00 Jun : 0.00 4.30 0.00 1.20 3.10 0.00 Major importers 4/ : May : 1.04 21.45 25.24 42.29 4.31 1.14 June : 1.04 21.38 25.25 42.20 4.31 1.16 EU-15 May : 0.86 12.08 17.89 25.61 4.29 0.93 Jun : 0.86 12.08 18.09 25.81 4.29 0.93 China May : 0.00 8.22 2.80 11.00 0.02 0.00 Jun : 0.00 8.22 2.50 10.70 0.02 0.00===============================================================================1/ Data based on local marketing years except for Argentina and Brazil whichare adjusted to an October-September year. 2/ World imports and exports maynot balance due to differences in local marketing years and to time lagsbetween reported exports and imports. Therefore, world supply may not equalworld use. 3/ Argentina, Brazil, and India. 4/ Eastern Europe, China, EU,and Southeast Asia (includes Indonesia, Malaysia, Philippines, and Thailand).

WASDE-351-25 World Soybean Oil Supply and Use 1/ (Million Metric Tons)=============================================================================== : Supply : Use : :=========================:===================: Ending Region : : : : : : stocks :Beginning:Produc-: : Total : : : stocks : tion :Imports: Domestic: Exports :=============================================================================== : : 1996/97World 2/ : 2.65 20.65 5.79 20.62 5.94 2.54United States : 0.91 7.14 0.02 6.47 0.92 0.69Total foreign : 1.73 13.51 5.77 14.15 5.01 1.85 Major exporters 3/ : 0.85 8.27 0.64 4.50 4.40 0.86 Argentina : 0.28 1.91 0.00 0.10 1.79 0.30 Brazil : 0.38 3.72 0.18 2.60 1.29 0.38 EU-15 : 0.20 2.63 0.46 1.80 1.32 0.17 Major importers 4/ : 0.37 2.05 1.93 3.80 0.08 0.47 China : 0.35 1.39 1.67 2.89 0.08 0.45 Pakistan : 0.02 0.01 0.21 0.21 0.00 0.02 : : 1997/98 (Estimated)World 2/ : 2.54 23.08 6.78 22.85 6.98 2.57United States : 0.69 8.23 0.03 6.92 1.40 0.63Total foreign : 1.85 14.85 6.75 15.92 5.58 1.94 Major exporters 3/ : 0.86 8.93 0.70 4.67 4.94 0.87 Argentina : 0.30 2.25 0.00 0.10 2.17 0.28 Brazil : 0.38 3.74 0.20 2.72 1.18 0.42 EU-15 : 0.17 2.94 0.50 1.84 1.59 0.17 Major importers 4/ : 0.47 2.64 2.11 4.54 0.08 0.60 China : 0.45 1.78 1.65 3.22 0.08 0.58 Pakistan : 0.02 0.00 0.23 0.23 0.00 0.02 : : 1998/99 (Projected)World 2/ : May : 2.58 23.46 7.33 23.67 7.34 2.37 June : 2.57 23.46 7.30 23.75 7.27 2.32United States : May : 0.63 7.99 0.03 6.94 1.11 0.59 June : 0.63 7.96 0.03 6.99 1.04 0.59Total foreign : May : 1.96 15.48 7.31 16.73 6.23 1.78 June : 1.94 15.50 7.27 16.76 6.22 1.73 Major exporters 3/ : May : 0.87 9.52 0.70 4.68 5.56 0.86 June : 0.87 9.48 0.70 4.68 5.56 0.82 Argentina May : 0.28 2.77 0.00 0.11 2.65 0.29 Jun : 0.28 2.77 0.00 0.11 2.65 0.29 Brazil May : 0.42 3.97 0.21 2.72 1.45 0.42 Jun : 0.42 3.93 0.21 2.72 1.45 0.38 EU-15 May : 0.17 2.79 0.49 1.85 1.46 0.15 Jun : 0.17 2.79 0.49 1.85 1.46 0.15 Major importers 4/ : May : 0.60 2.60 2.32 4.97 0.08 0.47 June : 0.60 2.70 2.30 5.05 0.08 0.47 China May : 0.58 1.72 1.65 3.42 0.08 0.45 Jun : 0.58 1.72 1.65 3.42 0.08 0.45 Pakistan May : 0.02 0.01 0.28 0.28 0.00 0.02 Jun : 0.02 0.01 0.26 0.26 0.00 0.02===============================================================================1/ Data based on local marketing years except for Argentina and Brazil whichare adjusted to an October-September year. 2/ World imports and exports maynot balance due to differences in local marketing years and to time lagsbetween reported exports and imports. Therefore, world supply may not equalworld use. 3/ Argentina, Brazil and EU. 4/ India, China and Pakistan.

WASDE-351-26 World Cotton Supply and Use 1/ (Million 480-pound bales)=============================================================================== : Supply : Use : : Region :=========================:================: Loss :Ending :Beginning:Produc-:Imports:Domestic:Exports: 2/ :stocks : stocks : tion : 3/ : : 3/ : :=============================================================================== : 1997/98 :World : 38.18 91.60 26.49 88.51 26.61 0.30 40.85United States : 3.97 18.79 0.01 11.35 7.50 0.04 3.89Total foreign : 34.20 72.81 26.48 77.16 19.11 0.26 36.96 Major exporters 5/ : 11.88 39.82 0.51 24.03 15.86 0.07 12.26 Pakistan : 1.82 7.18 0.12 7.19 0.38 0.03 1.52 India : 4.68 12.26 0.15 12.68 0.31 0.00 4.10 Central Asia 6/ : 1.49 7.14 0.01 1.19 5.85 0.00 1.60 Afr. Fr. Zone 7/ : 0.49 4.32 4/ 0.31 3.59 0.00 0.91 S. Hemis. 8/ : 2.33 5.75 0.23 1.26 4.50 0.02 2.52 Australia : 0.95 3.06 4/ 0.20 2.71 0.00 1.10 Argentina : 1.04 1.41 0.03 0.43 1.00 0.01 1.04 Major importers : 20.53 29.75 20.39 45.65 1.95 0.18 22.89 Brazil : 1.26 1.75 1.88 3.40 0.00 0.00 1.49 Mexico : 0.20 0.98 1.60 2.05 0.30 0.04 0.40 China : 14.76 21.10 1.83 20.80 0.03 0.00 16.86 Europe : 1.88 2.23 6.02 6.68 1.40 0.05 2.00 Turkey : 0.56 3.65 1.45 5.00 0.10 0.00 0.56 Selected Asia 9/ : 1.88 0.05 7.60 7.72 0.12 0.10 1.60 Indonesia : 0.10 0.02 1.92 1.85 0.00 0.05 0.14 South Korea : 0.51 4/ 1.32 1.35 0.05 0.00 0.43 : : 1998/99 (Estimated) :World : 40.85 84.35 24.50 84.71 23.60 0.30 41.08United States : 3.89 13.92 0.40 10.50 4.10 0.01 3.60Total foreign : 36.96 70.43 24.10 74.21 19.50 0.30 37.48 Major exporters 5/ : 12.26 37.58 1.21 23.37 15.40 0.07 12.21 Pakistan : 1.52 6.30 0.65 7.10 0.01 0.03 1.34 India : 4.10 12.80 0.35 12.20 0.15 0.00 4.90 Central Asia 6/ : 1.60 6.60 0.01 1.19 5.45 0.00 1.57 Afr. Fr. Zone 7/ : 0.91 4.04 4/ 0.31 3.75 0.00 0.89 S. Hemis. 8/ : 2.52 5.22 0.20 1.24 4.44 0.02 2.23 Australia : 1.10 3.10 4/ 0.19 2.90 0.00 1.12 Argentina : 1.04 1.00 0.02 0.44 0.85 0.01 0.76 Major importers : 22.89 29.81 17.72 44.02 2.83 0.22 23.34 Brazil : 1.49 2.00 1.35 3.25 0.00 0.00 1.59 Mexico : 0.40 1.00 1.45 2.20 0.25 0.04 0.36 China : 16.86 20.70 0.40 20.00 0.70 0.00 17.26 Europe : 2.00 2.21 5.68 6.39 1.49 0.09 1.92 Turkey : 0.56 3.85 0.70 4.20 0.30 0.00 0.61 Selected Asia 9/ : 1.60 0.05 8.14 7.99 0.10 0.10 1.61 Indonesia : 0.14 0.02 2.20 2.15 0.00 0.05 0.16 South Korea : 0.43 4/ 1.38 1.38 0.04 0.00 0.40===============================================================================1/ Marketing year beginning August 1. Totals may not add exactly and trademay not balance due to rounding and other factors. 2/ For foreign countries,reflects cotton lost or destroyed in the marketing channel; for the UnitedStates, reflects the difference between implicit stocks based on supply lesstotal use and ending stocks based on Bureau of Census data. 3/ World tradeincludes estimated trade among the 12 countries of the former USSR and threeBaltic states 1.81 million bales in 1997/98 and 1.68 million in 1998/99. 4/Less than 5,000 bales. 5/ Includes Egypt, and Syria in addition to thecountries and regions listed. 6/ Azerbaijan, Kazakhstan, Kyrgyzstan,Tajikistan, Turkmenistan, and Uzbekistan. 7/ Benin, Burkino Faso, Cameroon,Central African Republic, Chad, Cote d'Ivoire, Mali, Niger, Senegal, and Togo. 8/ Argentina, Australia, Paraguay, South Africa, Tanzania, and Zimbabwe. 9/ Hong Kong, Indonesia, Japan, South Korea, Taiwan, and Thailand.

WASDE-351-27 World Cotton Supply and Use 1/ (Million 480-pound bales)=============================================================================== : Supply : Use : : Region :=========================:================: Loss :Ending :Beginning:Produc-:Imports:Domestic:Exports: 2/ :stocks : stocks : tion : : : : :=============================================================================== : : 1999/00 (Projected)World : May : 41.23 87.00 25.30 86.50 25.00 0.30 41.73 June : 41.08 87.00 25.30 86.50 25.00 0.30 41.58United States : May : 3.60 18.00 0.05 10.60 5.50 0.05 5.50 June : 3.60 18.00 0.05 10.60 5.50 0.05 5.50Total foreign : May : 37.63 69.00 25.25 75.90 19.50 0.25 36.23 June : 37.48 69.00 25.25 75.90 19.50 0.25 36.08===============================================================================1/ Marketing year beginning August 1. Totals may not add exactly and trademay not balance due to rounding and other factors. 2/ For foreign countries,reflects cotton lost or destroyed in the marketing channel; for the UnitedStates, reflects the difference between implicit stocks based on supply lesstotal use and ending stocks based on Bureau of Census data.
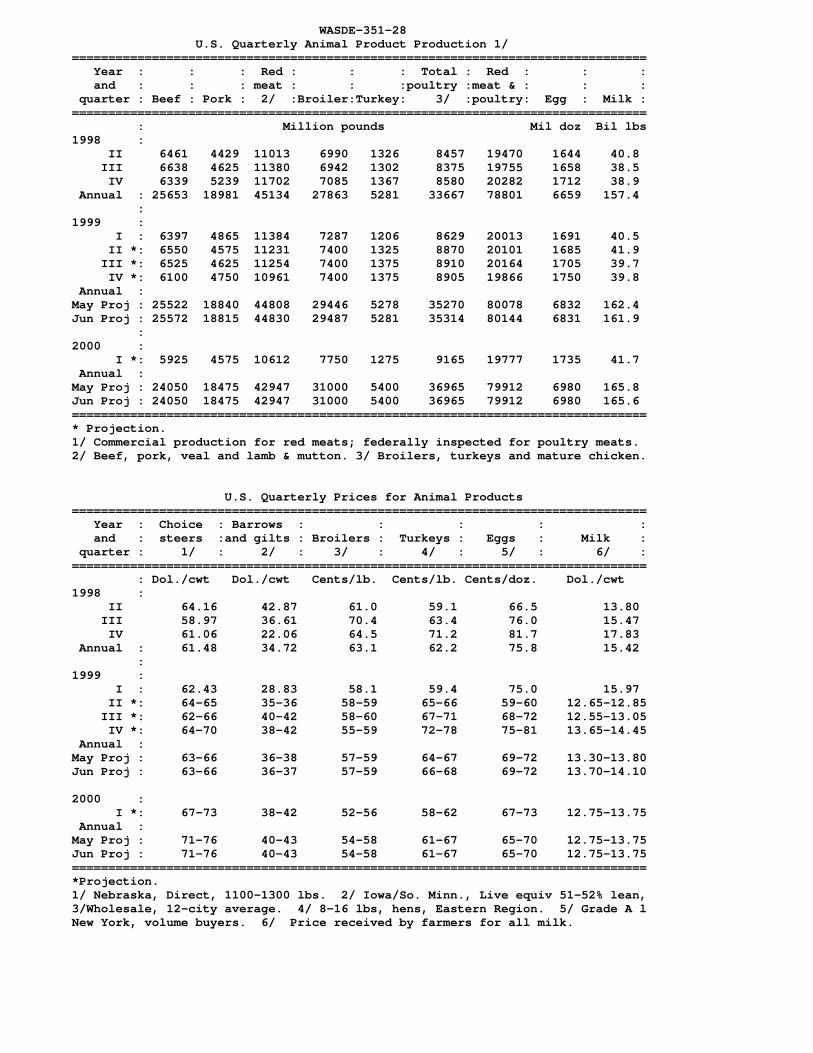
WASDE-351-28 U.S. Quarterly Animal Product Production 1/=============================================================================== Year : : : Red : : : Total : Red : : : and : : : meat : : :poultry :meat & : : : quarter : Beef : Pork : 2/ :Broiler:Turkey: 3/ :poultry: Egg : Milk :=============================================================================== : Million pounds Mil doz Bil lbs1998 : II 6461 4429 11013 6990 1326 8457 19470 1644 40.8 III 6638 4625 11380 6942 1302 8375 19755 1658 38.5 IV 6339 5239 11702 7085 1367 8580 20282 1712 38.9 Annual : 25653 18981 45134 27863 5281 33667 78801 6659 157.4 :1999 : I : 6397 4865 11384 7287 1206 8629 20013 1691 40.5 II *: 6550 4575 11231 7400 1325 8870 20101 1685 41.9 III *: 6525 4625 11254 7400 1375 8910 20164 1705 39.7 IV *: 6100 4750 10961 7400 1375 8905 19866 1750 39.8 Annual :May Proj : 25522 18840 44808 29446 5278 35270 80078 6832 162.4Jun Proj : 25572 18815 44830 29487 5281 35314 80144 6831 161.9 :2000 : I *: 5925 4575 10612 7750 1275 9165 19777 1735 41.7 Annual :May Proj : 24050 18475 42947 31000 5400 36965 79912 6980 165.8Jun Proj : 24050 18475 42947 31000 5400 36965 79912 6980 165.6===============================================================================* Projection. 1/ Commercial production for red meats; federally inspected for poultry meats.2/ Beef, pork, veal and lamb & mutton. 3/ Broilers, turkeys and mature chicken.
U.S. Quarterly Prices for Animal Products=============================================================================== Year : Choice : Barrows : : : : : and : steers :and gilts : Broilers : Turkeys : Eggs : Milk : quarter : 1/ : 2/ : 3/ : 4/ : 5/ : 6/ :=============================================================================== : Dol./cwt Dol./cwt Cents/lb. Cents/lb. Cents/doz. Dol./cwt1998 : II 64.16 42.87 61.0 59.1 66.5 13.80 III 58.97 36.61 70.4 63.4 76.0 15.47 IV 61.06 22.06 64.5 71.2 81.7 17.83 Annual : 61.48 34.72 63.1 62.2 75.8 15.42 :1999 : I : 62.43 28.83 58.1 59.4 75.0 15.97 II *: 64-65 35-36 58-59 65-66 59-60 12.65-12.85 III *: 62-66 40-42 58-60 67-71 68-72 12.55-13.05 IV *: 64-70 38-42 55-59 72-78 75-81 13.65-14.45 Annual :May Proj : 63-66 36-38 57-59 64-67 69-72 13.30-13.80Jun Proj : 63-66 36-37 57-59 66-68 69-72 13.70-14.10
2000 : I *: 67-73 38-42 52-56 58-62 67-73 12.75-13.75 Annual :May Proj : 71-76 40-43 54-58 61-67 65-70 12.75-13.75Jun Proj : 71-76 40-43 54-58 61-67 65-70 12.75-13.75===============================================================================*Projection. 1/ Nebraska, Direct, 1100-1300 lbs. 2/ Iowa/So. Minn., Live equiv 51-52% lean,3/Wholesale, 12-city average. 4/ 8-16 lbs, hens, Eastern Region. 5/ Grade A lNew York, volume buyers. 6/ Price received by farmers for all milk.
WASDE-351-29
U.S. Meats Supply and Use============================================================================ : Supply : Use :--------------------------------------------------------- : : : : : : : Consumption : : Pro- : : : : :--------------- : Beg- : duc- : : : : End- : : Per Item :inning: tion : Im- :Total : Ex- : ing : :capita :stocks: 1/ :ports :supply: ports:stocks:Total : 2/ ============================================================================ : Million pounds 3/BEEF : 1998 : 465 25760 2642 28867 2171 393 26303 68.1 1999 Proj. May : 393 25628 2705 28726 2435 370 25921 66.5 Jun : 393 25678 2708 28779 2449 370 25960 66.6 2000 Proj. May : 370 24156 2800 27326 2300 365 24661 62.8 Jun : 370 24156 2800 27326 2300 365 24661 62.8 :PORK : 1998 : 408 19011 704 20123 1229 586 18308 52.6 1999 Proj. May : 586 18870 700 20156 1250 475 18431 52.4 Jun : 586 18845 780 20211 1247 500 18464 52.5 2000 Proj. May : 475 18505 700 19680 1200 475 18005 50.8 Jun : 500 18505 700 19705 1200 475 18030 50.9 :TOTAL RED MEAT 4/ : 1998 : 895 45284 3458 49637 3406 996 45235 122.7 1999 Proj. May : 996 44957 3520 49473 3691 862 44920 120.8 Jun : 996 44979 3600 49575 3702 887 44986 121.0 2000 Proj. May : 862 43096 3621 47579 3506 855 43218 115.3 Jun : 887 43096 3621 47604 3506 855 43243 115.4 :BROILERS : 1998 : 607 27612 5 28225 4673 711 22841 72.6 1999 Proj. May : 711 29175 4 29890 4500 750 24640 78.5 Jun : 711 29216 4 29931 4512 800 24619 77.5 2000 Proj. May : 750 30709 4 31463 4575 800 26088 82.4 Jun : 800 30709 4 31513 4575 800 26138 81.6 :TURKEYS : 1998 : 415 5215 0 5630 446 304 4880 18.1 1999 Proj. May : 304 5212 1 5517 400 250 4866 17.8 Jun : 304 5215 1 5520 395 250 4874 17.9 2000 Proj. May : 250 5332 0 5582 400 300 4882 17.8 Jun : 250 5332 0 5582 400 300 4882 17.8 :TOTAL POULTRY 5/ : 1998 : 1029 33352 6 34387 5545 1022 27821 91.0 1999 Proj. May : 1022 34935 5 35962 5275 1005 29681 97.0 Jun : 1022 34978 6 36006 5283 1055 29667 96.1 2000 Proj. May : 1005 36607 4 37616 5357 1105 31154 100.9 Jun : 1055 36607 4 37666 5357 1105 31204 100.1 :RED MEAT & POULTRY: 1998 : 1924 78636 3464 84024 8950 2018 73057 213.7 1999 Proj. May : 2018 79892 3525 85435 8966 1867 74601 217.8 Jun : 2018 79957 3606 85581 8984 1942 74654 217.0 2000 Proj. May : 1867 79703 3625 85195 8863 1960 74373 216.2 Jun : 1942 79703 3625 85270 8863 1960 74448 215.5============================================================================1/ Total including farm production for red meats and, for poultry, federally inspected plus non-federally inspected, less condemnations. 2/ Pounds, retail-weight basis. 3/ Carcass weight for red meats andcertified ready-to-cook weight for poultry. 4/ Beef, pork, veal, lamb andmutton. 5/ Broilers, turkeys and mature chicken.
WASDE-351-30
U.S. Egg Supply and Use=============================================================================== : : : 1999 Projected : 2000 Projected : : :-----------------:----------------- Commodity : 1997 : 1998 : May : Jun : May : Jun===============================================================================EGGS : Million dozen Supply : Beginning stocks : 8.5 7.4 8.4 8.4 5.0 5.0 Production : 6473.1 6658.7 6832.0 6831.3 6980.0 6980.0 Imports : 6.9 5.8 4.0 5.0 4.0 4.0 Total supply : 6488.5 6672.0 6844.4 6844.7 6989.0 6989.0 : Use : Exports : 227.8 218.8 190.0 181.8 200.0 200.0 Hatching use : 894.7 921.8 963.5 963.5 1010.0 1010.0 Ending stocks : 7.4 8.4 5.0 5.0 5.0 5.0 Consumption : Total : 5358.6 5523.0 5685.9 5694.4 5774.0 5774.0 Per capita (number) : 240.0 245.2 250.2 250.6 252.0 252.0===============================================================================
U.S. Milk Supply, Use and Prices=============================================================================== : : : 1998/99 Proj 1/: 1999/00 Proj 1/ Commodity :1996/97:1997/98:-----------------:----------------- : 1/ : 1/ : May : Jun : May : Jun===============================================================================MILK : Billion poundsSupply : Beg. commercial stocks 2/ : 4.9 5.9 5.8 5.8 5.8 5.8 Production : 155.9 156.5 161.5 161.0 165.3 165.0 Farm use : 1.4 1.4 1.3 1.3 1.2 1.3 Marketings : 154.5 155.2 160.2 159.7 164.0 163.8 Imports 2/ : 2.8 4.0 3.7 4.0 3.4 3.5 Total cml. supply 2/ : 162.3 165.1 169.6 169.5 173.2 173.1Use : Commercial use 2/ 3/ : 155.6 158.6 163.5 163.4 166.7 166.6 Ending commercial stks. 2/: 5.9 5.8 5.8 5.8 5.6 5.6 CCC net removals: : Milkfat basis 4/ : 0.7 0.7 0.3 0.3 0.9 0.9 Skim-solids basis 4/ : 2.7 4.5 4.3 4.6 2.6 2.7 : : Dollars per cwtPrices rec'd. by farmers : Basic Formula (BFP) 5/ : 11.88 13.28 12.85- 13.05- 11.05- 11.15- : 13.05 13.25 12.05 12.15 All milk 6/ : 13.53 14.60 14.50- 14.75- 12.50- 12.65- : 14.70 14.95 13.50 13.65 : : Million poundsCCC product net removals 4/: Butter : 24 21 5 5 35 35 Cheese : 10 8 7 7 6 6 Nonfat dry milk : 222 368 360 385 215 225 Dry whole milk : 7 15 9 9 4 4===============================================================================Note: Totals may not add due to rounding. 1/ Marketing year beginning October 1. 2/ Milk equivalent, milkfat basis.3/ Includes commercial exports. 4/ Includes products exported under the DairyExport Incentive Program. 5/ Or equivalent after Federal Market OrderReform. 6/ Milk of average fat test. Does not reflect any deductionsfrom producers as authorized by legislation.
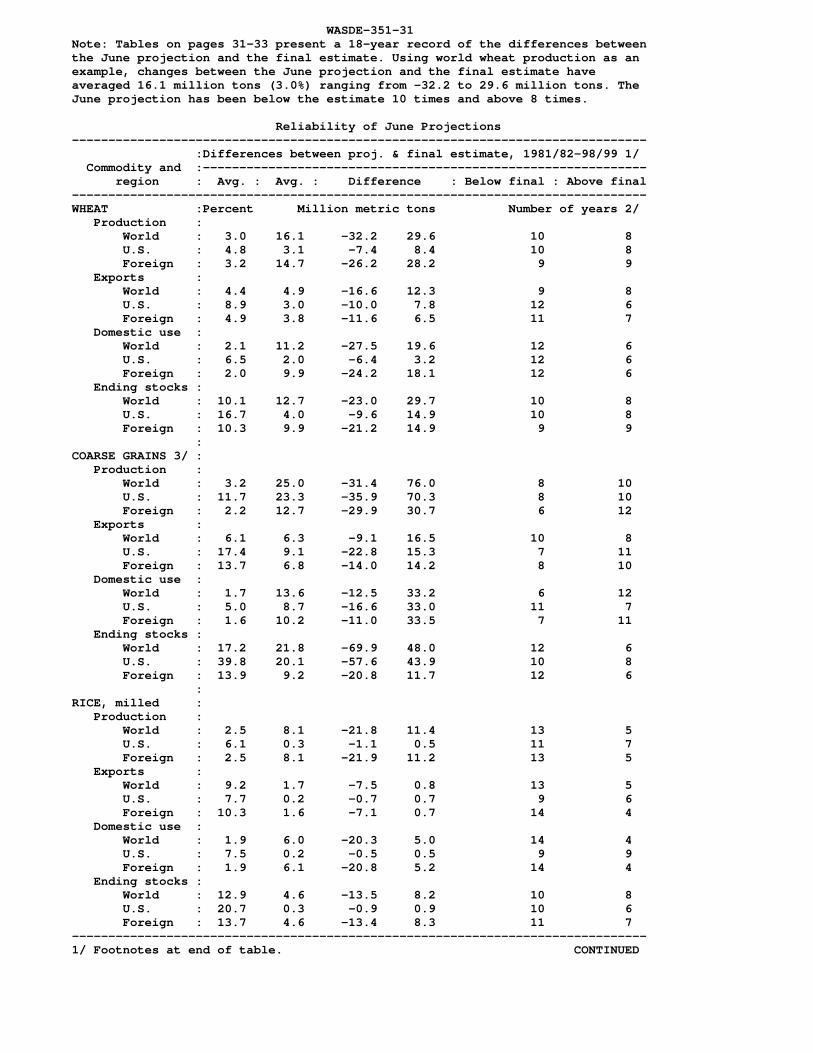
WASDE-351-31 Note: Tables on pages 31-33 present a 18-year record of the differences betweenthe June projection and the final estimate. Using world wheat production as an example, changes between the June projection and the final estimate haveaveraged 16.1 million tons (3.0%) ranging from -32.2 to 29.6 million tons. The June projection has been below the estimate 10 times and above 8 times. Reliability of June Projections------------------------------------------------------------------------------- :Differences between proj. & final estimate, 1981/82-98/99 1/ Commodity and :------------------------------------------------------------- region : Avg. : Avg. : Difference : Below final : Above final-------------------------------------------------------------------------------WHEAT :Percent Million metric tons Number of years 2/ Production : World : 3.0 16.1 -32.2 29.6 10 8 U.S. : 4.8 3.1 -7.4 8.4 10 8 Foreign : 3.2 14.7 -26.2 28.2 9 9 Exports : World : 4.4 4.9 -16.6 12.3 9 8 U.S. : 8.9 3.0 -10.0 7.8 12 6 Foreign : 4.9 3.8 -11.6 6.5 11 7 Domestic use : World : 2.1 11.2 -27.5 19.6 12 6 U.S. : 6.5 2.0 -6.4 3.2 12 6 Foreign : 2.0 9.9 -24.2 18.1 12 6 Ending stocks : World : 10.1 12.7 -23.0 29.7 10 8 U.S. : 16.7 4.0 -9.6 14.9 10 8 Foreign : 10.3 9.9 -21.2 14.9 9 9 :COARSE GRAINS 3/ : Production : World : 3.2 25.0 -31.4 76.0 8 10 U.S. : 11.7 23.3 -35.9 70.3 8 10 Foreign : 2.2 12.7 -29.9 30.7 6 12 Exports : World : 6.1 6.3 -9.1 16.5 10 8 U.S. : 17.4 9.1 -22.8 15.3 7 11 Foreign : 13.7 6.8 -14.0 14.2 8 10 Domestic use : World : 1.7 13.6 -12.5 33.2 6 12 U.S. : 5.0 8.7 -16.6 33.0 11 7 Foreign : 1.6 10.2 -11.0 33.5 7 11 Ending stocks : World : 17.2 21.8 -69.9 48.0 12 6 U.S. : 39.8 20.1 -57.6 43.9 10 8 Foreign : 13.9 9.2 -20.8 11.7 12 6 :RICE, milled : Production : World : 2.5 8.1 -21.8 11.4 13 5 U.S. : 6.1 0.3 -1.1 0.5 11 7 Foreign : 2.5 8.1 -21.9 11.2 13 5 Exports : World : 9.2 1.7 -7.5 0.8 13 5 U.S. : 7.7 0.2 -0.7 0.7 9 6 Foreign : 10.3 1.6 -7.1 0.7 14 4 Domestic use : World : 1.9 6.0 -20.3 5.0 14 4 U.S. : 7.5 0.2 -0.5 0.5 9 9 Foreign : 1.9 6.1 -20.8 5.2 14 4 Ending stocks : World : 12.9 4.6 -13.5 8.2 10 8 U.S. : 20.7 0.3 -0.9 0.9 10 6 Foreign : 13.7 4.6 -13.4 8.3 11 7-------------------------------------------------------------------------------1/ Footnotes at end of table. CONTINUED

WASDE-351-32 Reliability of June Projections (Continued)------------------------------------------------------------------------------- :Differences between proj. & final estimate, 1981/82-98/99 1/ Commodity and :------------------------------------------------------------- region : Avg. : Avg. : Difference : Below final : Above final-------------------------------------------------------------------------------SOYBEANS :Percent Million metric tons Number of years 2/ Production : World : NA NA NA NA NA NA U.S. : 7.8 4.2 -11.3 12.0 10 8 Foreign : NA NA NA NA NA NA Exports : World : NA NA NA NA NA NA U.S. : 15.7 3.0 -6.4 6.4 9 9 Foreign : NA NA NA NA NA NA Domestic use : World : NA NA NA NA NA NA U.S. : 6.2 2.3 -7.2 4.5 13 5 Foreign : NA NA NA NA NA NA Ending stocks : World : NA NA NA NA NA NA U.S. : 32.1 2.2 -7.1 5.3 7 11 Foreign : NA NA NA NA NA NA :COTTON : Million 480-pound bales Production : World : 4.8 4.0 -13.9 11.4 10 7 U.S. : 9.2 1.3 -2.8 3.1 8 10 Foreign : 4.7 3.2 -12.4 10.5 9 9 Exports : World : 5.6 1.3 -4.2 2.5 8 10 U.S. : 21.1 1.0 -2.4 3.0 11 7 Foreign : 6.9 1.2 -3.5 1.9 8 10 Mill use : World : 2.7 2.2 -7.9 4.7 7 11 U.S. : 7.5 0.6 -1.4 1.0 12 5 Foreign : 2.7 2.0 -7.2 4.3 7 11 Ending stocks : World : 16.6 5.6 -14.3 15.2 12 6 U.S. : 36.4 1.5 -3.4 3.5 9 9 Foreign : 15.7 4.7 -13.4 12.5 12 6-------------------------------------------------------------------------------1/ Final estimate for 1981/82-97/98 is defined as the first November estimatefollowing the marketing year and for 1998/99 last month's estimate. 2/ May nottotal 18 if projection was the same as final estimate. 3/ Includes corn,sorghum, barley, oats, rye, millet, and mixed grain.

WASDE-351-33 Reliability of United States June Projections 1/------------------------------------------------------------------------------- :Differences between proj. & final estimate, 1981/82-98/99 2/ Commodity and :------------------------------------------------------------- region : Avg. : Avg. : Difference : Below final : Above final-------------------------------------------------------------------------------CORN :Percent Million bushels Number of years 3/ Production : 14.6 974 -3327 2379 9 9 Exports : 19.2 343 -850 588 7 11 Domestic use : 5.5 322 -558 1095 10 8 Ending stocks : 48.3 703 -2091 1460 10 8 :SORGHUM : Production : 14.8 105 -228 171 9 9 Exports : 18.3 44 -105 97 8 10 Domestic use : 12.5 61 -139 100 10 8 Ending stocks : 56.6 82 -189 191 6 12 :BARLEY : Production : 9.8 39 -73 206 7 11 Exports : 35.9 22 -92 53 11 7 Domestic use : 10.7 41 -72 95 11 7 Ending stocks : 15.0 28 -59 79 8 10 :OATS : Production : 17.7 50 -77 231 4 14 Exports : 96.8 2 -5 8 5 9 Domestic use : 8.7 32 -39 160 7 10 Ending stocks : 18.6 23 -59 77 4 12 : : Thousand short tonsSOYBEAN MEAL : Production : 5.3 1521 -3721 4432 11 7 Exports : 17.8 1139 -2650 2000 10 8 Domestic use : 4.3 926 -1800 2259 12 6 Ending stocks : 36.0 82 -204 488 8 10 : : Million poundsSOYBEAN OIL : Production : 5.3 711 -1923 1553 11 7 Exports : 26.5 430 -1700 914 9 9 Domestic use : 3.3 391 -985 758 14 4 Ending stocks : 37.4 499 -966 1288 7 11------------------------------------------------------------------------------- :ANIMAL PROD. 4/ : Million pounds Beef : 1.4 342 -348 819 11 6 Pork : 2.1 324 -579 676 12 5 Broilers : 0.9 177 -399 436 9 7 Turkeys : 1.6 63 -171 116 10 7 : : Million dozen Eggs : 0.8 49 -83 125 12 5 : : Billion pounds Milk : 0.6 0.8 -2.7 2.1 7 10-------------------------------------------------------------------------------1/ See pages 31 and 32 for record of reliability for U.S. wheat, rice,soybeans, and cotton. 2/ Final estimate for 1981/82-97/98 is defined as thefirst November estimate following the marketing year and for 1998/99 lastmonth's estimtate. 3/ May not total 18 for crops and 17 for animal production if projection was the same as the final estimate. 4/ Calendar years 1983 thru1998 for meats and eggs; October-September years 1982/83 thru 1997/98 for milk.Final for animal products is defined as latest annual production estimatepublished by NASS.

WASDE-351-34 METRIC CONVERSION FACTORS 1 Hectare = 2.4710 Acres 1 Kilogram = 2.205 Pounds--------------------------------------------------------------------- 1 Metric Ton : = Domestic Unit * Factor---------------------------------------------------------------------Wheat & Soybeans : = bushels * .027216Rice : = cwt * .045359Corn, Sorghum & Rye : = bushels * .025401Barley : = bushels * .021772Oats : = bushels * .014515Sugar : = short tons * .907185Cotton : = 480-lb bales * .217720---------------------------------------------------------------------

FIRST-CLASS MAILPOSTAGE & FEES PAID
USDAPERMIT NO. G-289
UNITED STATES DEPARTMENT OF AGRICULTUREWORLD AGRICULTURAL OUTLOOK BOARD
WASHINGTON, D.C. 20250-3800_________________OFFICIAL BUSINESS
Penalty for Private Use, $300
World Agricultural Supply and Demand EstimatesWASDE-351 - June 11, 1999
U.S. Department of AgricultureOffice of the Chief Economist
Approved by the World Agricultural Outlook Board
**********
The U.S. Department of Agriculture (USDA) prohibits discrimination in all its programs andactivities on the basis of race, color, national origin, gender, religion, age, disability, political beliefs,sexual orientation, and marital or family status. (Not all prohibited bases apply to all programs.) Persons with disabilities who require alternative means for communication of program information(Braille, large print, audiotape, etc.) should contact USDA’s TARGET Center at 202-720-2600 (voiceand TDD).
To file a complaint of discrimination, write USDA, Director, Office of Civil Rights, Room 326-W,Whitten Building, 14th and Independence Avenue, SW, Washington, DC 20250-9410 or call(202) 720-5964 (voice or TDD). USDA is an equal opportunity provider and