world bank document - all documents | the world...
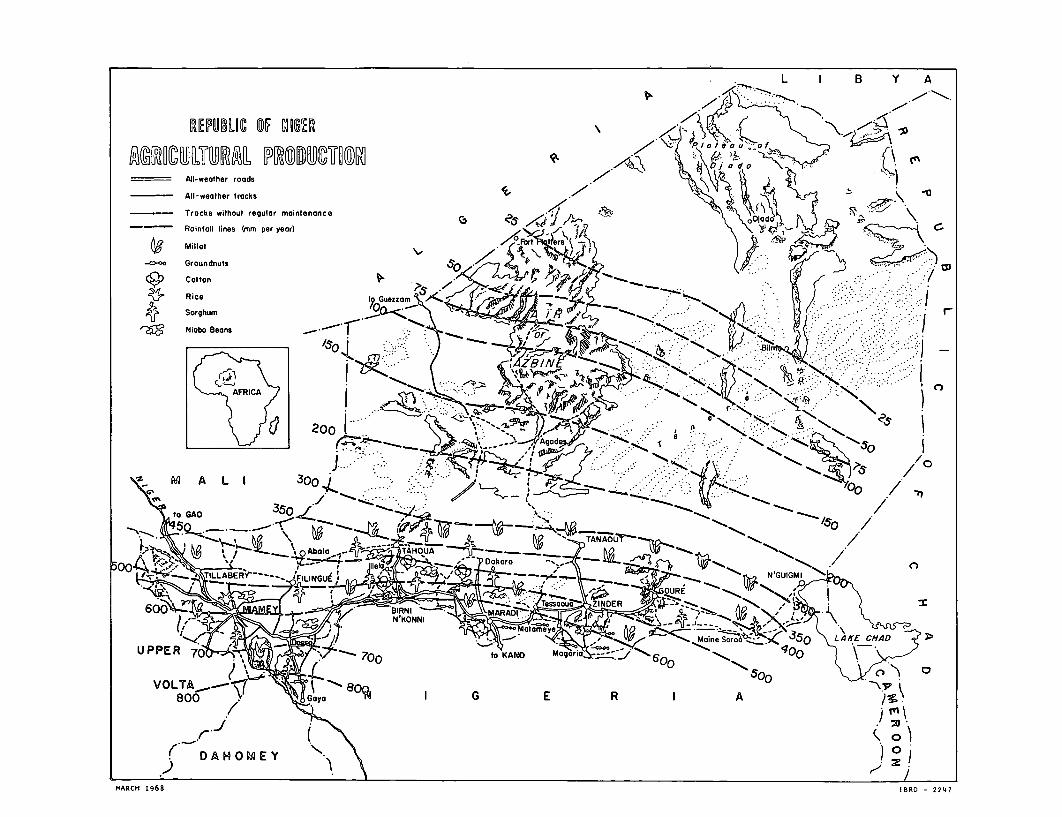
TRANSCRIPT

RESTRICTED
FILE COP-Y Report No. AF-77a
This report was prepared for use within the Bank and its affiliated organizations.They do not accept responsibility for its accuracy or completeness. The report maynot be published nor may it be. quoted as representing their views.
INTERNATIONAL BANK FOR RECONSTRUCTION AND DEVELOPMENT
INTERNATIONAL DEVELOPMENT ASSOCIATION
THE ECONOMY
OF
NIGER
July 8, 1968
Africa Department
Pub
lic D
iscl
osur
e A
utho
rized
Pub
lic D
iscl
osur
e A
utho
rized
Pub
lic D
iscl
osur
e A
utho
rized
Pub
lic D
iscl
osur
e A
utho
rized
Pub
lic D
iscl
osur
e A
utho
rized
Pub
lic D
iscl
osur
e A
utho
rized
Pub
lic D
iscl
osur
e A
utho
rized
Pub
lic D
iscl
osur
e A
utho
rized

TABLE OF CC]NTENTS
Page No.
BASIC DATAoooooooooo.ooooo.ooooooo oooooooooooo.ooooooMAPS (3)00000o0 00o00o000000o0ooo.oo.o.oa. . .o0 0 0 0
SUMMIARY AND CONCLtJSICNS ...... 0oooooo0 o0 o0 oooooooooooo0 i - vi
I. GENERAL BACKGROUNDo 0 o0.0.0.00 00 00 0 0ooooo0ooo0ooo 1
Natural 0 000o0 00.0.0.0000o0oo...0..0... 0 00000 1Soc jal.0000000000000000o... 0000 0...0 000 .. 0000 .o.o 2Government and Policies000....... 0000000000000 2
II. OVERAL ECONOMIC STRUCTURE AND DEVELOPMENTS0 0... 0 0 4
A0 Overall view 1956-66oo0000o00Q0 00 0 00 00000 00000 4B0 The use of resources and growth0 0 0o0 0 0 .... 0 0 .0 B
General: the primary generation of income 00 0 0 8Factors of growth0000o 000000 ..00000000 00000 000 9Induced effects o.00 0 0 0 0 0 0 0 0 0 00 0 0 00 0 0 0 0 0 0 0 0 0ooO 12
CO The achievement of financial equilibrium0 0 0 0 0 0 13Public finance. 00 o00oo00000000000000 0000 0000000 13External finance000.. 0000 .000000- 00ooo .0000000 18Monetary developmento0 0 0 0 0 0 0 0 0 0 00 0 0 00 0 0 0 00 0 0 .. 24.Savings and Investmentoo0 0 0 0 0 0 0 00 0 0 0 0 0 0 0 0 00 0oo 27
III DEVELOPMENT PROBLEMS AND PROSPECTSo.......o.....Oo 31
A0 Overall review of planning0o0 0 .0 0 00 .... 0..O... 31B0 The sectoral development strategy0000000000000 32C. The budget and development policy0000000000000 35D. External balance.0.00..0..0...0.0000..00.00 a .. 38
ANNEXES
Note on the Uranium Mining Company.. 0.....0 .o0 1Notes on Projections 00 00 0 Ooooo0 oo0 Oooo0 0 0 0 0 00 1 - 8
APPENDIX-TABLES
This report was prepared by a mission whichvisited Niger in November/December 1967
and was composed of:
Luis de AzoarateRoger Adams
RASIC DATA
Area: 4909000 sq. miles; 1,3009000 sq. kms.
Pfopuation (1966): 3,350,000rate of growth: 2.5% to 2.8% p.a.school attendance - 1957: 4%
1967: 10.5%
Political Status: Independent since 1960
Gross Domestic Product: (billion CFA francs, current prices)
1956 1960 1966 (est)
Total 45.9 50.1 77,0
Estimated real growths 0 32%
GDP per head (1964): approximately CFAF 20,000; $80
Structure of GDP (1964):
Orgin % Uses %
Agriculture 62.0 Private consumption 73.0Secondary sector 11.0 Public consumption 13.0Tertiary sector 20.0 Gross investment 14.0Government 7,0 Exports 15.5
Imports -15.5
100.0 100.0
Savings and Investment (billion CFA francs)1960 1964
1. Domestic savings 4.7 9.12. Public transfers (net) 4.0 4.33, Private "transfers" (net) -3.7 -4.54. Available savings 5,05. Adjustment (+) -_4 -ol6. Gross investment 4.6 9.0
7. Investment rate as % of GDP 902 14.0
Central Government Budget (billion CFA francs)1960 1965/66 1966/67
10 Current revenue 3.9 8o4 8.520 Current expenditure 501 7.8 8.530 Balance -1o2 +07. -40 Investment expenditure -0.5 -lo9 -loO5. Total excess expenditure -li7 1o0 =.O6. External contributicns 1.4 0.25 0o1570 Of which: French (loO) (Oo25) (015)8. Internal financing 0o4 0035 0.85
Money and Credit: Niger is a member of the West African Monetary Union(UMOA) within the Franc area.
billion CFA francs(e-nd of-y-e-ar)T
1962 966 1967Money supply 4,9 7.3 7 9Credit to economy 4.6 9.8 900Credit to government -009 -lol 1 0o9Net external assets (within UMOA) 106 -0,5 -03
External Trade (Goods):
billion CFA francs
1964 1965 1966Estimated exports f.oobo 103 8,53 ll191Estimated imports coiofo 102 10023 1156
Ool -l 70 +Oo35
(Note: estimates of exports andimports vary considerably)
Commodity concentration of exports (1964-66):
one product (shelled groundnuts): 41%two products (groundnuts and livestock): 75%
Balance of Payments (rough estimates)billion CFA francs
1964balance on goods and services 01factor payments (identified) -o.6private "transfers" -405public transfers -4.8BALANCE -0.2change in reserves (decrease) +1.0errors and omissions -008
-3-
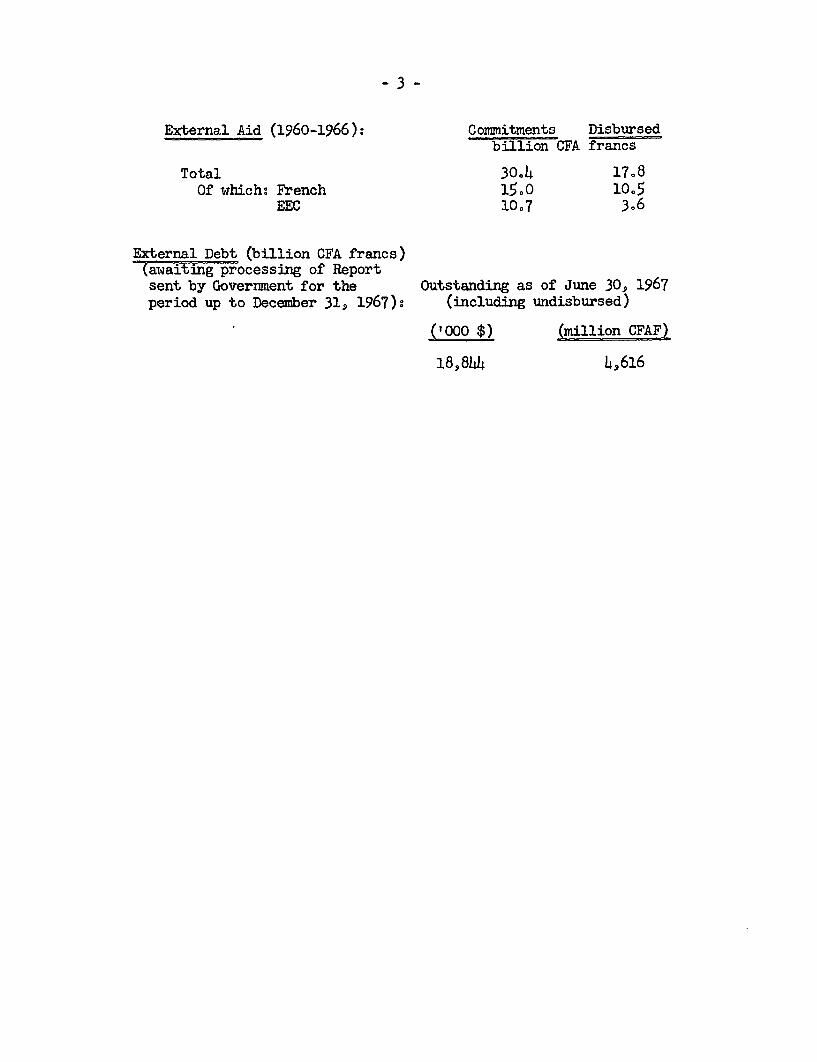
External Aid (1960-1966): Cormitments Disbursedbillion CFA francs
Total 30°4 17.8Of which: French 150 10.5
EEC 10.7 3.6
External Debt (billion CFA francs)(awa-iing processing of Reportsent by Government for the Outstanding as of June 30, 1967period up to December 31, 1967): (including undisbursed)
('0oo $) (million CFAF)
18,844 48616
62zz anuI 8961 q:)-LeW
a A 3 1e 0 H Vt aI
O SN ooz OS I OOT OS O' OS West ° 0 '
o ~ ~~~~~~~~~~~~~ 3; Na 0 O}.,
0 ~ ~~~~~~~~~~~~~~~~~~~~~~~~~~~~~~~ --- 0
0~~~~~~~~~~~~~~~~~~~~~~~~~~~~~~~~~~~~~~~~O 9!9 .--
\~~~~~~~~~~~~~~~~~~~~~( 0. D .-O0 *t
o~~~~~~~~~~~~~~~~~~~~~~~~~% 0 o
v~~~~~~~~~~~~ 0 0 c 5\--..
L I B Y A
REPUBLIC OF DIEER 'N,*B Y
All-weather roads ?
_ _ All-weather tracks
Tracks without regular maintenance
Rainfall lines (mm per yeor) -. C.Milletr
Groundnuts / i /
Rice lpuzzam X4 -
Sorghum rNiobo Beans ...
L S~~~~ 2 0 0v-j p;;S O e -~~~ '~~0
M A L 1 3 00o . . ,_ j /
to GAO /r\
UPPR DAHOMEY 70 ~ A.. ?0 .X zo LAECA
500CH 1W68 ssRD - 2247
MARCH 1968 ~ ~ ~ ~ ~ ~ ~ ~ ~ ~ ~ ~ ~ ~~~~~~~~~~~~~~ AECA<ne Soro _k -1150 >RO -224

to Ghordo;o /
J A L G E R I A \'- I_~~qsn Guezzom
I 0 REPUBLIC OF NIGER
0 I ~~~~~~ROAD NETWORK
Bituminous Roads
__GA D E Z Laterite Roads
AGDEZIn Gall assous| Tracks
M A L I
{_/ / /
to Gaoo el ~ ~ - ~ ~// 0 A A g~~~ ~ ~~~~~~~~~~~Abho TAOU Tonoout N'it
c~~~~~~~~~~~~~~
tDuag~~~~~~~~~~~~~~~~~~~~~~~odcoua G ln onore
o- D A H O M E r o / l~~~~~~~~~~~~~~~~~~~~~~~ga
MARCH 1968 IBRD-2297

SUMMARY AND CONCLUSIONS
A0 General
10 Niger's natural conditions are difficult. Nine-tenths of itshalf million square miles is desertic; in the "useful Niger", lack ofwater is a problem almost everywhere; the Niger River has only 300 ofits 2,500 miles course in the country and its valley cannot be economi-cally developed without costly investments. Population is growingrapidly, at 2.5 percent per annum or more, and it is concentrated in thesouthern belt, to the North of the Voltaic, Dahomean and Nigerianborders. However, its small size (3-5 million) and wide dispersion onlyadd to the difficulty of expanding the home market as internal distancesare enormous and transport costs very high. At the same time, importedgoods have to cover 800 miles of land routes, through Dahomey or Nigeria,before reaching consmnption centers.
20 The existence of a difficult environment makes the achievementof economic and political goals appear the more remarkable. Since inde-pendence, Government stability and national unity have been strengthenedunder the leadership of President Hamani Diori, very much in contrast towhat has happened in all neighboring countries0 President Diori hasbecome one of the prominent figures of the whole group of French-speakingAfrican countries, together with Presidents Senghor of Senegal, andHouphouet Boigny of Ivory Coast. He is currently the elected president,for the second consecutive term, of both the common organization of Afri-can and Malagasy States (OCA 1/) and of the Conseil de l'Entente. 2/
B. Past Develpmaent
3. Taking a long-term view of Niger's development, it would appear,on the basis of uncertain figures, that after a period of stagnation inthe years preceding independence, GDP has grown in real terms by around32 percent from 1960 to 1966, or an average of 4.75 percent per year0 Theannual rate of growth has in fact been very irregular, depending partlyon weather conditions. The level of income per head remains very low, ataround $80, or about one-third of the Ivory Coast's0 Over the ten-yearperiod 1956-66, some structural change has taken place along a classicalpattern of a slowly-declining share of agriculture and a correspondingrelative increase of industry, construction, and s wvices, includingGovernment. With over 60 percent of GDP, the primary sector remainsdominant, while the small share of industry (11 percent in 196 4) can
1/ OCAM: Organisation Commune Africaine et Malgache, grouping 14 French-speaking African states and Malagasy.
2/ Conseil de l'Entente: Loose political grouping of Dahomey, IvoryCoast, Niger, Upper Volta and Togo.

- ii -
easily be explained in terms of market limitation and high cost of thenecessary imported inputs. The relatively high contribution of thetertiary services in turn is not so much the result of the developmentof the more modern section of the economy as the reflection of theimportance of import and export trade and the cost of transportationQ
40 Higher levels of both investment and exports have played amajor role in the mechanism of growth on top of the basic upward trendof growing population and the parallel increase of food crops which hastaken place, thanks, mainly, to the expansion of the area under cultiva-tion.
5. The rate of gross investment, in the most recent years, averaged15 percent of GDP and that of fixed investment is around 10 percent, orroughly twice the pre-independence level. In total investment, "tradi-tiona!'investment, iLe. house building by farmers, growth of livestock(and also the creation, extension and improvement of agricultural holdingswhich is not accounted for in the national accounts) represents about halfthe total and its role has been decisive, together with that of the in-crease of labor and other current inputs such as improved seeds, in thegrowth of agricultural production, especially cash crops0 At the sametime, the greater part of modern investment has gone into transport infra-structure and, more recently, to a lesser extent, in water supplies0
60 Modern investment has been financed by external aid in a veryhigh proportion, normally 80 percent or more0 This results from the factthat private investment in the secondary and tertiary sectors has beenlimited by the lack of attractive opportunities, and from the absence ofsizeable local public savings. In fact, the remarkable increase in thetaxation effort, with an overall rate going up from 5 percent of GDP in1956 to 10.5 percent in 1966, has only permitted to meet Governmern's in-creased current expenditure twice since independence0 At the same time,the Government cannot easily mobilize private resources, despite anapparently relatively high rate of domestic savings of the order of 15percent, because, while a high proportion of private money savings flowout of the country, half of these "savings", in the subsistence sector,never take a monetary form0 It is expected that the French "investment"subsidy to the public budget will not have to be renewed in 1968 andthat the Government will finance those public investments, administrativebuildings and the like which external sources of aid do not normally con-sider.
70 The composition of exports has not changed much0 Two products,shelled groundnuts (40-50 percent) and livestock (35 percent)j representthree-fourths of the total, while a variety of secondary products, suchas groundnuts oil and cakes, hides and skins, cotton and foodstuffs,constitute the balance. Exports have more than doubled since the immedi-ate independence period0 Between 1960 and 1965, quantities of groundnutsexported have nearly doubled, and in 1966 and 1967 have reached 130,000tons or 2.5 times the 1960 level. This rapid growth is the result ofthree sets of factors0 One is the system of guaranteed stable export

- iii -
price and export quota maintained by France until the 1966/67 campaign.The other is the expansion of the marketing network since the creationin 1962 of the official marketing board (SONARA 1/). The third one isthe increase in yields achieved thanks to the introduction of improvedmethods, notably improved seeds. Cattle is exported on the hoof, main-ly to Nigeria, through traditional channels, and except for the con-struction of wells and the provision of veterinarian services, thelivestock sector has remained entirely traditional. Among secondaryexports, cotton, where CFDT 2/, a French public development agency, isactive, has shown the greatest progress in recent years.
8. The balance of paymentsis known very imperfectly, and compari-sons through time are almost impossible because the coverage of officialstatistics has changed widely. The best estimates show that imports -official and those smuggled in from Nigeria and other countries - havegrown much faster than GDP and slightly faster than exports over the1956-66 decade as a whole. Their growth has been slower in the 1961-6hperiod. The trade balance is generally slightly negative but thefigures are very uncertain. One important feature of Niger's externalbalance is the large size of "private transfers" abroad, an item whichcovers, in unknown proportimns, capital movements, factor payments andsome unaccounted trade transactions. Varying between CFAF 3.5 and 6.5billion a year, these movements basically originate in the money in-comes generated in the modern sections of the econony by the flow ofexternally-financed public expenditures and in the import-export trade.Given the rules governing the West African Monetary Union of whichNiger is a member, these movements cannot be limited in any way. When-ever this outflow of funds exceeds the inflow of public transfers inthe other direction, this adds to the trade deficit and externalreserves go down. Since 1964, net external assets have decreased bynearly CFAF 2 billion and have been negative for the greater part of1966 and 1967. This has induced the monetary authorities into somewhatstricter credit policies but has not otherwise affected Niger's mone-tary situation, whose basic strength rests on the overall position ofthe Monetary Union and the unlimited convertibilityof the CFA franc asguaranteed by the French Treasury.
C. Development Policies and Prospects
9. After having prepared various plans or programs, which havehardly been implemented at all because they were unduly over-ambitious,the Government has taken a more practical view of development policy.Serious, and as far as can be judged at this stage, largely successfulefforts have been put in three key areas. First, the size of publicinvestment program has been lowered so as to be consistent with bothfinancial resources and absorptive capacity; second, it has been ensured
1/ Societ6 Nige"rienne de Commercialisation de l'Arachide.7/ Compagnie Francaise pour le Developpement des Fibres Textiles.
- iv -
that the technical departments did participate in the preparation andagree with the investment targets; third, it has been ensured, as faras possible, that the public budget can both participate in the financ-ing of investment and bear the recurrent costs of the social sector andthose - such as road maintenance - attached to economic investments.At the same time, long-term forecasts of revenue have been made consist-ent with the general development of the economy.
10. The efforts towards coordinating the various actions which to-gether constitute development policy have gone further. Thus a majorreorganization of the fifteen or so odd public and semi-public enter-prises is now underway with the aim of exerting better control over themwithout hindering their autonomy. In the recent years, some of the pub-lic firms which were hastily set up in the period following independence,when a "socialistic" mood was very much in evidence, have been discardedin order to end their being subsidized by the budget.
11. The current program for 1967-711/foresees total public invest-ments of CFAF 23 billion. Given the existing pipe line of foreign aidcommitments on previous programs which amounted to some CFAF 9 billionby the end of 1966, and the outlook for aid from France and EEC, thereshould not be serious difficulties for the financing of the program.The only point in this respect is that local participation, which thePlan puts at around CFAF 2 billion, should be somewhat increased, a realpossibility given the budget forecast when account is taken of the in-come to accrue to the Government as a result of the forthcoming exploita-tion of a uranium mine.
12. The sectoral strategy of the program strongly reflects thewell-felt need to consolidate and expand infrastructure in the two basicfields of transportation and water resources. Investments in roads isthus put at CFAF 6.3 billion, or 30 percent of the total, and developmentof water resources at CFAF 6.7 billion, or 31 percent of the total.There exists a long-term sectoral plan for transportation, and the prob-lem is mainly a technical one of allocating the precise priorities intime on the basis of further feasibility studies. The development ofwater resources, however, raises much more intricate problems because theeconomics of this sector in Niger's conditions are not well known. Thecase for irrigation schemes, which would be favored by some in the Govern-ment, is far from clear. Recognizing this, the main effort is being puton a large program of wells and other small constructions for the satis-faction of both human and animal requirements, whereas only one largescheme implying irrigation is being implemented. The plan rightlystresses the need for more studies in this field before embarking onfurther programs. Certainly, the results achieved so far in a fewprojects undertaken in the past justify a cautious approach.
1/ In fact, under the system of "rolling" four-year programs, one suchplan covers the period 1967-70 and the current one is for 1968-71.

- v -
13. Although raising the rate of school attendance from its pres-ent 10 percent is an obvious objective, the Government is well aware ofthe budgetary difficulties involved in too rapid a progress. In thelight of these, as well as by taking account of pedagogic and politicalconsiderations, the Government is presently trying to assess the rela-tive merits of extending the classical school system against a generali-zation of educational television, which is now at an experimental stagein the Niamey area.
14. In industry and mining, the program foresees little publicinvestment as the policy is now to attract private capital under the in-vestment code which grants various tax privileges and long-term guaran-tees. A number of important projects have been agreed upon and are tostart production in the next two or three years, notably a cotton textilemill and a brewery.
15. The largest single project to be undertaken in 1968 is theexploitation of an important uranium deposit in the Sahara desert(Arlit). A joint French-Nigerien company has been formed in which theGovernment has a 20 percent participation, other French private inter-ests a total of 40 percent, and the French official Atomic Authority 40percent. The latter will be sole buyer of the ore. In a first stage,the equivalent of 200 tons of metal uranium will be produced, a level toreach 1,000 tons in 1973-74. Total investment in the mine and relatedfacilities will be of the order of CFAF 11 billion (not included in theabove figures of the development program) to be entirely financed by theshareholders and French public sources. It is expected that the Govern-ment will receive annually some CFAF 200 million a year, going up toCFAF 600 million in the subsequent stage in the form of dividends,"royalties" and taxes. Though the latter sum is a mere 8 percent ofpresent public revenue, it will significantly ease the budgetary problemand contribute about 40 percent to the level of public savings of aroundCFAF 1.5 billion foreseen for the mid-seventies.
16. The overall prospects are that growth of GDP will be between 4and 4.5 percent per annum up to 1974 or so. This is based on the assump-tion, among others, that external aid will finance the bulk of publicinvestment. Whether the proportion be as high as 90 percent as foreseenin the original development programs for 1967-71 or only 80 percent, asseems feasible, does not really change the nature of the problem: in anycase, as in the past, an annual inflow of investment aid of CFAF 4 bil-lion or so ($16 million) will be required. One of the reasons for thisstate of affairs is that the outlook for exports of groundnuts will nolonger benefit from the French support system, starting this year. Itcan thus be expected, at best, that the decline in price will be 10 per-cent only, as compared to the present level, assuming that some compensa-tory financing will be provided under the 1969-74 agreement of associa-tion with EEC. In the possible case where such a scheme would not beforthcoming, the decline in price for Niger's major export will probablybe of the order of 15 or 20 percent. Already, producers' prices havebeen reduced, and in the absence of the incentive of high and stable

- vi-
prices, it is difficult to expect more than a 20 to 25 percent increasein groundnuts production as a result of increased productivity. As forother exports, price prospects are not very bright either (groundnut oil,cotton, hides and skins), or limitations will appear on the supply side(livestock). With a continued and unavoidable outflow of private"transfers" and much higher factor payments (on account of the uraniummine operations), it would be unreasonable to hope for a reduced overall"gap" in the balance of payments in the early mid-seventies.
17. As in the past, aid will have to be mainly in very softterms with grants from France and EEC playing the major role. Nigerexternal borrowing has been small until 1967 with a debt service ofaround CFAF 250/300 million representing some 4 to 4,5% of both exportproceeds and Government revenue. Howevers indebtedness has increasedsharply in the second half of 1967 with total debt, including undis-bursedp going up from CFAF 4.7 billion ($18.8 mil"lion) as of June 30, 1967to CFAF 7.4 billion ($29.7 million) as of December 31. Because theproportion of suppliers, credit and other privately placed debt has nowbecome 4o% of the total, debt service in the early seventies willbecome very high relative to past levels, assuming that disbursementstake place normally with service pf between CFAF 500 to 1,000 millionper year. Such levels would still represent a modest proportion ofexport proceeds (about 6% in 1973) and G-vernment revenue (about 8%in 1973). flowever, the debt service burden must be weighed in thelight ef the Government's capacity to secure public savings. Thesewere projected at CFAF 1.1 billion in 1971 going up to CFAF 1.5 billionby 1974 assuming debt service at around CFAF 250/300 million. Butservice on the new borrowing would now absorb between one fourth andone third of these public savings thus reducing the already modestprojected Government contribution te the public investment program.Nevertheless, if the bulk of aid is on a grant basis or on soft terms,there would be a small margin for some conventional borrowing.,

I. GENERAL BACKGROUND
Natural
1. There is sane irony in having named this immense territory ofnearly 1.3 million square kilometers by the name of a river which isover 4,000 km long but has only some 500 km of its course in the country.It is a fact that the country owes only a minor part of its naturalassets to the presence of the Niger River. As a means of transportationit has been of limited value until now; the use of its waters for irriga-tion purposes raises very difficult technical and economic problems;fish resources are infinitely more important in Mali where the Niger hasits "internal delta"; its hydropower potential certainly is enormous butit does not lend itself to be used on the reduced economic scale whichwould be appropriate.
2. What is called the "useful Niger" (,le Niger utile") is astretch of land, 250 km wide at most, parallel to the southern bordersof the country and where 90 percent of the 3.5 million inhabitants live.Roughly, the northern limit of this area corresponds to the 350 mm rain-fall line. Further north, permanent cultivation of the land is practi-cally impossible. The "useful" region presents an inherent difficultybecause of the long distances involved: over 1,000 km from east to west.Thus, population is dispersed, transportation and communications ingeneral time-consuming and costly, and this is, of course, a permanentobstacle towards the expansion of the internal market.
3. This,and the other general eccnomic factors which account forthe limited home market, in turn prevent the long distances to the sea(Cotonou is at 1,000 km from Niamey, Lagos at 1,300 km from Zinder) fromconstituting a "natural" protection for home-produced goods. High trans-port costs of imported goods have a direct impact on real incomes: theprice of a ton of cement trebles between Cotonou and Niamey; they direct-ly reduce the price paid to producers of export goods: typically, theNigerien groundnut grower gets 20 percent less than the Senegalese growerwhen the c.i.f. price is the same (see Appendix Table 26).
4. Knowledge of the nature of soils is not sufficient, at present,to permit determining the most economic pattern of cultivation. However,it is the lack of accessible water which constitutes the main directobstacle for agriculture. With rudimentary techniques, the populationmakes the most of existing resources: the permanent rivers (Niger,Kamadougou), permanent ponds ("gueltas"), of which about ten large onesconstitute privileged areas for cultivation, and the various ways inwhich water appears temporarily in ancient river vall.ys, ponds, or"bas-fonds". There is only one rainy season of varying length betweenMay and September.
5. The Saharian part of Niger - perhaps four-fifths of the totalarea - is a world of its own. It is not unpopulated. The Touareg andsome Arabs who inhabit it, mostly as nomads, constitute two strong socialgroups. Until now, research for petroleum has not been rewarding,
although discoveries in the Algerian Sahara in the Fifties once gaverise to great hopes in Niger. The desert has, however, revealed atleast one important wealth recently, in the form of a large uraniumdeposit (Arlit) discovered by the French official atomic authority andsoon to be exploited.
Social
60 The fast population growth, estimated at around 2.7 percentper year now may be a promise for the futureo For the present, itmeans that nearly half the people are under 15 years old, and thusconstitute consumers with little earning power rather than producers0It means very serious health problems as these lie mainly with child-hood. It means also a tremendous pressure for more education in acountry which still has the lowest literacy rate and school attendancerate (10 percent) of all the former French colonies.
7. A few large ethnic groups form the bulk of the population:Hausas (about half), mainly in the center and East; Djerma-Songai (aboutone-fifth), along the Niger valley; semi-nomadic Peuls, Touareg, Arabs,etc. The mosaic of different origins is perhaps simpler than in otherAfrican countries and thus gives less way to tribalistic tendencies.The danger is, however, that fewer but larger groups are more powerfulcentrifugal forces, which the political organization of a country can-not always contain effectively. It certainly is a major achievement ofthe people and Government of Niger, therefore, that the national unityhas been maintained, and indeed strengthened, over the years0 Religionplays a unifying role as the great majority of Nigeriens are Moslems.
80 Non-ethnic contrasts, if not oppositions, exist in Niger, asin all the African countries having undergone similar developments.Here also, urbanization is a notable trend, as is the difference inliving standards and in ways of living between urban wage earners, pub-lic and private, and the traditional farmers who form over nine-tenthsof the population0 However, this country has not known the kind ofsocial unrest often connected with these movements.
Government and Policies
90 Stability of power and national unity are two already menLtioned achievements which count high in the Government's performance0President Hamani Diori, leader of the country for the last 8 years, isfor a large part the personal artisan of this situation0 In additionto having consolidated Niger as a nation, President Hamani Diori hasacceded to a prominent position in Africa. Its geographical and eco-nomic position makes it really vital for the country to maintain goodrelations with the rest of the world0 In this also, the Government hasdone well0 President Diori is for the second consecutive term theelected acting-president of OCAM 1/ and of the Conseil de l'Entente 2/;
1/ OCAN - Organisation de Coop6ration Africaine et Malgache02/ Conseil de l'Entente - a body for mutual consultation, comprising
Dahomey, Ivory Coast, Niger, Togo and Upper Volta.
- 3 -
as such, he has become also the most forceful spokesman of the Africancountries associated with the European Economic Community, and moreactively so in the present period of preparation for the renewal of theassociation agreement due in 1969.
10. Adapting the Administration to the requirements of an efficienteconomic policy is a laborious task, and one not yet satisfactorilyachieved in Niger. The creation of an administrative machinery in acountry where only a few hundred people have any secondary education is aformidable enterprise. Still now,most of the higher and intermediateposts are filled by expatriates. The making of economic policy appearsat times as a compromise between political aims, as broadly defined atthe highest level by the Presidency, and the views of such or such frac-tion of the body of foreign technical assistants. At the same time, forlack of a well-stratified administration and the resulting difficulty indelegating power, practical details and minute actions are decided by thePresident himself.
11. Economic policy has been determined by successive "moods" asregards the "right" doctrine to follow. In brief, there has been firsta period, immediately before and after full independence was obtained in1960, when the first attempts at some kind of planning were made. Thiswas done mostly by foreign experts and practically outside the Governmentand the Administration. These exercises helped achieve a better knowledgeof the resources and needs of Niger but had little influence over thedirection of the economy. This phase was promptly followed until 1965/66by one of enthusiastic and somewhat romantic "socialism" largely inspiredby foreign advisers, mainly French. This was the time when comprehensive,detailed and over-ambitious development programs, especially the "Perspec-tives Decennales" 1965-74 and the first four-year plan for 1966-70 wereprepared. More practically, during this period a number of public orsemi-public institutions were created in a proclaimed effort to socializethe economy and make it truly independent from the "exterior", especiallythe former colonial power. The role and fate of these enterprises, whichhave affected practically every sector of the economy, has been verydiverse. No overall appraisal would be meaningful. It has been recog-nized by the Government itself, however, that several of them were toohastily mounted, with too little own capital, and were poorly staffed.Thus, it has been part of the present-accepted approach, an essentiallypragmatic one, to economic problems, to discard some of the enterprisesof the public of semi-public sector and to exert a much stricter controlon the others. At the same time, planning has become a much more practi-cal exercise. Targets are more realistic, and the means to fulfill themmore precisely spelled out. Annual revisions of the four-year publicinvestment programs have become current practice. Also, and this is tobe strongly credited to the present administrative organization, coopera-tion between the planning unit (Commissariat G6neral au Developpement),which is itself attached to the Presidency, and the various Governmentdepartments, especially the Finance Ministry, is being actually imple-mented.

-h -
12. The Government has taken the sensible view that regional plan-ning can yet imply only a very limited decentralization of economicdecisions and of the financial organization. However, as a first steptowards an improved development policy at the local level, the sevenprovinces ("'departementst") were defined in 1962, taking account of localeconomic realities, and to a certain extent the same considerations applyto the thirty-two "arrondissements".
13. Nothing will prevent the general natural surroundings frombeing predominantly unfavorable in Niger. As will appear presently,some external elements of foreign assistance which in the past have hadpositive effects are now turning adverse with the cessation of any Frenchsupport for Niger's principal exports (groundnuts), thus adding to exist-ing difficulties. Bilateral aid is not any longer to be taken for granted.These are the costs of political independence to which the Government andaidthe people of Niger endeavor to adjust themselves in a spirit ofdetermination and realism.
II. OVERALL ECONOMIC STRUCTURE AND DEVELOPMENTS
14. In spite of grave deficiencies, enough statistical informationexists now to warrant a general presentation of economic developmentswhich have taken place in Niger over the last 10 years or so. In so do-ing, no attempt is made at explaining conjunctural changes. Followingan overall view of the period 1956-66, the mechanisms of growth arebriefly explored under the broad heading of "Use of Resources", andfinally, it is tentatively explained how the financial equilibria of theeconomy have been achieved.
A. Overall View: 1956-1966
15. Overall, the past decade has been one of slow structural changesin the economic set-up of Niger, of moderate growth of the country's out-put of goods and services, and one in which the "take-off into self-sustained growth" has not been achieved in the sense that externalpublic aid has remained essential to keep the economic machine working.Although some fundamental difficulties are being progressively solved -particularly in the field of public finance - others have occurred -particularly in the field of exports. The fact that the country hasremained fundamentally an agricultural economy, with something like 90percent of the population engaged in rural activities and over 60 percentof GDP originating in agriculture, is not to be taken, as such, as a signof economic retardation. It is progress, or the lack of it, within theprimary sector which is a meaningful test. This will have to be examined.
16. The overall growth of GDP over the years 1956-66 is roughly in-dicated in the figures of the following table:

-5-
1956 1959 1960 1961 1962 1963 1964 1965 1966
1. GDP at market prices(billion CFAF) 45.9 48.1 50.1 54.1 60.9 6 4.1 64.9 (69.0) (77.0)
2. Percentage change - +5 +4 +8 +13 +5 +1.5 (+6.5) (+12)
3. Estimated percentage)change in real ) - o 0 +9 +15 +3.5 -1.5 (+2.5) (+4.25)terms a/ )
4. OfficiaT estimate (+9) (+12.5) (+5.3) (+1.3)
a/ Deflator for 1961 to 1966 is the arithmetic average of the variation of theprice indexes for "African" and for "t European" consumption in Niamey. For1956 to 1960, the wholesale price index in France has been used. Officialestimates exist in official "Comptes Economiques" for 1961, 1962, 1963 and1964 but they do not appear to be based on adequate calculation of pricechanges. For the period when some price indexes exist (1961-66), the offi-cial estimates of "real" growth and those based on those price indexesdiffer. It is reasonable to think that the consumer price indexes used inline 3 show higher increases in price than have affected the "traditional"goods outside Niamey. To that extent, estimates of line 3 would be on thelow side. However, over the period as a whole, the official estimates andthose of the table, line 3 above, give very slightly different results.
Source: See Appendix, Tables 2A, 2B, 2C.
Rather than comment on the annual changes, it is more meaningful to assessthe broad evolution which emerges from the very uncertain figures in "real"terms. It would thus appear that during the period preceding independence,the real growth of GDP at market prices has been practically nil, whereasit has been of the order of 32 percent between 1960 and 1966. Given anannual population increase of about 2.5 percent p.a., this would mean littleincrease in product per head. National income at factor cost has increasedeven less, because indirect taxation net of subsidies has increased morethan GDP.
17. Movements, however, have been very different from one period tothe other. It can be concluded with a fair degree of certitude that theimmediate pre-independence years have been, at best, a period of stagnat-ing incomes per head. All the available indications on prices (in neigh-boring countries and in France) point to great increases which in allprobability have annihilated the apparent growth of GDP. In contrast, theearly years following independence, until 1963, have witnessed very signi-ficant real progress overall and per capita. Finally, on the basis of thevery tentative estimates made by the Mission, the most recent years wouldshow a slower progress than in the previous period, with an improvement astime goes by. The least uncertain conclusions to be drawn from the generalpicture just outlined seem to be threefold: the overall real growth of the

- 6 -
Nigerien economy has been modest, it has been marked by very unequalphases of acceleration and deceleration, and income per head has notsignificantly exceeded the $80 mark. This level is very low by anystandards. However, about the only meaningful comparison of per capitaincomes is with other former French colonies of Africa: in this contextNiger would rank ninth out of fourteens slightly before Chad, Congo (B)or Dahomey, well above Upper-Volta, but at one-third of the Ivory Coast'slevel.
18. Changes in sectoral and socio-economic distribution of productand income have followed what can be regarded as a very classical patternin Africa.1/ Some features, however, are more particular to Niger.Thus, though the share of the primary sector has declined from 72 percentof GDP in 1956 to around 62 percent in 1966, the trend appears to bepractically stabilized since 1961, as if there were some factors resistingfurther decline. Since this is a relative decline, of course, one simplepartial explanation for this state of affairs is that the industrial sec-tor finds so many obstacles to its development. Its share (includingconstruction) in 1956 was a little under 9 percent and in 1964 a littleover 11 percent. It is unlikely that it has increased at all in thesubsequent years. In fact, since 1960, with the exception of 1959(when probably some "secondary" activity has been included under the"primary"t sector), the absolute value of industry has fluctuated withoutgrowing markedly. This is attributable, for a large part, to variationsin construction activity.
19. Government "product" as conventially measured by salariesdistributed has grown comparatively little. This general impression con-ceals the structural change which took place in the period as theNigeriens progressively took over governmental functions from the French,including most of the armed forces.
20. It is the sector of services, including transportation, whichhas shown the highest absolute and relative growth. However, the largestincreases occurred only in 1961, and probably again in 1966 according tothe Mission's guess. The increase in 1961 may well in fact be only"statistical". That of 1966, and more generally the growth of this sec-tor throughout the period, is to be linked to the progressive "monetiza-tion" of the economy. It is estimated that in 1956 the non-marketedproduction was well over 50 percent of GDP, whereas in 1964, it wasaround 42 percent, and all the indications are that this trend hasaccentuated in the most recent years. The development of services ismore particularly dependent upon the growth of external trade, bothexports and imports, which has been a major characteristic of the period.Thus, exports were about 10 percent of GDP uses in pre-independence yearsas against over 15 percent in the following period, while the share ofimports went up from around 8 percent to a share similar to that ofexports.
1/ See Appendix Tables 2A, 2B, 2C.

-7-
21. The pattern of income distribution follows closely that of theproduct by sectors, with some overlapping to the extent that part of thesecondary and tertiary sectors are not wage distributors but are withinthe realm of traditional activities. Thus, the share of wages remainsnecessarily small, with 9 percent of GDP at factor cost in 1956, 14.5percent in 1964t, and probably a slightly higher figure in more recentyears. About half the regular wage earners (excluding army), whichtotal around 24,000, or only 1.5 percent of,working aget population, in1966, as against 15,000 ten years earlier, are in the public sector andhalf in the private sector, including public and semi-public enterprisesof an econamic character. The wage bill is also distributed in similarproportions between public and private sector.
22. Obviously, the average nominal income of the wage earner is,and increasingly so, much higher than that of the rest of the population.For a number of reasons, familiar in the African context, the differencein real terms is not so great as would appear from the statistics. Onereason is that the cost of living in urban centers is much higher and hasincreased more than in the "bush". Another is that the wage of oneemployee, be it private or public, in fact helps maintain a much largernumber of people than does the income of, say, the typical peasant. Also,the wage earner pays higher taxes than the rest of the population. It isnevertheless the case that wage earners are a privileged group in thenation. The Government is aware of this and has tried to keep wage in-creases within strict limits. The minimum legal wage rate has remainedthe same since June 1962. Average actual wages and salaries have in-creased, however, by about 40 percent between 1956 and 1966, while consu-mer prices have risen by about 16 percent between 1961 and 1966 only, andby an unknown but probably higher percentage in the earlier, 1956-61,period. The increase in real wages has therefore been a definitelymodest one.
23. Income of households (other than wages) closely follows theevolution of primary output since, for the greater part, it simplyrepresents the income side of it. Thus, though increasing absolutely,its share diminishes from 79 percent in 1956 to 71 percent in 1964.Corporate income of public and private enterprises is the most fluctuat-ing category. This is consistent with the fact that profits are by naturemore unstable than other incomes. It is linked also to the already-mentioned influence of construction activity,which is very unequal fromone year to the other. It can be seen in fact (compare Appendix Tables2B and 2C) that corporate income rises when gross investment rises(1956-62) and declines when gross investment levels off. Other factorssuch as price controls and the varying degree of competition in the com-mercial and transportation sectors, have certainly played a role, butnot one easy to quantify. It is likely, but impossible to prove, thatthe decline by some 50 percent between 1962 and 196h has been made good,at least partially, in the subsequent year, in correlation with the risein the output of services resulting from the rapidly-expanding externaltrade.
B. The Use of Resources and Growth
General: the "primary" generation of income
24. Fundamentally, the mechanism of an economy like that of Niger'sis simple. There are three main sources of national resources or incomewhich basically are fairly autonomous in the sense of not being predomi-nantly and directly determined by other national economic activities:subsistence agricultural production, agricultural exports and the inflowof public funds.
25.' The greatest part of agricultural output is produced to satis-fy the basic needs of the farmers themselves. There are no large planta-tions. Agricultural production comes about as a result of current inputsof non-wage labor plus investment in the form of land clearance, and itincreases with population as more labor is done and more land put intocultivation and livestock grows. Fluctuations of production dependheavily on weather conditions. Specialization in the agricultural sectoris limited if one excludes export products, and the bulk of productionis auto-consumed. Money income generated in this sector as a result ofinternal exchange is small.
26. Agricultural exports are of various kinds. Some are mere sur-pluses, i.e. what happens to be left after consumption by the producer,and their magnitude depends mainly on climatic c cnditions. This is thecase of food crops such as millet or niebe beans, of which Niger isnormally an exporter. Other products, on the contrary, are produced inorder to be exported, although part of the consumption is retained forlocal consumption. This, of course, is the case of Niger's main exports,namely, groundnuts, but also of such produce as onions, tomatoes andother vegetables, of which neighboring countries and even Europe arebuyers. Finally, livestock has its own genus. Although it is repeated-ly said - as part of the socio-economic folklore on Africa - thatherders grow cattle for prestige reasons, that they are not interestedin mercantile intercourse and that they sterilize capital, the fact isthat increasing quantities of cattle are sold abroad and also on localmarkets. Indeed, from what scanty factual information exists, it wouldappear that the return on the capital value of livestock, in the way ofsales of animals, meat, skins and dairy products, is of the order of20-25 percent, of which three-fourths is in money income, a level whichone would wish to be more common in the "modern" sectors of the economy'
27. The third "autonomous" origin of national resources is the inflowof external public resources. These, in fact, have been by far the mainsource of financing of modern (monetary) investment. Private moderninvestment has been very small in the past. However, in addition to theexternal inflow of investment funds, a feature of the Nigerien economyover the last decade is the importance of non-investment public trans-fers from abroad to cover current expenditure, for example Niger's Govern-ment budget, but mainly of French military forces, French technicalassistance or to cover inter-African agencies (e.g. the aerial navigation

-9-
security agency, etc.).l/ Thus, the total inflow of public funds has atall times represented a major resource for Niger, not only from the bal-ance of payments point-of-view, but from that of the income generationprocess in the country.
Factors of Growth
28. The three main origins of national income - agricultural pro-duction for the home market, agricultural exports, public transfers fromabroad - raise two sets of inter-related questions regarding what rela-tionships may exist between themselves and regarding the manner in whichthey contribute to the economic growth of the country. The first ques-tion concerns mainly the possible competition between production for thehome market and production for exports, and the other one concerns main-ly the role of investment and other factors in the process of growth.
29. The period 1956-67 has not witnessed a clear substitution ofexport crops for food crops in terms of area. The part dedicated togroundnuts has increased slightly from 12 percent to 13 percent, andagain more significantly in 1967, according to inf.ormation given to theMission. The areas under millet, sorghum, and niebes (beans), thethree main staple crops, remain a massive proportion of the total. 2/What has happened, however, is a definite shift towards more intercrop-ping practices (millet-sorghum, millet-niebe, sorghum-groundnuts, etc.),and a relatively important growth of more sophisticated products such asrice, onions, tomatoes, wheat, and also cotton. The area used forthese products, however, does not yet exceed 2 percent of the total. Itseems that the trend towards more intercropping and the response to prac-tices yielding higher returns per hectare in the cultivation of exportcrops has resulted largely from the increasing difficulty in finding newgood land. This,in turn, points to the possibility of harder competi-tion for land in the immediate future between export crops and othercrops. Competing clanMs on labor, on the other hand, have been real,since that factor has been applied in proportionately greater amounts tothe production and marketing of export crops, mainly groundnuts and alsocotton. This has been parallel to, and made necessary by, the applica-tion of better techniques in these crops such as use of fertilizers,pesticides and insecticides and utilization of draught animals, transpor-tation of larger quantities to markets, etc.
1/ For example, in 1964, the gross inflow of public transfers of CFAF 4.3billion was composed of: CFAF 2.2 billion of project aid from FAC andFED and, secondarily, USAID; CFAF 1 billion of French civil expendi-ture (technical assistance, French Embassy, French education and re-search institutions, etc.); CFAF 0.6 billion of French militaryexpenditures; CFAF 166 million on account of the aerial navigationsecurity agency; and around CFAF 300 million of other non-French(USAID, etc.) aids and expenditures in Niger.
2/ See Appendix Table 4.

- 10 -
30. As regards the role of investment and other factors, it must benoted first that "modern" (money) investment,l/ a part of investmentwhich is mainly financed by external public resources, is only a fractionof total investment. Further, investment in construction, modern andtraditional, represents by far the largest single item in the total,as isshown for the years for which information is available (and there is noreason to think that this has significantly changed in the more recentperiod):
1961 1962 1963 1964
1. Proportion of "modern"investment in totalinvestment 43 65 53 51
2. Proportion of construc-tion in total invest-ment 70 49 49 48
Investment involved in clearing and preparing new land for cultivationis not included in the figures available from national accounts, althoughit is argued below that this wmas the most important factor accounting forthe overall growth of agricultural output. Modern investment of directimpact upon agriculture has practically been confined to irrigationprojects, most of them small, for a total area of some 4,000 ha., i.e.,an insignificant proportion of the total area under cultivation and onewhich until now has contributed very little to total physical productionand, it would seem, with very low economic returns, if any.
31. Modern investment has had two major roles in the growth processin the past. One has been to provide the basic infrastructure facilities,mainly in roads and secondarily in power, water supplies, etc. Basically,however, the road network existed already in 1956 and subsequent grossinvestment has been mainly in maintenance and improvements. Capitalformation of this sort has had its most beneficial effects in permittingthe transportation of increased amounts of marketed products and more,concretely,of the 200,000 tons of unshelled groundnuts now carried annual-ly, as against less than half that amunt 10 years ago. The second rolehas been through the generation and subsequent multiplication of money
1/ "Modern" investment comprises: housing and other buildings outsidethose built by farmers for their own purposes, public works, trans-portation equipment, other machinery and equipment (excluding smallimplements used by the peasant economy). Total investment includesgrowth of livestock and other stock formation.
incomes in successive years and, through foreign financing, the purchaseof imports. In other words, the contribution of non-traditional invest-ment to directly productive capacity has been very small. It has con-cerned mainly a few oil mills, other small factories and workshops,commercial buildings and transport vehicles. Actually, according toestimates of the existing stock of capital in 1964, it would appear thatthe largest item by far is livestock (48 percent), then buildings (35 per-cent), then transport infrastructure (10 percent), while machinery andother equipments represent a mere 7 percent of the estimated total ofsome CFAF 135 billion.
32. Other decisive factors in promoting growth have been what maybe called "traditional" investment and the use of modern current inputs.It can roughly but realistically be said that what results in largerareas being cultivated is traditional investment and additional labor,whereas higher yields and product per worker come about, at least in part,as a result of more modern techniques being applied (and, of course,favorable weather). Over the 1956-66 period, rural population (total andactive), total area under cultivation (see Appendix Tables 4 and 5), andprimary production (in value, considering that unit prices have not verymuch increased this sector) have all equally increased by some 30 percent.The figures are only approximations but they nevertheless point to thefact that increased productivity has played a small role overall, andthat it is increased traditional inputs which explain the increase inproduction of the main staple products (millet, sorghum, niebe beans,cassava, etc.). Modernization of agriculture has taken place, however,in the sense that a growing proportion of output is marketed andexported, thus enlarging the monetary section of the economy: in 1956-59,about 15 percent of total primary production was exported, as againstover 25 percent in more recent years.l/ At the same time, yields ingroundnuts have significantly increased between 1960 and 1966 as a resultof improved techniques, but good weather conditions in 1965 and 1966 alsoaccount for a great part of the progress. Another reason for higher pro-duction of groundnuts is simply the expansion of the official marketingnetwork, which has covered new areas where this product was not previous-ly cultivated for the market.
33. Exports and investment have become an increasing proportion inthe use of (real) resources, and consequently, in the sources of (money)income. As a total, their share has increased in two steps: in 1960, by40 percent as compared to pre-independence years, and by another 40 per-cent in 1962. Although complete figures for 1965, 1966 and 1967 are notavailable, some increase must have taken place again, since exports ofgoods went up considerably and the rate of public investment was steppedup. Not surprisingly so, these stages of increase correspond to those
1/ As exports are valued f.o.b., whereas agricultural production isvalued at the producer price, only the comparison between the twonumerical proportions mentioned is meaningful.

- 12 -
of accelerated overall growth. As shown in national accounts, the sum ofinvestment plus exports went up from around 10 percent of total gross useof resources in 1956-59 to 22 percent in 1960-61, and over 26 percent in1962-64; a proportion probably of the same order holds good in the morerecent years. These proportions are considerably higher when only themonetized section of the economy is considered.
"Tnduced" Effects
34. The incomes generated by agricultural production for the homemarket, agricultural exports and public inflows of funds, in turn gener-ate or permit other flows of income and expenditure to take place. Someinvestments additional to those of the "traditional" kind and to thosedirectly financed by foreign aid may then be induced. But contrary tomore complex economies, this is not an important factor in Niger, as aresult of the limited diversification and internal specialization of theeconomy.
35. Two major economic activities, on the contrary, directly dependupon the three major "original" flows of income, namely, Governmentrevenue and imports. The latter represents also the greater part of thetaxation base. In addition, important outflows of private funds areclosely connected to the "primary" generation of income through exportsand the public inflow of funds. What is to be emphasized as part of theessential working of Niger's economy is precisely the quasi-automaticconnection between "primary" income and other induced flows of income orexpenditure.
36. This is true mainly for the relationships between the flows ofthe balance of payments. Money incomes generated by exports are promptlyused to buy imports, and this is true for the groundnuts producer as wellas for the herders who always return from Nigeria, after having soldtheir cattle, with a variety of consumer goods of local or foreign origin,from kerosene lamps to sugar, from transistor radios to cosmetics.Foreign-financed investment always has a high import content; wages dis-tributed as a result of investments go to buy similar imported consumergoods, because wage-earners very rapidly acquire "European" consumptionpatterns. As for profits earned by trading firms and contractors andsalaries of expatriates, they are readily transferred abroad (France),since there has never been any limitation to such movement within thefranc area and investment opportunities in Niger are scarce. Thus, inbroad terms, but quite effectively, the income from exports and capitalinflows creates imports and capital outflows with the number of "rounds"of expenditures taking place in Niger being small. One such "round", atleast, is obvious, however, and is represented by the taxes collected bythe Government. But inmediately afterwards, wages and salaries paidthrough the budget and purchases of goods and services by the Governmentmean more imports. It is no surprise therefore that exports plus invest-ment represent a high and increasing proportion of monetary GDP, as notedearlier. The following sections consider the specific problems of in-ternal and external financial equilibrium during the past decade, together

- 13 -
with the relationships between savings and investment, and how the mone-tary framework affects them.
C. The Achievement of Financial Equilibrium
37. Some of the general conditions of equilibrium in the fields ofpublic finance, money, external payments and the financing of investmenthave changed in the course of the 10 years 1956 to 1966. Yet, thechanges have not been drastic as might have been expected in a periodwhen the passage from the colonial status to one of "internal autonomy"in 1958, and of full independence in 1960, have taken place. The mainmodifications have concerned, quite naturally, the nature and importanceof the former colonial power's role.
38. Thus, the amount of expenditures incurred by the French Repub-lic in Niger has considerably diminished, subsidizing f the Nigerienpublic budget has progressively come to an end, the origin of develop-ment aid has been diversified with the growing role of the "FondsEuropeen de Dfveloppement" (FED)), and trade with partners other thanFrance has developed. Also, institutional arrangements with otherAfrican countries - former French West Africa as a whole or the moreclose neighbors of the Entente - have undergone successive adaptationsin efforts to promote more efficient regional cooperation and to re-place some of the links which existed between countries under thecolonial regime and which have been considerably weakened as a result ofindependence.
39. At the same time, other major aspects which form the generalcontext of the Nigerien economy have remained fundamentally unchanged.Among these, the most decisive ones relate to the monetary frameworkand to external aid. The monetary arrangements are characterized, todayas earlier, by their regional nature and by the existence of close linkswith France. As for external aid, if its composition has changed, itsrole has remained equally vital throughout the period.
Public Finance-V
40. Until 1958-59, under the colonial system of the former Federa-tion of West Africa (AOF), many public current expenditures werefinanced by the budget established in Dakar for the federation, and byFrance. These - army, police forces, education, agricultural research,etc. - are now almost exclusively the responsibility of the Nigeriencentral and local governments. Further, the Nigerien budget received
1/ The following section refers to the public finances of the Governmentof Niger only, because it is intended to appraise the role and per-formance of the Government in this respect. Other "public" opera-tions, i.e. of the French Government, and the investments financeddirectly by foreign sources are considered later (in the savings-investment account).
- 14 -
current subsidies from Dakar, from Paris, and also from Abidjan throughthe mechanism of the Solidarity fund of the Entente. The amount of cur-rent expenditures covered either directly by France and by the budget ofthe federation, or by subsidies to the local budget, varied aroundCFAF 2.5 to 3 billion per year between 1956 to 1959, representing halfor more of total public current expenditure. In 1960, the last year be-fore independence, external contributions were still near CFAF 3 billionout of a total expenditure on current accoint of CFAF 7 billion. Thesefigures only reflect the fact that until the full financial implicationsof independence started being felt, the problem of balancing expenditureand revenue was not really a concern for Niger.
41. The serious problems arose in 1959-60 when the automatic feder-al contribution disappeared and the French support became more and morequestioned, or rather was intended to be a contribution to the Governmentbudget rather than a balancing item of the current budget. The differ-ence is that the "contribution to the investment budget" is determinedwhen the budget is voted, whereas a support to the current deficit is afunction of the deficit itself as the budgetary outcome shows it. Thesecond major external contribution came, until 1964, from the SolidarityFund of the Conseil de l1Entente. 1/ Also, until 1966, some proceedsfrom the liquidation of the former AOF accrued to Niger.
42. During the period since independence, the financing of theGovernment investment budget and other public investments not normallyfinanced by external development aid has assumed increasing importanceas compared to that of covering the current deficit. This is shown inthe following table, expressed in billions of CFA francs:
1/ The Entente then comprised the Ivory Coast, Dahomey, Niger and UpperVolta. Each country contributed a fixed percentage of its publicrevenue. After an allocation to a reserve fund, the proceeds werere-distributed, 1/16 to the Ivory Coast and 5/16 to each of theother three. Thus, the Ivory Coast was a net contributor to thebudgets of the others. In 1965, the Solidarity fund was transformedinto a Guarantee fund to insure private (or public) foreign invest-ment in any one of the participating countries (including Togo since1966) against any losses due to default, whatever the cause, politi-cal or otherwise.

- 15 -
1960 1962/6/ 1963/64 1964/65 1965/66 1966/67(Provisional)
1. Current revenue 3.9 5.4 6.4 6.9 8.4 8.5
2. Current expenditure/ 5.1 6.1 6.2 7.1 7.8 8.5
3. Balance -1.2 -^7 +.2 -.2 +.6 0
4. Investment expendi-tures c/ -. 5 -. 8 7 9 -1.2 -1.0
5. Total excess expendi- petures (3) + (4) -1.7 -1.5 -,5 -11 -. 6 -1.0
6. External contributionsto the budget 1.4 .9 .7 .4 .25 .15
7. Of which: French (1.0) (.5) (.6) (.4) (.25) (.15)
8. Internal financing .4 .6 -. 2 .7 .35 .85
a/ Since 1962, the fiscal year is from October 1 to September 30.b/ Including debt servicing, which is very small until 1966/67.c/ Investment of the Goverment budget and road fund: excludBS investment
financed through project aid.
Source: See Appendix Tables 11, 12, and accompanying notes.
That part of excess expenditure not financed by external contributions(line 8) has been met by non-current revenue of various kinds (proceedsof national lottery, past reserve funds, contribution from retirementfund, and from the agricultural price stabilization fund, etc.) and/or'by changes in the *6sores liquidity position in one direction or theother (see Appendix Table 13). 1/43. Current surpluses have been exceptional. It can be said, how-ever, that from 1963/64 the situation has been improving in this respect,as a result of both an increase in the taxation effort and a tighteningof expenditure control, which has come to be particularly efficient inNiger. Tax proceeds consistently constitute around 95 percent of total
1/ The Nigerien Tresor is not separated from the French Tresor (con-trary to what has happened in all other former French colonies).'Whatever excess liquid funds the Nigerien section of the localTresor has are deposited with the French section in Niger and donot necessarily go to France through the Central Bank, as is thenormal case in other countries.

- 16 -
revenue. Taxes and duties on external trade, imports for the greater part,have varied little, around 50 percent of tax revenue. This relatively lowfigure, in the African context, is to be explained by the fact that thepoll tax ("impot du minimum fiscal") on heads of people and on livestockhas not seen its role diminished. It represented 11 percent of tax revenuein 1960 and 19 percent in 1966/67. Rates of this tax are roughly differ-entiated according to the estimated wealth of each area (e.g. a littleunder CFAF 1,000 in Niamey and CFAF 250 in Agadez). Collection of this taxis efficient, contrary to that of taxes on wages, salaries and profits,though real efforts are made to correct this. Taxes on external trade haveincreased parallel to total revenue. The Government has found it difficultto increase rates of these taxes,as this necessarily means lower producerprices when applied to exports (because the c.i.f. price for groundnuts isfixed), or higher prices for imported goods which, because of the country'slocation, are already high.
44. The overall taxation rate has considerably increased during theperiod, from around 5 percent of GDP in 1956 to 8 percent in 1960, 9.5 per-cent in 1964, and an estimated 10.5 percent in 1966. Although even thelatter proportions may seem moderately low by international standards,they must be appraised in the light of the very low average income perhead and of the fact that in 1964 non-monetary income was still somethinglike 40 percent of total GDP. Taxes on money incomes represent over 15percent, on the average.
45. The decade under consideration has been one of great progresstowards the achievement of equilibrium in Government finance. This hasbeen done in a period of unavoidable, and indeed necessary, increases ofcurrent expenditure resulting from the attainment of independence, and oneof rapidly declining external assistance to the budget. However, currentsurpluses have been difficult to obtain and have remained the exceptionrather than the rule. Therefore, the financing of excess expenditure com-prising the current deficit, the Government investment budget and otherinvestments (i.e. roads fund), has been achieved by using other internalmeans. These are necessarily limited to the extent that they consist,for a great part, of liquid funds available to the Tresor. In fact, theliquidity position of the Tresor has become increasingly difficult onaccount of budgetary operations and also because funds of public institu-tions (e.g. postal checking accounts), normally deposited at the Tresorunder the French financial system, have been transferred to the develop-ment bank (BDRN 1/) in 1963 and in successive years. Advances from theCentral Bank have not been necessary until now but, but this possibilityis not excluded for the immediate future. In any case, such advances areby statute very strictly limited.
46. As is to be expected in a period of transition from colonialstatus to full independence, all items of public current expenditurehave increased. National defense and police, which were almost entirely
1/ Banque de Developpement de la Republique du Niger.

- 17 -
the responsibility of France, have grown most. However, they have beenstabilized at around CFAF 1.4 billion since 1964, and represent a littleover 15 percent of total expenditure in 1966/67. Social expendituresare lower, as a proportion, than in most similar African countries.This, of course, is a mere reflection of the still low rate of primaryschool attendance. Thus,education does not claim more than 10 percentof the total, a proportion which has changed little since independence,whereas health accounts for less than 8 percent. On the other hand,economic services, i.e. the departments of rural economy and of publicworks, do not account for more than 13 percent, a modest proportionstill, considering the overwhelming importance of these two sectors inthe economy and in the investment programs. Transfer outlays havealways remained at low levels, though subsidies - mainly to non-profitinstitutions - have greatly increased until 1966; their share is, how-ever, less than 5 percent in 1966/67. Quite naturally, the bulk of cur-rent expenditure is for general administration, which absorbed around40 percent of the total. It is worth noting that, contrary to almostevery other former French African colony, the proportion of expenditureon personnel is low, at around 45 percent, as a result of both lownominal salaries and a cautious policy in recruiting new staff, and alsobecause expatriate technical assistants are paid only nominally by Niger.As in other countries having achieved independence in 1960, it can besaid that Niger has now reached the end of the transitory period. Thismeans that in the future, expenditures linked to the new political status,i.e., on defense, police and general administration, should be preventedfrom growing faster than those on which the achievement of economic andsocial objectives depend.
47. Outside the Government budget, the Nigerien public sector com-prises mainly local authorities whose consolidated budgets representbetween 10 percent and 13 percent of the central government budgetvolume (see Appendix Table 13) and a number of public and semi-publicautonomous agencies and enterprises. These are of a very diverse kindand no global account of their operations is meaningful. 1/ Some, likethe Office of Posts and Telecommunications, are simple offsprings ofGovernment departments. In the trade sector, the SONARA 2/ actuallysupervises the marketing operations of groundnuts in Niger and directsits export with the help of its Paris branch, while the price stabiliza-tion board (CSPPN 3/) is simply a fund which receives profits on theexport of groundnuts and cotton above a determined level, or pays out acompensation when a loss is incurred in world markets (as for cotton,for example), and may in turn receive certain subsidies from EEC. As a
1/ A list of the enterprises in operation by the end of 1967 is inAppendix Table 1OA; Appendix Table lOB gives a picture of theaccounts of 14 such enterprises and other public institutions.
2/ SONARA: Societ6 Nigeri6nne de Commercialisation de l'Arachide.
I/ CSPPN: Caisse de Stabilisation des Prix des Produits du Niger.
- 18 -
whole, the CSPPN has had sufficient funds in excess of those necessaryfor its operation, largely as a result of profits made by SONARA. Thecontrast is easy between these agencies and the State enterprise incharge of imports (Copro-Niger), whose financial position is difficultand which has a sizeable debt towards the local banks and the develop-ment bank. The reasons for this situation are varied: insufficientequity capital at the start, management mistakes, high cost of the manysmall branches outside Niamey, etc. Copro-Niger, however, certainlyplays a useful role as a competitor to the private trading firms whosepricing policies are sometimes of a monopolistic character, to putthings mildly. In other sectors, the situation, from a purely financialpoint-of-view, varies from good (e.g. SNTU 1/ Niamey's bus company), tomediocre (e.g. the two state-owned hotels), to bad (e.g. the Malbazacement plant which, because of the limited market, works well belowcapacity 2/), while others are at an experimental stage (e.g. SOTRAMIL 3/,a millet-sorghum flour mill in Zinder which has made an encouraging start).
48. In connection with public enterprises the most remarkabledevelopment, perhaps, is the fact that the Government has recognized theirlimits and effectively tried to improve their performance, as has beenmentioned earlier. Action has been in two directions. First, 4 or 5 ofthe most deficient and hopeless enterprises - such as the "national con-tractors society" - have been discarded altogether and their debts havebeen paid by the Government in the course of 1966. Second, a supervisorycommittee has been instituted within the Ministry of Economic Affairs in1967, with the aim of imposing accounting rigor and financial control,and with the overall task of both appraising performance of the firms con-cerned and giving advice when necessary. Changes in the top managementpersonnel of some firms are also being effected. If anything, the super-visory committee is perhaps too much inclined to seek per±ection (forexample, by demanding quarterly balance sheets, etc.), but it seems to beaware, however, of the necessity of not impairing the autonomy and opera-tional flexibility of each enterprise.
External Finance
49. The nature and quality of the information precludes any detailedanalysis of changes in external trade and payments over the period. Noofficial statistics of the balance of payments exist, and trade figuresthemselves are subject to wide margins of error. Some important trendsemerge, however, and for some years. more details are available which willhelp spotlight the most relevant structure of the external balance ofNiger.
1/ SNTU - Societe Nigerienne des Transports Urbains.
2/ The technical management of the firm, however, appears to be excellent.
3/ SOTRAMIL - Societe de Transformation du Mil.

- 19 -
50. As noted in paragraph 33, trade in goods and non-factor serv-ices has assumed an ever-increasing role in the economy. The estimatesare as follows (in billion of CFA francs):
961 962 963 964 96a/ a1956 1959 1960 1961 1962 1963 1964 1965- 1966-/
Exports f.o.b. 5.0 5.0 7.8 8.5 9.7 9.9 10.3 (8.5) (11.9)
Imports c.i.f. 3.6 6.7 7.7 8.6 10.7 10.0 10.2 (10.2) (11.6)
Balance 1.4 -1.7 .1 -.1 -1.0 -.1 .1 -1.7 +.3
a/ Goods only.
Source: See Tables 20 and 21.
Changes in the composition of exports are impossible to measure becausethe accuracy of estimates is not the same throughout the period. Whatappears to be certain is that no drastic change has taken place, andshelled groundnuts, groundnuts products and livestock on the hoof togetherconsistently constitute around 80 percent of exports of goods and non-factor services. The latter do not exceed 5 percent of the total. Thebalance is composed mainly of products such as cotton, niebe beans, onionsand other vegetables, whose share has grown during the period, and of othermore traditional ones such as hides and skins, fish, sorghum and millet,which do not show any clear upward trend. The only mineral now exportedis tin ore (cassiterite) for amounts not exceeding 100 tons.
51. Apparently, the exports of cattle on the hoof have increasedmoderately during the period, probably a little faster than the growth oflivestock itself as the demand in Nigeria tended to increase faster andoutlets were not difficult to find. Thus, the rate of exploitation oflivestock has been somewhat stepped up to reach around 10/l percent, stilla low level by the standards of modern husbandry.
52. The growth of exports has come mainly from that of groundnuts,whereas groundnuts products, oil and cakes, have grown little:
1958 1959 1960 1963 1965 1966 1967
Groundnuts(shelled) '000 tons 87.0 52.4 50.5 91.4 86.4 130 140
Crude oil '000 tons 1.1 5.2 4.6 3.1 4.8 4.5 n.a.
Cakes '000 tons 2.3 5.4 5.9 4.0 6.8 6.5 n.a.

_ 20 -
Throughout the period, the French system of guaranteed price and quota(for shelled groundnuts) has been in force. This has permitted Niger tosell from around 60 percent (when the crop is high as in 1966) to 90 per-cent of its exportable crop at a price consistently above the worldmarket level by something like 10 to 20 percent, with the exception ofsome very brief periods of world booming prices. The guaranteed price,however, has been decreased from a level of CFAF 52.50 (c.i.f.) per kilo,which prevailed until the 1964/65 campaign, to CFAF 49.13 in 1966/67, inan effort to narrow the gap between the previous level and the EEC targetcost price of CFAF 45.25 (in 1966/67) and thereby the market price.There is little doubt that the stability of the export price, and henceof the producer price (see Appendix Table 7), combined with the assurancethat most of the quantities produced would be actually bought at thatprice, has been a powerful incentive to the producer. Also, the increasedefficiency of marketing operations, in the first instance the collectionof the crop in the "primary" markets by the official marketing board'sagents (SONARA. 1/), has been a strong factor in that direction.
53. Cotton production and exports have significantly grown only inthe last few years and were a negligible item until 1962. The 2,000 tons(fiber) level has been reached in 1966. Until the 1966/67 campaign, theproducer price was subsidized (see Appendix Table 7). This was done,first, by a West African stabilization fund, which itself received Frenchsupport; then, since 1964 by EEC, at a lower level. The price was againlowered in 1966/67. The cotton is sold on the French market, or other-wise, at the market level. Under the efforts of CFDT 2/, productivity inboth production and ginning has so increased that the lowering of priceshas not been seriously felt by the producer.
54. Other notable exports are hides and skins (goats), which areexported to Europe and USA, vegetables for which markets in neighboringcountries exist, and, from time to time, sorghum and millet.
55. The direction of trade has been at all times almost entirelydetermined by the very existence of the French guaranteed market forgroundnuts on one side, and by the fact that Nigeria is by far the mainmarket for livestock on the other. Exports to other countries havetaken some importance only in 1966, when perhaps 30 percent of the ground-nuts could not find place in France (see Appendix Table 29).
56. The rapid development of irports is simple to explain in a casewhere internal production is little diversified, import substitutionlimited, where money incomes grow, and where limitation to imports are
1/ Societe Nigerienne de Commercialisation de l'Arachide (see AppendixTable 9).
2/ Compagnie Francaise pour le Developpement des Fibres Textiles, aFrench semi-public, non-profit, crop development agency.
- 21 -
practically nil (since before liberalization of the franc zone, importsfrom France were not subject to any restrictions). Thus, imports in-creased much more than GDP.
57. The composition of imports (see Appendix Tables 20, 21) showsthree main features. One is the moderate increase of food and beveragesand their declining share in the import bill: 25 percent in 1960 1/, 13 per-cent in 1964, 14 percent in 1966. In value terms, Niger is probaTLy anet exporter of food. The role of imports of this category is not tomatch any overall quantitative deficiency in internal food supply but,quite naturally, to provide particular products whose production at homewould be uneconomical or is still littledeveloped (e.g. rice). A secondfeature is the surprisingly moderate growth of manufactured consumptiongoods, and indeed the decrease observed, for example, in 1966 as com-pared to 1961. This would tend to show that money purchasing power inprivate hands has not increased very much and is not high enough to per-mit the acquisition of imported goods because of their very high prices,especiaLly in the small population centers outside Niamey. Also, in-creases in personal taxation have curtailed the growth of disposableincome.
58. The biggest increases concern petroleum products and manu-factured goods for industry. The latter group became important in 1962,and grew steadily after that to the point of constituting over 50 per-cent of total imports in 1966 as against 20 percent in 1962. The reasonfor this growth appears to have been the construction of a few industrialunits during the period (oil mills, a cement factory being the mostimportant ones). As the economy is small and all the investment goodsimported, a few such projects being undertaken results in proportionatelyvery large changes in total imports and in their composition.
59. The actual balance of trade is almost impossible to ascertain.The unknown margin of error does not permit the drawing of any firm con-clusion. However, as deficits are apparently both more frequent andmore important than surpluses, a "normal tendency" towards an excess ofimports is more likely the case than the other way round. At the sametime, Niger has not shown any evidence of being a "structural" deficitcountry nor one where the situation in this respect has been deteriorat-ing.
60. It is repeatedly and officially claimed in Niger that theterms of trade, for which no statistics exist, have been deterioratingin the long run. In fact, the groundnuts c.i.f. guarantee price hasbeen very stable until 1965-66, while the prices of imported goods haverisen more or less rapidly according to degrees of inflation in supplying
1/ Figures prior to 1960 too unreliable. Figures based on recordedimports and including tobacco. Actual figures should be slightlyhigher all over the period as unrecorded imports fall mostly inthis category.
- 22 -
countries, mainly France. The outcome, however, would depend on theevolution of prices of livestock, Nliger's second largest export. Theseappear to have risen for# cattle by around 50 perNcent from 1955 to1960 1/ and in a lower, but unknown, proportion in the following years.It can~ be concluded, finally, with a fair degree of confidence, that(i) on the average, the terms of trade have deteriorated somewhat, and(ii) the terms of trade to the groundnuts producer have deteriorated
more than the average.
61. The balance of payments and its evolution are known very im-perfectly. The only reliable statistics concern transactions with non-franc area countries (other than Nigeria, with which unrecorded tradeis important), which is only a minor part of the total. The main quali-tative features of the balance, however, are known and some of its"sensitive" points also. These are not different from those of theother poor countries of former French Africa, i.e. (i) as alreadystated, a moderate trade deficit aggravated by the services account,(ii) important "private transfers" outflows, which are normally morethan compensated by (iii) an inflow of public transfers. Net factorpayments apparently vary in direction because of the important inflowof remittances by migrant labor to Niger. However, item (ii) above,as defined in official statistics includes factor payments in additionto those officially identified, and it is more than likely, therefore,that net factor payments are normally a big "minus" in the country'sexternal balance. Available figures are summarized in the followingtable:
1/ BDRNI, 1966 Report, p. 55.

- 23 -
ESTIM4(,TED IvIAIN NET IT&ES OF BAIANCE OF PAYMENTS(billion of CFA francs)
1956 1959 1960 1961 1962 1963 1964 1965 1966
1. Goods and non-factor services 1.4 -1.7 -0.1 -0.1 -1.0 -0.1 0.1 -1.7 0.3
2. Factor payments a/ n.a. n.a. n.a. 0.4 0.4 -0.6 -o.6 n.a. n.a.3. Balance (1) - (23 n.a. n a. n.a. 0.3 -7§ -Z.7 -7 n.a. n.a.4. Public transfers b/ 3.7 5.0 4.0 5.9 6.5 6.0 4.8 2.7* 2.8*5. Private "transfers" c/ -5.1 -3.3 -3.7 -6.4 -5.8 -5.3 -4.5 -3.1 -2.66. Balance (4) - (5) -:7. 1.7 U73 -07U 0.7 0.7 -0.2 -- 0.27. Errors and omissions ) 0 0.l 0.1 0.8 -0.9 -0.3
8. Change in reserves d/ ) ) -0.1 +1.0 +1.3 -0.1(+= decrease; - = increase)
a/ Factor income payments as identified in national accounts. Positive figuresfor 1961 and 1962 result mainly from migrant remittances by Nigerien workersabroad. This item disappears in 1963 and 1964 accounts for reasons notexplained. See note (c).
b/ In 1965 and 1966, includes French (FAC) and EEC operations only. Figuresfor other years include sometimes a small amount of public loans.
c/ "Private transfers" is in fact a residual item after taking account of alltransactions in the balance, including public transfers. Since it includes -in unknown proportions - income factor payments (notably gross profits offirms) private current transfers, private capital and possibly some tradetransactions, this item blurs the very concept of "the balance on currentaccount".' There is little doubt, however, that its existence means alarger deficit of the current balance than figures of line 3 of the tablewould suggest.
d/ Reserves of particular countries of the West African Monetary Union notidentified before 1962.
62. The most important of the "sensitive" features referred toabove concerns the relationship between private and public flows offunds. It is clear from the figures, however imprecise they may be,that the net outflow of private funds (very similar to the gross out-flow) matches almost entirely the net (very similar to the gross) inflowof public funds. Adding factors payments abroad to the former would, incertain years, totally annihilate any excess of the latter. This stateof affairs has been the subject of grave dissatisfaction in officialcircles, especially so in the "socialist" mood of the early Sixties.
63. The inflow of public funds include, of course, aid fram themain sources (FIDES, FAC, OCRS, FED) 1/ and also other public
1/ FIDES - French Fonds d'Investissement et de Developpement Economiqueset Social. FAC - Fonds d'Aide et de Cooperatimn (which replacedFIES in 1960). OCRS - Organisation Commune des Ri5gions Sahariennes,French public agency in charge of development in the Sahara portion ofthe former French territories and departments concerned. FED - FondsEuropeen de D6veloppement of the European Economic Community.

- 24 -
expenditures, current and capital, civil and military; which until thevery last years of the period under consideration were very important,actually exceeding development aid. Thus, the departure of some Frenchforces in 1964 and 1965 explains for the greaier part the decrease inthis item of the balance of payments. (Statistics of aid proper willbe found in Table 13A).
64. The nature and content of the item called "private transfers"outflow is not precisely known. There is little doubt that it includesprofits and savings out of personal income, as well as capital proper.In fact, for lack of confidence and/or investment opportunities in thecountry, the greatest part of business and personal savings are trans-ferred abroad (and the more so that the CFA franc parity encourages suchmovements). Since external aid and other foreign public expendituresare one of the major determinants of money incomes, Niger would be atypical case of "feedbacktt effect of foreign aid whereby the publicsources of external aid simply, in the end, finance the private andexpatriate sector of the receiving country. There has been concern alsoas to whether "transfers" outflows did not at times reflect some dis-investment by private firms and at the insufficient inflow of externalcapital in the case of the creation of new firms, the lack of long-termcapital being compensated. Finally, the banks themselves tend to investabroad their idle funds, with a view to earning higher interest.
65. This general interpretation of the facts is at the core of themotives which prompted Niger to create a large State trading firm (Copro-Niger) and other State enterprises, in the hope of retaining funds whichwould then become available for internal use. The advisability of remain-ing within the West African Monetary Union was also questioned in theearly Sixties. However, Niger has remained a member of the Union, and itis the role and the very existence of the State enterprises whichhave been increasingly criticized.
66. External equilibrium - or rather disequilibrium - has beenachieved by a sharp decrease in the external net reserves imputed toNiger within the monetary union, to the point that these have becomenegative during the fourth quarter of 1965 and have remained so untilthe end of 1967, with short intervals in 1967 when they became slightlypositive. From CFAF 1,579 million by the end of 1962, the net reserveshave declined to minus CFAF 600 million by the end of 1965, minus 472by the end of 1966 and minus 305 by the end of 1967. This situation, assuch, is not one which called for corrective measures, as would have beenthe case in a country monetarily independent, because the overall re-serves of the union have remained high at all times. The monetaryauthorities, however, have been as much preoccupied as the Government bythe existence of the underlying factors.
Monetary Developments
67. The fundamental features of the monetary union of the countriesof West Africa to which Niger belongs have remained unchanged throughoutthe decade 1956-66. Full and unlimited convertibility of the CFA franc
into French franc at a fixed rate by virtue of the cooperation agreementswith France is the backgone of the system. Credit control by means ofrediscount ceilings is the main policy instrument, variations of interestrates playing no role. What the treaty of 1962, instituting the WestAfrican Monetary Union between the newly independent states,and subsequenttexts have added to these basic characteristics is (i) identification ofbanknotes, with the result that the external assets imputable to eachcountry became possible; (ii) new measures of monetary policy to comple-ment rediscount ceilings in the form of liquidity ratios imposed to thebanks; (ii) a certain autonomy of decisions in each country through thecreation of national monetary committees, and (iv) uniform rules for thebanking profession and operations. Before 1962, advances by the centralbank to the Government were not possible. Facilities of this kind weregranted,when necessary, by the French Tresor. Since 1962, advances bythe central bank are possible within strict limits (240 days extendableto 360 days, and up to 10 percent of previous year tax revenue). Advancesby the French Tr6sor remain possible, however, in addition to those by theBCEAO. 1/
68. Within this general framework, Niger's banks have found it pos-sible to increase credits to the economy by over 100 percent between 1956and 1962 and again by almost 100 percent between 1962 and 1967. The in-crease has been fastest between 1963 and 1965 when CFAF 3.1 billion addi-tional credits were extended in two years. One reason was that severalrecently-created public enterprises had to rely on large credits becauseof lack of long-term funds of their own. Later, in 1966 and 1967, follow-ing the reorganization of the public sector and the discarding of some ofthe enterprises and the implementation of new stricter banking rules,this movement was slowed down. The large increase of CFAF 1.2 billion in1966 was primarily the result of a groundnut crop 50 percent larger thanin preceding years, while the decrease observed in 1967 is in part attri-butable to the fact that the credit tI public and semi-public firms was kepttight and the groundnuts campaign took a late start. (However, the finan-cing of the campaign has gained momentum in early 1968, and total creditshave reached the unprecedented level of CFAF 10.2 billion in February.)Credit to the Government has fluctuated but has at all times remainednegative as a result of Government deposits at the central bank andTresor's own credit operations (discounting of customs bills) beingalways more than credits received (in the form of custom bills redis-counted at the central bank).
1/ Banque Centrale des Etats de l'Afrique de l'Ouest.
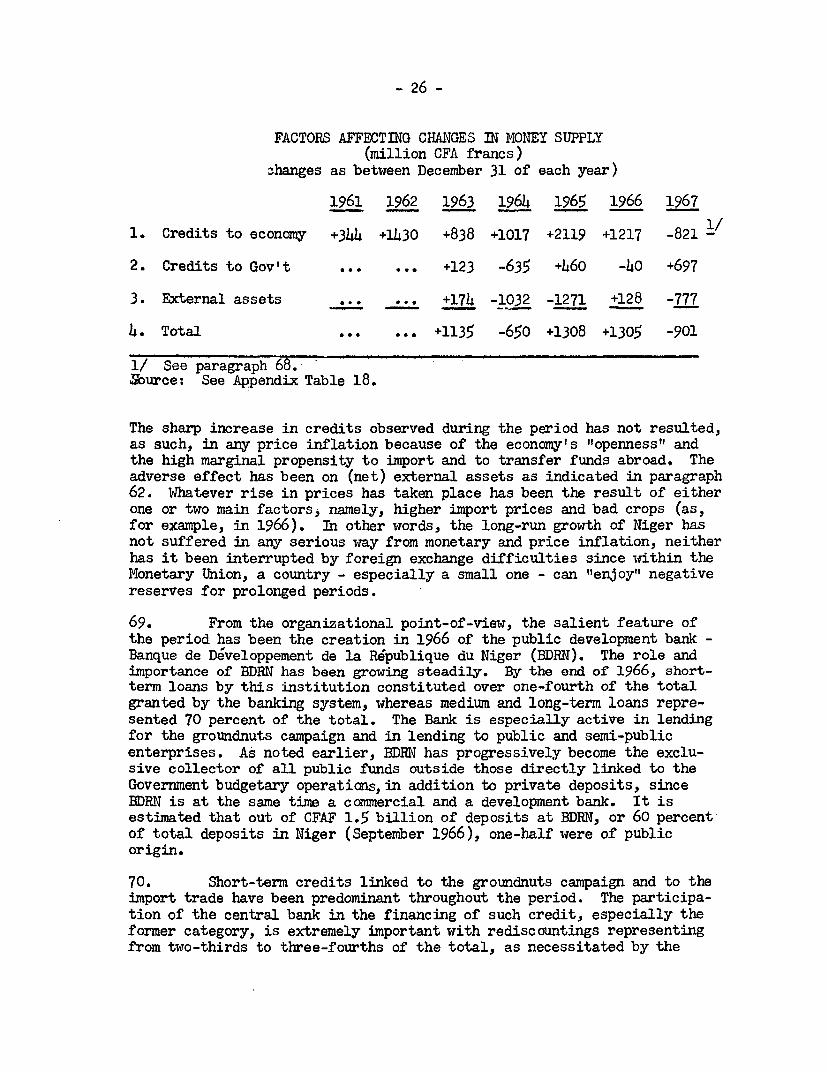
- 26 -
FACTORS AFFECTING CHANGES IN MONEY SUPPLY(million CFA francs)
qhanges as between December 31 of each year)
1961 1962 1963 1964 1965 1966 1967
1. Credits to econamy +344 +1430 +838 +1017 +2119 +1217 -821
2. Credits to Gov't ... ... +123 -635 +460 -40 +697
3. External assets ... ... +174 -1032 -1271 +128 -777
4. Total +1135 -650 +1308 +1305 -901
1/ See paragraph 68.Source: See Appendix Table 18.
The sharp increase in credits observed during the period has not resulted,as such, in any price inflation because of the economy's "openness" andthe high marginal propensity to import and to transfer funds abroad. Theadverse effect has been on (net) external assets as indicated in paragraph62. Whatever rise in prices has taken place has been the result of eitherone or two main factors, namely, higher import prices and bad crops (as,for example, in 1966). In other words, the long-run growth of Niger hasnot suffered in any serious way from monetary and price inflation, neitherhas it been interrupted by foreign exchange difficulties since within theMonetary Union, a country - especially a small one - can "enjoy" negativereserves for prolonged periods.
69. From the organizational point-of-view, the salient feature ofthe period has been the creation in 1966 of the public development bank -Banque de Developpement de la Ropublique du Niger (BDRN). The role andimportance of BDRN has been growing steadily. By the end of 1966, short-term loans by this institution constituted over one-fourth of the totalgranted by the banking system, whereas medium and long-term loans repre-sented 70 percent of the total. The Bank is especially active in lendingfor the groundnuts campaign and in lending to public and semi-publicenterprises. As noted earlier, BDRN has progressively become the exclu-sive collector of all public funds outside those directly linked to theGovernment budgetary operations,in addition to private deposits, sinceEDRN is at the same time a commercial and a development bank. It isestimated that out of CFAF 1.5 billion of deposits at BDRN, or 60 percentof total deposits in Niger (September 1966), one-half were of publicorigin.
70. Short-term credits linked to the groundnuts campaign and to theimport trade have been predominant throughout the period. The participa-tion of the central bank in the financing of such credit, especially theformer category, is extremely important with rediscountings representingfrom two-thirds to three-fourths of the total, as necessitated by the
- 27 -
volume and pace of sales Of the groundnut crop. Medium and long-termcredits by banks and CCCE ;/ have always remained small and the centralbank's contribution to their financing negligible. During the periodunder review, housing has been the main sector of activity with industrybeing represented mainly by a loan of CFAF 200 million for the construc-tion of the cement plant at Malbaza.
Savings and Dhvestment
71. The nature of the available information makes it very difficultto present the full picture of relations between savings and investmentsalong traditional lines. This is due mainly, but not only, to the uncer-tainties surrounding the statistics of the balance of payments and, inparticular, the very imprecise recording of services and factor paymentstogether with that of private capital movements, as already noted. Ameaningful picture for the 1956-64 period is attempted hereafter, basedon figures from national accounts of Niger, after some adjustments andcorrections, while the more recent period will have to be considered inmore qualitative terms since no national accounts exist after 1964.
j/ CCCE - Caisse Centrale de Coope"ration Economique, a French publicdevelopment bank operating in the former French colonies and inthe overseas departments.

- 28 -
SAVINGS AND INVESTMENT
1956 1960 1961 1962 1963 1964
"Domestic Savings" a/
1. Private 6.0 4.4 10.1 11.8 11.8 9.12. Public b/ -2.9 -2.7 -4.1 -4.0 -2.9 -1.0
3. Total 3.1 1-7 5.9 7.8 8.9 8.1
Transfers as recorded (net) c/
4. Private -0.7 0.4 -0.5 -0.2 -0.4 -0.45. Public 3.7 4.0 5.9 6.6 6.0 4.8
6. Total transfers 3.0 4.4 5.5 6.4 5.6 4.4
7. Available Savings(6) + (3) 6.1 6.1 11.4 14.2 14.5 12.5
8. Gross domestic investment d/Total 1.7 4.6 5.1 9.2 9.9 9.0Public (fixed) 0.8 1.9 1.5 2.5 2.8 2.5
9. Excess available savings overdomestic investment (7) - (8) 4.4 1.5 6.3 5.0 4.6 3.5
10. "Financial (private) trans-fers" in external balance e/ -5.1 -3.7 -6.4 -5.8 -5.3 -4.5
a/ As in income appropriation accounts of firms, households and Governmentsshown in national accounts.
b/ Includes Niger's Government operations, rest of Nigerian public sectorand French operations as well. See note to para 27.
c/ Identified current "transfers" in income-appropriations account.
d/ As in capital account. For 1956 only fixed capital formation.
e/ As in external balance of national accounts. See table paragraph 61note 3.
General note: Figures for 1956 and 1960 not directly comparable to otheryears and probably more inaccurate.
- 29 -
72. The above figures show that, overall (i) domestic savings havenot been, in most years, very different from gross domestic investment,being slightly more (1956, 1961) or slightly less (1952, 1963, 1964).This could suggest that the level of domestic savings is almost suffi-cient as compared to domestic investment, and that the inflaw of external(public)resources is therefore necessary only because the mobilization ofdomestic savings is not properly achieved, and part of domestic (private)savings flow out and have to be "replaced" by an inflow of external(public) savings. This is an ex-post view of the phenomenon alreadymentioned in the context of the balance of payments. However, this istrue in an accounting sense but it would certainly be wrong if it weretaken to mean that during the period under review the Government failedto mobilize all domestic savings in a way which could have made possiblea reduction of external aid. What happens, in fact, as noted earlier,is that a certain proportion of total investment, around half the total,takes place in the traditional sector where the process of saving and theprocess of investment are one and the same thing (the growth of livestock,traditional house building, etc.). In that case, there is no problem ofequilibrium between the two but, at the same time, there is obviously noquestion of transferring "savings" from one section of the economy to theother. Thus, the public sector has been in deficit all the time witheither not enough savings or negative savings and external resources havefilled the gap. Why "free" private savings have not been mobilized by thepublic sector and have been let to flow out of the country is to beexplained, in fact, in terms of the financial and monetary arrangements ofthe monetary union to which Niger belongs: the borrowing capacity of theGovernment is limited and it could not service a sizeable internal debt ata rate of interest which would be attractive for the private sector.Private savers obviously have had better and unlimited opportunitiesabroad. And the Government and public agencies could rely on externalpublic grants and, if necessary, borrow modestly on soft terms fromFrench public institutions (Caisse Centrale de Coope'ration Economique).Finally, it is important to note that the public sector, as defined in theabove table, includes operations of French agencies and military forces inNiger and this tends to increase negative savings. When the Nigerien pub-lic sector is isolated, it appears, when this is feasible, that publicsavings although negative are not so heavily negative, with 1964 showingpositive savings of, apparently, CFAF 1.1 billion 1/ (see Appendix Table 17).
73. What has happened since 1964 regarding the savings-investmentpicture can only be roughly inferred from scanty data. The essentialfeatures certainly have remained the same in two important respects.First, Government savings on account of the budget appear to have beensmall (CFAF 600 million in 1965/66) or practically nil (1966/67) orslightly negative (in 1964/65), and practically all public investment,
1/ This figure emerges from the national accounts, but it seemsrather large, in view of the fact that the Government budget surpluswas only in the vicinity of CFAF 250 million.

- 30 -
which has increased as indicated later (para 80), has been financed byforeign aid. Second, although private transfers have apparently diminishedaccording to central bank statistics (see table, para 61), they have re-mained heavily negative. Thus, private national savings have been certain-ly much lower than private domestic savings. The latter, however, are notknown after 1964., and it cannot be said whether the apparent decrease inprivate transfers abroad is due to lower domestic savings or to the factthat more of these have remained in the country.
74. As has been noted earlier, there is no evidence of the Nigerienpublic sector having increased its current expenditures so as to wipe outany potential savings in a manner which would seem unwarranted. It istrue that public and semi-public enterprises have necessitated some budgetsupport and have found themselves in a difficult financial situation forhaving relied too much on bank credit for financing their current opera-tions. But as already noted, the Government has started an effective re-organization program in this sector and the situation had markedly improvedby the end of the period under consideration.
75. Since the difficulty of finding good investment opportunities forprivate capital outside certain sectors such as trade and construction isevident and the Government cannot easily retain private savings with thepresent institutional framework, the case for external public aid is clear.External aid has been not so much a supplementary item permitting thefinancing of gross investment as the essential piece of the savings-investment equilibrium mechanism. What best use for aid and how to increasethe contribution of local public and private savings are nonetheless veryreal questions for the future.
- 31 -
III. DEVELOPMENT PROBLEMS AND PROSPECTS
76. It has been pointed out already that the current planning policyrepresents an effort towards realism and practicability. This isreflected in three important and related fields: planning, sectoralstrategies, and budgetary policy. The following paragraphs discussthese together with the implication for the external balance and theexternal aid requirements for the period up to 1974. 1/
A. Overall Review of Planning
77. The present 1968-71 program is the result of successive adjust-ments of past plans and programs which were systematically over-ambitious,superficially overdetailed in their objectives, had little relation withexisting possibilities and sought, with more faith than competence, tointroduce "structural changes".
78. The "Perspective Decennales" 1965-74, prepared in the yearsimmediately following independence have never been translated intopractical terms although they have not been formally discarded. Thefirst plan proper was an interim three-year program for 1961-63. Thisprogram proved reasonably realistic after its period of application wasextended by one year, and by the end of 1964 nearly 80 percent of theoriginal public expenditures target had been realized. The 1965-68 planwas supposed to represent the means to realize the first half of the ten-year "Perspectives". Investment targets were put at CFAF 43.2 billionof which CFAF 33.4 billion public (of which 4.9 billion local and 28.5billion external). Disbursements during the first year were nearly 72Percentof forecast. However, it was soon realized that the plan was far tooambitious and would not be implemented. The flow of foreign aid was notat the expected level and at the same time the rate of spending on aidcommitted was low: insufficient absorptive capacity appeared as the majorobstacle, especially in the agricultural and construction sectors. Diffi-culties were encountered also in the public and semi-public sector enter-prises. In short, the need for reforms in the development policy thenappeared more urgent and decisive than any attempt at sticking to theplan investment targets.
79- Change has been sought in three directions: adjust the plan'sobjectives to the means available, financial as well as human, reorganizethe public sector enterprises as explained earlier, implement real coordi-nation between government departments and between these and the planningunit. Niger has adopted now a rolling program system: every year a four-year investment program is prepared almost exclusively for the publicsector, while the plan proper, embodying a new set of objectives and
1/ The terminal date is taken as defining a conveniently long perspectivecorresponding to the end year of the forthcoming second convention ofassociation between EEC and African countries.

- 32 -
refonms if necessary, is to be prepared every four years. A first sketchypublic investment program was defined for 1967-70. The program now appli-cable is for 1968-71 and preparation of the 1969-72 plan is to start in1968. The 1968-71 program, after a number of revisions, is as follows:
INVESTMNT PROGRAM OF PUBLIC SECTOR(billion of CFA francs)
1967 1968-1971 %
1. Surveys, studies, etc. ... ... 0.12. Infrastructure 1.2 5.7 36.03. (Roads) (0.8) (5.5) (34.6)4. Social 0.8 2.9 18.25. Administrative training 0.2 0.9 5.86. Production 3.0 6.3 39-97. Water resources (1.9) (.48) (30.0)8. Agriculture (1.0) (1.4) (8.5)9. Industry ( -(.2 (1.4)
10. Total net investment 5.2 15.9 100.0
11. Renewal and maintenance 1/ 1.012. Local authorities 0.06 o.6
13. Total estimated gross investment 5.26 17.5
14. Other 2/ 13.0
80. Average gross investment of CFAF 4.4 billion per year over 1967-71--excluding the exceptiona items contained under the item "Other" ofthe above table--does not represent an unduly optimistic estimate on thebasis of both financing and absorptive possibilities. As concerns theformer the program figures take account of the fact that at the beginningof 1967 there were some CFAF 8 billion of foreign aid, mainly from FED 3/,committed on past projects but not yet spent. To this must be added CFAF1.7 billion obtained by the middle of 1967, or a total of CFAF 9.7 billionrepresenting over 40% of expected total funds to be spent or committed overthe five years 1967-71. Out of the CFAF 13 billion, or so, yet to beobtained, a modest CFAF 1.2 billion are expected to come from local publicsources, and nearly CFAF 12 billion from external sources. It is expectedthat FED and FAC will contribute about half of the total each, other sources
1/ Partial figure concerning road maintenance only.T/ This covers mainly estimated investment by public and private foreignsources in the uranium mining company (around CFAF 11 billion over 6years) and a few major enterprises (textile, sugar mill, etc.).Excludes investment by autonomous public and semi-public enterprisesin the commercial and industrial sector.
3/ FED = Fonds Euror6en de D6veloppement, the European Economic Communitydevelopment fund for the overseas associated countries. See Appendix -Table 15.

- 33 -
playing only a marginal role. Absorptive capacity, on the other hand, hasincreased in recent years permitting stepping up in the use of funds frombelow CFAF 2 billion per year in 1959-61 to around 3 billion in 1962-65,nearly 3.4 in 1966 and an estimated 5 billion in 1967.
81. In the task of programming investment for 1967-71 the effort hasproperly been put on the definition of all the particular operations andprojects to be undertaken by each government department and public agency,in the adaptation of rates of spending to actual financial and adminis-trative possibilities and in devising a system for the control of operationsthrough time. As a result, however, the forecast of the effects of theinvestment program on production of goods and services has been neglectedor rather left as a task to be undertaken as part of the 1969-72 plan.Sectoral programs, however, have been prepared especially in agriculture and traspaThe rate of growth of GDP was put at 5% per year in the 1965-68 plan. Thegenerally accepted estimate thought to be consistent with the current,more modest program is a figure of 4I?, or slightly over, per annum. Noprecise forecast is attempted: the planming unit realizes that the relationbetween the rate of investment and the rate of growth is far from direct inNiger's circumstances: weather and the terms of trade to mention only twoare important and unpredictable factors.
B. The Sectoral Development Strategy
82. It can readily be seen from the composition of the investment
program that two subsectors--roads and water resources--absorb nearly 2/3of the total. Consistently with this choice, the Government intends tocontinue to increase the current budget allocations for the maintemnceof roads (through the roads fund and through the road maintenance projectcurrently under consideration by mA) and of hydraulic works (wells, dams,etc.) by channelling more funds to OFEDES 1/. This choice reflects thedesire to deal with the two major development pre-requisites given Niger'snatural conditions. The size of the current program in these fields isalso intended to compensate for past neglect of maintenance of the transportinfrastructure, although transport has long received priority in pastinvestments, while the program for developing water resources is thecontinuance of a 'big push" action initiated a few years ago with aidfrom FAC and FED.
83. Following the current program some large road projects will bepursued--particularly the paving of the main West-East axis Niamey-Zinder--and new emphasis will be put on secondary roads in order to permit andconsolidate the expansion of cultivated area and the progress in themarketing of production. A general plan for the transportation sectorup to the late seventies has been prepared based on a general survey ofthe sector in 1966 and the main problem is only one of determining oneconomic grounds, the time pattern of the investment operations.
17 OFEDES: Office des eaux du sous-sol, a sem1-autonomous agency underthe Ministries of Rural Econony and of Public Works, in charge ofmaintaining hydraulic works financed with public funds.
- 34 -
84. The economics of developing wrater resources is much more intricateand the choice of a policy much more difficult and the results, so far, alsomore dubious than in the case of transportation. This is so because of thedual character of water works as being consumer goods and producer goods atthe same time (in varying degree, of course, as a village well and an irri-gation dam are different goods). As a result though-the "need for water" isobvious, which aspect - the consumers or producer's _ has to be emphasizedis not always clear. Second, the choice of technique is never obvious asbetween "modern" construction--be it for wells or for dams--which are morecostly in terms of investment or "traditional" ones which require greatermaintenance effort. Third, the conditions for making the use of watereconomically justified in the agricultural production are seldom all met:the obstacles are technical (e.g., insufficient knowledge of water require-ments of different soils), institutional (organization of land tenure), human(lack of irrigation experience), and economic (choice of crop pattern) andnone of them has been solved. The plan recognizes this, which is a greatstep in itself and may permit the savings of billions of francs which somecircles in the Government would all too readily be prepared to spend inirrigation projects. The results of the few such projects completed in therecent past will thus be carefully examined. Cautious advance and con-centration of efforts on one area (mainly with FAC financing) at a timeare more generally favored now as against the undertaking of too largeindividual operations all at a time. Also the not so "glamorous" programsof village wells construction to serve human and livestock needs are morereadily accepted and carried out on a large scale (mainly -with FEDfinancing).
85. Whatever the long-term future of irrigation the more pressingproblems in the agricultural sector concern the main and secondary cashcrops, groundnuts and cotton. Niger has reached a point where extensivegrowth of these two crops is not going to be remunerative to producers inthe face of declining prices. This is well understood and productivitygains obtained in the recent past, in contrast to area expansion, is a veryencouraging fact. Higher yields per hectare are necessary in order toprevent groundnuts and to a lesser extent cotton--encroach upon the areanecessary for food crops, while higher productivity per man is the logical"response" to compensate for lower prices. Thanks to more widespreadextension work ("animation" and "fvulgarisation"), improved seeds, flexibleagricultural credit, further use of draft animals, and in some areas moreheavy investments, including water works, it is hoped that in the courseof the next four or five years the average yields in groundnuts will beraised by 25% or so and still more in cotton production. 1/
86. The second largest export production, livestock, has benefittedin the past from improvements in veterinarian services and supply of water.The long-term policy for the future will be in two complementary directions:(i) further improvements in these two fields, especially the second one,and (ii) investments in more directly commodity producing projects such asranches or meat processing units. These, however, are difficult not only
1/ See Report of the FAO/IBRD Agricultural Crecnt Mission, no 2/68 NIGER I,of January 31, 1968.

to implement but even to conceive of because the secular habits ofherders in that part of the world are not easy to modify and, althoughnot very productive by modern standards, are far from "unproductive"(see para 26) and are well adapted to ecological conditions.A cautious approach is being followed. A first ranching scheme ("NordSanam" ranch), north-west of Niamey has been started in 1967 to supplyhigh quality animals to the Niamey slaughterhouse with the objective ofexporting meat to the coastal countries. Marketing arrangements with theIvory Coast are being negotiated. A UNDP-financed survey of ranchingpossibilities in a vast area north of Zinder is being carried out. Otherproject-oriented studies concerning the Entente group of countries arealso underway.
87. Outside the agricultural sector the Government developmentpolicy is also one of cautious progress: rather than seek to create anindustrial sector at whatever cost, i.e., under heavy tariff protection,the emphasis is put now on (i) systematic exploration of market possibi-lities, (ii) minority Government participation in private firms,(iii) attraction of foreign capital and know-how by tax incentives(38 firms have been admitted to benefit from the "Investment Code"between 1963 and 1967), (iv) improving the quality of secondary leveleducation in its technical and vocational aspects, and finally (v) apolicy of regional cooperation in the sense of trying to agree withneighboring countries on avoiding competition, a limited but politicallyvery difficult task.
88. As for the social sectors the Government is well aware of thebudgetary constraints and at the same time politically strong enough toresist demagogic pressures. The long term "model" for the developmentof primary education is currently a much debated subject which turnsaround the relative merits and costs of classical methods versus theextension of a television system now at an experimental stage. 1/
89. The above conments are not intended to mean that, in all fields,a clear long run strategy has been devised and all the obstacles removed.It is however the case that in its most important aspects such a strategyis presently viewed by the Government with a sense of realism both asregards the objectives and the means. It is the case also that policiesfor the long term are not on paper only and that the program of publicinvestment reflects a genuine desire to serve as a guide for day to dayaction.
C. The Budget and Development Policy
90. The budgetary prospects have been worked out by the Governmentwith the assistance of French advisers in an effort to make them con-sistent with the development program. The basic assumption is thatrevenue will at best rise by 4.5% to 5% per annum between 1967 and 1971,or by a little over 20% over the period (at constant prices). This is
1/ The experiment concerns 20 schools in the region of Niamey. It isfinanced by the French Government.
- 36 -
much less than the observed increase of 58% (at current prices) between1963 and 1967 and it is a reasonable target. It implies a slightlyhigher overall taxation rate only, in contrast also with the trendobserved over the last ten years (see para. 44)*. In fact, the yieldon a number of taxes, the rates of which have been considerably increasedin recent years,' has not increased at all. New taxes (on meat sales)imposed in 1966 have proved extremely difficult to collect. Taxes onimports weigh heavily on the cost of consumption and investment inputsand, on the average, represent already 35% of the c.i.f. value of(recorded) imports. Taxes on exports (of groundnuts and cotton) arebeing reduced because of the falling export prices. Personal taxes onthe peasant population are high also and if their yield is good it isjustly felt that farmers would be strongly resistant to further increases,especially at a time when producer prices for the main cash crops arebeing lowered. As in most African countries of similar structure abetter collection of taxes on wages, salaries and profits is possiblebut this will not provide more than a once for all addition of one ortwo hundred million CFA francs. 'Finally, the revenue out of new or highertaxes is expected to be around CFAF 200 million per year only.
91. However, a welcome addition to government income will result
from the arrangements concluded, late in 1967, with the French Governmentregarding the uranium mine of the Air 1/. The full benefits will notaccrue before the mid-seventies when the production reaches full capacity.The government might then receive up to CFAF 600 million yearly in taxesand "royalties" while perhaps CFAF 200 million will be obtained each yearbetween 1971 and 1974. On the other side, the so-called "investment"subsidy from France to the budget (CFAF 150 million in 1967) is notexpected to be renewed in 1968 or for the subsequent years.
92. Expenditures on current account have increased rapidly since1960 as a result of independence and their "normal" level may be said tohave been reached now. It is expected therefore that increases in expendi-tures will result (i) from an in-built overall growth of 2% per annum duefor example to past commitments or wage increases; (ii) from the necessityto strengthen the services mostly concerned with development (Ministry ofRural Economy: +6%, transfer to UNCC2?1l2%, DFW + h%:);(iii) from increasedsocial charges connected with the corresponding development targets(education +5%, health +2%), and (iv) from the recurrent charges linkedwith investments in the economic sectors or necessary to compensate forbacklogs of deferred maintenance (e.g., the 15% yearly increase agreedupon with IDA for roads maintenance). The resulting overall growth ofcurrent expenditure between 1967 (fiscal year 1966/67) and 1971, includingservice;u* on debt contracted by mid-1967, which will be around CFAF 200/250million, would then be a little under 20%, or 4.5% per annum.
93. The budget forecast is then as follows, making the furtherassumption that, with the exception of the income from the uranium mine,the trends of revenue and expenditure will hold good until 197h:
1/ See Annex I.2/ Union Nigerienne de Cooperation et de Credit, a public semi-autonomous
body responsible for some extention work, organization and supervisionof cooperatives and other types of community development.

- 37 -
GOVEM HT'IT BUDGET PROJECTI0N-/(in billion of CFA francs)
2/1967- 1968 1969 1970 1971 1972 1973 1974(prov.)(est.)
1. Revenue 8.5 9.6 9.9 10.4 10.9 11.4 12.0 12.62. Expenditure 8.4 8.8 9.0 9.5 10.0 10.5 11.1 11.7
3. Balance 0.1 0.8 0.9 0.9 0.9 0.9 0.9 0.94. Income from
Uranium - - - 0.2 0.2 0.2 o.65. Government
saving 3/ 0.1 0.8 0.9 0.9 1.1 1.1 1.1 1.5
94. It might seem that the above projections do not sufficiently stressthe effort needed to increase the Government's participation in the develop-ment program since the surplus does not increase overtime except for theincome from the uranium mine. Thus, total savings over 1968-71 will amountto some CFAF 3.5 billion or hardly 20% of the public investment targets,but this is also more than the original expectation of the Plan (see para.80) and as the forecast for revenue is rather optimistic it has to beconsidered as a maximum.4/Two important qualifications must be made inthis connection. First, the projected level of savings is high as comparedwith the past when a sizable surplus (CFAF 600 million) was achieved onlyin 1966. Some doubts may be cast indeed on the budgeted CFAF 890 millionfor 1968 in view of the provisional results of 1967 when it would besurprising if even a mere hundred million surplus will appear from thefinal outcome.
95. Second, the achievement of a budget surplus is not the only ormost important test for appraising the Government's budgetary performance.The structure of current expenditures and the manner in which they areoriented towards development is as important. It is difficult, withouta detailed analysis, to appraise the "usefulness" of public current outlays.At least it may be noted that (i) military and police expenditure is keptat a reasonable level considering the size of the country, attempts atinternal subversion in recent years and the small absolute size of thebudget; the share of such expenditures is kept at around 17% of the total;(ii) the growth of social expenditures is kept within modest limits andreflects a real austerity policy in education; (iii) the emphasis isclearly put on development sectors: rural economny and related agencies
1/ Official forecast up to 1971, trend continued up to 1974.2/ Provisional outcome as at September 1967; actual outcome may be
around 8.8 billion for both income and expenditure.3/ After debt service assumed to remain in the vicinity of CFAF 250/300
million, as in the past, on the basis of debt outstanding as of June 30,1967. See,however, paragraph 105 and 106.
4/ See note (3) above.

- 38 -
(UNCC, OFEDES), public works, notably roads. These are three features ofthe budgetary policy which strongly reflect the Governmentts awareness ofthe links between the budget and policies for development.
D. External Finance and the Problem of Exports
96. Prospects for traditional exports appear less brilliant than
past trends might suggest. The reasons for pessimism are unquestionablyvery real. Qne is the total cessation, starting with the 1967/68 campaign,of the French support to groundnuts-exports which consisted of a subsidizedprice and a guaranteed outlet for the greater part of the crop. Another isthe forecast of falling prices for cotton and for other secondary producesuch as hides and skins. Prospects for livestock exports, on the otherhanid, are good to the extent that the African market, i.e.., Nigeria, Ghana,Ivory Coast, will be in a position to absorb increasing quantities, but itis difficult, however, to envisage great increases in supply in a relativelyshort period of time as livestock production is notoriously difficult to"modernize".
97. Favorable elements exist, however. It is reasonable to assumethat the EEC will still provide some form of compensatory finance to a fewexports from the overseas associated countries under the forthcoming associ-ation agreement for the 1969-74 period. No one knows, as yet, under whatguise, or on what amounts. It is generally believed, however, that oilsand fats, notably groundnuts, and probably also cotton, will be the mainbeneficiaries of whatever measures are finally agreed upon. Above all,starting in 1971, and with its full impact being felt in 1974, exports ofuranium will represent a large item in the trade balance. Exports will be200 tons of contained metal uranium in the initial stage 1971-73 and 1000tons starting in 1974. The terms of the contract between the mining com-pany and the French atomic energy agency, which is both an important share-holder and the purchaser of the ore, are not known. On the basis ofscattered information, it will be assumed that the f.o.b. price will beCFAF 4000 per kilo of contained ore (around $8 per pound) which wouldmean gross exports of CFAF 800 and 4,000 million by 1971 and 1974, re-spectively. But, of course, the mine will have most of the characteristicsof an "enclave" operation with the result that the greater part of theinputs will be imported, about half of net profits and all amortizationfunds will be transferred abroad together with a share of the wages andsalaries earned by expatriate personnel. What will be left in Niger istaxes and net profit accruing to Niger plus wage and salaries paid tolocal personnel (about 1,000 persons) and purchase of some local inputs.
98. The level of traditional exports by 1974 is forecast at around20% above the 1966 level and 33% above the average of 1965-66. Thisresults from the assumptions made which in suimmary are that: (i) quantitiesof groundnuts and groundnut products will increase by 25% over 1966 whereasprices will decrease by 5% to 15% according to whether EEC support will beforthcoming or not; (ii) quantities of cotton will increase 2.4 timesaccording to CFDT objectives, whereas prices will go down by 5% to 12%

- 39 -
on assumptions parallel to the above; (iii) livestock and meat exportswill increase by 17% in price whereas quantities will change little 1/;and (iv) that some secondary exports (vegetables and other foodstuffs)will increase by some 25% whereas others will show little change as aresult of declining prices (hides and skin) or higher internal consumption(fish). Detailed assumptions are spelled out in the annexed note onprojections.
99. The relative growth of imports in total gross available resourceshas been noted as being an important feature of past development. Leavingaside the additional imports which will be necessary for the investmentsin and the operations of the uranium mine, there appears to be no reasonwhy the past trend should not continue unless import substitution assumesmomentum. The prospects for a movement in that direction are necessarilylimited for reasons already noted but they appear better than the pastmight suggest. Substitution for food imports can only concern "superior"types of foodstuffs since Niger is otherwise self-sufficient. One importitem would be sugar, an increasingly important item considering both re-corded and smuggled imports. Other items of the superior type would bebeer and non-alcoholic drinks--a brewery is expected to be operating by1969--rice, whose production is slowly increasing, dairy products forurban population and perhaps wheat flour, both of which have made a starton a semi-experimental level, and canned vegetables. Among other consumergoods, cotton textiles will be first to come from local industries (earlyin 1970), although the greater part of the cotton will be imported duringthe next few years and subsequently the requirements of the local millwill necessarily absorb otherwise exportable raw cotton. Other projectsfor import substitutes with fairly serious prospects concern matches,soap (extension), assembly of wireless sets. Cement is already producedlocally and the capacity of the existing plant (Malbaza) is 50,000 tonsper year or twice the present level of production. No production of othercapital goods is foreseen.
100. The remarks of the preceding paragraph point to a real possibilityof a sizable import substitution movement in the future which could slowdown the past trend of imports representing an increasing share of totalgross supply of resources. As an indication of prospects for the periodup to 1974, it can be said only that it is safer to assume two alternativetrends. One would simply be a continuation of the past trend, meaning thatimports would increase by some 60% over the period 1965/66 to 1974, andreach CFAF 16 billion, based on a rough estimate of income elasticity ofimports of 1.5 and a growth of GDP of 41 per annum. The other would bebased on a possible net effect of import substitution of a group of 8productsrepresenting over 1/3 of-1965-66 imports, taking only half theirvalue (to account--very roughly--for the fact that most inputs necessaryfor home production of the relevant products will have to be imported inany case). This would mean general imports growing by 25% only over theperiod and reaching CFAF 13.5 million by 1974.
1/ Based on a study discussed at the recent meeting of OCAM Chiefs of Statein Niamey, January 1968.
- 40 -
101. The other elements of the balance of payments have been definedin the same manner as in the estimates presented earlier (para. 61). Asa consequence, there is a large item--"private transfers"--which includesunidentified factor payments, private capital and, probably also, someunaccounted imports. The magnitude of this item has been assumed toincrease only slightly as the result of mutually offsetting factors (seenote on projections). Two corrections have been made however: on thecredit side a small item of private capital inflow based on an estimateof industrial projects to be undertaken; on the debit side an estimateof factor income on account of the uranium mine operations.
102. The final balance leaves a gap varying from CFAF 5.9 to 7.7
billion in 1971, and from CFAF 4.1 to 6.3 billion in 1974 according tothe outcome of exports. The "financing" of this gap will result fromthe addition of the following main flows of fundst (i) public grants-in-aid, essentially from France and the EEC, at an annual rate of CFAF2.5 to 3 billion over the period, little increase being expected in thiscategory of aid; (ii) foreign (French) current and other expenditure(including military, mineral research in the Sahara, etc.), a veryvolatile element which might be of CFAF 1 billion per annum; (iii) capitalinflows on account of the investment in the uranium mine and relatedfacilities of CFAF 11 billion over 1968-73, or a yearly average of CFAF1.8 billion. The sum of items (i)-(iii) would leave an uncovered amountof between CFAF o.6 to 1.9 billion in 1971 and 0.6 to 2.3 billion in 1974,meaning, possibly, an average of CFAF 750 million yearly over 1968-71 andabout twice as much over the years 1972-74. Loan capital, in the past,
has been provided mainly by OCCE to the Government, local authorities anddevelopment institutions. It may be expected that this institution will
continue to provide some CFAF 100/200 million per year.

- 41 -
PROJECTION OF BALANCE OF PAYMENTS
(billion of CFA francs)
1964 19712/ 1/
1. Exports: total 2/ 10.3 14.10 18.352. Uranium Exports - (o.80) (4.00)3. Imports: total 2/ -10.2 -17.28 -18.304. Imports: for uranium - (-148) (-0.60)
5. Balance 0.1 -3.18 0.05
6. Private "itransfers" and capital 3/ -5.1 -4U85 -6.707. Transfers on account of uranium - (-0.35) (-1.70)8. Debt service . -0.25 -0.22
9. Overall balance (5)+(6)+(8) -5.0 -8.28 -6.8710. Public "transfers" and capital hi 4.8 7.98 6.5711. Private capital inflow e 0.30 0.30
12. Balance -0.2 0.0 0.0
13. Errors and omissions 0.8
Source: See Annex II, Notes on projections, table P.5.
1/ Projection of maximum hypothesis for both inflows and outflows.(See alternative projections in Note)
2/ Goods and non-factor services. Note that projection for 1971 and 1974are based on increases relative to 1965-66 base period.
3/ Including factor income payments.
4/ For 1964 public capital negligible.For 1971 and 1974 total of public transfers and public capital.

- 42 -
The balance, representing a yearly average of some CFAF 600 million($2.1 million) and CFAF 1,250 million ($5 million) for the two periods1968-71 and 1972-74, respectively, would represent the contribution ofother sources of soft capital.
103. The significance of the overall gap must be viewed in the parti-cular context of Niger as a member of the West African Monetary Union.First, it would be wrong to see the "gap" as a residual, otherwise thanin a purely accounting sense. In fact, as earlier explained, the inflowof public funds which nominally "fills" the overall gap is directly andindirectly a major determinant of the level of imports and is itself anautonomous factor, especially the grants-in-aid from France and the EEC.This means that if the level of external aid is less than foreseen,imports will also be diminished and, indirectly, private outflows offunds will also be less, othe.- things equal, and equilibrium will bereached at a lower level. In the same guise public foreign expendituresin Niger (.e.g., French military expenditures) increase both domesticpublic consumption and imports and therefore tend to offset each other.In other words, the overall external gap is largely self financing.To the extent that it is not and that, for example, the outflow ofprivate funds (factors income and capital) increases what happens is--as in the recent period--a decrease in external assets imputed to Nigerin the books of the central bank of the Monetary Union. However, this,although certainly not a welcome occurrence, does not have any of theimplications normally associated with such movements. It does notnecessarily entail corrective deflationary policies, nor does it createany foreign exchange crisis.
104. As is known, the financial constraints of the Monetary Unioncountries lie first in the public budget and investment may be limitedby the fact that sources of external aid will be reluctant to financecertain types of capital expenditures which must then be met by localpublic savings. These will always be difficult to increase substantiallyas already noted, although a significant improvement is expected. At thesame time the mobilization of private savings, though an objective not tobe overlooked in any manner, will remain extremely problematic given thenon-monetary nature of traditional "savings", the pressure already puton farmers' money incomes by taxation and by decreasing producerprices of cash crops, by strong sociological and political obstacles,particularly in the case of livestock herders, by the full convertibilityand transferability of the currency and consequent easiness of transferringmonetary savings abroad, and finally by the scarcity of investment oppor-tunities capable to appeal to private investors. The continuance ofexternal aid at a level of the order of magnitude indicated in para. 102is therefore necessary within the present institutional framework. At thesame time, it is as much important that the providers of such aid acceptan increasing degree of flexibility in the kind of expenditures to befinanced, for example local costs, current inputs and in the types ofactivity in a country where projects of the "classical" capital intensiveand with a high foreign cost component are less than obvious or would notbe the most productive ones.
- W3 -
105. The capacity of the Government to borrow cannot go beyondmodest limits and in all likelihood the bulk of foreign aid willcontinue to be in the form of grants. The servicing of public debthas been small in the past (table 11) not exceeding 4 to 4.5% ofeither export proceeds or Government revenue. However, public externalindebtedness 1 has increased substantially in the very recent past.Total debt (including undisbursed) was CFAF 4.7 billion ($18.8 million)as of June 30, 1967, and grew to CFAF 7.4 billion ($29.7 million) bythe end of 1967 as a result of a sharp increase in suppliers' creditsand other privately-placed debt which previously was only a smallfraction of the total but now represents nearly 40% of the outstandingdebt (tables 16A and 16B). Debt service will consequently increase
significantly and, because of the new debt structure, the peakperiod of repayments will be in the early seventies. Thus, as aproportion of gross export proceeds, including uranium, service onexisting external public debt will slightly exceed 6% in 1973. As aproportion of Government revenue, debt service will progressivelyincrease to 8%, also in 1973. However, it is possible that dis-bursements of suppliers' credits and contractors' finance (especiallyon the most recent contracts) will be slower than expected. Insuch a case the repayment period would move forward through time sothat repayments would not be so heavily concentrated in the 1971-74period.
106. The working of the West African Monetary Union, for allpractical purposes, relieves the member countries of short-termforeign exchange transfer problem. In this context the debt serviceburden must be weighed in the light of the Government's capacity tosecure public savings. In the past, budget surpluses on currentaccount have been very small or negative, while debt service hasbeen modest. Now,however, a large part of the projected currentbudget surpluses (see table paragraph 93) will be absorbed by thenew level of debt service of between CFAF 500 and 1,000 millionduring the period 1971 to 1974. Before the recent borrowing, debtservice in the early '70's was projected at CFAF 250-300 million;and public savings after debt service (i.e. fiscal resourcesavailable for new public investment) at CFAF 1.1 to 1.5 billion.But service on the new borrowing would now absorb between onefourth and one third of these resources. Service on any furtherincrease in conventional public debt would again reduce the alreadymodest projected Government contribution to the public investmentprogram. Nevertheless, if the bulk of aid is on a grant basis oron soft terms, there would be a small margin for some conventionalborrowing.
1/ Internal public debt is practically nil.

ANNEXES
ANNEX I: NOTE ON THE URANIUM MINE COMPANY
ANNEX II: NOTES ON PROJECTIONS
APPENDIX-TABLES: STATISTICS

ANNEX I
NOTE ON THEURANIUM MINING COMPANY

ANNEX IPage 1
The Arlit deposit is located 250 km. northwest of Agadez, or about800 km. northeast of Niamey. The reserves are estimated at 15 to 20,000tons of metal content, which is considerably more than the deposits inGabon (4,000 tons metal content). The Nigerien ore grades 2.5 percentagainst 4 percent for the Gabonese ore. Two smaller deposits (Azelikand Madaowela) have also been discovered by the Commissariat a l'EnergieAtomique but their exploitation is not envisaged because of technicalproblems.
A company (Societe des Mines de l'Air) with a capital of 3 billionCFAF has been created at the end of 1967 in view of the exploitation ofthe Arlit deposit. The shareholder's distribution is as follows:
Commissariat a l'Energie Atomique: 40%Nigerien Government: 20%Mokta (French private group): 20%Compagnie Francaise des Minerais
d'uranium (Fiench private company,related to the Rothschild group): 20%
The total investment will be of the order 10.5 billion CFAF. Inaddition to the equity, shareholders will advance 1.5 billion and thebalance will be financed by loans. The Caisse Centrale de CooperationEconomique will grant Niger a CFAF 112 million loan to allow the Govern-ment's participation in the company. The balance of the Government's participationwill be "ifinanced"f in the form of tax exemptionsgranted to the company.
In the framework of franco-Nigerien agreements relating to strategicmaterials signed in 1961, France will be the sole buyer of the production.
The financial benefits of the operations for the Nigerian budget arenot clear as yet. Under the agreement finally reached in December 1967,Niger will probably receive in the way of dividends, "royalties" and taxessomething like CFAF 200 million a year until 1973 and at 600 million CFAFthereafter.
Exploitation will take place in two stages. A pilot plant with acapacity of 300 tons a year of concentrates at 65 percent purity, or 200tons on uranium content, is to be put in service in 1970. In 1973/74, asecond plant will increase the capacity to 1,000 tons of uranium content.Mining will be open cast. Niger will, of course, indirectly benefit fromthe infrastructure which will, among other things, comprise a city for the1,000 Nigerians and 150 RWropeans who will be employed and theii families;a road for an asnual incoming traffic of about 30,000 tons (of which 10,000tons of fuel and 15,000 tons of chemicals) between Tahoua and Arlit. Thesematerials will come by rail over 400 km. from the Port of Cotonou toParakou (Dahomey) and then be transported by-truck. ove, 1,600--km. to Tahouausing existing roads.
ANNEX II
NOTES ON PROJECTIONS

ANNEX IIPage 1
NOTES ON FROJECTIONS
1. Projection of GDP 1971 and 1974
Table P.1
ORIGIN(billions of CFAF)
1964 1965 1966 1971 1974
1. Agriculture 40.0 n.a. 47.6 50.02. Manufacturing and construction 3 73 n.a. n.a. 10.03. Mining )3.04. Services 13.6 n.a. n.a. 20.05. Government 4.0 n.a. n.a. 8.06. Total (current prices) 64U.9 69.0 77.0 86.0 97.07. Total (1964 prices) 67.0 86.0 97.0
General Note: The overall assumption is one of growth of GDP at 4-1/4 per-cent in real terms over the period from 1964/66 (base period), based on thecurrent 1968-71 development program. The overall hypothesis appears consis-tent with whatever (rough) sectoral projections can be made.
Line 1/: see table P.2 - Projections for Agricultural Production.
Line 2/: based on the probability of a number of industrial projects justcompleted or to be undertaken: 1967, slaughterhouse with refrigeratingequipment (capacity 4,000 tons of meat, cost CFAF 157 million), millet flourmill (semi experimental, cost 112 million) soap factory (capacity 1,200 then2,400 tons, cost 60 millions), other smaller plants representing investmentsof 100 million. Starting in 196-.-a cotton textile mill, to start productionearly in 1970, (capacity 1,520 tons cotton cloth, cost CFAF 1.8 billion),textile printing mill complementary to the former (cost CFAF 600 million).Brewery (capacity 25,000 bottles, cost 250 million CFAF), soft drinks factory(capacity 9,000 bottles/day, cost CFAF 36 million); various food industries(cost CFAF 300 million), etc. Possibly a sugar mill costing CFAF 2.8 billionwith a capacity of 18,000 tons of raw sugar could start operating in the mid-seventies.
Line 3/: Mining will consist almost exclusively of the uranium mine (thecost/price assumption with Table P.4 - Exports Projection).
Line 4/: Services, including trading services and transportion, assumed togrow parallel to volume of external trade, by far the most important deter-minant.
Line 5/: Government: salaries paid by Government (and local authorities) asprojected (see text of main report Part III-C).
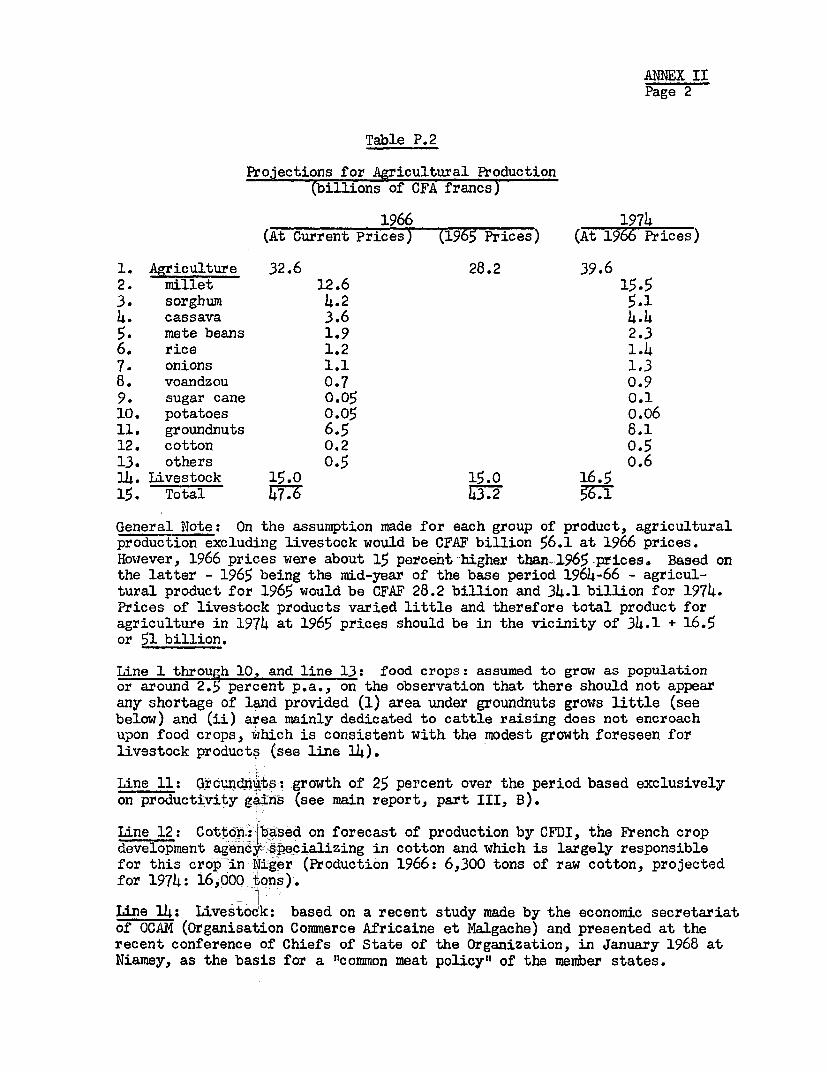
ANNEX IIPage 2
Table P.2
Projections for Agricultural Production(billions of CFA francs)
1966 1974(At Current Prices) (1965 Prices) (At 1966 Prices)
1. Agriculture 32.6 28.2 39.62. millet 12.6 15.53. sorghum 4.2 5.14. cassava 3.6 4.45. mete beans 1.9 2.36. rice 1.2 1.47. onions 1.1 1.38. voandzou 0.7 0.99. sugar cane 0.05 0.11O. potatoes 0.05 o.o611. groundnuts 6.5 8.112. cotton 0.2 0.513. others 0.5 o.614. Livestock 15.0 15.0 16.515. Total 47.6 43.2
General Note: On the assumption made for each group of product, agriculturalproduction excluding livestock would be CFAF billion 56.1 at 1966 prices.However, 1966 prices were about 15 percent higher than-1965 prices. Based onthe latter - 1965 being the mid-year of the base period 1964-66 - agricul-tural product for 1965 would be CFAF 28.2 billion and 34.1 billion for 1974.Prices of livestock products varied little and therefore total product foragriculture in 1974 at 1965 prices should be in the vicinity of 34.1 + 16.5or 51 billion.
Line 1 through 10, and line 13: food crops: assumed to grow as populationor around 2.5 percent p.a., on the observation that there should not appearany shortage of land provided (1) area under groundnuts grows little (seebelow) and (ii) area mainly dedicated to cattle raising does not encroachupon food crops, which is consistent with the modest growth foreseen forlivestock products (see line 14).
Line 11: Grcundnuts: growth of 25 percent over the period based exclusivelyon productivity gains (see main report, part III, B).
Line 12: Cotton-':b-ased on forecast of production by CFDI, the French cropdevelopment agency pecializing in cotton and which is largely responsiblefor this crop in Niger (Production 1966: 6,300 tons of raw cotton, projectedfor 1974: 16,000 tons).
Line 14: Livestock: based on a recent study made by the economic secretariatof OCAM (Organisation Commerce Africaine et Malgache) and presented at therecent conference of Chiefs of State of the Organization, in January 1968 atNiamey, as the basis for a "common meat policy" of the member states.

ANNEX IIPage 3
Table P.3
GDP by Uses(billions of CFA francs)
1964 1965 1966 1971 1974(1) 1974(2)TEstimateF -s-
Private consumption 47.5 n.a. n.a. 68.2 70.2Government consumption 8.4 9.0 9.5 13.0 13.0Gross investment 8.9 n.a. n.a. 13.7 13.7Fixed Private (3.7) n.a. n.a. (5.5) (5.5)Fixed Public (2 .5) (3.0) (3.4) (h.5) (4.5)Inventories (2.7) n.a. n.a. (2.7) (2.7)Uranium - _ _ (1.0) (1.0)
Exports 10.0 (8.5) (11.9) 17.9 18.4Imports -9.9 (-10.2) (-11.6) -15.8 -18.3
Total 64.9 69.0 77.067.0 86 97.0 9.
General Note: In variants (1) and (2) all items except private consump-tion (line 1) are the result of independent assumptions. Private con-sumption is different in each variant as the result of different assumptionsfor exports and imports and of total GDP being however assumed the same.Would an independent forecast have been made also for private consumption,total GDP would have had to be different. Also, in all strictness,differentassumptions as regard exports and imports should be made consistent withother items of GDP by use and possibly result in different levels of GDP.The nature of the information as well as the basis for forecasting eightyears ahead would have made such refinements rather vain.
Line 2: Government consumption: based on budget projection (see text ofmain report, Part III, C).
Lines 3 throughi7: Gross investment: fixed private investment based onpast levels as regards "traditional" investment increased by "modern" in-vestment as predictable on the basis of likely industrial projects forthe period (see Table P.1, line 2). Fixed public investment based onplan's forecastf up to 1971 extended up to 1974 on the basis of assumptionsdiscussed with-lplanning unit. Inventories consist partly of growth oflivestock and stocks of agricultural products assumed constant for lackof any indication' to the contrary. Uranium mine: for 1971: based onofficial figu4rs of 'forecast investment in the mine and related infra-structure of CFF 111 billion over the 1968-73 period; for 1974: depre-ciation assumed-to be 10 percent of total investment on the average.
Lines 8 and 9: Exports-Imports: see notes to Table P.4 and P.5.

ANNEX IIPage 4
Table P,4
Projection of Exports(bilions of CFA francs)
1965 1966 1967 1971 1974 1974(estimate) 717 (2)
1. Groundnuts 3.06 5.33 (5.00) 5.66 6.002. Groundnuts oil 0.28 0.66 (o.60) 0.61 0.713. Groundnuts cakes 0.09 0.21 (0.20) 0.23 0.244. Cotton 0.26 0.50 n.a. 1.07 1.165. Livestock 3.30 3.30 n.a. 3.90 3.906. Others 1.54 1.91 n.a. 2.14 2.14
7. Sub-total 8.53 11.91 n.a. 13.10 13.67 14.158. Uranium - - .80 4.00 4.00
9. Total 8.53 11.91 n.a. 13.30 17.67 18.15
General Note: Projections are specifically for 1974; figures for 1971 areinterpolated on the basis of the average result for 1974.
Notes: Line 1: Groundnuts (shelled): quantities: assumed to increaseby 25 percent as compared to 1966 (quantities in 1967 of same order) asexplained in text of main report.
Prices: The average sale price (c.i.f.) in 1966 is very close to CFAF48,60-0 per ton as a result of the French guaranteed price of CFAF 49,130
per ton (whereas the world price was $190 per ton IBRD) or CFAF 46,500.Assumption (1) is that the world price will apply in 1974: this is (IBRD)$169 per ton on CFAF 42,000, or a decrease of 14.5 percent. Assumption (2)is that EEC will compensate for 80 percent of the difference between thepresent (1968/69) target cost price of CFAF 44,000 per ton and the worldprice - as it theoretically will do until 1969; under this assumption thesale price would be 42,000 + 0.8 (44,000 - 42,000) = CFAF 43,60o per ton,or a decline of 10 percent. Thus under assumption (1) value of exportswould increase by 7 percent to CFAF 5.66 billion and under assumption (2)by 12.5 percent to CFAF 6.00 billion.
Line 2 and 3: Groundnut oil and cakes: assumed to grow little, i.e. lessthan groundnuts in view of the fact that no system of support of any kindis foreseen in their case. Quaptities produced will probably increase butlocal consumption will absorb an increasing share of production.
Line 4: cotton: quantities expected to increase according to CFDT's fore-cast (1966 = 6,000 tons; 1974: 16,000 tons or 2.4 times more).
Prices: Export price in 1966 very slightly above world price (f.o.b. CFAF141,38 per kilo against 139,00); assumption (1) is that price will declineby 12 percent according to IBRD projection (American middling, c.i.f.

ANNEX IIPage 5
Liverpool from $25.4 cents per pound to 22.5 cents); assumption (2) is thatEEC will compensate for 80 percent of the difference between the world priceand the present "target cost price" of CFAF 137,000 f.o.b. meaning a declinein export price of about 5 percent. Thus value exported will increase 2.11times or from CFAF 0.5 to 1.07 billion in assumption (1) and 2.38 times orup to 1.16 billion in assumption (2).
Line 5: Livestock: quantities: assumed to increase by 10 percent as fore-seen in study by OCAM mentioned in text of main report; prices assumedarbitrarily to increase by 2 percent per year in view of the increasingtendency of demand (local and in coastal countries, mainly Nigeria) toexceed supply.
Line 6: Others: includes mainly hides and skins (approximately CFAF 150million 1966 and previous years) assumed to remain stagnant as resultof possible slight increase in quantities but declining prices; fish whosevalue varies between CFAF 10 and 130 million, in decline as result ofhigher level of local consumption, beans, sorghum, millet varying greatlybetween a few million and 230 million officially recorded in 1962, etc.In view of the near impossibility of making meaningful predictions for suchitems it has been assumed that the group of secondary products under "others"would grow moderately, by 25 percent or so, mainly to take account of thefact that (i) Niger is normally a net exporter of foodstuffs to neighboringcountries (ii) that some new products such as fresh vegetables have made apromising start in European markets and there are projects to increase thiscurrent with European firms involved, (iii) barring inimical policies fromneighboring countries some industrial exports will become possible (e.g.cement to Northern Nigeria and Dahomey, etc.).
Line 8: Uranium: terms of the contract for the purchase of uranium bythe French Commissariat a l'Energie Atomique are not known (and apparentlynot yet decided). From the information available (on Gabon's terms, pricesapplied by US Authorities, etc.) a f.o.b. price of CFAF 4,000 per kilo ofmetal uranium - or roughtly $16 per pound - seems likely and has beenretained.

ANNEX IIPage 6
Table P.5
Balance of Payments Projection
1964 1965 1966 1971 1971 1974 1974
1. General exports 8.5 11.9 13.10 13.10 13.67 14.152. Uranium - - - .80 .80 4.00 4.003. Trade services n.a. n.a. .20 .20 .20 .20
n_.a * _T _ - __O 7.8.
4. Total Exports 10.00 n.a. n.a. 14.10 14.10 17.87 18.35
5. General imports 10.2 11.6 12.65 14.30 13.50 16.006. Uranium imports - - - 1.48 1.48 .80 .80
7. Trade services n.a. n.a. 1.50 1.50 1.50 1.50
8. Total Imports 9.90 n.a. n.a. 15.63 17.28 15.80 18.30
9. Balance (4) - (8) .10 -1.53 -3.18 +2.07 +o.05
10. Private transfers abroad (gross) -4.50 -4.50 -4.50 -5.00 -5.0011. Uranium transfers (net) - - .35 - .35 -1.70 -1.70
12. Total private transfers (net) -4.50 -4.85 -4.85 -6.70 -6.70
13. Debt service .25 .25 .22 .22
14. Overall balance (9)+(12)+(13) -4.40 -6.63 -8.28 -4.65 -6.87
15. Private capital inflow - .30 .30 .30 .30
16. Balance = public transfers 4.80 6.33 )7.98 4.35 6.57=other - .40).3)79865
Notes: Lines 1 and 2: General exports: See table P.4.
Line 3: Trade services: freight, insurance, tourism, etc.: notional amount
similar to very rough estimates for recent period.
Line 5: Assumption (2) is based on a continuation of past trend with income-
elasticity of imports to GDP of around 1.5. Assumption (1) is based on a move-
ment of import substitution whose impact, for lack of more precise information,
is estimated thus: it is assumed that substitution can affect the following
group of products:

ANNEX IIPage 7
Average value 1965/66(as recorded: million CFAF)
- dairy products 70- rice 35- sugar 300- beer 110- various foodstuffs (cereals, etc.) 60- cement 45- soaps 60- cotton textiles 2,500- wireless sets 75
3,195 32%
- total recorded 10,000 100%
On the basis of likely projects it is expected that beer and cement willbe entirely produced at home before 1971 (this is the case for cement sincemid-1966) that about 1/3 to 1/2 of cotton textiles will, by 1970; thatprogressively home produced dairy products, rice, other foodstuffs (cerealproducts), soaps will replace imports but to what extent is not known.Finally, there are vague prospects for sugar for the mid-seventies (toproduce around 15,000 tons) to mount wireless sets, etc. Lacking moredetailed information on these projects and others it has been assumed thatlocal production could replace half the imports of the group of productslisted. This is to take account of the fact (i) that current projects arenot intended to replace all imports of the list and (ii) that the productionof some of the products listed will require additional imported inputs(fuel, certain kinds of cotton, parts, etc.). It has been assumed finallythat the share of this group of products would be the same in the futureas now. Therefore from the higher projection of imports based on assump-tion (2), 16 percent has been subtracted.
Line 6: Imports needed for the investment of the uranium mine and forits operation. For the investment period (up to 1973) it has been assuredthat 70 percent of the investment program of CFAF 11 billion (or 1.83 billionper year) would be spent on imports: 1.83 x 070 = 1.28. During the in-vestment period operations will start in 1970 or 1971 requiring an estimatedimports of CFAF 200 million. Hence total imports = CFAF 1.48 billion.For the period starting in 1978 only current import requirements corres-ponding to full capacity level approximately four times the previous one,hence imports of CFAF 800 million per year (current imports roughlyestimated on the basis of actual figures for Gabon's uranium mine).
Line 7: Trade services: Assumed to grow like imports or from CFAF 1billion in 1964 to approximately CFAF 1.5 both for 1971 and 1974 (and forthe higher and the lower assumption).

ANNEX II
Line 10: Private "transfers" abroad: as explained in main text this isa semi-residual item which probably includes factor payments and sometrade transactions. It has been assumed to remain at roughly the samelevel as in the past in spite of the prgjedted growth of GDP on the supjesi-tion that more investment opportunities in the country combined with aslight increase in taxation will retain a higher proportion of privatesavings.
Line 11: Uranium transfers: based on the assumption of transfer abroadof net profits not accruing to Niger (CFAF 500 million? by 1974); ofdepreciation allowances (lA/O of total investment or CFAF 1 billion peryear) and of CFAF 200 billion of private savings on wages and salariespaid.
Line 15: Private capital inflow: The amount of CFAF 300 million isnominally to re-gresent external contributions in industrial projects. Theamount will vary greatly, of course, and, for example, will be much moreon account of the textile mill in 1968 and 1969.

LIST OF APPENDIX-TABLES
Table
IA Age and Sex Distribution of Population (1964)
1B Percentage Distribution of Population Between Urban And RuralAreas in 1964
1C Active Population
2A National Accounts - Supply of Resources
2B National Accounts - Use of Resources
2C National Accounts - Breakdown of GDP According to Incomes
3 Prices and Wages
4 Agriculture
5 Evolution of Cultivated Area
6 Livestock - Recorded Population
7 Groundnuts; Export Price Structure Marketing and Price Subsidies
8 Cotton; Export Price Structure, Marketing and Price Subsidies
9 Sonara - Financial Statements for the Years Ending September 30,
1964, 1965, 1966
lOA List of the Semi-Public Enterprises (Societes d'Economie Mixte)
Under the Supervising Committee (Comitd de Tutelle)
lOB Summarized Balance Sheets of Main Enterprises in the Public andSemi-Public Sector
11 Government Current Budget
12 Financing of Government Excess Expenditure
13 Tresor's Liquidity Position
14 Local Budgets
15 Main Sources of Aid - Project Aid and Aid to the Government Budget
-2-
Table
16A Extlernal Medium and Long-Term Public Debt Outstanding IncludingUndisbursed as of June 30, 1967
16B Estimated Contractual Service Payments Due in Future on ExternalMedium- And Long-Term Public Debt Outstanding Including Undisbursedas of June 30, 1967
17 Savings Gap of the Public Sector
18 Monetary Survey
19 Distribution of Short-Term Credits by Main Sectors
20 Foreign Trade - Commodity Distribution
21 Foreign Trade - Quantities Officially Recorded
22A Geographical Distribution of Recorded Exports
22B Geographical Distribution of Recorded Imports
23 Balance of Payments with Non-Franc Area
24 Energy
25 Consumption of Electricity (1000 kwh)
26 Transpportation Cost Between Cotonou and Niamey For SelectedCommodities
27 Industry

Table 1A: AGE AND SEX DISTRIBUTION OF POPULATION (196h)
(thousands)
Age Male Female Total % Cumulative %
0-h 299 299 598 18.85-9 225 229 454 14.3 33.1
10-14 193 197 390 12.3 45.415-19 166 168 334 10.5 55.920-29 259 259 519 16.4 72.330-39 179 179 357 11.2 83.540-49 121 121 242 7.6 91.150-59 75 78 153 4.8 95.960-69 40 43 83 2.6 98.570-79 13 19 32 1.1 99.680 and over 6 7 13 o.4 100.0
1,576 1,598 3,174 100.0
Source: Comptes Economiques de la Republique du Niger 1964, Niamey 1966

Table 1B: PERCENTAGE DISTRIBUTION OF POPUIATION BETWEEN URBAN AND RURAL AREAS IN 1964
1. Urban 6.o
Agglomerations with 20,000 inhabitants or more 1/ 3.3
Other urban agglomeration 2.7
2. Sedentary 75.0
3. Nomadic and semi-nomadic 19.0
100.0
1/ Niamey, Maradi, Zinder, Tahous. Estimates for Niamey vary widely, from 50,000 to 100,000
Source: Comptes Nationaux de la Republique du Niger 1964, Niamey 1966

Table 1C: ACTIVE POPULATION
(Demographic Survey 1960)
Males Females Total % Males % Females
Primary Sector 666,630 77,220 743,850 94.1 9.7
Secondary Sector 4,480 30 41,510 o.6
Tertiary Sector 13,230 1,880 15,110 1.9 0.2
Housewives and others 24,430 7 8,590 743,020 3.4 90.1
708,770 797,720 1,506,490 100.0 100.0
Total population: 1,434,350 1,441.,41 17 2,875,767
Percentage of activepopulation 49.4 55.3 52.4
Source: Perspectives decennales
Table 2: NATIONAL ACCOUNTS
A. SUPPLY OF RESOURCES(billion of CFA francs)
1956 1959 1960 1961 1962 1963 1964 1965 1966
Primary Sector 32.8 36.9 32.8 33.1 36.7 39.3 40.0
Non marketed production .. .. .. 22.8 24.2 23.7 23.3Marketed Production .. .. .. 10.3 12.5 15.6 16.7
Secondary Sector 4.0 1.2 8.3 5.8 6.8 7.1 7.3
Non Marketed production .. .. .. 2.5 2.5 2.6 2.7Marketed production .. .. .. 3.3 4.3 4.5 4.6
Tertiary Sector 5.8 5.9 4.8 106 12.3 13.0 13.4
Non marketed production .. .. *° 1.5 1.7 1.6 1.6Marketed production .. .. .. 9.1 10.6 11.4 11.8
Government 3.3 4.1 4.0 4.4 4.9 4.5 4.0
Households .. .. 0.2 0.2 0.2 0.2 0.2
GDP at Market Prices 45.9 48.i 50.1 54.1 60.9 64.1 64.9 69.0 77.0
Imports of Goods and Services 3.6 6.7 8.1 8.4 10.7 9.8 9.9 10.21/ 11.61/
Total Gross Available Resources 49.5 54.8 58.2 62,5 71.6 73.9 74.8 79.2 88.6
1/ Goods only
Source: Data for 1962, 1963, 1964: Comptes Economiques; Data for 1960 and 1961:Annuaire Statistique 1962Data for 1956 and 1959: H. Leroux, Planification.en Afrique, Minist4re de la Cooperation, Paris;Data for 1965 and 1966: Mission's estimate.
Table 2: NATIONAL ACCOUNTS (ODNT.)
- B. USE OF RESOURCES(in billions of CFA francs)
1956 1959 1960 1961 1962 1963 1964 1965 1966
-Consumption 42.8 47.1 45.4 49.2 52.9 54.4 55.9
Private 37.5 41.1 38.4 40-3 44.2 45.8 47.5Public 5.3 6.0 7.0 8.9 8.7 8.6 8.4
Gross Investment 1.7 2.7 4.6 5.1 9.3 9.9 8.9
Fixed 1.7 2.7 2.4 2.2 5.2 7.1 6.2Private 0.9 0.8 0.5 0.7 2.7 4.3 3.7Public 0.8 1.9 1.9 1.5 2.5 2.8 2.5 3.0 3.4
Changes in stocks - - 2.2 2.9 4.1 2.8 2.7
Exports of goods and services 5.0 5.0 7.8 8.2 9.4 9.6 10.0 8.5 1/ 11.9 1/
Total use of resources 49.5 54.8 57.8 62.5 71.6 73.9 74.8 79.6 1/ 88.6 1/
Imports of goods and services -3.6 -6.7 -7.7 -8.4 -10.7 -9.8 -9.9 -10.2 -11.6
GDP at market prices 45.9 48.1 50.1 54.1 60.9 64.1 64.9 69.0 77.0
2 Goods only
Source: Data for 1962, 1863, 1964: Comptes Economiques; Data for 1960 and 19 6 1:Annuaire Statistique 1962Data for 1956 and 1959: H. Leroux, Planification in Afrique, Ministare de la Cooperation, Paris;Data for 1965 and 1966: Mission's estimate.

Table 2: NATIONAL ACCOUNTS (CONT.)
B. USE OF RESOURCES(in billions of CFA francs)
1956 1959 1960 1961 1962 1963 1964 1965 1966
.Consumption 42.8 47.1 45.4 49.2 52.9 54.4 55.9
Private 37.5 41.1 38.4 40.3 44.2 45.8 47.5Public 5.3 6.0 7.0 8.9 8.7 8.6 8.4
Gross Investment 1.7 2.7 4.6 5.1 9.3 9.9 8.9
Fixed 1.7 2.7 2.4 2.2 5.2 7.1 6.2Private 0.9 0.8 0.5 0.7 2.7 4.3 3.7Public 0.8 1.9 1.9 1.5 2.5 2.8 2.5 3.0 3.4
Changes in stocks - - 2.2 2.9 4.1 2.8 2.7
Exports of goods and services 5.0 5.0 7.8 8.2 9.4 9.6 10.0 8.5 1/ 11.9 1/
Total use of resources 49.5 54.8 57.8 62.5 71.6 73.9 74.8 79.6 1/ 88.6 1/
Imports of goods and services -3.6 -6.7 -7.7 -8.4 -10.7 -9.8 -9.9 -10.2 -11.6
GDP at market prices 45.9 48.1 50.1 54.1 60.9 64.1 64.9 69.0 77.0
I/ Goods only
Source: Data for 1962, 1863, 1964: Coaptes Economiques; Data for 1960 and 1961:Annuaire Statistique 1962Data for 1956 and 1959: H. Leroux, Planification in Afrique, Ministare de la Cooperation, Paris;Data for 1965 and 1966: Mission's estimate.
Table 3: PRICES AND WAGES
A. African Consumwr Price Index(July 1962 - June 1963 = 100)
1961 1962 1963 1264 1965 1966 1967(first quarter)
Foodstuffs and beverages 103.2 102.0 101.0 99.7 104.0 119.8 113.5Clothing 102.0 98.9 100.3 97.9 99.7 103.6 112.4Housing and bousehold 103.0 101.4 92.4 94.2 105.9 108.6 109.4Miscellaneous 97.0 94.5 102.2 103.5 111.7 113.5 121.6General 101.7 100.7 97.8 99.8 104.9 116.0 114.4
B. European Consumar Price Index(Nov. 15 - Dec. 15, 1964 =100)
1961 1962 1963 1964 1965 1966 1967--- (first quarter)
Foodstuffs 88 86 92 95 102 105 108Utilities 94 90 92 101 102 107 107Clothing and housebold 92 89 93 96 105 106 112Servants 89 89 97 100 100 100 100Miscellaneous 99 102 101 103 100 107 118General 91 88 93 97 101 105 110
Source: Annual Reports of BDRN
C. Wages
Since June 1962, the SMIG (salaire minimum inter professionnel garanti) computed on the basis of48 mainly locally produced articles, renained unchanged at the level of CFAF 24 per hour for agricul-tural workers and CFAF 28 per hour for mn-agricultural workers.

Table 4: AGRICULTURE
CULTIVATED AREAS, PRODUCTION, YIELDS
1956 1960 1964 1965 1966
Food crops
Millet - Area - 1000 ha 1,211 1,692 1,777 1,810 1,743Production - 1000 T 485 718 1,012 789 841Yields - kg/ha 400 424 571 436 480
Sorghum - Area - 1000 ha 570 440 453 465 546Production - 1000 T 364 222 315 266 277Yields - kg/ha 640 505 695 570 507
Niebe beans - Area - 1000 ha 349 375 519 468 652Production - 1000 T 24 46 86 76 103Yields - kg/ha 68 123 166 168 158
Cassava - Area - ha 16,420 14,110 17,270 19,070 21,340Production - 1000 T 87 100 149 150 148Yields - T/ha 5.3 7.1 8.6 7.9 6.9
Sweet potatoes - Area - ha ( 1,995 1,635 1,471 949Production - T ) n.a. 16,600 23,500 19,713 6,633Yields - T/ha ( 8.3 114.4 13.4 7.0
Maize - Area - ha 4,420 3,120 5,105 4,435 3,475Production - T 3,270 2,780 4,115 2,711 2,203Yields - kg/ha 780 891 806 611 634
Wheat - Area - ha 1,360 715 795 592 557Production - T 900 1,080 930 507 681Yields - kg/ha 660 1,510 1,109 856 1,222
Rice - Area - ha 5,450 8,155 9,360 8,734 9,222(paTy7 Production - T 3,920 7,395 11,970 11,704 20,459
Yields - kg/ha 719 907 1,279 1,340 2,218Onions - Area - ha ( 935 1,150 1,972 1,689
Production - T ) n.a. 19,400 23,500 42,290 35,941Yields - kg/ha ( 20,748 20,435 21,445 21,279
Pimentos - Area - ha ) 140 885 1,056 720Production - T ( n.a. 210 720 766 574Yields - kg/ha ) 1,500 813 725 797
Sugar Cane - Area - ha ( 2,160 1,860 2,064 694Production - T ) n.a. 32,280 43,085 41,105 12,445Yields - kg/ha ( 14,944 23,163 19,915 17,932
Tomatoes - Area - ha ) 424Production - T ( n.a. n.a. n.a. n.a. 4,428Yields - kg/ha ) 10,443
Cash crops
Groundnuts - Area - 1000 ha j' 259 321 293 341 355Productian - 1000 T 3 131 150 184 277 312Yields - kg/ha 505 465 630 810 877
Cotton - Area - ha 21,700 4,500 14,645 16,260 11,390Production - T 1440 1,300 6,285 6,980 5,466Yields - kg/ha 6 162 288 430 430
Tobacco - Area - ha ( 710 630 736 653Production - T ) n.a. 230 290 337 289Yields - kg/ha ( 323 460 457 442
Source: Ministere de l'Economie Rurale.

Table 5: EVOLUTION OF CULTIVATD AREA
1956 1960 1964 1965 1966
Total in 000 ha 2,070 2,490 2,577 2,674 2,751
% Distribution among crops:-
Millet 44.1 59.0 57.3 57.6 63.3
Sorghum 33.1 15.3 14.6 14.8 19.8
Niebe beans 2.2 13.0 16.7 14.9 23.7
Groundnuts 11.9 11.2 9.4 10.8 12.9
Cassava 7.9 0.5 0.5 o.6 0.7
Other crops 0.8 1.5 2.0 1.9 1.7
1/ Percentages do not add up to 100 due to intercropping.
Source: Ministbre de l'Economie Rurale.

Table 6: LIVESTOCK
RECORDED POPULATION 1/
(000 heads)
1959 % 1960 % 1963 % 1964 % 1965 % 1966 % 1966 %(Estimated)
Cattle 1,922 28.9 1,850 28.5 2,066 29.2 2,155 29.8 2,272 30.5 2,122 30.1 (4,000) 31.8
Sheep and Goats 4,232 63.4 4,104 63.2 4,419 62.4 4,463 61.8 4,635 62.2 4 3L9 61.2 (7,950) 63.1
Horses 90 1.3 95 1.5 116 1.6 120 1.7 132 1.8 135 1.9 (160) 1.3
Asses 212 3.2 220 3.4 239 3.4 228 3.2 227 3.0 260 3.7 (315) 2.5
Camels 213 3.2 221 3.4 243 3.4 257 3.5 260 3.5 217 3.1 (160) 1.3
TOTAL 6,669 6,9490 7,o83 7,223 7,526 7,053 (12,595)-
1/ The recorded population only represents part of the total population.
Source: Service de 1'Elevage.
Table 7: GROUNDNUTS; EXPORT PRICE STRUCTURE MARKETING AND PRTCE SUBSIDIES
1963/64 1964/65 1965/66 1966/67 1967/68 1968/69
I. Export price structure (in CFA francs per kg of shelled nuts)
A. Cost price, c.i.f. Producer's price 22.00 22.50 22.81 22.15 18.00Taxes Y 8.61 5.56 3.75 3.00 2.75Other costs' 18.39 19.60 20.92 21.46 20.70
Total cost price, c.i.f. 7949007.48 4 6.6 41.
B. Exporter's profAt or loss (-) 3.58 4.84 1.65 2.50 ...
C. French guaranteed export price, c.i.f. 52.58 52.50 49 .1J* 49.13
D. EEC target cost price, c.i.f.Producer's price - 22.15 21.25 21.25 21.25 21.25Taxes - 44.75 3.75 3.00 2.75 2.25Othw costs - 23.15 21.50 21.00 21.00 20.50
Total target cost price, c.i.f. - 570.0 46.50 .2" 45.0o0o 1iI
II. Marketing (in thDusands metric tons df shelled nuts)
A. Marketed productionf 114.2 106.4 156.1 193.0 ( 195)
B. French guaranteed quota 100.0 90.0 110.0 160.0
C. Exports of groundnutsat French guaranteed prices 88.1 77.9 100.2 152.0at world market prices 9.0 8.8 33.0 19.4 ...
Total exports of groundnuts 97.1 133.2 171.4.
D. Sales of groundnuts to local refineries 16.4 20.3 23.3 20.6of which: exports of crude oil i (15.2) (16.1) (23-3) (16.6) (---)
III. Prices subsidies disbursed by EEC (in million of CFA francs)
A. EEC program estimatesa _ 463.5 232.5 120.0
B. Actual disbursements - 2.2 0.6 ...on account of exports to France ( - ) ( - ) ( - ) ( ) (.)on account of other exports ( - ) (2.2) (0.6) (---)
a/ 1963/64-1966/67: official price scales (baremes) fixed at the outset of each crop season, estimates for 1967/68.,/ Includes export taxes and levies accruing to CSPPN (until 1963/64) and to FDAPR (until 1964/65).j Includes various internal costs (e.g. handling, storage, packing, commissions paid to intermediaries, financial
costs of SONARA) and external costs (e.g. overland and overseas transportation, insurance, unloading, selling).g/ The French guaranteed price was CFAF 49.13 per kg for the first 90,000 tons of the quota and CFAF 48.50 for the
remainder./ EEC is expected to revise the 1966/67 target cost price and set it at CFAF 48.00 per kg./ Does mnt match exactly the total of exports and sales to local refineries in the same year because some stock-
piling takes place.&/ Includes groundnut oil exports, computed by the equivalent tonnage of shelled groundnuts.i Computed by the equivalent tonnage of shelled groundauts.
O/ riginal estimates in the EEC 5-year program of aid to agricultural production (1964/65-1965/66).
Source: Data provided by the Niger authorities and SONARA.

Table 8: COTTON; EXPORT RICE STRUCTURE, HARKETDIG AND PRICE SUBS D IES
1963/64 1964/65 1965/66 1966/67 1968/69
I. Export price structure
A. Actual cost price, f.o.b.
Producer's price (in CFAF per kgof seed cotton) 32.60 32.60 32.60 30.00 ...
Yield in ginned cotton per unitof seed cotton (in percentage) 33.56 34.00 34.05 34.89 ...
Cost price, f.o.b. (in CFAF perkg of ginned cotton)
Cost of seed cotton 97.13 95.88 95.74 85.80 ...Taxes 3.37 1.75 1.10 1.10 ...Other costs 51.62 50.44 52.21 54.48
Total cost price, f.o.b. 152.12 148.07 149.05 141.38 ...
B. Exporters' profit or loss (-)(in CFAF per kg of ginned cotton) -11.70 -4.67 -19.01 -2.38 ...
C. Average export price, f.o.b.(in CFAF per kg of ginned cotton) 140.42 143.40 130.04 139.00 ...
D. EEC target cost price, f.o.b. 148.50 145.00 144.28 l1l.40 137.00
II. Marketed production(in metric tons of ginned cotton) 1,802 2,422 1,162 2,329 ...
III. Subsidies to the exporter(in millions of CFAF)
A. Price subsidies:Disbursed by EEC 14.3 3.9 31.4 33.8-'
(EEC program estimates) 1/ (40.9) (19.8) (12.2)3/Disbursed by CSPPN 1.7 - 7.7 -
B. Transport subsidies disbursed by CSPPN 8.7 12.0 -
1/ For cotton, the first tranche of the program covered the 1963/64 and 1964/65 crops./ Revised estimate.§/ Original estimate.E/ In 1965/66, exporting at lower cost through Nigeria permitted discontinuing subsidies to cotton
transportation.
Source: Date provided by the Niger authorities and Notes d'information et Statistiques BCEAO, No. 143,August-September 1967. For data on EEC Price Subsidies: Afrique Service, July 19, 1967.

Table 9: SONARA - FINANCIAL STATEMENTS FOR THE YEARS ENDING SEPTEMBER 30, 19 6 4, 1965, 1966
(million CFA francs)
I. Balance Sheet
A s s e t s L i a b i l i t i e s
Sept. 1964 Sept. 1965 Sept. 1966 Sept. 1964 Sept. 1965 Sept. 1966
Current Assets 904.8 796.0 747.9 Current Liabilities 623.3 508.3 472.6
Cash and receivables 770.8 635.4 605.1 Accounts payable 354.1 426.9 282.0Inventories 134.0 160.6 142.8
Short-term bank credit 269.2 81.4 190.6Fixed Assets 78.9 122.0 152.5
___________ - - ~~~~~~~~~~~~~~~Long & medium-tenm debt _ _ 56.9Organization and pre-operationexpenses (net) 3.3 6.2 - Shareholders' equity 360.4 409.8 370.8
Property and equipment (net) 72.2 108.7 145.6 Capital 300.0 300.0 300.0Reserves 4.7 4.7 9.9
Participation, deposits andguarantees 3.4 7.1 6.9 Non-imputed profits - 55.8 -
Net income after taxes 55.8 49.3 60.9
Total Assets 983.7 918.0 900.4 Total Liabilities 983.7 918.0 900.4
Source: SONARA
Table lOA: LIST OF THE SEMI-PUBLIC ENTERPRISES (SOCIETES d'ECONOMIE MIXTE)UNDER THE SUPERVISING COMMITTEE (COMITE DE TUTELLE) 1/
Supervising Ministry
Finance - Banque de D6veloppement de la Republique du Niger (BDRN)- Credit du Niger- Societe Nigerienne d'Urbanisme et de Construction Iwmobiliere (SCfUCI)
Economic Affairs - Societe Nationale de Cimenterie (SNC)- Societe Nigerienne de Commercialisation de l'Arachide (SCNARA)- Societe Nationale de Commerce et de Production )COPRO-NIGER)- Societe Nigerienne de Ceramiques (SONICERAM)- Societe HoteliAre "Le Sahel"- Societ6 Nig6rienne de Fabrication M6talliques (SCNIFAME)- Societe de Transformation du Mil (SOTRAMIL)- Office National de Produits Pharmaceutiques et Chimiques (ONPPC)
Public Works - Societe Nationale des Grands Travaux du Niger (SNGTN)- Soci6t6 Nationale des Transports Nigeriens (SNTN)- Societe des Mines du Niger (SMN)-- Soci6t6 Nationale des Transports Urbains (SNTU)- Air Niger
1/ Two "Societ6s d'Economie Mixte", the Societe Nationale d'Etudes et de Travaux Hydrauliqueset Agricoles du Niger (SNETHA) and, Batisseurs Nigeriens, have been liquidated in 1967.
Table lOB: SUPOANZED BALANCE SHEETS OF MAIN ENTERPRISES IN THE PUBLIC AND SEMI-PUBLIC SECTOR
(in millions CFA franno)
Soc. Hoteliore Credit doSONARA OOFIO-NIGER SNOTN SONUCI SONICERAM 'L.e Sahel" 1" SNTN SNTU SONIFAME 1/ SIMN h/ ONPPC 1/ UNCC CSPPN NigC r
A s s e t 9
Current assets
1964 904.8 285.1 38.7 83.8 _ 101.8 2.4 - 26.3 - 155.6 - 361.71965 796.0 418.0 125.0 n.5 - - 113.0 3.2 - 27.0 - 187.3 - 366.21966 7b7.9 472.0 130.8 26.2 3.7 11.3 137.9 6.8 26.8 17.0 53.4 290.4 885.7 b88.2
Flxed assets
1961 78.9 712.3 37.7 519.3 - - 203.7 7.7 - 7.4 - 43.9 - 51.81965 122.0 1,061.1 92.6 448.4 - - 311.2 10.2 - 21.4 - 84.1 - 40 71966 152.5 1,038.1 107.5 631.5 80.3 133.9 268.1 5.3 64.o 30.1 354.9 117.3 366.1 63.9
Masnellaneous assets
1964 - 67.2 - 67.3 - - (14.9)d/ - - _ - _1965 - 33.5 145.4 - - - _ _ _ - - _1966 - 0.1 242.3 - - 43.3 0.3 - - - 3.0
Results b/
1964 - - 9.5 30.1 - - 29.2 - - 16.8 - 3.9 - -1965 - 2.8 9.5 59.3 -- - - - - -1966 - - 1.2 61.8 4.9 26.3 - - 12.9 - - 26.0 - -
Total Assets a!
1964 983.7 1,064.8 86.1 700.4 - - 334.6 10.2 - 50.5 - 203.4 - 366.6i965 918.0 1,515.4 227.0 724.7 - - 476.3 e/ 13.4 - 48.0 - 271.4 - 416.01966 900.4 1,510.5 239.6 961.8 88.9 171.7 481.5 / 12.4 103.8 47.2 408.3 433.7 1,252.1 555.°
L i a b L i t i e a
Current liabilities
1964 623.3 812.0 37.2 155.1 - - 203.7 3.6 - 0.7 - 28.5 - 71.61965 508.3 1,262.5 127.3 203.8 - - 268.7 4.9 - 3.8 - 64.3 - 97.61966 472.6 1,288.9 45.4 392.2 12.9 30.4 250.0 1.8 68.8 - 199.5 226.0 2.2 22.1
Long snd oediuam-term debt
1964 - 58.8 - 457.5 - - - - - - - - -1965 - 54.8 14.9 428.6 - - 69.8 2.2 - - - 4.5 -1966 56.9 50.8 93.6 436.i 59.0 63.7 117.1 2.2 20.0 - 90.0 14.0 o 280.4
Shareholders' equity
1964 360.4 158.2 68.9 87.7 . - 120.3 2.5 - 25.3 - 172.4 - 295.01965 409.8 157.1- 76.7 - 92.4 - - 120.3 2.3 - 28.1 - 192.5 _ 309.41966 370.8 157.2 0oo.8 133.4 17.0 77.7 121.0 6.6 15.0 34.5 118.8 178.7 - 241.6
Miscellaneous
1961 - 22.6 - - - - 10.6 3.6 - 1.2 - 2.5 - -1965 - 40.9 _ _ - - 16.3 3.9 12.3 - 8.o - 9.01966 - 2.? 36.1 1.6 -7.9 - 15.0 -10.5
Results b/
1964 55.8 13.3 - - - 0.5 - 20.3 _ - _1965 49.3 - 10.8 _ 1.4 0.05 - 7.5 _ 2.1 - -1966 6o.9 16.3 - - - o.6 0.2 - 4.7 - - 1,249.9 -
Total Ltabilities a/
1964 983.7 1,o61.8 86.1 700.4 - _ 334.6 10.2 - 50.5 - 203.4 - 366.61965 918.0 1,515.4 227.0 724.7 4 - 176.3 13.4 4 18.o V - 2n.4 - 416.o1966 9CO.4 1,510.5 c/ 239.6 961.8 88.9 171.7 481.5 I/12.4 103.8 47.2 408.3 133.7 1,252.1 555.0
Source: Data submitted by Nigerian authorities. Balance sheets a of September 30 unles otherwise imicated.
Coponmste my mt add up to total figures due to rounding.b/ Nay include carry over from previous yers.e/ Total liabilities asount to 1,515.9 by adding up the figures provided.C/ Assets and liabilities balanced if omitted.o/ Sua of components 424.2.fl Sun of cowponents 449.3.s/ Sun of components 525.1.h/ As of December 31.
T/Total of cosponents 51.7.As of March 31, 1967.As of June 30, 1967.
I/ As of Septeaber 30, 1967.
Table 11: GOVERNMENT CURRENT BUDGET(million CFA francs)
1960 1963 1964 1965 1966 1962Z 1968Revenue (estimates)
1. Direct taxes 1,418 2,010 2,337 2,550 2,883 2,923 3,7232. Internal indirect taxes 458 555 555 651 971 1,007 1,1233. Import-Export taxes 1,591 2,343 3,064 2,997 3,843 3,731 4,0714. Other taxes 239 199 223 390 299 225 307
5. Total taxes 3,706 5,107 6,179 6,588 7,996 7,886 9,2246. Other current revenue 244 280 265 276 423 598 346
7. Total 3,950 5,387 6,h44 6,864 8,419 8,484 9,570
Expenditure
8. Public debt 42 81 200 299 263 260 2409. General administration 1,543 1,519 2,247 2,622 2,883 3,068 3,32310. Defense and police 700 900 971 1,238 1,472 1,450 1,43611. Economic 578 575 520 522 545 613 72712. Social (Education and Health) 976 1,042 1,168 1,156 1,217 1,541 1,595
14. Unallocated sub)i-i) 721- -787 1,033 1,167 1,339 - 1,080
15. Subtotal ) 5,791 5,893 6,870 7,547 8,271 8,401
16. Maintenance and big repairsC/ ) _ 615 343 238 269 203 348
17. Total 5,100 6,106 6,236 7,108 7,816 8,474 8,749
Current Balance (7) - (17) -1,150 -719 +208 -243 +603 +10 +821
a/ Sale of assets, assets of ex AOF accruing to Niger, etc. (Fonds de reserve de Tresorerie).b/ Provisional resultsc/ Not homogeneous coverage through time, as road fund has taken part of this type of expenditured/ Of which 580 allocated to investments budget, 140 to road fund and 93 for new capital participation.Source: From official budgets, Tresor's accounts and National accountsNote: Starting in 1962, fiscal year is from October 1 to September 30.
Table 12: FINANCING OF GOVERNMENT EXCESS EXPENDITURE
(million CFA francs)
19681960 62/1963 63/1964 64/1965 65/1966 56/1967 (estimates)
Main sources of excess expenditure:
Current budget balance(+- deficit, - - surplus) 1,150 719 - 208 243 - 603 - 10 - 681
Investment budget expenditure 486* 653 / 526 814 1,071 / 892 859
Roads fund n.a. 129 6 163 136 (130) 97 1415
Total excess expenditure (1,636) 1,501 481 1,193 (598) 979 593
Main sources of financing:
a. Internal
Resources earmarked for RF(transfered from current budget) (100) 100 120 110 127 140Non current receipts - 3] 254 32 - 233 73 115
Reserve fund "current" 131 68 5/ 67 ( 446 ( 88 ( 228 60"investment" ( 33 ( 140 ( 67
b. External ( 210French contribution 1,025 534 620 416 250 150 160
Entente Solidarity Fund (net) 340 348 4/ 125 / - - - -
Subtotal 1,750 (1,050) 944 1,015 821 645 685
Change in Tresor's liquidityposition on account pf Govt.operations (-114) (+451) -463 + 178 (.223) + 334 +92
(+ * decrease, - increase)* IMF1/ DIF - 5.314 ,2/ may include 1credits reportes".3/ In 1966: value of assets of former AOF accruing to Niger for CFAF 187 million and contribution from Retirement
Fund 46 million. In 1964 contribution from local authorities. In 19671 includes CFAF 50 million proceeds ofNational Lottery.
4/ FFom BCEAO, in Bulletin No. 134, Nov. 1966 (fig. for RF subaidy is 486).IMF p. II. 97.From National Accounts for 1963, table No. 66, page 84 - The figure which include only capital outlays onaccount of the roads fund is probably less than total expenditures by the fund, by the amount of suchexpenditures as those related to engineering studies etc.
7/ Of which CFAF 526 million, aid ("smandates") and 321 committed and carried forward for payment.
General note: Operations of the Nigerien Tresor outaide the Oovernment budget are emall and have been graduallyreduced over the period. As a result the liabilities to external agents other than Government agencies
and even to these, are very small. This mean that the Tresor liquid funds are more or less net assets.The only significant operation outside budget concern certain movement of funds in conne@tton with
French external aid (FAC, OCRS) which, since 1963 or 1964, have been entirely transfered to COCE; the roadsfund which is directly administered by the Public Works Department and gets its resources from the budget;the resources belonging to local authorities which in 1966 were transfered to the BDRN; the National RetirementFund whose variations hardly exceed CFAF 100 million from one year to another; finally the holding of Customspromissory bills. Extra budgetary resources of the Tresor are, for all practical purposes, limited now to thelatter mentioned sources.
Table 13: TRESOR'S LIQUIDITY POSITI2
(million CFA francs)
Sept. 30 Sept. 30 Sept. 30 Sept. 30 Sept. 30 June 301962 1963 1964 1965 1966 1967
1. Deposits at French Tresor 749 903 857 317 437 157Variation +154 -46 -540 +130 -285
2. Funds at district agencies 425 343 443 389 332 293
3. Sub-total 1,174 1,246 1,300 706 769 445
4. Customs bills held 175 169 255 329 374 292
5. Total 1,349 1,L415 1,555 1,035 1,143 737
6. Variation (+ - increase - +66 +140 -520 +108 -406- = decrease)
7. Variation on account of main - -451 +463 -178 +223 -Government operations
8. Balance = variation on account - +517 -323 -342 -115 -of other public operations
General note: Expenditures of budget (incl. investment and roads fund) are "mandatements" i.e. lastprocedure before actual payment by Tresor. This is one reason it is not possible toreconcile the "variation of Tresor's position on account of Government operation" withTresor's liquid position as given in the Tresor's accounts.
Source: From Tresor's accounts.

Table 14: LOCAL BUDGETS
(million CEA francs)
1. Budgets of the Districtsi/
_1963 1964- 1965 1966 1967
Receipts
Current Revenue 451.0 456.0 714.7 867.0 995.4Central Governnrnt subsidies 4 . 2 9.0 15.0 13.1Loans_/and drawings fromreserve and investment funds _ 86.3 loh.9 93.0 139.3
456 .0 546.5 828.6 975.0 1148.4
Expenditures
A. CurrentAdministrative expenses 300.0 272.3 309.6 392.2 431.AExpenditures foreconomic development 90.0 93.0 37.9 49.1 66.5
Expenditures for education 30.0 38.8 124.7 145.2 155.6Health and social affairs 29.0 11.3 116.6 143.3 181.2Debt servicing and contribu-tions to UNCC and CPCL - 86.3 105.0 147.9 67.3Other expenditures - 30.6 99.4 88.4 127.8
449.0 532.3 793.2 966.1 1030.2
B. Investment 7.0 14.1 35.3 8.9(?)131.2
Total 456.0 546.5 828.6 975.0 1148.4
2. Budgets of the YhnicipalitiesV'(total expenditures)
1963: 263.61964: 328.91965: 364.61966: 392.81967: 335.0
1/ Presently there are 32 districts ("arrondissements") grouped in 7provinces ("departements")
2/ Fron UNCC and CPCL (Caisses de Prets aux Collectivites locales.)3/ There are 4 commines: Niamey, Maradi, Zinder and Tahoua (which only
recently acquired the municipality status.)
Sources: Part 1: Ministere de l'Interieur, Etat Comparatif Des Budgetsdes eirconscriptions, and data provided by the Nigerauthorities.
Part 2: E.F. Hentgen & R. Brusselle, Les Budgets des arrondisse-ments pour lexercice 1967.

Table 15: MAIN SOURCES OF AID - PROJECT AID AND AID TO THE GOVERNMENT BUDGET **(million CFA francs)
C = CommitmentsD = Disbursements
Total1960 1961 1962 1963 1964 1965 1966 1960-1966
C D C D C D C D C D C D C D C DFrance
FAC 1390 n.a. 204 749 1705 457 1936 859 1967 1149 1220 1318 1390 1074 9812 (5606) 1/CCCE(soft loan) 60 - - 30 104 103 329 296 200 h4 40 60 132 175 865 708 2/Aid to budget(grants) 775 1025 943 575 902 714 600 534 560 620 416 - .16 160 250 4356 4134
Total France 2225 (1025) 1147 1324 2711 1274 2865 1689 2727 1813 1676 1 1682 1499 15033 10l48EEC(FED) - - - 272 - 744 - 672 - 611 - 910 - 349 107173/ 3559Solidarity Fund of the
Entente(aid to thebudget:net) 4/ - 340 - 180 - - - 348 - 125 - - - - 993 993
USA 5/ - - 172 - 509 - 333 - 600_/ - 337 - 315 - 2266 (1226) 7/
UN Agencies(UNDF etc) - - 137 - 32 - 156 - 222 - 452 - - - 999 (999) 8/
IDA 9/ - - - - - - - - 368 _- - - 368 -
TOTAL 30376 (17825) 8/
1/ 1961-1966 only.2/ Loans by CCCE befare 1960 amount to CFAF 1,357 million of which 1,182 million represent the consolidation of the equivalent of Niger's participationto FIDES from 1946 to 1959 (FIDES was the French development fund before FAC).3/ Of which first FED (1960-1964): CFAF 7,349 and second FED(1964-69): CFAF 3,368 million./ See main report, page 23. -§/ US fiscal year.'/ Of which CFAF 440 million soft loan for Niger river bridge at Niamey.7/ Total committed assumed disbursed except loan for bridge at Niamey on which works started late in 1967.8/ Estimate.9/ Road project: disbursements have started in 1967 only.
Sources: French Mission dAide et de Cooperation in Niamey; CCCE.
** General Notes: (a) in addition to the above other donors have provided aid in various forms: West Germany has committed about CFAF 700 million,China(Taiwan) is conducting a few irrigation projects with Chinese technicians; Israel also provides some technical assis-tance, etc.
(b) technical assistance is provided mainly by France, to all sectors of the economy, notably education, general administration,agriculture, etc. (500 persone by May 1967). The financial equivalent of French technical assistance is of the order ofCFAF 1 billion per year.
(c) Inflows of public funds other than aid (e.g. French military expenditure) are not included in the table.

Table 16A: NIGER - EXTERNAL MEDIUM- AND LONG-TERM /1 PUBLIC DEBT OUTSTANDINGINCLUDING UNDISBURSED AS OF DECEBD4ER 31, 1967
Debt Repayable in Foreign Currency /1
(In thousands of U.S. dollars)
Debt outstandingDecember 31, 1967
Item Disbursed Includingonly undisbursed
TOTAL EXTERNAL PUBLIC DEBT 12,580 29,706
Publicly-issued bonds 27 27
Privately-placed debt - suppliers' credits 792 11,421
IDA credits 468 1,500
U.S. Government loans - AID 356 3,200
Loans from governments of other IBRD members 10,938 13,558
France 8,907 9,542Germany 1,015 3,000Ivory Coast 911 911Tunisia 105 105
/1 Debt with an original or extended maturity of one year or more.77 Includes the CFA franc which is freely convertible into the French franc.
Source: Statistical Services Division, Eoonomics Department, June 21, 1968
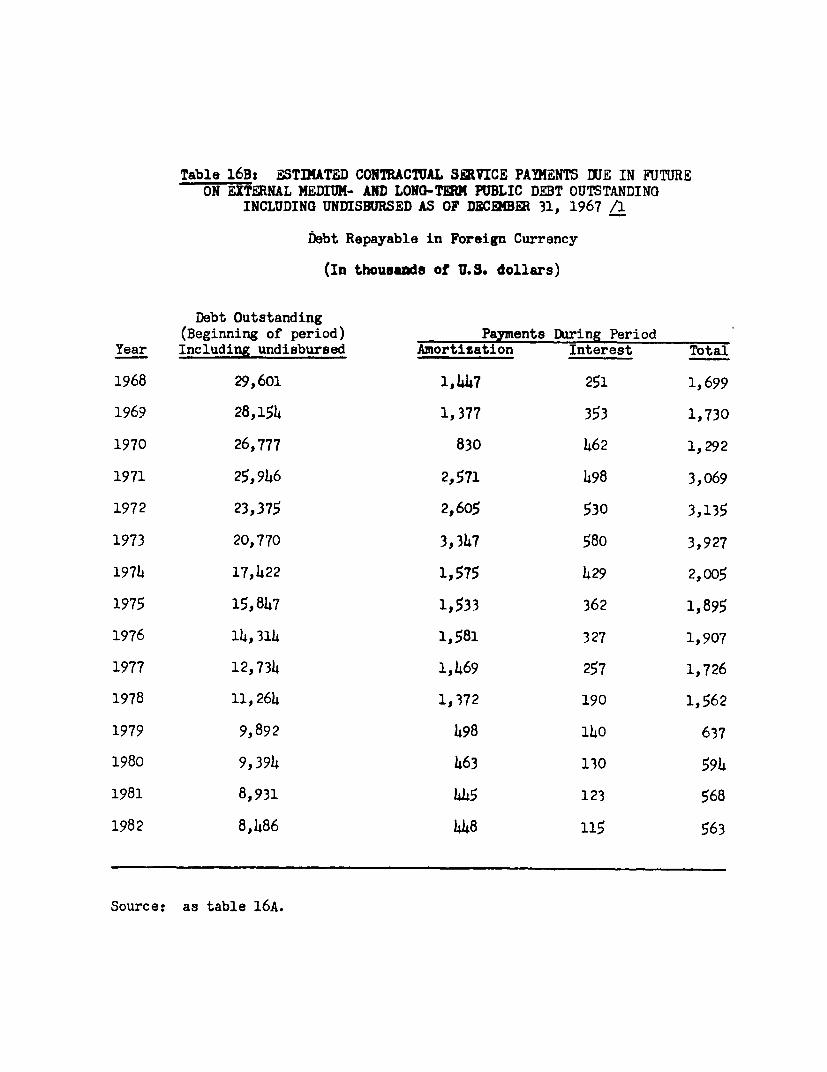
Table 16Bt ESTIMATED CONTRACTUAL SERVICE PA9MENTS DIJE IN FUTUREON EXTERNAL MEDIUM- AND LONG-TERM PUBLIC DEBT OUTSTANDING
INCLUDING UNDISBURSED AS OF DWECEMBER 31, 1967 /1
Debt Repayable in Foreign Currency
(In thousands of U.S. dollars)
Debt Outstanding(Beginning of period) Payments Daring Period
Year Including undisbursed Amortization Interest Total
1968 29,601 1,447 251 1,699
1969 28,154 1,377 353 1,730
1970 26,777 830 462 1,292
1971 25,946 2,571 498 3,069
1972 23,375 2,605 530 3,135
1973 20,770 3,347 580 3,927
1974 17,,422 1,575 429 2,005
1975 15,847 1,533 362 1,895
1976 14,314 1,581 327 1,907
1977 12,734 1,469 257 1,726
1978 11,264 1,372 190 1,562
1979 9,892 498 140 637
1980 9,394 463 130 594
1981 8,931 445 123 568
1982 8,486 448 115 563
Source: as table 16A.
Table 17t SAVINGS GAP OF THE PUBLIC SECTOR
(billions of CFA francs)
1959 1960 1961 1962 1963 1964
1. Total income 4 4.0 5.7 6.6 6.0 6.8 7.8
2. Current expenditures 4.8* 6.7* 6.8 6.7 7.1 6.7
3. Savings -0.8* -1.0* -0.2 -0.7 -0.3 +1.1
4. Debt servicing - - - - -0.2 -0.2
5. Investment in public budgets 0.5* 0.5* 0.5 0.7 0.6 0.6
6. Investment outside publicbudgets / 1.4 1.4 0.9 1.9 2.2 1.9
7. Total to finance ("gap") 2.7 2.9 1.6 3.3 3.3 1.7
(3)+(4)+(5)+(6) -
8. Total public transfers 5.5 4.2 6.3 7.1 6.2 4.9
9. Balance (8)-(7) / 2.8* 1.3* 4.7 3.8 2.9 3.2
Source: Adapted from national accounts
* Estimates: in 1959 and 1960 the negative savings have been taken equalto the French and other subsidies to the Government current budget:the resulting figure is probably on the high iside.
1/ Tax revenue and other current revenue of Niger Government, local and otherpublic autonomous budgets, including profits of public agencies (GPO, etc.)but not state enterprises of the commercial sector.
/ Investment financed on external project aid (FAC, FED, etc.).
3/ This is practically equivalent to foreign public current expendituresin Niger, the greater part being military. But it includes also somecash surplus of the public sector (which go to the Tresor and are transferredto France most of the time).
Table 18: MONETARY SURVEY
Factors affecting the money supply
December 31 of each year: Millions of CFAF 1/
1960 1961 1962 1963 196h 1965 1966 1967
1. Bank notes and coins .. ,. 2767.0 3231.0 2994.0 h131.0 456 2.0 5215.0
2. Demand deposits 1879.1 2287.2 2095.7 2519.5 2683.8 2572.1 2390.5 2573.0
3. Time deposits 90.1 21.5 7.6 42.8 2.0 2.3 381.8 541.0
4. Total money supply .. .. h870.3 5793.3 5679.8 67o5.4 733h.3 8329.0
5. Other net items of the balance sheet .. .. 317.6 529.6 - 6.6 275.4 951.7 541.0
6. Total assets and liabilities 5187.9 6322.9 5673.2 6980.8 8286.0 8329.0
7. Credits to the Economy 287.8 322.2 4651.6 5490.0 6507.0 8626.5 98433.o 9022.0
8. Credits to the Government .. .. - 993.0 - 870.0 - 1504.9 - 1045.5 - 1085.1 - 388.0
9. External Assets (net) .. .. 1529.3 1702.9 671.1 - 600.2 - 471.9 - 305.0
1/ December, which is in the middle of the groundnut campaign, constitutes a peak for credits to the economy.
Source: BCEAO: Notes dtInformation et Statistiques.
Table 19: DISTRIBUTION OF SHORT-TERM CREDITS BY MAIN SECTORS
(million CFA francs)
1962 1963 196h 1965 1966 1967Sept. Dec. Sept. Dec. Sept. Dec. Sept. Dec. Sept. Dec. June
1. By economic sectors 1/ 2,041 3,801 2,709 4,513 3,837 5,280 407 7 263 5,308 8 404 6 696Agriculture and fishing 2/ .. .. .. .. 10 .. 553 3, Industry 140 .. 84 .. 102 .. 13h 154 372 . . .Construction and public works 273 .. 347 .. 511 .. 6 4 6 660. 589 6 41 635Import-export 3/ 1,057 .. 1,283 .. 1,173 * 1,258 1,253 1,621 1,568 1,072Transportation and utilities 247 .. 225 .. 283 .. 277 289 337 366 310Other 324 770 .. 1,803 .. 1,583 1,522 1,836 .. .
2. By public and private sectors 2,041 3,801 2,709 4,513 3 837 5,280 4 407 7 263 5 308 8,.40 6,696.Public and semi-public sector .. .. .. .. .. ....... 3 2,31 . ..Private sector .. .. .. .. 2,205 .. 2,259 2,218 2,992 .. ..
1/ Breakdown not available for December prior to 1965.2/ Including exports of agricultural products fron 1965 onwards.3/ Excluding exports of agricultural products.
Source: BCEAO.

Table 20: FOREIGN TRADE - COMMODITY DISTRIBUTION
(billion CFA francs)
1960 1961 1962 1963 1964 1965 1966Recorded Recorded Recorded Recorded Recorded Estimated Recorded Estimated Recorded Estimated
I. Exports, f.o.b. 3.11 3.82 4.83 5.34 5.26 7.77 6.25 8.53 8.57 11.91
1. Groundnuts, shelled 1.81 2.58 2.76 3.38 3.29 3.29 3.06 3.06 5.33 5.332. Groundnut oil 0.36 0.30 0.12 0.21 0.41 0.h1 0.28 0.28 o.66 0.663. Groundnut cakes 0.07 0.08 0.06 0.04 0.12 0.12 0.09 0.09 0.21 0.21h. Cotton .. a/ .. a/ .. a/ 0.14 0.27 0.27 0.26 0.26 0.50 0.505. Livestock on the hoof 0.42 0.39 1.09 0.99 0.60 3.00 1.02 3.30 0.94 3.30*6. Hides and skins 0.15 0.09 0.11 0.09 0.12 ) 0.15 ) 0.12 )7. Dried and salted fish 0.03 0.07 0.13 0.07 0.03 ) o.68 0.01 ) - )8. Beans, sorghum, millet 0.02 0.11 0.23 0.14 0.03 ) 0.31 ) 1.54 0.13 ) 1.919. Tin ore 0.02 0.01 0.01 .. a/ .. a/ ) .. a/ ) . . a/ )
10. Others 0.23 0.19 0.32 0.28 0.39 ) 1.07 ) o.68 )
II. Imports, c.i.f. 3.21 4.65 6.78 5.97 8.28 9.11 9.30 10.23 11.11 11.56
1. Food, beverages, tobacco 0.83 1.07 1.53 0.99 1.04 1.21 1.432. Petroleum products 0.17 0.24 0.23 0.64 o.60 0.52 0.863. Raw materials 0.28 0.23 0.09 0.09 0.15 0.13 0.254. Semi-processed products b/ 0.03 0.05 0.27 0.25 0.44 (n.a.) 0.36 (n.a.) 0.43 (ni..)5. Manufactured goods 1.90 3.06 14.58 3.88 5.94 7.04 8.14
- for private consumption (1.30) (2.25) (1-49) (1.15) (1.48) (1.52) (1.60)- for industry (0.60) (0.81) (3.03) (2.67) (4.34) (5.31) (6-35)- for agriculture ( - ) ( - ) (0.06) (0.06) (0.12) (0.21) (0.19)
6. Others - 0.08 0.12 0.11 0.04 7
General Note: Estimates of total exports and imports vary; the above estimate for exports in 1964 is lower than that ofthe national accounts (CFAF 10.0 billion). The inclusion of trading services in the latter cannot accountalone for the difference.
a/ Included in "Others".b/ Includes textiles.
Source B.C.E.A.0.
* Reports BDRN

Table 21: FOREIGN TRADE - QUANTITIES OFFICIALLY RECORDED
Units 1960 1961 1962 1963 1964 1965 1966
I. EKports (principal commodities)
1. Groundnuts shelled tons 50,525 67,281 72,140 91,400 75,169 86,400 163,5672. Groundnut oil tons 4,673 4,974 1,911 3,141 5,491 4,811 8,7893. Groundnut cakes tons 5,864 6,196 5,528 4,004 17,548 6,755 16,3074. Cotton tons .. .. 2 1,064 1,947 1,905 2,0395. Livestock on the hoof heads 134,000 157,000 272,990 182,089 163.215 111,325 163,5886. Hides and skins tons 1,338 384 492 326 389 629 4407. Dried and salted fish tons 363 499 1,858 1,200 484 71 8. Sorghum and millet tons 110 3,115 3,459 2,909 749 13,263 _9. Tin ore tons 77 71 62 87 72 78 86
10. Niebe beans and vegetables tons 1,313 907 19,837 9,057 3,697 18,445 7,670
II. Imports (selected items)
1. Rice tons 930 1,398 1,329 2,087 883 2 , 1 2 6 a/ -2. Wheat flour tons 717 1,923 3,050 1,461 1,437 1,453 3,5963. Concentrated milk tons 51 153 241 157 229 .. -4. Salt tons 1,588 4,454 7,641 5,567 6,705 5,042 8,2825. Sugar tons 4L,263 4,202 6,774 6,299 6,209 6,455 8,4156. Beer tons .. 2,300 4,655 2,134 1,933 2,364 1,9127. Cement tons 10,722 11,736 17,107 9,784 13,469 12,998 6,2168. Petroleum & products tons 8,426 17,361 23,418 34,621 34,501 30,954 42,9189. Cotton cloth b/ tons 907 2,072 2,425 1,510 5,237 5,400 4,858
10. New jute sacks tons 455 551 698 817 754 *-11. Iron and steel semi-fabrics tons 2,033 8,896 3,722 3,953 6,029 4,980 8,53712. Motor vehicles and parts tons 676 1,227 1,651 871 1,684 1,884 1,783
a/ Nine months.b/ Including blankets.
Source: Direction des Donanes,Service de la Statisque et de la Mecanographie.

Table 22A GEOGRAPHICAL DISTRIBUTION CF RECORDED EXPORTS
(million CFA francs)
1963 1964 1965 1966
France 3,613 3,334 3,513 4,705% 67.7 63.4 56.2 54.9
Other EEC 20 80 129 1,065% o.4 1.5 2.1 12.4
Nigeria 1,036 1,264 1,586 1,497X 19.4 24.0 25.4 17.5
West African Mbnetary Union 273 284 318 472% 5.1 5.4 5.1 5.5
Other 397 298 704 858% 7.4 5.7 11.3 10.0
Total 5,339 59260 6,250 8,574% 100 100 100 100
Source: Indicateurs Nigerians, BCEAO
Table 22B: GEOGRAPHICAL DISTRIBUTION OF RECORDED IMPORTS
(million CFA francs)
1963 1964 1965 1966
France 3,061 4,624 4,944 5,730% 51.2 57.0 53.2 57.6
Other EEC 345 789 1s040 1,096% 5.8 9.7 11.2 9.9
United Kingdom 129 168 279 377% 2.2 2.1 3.0 3.4
USA 219 287 324 424% 3.7 3.5 3.5 3.8
China 69 128 451 609% 1.2 1.6 4.8 5.5
Japan 2 25 64 399% 0.03 0.3 0.7 3.6
Nigeria 438 260 162 164% - 7.3 3.2 1.7 1.5
West African Monetary Union 768 882 848 979% 12.9 10.9 9.1 8.8
Others 943 951 1,188 1,337% 15.8 11.7 12.8 12.0
Total 5,74 5,114 9,300 11,115% 100 100 100 100
Source: Indicateurs Nigeriens, BCEAO.

Table 23: BALANCE OF PAYICNTS WITH NON-FRANC AREA
(in million FF)
1961 1962 1963 19641 1965 1%66
1. Ingorts 15.3 21.5 22.0 29.2 39.9 75.2
2. Exports 3.6 3.9 5.4 8.4 4.7 2.6
3. Trade balance -11.7 -17.6 -16.6 -20.8 -35.2 -76.6
4. Services (net) -9.7 -20.3 -24.9 -27.5 -20.7 -30.1
5. Transfers (net) 6.3 13.5 13.7 11.2 15.5 43.1
6. Capital (net) .. 0.1 -6.9 +0.3 +0.8
7. Overall balance -15.1 -214.3 -34.7 -36.8 -39.6 -63.6
Source: La Zone Franc, annual reports by the Comite o bnetaire dela zone Franc; and, for 1966, Bulletin de l'Afrique Noire,No. 1435, Feb. 7, 1968.

Table 24: ENERGY
Consumption of fuel (m3)
1961 1962 1963 19641 1965 1966 1967(6 months)
Jet 2,959 2,960 14560 5,397 4,833 5,262 (3,607)
Airplane fuel 6,359 5,620 3,271 3,552 3,570 2,380 (1,071)
Gasoline 14t,979 15,511 15,831 15,224 15,305 16,682 (8,740)
of which in Niamey 6,019 6,895 7,158 7,854k 7,896 9,094
Gas-Oil 8,014 10,680 11,853 12,386 14,335 20,452 (14,603)
of which in Niamey 3,970 6,108 6,610 6,898 7,803 10,578
Petroleum 3,h76 1.,103 1.,686 4h,587 14,282 4,039 (1,885)
General total 35,787 38,874 40,201 41,066 42,325 4s8,815 (29,906)
Index 100 108 112 114. 118 136
Source: Annual reports BDRN and Indicateurs Nigeriens, BCEAO.
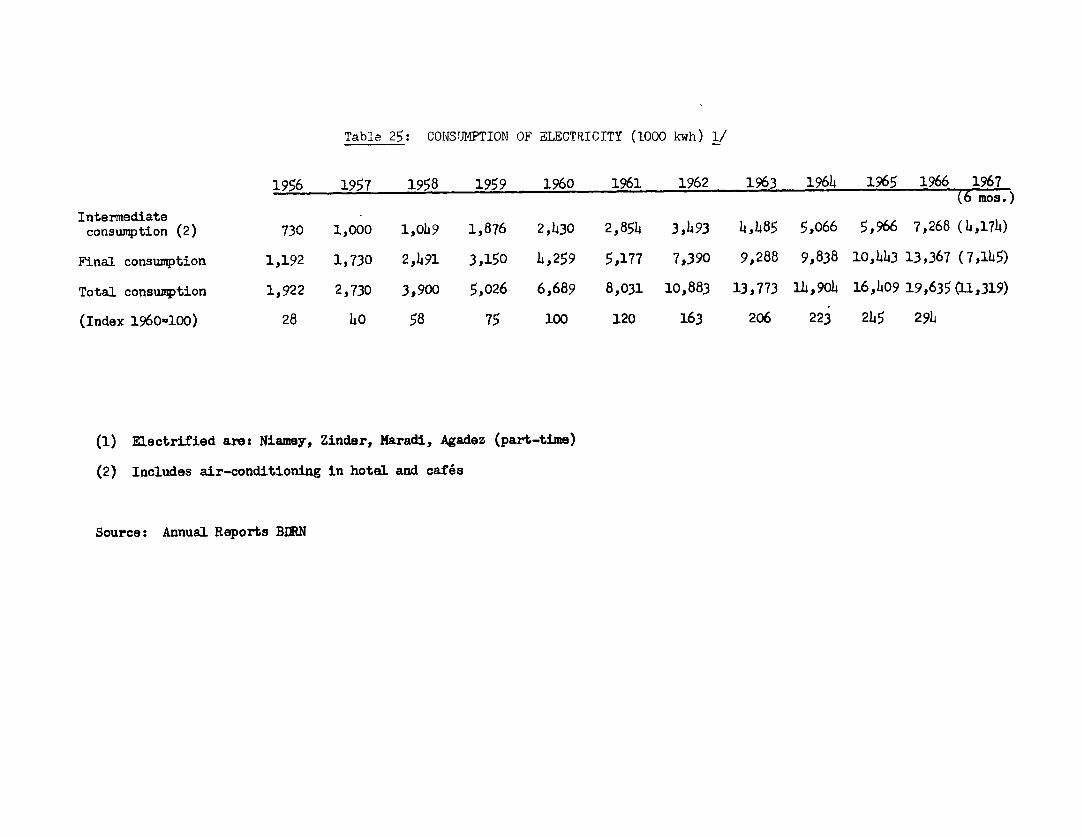
Table 25: C01STJMPTION OF ELECTRICITY (1000 kwh) 1/
1956 1957 1958 1959 1960 1961 1962 1963 1964 1965 1966 1967(6 mos.)Intermediate
consumption (2) 730 1,000 1,009 1,876 2,430 2,854 3,493 4,485 5,o66 5,966 7,268 (4,174)
Final consumption 1,192 1,730 2,491 3,150 L,259 5,177 7,390 9,288 9,838 10,443 13,367 (7,145)
Total consumption 1,922 2,730 3,900 5,026 6,689 8,031 10,883 13,773 114,904 16 ,409 19,635(11,319)
(Index 1960u100) 28 40 58 75 100 120 163 206 223 245 294
(1) Electrified are: Niamey, Zinder, Naradi, Agadez (part-time)
(2) Includes air-conditioning in hotel and caf6s
Source: Annual Reports BDRN

Table 26: TRANSPORTATION COST BETWEEN COTONOU AND NIAMEYFOR SELECTED COMMODITIES 1/
(CFA francs per ton)
For loads of For loads ofup to 5 tons over 5 tons
Cement 9,000 8,500
Semi-fabricated metal parts 13,200 12,700
I4etal sheets 13,700 13,200
Salt 8,500 8,000
Rice and flour 12,500 12,000
Sugar 12,000 11,500
Soap 1h,000 13,500
>Jine (not bottled) 1h,500 14,000
Beer 12.500 12,000
Textiles 15,650 15,150
1/ iks of mid-1966. Distance Cotonou-Niamey is 950 km (600 miles).
Source: Guide de ltinvestisseur, Niamey December 1966.

Table 27: INDUSTRY
GROSS SALES OF INDUSTRIAL ENTERPRISES AND NUMBER OF ENTERPRISES IN 1966 1/(million CFA francs)
-Number af 1000 and
Sector enterpri'ses -5 5-10 10-20 20-50 50-100 100-200 200-500 500-1000 over Total
- Agro-industries andfood processing 7 - - - 31.6(1) 236.8(3) 139.9(1) - 592.0(1) 1,180.4(1) 2,180.7
- Mechanical andelectrical industries 3 - - 12.4(1) 56.6(2) - - - - 69.0
- Chemical industries 3 2.2(1) - - - 88.3(1) 136.3(1) - - - 226.8
- Printing 4 3.6(2) - 14.2(l) 33.9(1) - - 51.7
- Miscellaneous industries 6 2.9(2) 16.2(2) - 26.8(1) - - 494.4(l) - - 544.3
- Construction, public worksand related activities 16 9.6(1) 40-9(3) 95.2(3) 267.9(4) 367.1(3) 514-5(2) - - 1,295.2
Total 39 8.7(5) 25.8(3) 67.5(5) 244.1(8) 593.0(8) 647.3(5) 1,012.9(3) 592.0(1) 1 j80.4(l) 4,367.7
& Number of enterprises indicated between brackets.
Source: Annual Report 1967 BDRN