world bank document - portland state university · pdf filethe world bank vietnam is an...
TRANSCRIPT

W O R L D B A N K
THEWORLDBANK
ISBN 0-8213-5543-0
R E G I O N A L A N D S E C T O R A L S T U D I E S
Economic Growth,Poverty, andHousehold Welfare in VietnamEconom
ic Grow
th,Poverty,andH
ousehold Welfare in V
ietnamEDITED BY
PAUL GLEWWE
NISHA AGRAWAL
DAVID DOLLAR
GLEWW
E/AGRAWAL/DOLLAR
THE WORLD BANK
Vietnam is an economic success story. It transformed itself from a country in the 1980sthat was one of the world’s poorest to a country in the 1990s with one of the world’shighest growth rates. With the adoption of new, market-oriented policies in the late1980s, Vietnam averaged an economic growth rate of 8 percent per year from 1990 to2000. This economic growth was accompanied by a large reduction in poverty (from 58percent in 1993 to 37 percent in 1998), which included dramatic increases in schoolenrollment and a rapid decrease in child malnutrition.
Economic Growth, Poverty, and Household Welfare in Vietnam uses anunusually rich set of macroeconomic and household survey data to examine severaltopics. These include the causes of the economic turnaround and prospects forfuture growth; the impact of economic growth on household welfare, as measured byconsumption expenditures, health, education, and other socioeconomic outcomes;and the nature of poverty in Vietnam and the effectiveness of government policiesintended to reduce it.
Although Vietnam’s past achievements are quite impressive, future progress is by no means ensured. This book draws lessons for Vietnam and for other low-income developing countries. It is a valuable resource for anyone—including those in the devel-opment community, academia, and the media—who is interested in economic policy,poverty reduction strategies, health care, education, and social safety nets.
™xHSKIMBy355435zv":;:&:%:.
Publ
ic Di
sclo
sure
Aut
horiz
edPu
blic
Disc
losu
re A
utho
rized
Publ
ic Di
sclo
sure
Aut
horiz
edPu
blic
Disc
losu
re A
utho
rized

3
The Wage Labor Market and Inequality in Vietnam
John Luke Gallup
Vietnam has had rapid economic growth since the implementation of theDoi Moi (renovation) policies in the late 1980s, despite a sometimes fitfulmarket reform process. This fitfulness has been due to ideological doubtsabout moving toward a market-based economy, as well as concern aboutthe social impact of a market-based transformation.
The changes have indeed been dramatic. Output per person grew at anaverage rate of 5.5 percent per year from 1988 to 1998, raising the averagelevel of output per person by 73 percent in a decade (see figure 3.1).1 Thistransformation has been of such magnitude that it has touched all facets ofsociety and dramatically reduced poverty.
Family farms and small household enterprises still dominate theincome-generating activities of the population, and much of the initialchange due to Doi Moi occurred in the small farm and small household en-terprise sectors. But wage employment is the future. Historically, the processof economic development has always caused a transition out of small farmsand household enterprises into wage employment, as worker productivityincreases and nonhousehold enterprises dominate the economy. Scrutiniz-ing the evolution of the labor market in the 1990s gives us clues about howeconomic development in Vietnam will continue to affect households andsociety in the coming decades.
The economic transformation in Vietnam, despite its positive impact onpoverty, could increase inequality. If that occurs, the labor market is likely tobe the source of the disparity. The development of urban private enterprisecould polarize workers between those in high-paying skilled jobs andothers, often immigrants from the countryside, who are eligible only for low-skilled, low-paying jobs. If employment creation concentrates in the cities, itwidens the gap between rural and urban dwellers. In a situation where there
53

is a lack of opportunity for the poor and an increasing disparity of income,the economic transformation could contribute to many social problems.
This chapter uses the two completed rounds of the Vietnam Living Stan-dards Survey (VLSS)2 to evaluate the contribution of wage employment toinequality and income growth over the period of rapid economic growth inthe 1990s that followed market reforms. It will address the question: Has theexpansion of wage employment in Vietnam exacerbated social inequalities,despite its contribution to income growth? If Vietnam is able to sustain itseconomic development, wage employment will become an increasingly im-portant source of household income as family farms and small householdenterprises become less prevalent. Comparing the recent evolution of wageemployment to farm and nonfarm self-employment provides clues as tohow economic development will change Vietnamese society, in particular itsimpact on income inequality within and between communities.
This chapter shows that standard methods for calculating income in-equality can be severely biased by measurement error when decomposingthe contribution of different sectors, regions, or groups to overall inequality.An easily calculated, alternative, consistent method for decomposing incomeinequality is proposed.
The first section reviews developments in the Vietnamese labor marketin the 1990s, focusing on wage employment as opposed to self-employment.The following section explores the determinants of wages to find the indi-vidual and community characteristics that explain why different people arepaid different wages. A presentation of standard inequality measures fol-lows. This section considers the important impact of measurement error oninequality statistics and proposes a new statistic that is not subject to the
54 Economic Growth, Poverty, and Household Welfare in Vietnam
0
50
100
150
200
250
300
350
GNP per capita (1995 US$)
1986 1988 1990 1992 1994 1996 1998
Figure 3.1. Economic Growth in Vietnam
Source: World Bank 2000b.

biases of standard inequality measures. The section on Vietnamese wageinequality describes wage inequality in the country and how it has changedduring the last decade. This is followed by a discussion of the contributionof wage employment to overall income inequality. Finally, the relationshipbetween income sources and overall inequality is used to predict futurechanges in income inequality, followed by the conclusion.
The Vietnamese Labor Market
This section evaluates how the rapid economic changes in Vietnam have af-fected labor force participation, unemployment, sectoral shifts in employ-ment, and the growth and regional differences in wages.
Labor Force Participation and Unemployment
In Vietnam, a high percentage of the working-age population works. Evenwhen housework is excluded (but work on the household farm or house-hold business is included), 81 percent of all Vietnamese women and 85 per-cent of men ages 16 to 60 were working in 1993 (see table 3.1).3 As incomerose during the 1990s, participation rates rose by 2 percent for women andwere unchanged for men.
In rural villages, participation rates are even higher—83 percent forwomen and 87 percent for men in 1993. Rural participation rates jumped by4 percent for women and stayed unchanged for men, so that both rural menand rural women had the same 87 percent participation rate in 1998.
Participation rates were lower in urban areas than in rural areas in 1993,at 74 percent for urban women and 78 percent for urban men. Unlike rural
The Wage Labor Market and Inequality in Vietnam 55
Table 3.1. Labor Force Participation, Ages 16–60 (percent)
Change,Population 1993 1998 1993–98
FemaleRural 82.8 87.0 4.2Urban 73.4 70.4 !3.4Total 80.5 82.8 2.3
MaleRural 87.1 87.1 0.0Urban 77.7 77.3 !0.4Total 84.7 84.7 0.0
Note: Labor force participation is the percentage of the working age population (16–60) whowere working in the previous seven days or who were looking for work.
Source: Author’s calculations from the 1993 and 1998 VLSSs.

women, urban women’s participation fell substantially by 3 percent to 70 per-cent in 1998. Urban men’s participation also fell slightly to 77 percent in 1998.
Unemployment—people looking for work who do not have a job—isvery low in Vietnam. In 1993, the unemployment rate was 0.5 percent inrural areas and 1.5 percent in urban areas (table 3.2). Unemployment fell by0.1 of a percentage point from 1993 to 1998, an insignificant change. Thevirtual absence of unemployment is probably due to a combination of fac-tors, including the fact that Vietnam’s income level is too low to permitpeople to be without work while job searching, and the wide availability ofself-employment on a household farm or enterprise.
The Composition of Employment
Vietnam is still a highly agricultural country, with half of all workers work-ing on family farms, but the share of agricultural employment is shrinking.
“Self-employment” is defined here in an unconventional way because ofinconsistencies between the two rounds of the VLSS. The survey questionasking whether the survey respondent was self-employed in his or her mainjob in the previous seven days was changed from the 1993 to the 1998survey.4 Using this self-employment question results in dramatic, but spuri-ous, changes in type of self-employment between 1993 and 1998. To ensurecomparability, tables 3.3, 3.4, and 3.5 use the questions about whether the re-spondent has worked in any job in the three sectors (wage employment,nonagricultural self-employment, and agricultural self-employment) dur-ing the previous week, so that the sector designations are not mutuallyexclusive. To make the sectors mutually exclusive, “wage employment” in-cludes anyone who has worked in wage employment, whether it was theperson’s main job or not. “Nonagricultural self-employment” excludes any-one who has participated in any wage employment, and “agricultural self-employment” excludes anyone with any other employment. This tends toexaggerate the number of wage employees and nonagricultural self-employed at the expense of the agricultural self-employed, but it should notbias the rate of change over time.
The share of agricultural self-employment (family farms) fell from 52 per-cent in 1993 to 50 percent in 1998 (table 3.3). The 2 percentage point drop in
56 Economic Growth, Poverty, and Household Welfare in Vietnam
Table 3.2. Unemployment Rates (percent)
Sector 1993 1998
Rural 0.5 0.4Urban 1.6 1.5
Note: The unemployment rate is the percentage of people ages 16 to 60 in the labor force inthe seven days before the survey who were not working and who were looking for work.
Source: Author’s calculations from the 1993 and 1998 VLSSs.

The Wage Labor Market and Inequality in Vietnam 57
Table 3.3. Sectoral Composition of Employment (percent)
Change,Employment sector 1993 1998 1993–98
Wage employment 23.9 24.9 1.0Agricultural self-employment 51.6 49.7 !1.9Nonagricultural self-employment 24.5 25.4 0.9
Note: Sectoral employment is the percentage of workers ages 16 to 60 employed in each ofthe three sectors in the previous seven days. See text for definition of sector.
Source: Author’s calculations from the 1993 and 1998 VLSSs.
Table 3.4. Rural Composition of Employment, by Sex (percent)
Change,Sector 1993 1998 1993–98
MenWage employment 24.5 26.3 1.8Agricultural self-employment 57.4 54.8 !2.6Nonagricultural self-employment 18.0 18.9 0.9
WomenWage employment 13.0 12.7 !0.3Agricultural self-employment 67.1 66.1 !1.0Nonagricultural self-employment 20.0 21.2 1.2
Source: Author’s calculations from the 1993 and 1998 VLSSs.
Table 3.5. Urban Composition of Employment, by Sex (percent)
Change,Sector 1993 1998 1993–98
MenWage employment 50.9 53.0 2.1Agricultural self-employment 12.9 8.2 !4.7Nonagricultural self-employment 36.2 38.8 2.6
WomenWage employment 35.0 37.7 2.7Agricultural self-employment 15.0 12.7 !2.3Nonagricultural self-employment 50.0 49.6 !0.4
Source: Author’s calculations from the 1993 and 1998 VLSSs.

the employment share of agricultural self-employment was equally sharedby increased wage employment and nonagricultural self-employment. Wageemployment and nonagricultural self-employment each grew to 25 percentof total employment.
Rural men’s employment changed more decidedly than overall employ-ment toward the wage labor market. Of the 3 percentage point fall in ruralmen’s agricultural self-employment from 1993 to 1998, 2 percentage pointswent into wage employment, but only 1 percentage point went into non-agricultural self-employment.
Rural women’s employment is the most highly agricultural, with two-thirds of employed women working on family farms. It also fell the least,by 1 percentage point. Rural women’s wage employment also fell slightly,while nonagricultural self-employment expanded by 1 percentage point.
The changes in the urban sectoral composition of employment weremore dramatic (table 3.5). For urban men, agricultural self-employment stillaccounted for 13 percent of employment in 1993, but it had fallen 5 percent-age points by 1998. There was a roughly equal transfer of employment intononagricultural self-employment and into wage employment, which madeup 53 percent of all employment by 1998.
Urban women saw the greatest increase in wage employment, almost3 percentage points from 1993 to 1998. The expansion of the wage employ-ment came from a sharp reduction in agricultural self-employment and asmall reduction in nonagricultural self-employment.
Agricultural employment shrank for everyone between 1993 and 1998. Itfell twice as much in urban areas as rural areas, and twice as much for menas for women. Where the agricultural workers went differed for men andwomen. Men’s employment expanded roughly equally into wage employ-ment and nonagricultural self-employment in both urban and rural areas.Rural women’s movement out of agricultural work was entirely absorbed bynonagricultural self-employment, while urban women’s reduced participa-tion in agriculture went entirely into wage employment.
This chapter will focus on wage employment of adults and its impacton inequality. Questions of agricultural and nonagricultural employmentare left aside, but other chapters in this volume focus on agriculture (seechapter 5, by Dwayne Benjamin and Loren Brandt) and household enter-prise (see chapter 4, by Wim P. M. Vijverberg and Jonathan Haughton).
Wage Growth
As shown above, there was a steady expansion of wage employment inVietnam in the 1990s for men and urban women. What happened to wages asthis expansion occurred? Despite the increase in the supply of wage workers,wages in Vietnam grew extremely rapidly. Average hourly wages increasedby 10.5 percent per year in real terms between the 1993 and the 1998 VLSSs(table 3.6). Over the course of just five years, wage levels jumped by two-thirds.Wage growth was considerably faster than the growth in household income
58 Economic Growth, Poverty, and Household Welfare in Vietnam

per person in the same period, which grew at 8.7 percent per year, as well asoutputperpersonintheeconomyasawhole,whichgrewat6percentperyear.5
Regional Wage Differences
Wage growth and wage levels were distributed unevenly across differentregions of the country, with a split between the two primary cities—Ho ChiMinh City and Hanoi—and the rest of the country (table 3.6).6 The twourban centers had higher wages than the rest of the country in 1993, andtheir wages grew much faster from 1993 to 1998.
In 1998, average Ho Chi Minh City and Hanoi wages were more than50 percent higher than in all the other regions. Ho Chi Minh City wagesstarted out 37 percent higher than all other regions in 1993, and grew 1 per-centage point faster than overall wages from 1993 to 1998.
Wages in Hanoi were not much higher than wage levels in other parts ofthe country in 1993, but grew by 19 percent per year to become the highestwages in the country. In 1998 wages in Hanoi were even 5 percent higherthan they were in Ho Chi Minh City.
Ho Chi Minh City and Hanoi together make up a significant part ofVietnam’s wage labor market, accounting for 25 percent of all wage jobs in1998, although they account for only 8 percent of the country’s population(18 percent of all wage employment is in Ho Chi Minh City and 7 percent isin Hanoi).7
Outside Ho Chi Minh City and Hanoi, average wages were surprisinglysimilar across regions in 1993, and they had become even more similar by1998. Regions with lower wages in 1993 are the ones that saw the largestwage increases in the 1993–98 period, and the regions with the highestwages initially tended to grow more slowly. Medium-size urban and ruralcentral regions had the lowest average wages in 1993 and saw the largest
The Wage Labor Market and Inequality in Vietnam 59
Table 3.6. Wage Levels and Growth, by Region
Annual change, Percent of 1998 1993 1998 1993–98 Ho Chi Minh
Region wage wage (percent) City wage
Ho Chi Minh City 2.60 4.70 11.9 100.0Hanoi 1.94 4.91 18.6 104.5Medium urban 1.64 3.10 12.8 66.0Small urban 1.81 2.91 9.5 61.9Rural north 1.54 2.39 8.8 50.9Rural central 1.50 2.41 9.5 51.2Rural south 1.93 2.65 6.4 56.4
Total 1.85 3.13 10.5 66.6
Note: Wages are mean hourly compensation in thousand 1998 dong.Source: Author’s calculations from the 1993 and 1998 VLSSs.

increase in wages by 1998. The rural south, which had the highest wagesoutside the two largest cities in 1993, saw the lowest increase in the follow-ing five years. With the exception of the two largest cities, labor marketsseem to have been equilibrating over this period, with wages becoming moresimilar over the course of the decade.
The divergence of the largest cities from the rest of the country could bedue to the fact that the demographic characteristics of workers and the kindsof employment are different in different parts of the country. If the best-educated, most productive workers are drawn to the main cities, the wagedisparity could be due to differences in worker characteristics rather thandifferences in wages for the same kinds of workers. Table 3.7 makes wagerates more comparable across regions by restricting wages of those workerswith at least a lower secondary school education, working for a privatenongovernmental or non-state-owned enterprise, and a nonagriculturalbusiness. Wages for skilled, private, nonagricultural work show even fastergrowth and a stronger convergence across regions over the 1993–98 periodthan overall wages, again with the exception of the two primary cities.Hanoi had the lowest level of skilled private wages of any region in 1993 butcaught up so fast that it had the highest wages of all by 1998, with wagegrowth of 27 percent per year.8 When considering workers with high educa-tion and private, nonagricultural, employers, Hanoi and Ho Chi Minh Citystill have more than a 50 percent wage premium. Except for the rural south,the two largest cities have a 75 percent wage premium over the rest of thecountry for skilled private employment.
Hours Worked
At the same time that hourly wages grew extremely rapidly and employ-ment shifted toward the wage labor market, hours worked in wage labor alsoincreased rapidly, all of which contributed to the large rise in wage income.
60 Economic Growth, Poverty, and Household Welfare in Vietnam
Table 3.7. Skilled, Private, Nonagricultural Wages, by Region
Annual change, Percent of 1998 1993 1998 1993–98 Ho Chi Minh
Region wage wage (percent) City wage
Ho Chi Minh City 2.34 5.57 17.3 100.0Hanoi 1.50 5.75 26.8 103.1Medium urban 1.53 3.16 14.5 56.7Small urban 1.82 2.95 9.7 53.0Rural north 1.90 2.58 6.2 46.4Rural central 2.57 3.02 3.2 54.2Rural south 2.23 3.62 9.7 65.1
Total 2.01 3.78 12.6 67.9
Note: Wages are mean hourly compensation in thousand 1998 dong.Source: Author’s calculations from the 1993 and 1998 VLSSs.

On average, hours worked in wage employment increased by 18 percentfrom 1993 to 1998 (table 3.8). In 1993, there was a sharp difference betweenrural and urban wage employment in terms of total hours worked. Workersin medium-size and large cities worked, on average, about 50 percent morehours per year than rural wage laborers. Workers in Ho Chi Minh Cityworked the longest hours in 1993, averaging 2,176 hours per year. Assumingan eight-hour workday and a five-day workweek, this works out to 272 workdays, or 54 workweeks.9 These are long hours by any standard. Despite this,by 1998, working hours in Ho Chi Minh City had grown by 9 percentagepoints. Ho Chi Minh City, Hanoi, and medium-size urban centers had thehighest average working hours in 1993, but their increases in working hourswere more modest than the increases in rural areas and small urban centers.Rural areas and small urban centers partially caught up with the workinghours in the medium-size and large cities between 1993 and 1998, with verylarge increases in rural wage labor working hours.
State-Owned Enterprise Employment
The Vietnamese government has made plans for the reform of state-ownedenterprises (SOEs) since the beginning of Doi Moi in the late 1980s. Despiteplans for staff reductions, the political commitment to reform has not alwaysbeen clear because SOE employees are an important political constituencyfor the government. All of Vietnam’s 5,740 SOEs are scheduled to be priva-tized or restructured by 2005 (Belser and Rama 2001), so it is useful to reviewwhat was accomplished between 1993 and 1998.
SOE personnel account for 5 percent of the labor force and more than15 percent of wage employment. Surprisingly, SOE employment as a shareof wage employment grew by almost 1 percent from 1993 to 1998 in the VLSSsample, from 15.9 to 16.7 percent (table 3.9). The estimates of SOE employ-ment in the VLSS should be reasonably accurate because there is a sample of340 SOE employees in 1993 and 563 employees in 1998.
The Wage Labor Market and Inequality in Vietnam 61
Table 3.8. Average Annual Hours Worked in Wage Employment
Change, 1993–98 Region 1993 1998 (percent)
Ho Chi Minh City 2,176 2,365 8.7Hanoi 2,022 2,113 4.5Medium urban 2,027 2,184 7.7Small urban 1,816 2,169 19.4Rural north 1,113 1,460 31.2Rural central 1,321 1,576 19.3Rural south 1,276 1,628 27.6
Total 1,572 1,862 18.4
Source: Author’s calculations from the 1993 and 1998 VLSSs.

The increasing share of SOE employment in wage employment occurredwhile wage employment was growing as a fraction of total employment(table 3.3), while employment participation was growing (table 3.1), andwhile the total population was growing. If we apply the total populationgrowth of 8.3 percent from 1993 to 1998 (World Bank 2002, p. 108) to theworking population, that implies that SOE employment grew by 20.2 per-cent from 1993 to 1998, or 3.7 percent per year.
Wage levels at SOEs mirrored the changes in other wage employment.SOE wages increased by 68 percent in real terms from 1993 to 1998, while allwages grew by 69 percent (table 3.9). SOE wages remained slightly lowerthan average wages in other jobs, at a steady 93 percent of average wages inboth 1993 and 1998. Although SOE wages were typical of overall wages, therapid increase in SOE wages in the 1990s is surprising during a period ofplanned retrenchments of SOEs.
The VLSS data show that SOE employment is predominantly male. Only7.6 percent of SOE workers were women in 1993, and this stayed essentiallythe same in 1998. The small participation of women in SOEs is untypical ofoverall wage employment, where 43 percent of workers were women in1993, although this fell to 40 percent by 1998.
Wage Employment Patterns
In sum, wage employment shows remarkable growth in wage levels andhours worked, as well as a more modest increase in the fraction of workersemployed outside the home. Hanoi and Ho Chi Minh City maintain largewage premia, probably because the residency permit restrictions in thesecities exclude people who were not born in the city. SOE employment levelsshowed a surprising 20 percent increase between the surveys, and SOEwages kept up with the rapid increase in overall wages.
62 Economic Growth, Poverty, and Household Welfare in Vietnam
Table 3.9. State-Owned Enterprise Employment
SOE employment Change, 1993–98measures 1993 1998 (percent)
SOE share of wage employment (percent) 15.9 16.7 0.8
Average hourly wage in SOEs (thousand 1998 dong) 1.72 2.90 68.4
Share of SOE employees, female (percent) 7.6 7.4 !0.2
Share of all wage employees, female (percent) 43.0 39.8 !3.1
Source: Author’s calculations from the 1993 and 1998 VLSSs.

Determinants of Wages
Which individual characteristics or employment characteristics determinehow much an individual earns in the labor market? Previous work showsthat wages are typically positively correlated with education levels and withwork experience (at a decreasing rate).10 In other countries, wages are typi-cally negatively correlated with being female or being a member of an eth-nic minority.11 Wages also typically vary by regions within a country. In thecase of Vietnam, where much of wage employment is still offered by thestate and there is still a large amount of agricultural employment, indicatorsof private and nonagricultural employment also explain wage levels.
Returns to Education and Experience
The determinants of wages can be explored with a simple earnings equation:
log(Wagei ) = !0 + !1 X1i + · · · + !K XK i
where Wagei is the wage of individual i, X1i , . . . , XK i are the K correlates ofwages (such as education, experience, and so on), and !0, !1, . . . , !K are theeffects of the correlates on wages. Log(·) is the natural logarithm. With cer-tain assumptions, the coefficient on education (!1) can be interpreted as theinternal rate of return to an additional year of schooling (Berndt 1991, p. 162).
The estimated effect of education and experience on wages is shown intable 3.10. The estimated rate of return to schooling in Vietnam in 1993 wasquite low, just 2.9 percent. The rate almost doubled to 5 percent in 1998, but itis still very low compared with other developing countries. Psacharopoulos(1985, p. 588), for example, reports an average rate of return of 11 percent for
The Wage Labor Market and Inequality in Vietnam 63
Table 3.10. Wage Regressions: Estimated Effect of Education and Experience
Difference, Independent variables 1993 1998 1998–93
Schooling (years) 0.029 0.050 0.021(6.29)*** (14.61)*** (3.84)***
Experience (years) 0.033 0.025 !0.008(5.42)*** (4.80)*** (0.93)
Experience squared !0.001 !0.001 0.000(5.37)*** (4.52)*** (0.66)
Constant 7.269 7.757 0.488(91.40)*** (128.23)*** (4.76)***
Observations 2,007 3,033R2 0.04 0.08
***Significant at 1 percent level.Note: Absolute value of t statistics in parentheses.Source: Author’s calculations from the 1993 and 1998 VLSSs.

Asia, 13 percent for Africa, and 14 percent for Latin America, averaging overmany similar studies using this model of wage determinants. The increasein the rate of return to schooling from 1993 to 1998 of 2.1 percent is statisti-cally significant.
The average rate of return to a year of education was quite low in the1990s, but there was considerable variation in the return to different levels ofschooling, at least for private employment, as shown in chapter 16 of thisvolume. Particularly for the small number of university graduates in thesample, the return to a year of university in private employment was negli-gible in 1993 but had become a very good investment in 1998.
“Experience,” which is actually years since completion of schooling, isstrongly positively correlated with wages, but at a decreasing rate, as ex-pected, and its effect shows no sign of changing from 1993 to 1998.
Table 3.11 shows a broader group of correlates of wages: being female, amember of a non-Chinese ethnic minority, having Chinese origins, workingfor a nonagricultural employer, working for a nongovernmental employer,and indicators of living in the two primary cities in Vietnam. The correlationof real wages with years of schooling is still strongly positive, though evenlower with the inclusion of other correlates, and it still has a statistically sig-nificant increase from 1993 to 1998. Experience has a stable, positive correla-tion with wages.
Women in Vietnam earn much less than men with the same observablecharacteristics, although the difference in earnings decreased between 1993and 1998. In 1993, wages for women were 31 percent less than for their malecounterparts, even after controlling for education and experience.12 The gapbetween men’s and women’s wages in Vietnam became smaller by 1998,when women’s wages were 17 percent smaller. The wage gap betweenmen and women halved between 1993 and 1998, a statistically significantchange.
Non-Chinese ethnic minorities do not show lower wages in 1993, butthey do show a 10 percent lower wage in 1998. Ethnic Chinese in Vietnamhad a 25 percent wage premium in 1993, but this all but disappeared by1998.
In both 1993 and 1998, nonagricultural employers paid higher wages,and in 1998, private employers paid a statistically significant higher wagethan state employers.
The regression in table 3.11 properly tests whether the two primarycities, Ho Chi Minh City and Hanoi, have significant wage premia, otherthings being equal. Residents of both cities earn much higher wages thanresidents of other regions with the same characteristics. Workers in Ho ChiMinh City earned a remarkable 80 percent higher wage than rural or smalland medium-size urban area residents with the same education, experience,and so on in 1998. Hanoi residents earned 47 percent higher wages in 1998than Vietnamese living outside the two largest cities. There is no sign thatthe wage premia of Ho Chi Minh City and Hanoi fell during the period of1993 to 1998.
64 Economic Growth, Poverty, and Household Welfare in Vietnam

It should be noted that only 18 percent and 22 percent of the variation ofwages in 1993 and 1998, respectively, were explained by the correlates intable 3.11 (as measured by the R2 statistics), so the largest part of wage vari-ation is due to other unidentified factors.
Table 3.12 shows the effect of correlates on wage levels in 1998 separatelyby seven regions. The regional differences are strong. The rates of return toschooling are especially low in the rural central region, in small urban areas,and in the rural south, where the rate of return is not significantly differentfrom zero. The rate of return to schooling in Hanoi and the rural north is morethan double the level in the three lowest regions, approaching a respectable8.5 percent in Hanoi and 6.9 percent in the surrounding rural north.
The disadvantage of being female is similar around the country, exceptin the rural north and the rural central region, where women come closer to
The Wage Labor Market and Inequality in Vietnam 65
Table 3.11. Wage Regressions: Broader Group Correlates
Difference,Independent variable 1993 1998 1998–93
Schooling (years) 0.019 0.035 0.016(3.27)*** (8.01)*** (2.19)**
Experience (years) 0.027 0.028 0.001(4.72)*** (6.04)*** (0.15)
Experience squared !0.001 !0.001 !0.000(4.71)*** (5.55)*** (0.29)
Female !0.370 !0.182 0.188(10.69)*** (6.83)*** (4.27)***
Non-Chinese ethnic minority 0.030 !0.107 !0.137(0.39) (2.05)** (1.58)
Chinese origins 0.224 0.005 !0.220(2.66)*** (0.07) (2.17)**
Nonagricultural employment 0.126 0.289 0.163(2.79)*** (6.42)*** (2.45)**
Private (nongovernmental) employer 0.001 0.082 0.081(0.01) (2.38)* (1.37)
Ho Chi Minh City 0.609 0.589 !0.020(11.19)*** (16.24)*** (0.32)
Hanoi 0.296 0.384 0.088(4.15)*** (6.58)*** (1.06)
Constant 7.353 7.530 0.177(71.91)*** (91.24)*** (1.24)
Observations 2,007 3,033R2 0.18 0.22
*Significant at 10 percent level.**Significant at 5 percent level.***Significant at 1 percent level.Note: Absolute value of t statistics in parentheses.Source: Author’s calculations from the 1993 and 1998 VLSSs.

Tabl
e 3.
12.
Wag
e R
egre
ssio
ns, b
y R
egio
n, 1
998
Ho
Chi
M
ediu
m
Smal
l R
ural
R
ural
R
ural
In
depe
nden
t var
iabl
esM
inh
City
Han
oi
urba
nur
ban
nort
hce
ntra
lso
uth
Scho
olin
g (y
ears
)0.
054
0.08
50.
045
0.03
20.
069
0.02
70.
015
(6.1
1)**
*(4
.20)
***
(3.8
6)**
*(2
.44)
**(4
.63)
***
(2.5
4)**
(1.5
9)Ex
peri
ence
(yea
rs)
0.01
90.
029
0.02
20.
047
0.02
60.
020
0.03
5(1
.76)
(1.5
8)(1
.79)
(3.1
5)**
*(2
.28)
**(1
.63)
(3.5
4)**
*Ex
peri
ence
squ
ared
!0.
000
!0.
001
!0.
000
!0.
001
!0.
001
!0.
000
!0.
001
(1.2
5)(1
.43)
(1.0
6)(2
.72)
***
(2.4
4)**
(1.4
3)(3
.90)
***
Fem
ale
!0.
241
!0.
284
!0.
204
!0.
196
!0.
134
!0.
066
!0.
249
(3.9
9)**
*(2
.40)
**(3
.19)
***
(2.8
4)**
*(1
.54)
(1.0
2)(4
.47)
***
Non
-Chi
nese
eth
nic
min
ority
!0.
345
1.56
10.
116
!0.
301
0.13
8!
0.06
7!
0.20
2(3
.36)
***
(15.
18)*
**(0
.51)
(1.1
6)(1
.17)
(0.7
1)(2
.25)
**N
onag
ricu
ltura
l em
ploy
men
t0.
245
1.21
80.
235
0.50
20.
896
0.30
00.
352
(0.8
7)(5
.50)
***
(1.7
4)(3
.02)
***
(4.7
0)**
*(3
.48)
***
(5.1
2)**
*Pr
ivat
e (n
ongo
vern
men
tal)
empl
oyer
0.01
20.
014
!0.
154
!0.
052
0.26
00.
406
0.05
7(0
.15)
(0.1
1)(1
.98)
**(0
.46)
(2.6
5)**
*(5
.07)
***
(0.7
8)C
onst
ant
8.09
36.
480
7.77
47.
205
6.31
27.
384
7.72
7(2
4.73
)***
(12.
30)*
**(3
2.66
)***
(25.
19)*
**(2
2.52
)***
(36.
55)*
**(5
1.21
)***
Obs
erva
tions
556
215
499
402
270
433
658
R2
0.13
0.19
0.13
0.12
0.23
0.15
0.16
**Si
gnifi
cant
at 5
per
cent
leve
l.**
*Sig
nific
ant a
t 1 p
erce
nt le
vel.
Not
e:R
obus
t tst
atis
tics
in p
aren
thes
es.
Sour
ce: A
utho
r’s
calc
ulat
ions
from
the
1993
and
199
8 V
LSSs
.
66

obtaining their male counterparts’ earnings. The disadvantage of being awoman is greatest in Hanoi, where average wages for women are 25 percentlower than wages for men with similar characteristics.
The disadvantage of being a non-Chinese ethnic minority varies widelyacross regions.13 Only in Ho Chi Minh City and the rural south did ethnic mi-norities have statistically significantly lower wages in 1998—29 percent lowerin Ho Chi Minh City and 18 percent lower in the rural south. In Hanoi, thewages of ethnic minorities were, on average, almost four times higher than thewages of Kinh and Chinese workers with the same observable characteristics.This may be due to a small sample effect, because this reflects just 16 personsout of the small Hanoi sample of 215 wage earners, but the coefficient remainssignificant and of similar size in a quantile regression (not shown).
Nonagricultural employers paid higher wages in all the regions, but theeffect was most pronounced in Hanoi, the rural north, and small urban areas.Private (nongovernmental) employers clearly paid a wage premium only inthe rural north and the rural central region; this wage premium could be dueto the traditionally strong communist roots in these two regions, which couldmotivate workers to take government jobs despite low government wages.
The most notable results from exploring the determinants of wage levelsare very high wage premia in Hanoi and Ho Chi Minh City, and low returnsto schooling in Vietnam. With the same observable characteristics, workersin the two primary cities earned 50–80 percent higher wages than similarworkers elsewhere in the country. The high wages in the primary cities createdisparities with the countryside and drive up the cost of doing businessin two crucial markets. The wage disparities are underpinned by the systemof household registration, which prevents nonnatives from obtainingresidency permission in the primary cities except for those obtaining gov-ernment jobs or (with difficulty) those sponsored by their employer. Thedistorting impact of this system is suggested by anecdotal evidence that res-idency papers for Hanoi and Ho Chi Minh City improve young people’smarriageability and are even the basis for marriages of convenience.
The wage premia in the primary cities reported here are for registeredresidents. The VLSS data are based on household registration records, so un-fortunately they leave out unregistered migrants to the primary cities. Theunregistered migrants almost certainly find higher wages than they wouldhave in the countryside, or they would not have moved to the city, but theirwages are much lower than the wages of legal residents. The difficulty in ob-taining residency status in the primary cities has created a strong disparitybetween native residents and the class of illegal residents who are dispos-sessed by law. The unregistered migrants are not allowed to use governmentservices, including education and health care, nor can they obtain jobs inmost registered businesses.
The labor market rate of return to schooling in Vietnam is quite low,though it seems to have improved during the 1990s. Figure 3.2 shows thestrong correlation between estimated rates of return to schooling and averagelevel of schooling across regions. It points to a vicious cycle in regions with
The Wage Labor Market and Inequality in Vietnam 67

low education, because the rate of return is lowest in those parts of the coun-try with the lowest education levels, and the rate of return to education ishighest in the regions with highest education. This pattern may be explainedby poor education quality in regions with low educational attainment.
There is also a significant male-female wage gap, although it diminishedduring the 1990s.
Methods for Measuring Inequality
The previous sections explored the remarkable growth of Vietnamese wagesin the 1990s. The rest of the chapter will examine the impact of wage em-ployment on inequality in Vietnam, starting with a consideration of a num-ber of different measures of inequality that have desirable properties.
Inequality measures are chosen according to three criteria: (a) they satisfythe principle of transfers, (b) they are additively decomposable across sub-groups, and (c) they can handle negative income values.14 The principle oftransfers is the intuitively appealing requirement that a transfer of incomefrom a poorer to a richer person will increase the measure of inequality,as long as the transfer is not so large as to reverse the two persons’ relative po-sitions. All the commonly used inequality measures satisfy the principle oftransfers. In particular, the Gini coefficient, the generalized entropy measures,and the Atkinson inequality measures all adhere to the principle of transfers.
68 Economic Growth, Poverty, and Household Welfare in Vietnam
Estimated rate of return to schooling (percent)
Average years of schooling
9
8
7
6
5
4
3
2
1
05 131197
Rural south
Rural centralSmall urban
Medium urban
Ho Chi Minh City
Rural north
Hanoi
Figure 3.2. Levels of Schooling versus Labor Market Returns toSchooling by Region, 1998
Source: Author’s calculations from 1998 VLSS data.

The decomposition of inequality across a set of groups is useful forassessing how much of total inequality is due to differences within thegroups and how much is due to differences between the groups. Thesegroups can be any mutually exclusive subgrouping of the population, suchas region of residence or a household characteristic. Among inequality mea-sures with standard characteristics, only the generalized entropy measuresof inequality are additively decomposable, where the inequality within sub-groups and the inequality between subgroups sum to total inequality(Shorrocks 1984).
The decomposition of inequality across the source of income is a differ-ent problem because the sources are not mutually exclusive categories.Many households have income sources from more than one sector, for ex-ample, from farming and wage employment. The additive decomposition ofinequality across sources or uses of income is possible for any inequalityindex, and Shorrocks (1982) shows that there is only one rule for decompos-ing the inequality that satisfies a small number of reasonable properties.
Only two of the common inequality measures that satisfy the principle oftransfers are well defined for negative income levels, such as occur whenthere are year-on-year losses to farm and enterprise self-employment: theGini coefficient and one of the generalized entropy measures (I2, which ishalf the squared coefficient of variation).
This study uses four measures of inequality: the Gini coefficient andthree generalized entropy inequality measures (see appendix 3A for formaldefinitions of the inequality measures). The Gini coefficient is probably themost commonly used inequality measure, and it can be defined as a multi-ple of the covariance of individual income and the rank of individual in-come divided by average income. The Gini coefficient ranges between zero(perfect equality) and one (perfect inequality).
The generalized entropy measures of inequality are designated I" , wherethe more positive the " parameter, the more sensitive the index is to differ-ences at the top of the income distribution rather than the bottom. This chap-ter uses I0 (also known as the mean logarithmic deviation), I1 (also known asthe Theil index), and I2 (one-half the squared coefficient of variation).
For mutually exclusive groups of people, a generalized entropy incomeinequality index for the whole population decomposes into a weighted sumof the inequality indexes of the groups that make up the whole. Generalizedentropy indexes I" can be written as the sum I" = I"W + I"B of the totalwithin-group inequality I"W and between-group inequality I"B .15 The for-mulas for I"W and I"B are in appendix 3A.
The solution for decomposing the share of inequality from incomesources is simpler and more elegant (see equation 3.1). For any J sources ofincome, overall income inequality can be decomposed into the inequalitycontributed by each source:
(3.1) I =J
!
j=1
cov(yj , y)var(y)
I ,
The Wage Labor Market and Inequality in Vietnam 69

where cov(·) is the sample covariance and var(·) is the sample variance. Be-cause the inequality index I appears on both sides of the equation, it impliesthat the shares of inequality sum to one, and that they are independent ofany particular inequality index chosen. Our interest is the relative contribu-tion of each income source; thus, the actual inequality index can bedispensed with entirely. Note that if the covariance of the income from a par-ticular source is negatively correlated with total income, that income sourcemakes a negative contribution to total inequality. In particular, incomesources characteristic of poor households may contribute negatively toinequality—when these sources predominate in the household, total incomeis lower, resulting in a negative correlation.
Measurement Bias
Measurement error is a serious problem when studying inequality, evenmore serious than when studying other issues. Averages and growth rates ofaverages are typically unbiased in the presence of random measurementerror, due to the law of large numbers. Inequality measures, in contrast, aretypically biased and inconsistent in the presence of measurement error.Inequality is a measurement of variability, which is systematically increasedby errors. Positive and negative errors balance out in a sample average, butboth positive and negative errors add to the variance.
More important for this study than biases in the estimated level of in-equality is that different income sources are likely to suffer from very differ-ent levels of measurement error. Wage incomes are usually well known bythe survey respondents and others, making them easier to report accurately.Income from household farms and household enterprises is very difficultfor the household and the researcher to calculate correctly. If household self-employment income has systematically large measurement error, householdenterprises would appear (spuriously) to contribute a great deal to inequal-ity compared to wage employment, even when true income from bothsources has the same inequality.
Most inequality indexes depend on the variance of some transformationof income. The bias to inequality measures caused by measurement error iseasily seen in the case of the I2 inequality measure, which is the sample vari-ance of income divided by its sample mean squared. If measured income y"
iis assumed to be equal to actual income yi plus a mean zero measurementerror #i , with variance $ 2
# , then:
y"i = yi + #i.
Actual income yi has mean µ and variance $ 2 and is uncorrelated withthe measurement error. Average measured income y" is unbiased, E( y") =E( y) = µ, but the sample variance of measured income is biased,var(y") = var(y) + var(#) = $ 2 + $ 2
# . This causes inequality measures such
70 Economic Growth, Poverty, and Household Welfare in Vietnam

as I2 to be inconsistent when income is measured with error:
I "2 = var(y")
2y"2
plim I "2 = $ 2 + $ 2
#
2µ2 >$ 2
2µ2 = plim I2.
The larger the measurement error, the larger the bias in the inequalityindex.16
In a similar way, if the relative contribution to inequality is calculatedfrom different income sources using Shorrocks’ formula in equation 3.1, thecalculated contribution to inequality of income from sources that are poorlymeasured would be greater than the calculated contribution of incomesources measured more accurately, simply as a result of measurement error.This is shown formally in appendix 3B.
Measurement Error in Income
Measurement of household income is fraught with error, especially in low-income countries. Survey respondents may be reluctant to state their true in-comes; this is especially true where household farm and nonfarm enter-prises predominate, as in Vietnam, and households may not even knowtheir precise incomes. Calculating net revenue for household enterprises re-quires aggregating large numbers of recurrent input and labor costs andproduct sales, as well as addressing intractable practical and conceptualproblems. How does one account for home production, barter arrange-ments, and, especially, purchases of expensive capital equipment that willprovide services over many years? The VLSS makes a valiant effort to mea-sure all of these items across hundreds of categories of inputs and outputs,but the overall aggregation of household net revenues nonetheless in-evitably contains substantial errors. There are quite extreme positive andnegative outliers in farm and nonfarm household net revenues. There is nopractical way to ensure that answers to all these questions about compo-nents of household net revenues add up to a consistent inventory of costsand revenues (although it would be interesting to confront the survey re-spondents with the calculated net result to see if they felt it corresponded toreality!). Researchers using the calculated household net income often resortto more or less arbitrary ways of trimming the outliers, but this does noth-ing to solve the problem of statistical bias caused by measurement error.17
Researchers usually work around this problem by ignoring the incomedata and using instead the household expenditure data that are more accu-rately measured. In fact, household expenditure—that is, consumption—iswhat should be measured, because it is a direct measure of the material well-being attained by the household.
Household expenditure can be thought of as an estimate of “permanentincome” (Friedman 1957). Household consumption decisions and well-being
The Wage Labor Market and Inequality in Vietnam 71
depend on the household’s assessment of the smoothed expected incomerather than on the fluctuating annual transitory income. Because we careabout the inequality in household well-being rather than inequality of tran-sitory annual income, the measured annual income could be viewed as sub-ject to two kinds of measurement error. One is the mismeasurement ofannual income due to imperfect collection of household information; theother is the mismeasurement of permanent income using accurately mea-sured annual income data. In a context of highly variable annual incomefrom year to year, inequality in well-being using household income data willbe overestimated when households are able to smooth consumption.18
The simple solution of using household expenditure data rather thanincome data for inequality calculations does not work when studying incomesources. Expenditure does not tell us how wage employment, relative to othersources, contributes to household income. Using income data directly for in-vestigating the contribution of wages to inequality is especially problematic,because measurement errors are large for household self-employment earn-ings, but the errors in wage earnings data are probably much smaller. Surveyrespondents usually know precisely what they are paid, and they know thatpeople around them already have a good idea of what they earn, so they haveless reason to hide what they earn.19 This makes calculating the contribution toincome inequality of wage employment versus household production mis-leading. Even with exactly the same distribution of income from wage em-ployment as from household self-employment, measurement errors in theself-employment data would spuriously show that self-employment con-tributes much more to income inequality, giving the false impression that wageemployment is an equalizing force. In addition, household farm and nonfarmproduction revenues are inherently variable because of natural weather andmarket fluctuations, whereas wage payments are relatively stable. The distrib-ution of well-being is what is important here; thus, estimating the inequalitycontribution of household production income versus wage employmentincome, even with perfectly measured annual income data, would also spuri-ously show that household production was disequalizing, even when perma-nent income actually had the same inequality across the income sources.
Nevertheless, the contribution of wage employment versus householdproduction to the distribution of household income can be consistentlyestimated by combining the data on source-specific income with total ex-penditure data. Because the measurement errors for income are generallyuncorrelated with the measurement errors in expenditure, we can derive anestimator for which measurement errors cancel out as in averages and donot accumulate as in variances. The result is a consistent estimate of the con-tribution of income sources to inequality, as shown formally in appendix 3B.
Vietnamese Wage Inequality
The methods described in the previous section can be applied to look em-pirically at the relationship between wages and distribution in Vietnamusing the two VLSSs, but first we look at average wages by quintile.
72 Economic Growth, Poverty, and Household Welfare in Vietnam
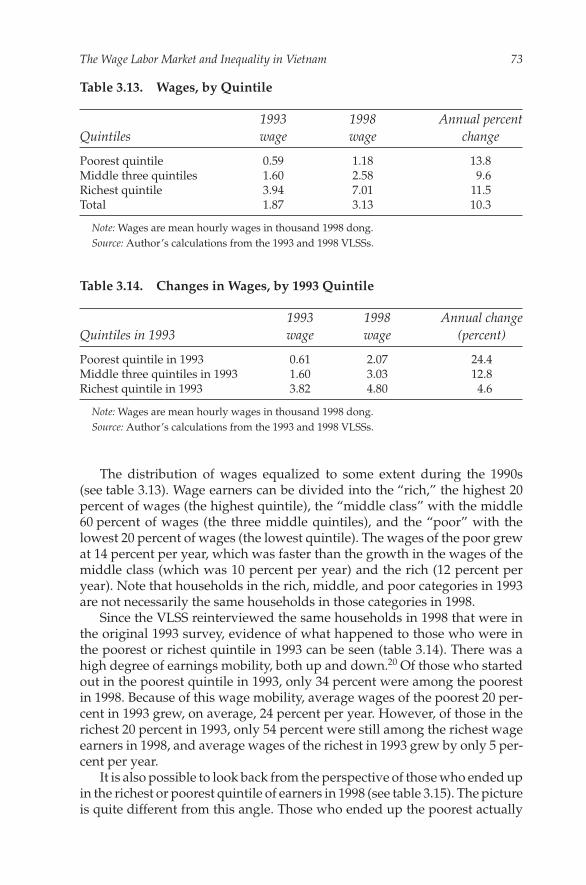
The distribution of wages equalized to some extent during the 1990s(see table 3.13). Wage earners can be divided into the “rich,” the highest 20percent of wages (the highest quintile), the “middle class” with the middle60 percent of wages (the three middle quintiles), and the “poor” with thelowest 20 percent of wages (the lowest quintile). The wages of the poor grewat 14 percent per year, which was faster than the growth in the wages of themiddle class (which was 10 percent per year) and the rich (12 percent peryear). Note that households in the rich, middle, and poor categories in 1993are not necessarily the same households in those categories in 1998.
Since the VLSS reinterviewed the same households in 1998 that were inthe original 1993 survey, evidence of what happened to those who were inthe poorest or richest quintile in 1993 can be seen (table 3.14). There was ahigh degree of earnings mobility, both up and down.20 Of those who startedout in the poorest quintile in 1993, only 34 percent were among the poorestin 1998. Because of this wage mobility, average wages of the poorest 20 per-cent in 1993 grew, on average, 24 percent per year. However, of those in therichest 20 percent in 1993, only 54 percent were still among the richest wageearners in 1998, and average wages of the richest in 1993 grew by only 5 per-cent per year.
It is also possible to look back from the perspective of those who ended upin the richest or poorest quintile of earners in 1998 (see table 3.15). The pictureis quite different from this angle. Those who ended up the poorest actually
The Wage Labor Market and Inequality in Vietnam 73
Table 3.13. Wages, by Quintile
1993 1998 Annual percentQuintiles wage wage change
Poorest quintile 0.59 1.18 13.8Middle three quintiles 1.60 2.58 9.6Richest quintile 3.94 7.01 11.5Total 1.87 3.13 10.3
Note: Wages are mean hourly wages in thousand 1998 dong.Source: Author’s calculations from the 1993 and 1998 VLSSs.
Table 3.14. Changes in Wages, by 1993 Quintile
1993 1998 Annual changeQuintiles in 1993 wage wage (percent)
Poorest quintile in 1993 0.61 2.07 24.4Middle three quintiles in 1993 1.60 3.03 12.8Richest quintile in 1993 3.82 4.80 4.6
Note: Wages are mean hourly wages in thousand 1998 dong.Source: Author’s calculations from the 1993 and 1998 VLSSs.

saw their average wage decline by 1 percent in the previous six years, whilethose who were the richest saw their wages grow by 16 percent per year. Howcan the prospective view of the richest and poorest in 1993 look so differentfrom the view in hindsight in 1998? The poor in 1993 were not the same groupas the poor in 1998. Most of the poorest wage earners in 1993 did not stay poor,and most of the poor in 1998 did not start out poor in 1993. Only 34 percent ofthose who were the poorest in 1998 had started out poor in 1993. This greatchurning within the labor market showed that those who held a job through-out this period had many opportunities to succeed and to fail. There was astrong tendency of regression to the mean—receiving especially low or espe-cially high wages was usually a transitory phenomenon.
The simple table of wages by lowest, middle, and highest quintiles intable 3.13 suggests that the distribution of wages became more equal overthe 1990s. This is confirmed by the summary measures of wage inequality intables 3.16 and 3.17. The statistics calculated are I0, I1, I2, and the Gini coeffi-cient, as defined in appendix 3A. Overall wage inequality in Vietnam indeedfell from 1993 to 1998 by all measures except I2, which most strongly weightshigh-wage earners.
The overall pattern of decreasing wage inequality contrasts sharply withwhat happened in the medium-size and large cities. Hanoi, Ho Chi MinhCity, and the second-tier medium-size urban centers had by far the lowestwage inequality in 1993. They are also the only regions of the country to seea rise in wage inequality over the 1990s. Wage inequality in Hanoi and HoChi Minh City rose quickly, while it stayed the same in medium-size urbanareas and fell sharply in the rest of the country. It is likely that this unusualpattern in wage inequality, similar to the wage premia in the two largestcities, is influenced by the residency permit restrictions that are enforcedthere. In fact, wage inequality was probably worse in 1998 than these statis-tics show: The VLSS sample does not properly cover illegal migrants intothe two largest cities, who lack residency permits, because the survey sam-ple was drawn from local residency records. The illegal migrants almostsurely have among the lowest wages in the large cities.
Another factor that could explain the low inequality in 1993 and the highinequality in 1998 for the medium-size and large cities is the prevalence ofgovernment employment there. In 1993, government employment waslikely a large part of the wage labor market, which tends to equalize wages,
74 Economic Growth, Poverty, and Household Welfare in Vietnam
Table 3.15. Changes in Wages, by 1998 Quintile
1993 1998 Annual percentQuintiles in 1998 wage wage change
Poorest quintile in 1998 1.25 1.20 !0.7Middle three quintiles in 1998 1.78 2.66 8.1Richest quintile in 1998 2.81 6.40 16.4
Note: Wages are mean hourly wages in thousand 1998 dong.Source: Author’s calculations from the 1993 and 1998 VLSSs.

because government wage levels tend to be similar across jobs. These citiesare also the locations that saw the greatest structural transformation duringthe 1990s; thus, government employment played a much smaller role in 1998.
The three generalized entropy inequality indexes—I0, I1, and I2—allowus to compare the within-region inequality versus the between-regioninequality in wage rates. Despite the wage premia in the two largest cities,between-region inequality accounted for only between 12 percent and15 percent of overall wage inequality in 1998, depending on the index(table 3.17). The balance of the inequality is due to variation within regions.Eliminating the cross-regional differences in wages would have someeffect on wage inequality, but most of it would remain.
The Wage Labor Market and Inequality in Vietnam 75
Table 3.16. Inequality Measures of 1993 Annual Wages, by Region
Regions I0 I1 I2 Gini
Ho Chi Minh City 0.204 0.178 0.221 0.312Hanoi 0.188 0.182 0.210 0.332Medium urban 0.239 0.236 0.318 0.365Small urban 0.351 0.306 0.388 0.420Rural north 0.310 0.261 0.301 0.393Rural central 0.242 0.231 0.276 0.372Rural south 0.322 0.263 0.303 0.394Total within group 0.280 0.238 0.304 n.a.Between groups 0.036 0.039 0.044 n.a.Overall 0.316 0.277 0.348 0.403
n.a. Not applicable.Note: The Gini coefficient cannot be consistently decomposed into total within-group and
between-group changes.Source: Author’s calculations from the 1993 VLSS.
Table 3.17. Inequality Measures of 1998 Annual Wages, by Region
Regions I0 I1 I2 Gini
Ho Chi Minh City 0.264 0.259 0.359 0.378Hanoi 0.243 0.232 0.311 0.355Medium urban 0.223 0.216 0.281 0.351Small urban 0.241 0.243 0.356 0.362Rural north 0.190 0.163 0.170 0.314Rural central 0.158 0.144 0.162 0.290Rural south 0.235 0.211 0.250 0.351Total within group 0.222 0.218 0.329 n.a.Between group 0.039 0.042 0.046 n.a.Overall 0.261 0.260 0.375 0.377
n.a. Not applicable.Source: Author’s calculations from the 1998 VLSS.

Wages and Income Inequality
If wage inequality fell between 1993 and 1998, what happened to the contri-bution of wages to overall income inequality? In this section, the impact ofwages on income inequality is measured, using both the simple, but biased,method in equation 3.1 and the consistent method derived in appendix 3B.
The inequality of household expenditure per person (as a measure of per-manent income) rose from 1993 to 1998 (table 3.18) at the same time that theinequality of wages was declining. Depending on the inequality measure, in-equality rose by 5 percent to 13 percent. Wages are the major source of incomefor only a minority of Vietnamese households (only 18 percent of householdsin 1998, accounting for 21 percent of household expenditure per person—seetable 3.19). Fifty-four percent of households depend on farming for theirmain income source, and another 18 percent rely on income from a house-hold enterprise for their main income. The remaining 10 percent get most oftheir income from other sources in a given year, primarily overseas remit-tances and other gifts, with some interest and leasing income.
Farming households have the lowest average per capita expenditure,only 60 percent of the income of predominantly wage employment house-holds. But the average expenditures of wage-earning households are not the
76 Economic Growth, Poverty, and Household Welfare in Vietnam
Table 3.18. Inequality of Household Expenditure Per Capita
Year I0 I1 I2 Gini
1993 0.188 0.211 0.308 0.3391998 0.207 0.235 0.347 0.357
Source: Author’s calculations from the 1998 VLSS.
Table 3.19. Per Capita Household Expenditure, Broken Down by MainIncome Source, 1998
Mean Ratio of income Share household source to overall of total
expenditure average household household Income Population per capita expenditure expenditure source share (dong) per capita per capita
Farming 0.541 2,157 0.722 0.391Household
enterprise 0.176 4,019 1.345 0.237Wage employment 0.179 3,570 1.195 0.214Other income
sources 0.103 4,574 1.531 0.158
Source: Author’s calculations from the 1998 VLSS.

highest. Households running their own businesses had an average perperson expenditure 13 percent higher than wage-earning households, andhouseholds that receive their main incomes from other sources do evenbetter, on average.
As discussed above, household income data suffer from substantial mea-surement errors, especially for farms and household enterprises, becauseincome must be netted out of the large number of costs and revenues. Mea-surement errors tend to be large, and less obvious to survey respondents,when income is the difference between much larger numbers, the costs andrevenues.
Tables 3.20 and 3.21 (in the columns labeled “No correction”) present thebiased calculation of the share of inequality attributed to each income sourceusing the formula in equation 3.1. The “Consistent estimates” column intables 3.20 and 3.21 presents the consistent calculation of inequality sharesusing the formula in appendix 3B.
There are large differences between the uncorrected estimates and theconsistent estimates of inequality shares. Farming’s contribution to inequal-ity is overestimated by the biased calculation, and the contribution of wage
The Wage Labor Market and Inequality in Vietnam 77
Table 3.20. Decomposition of Household Income Inequality, by Source, 1993
No correction Consistent estimates Share ofShare of inequality Share of inequality income
Income source (percent) (percent) (percent)
Farming 4.0 !5.2 36.3Household enterprise 40.2 40.4 25.0Wage employment 15.1 17.0 22.9Other income 40.6 47.9 15.8
Source: Author’s calculations from the 1993 VLSS.
Table 3.21. Decomposition of Household Income Inequality, by Source, 1998
No correction Consistent estimates Share of Share of inequality Share of inequality income
Income source (percent) (percent) (percent)
Farming 15.6 !3.4 39.0Household enterprise 39.3 38.9 24.1Wage employment 17.0 29.3 19.3Other income 28.1 35.2 17.6
Source: Author’s calculations from the 1998 VLSS.

employment and other income is underestimated. In both 1993 and 1998, thebiased estimate shows that farming contributes to inequality, while the con-sistent estimate shows that farm income actually reduces income inequality.In 1998, the differences are especially dramatic. The biased calculation givesthe impression that farming contributes about as much as wage employ-ment to total income inequality. In fact, the consistent estimates show thatwage employment contributes 33 percentage points more than farming in-come of total inequality. Whereas wage employment accounts for 29 percentof total income inequality in 1998, farming income reduces inequality by3 percent. The consistent estimates also show how important “otherincome”—largely overseas remittances—is to income inequality, contribut-ing almost one-half of all inequality in 1993, despite providing the smallestshare of income, at 16 percent. The income share of other income rose to18 percent in 1998, but its contribution to inequality fell to one-third of thetotal, presumably because remittances were being spread more equallyamong households in 1998.
The share of inequality due to wage employment increased from 26 per-cent in 1993 to 33 percent in 1998, at the same time that the inequality ofwages declined. This is possible because wage income was strongly nega-tively correlated with other income sources in 1993, but essentially uncorre-lated with other income sources in 1998.21 In other words, comparing 1998with 1993, high-wage earners are more likely to be in households with highincomes from other sources, such as farming and household businesses. Infact, all income sources have become both less negatively correlated withother sources and less variable from 1993 to 1998, but the negative correla-tion of wage income fell more than for the other income sources. This pat-tern suggests a diversification of economic activity within the householdthat one would expect from the period of rapid development that Vietnamhas experienced in the past decade.
Another way of quantifying the contribution of wage employment tohousehold inequality that proves useful for projecting future inequality is todivide households according to their primary income sources and decom-pose household expenditure inequality by type of household. Tables 3.22and 3.23 show that households whose income source is predominantlyfarming have expenditure much more equally distributed than nonfarmhouseholds. Inequality of household expenditure among other kinds ofnonfarm households is roughly similar, with the highest inequality amonghouseholds whose income source is predominantly wage employment.Wage employment households had the highest inequality among householdtypes in 1998, even though the previous analysis showed that wage em-ployment income is responsible for a smaller share of household inequalitythan enterprise income (table 3.21), because high-income wage employmenthouseholds are more likely to have extra income from nonwage sources.Households that earn income predominantly from wage employment hadhigher inequality in 1998 than in 1993 as a result of earned income fromother sources, not from high inequality of the wages themselves.
78 Economic Growth, Poverty, and Household Welfare in Vietnam

The consistent estimates of the contribution of each income source tototal income inequality show that wage employment contributes almostone-third of income equality—about on par with household enterprise in-come and other income, even though it contributes only about 20 percent oftotal income. Farm income, instead of being a substantial contributor to in-equality as the uncorrected estimates make it appear, actually reduceshousehold income inequality. The decomposition of household expenditureinequality by predominant income source also shows that predominantlywage employment households, household enterprise households, and otherincome households have similar levels of inequality, while farm householdsare substantially more equal.
Projections of Future Inequality
The previous section showed that predominantly wage income householdsare roughly similar to predominantly household enterprise and to “otherincome” households, both in terms of inequality and in terms of income
The Wage Labor Market and Inequality in Vietnam 79
Table 3.22. Inequality Measures of Household Expenditure, Per Capita,by Main Income Source, 1993
Main income source I0 I1 I2 Gini
Farming 0.115 0.124 0.161 0.263Household enterprise 0.186 0.199 0.267 0.336Wage employment 0.185 0.192 0.236 0.337Other income sources 0.269 0.284 0.401 0.401Within group 0.154 0.176 0.271 n.a.Between group 0.033 0.035 0.037 n.a.
Total 0.188 0.211 0.308 0.339
n.a. Not applicable.Source: Author’s calculations from the 1998 VLSS.
Table 3.23. Inequality Measures of Household Expenditure, Per Capita,by Main Income Source, 1998
Main income source I0 I1 I2 Gini
Farming 0.103 0.106 0.125 0.251Household enterprise 0.198 0.213 0.286 0.349Wage employment 0.250 0.267 0.375 0.390Other income sources 0.220 0.234 0.308 0.367Within group 0.158 0.186 0.297 n.a.Between group 0.048 0.048 0.049 n.a.
Total 0.207 0.235 0.347 0.357
n.a. Not applicable.Source: Author’s calculations from the 1998 VLSS.

levels. Farming households, however, are quite distinct. They have much lesswithin-sector inequality, and they have a much lower average income level.
One of the clearest historical patterns of economic development is theshrinking role of the agricultural sector as the economy grows, both as an em-ployer of labor and as a share of output. Farms now make up one-half of allhouseholds in Vietnam. Farm households are very different from other house-holds, they are a large part of the economy, and their relative number willdiminish as the economy grows. This means that inequality can be expectedto change in the near future. Inequality in Vietnam will rise over time as theproportion of equally distributed farming households falls in the economy.
Empirical predictions of how fast inequality will change can be made asthe Vietnamese economy develops by examining the relationship betweenthe decline of agriculture and economic development in other countriesaround the world. The relationship between income growth and the share oflabor in agriculture and the relationship between income growth and theratio of agricultural income to total income are both well-established inter-national patterns. By estimating these relationships from historical data—and assuming that inequality within the farming and nonfarming sectorsremains unchanged—the future course of inequality can be predicted as afunction of economic growth.
The predictions of future changes in inequality in this section have amechanical quality to them, but they result from a mechanism from whichVietnam will find it very difficult to escape. As long as agriculture growsmore slowly than the rest of the economy, overall income inequality willworsen unless inequality in the nonagricultural part of the economy de-clines sharply over time. Over the 1990s, in fact, inequality within house-holds that earned income predominantly from household enterprise andwage employment increased (tables 3.22 and 3.23). There is no reason to besanguine that inequality in nonagricultural households will decrease inthe near future sufficiently to overcome the worsening inequality due to thegradual transition out of agriculture.
The predictions are predicated on a continuation of Vietnam’s recenteconomic growth. If growth occurs more slowly, the worsening inequalitydue to the transition out of relatively equal agriculture will occur moreslowly than shown in these predictions.
Statistics from the previous section confirm that farm households havemore equally distributed income and lower income levels than nonfarmhouseholds, and that nonfarm households have similar income distribu-tions and levels across sectors. The generalized entropy indexes of inequal-ity in table 3.22 are one-half the level for farming than for other incomesources. Predominantly farming households have 54 percent of the averageincome of nonfarming households (table 3.19). The inequality indexes forhouseholds whose main income sources are household enterprise, wageemployment, or other income sources all have inequality indexes within 8percent of each other (table 3.22) and average incomes within 30 percent ofeach other (table 3.19).
80 Economic Growth, Poverty, and Household Welfare in Vietnam

To estimate the relationship between income level (as measured by grossdomestic product [GDP] per person) and share of labor force in agriculture,and between income level and agricultural output relative to total output,cross-country time-series data are used.22 Figure 3.3 shows the cross-countryrelationship between GDP per capita and the share of labor force in agricul-ture. The data come from 111 countries with an average of 30 observationsper country. To emphasize the patterns over time, the data shown for eachcountry in figure 3.3 are actually points on country-specific log linear trendlines to highlight the relationship in each country. Only 4 percent of thecountries had positive income growth and an increasing share of the laborforce in agriculture. Of the 15 percent of countries with an upward slopingtrend to the share of labor in agriculture, 11 percent were countries withshrinking incomes, so the share of labor force in agriculture fell even thoughthe economy was getting poorer. This suggests that the share of agriculturefalls over time independently of income growth due to technical change.
The estimated relationship between the share of labor force and GDP percapita using cross-country data shows a strong decline in the share of agri-cultural labor as the income level rises (table 3.24, second column). Theregression includes country-specific constants and a time trend, whichshows a clear but small decline in the share of agricultural labor over time of0.5 percentage point per year. The simple regression is able to explain 73 per-cent of all the cross-country variation in the labor force share in agriculture.
The Wage Labor Market and Inequality in Vietnam 81
GDP per capita (1985 PPP$)
Share of labor force in agriculture (percent)
100
50
0
500 20,00010,0005,0002,0001,000
Figure 3.3. Agricultural Labor Force Compared with Income Level
Note: GDP = Gross domestic product. PPP = Purchasing power parity. Data pointsare country-specific least squares trend lines for 114 countries between 1960 and 1990.
Source: World Bank 2000b.

The ratio of agricultural income per person to average income per personis also strongly correlated with the level of income per person and time(table 3.24, third column). Agricultural incomes are lower relative to non-agricultural incomes at higher GDP per capita levels, but agricultural in-comes become more similar to nonagricultural incomes over time, probablyas a result of technical changes in agriculture. The net effect for a countrygrowing at the rate of Vietnam in the 1990s is a decrease in agricultural in-comes relative to nonagricultural incomes. The agriculture income–shareregression explains 21 percent of the cross-country variation.
The inequality projection is based on the assumption that the Vietnameseeconomy continues to grow at the rate at which it has for the previousdecade: GDP per capita grew 5.5 percent per year from 1988 to 1998. In otherwords, this is a projection of what would happen to income inequality if eco-nomic growth in Vietnam were to continue as it has in the recent past.
The inequality projections are shown in table 3.25. The first columnshows the actual figures for 1998, and the second and third columns showthe projections for 2003 and 2008, respectively. The projection of the propor-tion of labor in agriculture depends on the first regression estimates fromtable 3.24, and it shows a decline of 3.8 percent every five years. The projec-tion of future agricultural GDP per worker depends on the second regres-sion estimates in table 3.24, and this shows that agricultural GDP per workeras a fraction of overall GDP per capita declines by 3.4 percent every five years.
The within agriculture—and within nonagriculture—income inequali-ties are assumed to stay constant at the 1998 level and are measured by theI0 inequality index. The total within-inequality measure depends on the
82 Economic Growth, Poverty, and Household Welfare in Vietnam
Table 3.24. Agriculture, in Relation to Income, across Countries
Agricultural Agricultural output Independent variables labor sharea per capita ratiob
GDP per capita (log of 1996 PPP, US$) !0.056 !0.200(20.65)*** (26.33)***
Time (year 1960 = 1) !0.0045 0.0042(57.59)*** (20.48)***
Constant 9.87 !6.18(69.67)*** (16.41)***
Observations 3,399 2,926Number of countries 114 106R2 0.73 0.21
*** Significant at 1 percent level.Note: PPP = purchasing power parity. Absolute value of t statistics in parentheses. Both
regressions include country-specific constants.a. Agricultural labor share is the fraction of agricultural workers in the total labor force.b. Agricultural output per capita ratio is the ratio of agricultural value added per worker to
GDP per capita.Source: Author’s calculations from data described in the text.

proportion of households in agriculture (which is taken to be equal to theproportion of labor in agriculture). As the proportion of the labor force inagriculture declines going forth to 2003 and 2008, total within-inequality in-creases because agricultural households have lower inequality and theirshare of households is shrinking.
Between-inequality also increases because average agricultural andnonagricultural incomes are diverging. Taking the sum of the within and be-tween measures of inequality, total inequality increases by 4.9 percent from1998 to 2003, and 4.4 percent from 2003 to 2008. This compares with anactual increase to I0 of 9.6 percent from 1993 to 1998.
This projection shows with numbers that the secular decline in agricul-ture as the economy grows will increase inequality because of a shift in thecomposition of households, because Vietnamese agricultural households
The Wage Labor Market and Inequality in Vietnam 83
Table 3.25. Inequality Projections, 2003 and 2008
1998 2003 2008Indicator (actual) (projected) (projected)
GDP per capitaa 325 428 563GDP per capita
growthb (percent) 5.5 5.5 5.5Proportion of labor in
agriculturec (percent) 54.1 50.3 46.5Agricultural GDP per workerd 234 293 367Nonagricultural GDP
per workerd 432 564 734Inequality of agricultural
income (I0)e 0.103 0.103 0.103Inequality of nonagricultural
income (I0)e 0.223 0.223 0.223Total within inequality (I0) 0.158 0.163 0.167Inequality between agriculture
and nonagriculture (I0) 0.047 0.052 0.058Total income inequality (I0) 0.205 0.215 0.225Change in inequality (since
five years before) (percent) 9.6 4.9 4.4
a. For 1998, this is the purchasing power parity (PPP) gross national product (GNP) percapita estimate for Vietnam (World Bank 2000b). The 1998 level of GNP per capita is not usedin the projections.
b. The rate for Vietnam for 1988–98 is 5.5 percent real growth of GDP per capita (World Bank2000b).
c. The 1998 value was estimated by proportion of working-age individuals in predominantlyagricultural households in the 1998 VLSS (table 3.18).
d. The 1998 value was estimated from the ratio of average expenditures per person ofpredominantly agricultural and nonagricultural households (table 3.18).
e. All values are set to the 1998 value estimated from the VLSS (table 3.22).Source: Author’s calculations from data described in the text.

have much less inequality than nonagricultural households. The secondeffect captured in the projections is that the relative incomes of the averageagricultural household and the average nonagricultural household will con-tinue to diverge as the economy grows, causing the between-sector inequal-ity to grow. This second effect actually accounts for more than half of thechange in inequality in the projections, as well as more than half of the actualchange from 1993 to 1998.
The predicted future inequality increases for 1998 to 2008 are only half ofthe actual increase for 1993 to 1998. This is primarily because agricultural in-comes have fallen behind nonagricultural incomes more rapidly from 1993to 1998, compared with the change that had been predicted by the cross-country evidence. The regression estimates predict that the ratio of agricul-tural GDP per worker to overall GDP per capita will fall by 3.4 percent forthe five-year periods 1998–2003 and 2003–08. The actual fall in expendituresper person of predominantly agricultural households relative to the averageexpenditures per person for all households fell by 5.3 percent for 1993–98. Ifthe 1993–98 rate of decline in the ratio of agricultural incomes to total in-comes were to be extended to the future periods, projected total incomeinequality would increase by 8.9 percent from 1998 to 2003 and 8.4 percentfrom 2003 to 2008, which is quite similar to the 9.6 percent rise in inequalityfor 1993–98.
The projected rise in inequality is not inevitable if nonagriculturalincome distribution equalizes in the future. During the 1993–98 period,however, the earnings of both predominantly wage-earning households andnonagricultural enterprise households became less equal, although theearnings of predominantly “other income” households became more equal(tables 3.22 and 3.23). A sharp improvement in the equality of nonagricul-tural earnings would be surprising.
If the divergence of agricultural and nonagricultural incomes is slowerthan predicted in table 3.25, but income distribution within agriculture andnonagriculture remains unchanged, then income distribution will worsenmore slowly than predicted in table 3.25.
The rising inequality that looks likely for Vietnam is a consequence of thedeclining role of agriculture as the economy develops, and the unusually equaldistribution of incomes among Vietnamese farm households. In low-incomecountries with unequally distributed agriculture, economic development im-proves overall income distribution as the share of agriculture declines.
The increase in inequality due to the decline of agriculture can probablybe delayed only by deliberately slowing economic growth and higher in-comes in Vietnam. A way out of rising inequality (other than a sharp im-provement in the equality of nonagricultural incomes) would be the rapidgrowth of incomes within agriculture while the equality of income distribu-tion among agricultural households is preserved. Sustained growth in agri-cultural incomes on par with income growth in the rest of the economy is ahistorical anomaly. The unfortunate consequence of Vietnam’s escapingpoverty will most likely be some increase in inequality, because, historically,
84 Economic Growth, Poverty, and Household Welfare in Vietnam

sustained development has almost always meant a shrinking role for agri-culture. The inequality in the nonagricultural sector in Vietnam is not par-ticularly high by international standards, however, and, if unchanged, itprovides the upper limit for the effect of the declining share of agriculture oninequality.
Conclusion
The labor market in Vietnam saw very rapid change in the 1990s. Averagereal hourly wages grew by 10.5 percent per year between 1993 and 1998,faster than income per capita in the economy. At the same time, there was asubstantial increase in hours worked, especially in rural areas, and a gradualincrease in the share of the labor force in wage employment.
SOE employment showed a marked rise of 20 percent from 1993 to 1998 ata time when the government was planning to restructure state firms, whichare generally perceived to be overstaffed (Belser and Rama 2001). SOE em-ployees also fully shared in the rapid wage increases of the mid-1990s.
The rate of return to schooling is very low in Vietnam, although it in-creased from 2 percent in 1993 to 4–5 percent in 1998. The lowest rates of re-turn to schooling are in the regions with the lowest education levels, and thehighest rates of return are in the regions with the highest levels of schooling.Women face significant wage discrimination after controlling for theirschooling and work experience, but the estimated wage gap fell by half overthe period.
After controlling for worker characteristics, workers in Hanoi and HoChi Minh City receive a very large wage premium over the rest of the coun-try, with average wages 50–80 percent higher than the other regions in thecountry. The primary-city wage premium suggests that the residency permitrestrictions contribute to inequality between the two largest cities and therest of the country. Qualitative evidence also suggests that residency permitscontributed to a worsening of inequality within Ho Chi Minh City. Althoughhouseholds without residency permits are excluded from the VLSS sampledesign, participatory poverty assessment interviews indicate that poor, un-registered residents of Ho Chi Minh City perceived no improvement in theirstandard of living in the 1990s, unlike poor residents of other parts of thecountry (World Bank and Department for International Development 1999).This suggests that the residency permit requirement for formal sector jobshas kept all the benefits of rapidly rising wage levels from unregistered res-idents of Vietnam’s largest city. In China, higher wages due to restrictions onurban residency have been a source of the sharp rise in income inequalitybetween rural and urban areas (Yang 1999). Even though within-region in-come differences in China, as in Vietnam, are larger than differences acrossregions, Chinese rural-urban income disparities have been an importantsource of rural discontent.
Inequality of wages fell modestly in the 1990s despite the rapid growthof wages. However, households with high wage income were more likely to
The Wage Labor Market and Inequality in Vietnam 85

have high incomes from other sources, so in this sense, wage employmenthas contributed to inequality. Agricultural households, for instance, are lesslikely to be engaged in wage employment. This effect will diminish ashigher proportions of the population are engaged in wage employment.
A new method for consistent decomposition of inequality by incomesource shows that, contrary to the results of uncorrected methods, wage em-ployment contributes a roughly similar amount to overall income inequalityas other nonagricultural income sources (primarily household enterpriseand remittances). Agricultural income actually reduces overall income in-equality because inequality between agricultural households is much lowerthan inequality between nonagricultural households, and agricultural in-come has a low correlation with other income sources.
The much lower inequality and income level in agriculture allows us topredict future inequality change in Vietnam. A declining share of agricultureas the economy grows in Vietnam will raise income inequality unlesswithin-sector inequality in the nonagricultural sectors falls substantially.From 1993 to 1998, the within-sector nonagricultural income inequality rosesomewhat. If within-sector inequality does not change, the declining shareof agriculture will increase inequality by 5–10 percent each five years forthe next decade, after an increase of 9.4 percent from 1993 to 1998.
This rising inequality due to the shrinking share of agriculture will bedifficult to avoid without giving up economic growth and rapid poverty re-duction in Vietnam. Keeping a large proportion of the Vietnamese popula-tion on household farms would keep inequality from continuing to rise overtime, but it would also keep the majority of Vietnamese at very low incomesbecause there are not good prospects for substantial rises in farm self-employment income without a major movement of labor out of farming. Im-provement of off-farm employment was a particular priority of the poor ina recent participatory poverty assessment in Vietnam (World Bank andDepartment for International Development 1999), indicating that the poorthemselves would not be happy with efforts to keep them on the farm.
The most notable results of this overview of the Vietnamese labor marketin the 1990s are that Hanoi and Ho Chi Minh City have very large wagepremia; SOE employment rose substantially; labor market rates of return toeducation are very low, especially in the regions with the lowest educationlevels; and inequality will continue to rise modestly as a result of the com-positional shift of the economy away from agriculture.
Appendix 3A Inequality Measures
The Gini coefficient can be defined as a multiple of the covariance of indi-vidual income and the rank of individual income divided by averageincome (Pyatt, Chen, and Fei 1980):
G = 2 cov(y, r)Ny
86 Economic Growth, Poverty, and Household Welfare in Vietnam

where y is a vector of individual incomes, yi, r is a vector of the ranks ofindividuals i when the population is ordered by increasing income, cov(·)is the sample covariance, and y is average income.
The generalized entropy measures of inequality have the form (Sen 1997,p. 140):
I" = 1"(1 ! ")
1N
N!
i=1
"
1 !#
yi
y
$"%
, " #= 0, " #= 1
with limit cases
I1 = 1N
N!
i=1
yi
yln
#
yi
y
$
and
I0 = 1N
N!
i=1ln
#
yyi
$
.
The I2 index simplifies to
I2 = var(y)2y2
which is one-half the squared coefficient of variation.For mutually exclusive groups, the overall generalized entropy indexes
decompose into a weighted sum of the inequality indexes of the groups thatmake up the whole. Assume there are several groups k with population Nk,average group income yk , and within-group inequality index I"k . Thena generalized entropy index I" can be written as the sum I" = I"W + I"B ofthe total within-group inequality I"W and between-group inequality I"B(Shorrocks 1984).
I"W =!
k
Nk
N
#
yk
y
$"
I"k
is a weighted sum of the within-group indices. Between-group inequalityI"B has the form of I" with yk substituted for yi.
Appendix 3B Inconsistency of Inequality Shares in the Presenceof Income Measurement Error
For simplicity, take the case where income comes from only two possiblesources: wage employment (w) and self-employment (s). Self-employmentincome is observed with measurement error, and wages are observed with-out error (relaxed below). Total income for person i is yi = ywi + ysi , whereywi is wage income and ysi is income from self-employment. Observed
The Wage Labor Market and Inequality in Vietnam 87

income for person i is y"i = ywi + y"
si , where y"si is measured income from
self-employment. y"si = ysi + %i where %i is the measurement error. Actual in-
comes have a constant mean and variance and may be correlated acrosssource:
E(ywi ) = µw; E(ysi ) = µs
$ 2(ywi ) = $ 2w; $ 2(ysi ) = $ 2
s
$ (ywi ysi ) = $ws .
Self-employment measurement error has a zero mean, constant variance,and is uncorrelated with incomes or across time:
E(%i ) = 0; $ 2(%i ) = $ 2%
$ (%i ysi ) = $ (%i ywi ) = 0
$ (%i%j ) = 0 $i #= j .
The estimated contribution of wage employment income to inequality rela-tive to self-employment income from Shorrocks’ equation 3.1 in the text is:
& " % cov(yw, y")var(y")
&
cov(y"s , y")
var(y")= cov(yw, y")
cov(y"s , y")
.
& " does not provide a consistent estimate of the ratio of income source con-tributions to inequality, & :
(3.B1) plim & " = plim#
cov(yw, y")cov(y"
s , y")
$
= $ 2w + $sw
$ 2s + $sw + $ 2
%
<$ 2
w + $sw
$ 2s + $sw
= plim#
cov(yw, y)cov(ys , y)
$
= plim &.
Wage Income Also Measured with Error
In real life, of course, wage income will also be measured with some error,though usually much less than the errors in imputed self-employmentincome. Wage income certainly has “errors” if the target is the inequality ofpermanent income, so that annual income would be viewed as an estimateof permanent income containing substantial error, even if annual incomeitself were measured perfectly accurately. This section shows that, as longas the variance of self-employment income is large enough relative to wageincome, then the same result as in equation 3.B1 still holds.
Let y"i = y"
wi + y"si , where y"
wi is measured income from wages.y"wi = ywi + 'i , where 'i is the measurement error. All other variables are the
88 Economic Growth, Poverty, and Household Welfare in Vietnam

same as above, and
E('i ) = 0; $ 2('i ) = $ 2'
$ ('i ysi ) = $ ('i ywi ) = 0
$ ('i'j ) = 0 $i #= j
$ (%i'i ) = 0.
Then the estimated contribution of wages relative to self-employment forincome inequality is biased:
plim& " = plim#
cov(y"w, y")
cov(y"s , y")
$
=$ 2
w + $sw + $ 2'
$ 2s + $sw + $ 2
%
#= $ 2w + $sw
$ 2s + $sw
= plim#
cov(yw, y)cov(ys , y)
$
= plim &.
plim & " < plim & & $ 2%
'
$ 2s + $sw
(
> $ 2'
'
$ 2w + $sw
(
so plim & " < plim & if $ 2% > $ 2
' and $ 2s ' $ 2
w . That is, wages will appear tomake a greater contribution to income inequality than they really do whenmeasurement error is worse for self-employment income than wage income,and actual self-employment income is more variable than wage income,both of which are likely to be true.
Consistent Estimator
If a second estimate of income is observed whose measurement error is un-correlated with the measurement error in y"
i , then the contribution of each in-come source to total inequality can be estimated consistently. That is,"j = cov(yj , y)
var(y) , and hence also the ratio of the contribution of two sources of in-come, & , can be estimated consistently. Household consumption expenditureper capita, ei, can be used as a second estimate of income. ei = yi + #i , where
E(#i ) = 0; $ 2(#i ) = $ 2#
$ (ei yi ) = 0
$ (#i#j ) = 0 $i #= j
$ ('i#i ) = $ (%i#i ) = 0.
The estimator of the contribution of wage income to total inequality usedhere is
"w = cov(y"w, e)
cov(y", e).
cov(y"w, e) = cov(yw + ', y + #)
= cov(yw, y) + cov(', y) + cov(yw, #) + cov(', #)
The Wage Labor Market and Inequality in Vietnam 89

cov(y", e) = cov(y + ' + % , y + #)= var(y) + cov(', y) + cov(% , y) + cov(y, #) .
Because ', % , and # are uncorrelated with y and yw , and ' and # are uncorre-lated with each other:
plim[cov(', y)] = $ (', y) = 0
plim[cov(yw, #)] = $ (yw, #) = 0
plim[cov(', #)] = $ (', #) = 0
plim[cov(% , y)] = $ (% , y) = 0
plim[cov(y, #)] = $ (y, #) = 0
so
plim "w = plim[cov(yw, y)]plim[var(y)]
= $ 2w + $sw
$ 2w + $ 2
s + 2$sw= plim "w .
For & = "w
"s, it follows that
plim & = $ 2w + $sw
$ 2s + $sw
= plim & .
So combining poorly measured, source-specific income data with totalhousehold expenditure allows us to obtain consistent estimates of the rela-tive contribution of different income sources to total inequality.
Notes1. Output per person is measured by real gross national product (GNP) per
capita in 1995 U.S. dollars (World Bank 2000b).2. The 1992–93 survey spanned a full year, starting in October 1992; the 1997–98
survey began in December 1997 and also lasted one year. For brevity’s sake, refer-ence is made to the surveys as the 1993 VLSS and 1998 VLSS, respectively. The sur-vey includes the information to make a detailed calculation of household income aswell as a full household expenditure survey. The 1993 survey sampled householdsproportionally to the population in each region, but the 1998 survey oversampledcertain areas, requiring the use of sampling weights to calculate representative sta-tistics. The VLSS is described in more detail in the appendix to chapter 1 of this vol-ume and in World Bank (1995) and (2000a).
3. Labor force participation used in table 3.1 refers to the seven days before the sur-vey interview. If people are included who were not working during the past week, butwho worked at some time during the year, total participation rises to 89 percent in 1998.
4. The 1993 VLSS asked a single question about whether the household mem-bers were self-employed for their main work in the past seven days. Whether theywere self-employed on the family farm or in the family business could be onlyinaccurately inferred from other questions. The 1998 VLSS asked separate questionsabout whether household members were self-employed on the farm or self-employed in a family business.
90 Economic Growth, Poverty, and Household Welfare in Vietnam

5. Household income per capita growth is calculated from the 1993 VLSS andthe 1998 VLSS data. Output per capita growth is measured by real GNP per capitagrowth in 1995 U.S. dollars (World Bank 2000b).
6. Wages here are hourly total compensation from the main job in the past sevendays (or from the main job in the past 12 months if there was no main job in the pastseven days). This includes the value of compensation in kind, as well as moneywages.
7. The urban population of Ho Chi Minh City was 4.4 million (5.6 percent of thepopulation) and of Hanoi, 1.6 million (2.1 percent of the population), out of a totalpopulation of Vietnam in 2000 of 77.9 million (World Bank 2000b).
8. Some of the apparent regional changes in table 3.7 may be due to small sam-ple sizes. In the worst case, there were only 20 skilled, private, nonagricultural wageobservations for Hanoi in 1993. Averages in all other tables come from sample sizesof more than 200 observations, with the exception of Hanoi in 1993, for wage-relatedtables with a sample size of 136.
9. Fifty-four weeks is more than a year, so the workers must have been workingmore than five days a week or more than eight hours a day. At the time of the twosurveys, the standard Vietnamese workweek was six days.
10. See Berndt (1991, chapter 5) for an accessible explanation of wage determi-nants and the regression specification used in this discussion.
11. About 86 percent of the population in Vietnam is ethnically Vietnamese(Kinh). Another 2 percent is Chinese, and the remaining 13 percent is spread across awide variety of groups found mostly in remote rural areas.
12. The estimated effect of a dummy variable in the wage regression is eb ! 1,where b is the coefficient estimate.
13. An indicator for Chinese ethnicity was not included in the regional wage re-gressions in table 3.12 because a number of regions had no Chinese in the surveysample.
14. Deaton (1997, pp. 134–40) provides a good, short explanation of inequalitymeasures.
15. The author thanks Paul Glewwe for pointing out that the weights used todecompose the generalized entropy measure I2 do not sum to one (unlike thedecomposition weights for I0 and I1), which makes the decomposition of I2 hard tointerpret.
16. This has interesting implications for cross-country inequality comparisons.Countries with income data that are measured less accurately (typically, poorercountries) will have a spuriously larger calculated inequality index.
17. This is certainly not a criticism of the collection of detailed household pro-duction data in the VLSS and similar surveys. As noted, the mean income estimatesare still unbiased. These data are very valuable for studying important questions ofhousehold production per se, and it is often possible to use the imprecise income datato calculate consistent estimates of income inequality, as has been done in this chapter.
18. Consumption smoothing is harder in Vietnam because financial institutionsare poorly developed and, over the years, have undermined their credibility with ar-bitrary behavior. However, this does not prevent consumption smoothing throughthe saving of commodities and durable goods, informal credit and debt arrange-ments within the village, and cash savings, which are often in the form of goldburied under the house.
19. Household rice harvests and certain other staple crop yields are probablycommon knowledge in rural Vietnam, to other villagers as well as to the village tax
The Wage Labor Market and Inequality in Vietnam 91

authorities, but input costs are not, and much of the profit in household farming inVietnam is in nonstaple agricultural production, which is difficult to observe. Non-farm household enterprises are also very difficult for outsiders to observe.
20. As shown in chapter 15 by Glewwe and Nguyen, measured mobility ishighly sensitive to errors, so part of the apparent high wage mobility could be due tomeasurement errors. Glewwe and Nguyen’s critique does not apply to the other in-equality measures used in this chapter. The general issue that income mismeasure-ment can bias inequality measures is addressed at length above.
21. The share of inequality of one income source compared with another de-pends on the ratio of the covariance of each income source with total income (see ap-pendix 3B). For the case of wage income, its share of inequality is greater when thecovariance of wage income with total income is greater. Since cov(yw, y) = var(yw)+ cov(yw, ys) = var(yw) + cov(yw, ys) where yw is wage income, y is total income,and ys is income from other sources, the share of wage income in inequality dependson both the inequality of wage income itself (var[yw]) and how correlated wage in-come is with other income sources. Because income is measured with error, the con-sistent estimates of inequality use total expenditure as an instrument for total incomein the covariance calculations.
22. The cross-country data for share of labor force in agriculture and the ratio ofagricultural value added to total output are from World Bank (2000b). The purchas-ing power parity GDP per capita data are from the Penn World Table 6.0 (2002).
Bibliography
Belser, Patrick, and Martín Rama. 2001. “State Ownership and LaborRedundancy: Estimates Based on Enterprise-Level Data from Viet-nam.” World Bank Working Paper 2599. Washington, D.C.
Berndt, Ernst R. 1991. The Practice of Econometrics, Classical and Contemporary.Reading, Mass.: Addison-Wesley.
Deaton, Angus. 1997. The Analysis of Household Surveys: A MicroeconomicApproach to Development Policy. Washington, D.C.: World Bank.
Friedman, Milton. 1957. Theory of the Consumption Function. Princeton, N.J.:Princeton University Press.
Penn World Table. 2002. “Data Appendix for a Space-Time System ofNational Accounts: Penn World Table 6.0 (PWT 6.0).” Accessed fromhttp://webhost.bridgew.edu/baten, May 30, 2002.
Psacharopoulos, George. 1985. “Returns to Education: A Further Interna-tional Update and Implications.” Journal of Human Resources 20(4):583–604.
Pyatt, Graham, Chau-Nan Chen, and John Fei. 1980. “The Distribution ofIncome by Factor Components.” Quarterly Journal of Economics 95(3):451–73.
Sen, Amartya Kumar. 1997. On Economic Inequality. Oxford: ClarendonPress.
Shorrocks, A. F. 1982. “Inequality Decomposition by Factor Components.”Econometrica 50(1): 193–212.
92 Economic Growth, Poverty, and Household Welfare in Vietnam

_____. 1984. “Inequality Decomposition by Population Subgroups.” Econo-metrica 52(6): 1369–86.
World Bank. 1995. “Vietnam Living Standards Survey: Basic Information Doc-ument.” Development Research Group. World Bank, Washington, D.C.Web site: www.worldbank.org/lsms/country/vn93/vn93bid.pdf.
_____. 2000a. “Vietnam Living Standards Survey (VLSS) 1997–98: BasicInformation.” Poverty and Human Resources Division, World Bank,Washington, D.C. Web site: www.worldbank.org/lsms/country/vn98/vn98bif.pdf.
_____. 2000b. World Development Indicators 2000 CD-ROM. Washington, D.C.:International Bank for Reconstruction and Development.
_____. 2002. Vietnam Development Report 2002. Washington, D.C.: World Bank.
World Bank and Department for International Development. 1999. Voices ofthe Poor: Synthesis of Participatory Poverty Assessments. Hanoi: WorldBank.
Yang, Dennis Tao. 1999. “Urban-Biased Policies and Rising Income Inequal-ity in China.” American Economic Review 89(2): 306–10.
The Wage Labor Market and Inequality in Vietnam 93