world bank document · cil to bharat coking coal limited ... this document has a restricted...
TRANSCRIPT

Document of
The World Bank
FOR OMCIAL USE ONLY
Repet No. P-3939-1-I
REPORT AND RECOHMENDATION
OF THE
PRESIDENT OF THE
INTERNATIONAL BALIK FOR RECONSTRUCTION AND DEVELOPMENT
TO THE
EXECUTIVE DIRECTORS
ON A
PROPOSED LOAN
IN ANY AMOUNT EQUIVALENT TO USt248 MILLION
TO INDIA
FOR THE
JHARIA COKING COAL PROJECT
February 5, 1985
lTab doeument h a resticted distnbot. ad MY be md by recpiet oly in the perfrnmance Oftaen .ulkil dues is .ognl mu no odewise be dicold wifth Wodd Bak atoriu i
Pub
lic D
iscl
osur
e A
utho
rized
Pub
lic D
iscl
osur
e A
utho
rized
Pub
lic D
iscl
osur
e A
utho
rized
Pub
lic D
iscl
osur
e A
utho
rized
Pub
lic D
iscl
osur
e A
utho
rized
Pub
lic D
iscl
osur
e A
utho
rized
Pub
lic D
iscl
osur
e A
utho
rized
Pub
lic D
iscl
osur
e A
utho
rized

CURRNC KODIVALENTS(As of February 4, 1985)
US$1.00 Rs 12.75Rs 1.00 US 0.78Rs 1 million US 78,000
The US Dollar/Rupee exchange rate is subject to change.Conversions in the Staff Appraisal Report were, exceptas otherwise noted, made at the rate of US$1 to Rsl2.
FISCAL YEAR
April 1 - March 31
ABBREVIATIONS
BCCL - Bharat Coking Coal LimitedCCL - Central Coalfields LimitedCIL - Coal India Li-itedCHPDI - Central Mine Planning and Design InstituteGOI - Government of IndiaICB - International Competitive BiddingIISCO - Indian Iron and Steel CompanyODA - Overseas Development AdministrationSAl!. - Steel Authority of India LimitedSCL - Singareni Collieries Limited
FOR OFFICAL USE ONLY
JHARIA COKING COAL PROJECT
LOAN AND PROJECT SUMNARY
Borrower: India, acting by its President.
Beneficiary: Coal India Limited (CIL).
Amount: USS248 million.
Terms: Repayment over 20 years, including five years- graceat the Ba-k-s standard variable interest rate.
On-lendina Terms: GOI to CIL for a period of 15 years, including fiveyears- grace, at an effective interest rate of notless than 13.25Z per annum. CIL to Bharat CokingCoal Limited (BCCL) for a period of 15 years,including five years of grace, at an effectiveinterest rate of not less than 13.25% per annum.
Proiect DescriDtion: The objective of the project is to increase the supplyof coking coal to the Indian steel sector. Itwill also improve the average quality of cokingcoal supplies and thus contribute to greaterefficiency in the use of indigenous energyresources. The project consists of the develop-ment of one open-pit mine at Jharia and one under-ground mine at Pootkie-Bulliary (with designcapacities of 2.5 and 3.0 million tons of raw coalper annum, respectively), two coal vasheries, andother associated facilities in the Jharia coal-field in the State of Bihar. The project willalso support institutional development in theareas of underground mine design and operatingpractices, shaft sinking and sand transportation,as well as project management. Furtbermore, itwill address the sectoral issue of coal qualityand facilitate continuation of a dialogue on coaltransportation and distribution, producer-consumerlinkages, and investment planning. The projectfaces minimal technical risks and a possiblefinancial risk is mitigated by GOI's commitment toa pricing policy which ensures the continuedviability of CIL.
| This document has a restricted distribution and may be used by recipients only in the performanceof their official dutis Its contents may not otherwise be disclosed without World Bank authorization-

Estimated Costs:
USS millionslocal Foreeian Total
Equipment and Spares 77.3 132.8 215.5Land and Civil Works 47.7 2.5 50.2Washery 76.2 31.8 108.0Engineering and Training 5.7 - 5.7Pre-operating Expenditure 9.0 0.6 9.6Technical Assistance - 2.0 2.0Duties and Taxes 94.5 - 94.5Base Cost 310.4 175.1 485.5
Physical Contingencies 24.2 10.4 34.6Price Escalation 100.2 58.1 158.3Working Capital 10.5 1.i 11.6
Total Project Cost 445.3 244.7 690.0
Interest During Construction 6.0 - 6.0Front-end Fee on IBRD Loan - -
Total Financing Required 451.3 244.7 696.0=====_
Financing Plan:
Equity
Government of India , 215.8 - 215.8CIL Cash Generation 132.2 - 13i.2Total Equity 348.0 - 348.0
Long-Term Debt
Government of India 85.8 - 85.8IBRD 17.5 230.5 248.0U.K. (ODA) - 14.2 14.2
Total Debt 103.3 244.7 348.0
Total Financing 451.3 244.7 696.0
-iii-
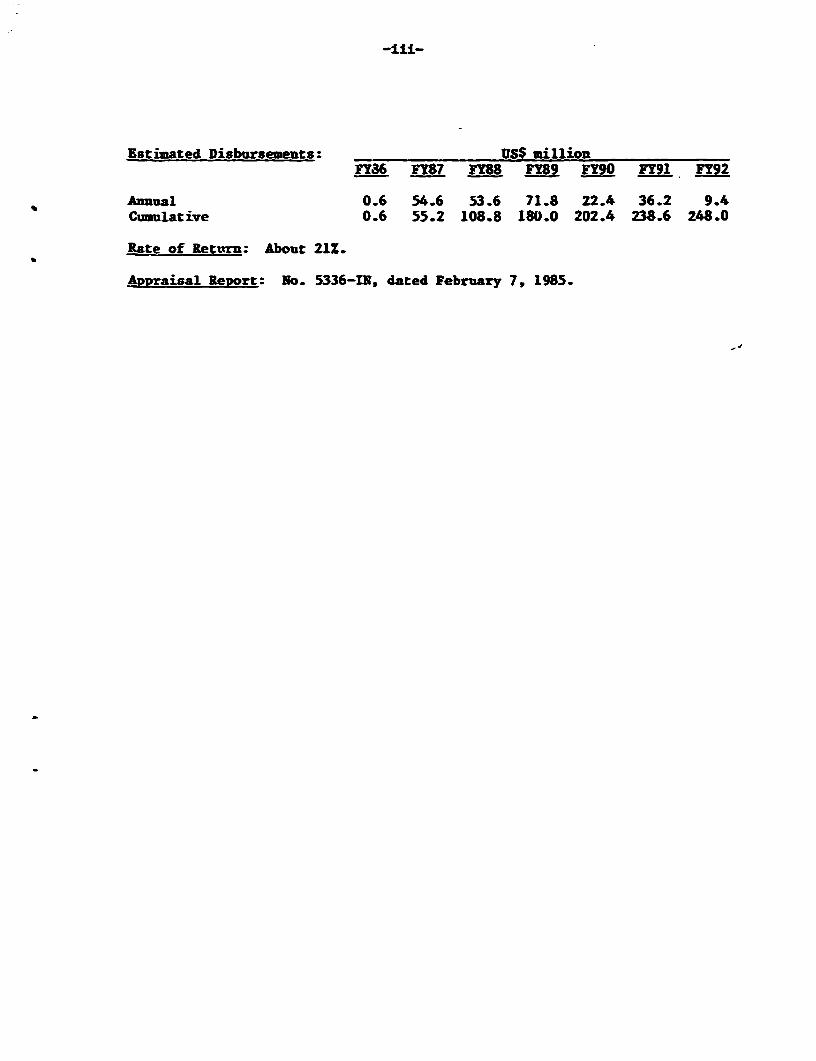
Estimated Disbursements: USS millionFY86 FY87 FY8s FY89 FY90 FY91 FY92
Annual 0.6 54.6 53.6 71.8 22.4 36.2 9.4Cumulative 0.6 55.2 108.8 180.0 202.4 238.6 248.0
Rate of Return: About 21%.
Appraisal Report: No. 5336-IN, dated February 7, 1985.
-~~~~~~~~~~~~~~~~~~~~~~~~~~~~~~~~~~~~~~~~~~~~~~~~~~~~~~~~~~~-
INTERNATIONAL BANR FOR RECONSTRUCTION AND DEVELOPMENT
REPORT AND RECOMMENDATION OF THE PRESIDENT TO THEEXECUTIVE DIRECTORS ON A PROPOSED LOAN TO INDIA
FOR THE JHARIA COKING COAL PROJECT
1. I submit the following report and recommendation for a proposed loanto India in an amount equivalent to US$248.0 million, to accelerate the expan-sion of coking coal production by developing a large scale open-pit and under-ground mines to feed steel plants. Amortization would be over 20 years,including five years of grace at the standard variable interest rate. TheGovernment of India (GOI) would onlend the proceeds of the proposed loan toCoal India Limited (CIL) for 15 years, including five years of grace at aneffective interest rate of not less than 13.25% per annum. CIL would makeavailable the proceeds of the proposed loan to Bharat Coking Coal (BCCL) for 15years, including five years of grace, at an effective interest rate of not lessthan 13.25Z per annum. GOI would bear the foreign exchange and interest raterisks.
PART I - THE ECONOMY 1!
2. An economic report, "Situation and Prospects of the Indian Economy -A Medium Term Perspective" (4962-IN, dated April 16, 1984), was distributedto the Executive Directors on April 23, 1984. Country data sheets are attachedas Annex I.
Background
3. India is a large and diverse country with a population of about 750 mil-lion (in mid-1984) and an annual per capita income of US$260. The economy isdominated by agriculture which employs more than two-thirds of the labor force.However, the land base is not sufficient to provide an adequate livelihood toeveryone engaged in agricultural activities, especially those who own little orno land. Growth of value-added in agriculture - 2.2% since 1950151 - hasbeen slower than growth of industrial value-added (5.3% per annum). As aresult, there has been a gradual decline in the share of agriculture in CDP (atfactor cost) from 52% in 1950/51 to about 33% in 1981/82, while the share ofindustry rose from 2O% to around 26%. But industrialization has not been rapidenough to absorb the growing labor force, or to bring about a rapid economictransformation, with significantly higher productivity and income levels. As aresult economic growth has been slow over the past three decades, averagingabout 3.6% per annum since 1950/51.
4. Nevertheless, there has been steady progress, with per capita income_ising by about 1.4% per year in the period 1950 to 1980. Despite the largepopulation base and its relatively rapid growth, India has been able toeliminate persistent dependence on foodgrain imports through significantimprovements in agricultural production. Savings and investment have increasedmarkedly since 1950/51: the gross national savings rate more than doubled from10.8% of GDP (at factor cost) to 22.7% in 1983/84, while the gross domesticinvestment rate rose from 12.5% of GDP to 24.82 in 1983/84. Foreign savings
1/ Parts I and II of the report are similar to Parts I and II of thePresident's Report for the Bombay Urban Development Project (No.P-3920-IN),dated January 7, 1984.

-2-
(balance of payments deficit on current account) have never financed a majorportion of domestic investment: a peak of about 20Z was reached during theearly 19609. Currently, foreign savings account for about 8X of investment.External assistance has been low both as a percentage of GDP and in per caritaterms, never rising above 3% of GDP and averaging below 1% for the past fiveyears. Net use of foreign savings has never risen above 3X of GDP, andpresently stands at 2.1Z.
5. Before the 1970s, India placed relatively less emphasis on exportpromotion and more on import substitution. The volume growth of exportsbetween 1950/51 and 1969/70 averaged only 2.2% per annum, while the volumegrowth of imports over the same period was 4.3%. In the early to mid-1970s,however, India's terms of trade, which had remained roughly constant duringthe 1960s, deteriorated sharply. In response, the Government introducedvarious policy measures designed to stimulate exports. As a result, the volumeof India-s exports grew on average about 7.3Z per annum for the 1970s as awhole, a performance which demonstrates that sustained rapid growth ispossible. While expanding world markets, particularly in the nearby MiddleEast, contributed to this growth, liberalized access to imported inputs andmore effective export incentives played a major role.
6. Moving into the second half of the 1970s, the Indian economy was buoyedby higher levels of investment and an expanding level of foodgrain output. Asa result, growth in real GDP and in agricultural and industrial value-addedsubstantially exceeded the historical 30-year trends (paragraph 3) averaging5.3Z, 3.3% and 8.1%, respectively, during the 1975/76 to 1978/79 period. In1979180, however, this momentum was broken when the worst drought in recentyears, combined with a doubling of international oil prices and domestic supplyshortages, led to a sharp fall in foodgrain production, a decline in GDP, andthe opening up of a relatively large trade deficit. Severe inflationary pres-sures also emerged after several years of virtual price stability. Thesesetbacks coincided with the preparation of the Sixth Five-Year Plan which laiddown a program of adjustment that aimed at improving the trade deficit, remov-ing infrastructural bottlenecks and ensuring price stability with an overallgrowth of the economy of 5.2% per annum.
Recent Trends
7. Despite the effects of two severe droughts in 1979/80 and 1982/83,India's economy in the early 1980s continued to grow at the faster pace of thesecond half of the 1970s. Between the two droughts (from 1979/80 to 1982/83),GDP growth averaged almost 5% per annum, while between the two recovery years(from 1980/81 to 1983/84), it was 4.5Z per annum - substantially higher thanIndia's long-term growth rate of 3.6%. Continued rapid economic growth hasresulted from a development strategy which includes higher investment levelsand liberalized policies on imports, industrial licensing, prices, and commer-cial borrowing. These policies, by easing constraints on the supply ofinfrastructure and basic commodities, were a determining factor in the improvedperformance of the economy and the industrial sector. This overall improvementin performance, combined with a more restrictive monetary policy in 1981182 and1982/83, resulted in a sharp decline in the rate of inflation. The growth rateof wholesale prices declined from over 18 in 1980/81 to only 2.6% in 1982/83,but rose to over 9% in 1983/84, mainly due to the effect of the 1982/83 droughton food prices. Further improvements in the policy environment will berequired to maintain these higher levels of economic growth and investment
-3-
without putting undue pressure on the balance of payments or reviving infla-tionary expectations.
8. Economic growth in the early 1980s has not been steady, mainly becauseof the effect of uneven rainfall on agricultural production during the period.In 1980/81 and 1981182, the economy substantially recovered from the 1979drought, with real GDP groving by 7.6% and 5.3%, respectively. Whileindustrial output expanded by 4% in 1980/81 and 8.6% in 1981/82, recovery wasparticularly robust in agriculture where normal weather helped output to riseby more than 15Z and 5.5%, respectively. The supply of power, coal, and railtransport, already improved in 1980/81, was further expanded in 1981/82,recording growth rates of about 10Z, 9.6Z and 12.5Z, respectively. This over-all improvement in the Indian economy was halted in 1982/83 by a severe droughtin mid-1982 which reduced agricultural production by 4Z, brought down the GDPgrovth rate to 1.8%, aud put further strains on the already difficult balanceof payments and domestic resource situation. The timely implementation ofvarious economic policies relating to foodgrain imports, procurement anddistribution, and the allocation of power to irrigation pumps mitigated theothervise very distressing effects of the poor monsoon. The economy recoveredin 1983/84, led by a robust agricultural sector - GDP grew by about 6.5Z to 7%with agricultural production growth in the 92-10: range and industrial growthof 4.5%. The major factors contributing to the good economic performanceduring 1983/84 were the excellent monsoon, combined with adequate agriculturalpolicies and programs, and satisfactory performance of the coal and transportsectors. The power sector, however, emerged again as a constraint on highergrowth, especially in industry.
9. Agricultural production rebounded strongly in 1983/84 in response tothe monsoon, improved use of inputs ard continued expansion of irrigation.Overall foodgrain production rose by 1OZ-12Z over the previous year, reachinga new record of 142-144 million tons, a substantial increase over the previouspeak of 133 million tons in 1981/82. Corrected for weather variations,foodgrain production continues to grow at a trend of 2.6Z per annum--sufficientto maintain a broad balance between supply and steadily increasing domesticdemand. Nonetheless, the balance remains delicate, and the need for foodgrainimports to maintain consumer supplies or adequate buffer stocks could arisefrom time to time. Thus, adequate management of foodgrain stocks and programsto expand irrigation, strengthen extension and encourage the efficient use ofother agricultural inputs continue to receive high priority.
10. Basic infrastructure services bad a mixed performance in 1983/84,partially because of sluggish demand from industry during the first half ofthe year but also due to a failure to maintain the productivity gains of1980-82. Electricity generation grew only by about 3.7% due to low reservoirwater levels during the first half of the year, delays in the comissioningof new capacity, and a deterioration of capacity utilization in thermal plants.As a result, power generation was about 11.5% below requirements and con-stituted a major bottleneck in the economy. Key industries which were adver-sely affected by power constraints included steel, fertilizers, cement, andcoal. To improxe performance in the power sector, the Government recentlyincreased incentives for higher labor and management productivity in thermalplants. Railway freight traffic, measured in ton-kms, grew by only 0.5% in1983/84, reflecting sluggisb demand. Coal production increased by about 6.5%in 1983/84 reaching 139 million tons. When combined witb stocks already avail-able this level of production was sufficient to meet the relatively slow demand

-4-
growth. Infrastructural constraints would have emerged much more sharply hadthe pace of industrial growth and demand been more rapid. It is thereforecritically important that Irlia maintain the pace of investment in these keysectors, mobilize sufficient resources to do so, and implement programs toenhance productivity.
11. The Indian economy has reverted from a situation of resource surplus inthe late 1970s to an aggregate resource deficit. The gap between gross invest-ment and national savings increased from negligible levels during the late1970s to an average equivalent to 2.1% of GDP in 1980-84. India's grossnational savings rate, which averaged 22.6Z of GDP in the last four years, ishigh by any standard, particularly considering India's low income and the largeproportion of its population below the poverty line. The scope for a substan-tial increase in the savings rate is therefore quite limited. If India is tomaintain investment at about 25Z of GDP, a major effort will be required toraise additional domestic resources particularly in the public sector. Futureincreases in savings will depend heavily upon the enhanced profitability ofpublic sector enterprises vhich would require better utilization of capacity,more efficient operations and adequate pricing policies. This would also allowa marginal decline in the use of foreign savings from the recent 2.1Z-2.3Z ofGDP to 1.5%-1.8X, to ensure a sustainable external debt service burdan.
12. India's external resource position has changed notably since the late1970s. The current account balance, which recorded surpluses trom 1976/77 to1978/79, reverted to deficits averaging US$3.5 billion and 2.1% of GDP during1980/81 to 1983/84. Several developments contributed to these relativelylarger current account deficits. First, the terms of trade deterioratedsharply in 1979/80 due to the second round of oil price increases and continuedto move against India during the first three years of the 1980s. Second, amore liberal import policy towards industrial inputs was pursued. Third, netinvisibles declined as travel receipts fell off, workers' remittances stagnated(reflecting slower development activity in the Middle East), and payment ofinterest on higher levels of foreign debt increased. Faced with severeinfrastructural constraints and a deterioration in its balance of payments,India initiated an adjustment program in 1980/81 designed to raise the growthrate from its historical level of 3.6% to 5.2% while adjusting the country'sexternal balance to the adverse price developments in the world markets. Themain elements of this strategy, which is being successfully implemented, areexport promotion, import substitution where economically justifiable, implemen-tation of a coherent energy policy designed to meet the energy needs of theeconomy while curbing the growth of oil imports, and continued movement towarda more liberal import policy aimed at providing producers with access to inputsfor higher capacity utilization, greater efficiency, improved technology andcapacity expansion.
13. A positive development in India's balance of payments is the reductionin the trade deficit from US$7.7 billion in 1980/81 to US$5.9 billion in1963/84 despite unfavorable world market conditions and import liberalization.Export volume growth and import substitution of oil and petroleum products,metals and fertilizers more than offset the substantial increase in "other"imports. These "other" imports consist mainly of industrial imports and capi-tal goods which historically have been in chronic short supply and which are ofcritical importance to capacity utilization, product quality, and plant modern-ization and expansion. A major factor in the decline of the trade deficit wasthe lover net import bill for petrcleum, whicb dropped from US$6.7 billion in

-5-
1980/81 to US$3.4 billion in 1983/84 in response to a successful oil develop-ment program that reduced import needs and allowed crude oil exports, whichtotalled about US$1.5 billion in 1983/84. These structural changes in thebalance of payments are to a significant degree the result of India's develop-ment and adjustment efforts over the past three years. It is expected that thebalance of payments will continue to be under strain for the next severalyears, since the adjustment strategy will continue to require high levels ofimports.
14. Even assuming a favorable export performance, India will need externalcapital flows to augment its own resources for the foreseeable future, giventhe low per capita income level in the country, the already high savings rate,and the structural adjustment process. Faced with a growing need for externalcapital inflows and stagnation in the availability of concessional assistance,India decided at the start of the Sixth Plan to increase borrowings from theInternational Monetary Fund (INF) and commercial banks to substantial levels.In the period covering the fiscal years 1981/82 to 1983/84, India drew SDR 3.9billion from the Extended Fund Facility of the IMF. In addition, India bor-rowed significant amounts on commercial terms from the Euro-dollar market andincreased the use of suppliers' and export credits. In the period 1980-84,India contracted commercial loans totalling over US$6,000 million andsuppliers' credits of over US$1,000 million. The bulk of this borrowing hasbeen used for specific development projects in the public and private sector(mostly for petroleum exploration and development, steel, power, aluminum andshipping). India's favorable debt service position and the nature of itsborrowings, for project-related purposes instead of direct balance of paymentssupport, enabled it to tap commercial capital markets at favorable spreads.This laiger commercial borrowing and transfer of funds under the arrangementwith the IMF has stemmed the use of foreign exchange reserves which had fallento less than four months of import coverage in 1981/82.
Development Prospects
15. The experience of recent years illustrates that India has the capacityto grow and develop at a more rapid pace. Although the industrial sector issmall compared to the size of the economy, it nevertheless is large in absoluteterms and has a highly diversified structure, capable of manufacturing a widevariety of consumer and capital goods. Basic infrastructure -- irrigation,railways, telecommunications, power, roads and ports -- is extensive comparedto many countries, although there is considerable need for additional capacityas well as improvement in the utilization of existing capacity. India also hasa wide range of institutions capable of fostering development and is well-endowed with human resources. Finally, India has an extensive natural resourcebase in terms of land, water, and minerals (primarily coal and ferrous ores,but also gas and oil). With good economic policies and reasonable access toforeign savings, India has the capability for managing these considerableresources to accelerate its long-term growth.
16. The Government is currently preparing the Seventh Plan which will laydown the development strategy for 1985/86-1989/90. This strategy is expectedto continue the emphasis of the Sixth Plan on agriculture, energy development,export promotion, domestic import substitution where economically justifiableand the removal of infrastructural bottlenecks. Overall Sixth Plan performancehas been encouraging, with aggregate real investment projected to be about 30%higher than in the period 1975-80--a creditable performance indeed. The Sixth
-6-
Plan expenditure targets, however, vill not be fulfilled as resource mobi-lization by the public sector will fall shor' of the financing requirements ofplanned public investment. Actual aggregate real investment is projected to beabout 7% below the original target for the period 1980-85, private investmentbeing 5% to 10% higher and public investment about 20X lower in real terms thanactually projected. In terms of meeting Plan expenditure targets, the perfor-mance of the Central Government is considerably better than that of the StateGovernments. The Central Government's Plan outlays are likely to reach about80% to 902 of the original Plan allocation in real terms, while the States'will probably achieve only about 50% of their targets, due principally toshortfalls in resource generation. Bottlenecks in key sectors such as power,transport and irrigation are likely to persist as a consequence of real invest-ment shortfalls relative to original Plan allocations.
17. Although Sixth Plan expenditure targets will not be met, India's capi-tal formation ratee have increased from 22.6% in 1975-80 to 24.7% of GDP in1980-84. Recent higher capital formation rates are encouraging for futureincome growth, but returns to investment have so far been relatively low. Muchof this phenomenon relates to India's stage of development, in which a largeand growing proportion of investment has been needed to build up basicinfrastructure services which have inherently high capital-output ratios.However, there is scope to reduce capital-output ratios through improvementsin efficiency. As discussed in greater detail in our recent economic reports,performance in the basic service sectors can be improved through better plan-ning and management, thus leading to higher productivity and capacity utiliza-tion throughout the economy. At the same time, programs to expand domesticcapacity are vital. In the case of tradeable commodities like coal, steel andcement, this is justified on the grounds of comparative advantage. For sectorssuch as irrigation, power and transportation, expansion of planned capacity inaccordance with the requirements of the rest of the economy will be vital forsustained growth.
18. Under the Sixtb Plan, India has an ambitious oil development programbacked by substantial financial commitment. Performance under the program hasbeen excellent with real investment and oil production levels running wellahead of Plan Targets. In 1981, and again in early 1983, resources forexploration and development were raised by successive price increases fordomestic crude and products. While the gap between domestic consumption ofpetroleum and production remains large, India's dependence on oil importsdropped from 63% of consumption in 1979/80 to about 41% in 1983/84 and isexpected to decrease to about 33% of consumption by 1984/85. The rapidlyexpanding level of exploration activity, combined with the possibilities foraccelerated offLake from known fields, offers much encouragement for India'slonger-term energy prospects. At the same time, the increases in domesticpetroleum prices have helped encourage conser-ation and slow demand growth.
19. India's development prospects over the next few years will hinge onthe extent to which the economy can be brought into both internal and externalbalance, while at the same time achieving more rapid growth than in the past.This will require the continuation of the current development strategy whichassigns high priority to export promotion, public finance discipline, improve-mene of economic efficiency, and investment in infrastructure, supported byadequate flows of external borrowing and aid. In the short term, a relativelylarge level of external borrowing, including an increased emphasis on commer-cial borrowing, will be necessary to cope with the balance of payments conse-
-7-
quences of such a growth strategy. However, an important element in providingIndia with the capacity to adjust flexibly will be adequate flows of conces-sional assistance since India is still a very poor country with a large ruralsector and enormous investment requirements for human development and basicinfrastructure. Although India is currently in a position to increase borrow-ing on commercial terms from the very low levels of the past, there are, ofcourse, limits beyond which India will choose to sacrifice growth objectivesrether than accept debt on unfavorable or unmanageable terms. Nevertheless,with a more open trade policy and expanded efforts to remove constraints on thegrowth of productive capacity, supported by adequate mobilization of bothforeign and domestic savings, India is demonstrating that it can sustain a rateof growth closer to 5.0X per annum than to the long-run trend of 3.6% perannum. If the rate of population growth can be brought to below 2.0X perannum, a 5.0% growth rate would mean E doubling of the trend rate of growth ofper capita income of 1.4% per annum. Success in these efforts would make asignificant difference to the prospects of easing poverty in India.
20. A large and growing population and severe poverty underline the needto accelerate India's development efforts. The 1981 Census indicated therewas no decline in the rate of population growth, which remained about 2.2X perannum in the 1970s despite a measurable decline in fertility rates. Thepopulation growth rate failed to decline in the past decade due to a reductionin the infant mortality rate and an increase in life expectancy, reflectinglarger availability of food and health services. While this is a welcomedevelopment, it implies a greater strain on the economy and re-emphasizes theneed for continuing efforts to strengthen the health and family planningprograms in a broad range of activities and services. These efforts are givenhigh priority in the Sixth Plan, which aims at a rise in the proportion ofprotected couples in the reproductive age group from its estimated 1979/80level of about 23% to over 35Z by 1984/85. The Government is reviewing itspopulation policy for the Seventh Plan, with indications of a determination toretain the emphasis on the implementation of family planning, health, educationand literacy programs aimed at reducing fertility rates.
21. Reduction of poverty remains the central goal of Indian economic andsocial policy. More than one-third of the world's poor live in India, and morethan 80% of the Indian poor belong to the rural households of landless laborersand small farmers. About 51% of the rural population and 40% of the urbanpopulation subsist below the poverty line. Significant reductions in povertywill depend primarily on an acceleration of economic growth, particularly inagriculture, combined with effective implementation of poverty alleviationprograms. India's poverty alleviation strategy appropriately recognizes thatproduction-oriented programs, which aim at accelerating the overall pace ofeconomic growth, and poverty alleviation programs, targetted at those leastable to participate in the general growth of the economy, can be mutuallyreinforcing rather than substituting for each other. Major poverty programsoperating on a nationwide basis at present include: the Minimum Needs Program(MNP), the Integrated Rural D_,velopment Program (IRDP), and the National RuralEmployment Program (NREP). The IRDP and NREP are targeted programs aimed atincreasing the incomes of the poor rapidly, either through the transfer ofproductive assets or direct employment. The MNP, aims at broadening the provi-sion of social infrastructure and basic services which enhance the human capi-tal of the poor and improve living standards. These programs represent avitally important commitment of the Government to address the needs of thepoorest. The scale of the poverty problem in India, combined with the inherent

-8-
difficulties in implementing poverty progrmas in any country, imply the needfor continued efforts to enhance the effectiveness of these programs.
PART II - BANK GROUP OPERATIONS IN INDIA
22. Since 1949, the Bank Group has made 82 loans and 165 developmentcredits to India totalling US$6,526 million and US$12,268 million (both netof cancellation), respectively. Of these amounts, US$1,524 million has beenrepaid, and USS6,207 million was still undisbursed as of September, 30, 1984.Bank Group disbursements to India in the current fiscal year throughSeptember 30, 1984 totalled USS171 million, representing a decrease of about40 percent over the same period last year. Annex II contains a summary state-ment of disbursements as of September 30, 1984.
23. Since 1959, ItFC has made 29 commitments in India totalling US$223million, of which USS34 million has been repaid, US$56 million sold andUS$34 million cancelled. Of the balance of US$98 million, US$91 million repre-sents loans and US$7 million equity. A sumary statement of IFC disbursementsas of September 30, 1984, is also included in Annex II (page 4).
24. The thrust of Bank Group assistance to India has been consistent withthe country-s development objectives in its support of agriculture, energy andinfrastructure. Of particular importance have been investments in irrigation,extension and on-farm development designed to increase agriculturalproductivity, and efforts to improve the availability of basic agriculturalinputs to farmers through credit, fertilizer, marketing, storage, and seedprojects. Major elements of the lending program have also been directed athelping to meet the energy needs of the economy while curbing the growth of oilimports, and to ease the infrastructu-re bottlenecks which have hamperedeconomic growth in India, particularly through power generation anddistribution, and railways and telecommunications projects. The Bank Grcup hasalso provided financing fcr a broad range of medium- and small-scale industrialenterprises, primarily in the private sector, through its support of develop-ment finance institutions. Recognizing the importance of improving the abilityto satisfy the essential needs of urban and rural populations, the Bank Grouphas supported nutrition and family planning programs, a rural roads project, aswell as water supply and sewerage and other urban infrastructure projects.
25. This pattern of assistance remains highly relevant and consonant withGovernment priorities as reflected in the Sixth Plan. Continuation of theBank's Group current prior-.ties can be strongly justified on the basis of theapproach that is being taken by GOI in the preparation of the Seventh Plan.First, continued support of GOI's agricultural program is warranted. WhileIndia has made significant progress in agriculture, productivity growth willhave to be sustained to improve the balance between food demand and supply andto contribute to poverty alleviation and employment. Thus, we will continueour support to irrigation, fertilizer production and d:stribution, and agricul-tural extensioa and credit. Second, the review of performance under the SixthPlan confirms the high priority that should continue to be given to the expan-sion and more efficient use of basic infrastructure capacity and to thedevelopment of India's indigenous hydrocarbon resources. Accordingly, the Bankwill continue to support the development of the energy, transport and telecom-munications sectors to alleviate critical shortages which constrain output inboth agricultural and industrial sectors. Third, support of urban developmentand other GOI basic social services programs for the poor must also continue in
-9-
light of the grovth in population which, despite successes in lowering birthand death rates, still increases by about 16 million each year. Finally, themajor departure from ou_ previous st-ategr vii1 be a substantial increase inthe Bank's assistance to India-s industrial development substantially aimed atsupporting GOI-s efforts in promoting greater efficiency and faster developmentof the industrial sector.
26. The need for a substantial net transfer of external resources insupport of the development of India's economy has been a recurrent theme ofBank economic reports and of the discussions within the India Consortium.Thanks in part to the response of the aid comunity, Inlis successfullyadjusted to the changed world price situation of the mid-1970s. However, Indiacontinues to require a substantial level of foreign assistance both to offsetthe overall deterioration in the world trade environment, and to sustain therelatively higher investment and growth rates achieved during the rirst fouryears of the Sixth Plan. As in the past, Bank Group assistance for projects inIndia should aim to include the financing of local expenditures. India importsrelatively few capital goods because of the capacity and competitiveness of thedomestic capital goods industry. Consequently, the foreign exchange componenttends to be small in most projects. This is particularly the case in suchhigh-priority sectors as agriculture and irrigation.
27. India's poverty and needs are such that whenever possible, externalcapital requirements should be provided on concessional terms. Accordingly,the bulk of the Bank Group assistance to India in the past vas provided fromIDA. However, IDA lending to India is declining from a peak of US$1.6 billionin FY82, mostly due to funding constraints related to IDA. The amount of IDAfunds available to India is likely to remain small in relation to India's needsfor external support. Thus, this requirement for additional assistance willhave to be met, in part, through larger Bank lending. Given its developmentprospects and policies, India is judged creditworthy for Bank lending to sup-plement IDA assistance. A continuation of efforts already underway to achievegrowth in pro -ctive capacity, trade expansion, higher levels of savings.f-odgrains self-sufficiency and a reduction in the rate of population growthshould result in continued economic grovth and improvement in the balance ofpayments. Despite recent setbacks, India-s external payments position is stijimanageable. The ratio of India-s debt service to the level of its total cur-rent account was about 12.9% in 1983184. Orer the next several years thisratio is projected to rise to around 20% and remain around that level through1995/96. As of September 30, 1984, outstanding loans to India held by the Banktotalled US$5,176 million, of which US$2,713 million remain to be disbursed,leaving a net amount outstanding of US$2,463 million.
28. Of the external assistance received by India, the proportion con-tributed by the Bank Group has grown significantly. In 1969/70, the Bank Groupaccounted for 34% of total commitmeLts, 13% of gross disbursements, and 12% ofnet disbursements as compared with 622, 33% and 37Z, respectively, in 1983/84.On March 31, 1984, India's outstanding and disbursed external public debt wasestimated to be about US$26.9 billion, of which the Bank Group's share wasUS$9.6 billion or 36% (IDA-s US$7.8 billion and IBRD's US$1.8 billion). In1983/84, about 19.0Z of India-s total debt service payments were to the BankGrour.

-10-
PART III - THE COAL SECTOR
Background
29. Coal is the most important source of commercial energy in India.Total resources are estimated at 127 billion tons, of which about 80% arethermal coals used primarily for heat and steam generation. The remainingresources are coking coals which are used in the Indian steel industry.Although the quality of India's reserves of both thermal and coking coalsvaries wideLy, reserves ox better grades are limited and are in shortsupply. Coking coal reserves account for nearly half (12 billion tons) ofthe proven coal reserves, which total about 26 billion tons.
30. Coal production reached 139 million tons in 1983/84, of which79Z was thermal coal and the balance (29 million tons) coking coal.Production stagnated during the mid- to late- 1970s. For the last fiveyears, coal production has risen at an average amnual rate of nearly 7Z.This has been due to more effective management, particularly with respectto project implementation, as well as to improved power supplies. Mostimportant, the first larger-scale open-pit mines (2-10 million tons peryear) started production during this period, which helped increase thecontribution of open-pit mines from 35Z in 1979/80 to nearly 50% in recentmonths. The shorter construction period of open-pit mines (normally 4-6years) compared with underground mines (5-10 years) and their largercapacities have contributed to the expansion of the coal industry.
31. In 1975, India completed the nationalization of most of its coalmines and consolidated operations under a holding company, Coal IndiaLimited (CIL), which presently accounts for close to 90% of India's coalproduction. The other producers are Singareni Collieries Limited (SCL),which is owned by the Central Government and the Government of AndhraPradesh, and captive coking coal mines of the privately-owned Tata Ironand Steel Company and the Government-owned Indian Iron and Steel Company(IISCO). In addition, the Government-owned Neyveli Lignite CorporationLimited operates lignite mines in Tamil Nadu.
The Market for Coking Coal
32. Coal is a key commodity for the future economic and industrialgrowth of India. The industrial sector consumes about 48% of domesticproduction, of which the steel industry consumes 18%. Coal-fired powergeneration represents a further 42% of coal use in India. Total coalconsumption is projected to grow at 8.3% per annum, to about 220 milliontons ver year (tpy) by 1989/90. It is predicted that power sector demandfor coal will grow most rapidly, and that it will account for 50% of totalconsumption by that year. The share of industry will decline rlightly (to
-11-
about 44%), but steel industry consumption of coking coals will reachnearly 20Z of total consumption. The Government's investment strategycalls for most of the requirements to be met from increases in domesticcoal production, in particular from CIL. A review of the status ofpreparation and implementation of major projects in CIL's investmentprogram indicates that the production increase of about 70 million tpybetween 1983(84 and 1989/90 is feasible, providing CIL continues toimprove its implementation capabilities.
33. The demand for coking coal is determined by the production ofhot metal in the steel industry. In 1983/84, steel plants produced 9.1million tons of hot metal, and production is expected to increase to 14.7million tons in 1989/90. Before coking coal extracted from mines can beused by the the steel industry, however, it needs to be washed in order toreduce the ash content and to remove other impurities so that the steelmills will have a product of consistent and acceptable quality. Accordingto the projected production of hot metal, the total demand for washedcoking coal is expected to increase from the present level of 15.2 milliontpy to about 24.0 million tpy by 1989/90.
34. An adequate suppLy of steel is essential to the future develop-ment of many basic sectors in the economy such as construction,engineering, mining, manufacturing and transportation. Steel productionin India is provided by six integrated steel plants, five of which aregovernment-owned and operated, and by over 100 mini-mills. Throughoutmost of the 1970s, the Indian steel industry was able to supply the domes-tic market at internationally competitive prices and, with the exceptionof a few specific products, India was self-sufficient in steel production.Toward the end of the decade, however, the industry experienced a varietyof operating difficulties ccmpounded by bottlenecks in the supply ofcritical inputs, especially power and coking coal, and productionstagnated. In the 1980s, production difficulties persisted, with thesteel sector suffering losses and domestic steel consumption has exceededproduction so that today India is a net steel importer. With the objec-tive of placing the steel sector on a sound financial footing, prices ofmedium- and high-carbon steels and most special quality steel productswere decontrolled in 1983 and are now set by market forces. Indian pricesare substantially higher, at present, than international prices for moststeel products.
35. According to data on mine production and available washerycapacity, supplies of washed coking coals should now be more or less inline with overall demand. Some imbalances are projected, however, forcertain grades. While the supply of medium-coking coal would be ade-quateLy covered, shortfalls are expected for the other two categories,particularly for prime coking coal. Substitution between grades isLimited due to technical factors and imports of prime coking coal havebeen required for the past several years. Despite plans for the increasein domestic production of prime coking coal, imports will continue to berequired, and could eventually increase from about 0.5 million tons in1983/84 to 1-1.5 million tons by the late 1980s.

-12-
36. The Government of India (COI) is appropriately placing a highpriority on improving the average quality of both thermal and coking coaldelivered to consumers. In the case of coking coals, the steel plantshave faced a steady deterioration of the quality of prime coking coal, aswell as daily fluctuations. The principal problem is the increased ashcontent, which seriously affects the efficiency of blast furnaces in thesteel mills. Steel-making facilities have been designed to use coal withan average ash content of 17Z, and washeries have been designedaccordingly. Over time, the average ash content of the coal fed towasheries and of washed coal has increased. In 1983/84, washed prime-coking coal sent to steel plants had an average ash content of 22.5Z, withdaily fluctuations of 1-2%. The decline in the quaLity of coal is largelydue to the gradual deterioration of the resource base combined withdilution, due to the increased use of blasting and mechanical coal cuttingand inadequate quality control. As a result of studies recently conductedby GOI, several measures have been introduced to improve the quality ofprime-coking coal, including the elimination of substandard coals fed towasheries, repairs and improvements at the older washeries, and greateremphasis on the quality of coal delivered as a criterion of each minemanager's operating performance. The proposed project will contribute toan improvement in overall coal qualities by installing facilities whichwill supply coal with 17% ash content of uniform quality.
Coking Coal Prices and Pricing Policy
37. Coal prices are set by GOI on an administered basis. In the1970s, prices were allowed to lag behind costs, with the result that theindustry experienced large financial losses during that period. Over thepast five years, however, GOI has increased prices on four separateoccasions, so that overall price has increased 88Z. In 1982/83, GOI alsoauthorized CIL to introduce an internal retention price system wherebyinternal accounting prices established for each subsidiary take account ofcost differences between the subsidiaries due to geological conditions,location, and other factors outside the control of the subsidiary. Thischange was recommended in the India Coal Sector Report (No. 3601-IN). Asa resuLt of the most recent coal price revision (January 1984), prices areclose to economically efficient levels, in that on average, theyapproximate long-run marginal costs for thermal coals, and net-back importparity for coking coals. Another important aspect of the 1984 priceincrease was that the largest adjustments were made in the price of thehigher grades of coal so that the differentials between the grades of coalwould provide producers greater incentives to mine higher quality coalswhose prices would better reflect their value to the users.
38. GOI's approach is to set coal prices at the mine head so thatthey will provide a return of about OZ on net worth (assuming certainproduction, productivity, and cost-efficiency standards), so as to ensurethe maintenance of the financial viability of producers and lead to anadequate level of resource mobilization for future investment in thesector. The need for periodic revision of coal prices to reflect these

-13-
objoctives was agreed upon under the Dudhichua Coal Project. Coking c3alpricing is complicated, however, because the basic product that steelmills feed into coke ovens is washed coking coal rather than the raw coalproduced by the mines. Since November 1983, coking coal has been sold ona washed coal basis, with CIL being responsible for processirg coking coalfor the steel industry. CIL and the Steel Authority of India Limited(SAIL) introduced contracts for the sale of washed coking coal, which aremuch like contractual arrangements in other countries whereby a price forwashed coal is negotiated, and bonus and penalty clauses relating toquality are included in the contract. This pricing approach is consideredsatisfactory, since it means prices are close to net-back import parity,after adjustments have been made for quality differentials. Ex-washeryprices for coking coal with 20% ash content are Rs 560 per ton (US$46.7per ton), including sales taxes and levies, compared to US$50 per ton forcoals imported from Australia (10% ash) after adjustments for porthandling, inland freight and quality differentials.
Project Sponsors
39. The CIL group of companies was established in September 1975, asa holding company with five wholly-owned subsidiaries. CIL operatessemi-autonomously under the direction of an 11-member board of directors,which is headed by a chairman-cum-managing director appoinced by thePresident of India. In addition to setting general policies for itssubsidiaries and retaining authority over the typical managerial functionsof a holding company, CIL directly manages the financial resources of thegroup, overseeing the investment program and arranging for all Long-termfinancing. For these reasons, CIL was considered as the primarybeneficiary of the Bank loan for Dudhichua, and the same arrangement isbeing recommended for the proposed project.
40. The CIL group is a very large and complex organization. Sinceits inception, CIL has made progress in strengthening its managerialcapabilities, with the result that its operational efficiency has improvedand production has expanded significantly. CIL is now able to play amajor role in formulating development plans and in coordinating theimplementation of sectoral policies. Specific operational and managerialissues relating to budgetary and cost control systems, the operationalefficiency of open-pit mines, and project managemeztt organization andpractices were addressed under the Dudhichua Coal Project. The Dudhichuaproject, including the studies being conducted in connection with it, isproceeding satisfactorily.
41. Underground mining accounted for 51% of CIL production in1983184. CIL has begun a program to rationalize its undergroundproduction, the principal aim of which is co reorganize groups of smallmines into larger units and to introduce mechanization, both in coalextraction and transportation. This strategy is sound and is expected tohelp to reduce unit production costs, as well as increase production. Atpresent, 24 reorganization/mechanization projects are at different stagesof implementation throughout the CIL group, 9 of which are for coking coal
-14-
mines. These schemes emphasize the mechanization of operations.Underground production of the mechanized mines is expected to increase toabout 35% (from the present 5) in the early 1990s when these mechaniza-tion projects are fully operational. A technical assistance program wouldbe required to improve the design, management, and operating procedures ofthe highly mechanized underground mines. Such assistance would beprovided by consultants selected according to qualifications, experience,and under selection procedures satisfactory to the Bank (Section 2.03,Project Agreement).
42. Prior to 1980/81, CIL's financial position was weak. Financiallosses derived from a low level of coal prices ar1 an emphasis on increas-ing production without due regard to cost effectiveness. This trend wasreversed in 1981/82 and for the first time CIL achieved an acceptableincome level with adequate internal cash generation and long-term debtservice coverage. Its financial position improved further during 1982/83.In 1983/84, however, CIL showed a loss of Rs 2,464 million and the mainfinancial indicators deteriorated owing to the back-dating of a nationalwage and salary settlement associated with a new four-year collectivebargaining contract. The wage settlement was finalized in December 1983but back-dated to January 1983. A price increase averaging 25Z was madein January 1984. However, financing the back-t!ated wage award resulted ina loss for CIL which was financed by deLaying debt repayment to GOI. Thisresulted in a temporary fall in its debt service ratio. Indications arethat the current financial year (1984/85) envisages a return to a finan-cial position more in line with that of 1982/83.
43. Bharat Coking Coal Limited (BCCL) is the subsidiary of CIL thatwill execute and operate the Jharia Coking Coal Project. BCCL is theprincipal producer of coking coal in India, and at present accounts for52Z of the total coking coal production. It operates about 100 coal minesand 9 washeries. Underground mining accounts for two-thirds of BCCL'sproduction, which lead to relatively higher operating costs than for theother subsidiaries. Its average operating costs are 44% higher than CIL'saverage, whereas average revenues are only 20% above the group's average.Despite its relatively weak financial position, efforts to improveefficiency, together with the introduction of a retention pricing system,have had a beneficial effect so that BCCL is expected to generate a profitand improve its cash generation considerably during the zurrent year.
Development Strategy and Investment Plan
44. Coal is India's most abundant indigenous energy source andpresently provides over 50% of India's commercial energy consumption.GOI's energy plans emphasize the development of coal, as a fuel both forgenerating thermal power and for direct use by industrial and commercialconsumers. In the 1970s, when coal shortages were prevalent, GOI's mainpriorities were to increase production as quickly as possible with littleregard for efficiency, cost effectiveness, coal quality, or distributionalfactors. COI's strategy has evolved to emphasize an adequate supply ofsatisfactory-quality coal with economically efficient mining and transpor-

-15-
tation systems. Specifically, GOI's coal development strategy centers on(i) the development of large-scale, highly mechanized coal mines (open-pitand underground) to permit a rapid expansion of production; (ii) therehabilitation and mechanization of deep underground prime-coking coaloperations to increase supplies; (iii) improvements in the distributionof coal to consumers who are far from existing coalfields; and (iv) theintroduction of measures to improve the quality of coal delivered toconsumers.
45. Total investments in CIL activities during the period 1985/86 tot g1989/90 are currently estimated at Rs 60 billion (US$5 billion) in 1984/85
prices, of which about 20Z is estimated to be foreign exchange. The aboveprogram is about 40% higher in real terms than investment in the previousfive years and represents an increase in both the number and average sizeof projects, and in the development work required for each new large-scaleproject. The sector is considered to be making good progress towardestablishing the necessary organizational resources and capabilities toimplement the investment program. About 23% of expenditures will be usedto reconstruct and improve operations at existing mines, 39% will be fornew projects currently being implemented, 21Z for projects prepared andawaiting final approval before initiating construction, and 17% for non-mine projects, including washeries, sand transportation, and projectfeasibility work. A review of CIL's overall investment program indicatesthat with a few exceptions, the investment program is following a leastcost development path.
46. The investment program places strong emphasis on the identifica-tion and developi-ent of new coalfields as close to consumers as possible,in order to relieve the burden on the railways of transporting coal overlong distances. In particular, priority is being given to meet the needsof consumers in western and southern India through the exploration anddevelopment of new coalfields, and improvements in the coal transportationsystem and in producer-consumer linkages.
47. Although the program is predominantly for thermal coal projects,coking coal projects are also emphasized because prime-coking coal hasbeen in short supply for several years, since its production is much moredifficult to increase than is the production of lower grades. Most cokingcoal production comes from underground mines which range in size from 0.1million tpy to 0.5 million tpy and whose recovery has ranged from 25% to40% of reserves in-situ. These low recovery and productivity factorsconstrain prime-coking coal production in India, but CIL hopes to improvethe recovery and production of prime-coking coal through the JhariaReconstruction Program. One of the most promising measures is that theshallower areas will be mined by mechanized open-pit methods which shouldprovide 90% or more recovery of previously unmined areas, and will allowcoal to be recovered from old workings. In addition, small, unmechanizedunderground mines (generally 0.1 million tpy to 0.3 million tpyproduction) will be combined into larger single units wherever geologicalconditions permit. Such rehabilitation projects will provide forincreased productivity, higher output, and higher recoveries. The Jharia

-16-
Coking Coal project incorporates both approaches: the Block II complexuses mechanized open-pit mining technology and the Pootkee-Bulliary com-plex is a rehabilitation undertaking that employs longwall mechanizedmining techniques.
Role of the Bank in the Coal Sector
48. The main purpose of the Bank's involvement in the coal sector isto support the development of this sector so that it takes place effi-ciently from both a technical and economic standpoint, to ensure thatresource allocation is optimal, and rhat consumers wilL be able to obtainsufficient quantities of coal of adequate quality in a timely manner. Tothis end, the Bank has (a) established a policy dialogue to identify andaddress critical economic, sectoral, and institutional issues that mayimpede the satisfactory achievement of GOI's objectives; and (b) initiateda lending program for large-scale projects, the goal of which is to helpGOI improve its implementation and operational capabilities for highlymechanized, capital intensive mining projects. So far, the policydialogue and lending program have resulted in (a) agreement with GOIregarding a satisfactory approach to pricing that will lead to regularreviews of pricing levels to ensure that they remain economically-efficient and result in rising levels of resource mobilization for thesector; (b) the initiation of important sector studies aimed at improvingcoal transportation and distribution linkages; and (c) agreement with CILregarding various institutional and operational improvements and studies.These studies have been initiated under arrangements satisfactory to theBank.
49. The Bank's involvement in the coal sector originated with oneloan to IISCO for a coking coal project (US$35 million underLoan 290-P-IN, dated August 9, 1961), which financed equipment for variousexisting and new coal mines. Project execution took more than five years,which was two years longer than appraisal targets, owing to delays inobtaining import licenses and local funds. Since the loan closed wellbefore the implementation of evaluation procedures within the Bank, nocompletion or audit report was prepared. Bank Group activity in thesector resumed with a sector review in 1980, following which the CoalSector Report, No. 3601-IN, was issued in 1982. This comprehensive reviewaddressed selected issues pertaining to supply/demand prospects for coal,pricing, investment, and financing. Most importantly, ic facilitated thepursuit of a policy dialogue with COI with respect to energy pricing andresource mobilization through the preparation of the Country EconomicReport (No. 4395-IN, dated April 11, 1983). Specific measures regardingcoal pricing and coal transportation were included in the lending opera-tion for the Dudhichua Coal Project (No. P-3735-IN, dated February 27,1984).
50. GOI has requested Bank Group financing of projects at regularintervals to increase the production of both thermal and coking coals.The Jharia Coking Coal Project will be the second of these, and the GevraThermal Coal Expansion Project is under preparation. The lending stracegy
-17-
is expected to involve all CIL subsidiaries, with each operation address-ing appropriate policy-sectoral issues, such as CIL's manpower planning,its approach to selecting, preparing and implementing investmentdecisions, and ways of improving the operational efficiency of a largenumber of labor-intensive underground operations.
PART IV - THE PROJECT
51. The project was identified in July 1982. It was appraised bymissions visiting India in March and May 1984. The Staff Appraisal Report(No. 5336-IN, dated February 7, 1985) is being distributed to theExecutive Directors separately. Negotiatio"s took place in Washington,D.C. in January 1985. The Government of ltlia, CIL, and BCCL were repre-sented by a delegation coordinated by Mr. P. Singh, Director, Departmentof Economic Affairs, Ministry of Finance.
Project Objectives and Description
52. The proposed project supports the Government's overall develop-ment strategy for the coal sector, outlined in paragraph 44 above. Theproject comprises the development of one open-pit mine and one undergroundmine with design capacities of 2.5 and 3.0 mty of raw coal, respectively,two coal washeries, coal handling plants, and surface infrastructure,including railway spurs, workshops, warehouses, offices, and town sites.The total annual output of washed prime coking coal for the steel industrywill be 2.6 million tons when both mines are operating at full capacity.Both mining complexes form part of the master plan to restructure theJharia coalfield, which is the main source of prime coking coal for thesteel industry. The Open Cast Block II complex is the first of themedium- to large-scale open-pit mines to be developed as part of theJharia Reconstruction Plan and by 1989/90 will account for about 11% ofprime coking coal production in India. The Pootkee Bulliary complex willbe the largest underground mining operation to be implemented in India.Both mines will employ highly mechanized mining systems, for which Bankassistance will be provided, and should improve the overall operatingefficiency of BCCL. The project will also help to improve the overallquality of coking coal supplies to the steel industry by providing aproduct with significantly lower ash content (17%) than the currentaverage supply to the steel sector (20Z-21Z). Furthermore, the projectwill help to reduce the need for imported coking coal.
53. The open-pit mine of the Block II complex has been designed toproduce 2.5 million tons of raw coking coal a year with an ash content ofabout 30% and a 17-year life. Overburden will be blasted and removed bydraglines, assisted by trucks and shovels. After drilling and blasting,the coal will be loaded and hauled to a crusher station, from which theraw coal will be moved to the washery by a conveyor. Coal will bereleased shortly after the start of excavation, and full production shouldbe achieved in 1987/88. Coal will be processed at the Madhuband washery,which will have a matching capacity, and should yield 1.1 million tpy of

-18-
washed coal with 17% ash. Washed coal will be transported by the raiLwaysystem to che steel plants. Most of the output has been earmarked for theneighboring Bokaro steel works about 30 km away. Marketing will not poseany difficulties to BCCL.
54. The Pootkee-Bulliary underground mine is expected to produce3 million tpy of raw coking coal, and thus will be the largest mine of itskind in India. Production will be built up gradually, so that smallamounts of coal will be produced at the start of underground work in 1985and its fulL capacity will be reached in 1995. About 52Z of the coal willbe mined by fully mechanized, retreating longwall mining techniques, andthe balance by conventional retreating longwall techniques combined withstowing to prevent surface subsidence. Management of underground minesusing fully mechanized longwall technology needs strengthening and techni-cal assistance will be provided under the project to improve the planning,design and management of such mines (Section 2.14, Project Agreement).Stowing material (sand, gravel, crushed rock) is in short supply in theJharia coalfield and the medium- to long-term availability of sufficientquantities of material will depend on CIL undertaking appropriate invest-ments to provide the sand to the coalfield. Studies to examine alterna-tive transportation modes for the sand will be conducted by consultantsfinanced under the loan (Section 2.14, Project Agreement). Two new500-meters deep shafts for coal hoisting are presently under constructionwith Polish technical assistance. These shafts are part of an extensiveshaft-sinking program required for the reconstruction of the Jharia cokingfield. GOI will initiate, by June 30, 1986, a study to improve theorganization of shaft-sinking activities and to introduce more efficientequipment. The raw coal from the underground mine will be washed in aproposed new Pootkee washery also to be financed under the proposed Bankloan. The wrshery will be implemented by BCCL and totally integrated withthe mine's surface instalLations. The washery comprises a plant withfacilities for crushing and screening, heavy media separation, flotation,and dewatering. The capacity will be 3 million tpy of raw coal and theyield of clean coal with 17% ash content will be about 49%, or 1.47 mil-lion tpy clean coal.
55. Electric power for the project will be supplied from the DamodarValley Corporation (DVC) main grid substation. Power is in short supplyin the Jharia area itself. To alleviate possible power problems, BCCL ismaking arrangements with the Damodar Valley Corporation to supply power tothe project through a direct line which is presently under construction.In addition, a 210 MW station planned for the early 1990s will be used tomeet coal industry power requirements in the Eastern Region, including theJharia coalfields. BCCL would make satisfactory arrangements with theBihar Water Authority for water supplies to the project (Section 3.05,Project Agreement). About 5,000 dwellings and associated servicefacilities will be constructed for the work forces of both complexes, anddetailed schedules for construction are being prepared (Section 2.08,Project Agreement). BCCL will prepare detailed training plans for bothBlock II (Madhuband and Pootkee-Bulliary) staff by July 1, 1986, and
-19-
thereafter annual training reports to the Bank every July 1 addressing theprevious years' training results (Section 2.09 Project Agreement).
Environment and Safety
56. The planning of environmental protection measures to be under-taken will be the responsibility of BCCL and the Central Mine Planning andDesign Institute (CMPDI), and they will be based mainly on the Water(Prevention and Control Pollution) Act of 1974 and the Air (Prevention andControl of Pollution) Act of 1981. Both Acts have satisfactory coverageand prescribe measures and tolerance limits acceptable in the industry.In general, water and air pollution problems are not expected to besevere. Water and air quality will be monitored regularly and dust, amajor potential pollution hazard, will be controlled by ventilation andsuppression/extraction equipment. The land that will be affected by themining activities is characterized as forest land, although it is veryarid. Because only very small quantities of topsoil are present, soilconservation will be undertaken whenever feasible. Erosion control andprevention measures, such es the placing of rip rap, turfing, andrevegetation will be undertaken cn waste dumps and exposed slopes. Thiswill also help to reduce surface water runoff. CIL and BCCL wouLd design,construct, and operate the project in accordance with ecological andenvironmental standards satisfactory to the Bank (Section 2.07, ProjectAgreement).
57. Mine safety and related operational practices and designcriteria are laid down in the "Mines Act" of 1952 and the "Coal MinesRegulations" of 1956 supported by monthly circulars from the DirectorGeneral of Mine Safety, Ministry of Energy as well as Acts regulatinghuman health and mine rescue work. They are adequate. The responsibilityto follow safety regulations rests with the safety organizations in eachsubsidiary. The activities of each safety organization are coordinated bya Safety Board of CIL, which meets quarterly to review safety practicesand introduce corrective actions where necessary. Although the overallaccident rate in CIL greatly improved from 1973 to 1983 (fatality ratedown 44% and serious injuries down 63%) the rates in CIL and BCCL arerelatively high when compared with other major coal producing industrialcountries. This is mainly attributable to very labor intensive, multiseammining methods with a low degree of support from modern mechanical andelectrical systems in most underground mines. Further, the great numberof working places and large number of workers make safety supervision andmanagement cumbersome, particularly during periods of rapid expansions of
d mining activities. The project, which involves a high degree ofmechanization with modern equipment, has adequate safety conditions but,to further assist BCCL, the technical assistance to be provided in supportof improved operational efficiency will strongly emphasize safety aspectsfrom the standpoint of both design and management. In order to satisfythe Bank of the adequacy of safety measures and the incidence of occupa-tionaL diseases, BCCL would make available to the Bank for comments everysix months, beginning January 1986, statistics on mine-related accidentsand occupational diseases.
-20-
Project Execution and Implementation
58. The project components will be implemented by BCCL under t.edirection of Project General Managers for each component reporting to theProject Director of BCCL. Each Project General Manager is supported bymanagers responsible for (i) mining and general engineering; (ii) cost andscheduling control; (iii) administration; and (iv) a Deputy ProjectGeneral Manager, directly responsible for project implementation. Eachproject organization comprises about 200 positions which are fully staffedand mobilized. The Project General Manager for both project componentshave been appointed and both are considered adequately qualified andexperienced. BCCL will ensure that the organizational structure,staffing, powers and responsibilities of each Project Management Unit aresuch as are considered necessary for timely and efficient implementationof the project (Section 2.10, Project Agreement).
59. Each Project Management Unit will be directly responsible forall activities related to detailed engineering, the procurement of localgoods (excluding mining equipment) and services, equipment erection andcommissioning, construction, and mine development. Mining equipment andother imported items wilL be procured by the CIL Central ProcurementOrganization, in direct collaboration with the Project General Managers.These arrangements have already worked out well in the Dudhichua project.However, in order to minimize the impact of external factors, such asimport approvals and foreign exchange allocations, import licences andforeign exchange requirements will promptly be made available for importedgoods. Due to land acquisition difficulties, the Madhuband washery hasbeen relocated to nearby land that is presently in BCCL's possession. Atthe Block II mine site, land is currently available for carrying outmining operations up to 1989/90, and BCCL will take possession of thebalance of the land required for the rest of the mine life (i.e. until2001/2) before September 30, 1988 (Section 2.11, Project Agreement). Thisis considered realistic in the light of progress during the past eighteenmonths on land acquisition which has been closely monitored by the Bank.Although the CIL group has some experience in implementing large m4ningprojects, it stiLl needs to strengthen the procedures required for projectmonitoring and control. Accordingly, BCCL will prepare, by December 31,1985, a project implementation manuaL, each for Block II and forPootkee-Bulliary, will discuss them with the Bank, and adopt them byDecember 31, 1985 and March 31, 1986, respectively (Section 2.12, ProjectAgreement).
Project Cost and Financing
60. The total financing required for the Jharia Coking Coal Project,including physical contingencies, working capital, and interest duringconstruction, is estimated at US$696 million, of which about US$245 mil-lion is in foreign exchange and about US$95 million represents taxes andduties.

-21-
61. The capital cost estimates were prepared by the Central MinePlanning and Design Institute (CMPDI), on the basis of cost informationfrom recent orders for similar equipment and actual cost data for ongoingprojects. It was last reviewed in January 1985. The cost estimate atthis stage is considered to be relatively accurate, particularly in viewof the degree of design and specification necessary for mining equipment.For this reason, 5% over the base costs is provided for physical contin-gencies for mining equipment and 10% is provided for other cost items.Local costs are expected to increase by 8.5% between 1984/85 and 1990/91,and 6% per annum thereafter. Foreign costs are expected to increase by3.5% for 1984, 8.0% for 1985, 9.0% for 1986-88, 7.5% for 1989, and 6.0%for 1990 and thereafter.
62. In keeping with current Government pricing policy, the overallfinancing of project costs will be in the ratio of 50% debt and 50%equity. The proposed Bank loan of US$248 million will provide about 41%of the financing requirements, net of taxes and duties; an additionalUS$85.8 million equivalent wilL be provided by GOI in the form of long-term debt. COI's approach to cofinancing has been to link specificprojects with individual financing sources rather than have differentsources participate in each of several projects. Although in the case ofJharia the Bank will provide most of the foreign financing, the OverseasDevelopment Administration (ODA) of the United Kingdom will also providefor a dragline that is being procured in advance of the Bank loan. Withrespect to equity contributions, CIL would provide about US$132 millionout of its internally generated funds, and the balance of about US$216million would come from the Government.
63. The proposed loan will be made to GOI at the standard variableBank interest rate for a period of 20 years, including 5 years of grace.GOI would onlend project funds to CIL for a period of 15 years, including5 years of grace. The onlending rate will effectively be 13.25X perannum, the standard Government rate for lending to industrial and commer-cial enterprises in the public sector. GOI would bear the foreignexchange and interest rate risks. CIL will in turn make the funds avail-able to BCCL on the same terms and conditions as those on which GOI hasextended a loan to CIL. Domestic inflation is not expected to exceed 8.5%over the project period, so that the onlending rate is projected to bepositive in real terms during this time. The conclusion of a satisfactorySubsidiary Loan Agreement between GOI and CIL and a satisfactory financialarrangement between CIL and BCCL will be the conditions of effectivenessof the proposed Bank loan (Section 6.01, Loan Agreement).
Procurement and Disbursement
64. Equipment and construction services financed by the Bank will beprocured by international competitive bidding (ICB) in accordance withBank Guidelines. These goods and services consist mainly of mining equip-ment grouped in 56 packages, averaging US$4.4 million each. For bidevaluation under ICB, qualified local suppliers/manufacturers will receivea margin of preference of 15% or the applicable customs duty, whichever is

-22-
lower. Qualified local contractors would receive a margin of preferenceof 7 1/2Z in the evaluation of bids for civil works contracts for thePootkee-Bulliary washery. It is expeected that for those itu-ms to befinanced under the Bank loan, about US$31 million (about 12X of he Bankloan) will be for contracts awarded to local suppliers following ICB. Theprocurement arrangement proposed for the project is in Annex IV.
65. The Bank loan of US$248 million will be used to finance miningequipment (US$169.5 million), a washery (US$60.8 million), and technicalassistance (US$2.0 million). In addition, US$15.7 million will beunallocated. There will be no front-end fee. Loan proceeds will bedisbursed against lOOZ of foreign and 100% of (ex-factory) local expendi-tures for mining equipment, at 100% of foreign expenditures and 70Z oflocal expenditures on the washery, and 10OZ of expenditures on technicalassistance. Disbursements are expected to be completed by Harch 31, 1992when all Bank-financed items would have been physically delivered orcompleted. Projections for the project indicated that disbursements willbe somewhat slower than the profile for industrial projects in India, aswell as for similar projects in other countries, because of the longgestation period of the underground mine.
Financial Evaluation
66. The Jharia Coking Coal Project represents only about 5% of CIL'stotal investment program for the period 1984185 to 1992193. By 1992/93,when the project is expected to reach a production level of 2.4 milliontpy of washed coal, this will represent about 8% of CIL's total cokingcoal production for that year.
67. It is expected that GOI will continue to provide 50% of CIL'sinvestment needs through long-term debt, and the remaining investmentrequirements will be met from CIL internally generated resources(approximately 19%) and GOI equity contributions. By 1989/90, CIL'saverage production cost per ton of raw coal is projected to decreaseslightly (OZ) in real terms from its present level of Rs 188 per ton(US$15.7), owing to increases in labor productivity deriving from thecapital intensive nature of the investments. Coal prices are expected toincrease marginally in real terms (2%) during 1985186, and thereafterwould generally follow local inflation. This pattern is in line with theGovernment's coal pricing policy and should strengthen CIL's financialposition. By 1989/90, the internal generation by CIL of funds availablefor its investment program would rise from its current level of 1% to 30%after allowances are made for debt repayment and increases in workingcapital.
68. To ensure that the consolidated financial position of the CILgroup of companies remains sound, COI will maintain coal prices that willensure the financial viability of CIL and provide for the progressiveinternal mobilization of resources to cover an increasing proportion ofcapital expenditures in the sector (Section 4.01, Loan Agreement) and CILwould maintain the same financial covenants agreed under the Dudhichua
-23-
project: a debt qervice coverage ratio of at least 1.3, a long-termdebt-io-equity ratio not greater than 60:40, and a current ratio of atleast 1.2 (Section 4.02, Project Agreement). Annual audit reports for CILand BCCL will be submitted to the Bank within nina months of the close ofCIL's fiscal year and six months for BCCL's fiscal year (Section 4.02,Project Agreement).
_ 69. The financial rate of return (FRR) for the Jharia Coking CoalProject is estimated at 10%, a result of the long implementation period,particularly o' the underground mine. This is composed of a 12% FBR forthe Block II compLex and 9% for the Pootkee-Bulli.-y component. Thedifference is due to the higher operating costs and longer implementationperiod of the undergrour-d mine at Pootkee-Bulliary, which are not fullyoffset by the t3tter quality of its coal. A 10% fall in revenues willreduce the fi,aucial rate of return to about 7%.
Economic Analysis and Risks
70. The Jharia coalfield provides all the domestic prime-coking coalused by the stt. 1 industry, and '-nth components of the proposed projectform part of the master plan for the reconstruction of the coalfield.Block II was selected as the first medium- to large-scale open-pit opera-tion to be developed in Jharia because of its relatively favorable geo-mining conditions which will allow production to build up rapidly and helpto keep operating costs down. With regard to underground development, afirst group of five mines, which are presently at various stages ofimplementation, meet the least cost criteria. Pootkee-Bulliary ranks asthe lowest-cost option in a second group of five mines proposed for fur-ther development.
71. The economic rate of returr (ERR) for the project is 21.5%. TheBlock II and Pootkee-Bulli. ry components are expected to have an ERR of28% and 17%, respectively. Even under aaverse assumptions, the overallERR would remain at acci table levels of over 17%, and thePootkee-Bulliary romponent would be above 14%. It would take an increasein capital costs of 55%, or of operating costs of 63Z, on a decline inrevenues of 24% to reduce the ERR to 2%, the opportunity cost of capitalin India. The differences between tr.e economic and financial rates ofreturn result from the elimination of custom duties on imported equipment
E (current!. averaging 74% of CIF value) in the calculation of the ERR. Asubstantia portio of the economic rent of the project thus accrues tothe Government (through taxes), suppLiers, and to the work force (throughhigh wages compared to alternative cccupations) rather than to CIL.Switching values for key parameters are (a) capital costs increased by55%, (b) operating costs increased by 65%, and (c) revenues decreased by24%, indicating the soundness of the inves.ments being proposed.
72. The project faces minimal technical risks, since coal reservesare well established and mining plans and equipment selection are based onproven technologies now being used in other open-pit and underground minesoperated by CIL. With regard to coal pricing, there is some risk that
-24-
GOI's commitment to an appropriate pricing policy may not be implementedin a timely manner; such an occurrence could adversely affect the finan-cial position of both the project and CIL. However, the financial risk isconsidered acceptable in view of the Government's policy to ensure thecontinued financial viability of entities in VYe energy sector and themobilization of an adequate level of resources for coal investments fromwithin the sector.
PAERT V - LEGAL INSTRUMENTS AND AUTHORITY -
73. The draft Loan Agreement between India and the Bank, the draftProject Agreement between the Bank, CIL and BCCL, and the draft Report ofthe Committee provided for in Article III, Section 4(iii) of the Articlesof Agreement are being distributed to the Executive Directors separately.
74. Special conditions of the project are listed in Section III ofAnnex III. The signing of a Subsidiary Loan Agreement between GOI and CILand a Financial Arrangement between CIL and BCCL would be additionalconditions of loan effectiveness (Section 6.01, Loan Agreement).
75. I am satisfied that the proposed loan would comply with theArticles of Agreement of the Bank.
PART VI - RECOMMENDATION
74. I recommend that the Executive Directors approve the proposedloan.
A.W. ClausenPresident
February 5, 1985

Al= IPage 1 of 5
TA3LI 3%
tw1a SO- DEMS I3k r amHURT RUCE CUFS cmZD AVESnA ) I
Qm:~~~~C~S 3EE ESIL3'
~~~~~~~~~~~~~~~~~~~~wc Lw ISCM K= )AM cUmA SQ. no
IOThL 3237.4 328.4 3287.6176,X5 1730S 161..3
m Cwl CP M 4W.0 100.0 20 .0 273.4 91 1 _2
IMOM cainmow=1 In A(3110dm OU oF 01L F4URZUWE? 79.0 113x0 1510 27z.0 567.3
ADVL SVICSTF0U,LA7E=.HXD-1!AR (NTS_U30) -34349.0 54754.. 716965.0 -MSAX 103ULATIM CZ OF TOMl) 16.0 19.8 24.1 Zl.7 34.7
FOIILAIES LWAR 200 OULL) 99424 -
SThT1m3I tOFULMM (qLL 1707.2FOFIIAThL¶ -S0401 1.7 -
FM SP. eI 132.3 166.6 213.4 164.6 261_9PIM Sl. t. AdirLt LA% 2464. 307.5 337.1 3f5.5 1735-1
TOPMATXM AGE ISMRICE (:) C0-wLI 'IS 60.9 :2.7 39.3 35.6 39._
15-6 ns 54.5 54.2 57T6 56.8 57.S45 ASD Xa3E 4.6 xi 3.1 .3 3_3
POPM031nt CDOW' RAME CZ)TOTAL, t.4 23 _.2 1._ .3
MAS 2.5 33 3.9 4.1 4.3
C3CE 51t3 RAl-E (PFlt THO) 67.7 41.4 34.2 27.7 3.11xWrDIE UATH RATE (FM -. BS) 2318 17.8 12. l.: 9.5
GRSS EWDm Cr1O0 RAIE 2.9 Z. 2_2 1.8 2'.0
FairLy FI-Mx=AC ZaS. 6MKAL (-!.I=) 4.0 3732.0 4O . _U CZ OF WJUtEED _I_ l) ._ 11.7 23.0 __ 52 -
L'IM OF FOS 1R00. FmR CAPMI(1949-71-100) 93.o 102.0 lo1.0 llZ- 123.0
*t CAPITA SUPFF OFCALORES (Z aF wEOIpLUEESS) 94.0 9L0 86.0 97_7 114.4PR016 (C3DS PM DAY) 5.0 50.0 46.0 5b.3 57.0
OF 113CR ASRAL AWD PCLSE 17_r j 15.0 13.0 Ic 16.9 141.
OhriD CAES 1-) DfA:6H AE 26.2 20.7 11.0 9.3 7_2
LIrE EXPEC.. A. 31Tq (tEAS) 42.5 *7.5 54.6 60.0 60.6MANF.- W03? KAZIE (PER TOM) 165.0 136.0 94.0 am3. 66.3
ACCESS TO SaFE tA (POP)TOTAL , 17.0 33.0 /d 3Z.9 37.0tUnaS 60_8.0 a-L0 76 70.9 56.3
RoQAL __0 20 .0 'd 22.1 264.
ACSS T EZKETA DUISFtRL(t tF POPOLATIcmO
TOTAL 18.o 20.0 lo 1.t 41.313865. MO 350 3-.0 1. 72.8 47_*RURAL -- I 2. 0 64 33.3
PFCIATtIZO PE t RISZCI 4850.0 49o.0 3690.0 f1 3484.2 7769.40O?. pF STCSEZ 113505 10930. Lo 7420.0j 5M60 7T 6793_ 2460.4
POP. PER HOSPITAL BED
:AL z o2180.0 1650.0 1290.0 if 104.5 1044.2135- 370.0 Id 29830 451.2RA __ 1 10410.0 7d 5993.4 2596s
AIISSIORS PE HOSPr:TL SW _ _ -. 27.0
AVERAGE SIZE OF HODS1flTOTAL S.2 56 5.2 I*URBAN S.2 5. b.8 7.RURAL s.2 5.6 5_3 _,
AVERIE WO2 OF PEtS0I/E003
WOAL 2.6 2.3
t33l* 26 2.3AMAL Z6 2.3
ACESS Z ELECT C: OF kIMLIHCS)TOTAL __ _
RU __ _.
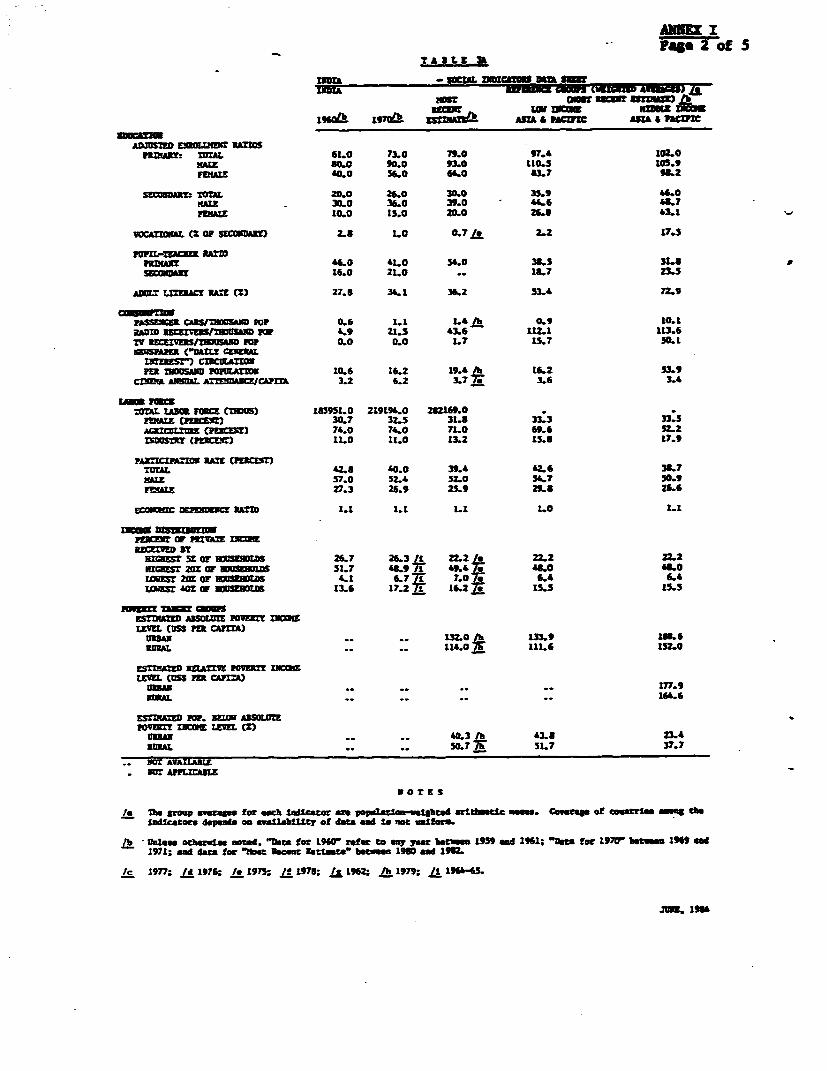
mu r- TASLE ?~~~~~~~~age 2of 5
_ 32 -SOIA INIAI 84T S
T836?- 33? TD U
"cm zwo am~~~~r o rAB UTU Z
1 & 17011 Zk SL4 AE S va:mc
?3:KAW: TOTAL 61.0 73.0 79.0 97.4 102.0PAZi 80.0 90.0 93.0 110.3 105.9FEN= £0.0 56.0 64.0 3. 982
SUcUDAXT: LTOL 20.0 2.0 30.0 35.9 4.0HAZI 30.0 36.0 39.0 - 4.6 £8.7FENAl 10.0 13.0 20.0 26. 43.1
VOCATInAL c: or SzCURUaW 2., 1.0 0.7 /9 2.2 17.3
POPI-?gACEM AIIRIAX £6.0 410 34.0 38.5 31.8
c84eT 16.0 21.0 .. 1.7 Ms
ADW;T LIUICI RATE (Z) 27.8 34.1 36.2 53.4 79
ASS CAWTOUSAND OP 0.6 1.1 L Ih 0.9 10.11A*0P1f0 3CLU WSA PU 4.9 2L5 43.6 1i1 1036TV CIf 5/2OUSAND to 0.0 0.0 1.7 13.7 50.1
wA1n%XLfan! EfALzr cmc .-EFSr) CXcnLa-
PE 1OSAI1 POPULATIE m1G6 16.2 19.4 16.2 SL3CDIa ARDAL AXnhEDirCA 3.2 6.2 3.7 3,6 3.4
TOTAL LA30 FORCE CT10S) l85951.0 219194.0 28219.0InhAZ CNT) 30.7 325 31.8 33.3 n.5AGRIC0LTWZ (fnCP ) 74.0 74.0 71.0 9.6 52.2Z5rThY (P IL) 11.0 11.0 13.2 15.S 17.9
PAITICIPX=O KALE CPECEIT-)TaTAL 42.6 40.0 39.4 £26 33.7NAi 357.0 52.4 32.0 57 50.9FInAE 27.3 26.9 25.9 29.8 26
Ehc UE ? RA0 1,1 1.1 1.1 1.0 1.1
D atmPERCO0 a ZVAw MCs=REczIED sr
R11ST 51 0r LDouS 26.7 2 6
L3 ft 22.2 A 22.2 2.2
--cT 20= or PUUbOM 31.7 £ 79 1 49.4 A48.0 8.0LORS= 20 or DRu1flS 4.1 6.7 7 7.0 7t 6.4 6.4LOUIS? 40Z0O OUSROLS 13.6 17.2RJI 16.2z7 X1S. 15.5
-r - SmES?TEDVM ASOLM r PEYCLEM (USS PU CA13)
UBAN .. .. 13.0 133.9 U36AL .. .. 114.0 1llL6 lS2.0
ETDIEATED 3ELATZ1 P0982? RCLET CUSS Pu CAPITA
Ur" .. .. .. .. 177.9ERURA ., ,, ,, ,. 164.6
ESThIATIM POP. 3r AS3O1=POVWn DEWIE LEVE CZ)
n .. . 0.3 lb £3.8 RURAL .. .. 50.m7 517 37.7Nor AVAIL _BLNOW APPLICAB
NoTES
la no S. mvYram for sech 1ndcmo A popoeltgn-aslbtud artt mtlc _ema. Cowatg of ctrlm e cbs- i -catot depends cm awalabtlLty of data and Is not u.Lfos.
lb - DUm otbacu noted. ca fer 1960L refe to my yea beuCom 1939 nd 1961; "ot. for 1970" bem.. 196 mi1971; and data !or "bat Recan 1.tionte bateau 1980 nd 192.
nc 1977; /d 1976; . 1975; ! 197B; k 1962; 1979; /I 196&-E.
JR. 19"4

ANNEX ITPage 3 of 5
_ea la _ m dm _ - *r-r_ ft. a _ msafU am a.aa al t_ _. am aaaaa _u amn ala _a *_a aa _ _ ta z amwalendaata at. atteaa! t_t_ ae, _m maaas a.eaal _tna daft.m _aw amei_
naaml tn <a_t .9tam !a_ *_a at. _'.n l- . _. mt__a a fat _0 _ata - a! ma _lts. amama_tta.-saan - l.. t t_ af amn._t. a> la..t _m r_.. _9 a .taaw _m _ _t. _a _nm alma.9daa ra - 09.. tm! .
ne . at. ct _ f l_ f_t_ _ _ t_ _a at a. * am a- t . -- - t a
-. as - "t .. f-" f9 eaw _a. a * _ _ ta, tWO. 1 . -"At nl - a e _ .0 t =e.Cl Basl ._e aaaaa men. 0 aatfi e - an. 9 c nel. *a.a alna
_.t ::.- ntitacaS. tl.a................... _ _ata -_| _ 9__an _ta. _ f_l. -f tei_ . 9|t.a_. ft_._ tt. _-ft t _ . - t. * t . p 9. altn,-*._ at~ _9W -_ ca nat... _..lna_ - caaaiaaaaa eflaa - _aM. _. .l. mt) - _tatlcna %Ia.3
C1..fl.a ma- - .mnd ma M_b0 Infl_t baaan_ taaalana.an.a aaaaaea. Satt.I. _9. aaaa!tsmaata m9PBv ftaLf=0
9,, Baa.. nasa. - nfl ~~l.a=.. t, .9 flaa-.a - .galm.fsfan talsnle.U la- _a as. .a 9.1. W .! pta .t .a Zt_ _L 9* C a - cl a n .ra tn _ot . _a . _wa.fla _.94 It
_taf -W .m 0 fnata matsa. a.aal .-at _ at_- na *_tO:a. n.aa. aflaia *a. Os .9. Sa--aa. a.aa _
199. _ - .111 _m _ t_ _ as__a t
a man -. )caa _-.i_ a- - _.4 B! atn *: *. st-. - nsa_f- - Wa. at olr-°t- Caet., act_ . md -= assm m- _
.9999,.- a a--a-t - t.t-. _.9. r-t-Sa,49 dm a M M. G n ma. a mat... = n ,t _ a
_ntt t_ t L. O M C.- _ a_ aft _ . -1- Wua at t- tr__- WM _d. aL ss r_ 1 ten - OL a t a. __ _! -et 5.9_ _ _ e_
|_tw _r_ B_ o E _ _ _ - r_ et_ r ~ ~ efft- I.Pm
t_r _m_- 4 _ma a.aat am_ _factli ltnma 9ar;. -. ! fl!Bt. an _ _,-_e_ta. aa . _ _tam. = , sa _rt_ tatrea *tatWz a_m_tana -tam | ote.t _ t B4 a..
Basal. m lit. atetmer 99.0 amamBaa salt 9.*a - sat-...aa--nt. asBem 1 Un. . a ~ ~ a.. w,t r__tsa .- i Sn .5.9.mE_ t_t fl* a r__ta ._ a. *Lu att aatatan t_a. r _ea tfl r_fm_ amuo ta factll. r._a t s a_. _am _tt__. Ia_ amt mt_e. _ _ _i
gem..- ____- *n.alaaa am t..a flat. Iva _ f rt emen- a .t_.0a.L ..... i ,t*_ __ 1.b *-_ # a.L- -r -_aa-amat at t ry _ -* al 0 9 _. t. s_ - 9.-B
t. . sta35mts.. aMa m-af I.fat_patan r9 o.a _ aS_ aflama ISn tt t_tm.4 9
a
aaa. te aasalaf!. 9a_!sa r_ rsalaw, Baa.! st _ _ _ fttt safla-. tel_ca_at_sT n . l a _r.t- - Wad a-Ba
9am.ama 9501. r_t tt_ a* a*_la am all.. T_ _a. tt_a le b.r a o_ ame. *trm t lafaa 1a49 ta. 045g1 t
sea faa... .. L-ec . t . aa - a - __t sata. _maBa a-.. - .Cs-s a5 R-ftaact atfila.
gaas. .9 at 9t!ca .itsaa9sa. t a.aa .a at9aaytt _ aataa :_:a t
a.| - _ 0. Sn_..a a- faa. .919.9ta.anaa _aaa .!e.Bna._ .-- _t,.9.. -- a. 9 an.. at.a atntaaaca.naa tameasa t-, 9._ tm................... ttt f te ata .99 a._ 'ma - Utdl sa.ts. a._t9n. at aaan............................. _taaa _ -a.a..a.. -at
B. Cit. m- rla tt -L.. man. 1- g- l .aln .aaa- --. I
_. .,_ ..aan-_.a annn. a. amt _aaaaa a_ *_ aact *_ ... n_a _ aa..n.a.E aataaa. 9 .a __.. _--ta
_le _ t... ... t _ - - t. - _-_ a ..a. . *__ -n -Bs C_
B att_.. ttaa _a- W-*a -_ t -- t ; W
- a.c -. ;.n.. nact 91o0.. nB5' 19.c. Isa - .9aans aaa
a_..! a*,az ;.. B. am_ _in I. aa Bane,.. Ca. -t - tja-- 0.9t tta . _a op
_-at aaflaff (_ _. _aa _ t [tn .ttet_ _ tcl_f 9_o a 1a9a *_ ara ala _Ba _t at .aae. am _t
Zt _ _ _ _ _tt_ ww rat_-0 "a
ta.aaaa e tacraalataeB-t- n dt. 91~-n gon. ac.mnl
_ l" en -_ t- _ W iit z
-_t a.t_t - _ _ .99. nt_* -.e _t a_rr rr _ _s.. .9 _sa t. t Uar ats = ta a t_ r_r an a = n................................... _ _
tmaasna £99 la at.at--W na. a9 n.a aalsl- .aat eat.... .
_E _tv *_- _I-. M"tSt __z_ o _s s_
7a.tnc rCntia.fatMea - VW -fat jtt aa t a ann. aa a., ateam- .9 1aasa 090.laa.aa rat .lt-a. a.'t.- aal.aLif .. ss.a a. mn anf. m w..n9tn
Stat tat. (lat ate.u - 999! alsa talat lokat a-t_s .t a.- Ia r. a. -_"
= ~ ~ ~ ~ ~ ~ ~ ~ ~~~~~~~~~~~~- di _t _ _sv Me- __ _ _
Lat mml.aa tWO. a- .1 am aM! dmA. I '._.tat. m a !fla.515.
re_ _ o- met. _ot ct t_af r _l mat a aa a6eWtta, amt a. r_s __ tlatB *t.9.a at_ affsat.
tM. _al.a dlaa lemet a. tint_ _sta mm,s fa a. adm_ 1at aatanaa. ia.in t n n - a.*inn902 ~1.aten. anan 'rt am aabt*| am V. _ - a- tn.49- *
_9a nact_.t_.tt,t_ _ _. .a.l _ a-t ant, e _ _a .4.tn a. aetsatat9 at___ _D ! _tldt_a _ t as. _.aBttW e_ ta - t_ _ _
_t9ta _ s _ aa aa.ttaa_ = a.t .11 ants. na. =ttat
S ~~~~~~~~~~~~~~t_nat.. aBa mm, a.nsa ~a *_ Ba_ tMt_9em Iat _| ,- a.nar msartn.9aaa -x _fi at _a na. t-a! tat_ -a -r .. B.t 9-t.e a itaam -t =aa _. rtat. z
A ta -. nW t tt a e tat. B. tta *_
mm . _na .9 .c _a - aSa _t a=t 1'_a. a.. _-t .as ?.ts _ - 9ft. _a .as _ tt .t _l. a aa ea 5at. _, _t _a. _a r_ ar_ . atz. e_ am me a. _ t_a r9 tm Bae tsn l. t_sta a.U asata 1aa_.. *leo1 _ a. sat_eas ni . n9 jr. am 95 t am 16 las
- tanlttmala. ts _:a.m.-a? - ea.an.r_nna ma *at_. - r*-tananmeas at
_ .9-_. aanat tefas *ita 10tt _ala . asset r_. n. _t__, am_-d tam...* *a -r 11' _ennea tat-
a._ -ana. a._tr f t.nsd a'_a-da -_ _fat _.sar t.nmztnl a w-_ _it .- teBaa inm a_ am .1 am
__ _. _ra! ala-a, na.n -Q_ nan dma. _ _1"°*'llS at am _amam. -. t"e.atto. dm-a . _. lataa.awaasa.ntt.n -maat0m.sa
* alna 9 _ta _a 5 aaat r_nl am __a am __. g.. ma 0
_aa . _9 _ _at n r l. . . tad_a l aet 9s ee am t l a_- ta c _ r_ am
_9am aa! a-s. 7.a nd lms 9 as __ _ .014. flateaa at_ _rl.ea! _mIn- t. til faa t_ i * n.. nail am ~aem. lasaam..asa. a. m aaf-
19 aa attfla nat 999 rsa. am a.. *- taaa _ea r_ 9a l19..fe.9m.sII anm.nn l taa.._alm Sn.. amaa mee _as -_w __ dan na-_ *_ln amn _ -n-a .ae a ....... m .n
e_|_ ~ ~ ~ ~ ~ ~ ~ ~ ~ ~ ~ ~ ~ ~~ttai t.l_laba a19 t -. e_t_.tan -a

Pqp4 f S
cU:oNc D5.03T Da2a
XWPmCMONTA U11AtS 1260 DT
CGOSS DWuSrxc p C? Ul 1982/83 bJ AnhwL RAE Olr C3IT (2L Cona't Price.) cl
1955/56-1959/60 1960/61-1964/65 1965/66-1969/70 1970/71-1974/75 1975176-1979/yuUrS$ S1.. 2
CDP at Market Pricle 170.74 100.0 3.7 3.6 3.7 2.9 4.1Gross Do eutic Inve-amt 41.99 24.6Crae Rati0ton av
4 n 35.12 22.3Correat Account Balance - 3.87 - 2.3
OwUT. PUTAO E M= JID lUCrrVrZY ID 1981
Valuo ide tat factor case Labor Force I/ V.A. Per WorkerS 61n. __-__ US5 t of Nationl Averae
Agriculture 51.7 35.1 172.: 70.6 299 50industry 35.2 23.9 31.6 12.9 I11U 185Services 60.6 41.0 40.3 16.5 150 249Totsl/Av.rge 147.5 10.0 1 -r :-- -or 7
GOVCIDUT F JSMSC!
General Government of Central Covern tPA. DIU. t of GDP as. BIn. 2 of GOP1982j3 1982183 f78179.-1982183 1962/B13 1982S83 1976/79-1982 83
Curret Recept. 333.34 20.3 19.5 175.61 10.7 10.5Corret E _penditura 340.09 20.7 19.0 188.59 11.5 10.8cqrrent Surplus/Defict - 6.75 - 0.4 0.5 - 12.98 - 0.8 - 0.4Capital Expenditure fl 131.2S 6.0 6.1 95.13 5.6 5.7Externl Assistane (nt) il/ 19.30 1.2 1.0
NOE. CR3DT AND PCES 1970/71 1975/76 1977/78 1978179 19979/80 1980181 1961182 1982/133 frbnuar 1983 Febnsary 1984(IoBallios outteadi at atd e
MAne and Qas Money 109.8 224.8 329.1 401.1 472.3 555.5 624.9 723.6 711.7 845.7Bmnk Credit to Gover t (not) 54.6 106.3 137.3 159.3 200.1 257.2 309.1 352.4 353.5 406.6Bnk Credit to Comrcial Sector 64.6 156.2 212.2 255.3 310.1 363.5 430.5 504.5 487.7 576.4
(Prcewtag& or Index Nu)me) Apr-Fab 1982VS3 Apr-Feb 1963/84
AMsy nd Quasi MOUsy as cEof GDP 27.3 30.3 36.7 41.1 ".1 43.6 42.0 44.0
Wholesale Price Indez(1970/71 * 100) 100.0 173.0 185.8 185.8 217.6 257.3 261.4 28.6 288.1 314.8
Anual perente change in:
Wooleale Ptie Index 7.7 -1.1 5.2 - 17.1 I 8.2 9.4 2.6 2.3 9.3Bank Credt to Governn (set) 15.0 22.7 16.3 16.0 Z5.6 26.5 20.Z 14.0 21.0 J/ 18.9 h/Bak Credit to C£nrcial Sector 19.4 22.7 12.6 20.2 21.5 17.2 I6.4 17.2 15.5 IV 17.9 b/
if The pw capita GOP estimte In at mcrket prie". -sI world Bak Atlas metbodolOgY. boe perlod 1979-198L.All other cocverime to dollars la thi table we at the avra exchage rate prevaling durin the perlod covred.
bl Quick 0Btimtes. Central Statistical Organizatien.cI Computed fra trend eit of CGP at factor coat series. including oS observation before first year And ose observati after lest yer of
lsted period.d/ World Bonk autistes of net dieburent of coneasonal aid sad ID.1J Tranfer. bee Cent.v ad State have b neted out.
El *11 loans and advane, co tid perrie have beo netted out./ Percentage dhan fra ed-Mrch 16 to end-February 1983.
blPercentage dc f r nd-March 1983 to end-Februar 1984.S/ Total Labor Force od percentage breakdown fro- 1981 Cenu. cludes data for Aseen.
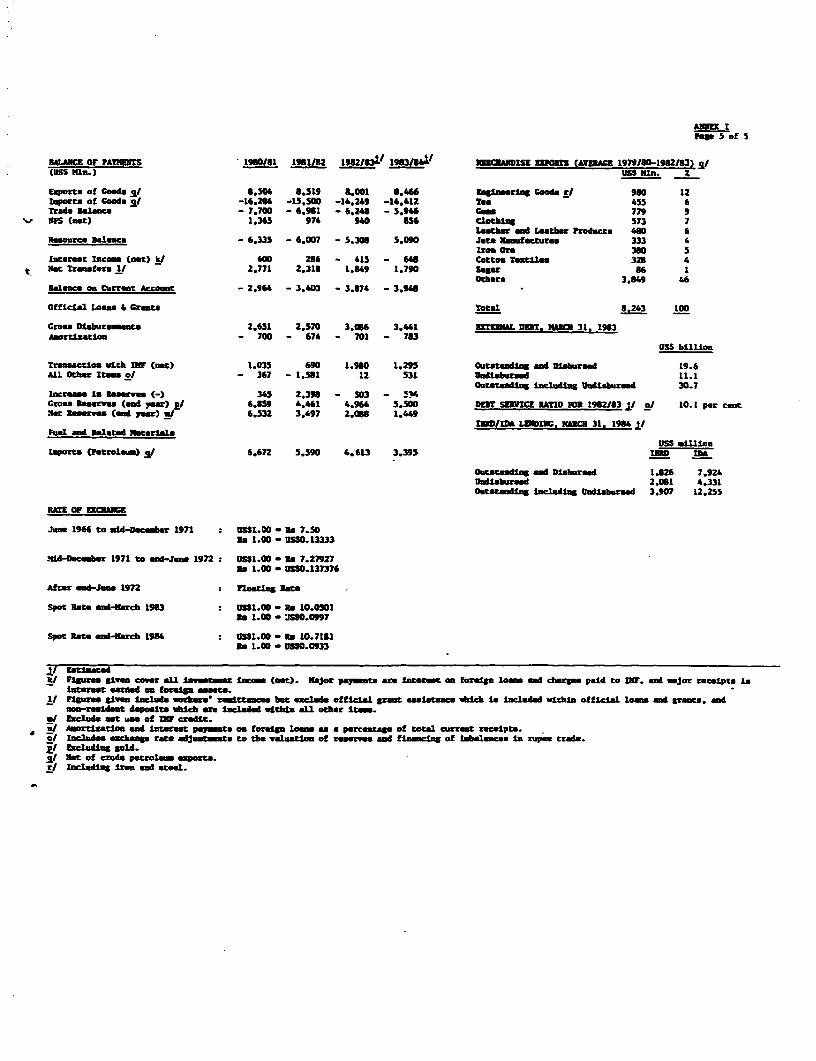
Page 5 of 5
BALANCE OF PAHnS - 1980/S 1981/S2 19823/ 1963/184/1 I NCIWISK 5181 (AVERAGE 1979310-1982183) &/(USS ULn.)
Exports of Goods I 8.*50 8.519 1.001 8.466 Riel rin Good. VI 910 12Imports of Goode gl -16.204 -15.500 -14.249 -14.412 T 455 6Trade Balance - 7.700 - 6.981 - 6.248 - 5.946 C_ 779 9IFS Cnat) 1.365 974 940 a5 ClothbU 573 7
Lther nd Lathr Product. 480 6Reanirc Bmlance - 6.335 - 6.007 - 5.30S 5.090 Jute Nanufacturee 333 4
it. ore, 380 5Lntaemt Incom (Mt) 600 238 - 415 - 64 Cotton Textile. 32 4
t Net Srf Il 2.771 2.318 1.849 1.790 S-r 36 1others 3.849 46
Balance on Ciarrt Account -2.964 - 3.403 - 3.74 - 3.948
Official Loan 4 Greats Total 8.243 100
GrC" Disbur.ao..t 2.651 2.570 3.066 3.41 DEBT. WARCN 31. 1983A.otzt n - 700 - 674 - 701 - 7U3
tlSS billo
Trenactio with ID C(mt) 1.035 690 1.980 1.295 Outst-ndn ed Disbursed 19.6AlL Other It. oJ - 367 - 1.581 12 531 Dudllbnrad l1.1
Outatandin including Undisburumd 30.7Incrme in Reme-) 345 2.398 - 503 - '?Cras Reeerv. (enA Year) 1 ! I 6.859 4.461 4.964 5.500 DB SERVCE RATO F0R 1982/3 L/ nl 10.1 per cntMac Resrves (nd yer) Mr 6.532 3.497 2.038 1.449
DrDtmWA LOIDDC. WIZ 31. 194 X IFuel and Related Neterial.
054 nillionports (tPtroleu) g/ 6.672 5.590 4.613 3.395 1 IDA
Outtndg nd Disbursd 1.826 7.924IJdudburne 2.0D1 4.331Outstanding Including Unddburmd 3.907 12.255
RATE OF UENIAR
June 1966 to imd-December 1971 : OS$1.00 - as 7.50Rs 1.00 - US#0. 13333
!ild-D.co.b.r 1971 to end-Jun 1972: U1S1.00 - Pa 7.27927ax 1.00 - U550.137376
After and-J_n. 1972 . Blastin late
Spot Rat entd-rch 193 US1 .00 - Rn 10.0501it 1.00 - J580.0997
Spot Rate dad-Narch 1984 US$1.00 - as 10.7151Ba 1.00 - USS00933
31 Eaintedk t Fie g or all t t) r pants e interet an foreig a d charge pad to DIF. a_d Jar r-edpte Ls
Interest eareed o foreig 11igur given inclue wors' rdtt_acu but exclude, official gret aueistace whic in Includ.d within Officl Loam ad granto. ad
oon-reaidat depeite which are included ithl &all other item.I Exclude not Wm of VlW credit.n/ Amortization and intart paymte on foreid leane as a prceatag of total curreat receipts.ol Includee exchang rate adjuatmato to the valuatio of reservee and finmnci of 1 1balance ia rupee trade.
/ ludin gold.Bat of crude petrola, exports.
rl Includin Irom d stel.

ANNEX IIPage 1 of 4
THE STATUS OF BANK GROUP OPERATIONS IN INDIA
A. STATENENT OF BANK LOANS AND IDA CREDITS(As of September 30, 1984)
US$ millionx Loan or Fiscal (Net of Cancellations)Credit Year ofNo. Akproval Purpose Bank IDA j] Undisbursed V
50 Loans/ 2,164.0 -93 Credits fully disbursed - 5,535.2
482-IN 1974 Karnataka Dairy 30.0 8.15610-IN 1976 Integrated Cotton Development - 18.0 0.031251-TN 1976 Andhra Pradesh Irrigation 145.0 - 24.941273-IN 1976 National Seeds I 25.0 - 11.191335-IN 1977 Bombay Urban Transport 25.0 - 1.17680-IN 1977 Kerala Agric. Development - 30.0 8.45682-IN 1977 Orissa Agric. Development - 20.0 1.65690-IN 1977 West Bengal Agricultural
Extension & Research - 12.0 7.321394-IN 1977 Gujarat Fisheries 14.0 - 2.62
720-IN 1977 Periyar Vaigai Irrigation - 23.0 1.52728-IN 1977 Assam Agricultural Development - 8.0 1.34747-IN 1978 Second Foodgrain Storage - 107.0 52.65761-IN 1978 Bihar Agricultural
Extension & Research - 8.0 4.931511-IN 1978 IDBI Joint/Public Sector 25.0 - 1.721549-IN 1978 Third Trombay Thermal Power 105.0 - 3.60
788-IN 1978 Karnataka Irrigation - 117.6 37.38793-aN 1978 Korba Thermal Power - 200.0 30.11806-IN 1978 Jamu-Kasbmir Horticulture - 14.0 9.91815-IN 1978 Andhra Pradesh Fisheries - 17.5 8.40816-IN 1978 National Seeds II - 16.0 4.861592-IN 1978 Telecommunications VII 120.0 - 15.10824-IN 1978 National Dairy - 150.0 43.85842-IN 1979 Bombay Water Supply II - 196.0 141.11844-IN 1979 Railva, Modernization
& ainterance - 190.0 25.05848-IN 1979 Punjab Water Supply & Sewerage - 38.0 5.28855-IN 1979 National Agricultural Research - 27.0 14.06862-IN 1979 Composite Agricultural Extension - 25.0 2.94871-aN 1979 National Cooperative Development
Corporation - 30.0 0.831648-IN 1979 Ramagundam Thermal Power 50.0 - 50.00874-aN 1979 Ramagundam Thermal Power - 200.0 10.71889-IN 1979 Punjab Irrigation - 129.0 38.32899-IN 1979 Maharashtra Water Supply - 48.0 6.72911-IN 1979 Rural Electrification Corp. II - 175.0 4.45925-aN 1979 Uttar Pradesh Social Forestry - 23.0 2.24954-IN 1980 Maharashtra Irrigation II - 210.0 42.74961-IN 1980 Gujarat Community Forestry - 37.0 6.51963-IN 1980 Inland Fisheries - 20.0 16.07981-IN 1980 Population II - 46.0 27.63

ANNEX IIPage 2 of 4
US$ millionLoan or Fiscal (Net of Cancellations)Credit Year ofNo. ADnroval Purpose Bank IDA jj Undisbursed j,
1003-IN 1980 Tamil Nadu Nutrition - 32.0 19.481011-IN 1980 Gujarat Irrigation II - 175.0 94.881012-IN 1980 Casheunut - 22.0 16.111027-IN 1980 Singrauli Thermal II - 300.0 159.671028-IN 1980 Kerala Agricultural Extension - 10.0 7.561033-IN 1980 Calcutta Urbau Trausport - 56.0 17.761034-IN 1980 Karnataka Sericulture - 54.0 30.321046-IN 1980 Rajasthan Water Supply & Sewerage - 80.0 49.091843-IN 1980 Industry DFC XIII 100.0 - 5.371887-IN 1980 Farakka Thermal Power 25.0 - 25.001053-IN 1980 Farakka Thermal Power - 225.0 113.521897-IN 1981 Kandi Watershed and
Area Development 30.0 - 20.31107Z-IN 1981 Bihar Rural Roads - 35.0 14.381078-IN 1981 Mahanadi Barrages - 83.0 42.641082-IN 1981 Madras Urban Development II - 42.0 19.491108-IN 1981 M.P. Medium Irrigation - 140.0 85.731112-IN 1981 Telecommunications VIII - 314.0 89.581116-IN 1981 Karnataka Tank Irrigation - 54.0 37.681125-IN 1981 Hazira Fertilizer Project - 400.0 117.861135-IN 1981 Maharashtra Agricultural Ext. - 23.0 13.921137-IN 1981 Tamil Nadu Agricultural Ext. - 28.0 17.081138-IN 1981 M.P. Agricultural Ext. II - 37.0 28.051146-IN 1981 National Cooperative
Development Corp. II - 125.0 70.251172-IN 1982 Korba Thermal Power Project II - 400.0 273.611177-IN 1982 Madhya Pradesh Major Irrigation - 220.0 154.992050-IN 1982 Tamil Nadu Newsprint 100.0 - 18.151178-IN 1982 West Bengal Social Forestry - 29.0 19.921185-IN 1982 Kanpur Urban Development - 25.0 15.132051-IN 1982 ICICI XIV 150.0 - 57.702076-IN 1982 Ramagundam Thermal Power II 300.0 - 269.542095-IN 1982 AnC IV 190.0 - 0.431219-IN 1982 Andhra Pradesh Agricultural Ext. - 6.0 4.692123-IN 1982 Refineries Rationalization 200.0 - 96.432165-IN 1982 Rural Electrification III 304.5 - 274.482186-IN 1982 Kallada Irrigation 20.3 - 20.001269-IN 1982 Kallada Irrigation - 60.0 30.571280-IN 1983 Gujarat Water Supply - 72.0 60.111286-IN 1983 Januu/Kashmir and
Haryana Social Forestry - 33.0 24.971288-IN 1983 Chanbal Madhya Pradesh - -
Irrigation II - 31.0 19.651289-IN 1983 Subernarekha Irrigation - 127.0 105.962205-IN 1983 Krishna-Godavari Exploration 165.5 - 140.522210-IN 1983 Railways modernization &
Maintenauce II 200.0 - 197.04
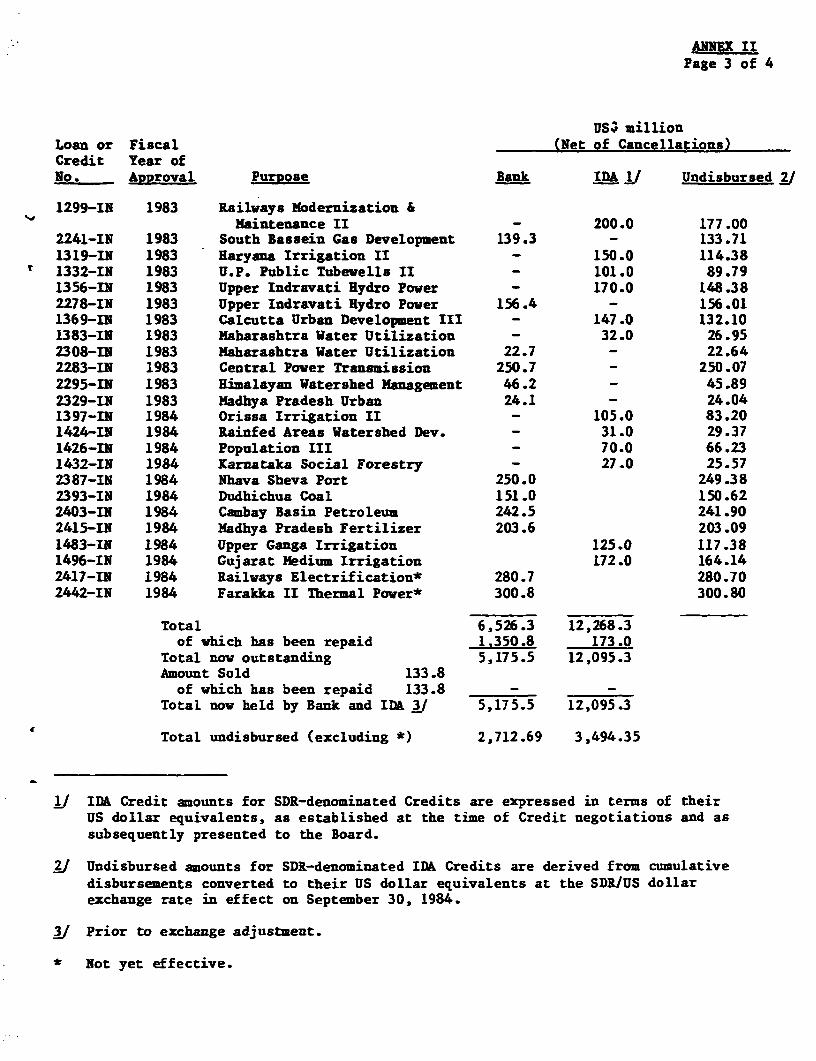
ANNEX IIPage 3 of 4
US%' million
Loan or Fiscal (Net of Cancellations)Credit Year ofNo. Approval Purpose Bank IDA j Undisbursed V
1299-IN 1983 Railvays Modernization &Maintenance II - 200.0 177.00
2241-IN 1983 South Bassein Gas Development 139.3 - 133.711319-IN 1983 Haryana Irrigation II - 150.0 114.381332-IN 1983 U.P. Public Tubevells II - 101.0 89.791356-IN 1983 Upper Indravati Hydro Power - 170.0 148.382278-IN 1983 Upper Indravati Hydro Power 156.4 - 156.011369-IN 1983 Calcutta Urban Development III - 147.0 132.101383-IN 1983 Maharashtra Water Utilization - 32.0 26.952308-IN 1983 Maharashtra Water Utilization 22.7 - 22.642283-IN 1983 Central Pover Transmission 250.7 - 250.072295-IN 1983 Himalayan Watershed Management 46.2 - 45.892329-IN 1983 Madhya Pradesh Urban 24.1 - 24.041397-IN 1984 Orissa Irrigation II - 105.0 83.201424-IN 1984 Rainfed Areas Watershed Dev. - 31.0 29.371426-IN 1984 Population III - 70.0 66.231432-IN 1984 Karnataka Social Forestry - 27.0 25.572387-IN 1984 Nhava Sheva Port 250.0 249.382393-IN 1984 Dudhichua Coal 151.0 150.622403-IN 1984 Cambay Basin Petroleum 242.5 241.902415-IN 1984 Madhya Pradesh Fertilizer 203.6 203.091483-IN 1984 Upper Ganga Irrigation 125.0 117.381496-IN 1984 Gujarat Medium Irrigation 172.0 164.142417-IN 1984 Railways Electrification* 280.7 280.702442-IN 1984 Farakka II Thermal Pover* 300.8 300.80
Total 6,526.3 12,268.3of which has been repaid 1.350.8 173.0
Total nov outstanding 5,175.5 12,095.3Amount Sold 133.8of which has been repaid 133.8 - -
Total now held by Bank and IDA &J 5,175.5 12,095.3
Total undisbursed (excluding *) 2,712.69 3,494.35
11 IDA Credit amounts for SDR-denominated Credits are expressed in terms of theirUS dollar equivalents, as established at the time of Credit negotiations and assubsequently presented to the Board.
Undisbursed amounts for SDR-denominated IDA Credits are derived from cumulativedisbursements converted to their US dollar equivalents at the SDR/US dollarexchange rate in effect on September 30, 1984.
2/ Prior to exchange adjustment.
* Not yet effective.
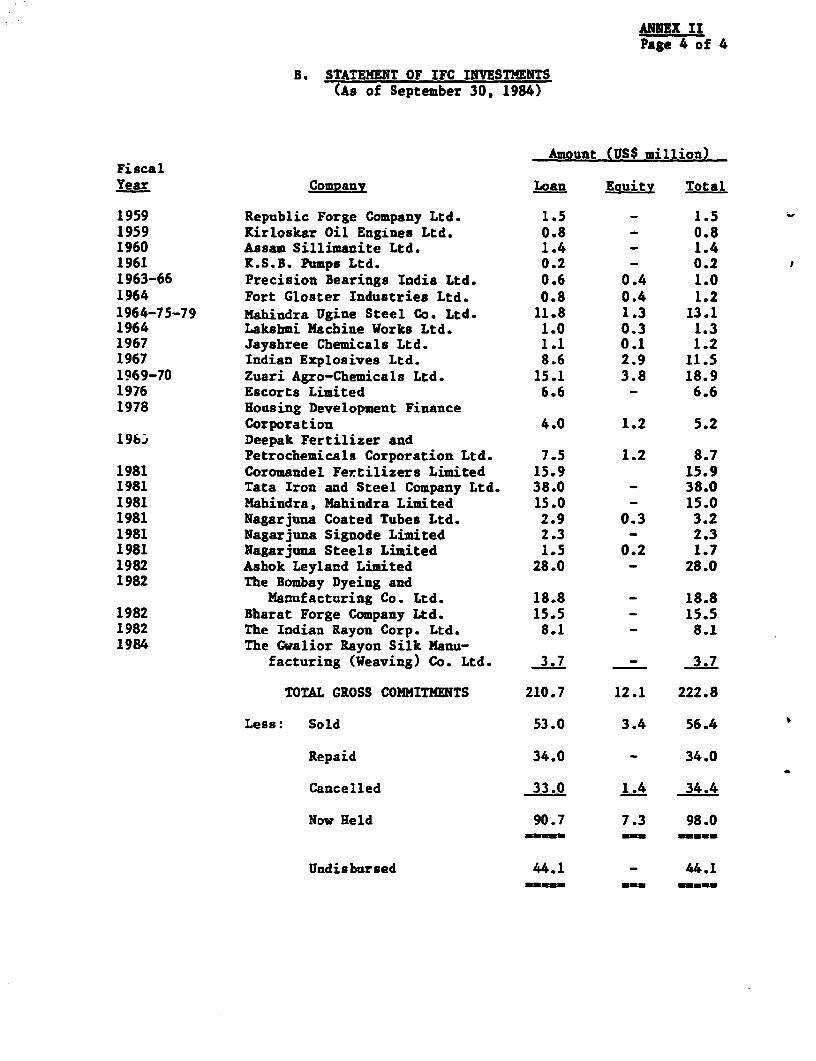
ANNEX IIPage 4 of 4
B. STATEMENT OF IFC INVESTMENTS(As of September 30, 1984)
Amount (US$ million)FiscalYear Company Loan Equity Total
1959 Republic Forge Company Ltd. 1.5 - 1.5 -1959 Kirloskar Oil Engines Ltd. 0.8 - 0.81960 Assam Sillimanite Ltd. 1.4 - 1.41961 K.S.B. Pumps Ltd. 0.2 - 0.21963-66 Precision Bearings India Ltd. 0.6 0.4 1.01964 Fort Gloster Industries Ltd. 0.8 0.4 1.21964-75-79 Mahindra Ugine Steel Co. Ltd. 11.8 1.3 13.11964 Lakshmi Machine Works Ltd. 1.0 0.3 1.31967 Jayshree Chemicals Ltd. 1.1 0.1 1.21967 Indian Explosives Ltd. 8.6 2.9 11.51969-70 Zuari Agro-Chemicals Ltd. 15.1 3.8 18.91976 Escorts Limited 6.6 - 6.61978 Housing Development Finance
Corporation 4.0 1.2 5.2l96; Deepak Fertilizer and
Petrochemicals Corporation Ltd. 7.5 1.2 8.71981 Coromandel Fertilizers Limited 15.9 15.91981 Tata Iron and Steel Company Ltd. 38.0 - 38.01981 Mahindra, Mahindra Limited 15.0 - 15.01981 Nagarjuna Coated Tubes Ltd. 2.9 0.3 3.21981 Nagarjuna Signode Limited 2.3 - 2.31981 Nagarjuna Steels Limited 1.5 0.2 1.71982 Ashok Leyland Limited 28.0 - 28.01982 The Bombay Dyeing and
Manufacturing Co. Ltd. 18.8 - 18.81982 Bharat Forge Company Ltd. 15.5 - 15.51982 The Indian Rayon Corp. Ltd. 8.1 - 8.11984 The Gwalior Rayon Silk Manu-
facturing (Weaving) Co. Ltd. 3.7 - 3.7
TOTAL GROSS COMMITMENTS 210.7 12.1 222.8
Less: Sold 53.0 3.4 56.4
Repaid 34.0 - 34.0
Cancelled 33.0 1.4 34.4
Now Held 90.7 7.3 98.0
Undisbursed 44.1 - 44.10.0 ...... ... ...n

ANNX ITIPage 1 of 1
INDIA
JHARIA COKING COAL PROJECT
SUPPLEMENTARY PROJECT DATA SHEET
Section I: Timetable of Key Events
(a) Time taken by the Country to orenare the Droiect
Two years
(b) The aiencv which has Prepared the Droiect
Central Mine Planning and Design Institute
(c) Date of first presentation to the Bank and date offirst mission to consider the proiect
July 1982
(d) Dates of departure of aopraisal mission
Hay 1984
(e) Date of completion of neLotiations
January 22, 1985
(f) Planned date of effectiveness
June 5, 1985
Section II: Special IBRD Implementation Actions
None
Section III: Special Conditions
(a) Technical assistance will be provided under theproject to improve underground mining procedures, tostudy alternative transportation modes for sand(stowing material); the project will also include astudy aimed at improving the organization of, andequipment for shaft-sinking activities (para. 54);
(b) GOI to maintain prices at levels which will ensurethe financial viability of CIL, as well as an ade-quate level of resource generation for the coalsector (?ara 68).

ANNEX IVPage 1 of 1
INDIA
JHARIA COKING COAL
Procurement Arranfements(US$ millions)
TotalProiect Element ICB LCB Other Cost
Block II
Mining equipment & parts 102.5 4.6 14.2 a/ 121.3(80.7) (80.7)
Washery 73.6 - - 73.6Land & civil works - 10.0 2.1 b/ 12.1Engineering - - 0.9 0.9Pre-operation - _ 6.5 6.5Sub Total 176.1 14.6 23.7 214.4
(80.7) (80.7)
Pootkee-Bulliarv
Mining equipment & parts 122.4 90.5 - 212.9(98.9) (98.9)
Washery 86.6 - - 86.6(66.4) (66.4)
Land & civil works - 58.5 0.5 b/ 59.0Engineering - - 5.9 5.9Pre-operation - - 3.1 3.1Technical Assistance - - 2.0 2.0
(2.0) (2.0)Sub Total 209.0 149.0 11.5 365.5
(165.3) (2.0) (167.3)Grand Total 385.1 35.2 583.9
(246.0) 163.6 (2.0) (248.0)
4~~~~~~~~~~~~~~~~~~~~~~
Note: Figures in parentheses are the respective amtunts financed by the Bank.
a/ UK financed dragline.bI Land acquisition only.

AFGHANISTAN ' .. ...... \.. .. AAFGHANISTAN S~ ~ ~~~~A' SHMI #vpr 11mil I0"-jt #lVw W (J1111ridH I N D I A/i -t ^t.,. tv ta,JHARIA COKING COAL PROJECT
J ,IiMACF '2 ') -" Jlinri, Coal Finlcl\ . MACHAI C H I N APRA IFSH & olFud
V\ t -F I I Malur Coal Fltirl ArOaseJNI8 1 Q I Oparatdl lby Varlous Mlnih,'c Coinpannio
jo0 PAKISTAN A LJ 'j A Coni ndina Ltd, Haccritirur, ror
/f ~ YAA (,Ji>yls / S National CnapitalJ a s,ialctal Clidms
g ts, te ;!K~I-Oew NNlh S('AI -.- 7 NEPAL ' ' ;,2'- -
( ~~~~~~~~~~~~~~IRPAFl. ,,'_BHUTAN~"I R A jel fHxl V K ASSA M I~AUNMH
K9. _L~ 'w ) A t GtMl>KA N , AGA1ANO
x,>~~~~~~~~~~~~~~~~~ 1 H odw ACilrI9 lE4BANGLADEi Jharia Cokin ColMAjet
c3AI '4\) \ ~~~Norlk Easlern CoolfielC: ''/ ' ~~~~~ _ ,? .:SXRMBURA
J MAHI1ARASHIRA. Lidva ('B' LCCL)
9embaa; % (** } S Coni&y Coalf Lie.nCa/CL
PRA - - > ,;i" f ,Wefrrn C',alfields Lid, (WCL)..
iAN PRA P ' -
jI SinguIen! Collieries Co, Lid (SCL)GOA
KA RNA MA (KA

73 , P. n DS W X v > CX HAR 9LmrJBANGLADESH (JMAN// IJ M -- -. ,< e 3 3 )Jharla Cokinci Coal Pr plac_- /, A9T o.? *IAO G A. A s ?1 r T AIRI/PURA P M/IORAM
j MADHYA PRAOF : IU | Norlh Eastern Coalfiel
~~ ~~? N. ,-* '~~~r- Eastern Coalfields A\} % \, \<D ~~~~~~ON.ng S - 2- < Lid (EC9 L)J
, t \ .\t. \t ORISSA \ > Ghoral Coking Cool'20 f MAHARAStltRA Lid. BCL)
\ 't=ga halult T \ i'l' \Central Coalfields Ltd.(CCL) y$5
' t, 7 > \9 . V .; Wpsiern Cooifitios Lid. IWCL)
,AN9DRi PA' A A
Singoareni Collieries Co Ltd (SCL)GOA ,
/(A Al/VA JA1KA I
>,~f~Ma i ANDAOMMltAANDAMAN
. S ) ,~t A AID .'VN/C08ARI1TA44/1 NADU ISlANDS
rhog RW ds Admnprq.d byrte fphtu 0"#Vtb viiv KR I A ,.h 'o. KORAlA1 ? I o Neyvol, Lignite Corporation Ltd (NLC)nhndos ttatd th xlbS, *J*eVondi use oE rho VIAiUr A"
O co N CI rbm mS rh s s L , ,0 C.i afti The baflh,i5 ssee
o: 'IX=,txtht : h 2 s KILOMEtERS 0 200 400 00 200 4 .B
m VW t tth On ta ' SRI MIlES 0 100 200 300 400 500 - aMwiwl U 'C'd'*° @ANKA