world bank document -...
TRANSCRIPT

Document of FILE COPYThe World Bank
FOR OFFICIAL USE ONLY
Report No. P-2931-ZIM
REPORT AND RECOMMENDATION
OF THE
PRESIDENT OF THE
INTERNATIONAL BANK FOR RECONSTRUCTION AND DEVELOPMENT
AND THE
INTERNATIONAL DEVELOPMENT ASSOCIATION
TO THE
EXECUTIVE DIRECTORS
ON A
PROPOSED LOAN AND CREDIT
TO THE
REPUBLIC OF ZIMBABWE
FOR A
PROPOSED MANUFACTURING REHABILITATION IMPORTS PROGRAM
March 5, 1981
This docment hs a resticted distribution and may be used by recipients only in the perfonmnce oftheir oficlal duties. Its contents may not otherwise be disclosed without World Bank authorintion.
Pub
lic D
iscl
osur
e A
utho
rized
Pub
lic D
iscl
osur
e A
utho
rized
Pub
lic D
iscl
osur
e A
utho
rized
Pub
lic D
iscl
osur
e A
utho
rized
Pub
lic D
iscl
osur
e A
utho
rized
Pub
lic D
iscl
osur
e A
utho
rized
Pub
lic D
iscl
osur
e A
utho
rized
Pub
lic D
iscl
osur
e A
utho
rized

CURRENCY EQUIVALENTS
US$1 - Z$.63Z$1 - US$1.59
SDR1.00 - US$1.24
ABBREVIATIONS
ACC - Associated Chamber of CommerceCFU - Commercial Farmers UnionCMED - Central Mechanical Equipment DepartmentCOM - Chamber of MinesCAI - Confederation of Zimbabwe IndustriesUDI - Unilateral Declaration of IndependenceZANU - Zimbabwe African National UnionZAPU - Zimbabwe African Peoples UnionZTA - Zimbabwe Tobacco Association
FISCAL YEAR
July 1 - June 30
FOR OFFICIAL USE ONLY
ZIMBABWE
PROPOSED MANUFACTURING REHABILITATION IMPORTS PROGRAM
LOAN AND CREDIT AND PROGRAM SUMMARY
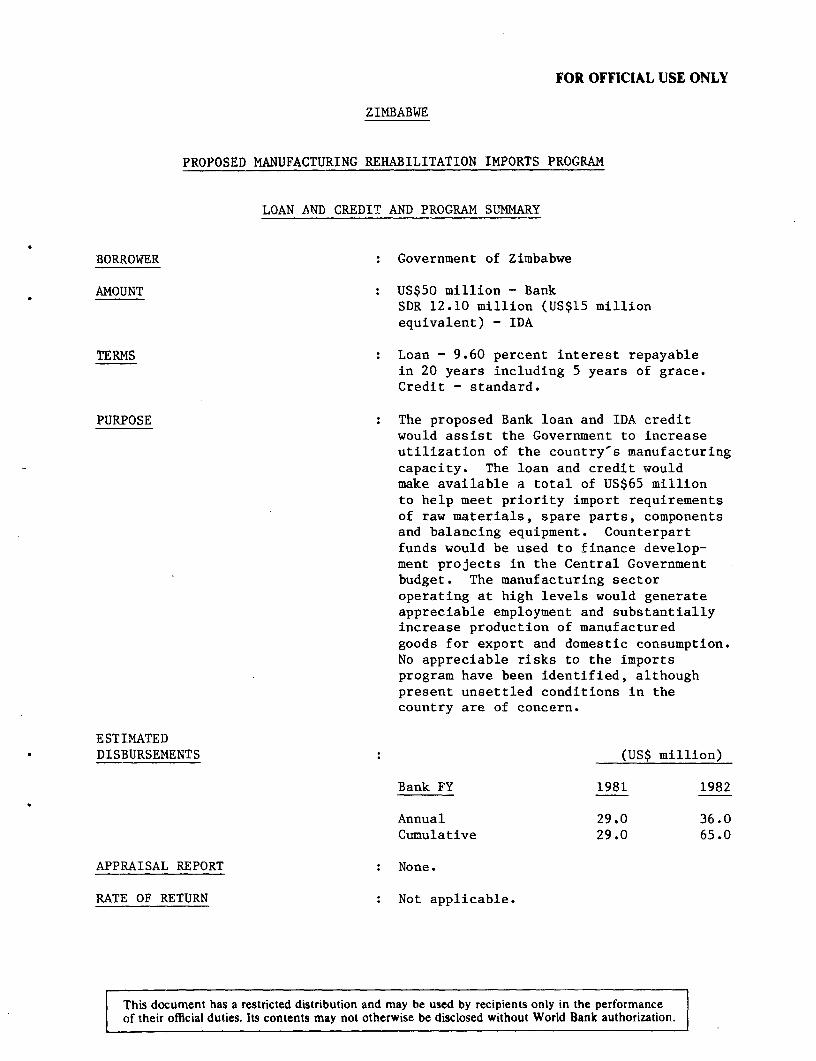
BORROWER : Government of Zimbabwe
AMOUNT : US$50 million - BankSDR 12.10 million (US$15 millionequivalent) - IDA
TERMS : Loan - 9.60 percent interest repayablein 20 years including 5 years of grace.Credit - standard.
PURPOSE : The proposed Bank loan and IDA creditwould assist the Government to increaseutilization of the country's manufacturingcapacity. The loan and credit wouldmake available a total of US$65 millionto help meet priority import requirementsof raw materials, spare parts, componentsand balancing equipment. Counterpartfunds would be used to finance develop-ment projects in the Central Governmentbudget. The manufacturing sectoroperating at high levels would generateappreciable employment and substantiallyincrease production of manufacturedgoods for export and domestic consumption.No appreciable risks to the importsprogram have been identified, althoughpresent unsettled conditions in thecountry are of concern.
ESTIMATEDDISBURSEMENTS (US$ million)
Bank FY 1981 1982
Annual 29.0 36.0Cumulative 29.0 65.0
APPRAISAL REPORT : None.
RATE OF RETURN : Not applicable.
This document has a restricted distribution and may be used by recipients only in the performanceof their official duties. Its contents may not otherwise be disclosed without World Bank authorization.


INTERNATIONAL BANK FOR RECONSTRUCTION AND DEVELOPMENTAND
INTERNATIONAL DEVELOPMENT ASSOCIATION
REPORT AND RECOMMENDATION OF THE PRESIDENTTO THE EXECUTIVE DIRECTORS
ON PROPOSED MANUFACTURING REHABILITATION IMPORTS PROGRAM LOAN AND CREDITTO THE REPUBLIC OF ZIMBABWE
1. I submit the following report and recommendation on a proposedManufacturing Rehabilitation Imports Program loan for the equivalent ofUS$50 million, which would have a term of 20 years including 5 years ofgrace, with interest at 9.60 percent per annum, and a proposed credit onstandard terms for SDR 12.10 million (US$15 million equivalent) to theRepublic of Zimbabwe.
PART I - THE ECONOMY
2. The first economic mission, since Zimbabwe attained independence,visited the country in September 1980, and its report is scheduled to bedistributed shortly. 1/ The information in this report was gathered bythis mission and two subsequent missions which visited Zimbabwe in October andNovember to appraise the proposed Manufacturing Rehabilitation Imports ProgramLoan and Credit.
3. Zimbabwe is a landlocked country of about 390,000 square kilometers,which borders Mozambique on the east, Botswana on the southwest and Zambiaon the northwest. Topographically, the territory rises from low plains(low veld) in the northwest and southeast to the middle veld (600-1,200meters) and further to a high plateau (high veld, 1,200-1,500 meters), whichruns from the southwest to the northeast. The high veld is a temperateclimate with a reasonably high level of rainfall, while the middle veldregions are warmer and drier and the low veld areas are arid to sub-arid.Population estimates for Zimbabwe for end-December 1979 indicate that thereare about 7.3 million people, 97 percent of whom are Africans. 2/ The remainingor "non-African" people consist of about 220,000 Europeans, 10,000 Asians and23,000 people of mixed origin. The growth rate of the African population isestimated to be 3.6 percent per year while the number of non-Africans is nowdeclining due to emigration. It is estimated, on the basis of pre-war data,that 20 percent of the population is urban.
4. The economic structure is well diversified. Agriculture, manu-facturing and mining are the important directly productive sectors of theeconomy. Agriculture accounts for about 12-15 percent of GDP and provides
1/ The data in this report is drawn from the draft version of the economicreport and is not therefore entirely consistent with the social indicatorsin Annex 1, which were prepared in October 1980.
2/ The Government of Zimbabwe's nomenclature.

- 2 -
formal employment for 334,000 persons (34 percent of all the formal employ-ment) and income opportunities for another estimated 1.4 million who dependmainly on subsistence or smallholder agriculture. Until recently, agriculturalexports provided about 39 percent of total foreign exchange earnings. Majorproducts are flue-cured tobacco, cotton, maize, sugar, wheat, coffee andlivestock.
5. Zimbabwe's mineral resources, include gold, asbestos, nickel,copper, coal, chrome ore, tin, iron ore, silver and cobalt. Besides contribut-ing 7.5 percent of the country's GDP and providing almost 6 percent of totalformal employment, mining also is central to Zimbabwe's foreign trade. In1979, for example, mining exports -- mainly gold, asbestos, copper, nickel,and ferrochrome -- earned about 40 percent of the total foreign exchangeearnings.
6. The mining and agricultural sectors supply the bulk of the inputsfor the manufacturing sector, which in 1979 was 25 percent of GDP, employed145,000 of the 989,000 workers in formal employment and accounted for 21percent of Zimbabwe's merchandise exports.
7. In 1979, per capita income was about Z$357 (US$470, using the WorldBank Atlas methodology). Distribution of income and assets between Africansand non-Africans, however, was highly skewed. The Land Tenure Act of 1969divided the country's total land area roughly into two equal parts for Europeanand African settlement. About 8 percent of the area designated for Africansettlement was set aside to be available for purchase (African PurchaseAreas), while the rest was designated as Tribal Trust Lands (TTL) to be heldunder communal ownership and used mainly for subsistence farming. Thisdistribution of land implies that there are at present 2.5 hectares of landper African person as compared with 65.2 hectares of land per non-African.Similar disparities exist in the distribution of other productive assets.Rough estimates suggest that the per capita income for the African populationin 1979 was about Z$110 (US$175) compared with roughly Z$5,500 (US$9,000) fornon-Africans.
8. In 1965, the international community imposed economic sanctionson Rhodesia with the aim of forcing the Government to abandon its unilateraldeclaration of independence. The subsequent war between the white-dominatedregime and African nationalists, who joined together in the Patriotic Front,intensified from 1973, but neither the sanctions nor the war appeared to haveseriously affected the economy until 1975. In fact, real GDP grew at aboutseven percent and per capita income about 3.5 percent a year, until 1974, withmanufacturing, agricultural and mineral output all registering impressivegains.
9. The sanctions were only partially effective, however. In addition,they stimulated the development of local capacity to manufacture substitutegoods for imports so that by 1979 consumer goods were only about ten percentof total imports, compared with 22 percent in 1964. They also encourageddiversification of commercial agriculture. Virginia Tobacco for example,accounted for more than 56 percent of total agricultural output in 1964/65,but by 1979/80 had dropped to only 25 percent. Livestock production over the

- 3 -
same period increased from 22 to 30 percent of total output, and cotton, soya
beans, wheat and coffee emerged as major crops. Overall, the value of agricul-
tural output rose from Z$123 million in 1966 to Z$305 million in 1979. During
the same time, mining grew rapidly under the impetus of expanding exports
(more than 90 percent of mining output is exported) and continuing reinvestments
by firms plus some new investments from abroad. By 1979 the value of mining
output had risen nearly 400 percent since sanctions were imposed in 1965.
10. The economic situation changed considerably from 1975 on. Sanctions,
the war and its petroleum requirements, oil price increases and two droughts
caused considerable disruption and resulted in a decline in economic activity
between 1975 and 1979. As a result, per capita income in real terms fell by
35 percent between 1975 and 1979 returning to its 1965 level. Although the
value of exports rose slightly during the period, the increasing cost of
imports, in particular oil, caused the volume of imports to fall precipitously.
Real investment also fell from Z$336 million in 1974 to Z$153 million in 1978.
11. The war and two droughts in 1978 and 1979 caused declines in
agricultural output, mainly of maize, so that Zimbabwe, which had been
exporting an average of about 500,000 tons of maize a year, became a net
importer in 1979. The manufacturing sector also declined. Formal employment
fell by about 65,000, affecting virtually every sector except public admini-
stration, which increased by over 20,000 persons.
12. In the sixties and early seventies, the Government's budget was
approximately in balance. However, beginning in 1974/75 deficits each year
increased until the 1979/80 deficit amounted to 35 percent of total Government
expenditures and 14 percent of GDP. Government expenditures during the same
period rose 20 percent per annum and in 1979/80 was 37 percent of GDP,
compared with 18 percent in 1971/72. The composition of Government expendi-
ture also shifted. The share of expenditure for administration and defense
constituted 46 percent of the total in 1979/80, while the portion directed to
economi't services, notably agriculture, commerce and industry declined.
While extensive controls kept price increases relatively low, -- 5 percent
annually during 1970-75 -- the annual rise from 1975 to 1979 was about 11.5
percent.
13. Externally, the economy maintained a reasonable balance on current
account -- as imports grew less rapidly than exports -- until 1975, when there
was a deficit of Z$116 million, financed in large part by private borrowing
abroad. With tightened exchange controls in 1975, imports in the following
three years dropped below 1974 levels and the balance on current account was
restored. A Z$61 million deficit in 1979, due in part to a sharp increase in
imports, as well as a net outflow of private capital was covered by Govern-
ment borrowing from South Africa.
14. With the end of the war and attainment of independence, the economy
began to grow. This was mainly due to an almost 40 percent increase in
imports, which facilitated a slight increase in capacity utilization. The rise
in imports has been financed from expanded foreign exchange earnings from
mineral exports (the price of gold increased appreciably). It has also been
financed from additional foreign exchange earnings resulting from the removal

- 4 -
of sanctions, which obliged Rhodesia to pay a premium for imports and acceptdiscounted prices for its exports. Furthermore, with the end of the war,the people are now able to concentrate on economic pursuits. Finally,growth in the agricultural sector has been facilitated by favorable weather.Consequently, a 6-8 percent real growth is expected in 1980.
15. The new Government's first budget presentation to Parliament stressespragmatic policies and programs aimed at a rapid rehabilitation of the economy,greater employment opportunities, and redistribution with growth. Relativeincreases are registered in Government expenditures on health, education,smallholder agriculture and capital investments by the Government. Thecapital budget increased from Z$85 million in 1979/80 to Z$142 million in1980/81, and the recurrent budget from Z$972 million to Z$1145 million.Expenditures for internal security and defense are expected to continue to besizeable and to make larger demands on resources than previously anticipated.Overall, the budget projects a deficit of about Z$575 million.
16. Economic prospects for the next two to three years are generallygood, provided the Government is able to control potentially divisive politicaland military forces. Economic rehabilitation will require substantialamounts of external assistance in addition to the domestic savings which canreasonably be expected to be mobilized. The Government has established areconstruction fund, separate from the Central Government budget, which isexpected to attract about US$350 million of foreign grants and loans onconcessionary terms over the next three years. These will assist in coveringthe cost of reconstruction of damaged schools, hospitals, local roads andrural infrastructure. The mining sector can be expected to continue toattract private foreign investment for its growth and to earn increasingamounts of foreign exchange for several years to come. Significant efforts torestructure the agricultural sector and increase output are expected parti-cularly through Government encouragement of smallholder production and givingincentives, initially to maintain and later to increase agricultural outputfrom the commercial farmers.
17. However, Zimbabwe faces a formidable array of problems callingfor both immediate and long-term solutions. The immediate problems relate torehabilitation and reconstruction. The Government must mobilize substantialamounts of resources over a very limited period in order to remove criticalbottlenecks in the economy created by the war and the sanctions. In additionto the proposed rehabilitation of the manufacturing sector (see Section IV),plans are also underway for the rehabilitation of the transport sector andmassive investments will soon be needed for power generation. The annual costof the railway and power investments should about equal total gross fixedinvestment in 1979. Therefore, if these and other large capital requirementsare to be met, external assistance of about US$400 million a year for the nextfew years will be required.
18. Unemployment is another critical problem which must be addressedquickly. The Government is attempting to deal with this problem throughsettlement and resettlement programs and through improving capacity utilization.

-5 -
Relative to other African countries, Zimbabwe has a reservoir of skilled
manpower. However, in relation to the Zimbabwean economic structure anddegree of sophistication, the country is short of trained manpower; a problemwhich has been aggravated by migration following independence. Retention ofexisting skilled workers is an important reason for the Government's moderateand reconciliatory attitude after independence. In addition, serious effortsare being made to attract some 25,000 educated and skilled Zimbabweans back to
the country.
19. The most complex problem is going to be restructuring the economy in
a manner which will ensure equitable distribution of income and assets withoutjeopardizing growth. This implies integrating the African majority intoZimbabwe's economic mainstream. Plans are underway for land reform, develop-
ment of smallholder agriculture and establishing smallscale industries to
bring about the gradual redistribution of assets and integration of theAfrican population. Zimbabwe's longer run political and economic stabilitywill depend on how fast the Government makes progress in this area.
20. Zimbabwe emerged from fifteen years of sanctions and the war with
relatively low external indebtedness. In mid-1980, foreign debt totalledZ$451 million, and the country's gross international reserves equalled aboutZ$215 million or three months of estimated 1980 imports of goods. The externaldebt figure was the equivalent of US$98 per capita or about 15 percent ofestimated GDP. The debt service ratio, which is expected to be four percentin 1980, is projected to rise to nine and eight percent in 1981 and 1982respectively. These external indebtedness figures do not include foreignexchange obligations resulting from restrictions on the repatriation ofcertain monies by private individuals and companies. Although the exactamount of these is not known, they are not large enough to affect the overallpicture significantly. Consequently, given the low estimated debt serviceratios and the country's potential for growth and expansion, Zimbabwe clearlyis creditworthy for Bank lending. However, given Zimbabwe's massive external
resource requirements for reconstruction and rehabilitation, expected highinterest rates and relatively hard repayment terms, the future debt serviceratio seems certain to rise. Because of these large resource requirements,Zimbabwe needs to receive at least part of the external assistance required onconcessionary terms.
PART II - BANK GROUP OPERATIONS
21. Before 1965, the Bank made five loans totalling US$140.3 million,
benefitting Rhodesia -- two directly to the Government for agriculture(US$5.6 million) and power (US$28 million), and two loans totalling US$87.7million to the Central African Power Corporation (CAPCO) and a US$19 millionloan to the Rhodesia railways. As a guarantor of each of the loans, the UK
serviced them after 1964. The loans for agriculture and the railways havebeen repaid, and CAPCO resumed servicing its two loans, on which US$13.8million was still outstanding as of June 30, 1980, following the lifting of
sanctions in December 1979.

- 6 -
22. IFC's first investment in Zimbabwe was approved by the IFC Board
last month. The investment is in the form of a US$38 million loan of which
US$20 million is for IFC's own account, and US$18 million comprises commercial
bank participations in the IFC loan. IFC was also responsible for arranging a
further US$10.3 million of commercial bank financing related to a proposed
loan by the Export-Import Bank of the United States (Eximbank). The invest-
ment, in the Wankie Colliery Company Limited, is to help finance a project to
produce coal for a thermal power station presently under construction as well
as for other customers.
23. Following Zimbabwe's becoming a member of the Bank Group in September
1980, Bank staff discussed with the Government an initial program of corporation,
including the proposed Manufacturing Rehabilitation Imports Program and an
imports program to rehabilitate the transport sector. The latter, which is
scheduled for Board consideration later in FY81, would comprise (i) spare
parts and track maintenance equipment and tools for the railways; (ii) road
service motor vehicles; and (iii) equipment for the Central Mechanical Equipment
Department (CMED). Work on identifying and preparing projects in agriculture,
rural development, power, transport, manpower development and training and
industrial intermediation also is underway or shortly will be initiated.
PART III - MANUFACTURING SECTOR
24. Almost 75 percent of Zimbabwe's industries are concentrated in the
metropolitan areas of Salisbury and Bulawayo. The sector, dominated by
external investments from the United Kingdom and South Africa, is relatively
well diversified and sophisticated, producing almost 90 percent of the manu-
factured goods consumed in Zimbabwe. The most important industries are food
processing, metal and metal products, textiles, including cotton ginning,
chemical and petroleum products, drinks, tobacco and transport equipment.
Priority is given to manufacturing for exports, mainly food, beverages,
tobacco, metal and metal products and textiles.
25. Between 1965, when sanctions forced the country to turn more and
more to local production, and 1974, Zimbabwe's manufacturing industries grew
faster -- more than 4 percent yearly (in real terms) -- than did GDP.
However, as the war intensified and began to take its toll, manufacturing
output fell 13 percent between 1974 and 1978. With the general recovery in
economic growth, the performance of the manufacturing sector also started
improving after the war, expanding nine percent in 1979. However, there still
is substantial idle capacity in the manufacturing sector.
Constraints
26. Manufacturing output is limited mainly by shortages of foreign
exchange and skilled manpower. While the latter is important in the long
run, the foreign exchange shortage is immediately serious. In 1979 the
foreign exchange allocation to the sector was only about 35 percent of the
1974 level (in real terms). Even in 1979, output and employment failed to
reach their earlier 1974/75 peaks. Zimbabwe's textiles, clothing, furniture,
pharmaceuticals, toilet preparations, iron and steel, non-ferrous metals and
metal products, all have export markets in neighboring African countries
and/or overseas, as well as unsatisfied domestic demand. Adequate foreign
exchange, however, for imported spare parts, raw materials and equipment is
needed to expand production.
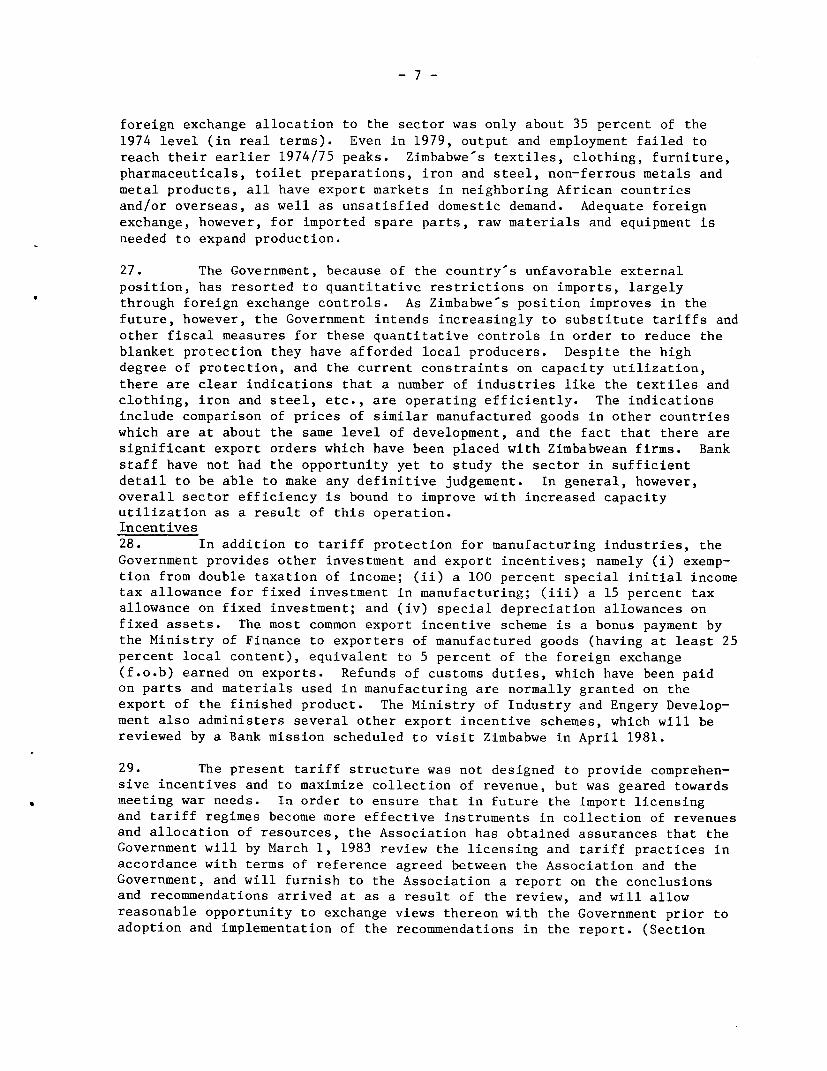
27. The Government, because of the country s unfavorable external
position, has resorted to quantitative restrictions on imports, largely
through foreign exchange controls. As Zimbabwe-s position improves in the
future, however, the Government intends increasingly to substitute tariffs and
other fiscal measures for these quantitative controls in order to reduce the
blanket protection they have afforded local producers. Despite the high
degree of protection, and the current constraints on capacity utilization,
there are clear indications that a number of industries like the textiles and
clothing, iron and steel, etc., are operating efficiently. The indications
include comparison of prices of similar manufactured goods in other countries
which are at about the same level of development, and the fact that there are
significant export orders which have been placed with Zimbabwean firms. Bank
staff have not had the opportunity yet to study the sector in sufficient
detail to be able to make any definitive judgement. In general, however,
overall sector efficiency is bound to improve with increased capacity
utilization as a result of this operation.Incentives28. In addition to tariff protection for manufacturing industries, the
Government provides other investment and export incentives; namely (i) exemp-
tion from double taxation of income; (ii) a 100 percent special initial income
tax allowance for fixed investment in manufacturing; (iii) a 15 percent tax
allowance on fixed investment; and (iv) special depreciation allowances on
fixed assets. The most common export incentive scheme is a bonus payment by
the Ministry of Finance to exporters of manufactured goods (having at least 25
percent local content), equivalent to 5 percent of the foreign exchange
(f.o.b) earned on exports. Refunds of customs duties, which have been paid
on parts and materials used in manufacturing are normally granted on the
export of the finished product. The Ministry of Industry and Engery Develop-
ment also administers several other export incentive schemes, which will be
reviewed by a Bank mission scheduled to visit Zimbabwe in April 1981.
29. The present tariff structure was not designed to provide comprehen-
sive incentives and to maximize collection of revenue, but was geared towards
meeting war needs. In order to ensure that in future the import licensing
and tariff regimes become more effective instruments in collection of revenues
and allocation of resources, the Association has obtained assurances that the
Government will by March 1, 1983 review the licensing and tariff practices in
accordance with terms of reference agreed between the Association and the
Government, and will furnish to the Association a report on the conclusions
and recommendations arrived at as a result of the review, and will allow
reasonable opportunity to exchange views thereon with the Government prior to
adoption and implementation of the recommendations in the report. (Section
- 8 -
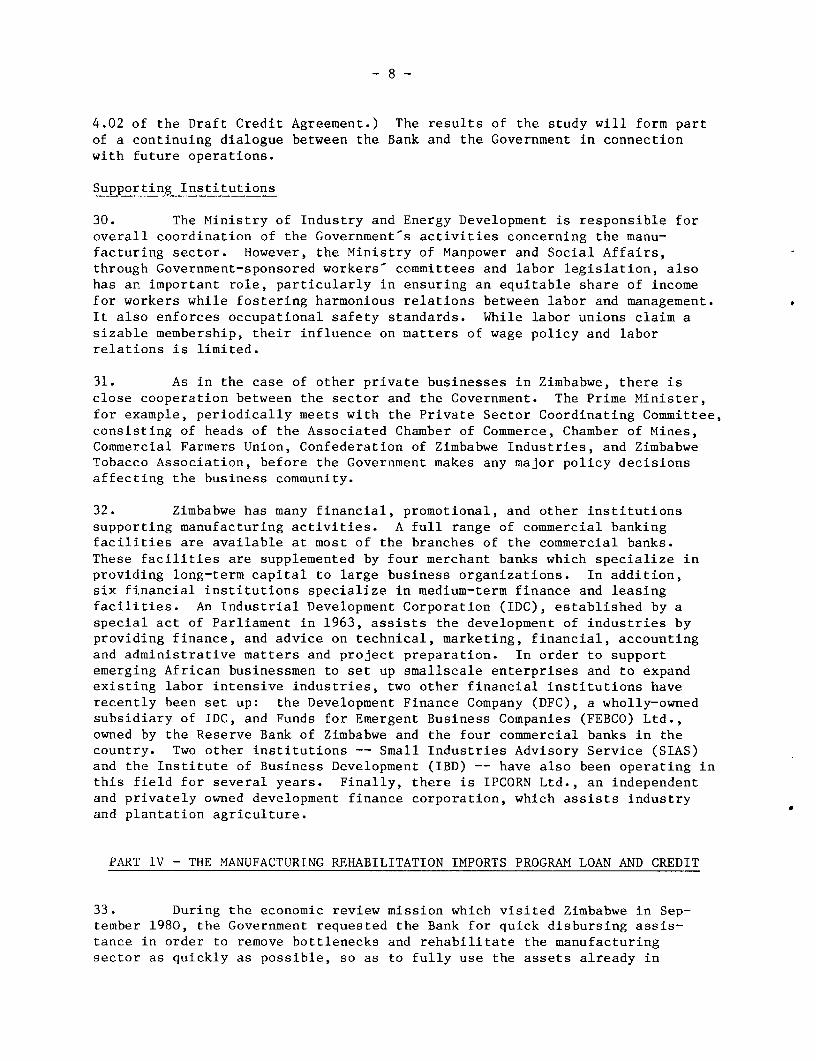
4.02 of the Draft Credit Agreement.) The results of the study will form partof a continuing dialogue between the Bank and the Government in connectionwith future operations.
Supporting Institutions
30. The Ministry of Industry and Energy Development is responsible foroverall coordination of the Government's activities concerning the manu-facturing sector. However, the Ministry of Manpower and Social Affairs,through Government-sponsored workers committees and labor legislation, alsohas an important role, particularly in ensuring an equitable share of incomefor workers while fostering harmonious relations between labor and management.It also enforces occupational safety standards. While labor unions claim asizable membership, their influence on matters of wage policy and laborrelations is limited.
31. As in the case of other private businesses in Zimbabwe, there isclose cooperation between the sector and the Government. The Prime Minister,for example, periodically meets with the Private Sector Coordinating Committee,consisting of heads of the Associated Chamber of Commerce, Chamber of Mines,Commercial Farmers Union, Confederation of Zimbabwe Industries, and ZimbabweTobacco Association, before the Government makes any major policy decisionsaffecting the business community.
32. Zimbabwe has many financial, promotional, and other institutionssupporting manufacturing activities. A full range of commercial bankingfacilities are available at most of the branches of the commercial banks.These facilities are supplemented by four merchant banks which specialize inproviding long-term capital to large business organizations. In addition,six financial institutions specialize in medium-term finance and leasingfacilities. An Industrial Development Corporation (IDC), established by aspecial act of Parliament in 1963, assists the development of industries byproviding finance, and advice on technical, marketing, financial, accountingand administrative matters and project preparation. In order to supportemerging African businessmen to set up smallscale enterprises and to expandexisting labor intensive industries, two other financial institutions haverecently been set up: the Development Finance Company (DFC), a wholly-ownedsubsidiary of IDC, and Funds for Emergent Business Companies (FEBCO) Ltd.,owned by the Reserve Bank of Zimbabwe and the four commercial banks in thecountry. Two other institutions -- Small Industries Advisory Service (SIAS)and the Institute of Business Development (IBD) -- have also been operating inthis field for several years. Finally, there is IPCORN Ltd., an independentand privately owned development finance corporation, which assists industryand plantation agriculture.
PART IV - THE MANUFACTURING REHABILITATION IMPORTS PROGRAM LOAN AND CREDIT
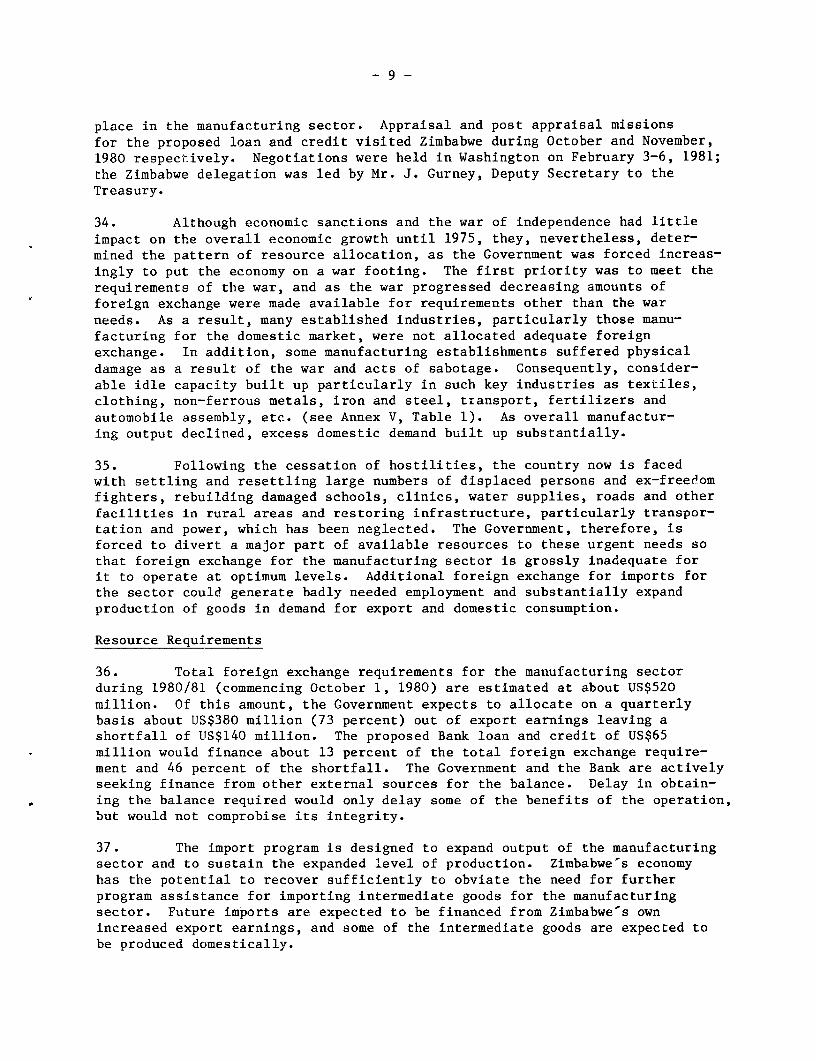
33. During the economic review mission which visited Zimbabwe in Sep-tember 1980, the Government requested the Bank for quick disbursing assis-tance in order to remove bottlenecks and rehabilitate the manufacturingsector as quickly as possible, so as to fully use the assets already in
- 9 -
place in the manufacturing sector. Appraisal and post appraisal missions
for the proposed loan and credit visited Zimbabwe during October and November,1980 respectively. Negotiations were held in Washington on February 3-6, 1981;the Zimbabwe delegation was led by Mr. J. Gurney, Deputy Secretary to theTreasury.
34. Although economic sanctions and the war of independence had little
impact on the overall economic growth until 1975, they, nevertheless, deter-mined the pattern of resource allocation, as the Government was forced increas-ingly to put the economy on a war footing. The first priority was to meet therequirements of the war, and as the war progressed decreasing amounts offoreign exchange were made available for requirements other than the warneeds. As a result, many established industries, particularly those manu-facturing for the domestic market, were not allocated adequate foreignexchange. In addition, some manufacturing establishments suffered physicaldamage as a result of the war and acts of sabotage. Consequently, consider-able idle capacity built up particularly in such key industries as textiles,clothing, non-ferrous metals, iron and steel, transport, fertilizers andautomobile assembly, etc. (see Annex V, Table 1). As overall manufactur-ing output declined, excess domestic demand built up substantially.
35. Following the cessation of hostilities, the country now is facedwith settling and resettling large numbers of displaced persons and ex-freedomfighters, rebuilding damaged schools, clinics, water supplies, roads and otherfacilities in rural areas and restoring infrastructure, particularly transpor-tation and power, which has been neglected. The Government, therefore, isforced to divert a major part of available resources to these urgent needs sothat foreign exchange for the manufacturing sector is grossly inadequate forit to operate at optimum levels. Additional foreign exchange for imports forthe sector could generate badly needed employment and substantially expandproduction of goods in demand for export and domestic consumption.
Resource Requirements
36. Total foreign exchange requirements for the manufacturing sectorduring 1980/81 (commencing October 1, 1980) are estimated at about US$520million. Of this amount, the Government expects to allocate on a quarterlybasis about US$380 million (73 percent) out of export earnings leaving ashortfall of US$140 million. The proposed Bank loan and credit of US$65million would finance about 13 percent of the total foreign exchange require-ment and 46 percent of the shortfall. The Government and the Bank are activelyseeking finance from other external sources for the balance. Delay in obtain-ing the balance required would only delay some of the benefits of the operation,but would not comprobise its integrity.
37. The import program is designed to expand output of the manufacturingsector and to sustain the expanded 'Level of production. Zimbabwe's economyhas the potential to recover sufficiently to obviate the need for furtherprogram assistance for importing intermediate goods for the manufacturingsector. Future imports are expected to be financed from Zimbabwe's ownincreased export earnings, and some of the intermediate goods are expected tobe produced domestically.

- 10 -
Allocation of the Manufacturing Imports Program Loan and Credit
38. Foreign Exchange. The proposed loan of US$50 million and credit
of US$15 million would help to finance imports of raw materials, spare parts,
balancing equipment and components. Only those goods needed for raising the
utilization of existing manufacturing capacity, and for which the Government
issues licenses would be eligible for Bank/IDA financing. Consumer goods
and capital items would be excluded (see Annex IV). To permit maximum
flexibility in utilizing the loan and credit, no industry by industry alloca-
tion is proposed.
39. Counterpart Funds. The Zimbabwe dollar equivalent generated by
the loan and credit would be credited to a special Government account in
the Reserve Bank of Zimbabwe to finance development projects in the Central
Government budget. Transfers from the project account would be made by the
Government periodically and reported to the Bank (Section 3.02(a) (iii)
of the Draft Credit Agreement).
Procurement
40. Procurement by private firms would be according to procedures
satisfactory to the Association. The commercial sector in Zimbabwe is
sufficiently diversified and competitive to ensure efficient procurement.
Procurement by public sector agencies would follow the procurement procedures
of the Central Tender Board. All purchases by Government and public sector
agencies exceeding Z$500 in any single year must be approved by the Central
Tender Board, 'which requires either competitive bidding or submission of more
than two quotations from different suppliers. However, all purchases in
excess of US$4 million would be procured on the basis of procedures which
include broad international tendering. The latter contracts would be subject
to ex post review, that is, a brief report containing evidence that each was
let in a manner satisfactory to the Association, would be submitted prior to
or with withdrawal requests.
41. In order to expedite early use of the loan and credit proceeds,
existing import licensing and foreign exchange allocation procedures which
were reviewed and found satisfactory, would be used. The Treasury allocates a
global sum of foreign exchange to the Ministry of Industry and Energy Develop-
ment on a quarterly basis. The latter allocates specific amounts for various
end uses and issues import licenses in accordance with the Government's
economic priorities. Within the manufacturing sector, priority has been
assigned to imports for the export subsector. The amount of foreign exchange
allocated to each importer does not exceed three months requirements.
Disbursements
42. The proposed loan and credit would reimburse the c.i.f. cost of
eligible imports against full documentation, including copies of invoices,
bills of lading and import licenses endorsed by the respective commercial

- ii -
banks as evidence of payment. (All merchandise imports are paid for through
the commercial banks.) The commercial banks would submit copies of documents
of eligible imports to a special unit to be set up in the Reserve Bank of
Zimbabwe, provided: (i) such goods have been procured in member countries,
Switzerland and Taiwan; (ii) each eligible invoice is of a minimum value
US$5,000 equivalent; (iii) invoices in respect of contracts in excess of
US$4.0 million equivalent have been accompanied by an evaluation report of
bids or quotations received certified by the Ministry of Industry and Energy
Development.
43. Because of the country's urgent need, it is proposed to permit retro-
active financing of eligible imports paid for on or after a date three months
prior to Board Presentation up to an amount not exceeding US$6.5 million
equivalent or 10 percent of the loan and the credit amount. No reimbursement
would be made for imports for which other sources of financing have been
secured. The exclusion of items costing less than US$5,000 equivalent would
not create any hardship, as these items can be covered by the Government's
resources. Disbursements should be completed within nine months from effec-
tiveness.
Accounts Audit and Evaluation
44. The project account (para. 39) would be audited by auditors accept-
able to the Bank and to the Association and certified copies of the relevant
financial statements submitted to the Bank and the Association by September 30,
1982. The Borrower will maintain records adequate to monitor project imple-
mentation. Furthermore, not later than six months after completion of the
project, the Government would prepare and furnish to the Bank and Association
a completion report on the costs and benefits resulting from the operation.
Benefits and Risks
45. The principal benefits of the proposed imports program would be
increased production of manufactured goods, utilizing capacity which other-
wise would be idle, greater exports and more employment. Of the expanded
production, 15 percent is expected to be exports valued at about US$50 mil-
lion per annum. The balance of output mostly would be import substitu-
tion worth about US$300 million in foreign exchange. The increased supply
of manufactured goods for domestic consumption would help materially to
reduce the large amount of unsatisfied domestic demand. Equally important is
the fact that the import program is expected to generate about 8,600 additional
jobs. Finally, the assistance would provide a vehicle for a dialogue on key
policy areas relating to licensing and tariff practices.
46. Given the Government's ability to administer the program and Zimba-
bwean manufacturers' ability to use it to expand production and employment,
there are no appreciable risks in the program per se. However, present
unsettled conditions in the country obviously are of concern, since they

- 12 -
could result in serious-economic dislocation. Future stability, however, willdepend in good part on how quickly the economy can respond to present demandsfor raising output and expanding employment -- two key areas in which theproposed imports program for the manufacturing sector is designed to make animportant contribution.
PART V - LEGAL INSTRUMENTS AND AUTHORITY
47. The Draft Loan and Development Credit Agreements between theRepublic of Zimbabwe and the Bank and the Association, the Report of theCommittee provided for in Article III, Section 4(iii) of the Articles ofAgreement of the Bank and the recommendation of the Committee provided for inArticle V, Section l(d) of the Articles of Agreement of the Association arebeing distributed to the Executive Directors separately.
48. Special conditions of the project are listed in Section III ofAnnex III.
49. I am satisfied that the proposed loan and credit would comply withthe Articles of Agreement of the Bank and the Association.
PART VI - RECOMMENDATION
50. I recommend that the Executive Directors approve the proposedloan and credit.
Robert S. McNamaraPresident
By Ernest Stern
AttachmentsWashington, D.C.March 5, 1981

ANNEX I-13 - Page 1 of 5
ZIMBABWE - SOCIAL INDICATORS DATA SHEET
ZIMBABWE REFERENCE GROUPS (WEIGHTED AVE8jAGESLAND AREA (THOUSAND SQ. KM.) - MOST RECENT ESTIMATE)-
TOTAL 391.0AGRICULTURAL 73.4 MIDDLE INCOME
MDST RECENT MIDDLE INCOME LATIN AMERICA &1960 /b 1970 /b ESTIMATE /b AFRICA SOUTH OF SAHARA CARIBBEAN
GNP PER CAPITA (US$) 220.0 310.0 470.0 868.0 1562.9
ENERGY CONSUMPTION PER CAPITA(KILOGRAMS OF COAL EQUIVAL.ENT) 558.0 692.0 579.0 699.4 1055.9
POPULATION AND VITAL STATISTICSPOPULATION, MID-YEAR (MILLIONS) 3.6 5.3 6.9URBAN POPULATION (PERCENT OF TOTAL) 12.6 16.9 21.7 28.9 63.4
POPULATION PROJECTIONSPOPULATION IN YEAR 2000 (MILLIONS) 13.4STATIONARY POPULATION (MILLIONS) 37.0YEAR STATIONARY POPULATION IS REACHED 2105
POPULATION DENSITYPER SQ. KM. 9.2 13.6 17.7 61.7 28.1PER SQ. KM. AGRICULTURAL LAND 52.6 72.7 94.2 126.0 81.7
POPULATION AGE STRUCTURE (PERCENT)0-14 YRS. 45.4 46.5 47.1 45.5 41.4
15-64 YRS. 51.8 50.8 50.2 51.6 54.765 YRS. AND ABOVE 2.7 2.7 2.7 2.8 3.9
POPULATION GROWTH RATE (PERCENT)TOTAL 4.0 3.9 3.3 2.7 2.7URBAN 5.8 6.8 6.6 4.9 4.1
CRUDE BIRTH RATE (PER THOUSAND) 46.7 47.5 48.1 46.8 34.8CRUDE DEATH RATE (PER THOUSAND) 19.0 14.9 13.6 16.4 8.9GROSS REPRODUCTION RATE .. .. 3.3 3.2 2.5FAMILY PLANNING
ACCEPTORS, ANNUAL (THOUSANDS) .. ..USERS (PERCENT OF MARRIED WOMEN) .. .. 5.0
FOOD AND NUTRITIONINDEX Of FOOD PRODUCTION
PER CAPITA (1969-71-100) 76.0 93.0 124.0 94.0 106.9
PER CAPITA SUPPLY OFCALORIES (PERCENT OF
REQUIREMENTS) 102.0 96.0 108.0 92.7 107.4PROTEINS (GRAMS PER DAY) 68.8 68.6 73.4 53.0 65.6
OF WHICH ANIMAL AND PULSE 18.8 20.9 20.4 15.6 33.7
CHILD (AGES 1-4) MOB ALIIY RATE 28.0 .. 16.0 21.3 8.4
HEALTHLIFE EXPECTANCY AT BIRTH (YEARS) 45.0 51.6 53.6 50.1 63.1INFANT MORTALITY RATE (PERTHOUSAND) .. .. .. .. 66.5
ACCESS TO SAFE WATER (PERCENT OFPOPULATION)
TOTAL .. .. .. 31.0 65.9URBAN .. .. .. 66.8 80.4RURAL .. .. .. .. 44.0
ACCESS TO EXCRETA DISPOSAL (PERCENTOF POPULATION)
TOTAL .. .. .. .. 62.3URBAN .. .. .. .. 79.4RURAL .. .. .. .. 29.6
POPULATION PER PHYSICIAN 4794.0 6372.0 7028.0 14508.2 1849.2POPULATION PER NURSING PERSON 1014.0 1361.0 1375.0 3279.5 1227.5POPULATION PER HOSPITAL BED
TOTAL 249.0 249.0 371.0 1141.5 408.3URBAN .. ..RURAL .. ..
ADMISSIONS PER HOSPITAL BED .. ..
HOUSINGAVERAGE SIZE OF HOUSEHOLD
TOTAL .. ..URBAN .. ..RURAL .. ..
AVERAGE NUMBER OF PERSONS PER ROOMTOTAL .. ..URBAN .. ..RURAL .. ..
ACCESS TO ELECTRICITY (PERCENTOF DWELLINGS)
TOTAL .. ..URBAN .. ..RURAL .. ..
- 14- ANNEX IPage 2 of 5
ZIMBABWE - SOCIAL INDICATORS DATA SHEET
ZIMBABWE REFERENCE GROUPS (WEIGHTED AV9 AGES- MOST RECENT ESTIMATE )_
MIDDLE INCOMEMOST RECENT MIDDLE INCOME LATIN AMERICA &
1960 /b 1970 /b ESTIMATE /b AFRICA SOUTH OF SAHARA CARIBBEAN
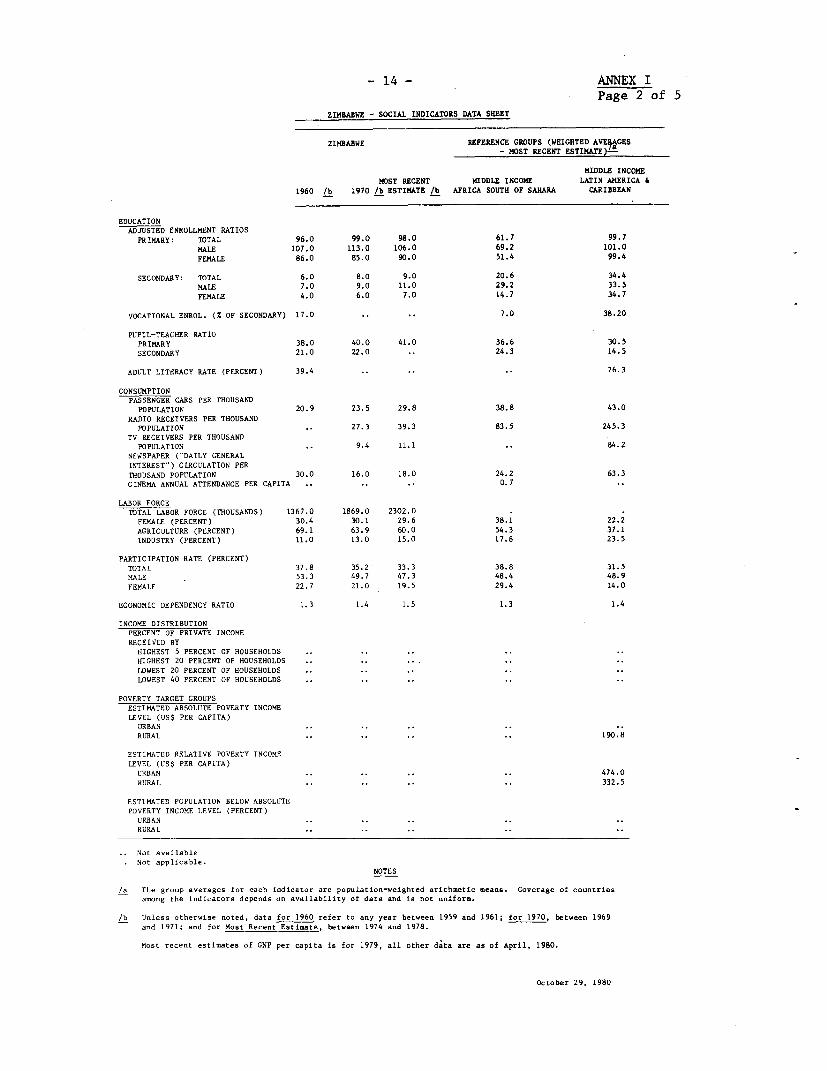
EDUCATIONADJUSTED ENROLLMENT RATIOS
PRIMARY: TOTAL 96.0 99.0 98.0 61.7 99.7MALE 107.0 113.0 106.0 69.2 101.0FEMALE 86.0 85.0 90.0 51.4 99.4
SECONDARY: TOTAL 6.0 8.0 9.0 20.6 34.4MALE 7.0 9.0 11.0 29.2 33.5FEMALE 4.0 6.0 7.0 14.7 34.7
VOCATIONAL ENROL. (X OF SECONDARY) 17.0 .. .. 7.0 38.20
PUPIL-TEACHER RATIOPRIMARY 38.0 40.0 41.0 36.6 30.5SECONDARY 21.0 22.0 .. 24.3 14.5
ADULT LITERACY RATE (PERCENT) 39.4 .. .. .. 76.3
CONSUMPTIONPASSENGER CARS PER THOUSAND
POPULATION 20.9 23.5 29.8 38.8 43.0RADIO RECEIVERS PER THOUSAND
POPULATION .. 27.3 39.3 83.5 245.3TV RECEIVERS PER THOUSAND
POPULATION ,. 9.4 11.1 .. 84.2NEWSPAPER ("DAILY GENERALINTEREST") CIRCULATION PERTHOUSAND POPULATION 30.0 16.0 18.0 24.2 63.3CINEMA ANNUAL ATTENDANCE PER CAPITA .. .. .. 0.7
LABOR FORCETOTAL LABOR FORCE (THOUSANDS) 1367.0 1869.0 2302.0
FEMALE (PERCENT) 30.4 30.1 29.6 38.1 22.2AGRICULTURE (PERCENT) 69.1 63.9 60.0 54.3 37.1INDUSTRY (PERCENT) 11.0 13.0 15.0 17.8 23.5
PARTICIPATION RATE (PERCENT)TOTAL 37.8 35.2 33.3 38.8 31.5MALE 53.3 49.7 47.3 48.4 48.9FEMALE 22.7 21.0 19.5 29.4 14.0
ECONOMIC DEPENDENCY RATIO 1.3 1.4 1.5 1.3 1.4
INCOME DISTRIBUTIONPERCENT OF PRIVATE INCOMERECEIVED BY
HIGHEST 5 PERCENT OF HOUSEHOLDS .. ..HIGHEST 20 PERCENT OF HOUSEHOLDS .. .. ..LOWEST 20 PERCENT OF HOUSEHOLDS ..LOWEST 40 PERCENT OF HOUSEHOLDS .. ..
POVERTY TARGET GROUPSESTIMATED ABSOLUTE POVERTY INCOMELEVEL (US$ PER CAPITA)
URBAN .. ..RURAL .. .. .. .. 190.8
ESTIMATED RELATIVE POVERTY INCOMELEVEL (US$ PER CAPITA)
URBAN .. .. .. .. 474.0RURAL .. .. .. .. 332.5
ESTIMATED POPULATION BELOW ABSOLUTEPOVERTY INCOME LEVEL (PERCENT)
URBAN .. ..RURAL .. ..
Not availableNot applicable.
NOTES
/a The group averages for each indicator are population-weighted arithmetic means. Coverage of countriesamong the indicators depends on availability of data and is not uniform.
/b Unless otherwise noted, data for 1960 refer to any year between 1959 and 1961; for 1970, between 1969and 1971; and for Most Recent Estimate, between 1974 and 1978.
Most recent estimates of GNP per capita is for 1979, all other data are as of April, 1980.
October 29, 1980

- 15 - ANNEX IDEITIN OFlOCIAL fIN1ICATORS Page 3 of 5
* :h-gh the data Io.da . rc sources . generlly judged the most sArharitetie and, reial, It ohoold ' also h sted that they may not be later-sloa..- -operable becus atwh tack of _sd-rdi-d defiwita.s cod t_soeto used by defteorat cosoite to -ol_terl the data. The date r. osthel1-, a-foi to da..triho ardors of agisudo, idic-tn treads, cad obh-ctorae cetain ajor differece heoaeco... ew
Theororwa groups are.i rh -am -oa y grap of the m-bJert I.setry wed 127 Arcastry grop with weaa lhnoog s eta h aer rsaf th wh b.ti auI.. (aetfr"oie upa i opres rs bn Cdl 'aw sooth Iowo-an tiddml fawn isa Imrh:.aa of swe-yoer.oio....al. ff.. iel Is.. teofroegap done rho nrae npopalesosweghe eih-eio oo fo -inh isdi--o cod sh-w sIy chew as
least halt' at -bif.mti t teagra asdt faMht tid.toe." sito- the a-erge of onoro me thn lediItetor depeeds 00tho crclsite fodat co asoatosior, o-tmlo mut he__ oarisnd Ie onlati.g -v_eges If so_aiao t ote.Tbeeseeesaerl ena woact h auof ..n odloat-1at uterim -9no the acuetry ewd ref-rTh.groups
Ttl- Totalsrseae ~rwn sdae o nednrr icw qualified tr eia oola errtylvlAgT-1trl-itmaea giuwac ncue tmoeiya prenty PotcittnBrsw ssaPnpuict iaodiided b by -thio o 9rat hyisfoo crops, peoru,,aknt cod ktioh-o ga-dee or to lie gallon; 1977 dcm. mleso femal gra I st_ sunes _ rrcolouss,ed aists us
tOP fb dPTi (0)1 lP-pr ac pita esnimat- at orr-nt maker Price, Iam- ah,aorul)diddbteiorsetnecbraf hsialbdoulrn by9sam convers1ion mthed Aa World Barb Atlas (iP-79 hbs is): 190hrtal.ephloadpiaegwna n poeie epita1 bsirs1070 uc 197997 da60a. bibtlraIaaaeorar d Ooplta-t are-- e-abIamsapewwl efo
ENfERGY CONSUMPfTION Ott CAPITA - A.-ewc cossumptiso of byetaoefy(ol or ar oc..t ... olthded. toEtal bnsitcs. haweve.. idgpiwolephelth an mdis
tti t)It kilorm atPe qavlo perapita; 1960, 1970. sd 1970 -id-, ifait, era.) hbioh otter iw-Pat int a_tidstiom asd P-ovide deto. ~~~~~~~~~~~~~~~limited t-9g of medira1 tf-ilitie. Par srttistiegl -purpse aebia hsapi-
POPULATION AND VITAL STATISTICS t.~~~rol isolade WHOs poiwotoci ge..erwl aiseialieed hospitals, an nataOPT.AtII Ot iA.IAITIihsisalclw otlhsiasa etaladmtriyrnes- Totsl Pooslattan.Mtd-te- fmillino) - s f Joly 1; a96ot, 1970, cod 107B h-lste Oit ct 1 o-1 a ned1 h- intaljumed sot. admusito waoriity cgdetba - tramt illpi--la dtttidsdIhythe euben no be.ds.- .. tdiff tsI ofota f urban arsemy a.t-t o-pcability 00 dc.a HOUSINGamamfC.uteict; 1960, 1970, amd 1970 dcw.tAeaeie tOusad .oesprhsead.-ttl ra.aderl
Popoltc tnntn A hosashni1d ooIsms at: af geo9 p at iwdiid-s1s who shaeliving q-at-e_ali.tnois rear. 2000 - torrent popaloeln pr-Je-iou wee base.d no 1900 And thet main al.Ihadro ogrso_rmyreh wlddto-tal poP -eto -h age as t a te sod _~i thhir aIta.tp an Asslwrts the hoo...hold foo mottieticaI prosePruEaIowprmoesformraityi- rate ...eim nothe lees e - A.ng cam.ber of p......ss pt rao - total. urhaw, and rural - macageumion110 5I enet-,,y at hitth nnaso Pb,outr' perraita Imot o o esbeprrot in 1 allora- -- d norl -orpisdtoenil
MIe, o fsl lito nwpec-aey trbilietog'at 77.5 year. The PAra- dreljiags, reapeativ_ly. D.llwsllegmeldonpranttuttamotor for fertility rate elno ban thne- levels -o-igdelw o u,omcpied p-rt-.
Iaahaao_y Is themt asignd- eo these sir -obisati-m fmtaiy Gsnoaa olig theettiyi iigqatr spn tgcd fertility treds_foe p-jlscimm pue.p_ss dt ota,s ian gco meal dec11is teaptoivl.gq t p- tg
rho ithet I a equal tn the death rtet, sadcls the g strutr- n-- OtTma. raw .tmorat. This Iw athievd aw1y after fertilitn rtes deln to ilsdeanmetiloibs repiwoemt Inuel of anit rut reprodItmiam raw, oh e ao serta Primary Eohoal -t Rtotl aecd eae-_-m oa,mlewdfs
of oteerepaoe usehismarly.Thestaiamry opalmio wie os rrowem of all agre t the pri-ay lee aspret-s fosstnemniated w th haws ofthe praJcted eh~an.o.eriatis of the Pmulia priar sehoal-age poplaim oralyimldes trhildm aged 6-11to theyea 20i0, sod the -tar ofd lIs of ferility rate to bel -yas u dud t far ditf_re_ lengths of pnieary edoeatilm; fee
want lord. oaowmr~~~~~~~~~~~ill with usivers1 edaIttice ecrolmet map weosd lii Pen-teTsar a-tiltsy .popletian Ia ranehd - The pea chew attia...np papulariom siet sam pupils are ho1o -t bhov the fftiriu1 soham1 sge.s..ine ha b... -sshed. imo.. d. rrYotool - tota.1 male ted fs - Compatsd as shon; serawdanyPaulr ... eita eds-tirm reain At leas.t foot -yer Ai apprrd primar isatnsties;Pe s -a - Mid-yea popalatin Pen square kilas-t- (IGO ha-me-) of pe BdsgerltPotoa,o echroamw m tyatosto ai
total ares. usually~,1. f. I.d o,f 12 to 7yasa.g;arepmeo ore r eesl
osbly. VI'otiosl_ nnlmat(en_o_t f.....dry v- rtio...l imatitatiomsPritiar Age titoot-ne (-Eea) -hild-e (B-li years), warkio9-ag (15- imelude t-ohaio1, ifdmt1is1, or thce programs whih oposte iwd.pes-h4 sans) wed rtied (is year so vr speet`ssgs of mid-psen PtPO- dently -e 5 depa--eto of.....nde-yraittoslatiam; 1960, 1970 , ard 197g don. Pnu-tahe ratio - pei-aro. sod we-nmdra Toa tdte rlld BafPuia1tion Gramth Rate foeracer) - mora - dAnsa.l groeth rtes. of total mid- primary;. wd Is....dwry lerelsdilided by mothebrstof twae.hsr it thcy-s Ppopultio_ far 1950-6, 19 60-P0, aud 1970-70. rorropondig enI_s.
P-nclgtta itrt-h mato Ireret-) -urhus- SAssl- groth rato of uohb ppO AfL.t lirt-a-yrte pert)-Litertet adulle (able to red cud maims)aisaOr 90-h, 1960-70, and 1970-PB. aopetor-tag of tonal adult population egd 15 y--r amdovrrue Brh tAme (nc eosd) - mAn-a live bieths per obsge f- i-ya
yapulatitc; 19t61, 197t1. eI1976 deta. CoiowinCrud loath'ft (per t=sad) - A-sul deaths Per tho..s..d of mId-yeer Pas atte (o hoosed Poplto)-Pse.e osamns ap6use ; 196, 1970. sod 197g dsta Eesstiglsmta sight persona Iolde nhb sns ha.resadCroos leraduoni9o R Aus -Arag uben at d-sghtsr- a na ill hear In t-inry ne.htcn
hrmon -rprod-tive p-itd if ah. empeit..e. pre....t agesr If Or9e- tdiamcerr (ctosedponsiiotl- All types of -e-irers f- atrditi.ityrmrs;as..l.0 in-pac argoa esdisg it 1960, 190,ad 197y. hb-drc... 00 gesera.l- public perah sd a oplton alodas .. li-family Pemaiwo-Aasntors danu..I_(tho....wds) - dA..aome fcaetn asnsadortesiourlcdinyaswwrgirtim fndnse
of ~hit-eant-l drioa wedcr aspies of matio..el family PLarwiu prga. rst fet aafrrrm p nmymnh aprhessemsFamIly PIanims -fursfece fmridmts -I.Pffoattags-of marriedt youemYictahn-pt...dblicansiag.arme of ahild.-bh..tII ag.e 15-44 y-sns-) oho sea hirth-ostra1 d-nio- to TV eeon (m- thousand bpanultio) - 10v rme-i--r for hradraet toall _ mrid esoinsm aegoP. gs..o-1 publia per rhaussed population; noludna usli-onsd TVl -eri-e
FOOD AND MUnITION H~~~ ~ ~~~~~~~~iwonntiI ed te years cherAgittis f TV asts was Is effect.POOP step noTeITIut sewepaper Circalomior (pee thasgsi ad uet Sh)-ihste snersge tIrtl-aind of Pond Mroueio ne .ais(1969-71li Inda apeeaitaccs -- 1 of "Ashy genen-l irte-et meppr ,do imds p-ntdita1 pb-Peodriu of ll,fo --- aditics. Pradaeiaelda ed eIfe ad li-ti-o fw-ttd primaily no -eoeingg Iea ses Itis roesideredIa onon-dar y-c hsais,. Gosaditiea cover primay Agos(e.g. augar-os tm ha "da11y" if itsppesrss lewan.. toot. time a. week.1-isamdo ugr hc aeeilmdIrotdm utiets(a.g. toffees..em oaiAtedsepttpn per earBasedanthe sambn atteauenoldd. Aggregate prodnatiot of oah -outry Is based Ottirk-t sold during the y-a, itutga snsto frire-iwoiw-sntional average produ..st price weights; 1961-65, 1970, amd 1970 dataadmhteoua
Pe .cPita upply of a.J.ries neo tw of siaat)-Compare froeerr gy eqoiv-lot of wet fond supplies e-alsbie Is ona_try Per _cPit. LAgOR FORCtper day. Ar-ilhl supplies r-priss dometic pr-d-tian, imparts less -TotallbrFoe toeue ionmirIly arive p-rsmns i-eldinguporto, and ah:tg, Is stt.lesspineeeue smlfed edskr fre n Nnoplyndbu enlatm bsein, atud-ts, teqwtitios usd In food prnt...m. il e,d lossIs distrihtibw. eur- liir in aroitcunris r ou comarble; 160, 197 cad
sentswsecs-lmtef by PAO hs.adowpyiolagina1 t..sd for wor-I c-i- 1978 dora.af o elh. eatderieg en taua temPerture, body a-ights, wfe Femal (perrent F-1fsna bn Ieharfo .t as ..rcrgs ofhoel b- fare..snd san distribution of papslatiaw, awd al11-iog 10 pentest far awte at Acetluo(eca)-lhrfre ofrig octy ote e
houseold lvel; 9h1-6. 19P. ctd1077 ata.fishismasg nreeg f total labot forte; 1906, 1970 sod 1918 dat.Pe o Iia uolo f pusefem c _s)-Poencnomo e wpita twiuttra_(nroe.st) - Labor fIoce In 'nioig,coruainmafarrgset suPply of f sod pen day. Bet supply of food It defited go chore. iO n ltecr,wttadgsa p_etg fttllbrfrs 90qairome-t far.1 all ..ostnie etablished by USDA ponnide fOt mitiot 1970sad1970ity data. dg. - tg tt1Ibtf 90sll.-u. of 60 go-a f a .t moa tio Pan dsy and 20 gram of animal and _at7 te gt rrsti otl ml, ad female - Pstrieipetto aPulse1 p-atei, of which 10 gEams sh-ad heaimal pti.. These -tad- satin try -- t-s ate c nd a os, ae udfml labor fate mara_oeIowrthaa these at 75 geam of tota1 protein wed 22 gram of Pan_ tnges of tate,mtanfeloPoplcts f luae n-opsomi-eI;
aees peisaanaegsfetewrdprpsdpPOisteTid 1960, 1970, wef 1975 data. TO es el7.' prieptiowestssest'lsetimgfoid PIdBsny; t961-65, 19P0 aud 1977 data. ags A-wetrorefthe pePoetio-, sod beg time tres.d. A few stia-Pe rpio rtein snafo w ladnla- Pro eis supply atfood de- mmE_ are _ roweamptl ous
ftird from a..-I. asd pulses in gram per day; 1961-65, 1970 sod ioyy daa ooir eeser Rato t nml of PoPu1atiom usd00 15 sad 65 en rsChild (ages 1-A) ttcttalitv Rsta (oar shausod) -A a..ouI deaths Pot thasead in tSoLtetta aorfreago group i-A y-ar, to ohildrem Im this age gn_p Oar taut developing onus-ttries data ud-nvd form life tables; 1960, 1970 aed 1977 data. INtiOME DISiTIBUTION9
HEALTH 5~~~~~~~~~~~~~~~.Pn~eratcg of tto c.-e (barb Bo seh sod kind) -ReaIedhOtbafEALTO I per~~~~~~~~~Aot, oirhest 2 _peoet, _o e 00 '.P.noea, andpors Ab pseeat
Ai birth; 19069 1970 sod 1978 dats.. ..isfast Matlit, ae(w th,aed A- wl destha of anft.wt nde- see yea rOnu TARGTI GROUPSat ags.; pee .ieasd lIve I"nhs IsiasdAsltePnm tot evl(5 ra.si -shnsd ru.s-A.....tOas Wter .con r osain -taL. ua , wd nata - Abslae ovrtpimon lrn amwa maslvlblwoib5siiaBamb- ofpeople (total.1 ha, sod rus)wt os ble ots to saf .totitiasa11 adequate dies pl .. s....tia1 sine-fond cequire-etm ta matwatr enppl'y (Isoludes treatsd safeos waters or sut-ted hat us-toainted affordable.octet ... b hstht fter prtote.td bh.rshele, aprfwge, ad .. sitgey wells) a fE.timatd Relawit Poet ZA sname Level (Po peb anis - athtan mm- rurs1 -perrentages at the it r-spe-iv- pops.i_ms. Is so urb An arspubit Bus na epvryteuelvli m-hrdo vrg mpta
toomnam or tsndpst boted mt mar thaw 200 meter frem a h..s. .. y be P=eom .. amef the omry. Irbm inve ts derinsd team the ruralo:.,:Ide..nd as .being. ,thic remsble aea f.that house. I'nnlaes lve fasja-e1frhbs 00 ffne in rba se.ms.reaacble ta moldiply 0 atuhe h.us . a or maban of the basbal Esiaehouaio.1dsAmli Pnm soslvl nret ra
tally' soaerweds
dispuse mapeewtgs f shear reepso ti-s Papulatias. OEres.st d.a- Er...i sIrd tonal flat DIi.isiopisa may isrilds rho ea11atios sad disposal , with or withast tse..stmet, _pmoin Molpata wed Pemetinma Dsp-ntm tOabe1980of hama esertat md vests- -- rse by -ms-barss sYstam or the use of
pit prioies mmd siilseisslere

- 16 -ANNEX IPage 4 of 5
ZIMBABWE
ECONOMIC INDICATORS
GROSS NATIONAL PRODUCT IN 1979 (est) ANNUAL RATE OF GROWrH (%, constant 1965 priceS)
US$_Mln. % 196 5-70 l9 70 -7
GNP at Market Prices 4,083 100.0 6.2 2.5Gross Domestic Investment 670 16.5 9.1 -1.5Gross National Saving 515 12.6 4.8 -2.9Current Account Balance -147 -3.6Exports of Goods, NFS 1,230 30.0Imports of Goods, NFS 1,259 30.8
OUTPUT, LABOR FORCE ANDPRODUCTIVITY IN 1979
Value Added Labor Force1/ V. A. Per WorkerUS$ Min. ,'000 % US $ -7 of Average
Agriculture 482 12.4 334 33.8 1,443 36.7Industry 1,504 38.7 253 25.6 5,945 151.5Services 1,899 48.9 402 40.6 4,724 120.2Unallocated
Total/Average
3,885 100.0 989 ioo.o 3,928 100.0
GOVERNMENT FINANCE 2/ 3/General Government - Central Government-
1ln. % of GDP 3$ Million % of GDr_15-7 197 190 -7 197X79 1978/79 1978- 79
Current Receipts 580 23.4Current Expenditure - 806 32.5Current Surplus --7 7r.1Capital Expenditures 82 3.3External Assistance (net) 129 5.2
MONEY. CREDIT and PRICES 1974 1975 1976 1977 1978 1979(Million ZT outstanding end periodF
Money and Quasi Money 543 690 769 810 892 992Bank credit to Public Sector 77 134 211 219 212 199Bank Credit to Private Sector 485 642 680 730 711 724
(Percentages or Index Numbers)
Money and Quasi Money as % of GDP 29 34 35 37 38 38General Price Index (1964 = 100)A/ 131 144 161 180 197 223
Annual percentage changes insGeneral Price Index 6.5 9.9 11.8 11.8 9.4 13.2Bank credit to Public Sector 74.0 57.0 3.8 -3.3 -6.5Bank credit to Private Sector 32.3 5.9 7.4 -2.7 1.8
NOTE: All conversions to dollars in this table are at the average exchange rate of 19$ = US$1.58.
1/ Formal Sector employment only.7/ Figures do not differ significantly from "Central Government".3/ Fiscal year = July 1 to June 30.4/ Lower income group. .. not available
not applicableAUGUST 1980
EACP I

- 17 - ANNEX I
Page 5 of 5ZIMBABWE
TRADE PAYMENTS AND CAPITAL FLOWS
BALANCE OF PAYMENTS (US$ Millions) MERCHANDISE EXPORTS (US$ Millions and %)1975 1979
1977 1978 1979 Value (%) Value (%)(Millions US $)
Exports of Goods, NFS 960 1,060 1,213 Agricultural 2 359 (46) 408 (38)Imports of Goods, NFS -902 959 1,259Resource Gap (deficit = _) - Mining3/ 332 (42) 536 (50)
58 101 -46Interest Payments (net) -71 .. .. Manufacturing 77 (10) 68 (6)Workers' Remittances . -55 -70Other Factor Payments (net) .. .. ,. Other 32 (2) 62 (6)Net Transfers -24 -40 -35Balance on Current Account i7 5 -15 TOTAL 800 (100) 1,074 (100)
Direct Foreign Investment .. . .. EXTERNAL DEBT. DECEMBER 31, 19791/Net MLT Borrowing
Disbursements .. .. .. US $ MlnAmortizationSubtotal .. .. .. Public Debt, incl. guaranteed 350
Capital Grants .. .. .. Non-Guaranteed Private DebtOther Capital (net) Total outstanding & DisbursedOther items n.e.i -54 4Increase in Reserves (+) -91 49 -20 DEBT SERVICE RATIO for 1979-
Gross Reserves (end year) ,Net Reserves (end year) -27 139 237 Public Debt, incl. guaranteed 7.0
Non-Guaranteed Private DebtFuel and Related Materials Total outstanding & DisbursedImports 138 141 256of which: Petroleum(est) 100 120 230
Exports 11 12 15of which: Petroleum - - - IBRD/IDA LENDING,June 30, 1980 (Million US $):
IBRD IDARATE OF EXCHANGE
1979 Outstanding & Disbursed 13.8Undisbursed _Us $ 1.00 =US$ 0.63 Outstanding incl. Undisbursed 13.8Z$ 1.00 = US $ 1.58
1/ Estimate2/ Defined as edible food and fats plus non-edible agricultural output such as tobacco, cotton, forestry products,etcSI Defined as crude materials and minerals, gold and processed mining materials-mainly unfabricated metals. Mfuchof this might, by another classification, be considered manufacturing output.4/ Ratio of Estimated Debt Service to Exports of Goods and Non-Factor Services.
Not availableNot applicable
AUGUST 1980

- 18 -
ANNEX IIPage 1 of 5
STATUS OF BANK GROUP OPERATIONS IN ZIMBABWE
STATEMENT OF BANK LOANS AND IDA CREDITS TO RHODESIA(As of January 1, 1981)
Loan CreditNo. No. Year Borrower Purpose Bank IDA Undisbursed
Southern58-0 1952 Rhodesia Electric Power 28.00 - .00253-0 1960 Southern Southern Rhodesia African
Rhodesia Agricultrue 5.60 - .00
Total 33.60 - .00of which has been repaid 33.60 -
Total now outstanding .00 -Amounts sold 25.34
of which has beenrepaid 25.34
Total now held by Bank/IDA-/ .00 - .00of which is undisbursed .00 -
1/ Prior to exchange adjustments.

- 19 -
ANNEX IIPage 2 of 5
STATUS OF BANK GROUP OPERATIONS IN ZIMBABWE
STATEMENT OF BANK LOANS AND IDA CREDITS TO RHODESIA AND ZAMBIA(As of January 1, 1981)
Loan CreditNo. No. Year Borrower Purpose Bank IDA Undisbursed
145-0 1956 CentralAfricanPowerCorp. Kariba Hydroelectric Proj. 80.00 - .00
197-1 1958 NorthernRhodesia Rhodesia Railways 9.50 -- .00
197-2 1958 S,Rhodesia Rhodesia Railways 9.50 - .00392-0 1964 Central
AfricanPowerCorp. Second Kariba Hydro- 7.70 - .00
electric ProjectTotal 106.70 - .00of which has been repaid 96.1
Total now outstanding 10.60 -Amounts sold 47.98
of which has been repaid 46.47 1.51 -
Total now held by Bank/IDA-/ 9.09 -of which is undisbursed .00 - .00
1/ Prior to exchange adjustments.

- 20 -
ANNEX IIPage 3 of 5
ZIMBABWE
STATUS OF BANK PROJECTS IN EXECUTION AS OF JANUARY 1, 1981)
There are no Bank projects in execution in Zimbabwe.

- 21 -
ANNEX IIPage 4 of 5
STATEMENT OF IFC INVESTMENTS IN ZIMBABWE(As of February 15, 1981)
Investment Type of US$ Million EquivalentNumber Year Business Loan Equity
552-ZIM 1981 Wankie CollieryCompany Limited Coal Mining 38.0
Total gross commitments 38.0Less cancellations, terminations,
repayment and sales -
Total now held by IFC 38.0Total now undisbursed 38.0

- 22 -
ANNEX IIPage 5 of 5
ZIMBABWE
STATUS OF IFC PROJECTS IN EXECUTION AS OF FEBRUARY 15, 1981
Zimbabwe Wankie Colliery Company Limited 552-ZIM
The Loan was approved on February 10, 1981.

- 23 -ANNEX IIIPage 1 of 1
SUPPLEMENTARY PROJECT DATA SHEET
I. Timetable of Key Events
(a) Time taken to prepare project: 2 months
(b) Preparation by Government and the Association
(c) First Bank Mission toconsider the project August 1980
(d) Appraisal Mission departed October 1980
(e) Negotiations : January 1981
(f) Planned Date of Effectiveness: March 1981
II. Special Bank Implementation Action
None.
III. Special Conditions
(a) The Government will undertake and complete by March 31,1983,, a review of the licensing and tariff practices inaccordance with terms of reference to be agreed between theGovernment and the Association (para. 29).
(b) The local counterpart funds generated by the loan and credit wouldbe deposited in a special account in the Reserve Bank and usedto help finance development projects in the Central Governmentbudget (para. 39).
- 24 -
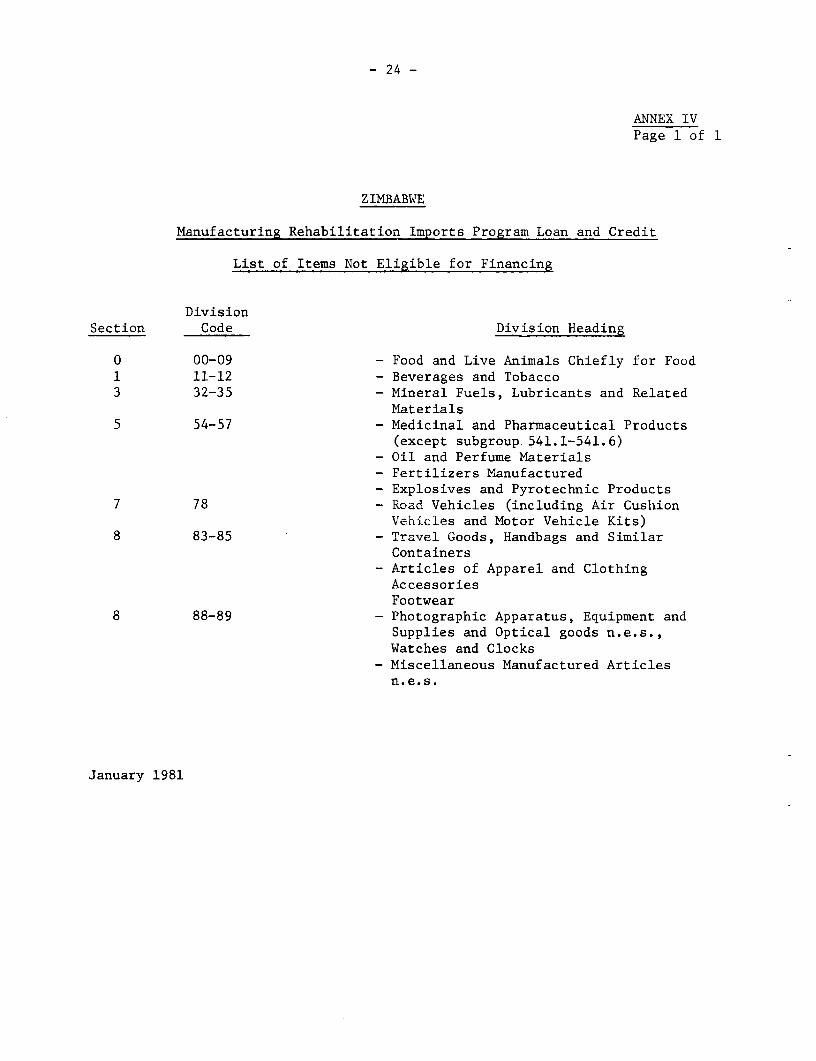
ANNEX IVPage 1 of 1
ZIMBABWE
Manufacturing Rehabilitation Imports Program Loan and Credit
List of Items Not Eligible for Financing
DivisionSection Code Division Heading
0 00-09 - Food and Live Animals Chiefly for Food1 11-12 - Beverages and Tobacco3 32-35 - Mineral Fuels, Lubricants and Related
Materials5 54-57 - Medicinal and Pharmaceutical Products
(except subgroup 541.1-541.6)- Oil and Perfume Materials- Fertilizers Manufactured- Explosives and Pyrotechnic Products
7 78 - Road Vehicles (including Air CushionVehicles and Motor Vehicle Kits)
8 83-85 - Travel Goods, Handbags and SimilarContainers
- Articles of Apparel and ClothingAccessoriesFootwear
8 88-89 - Photographic Apparatus, Equipment andSupplies and Optical goods n.e.s.,Watches and Clocks
- Miscellaneous Manufactured Articlesn.e.s.
January 1981
- 25 -
ANNEX V
Page 1 of 18
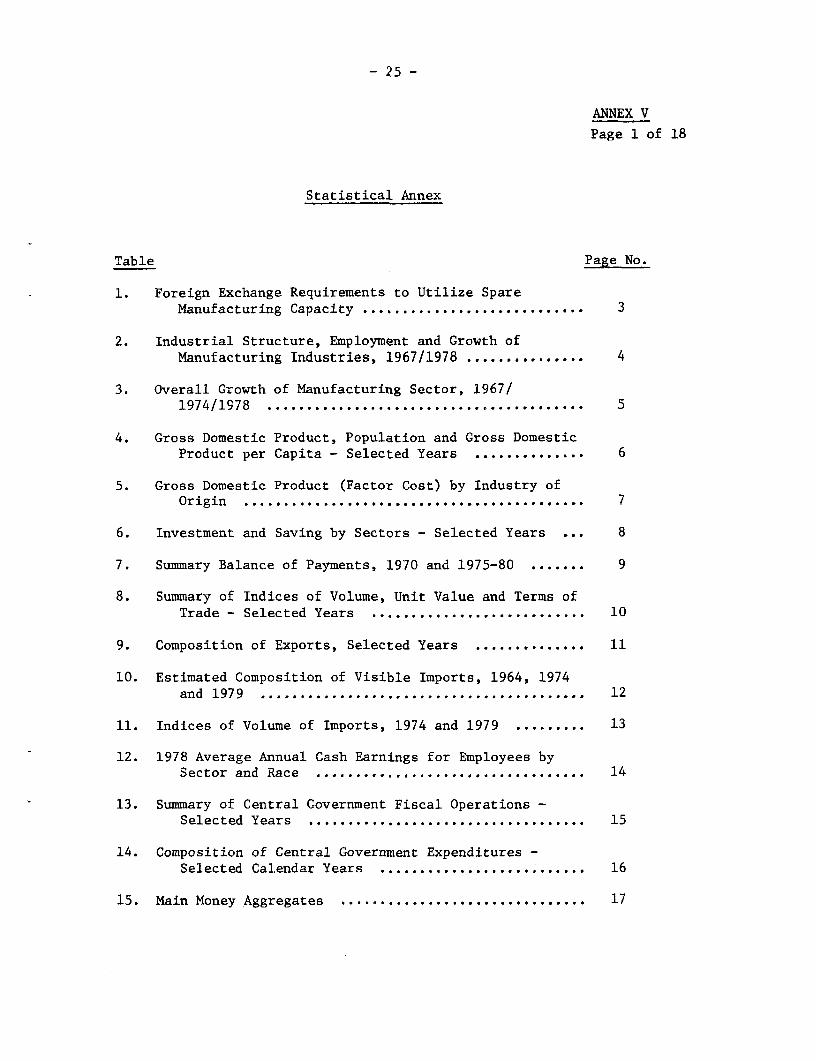
Statistical Annex
Table Page No.
1. Foreign Exchange Requirements to Utilize SpareManufacturing Capacity ...... ...................... 3
2. Industrial Structure, Employment and Growth ofManufacturing Industries, 1967/1978 . .............. 4
3. Overall Growth of Manufacturing Sector, 1967/1974/1978 . ....................................... 5
4. Gross Domestic Product, Population and Gross DomesticProduct per Capita - Selected Years .... .......... 6
5. Gross Domestic Product (Factor Cost) by Industry ofOrigin ............ ............................... 7
6. Investment and Saving by Sectors - Selected Years ... 8
7. Summary Balance of Payments, 1970 and 1975-80 9
8. Summary of Indices of Volume, Unit Value and Terms ofTrade - Selected Years ...... ..................... 10
9. Composition of Exports, Selected Years .... .......... 11
10. Estimated Composition of Visible Imports, 1964, 1974and 1979 ......................................... 12
11. Indices of Volume of Imports, 1974 and 1979 ......... 13
12. 1978 Average Annual Cash Earnings for Employees bySector and Race .................................. 14
13. Summary of Central Government Fiscal Operations -Selected Years ................................... 15
14. Composition of Central Government Expenditures -Selected Calendar Years ....................... 16
15. Main Money Aggregates ............................... 17

- 26 -
ANNEX VPage 2 of 18
Table Page No.
16. Percentage Changes in Consumer Price Indicesand the GDP Deflator. ... . 18
17. Liquidity Position of Banking Institutions 19

ZIMBABWE - FOREIGN EXC8ANGE REQUIREMENTS TO UTILIZE SPARE MANUFACTURING CAPACITY
IMPORT SUBSTITUTION EXPORTS
Additional Foreipm Additional Forei | _Spare Capacity for Exchange Required Additi-nal Resultant Emchag,e RequEred AdditIon.l Re-d tant Additi nul
Induttri-l Division which market exists (per *nnum) Sales (per annum) (per annum Sale, (per annum) Employment Remarks
7 ' 000 ZIn'.0 Z 'O000 Z$ soon
01 Meot -o Mest Prudu to 5012 Dai-y Producte 5 16 30V Cereal P-od-cts O _ _
Fr-il an" Vepetablej n916 Cunlrctiunee - 50 82 390 11. 60 25
i6A Su.jr Refineries 0t7 Coffee and Te 10 274 930 130 440 7518 Miecellaneoco foodstuffs 0 _ _ '9 Animal and Vegetable Oils 5 92 820 5r 440 10
10 Li-estock Feedetuffe 0 -11 Be-nrafes 5 - 160 20
12 Tobacco 0 -14 Leather 10 160 690 28 110 55
16 Robber 25 424 1,060 180 450 60
16A Tyres 0 _ _
17 Wood and Lumber 0 -18 Wood Manufacturers 0 _ _19 FPrniture 16 567 2,830 394 1,970 4142n Papermills 0 - -21 Paper Conv-rt.ra 5 621 800 5 110 148 422 Trvsl Co-da 25 1n8 230 InO 380 s0n 21A Plasti-s 15 544 520 606 580 25 d23B Jewelry 0 - -23, Pen.s 0 _ _ _23D Clo-ke nd Watchee 13 51 6BO _ - 10
21E Optical 0 _23F Toys 30 58 320 47 260 45 * Indirect employment -
21G Phot.prphy 0 - - mainly in clothing manr238 Br...h.-r 0 -- fa-tur. -2 J Can"las 0 _ _
27M Mi llaneo- 20 96 190 24 0() Includes extra sales2' T. ,cilm (Misre11--ou) 20 440 1,800 34 derIved from Division
2' T-til-e 19 10,424 79,210 3q968 6,340) 2,089 25 increasd productio..
2,092
26 ClothinF 20 2,199 10,620 (x) 571 1,330 40027 Fooutear 5 680 1,670 68 190 370
28 Iron and Steel 25 400 5,000 1,100 16,600 30029 Nm-FerrousMetals 45 800 2,300 200 100 120
910 Metal Manufacturers 13 3,265 4,900 435 800 I 40031 Non-Electrical Machinery 15 200 1,000 100 300 10032 Electrical Machinery 50 8,700 23,100 25032A Radio 50 2,400 9,600 170
33 Transport 50 9,200 16,270 20034 Non-Metallic Mineral. 10 100 300 100 300 4036 Gases _37 Chemical Elements _38 Paint 32 1,090 1,400 310 400 100
39 Medical Preparations 28 1,000 2,000 1,000 2,000 200
40 Toilet Preparations 20 907 2,250 483 1,200 103
41 Fertili.er (Am-moni) 25 2,200 3, 080 4 42 Miscellaneous Chemicals 100 300 20
Assembly) Passenger Vehicles 67 15,000 30,000 650
Plants ) Co-sernial Vehicles 50 16,000 32.000 6_ _ 650_ C
TOTAL 78.082 186.430 10. 218 32,250 8 5 49
Source: Ministry of Commerce and Industry, Salisbury
October 23, 1980
EAI DB
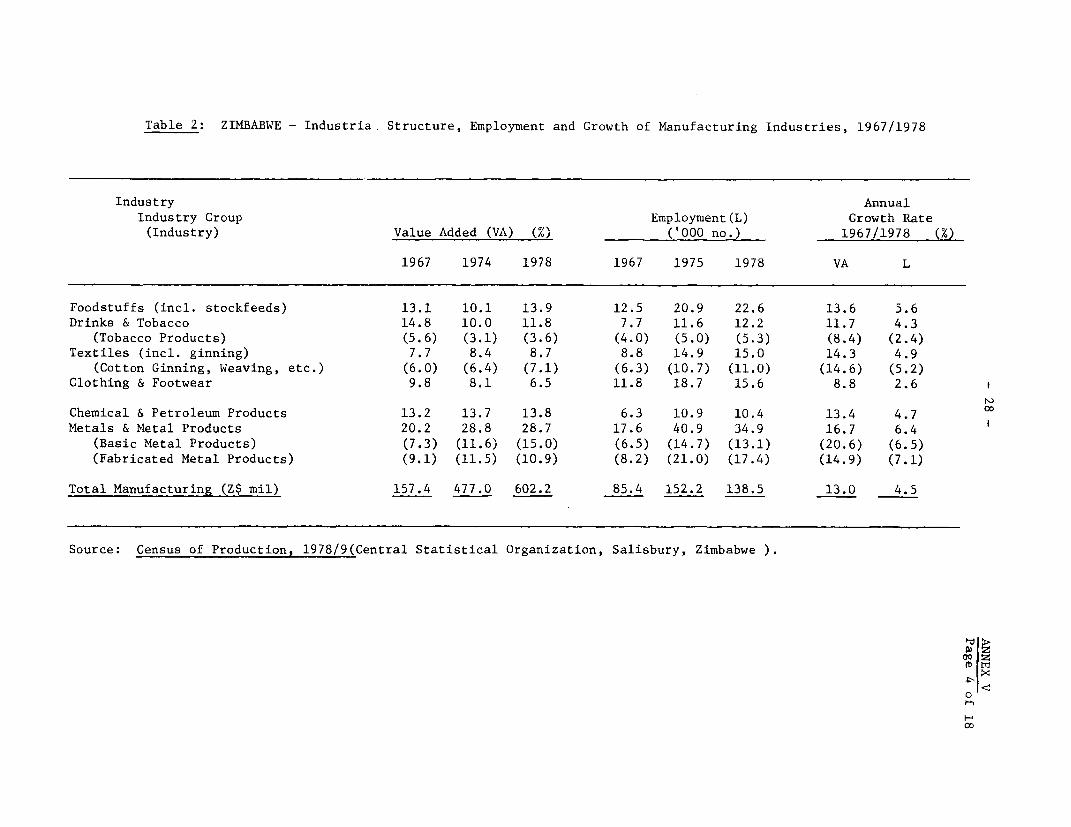
Table 2: ZIMBABWE - Industria. Structure, Employment and Growth of Manufacturing Industries, 1967/1978
Industry Annual
Industry Group Employment(L) Growth Rate
(Industry) Value Added (VA) (%) ('000 no.) 1967/1978 (x)
1967 1974 1978 1967 1975 1978 VA L
Foodstuffs (incl. stockfeeds) 13.1 10.1 13.9 12.5 20.9 22.6 13.6 5.6
Drinks & Tobacco 14.8 10.0 11.8 7.7 11.6 12.2 11.7 4.3
(Tobacco Products) (5.6) (3.1) (3.6) (4.0) (5.0) (5.3) (8.4) (2.4)
Textiles (incl. ginning) 7.7 8.4 8.7 8.8 14.9 15.0 14.3 4.9
(Cotton Ginning, Weaving, etc.) (6.0) (6.4) (7.1) (6.3) (10.7) (11.0) (14.6) (5.2)
Clothing & Footwear 9.8 8.1 6.5 11.8 18.7 15.6 8.8 2.6
Chemical & Petroleum Products 13.2 13.7 13.8 6.3 10.9 10.4 13.4 4.7 X
Metals & Metal Products 20.2 28.8 28.7 17.6 40.9 34.9 16.7 6.4
(Basic Metal Products) (7.3) (11.6) (15.0) (6.5) (14.7) (13.1) (20.6) (6.5)
(Fabricated Metal Products) (9.1) (11.5) (10.9) (8.2) (21.0) (17.4) (14.9) (7.1)
Total Manufacturing (Z$ mil) 157.4 477.0 602.2 85.4 152.2 138.5 13.0 4.5
Source: Census of Production, 1978/9(Central Statistical Organization, Salisbury, Zimbabwe ).
09 zon mIs
0

Table 3: ZIMBABWE - Overall Growth of Manufacturing Sector, 1967/1974/1978
Absolute Levels Annual Growth Rates
(%)1967- 1974- 1967-
Description Unit 1967 1974 1978 1974 1978 1978
Net capital expenditure Z$mil 15.2 102.2 45.3 31.3 -23.0 10.4Average Number of Employees (L) (000) 85.4 148.0 138.5 8.2 -1.7 4.5Wages and Salaries Paid (W) Z$mil 74.2 193.1 262.5 14.7 8.0 12.2Gross Value Added (VA) Z$mil 157.4 477.0 602.2 17.2 6.0 13.0Gross Output Z$mil 403.3 1,198.6 1,470.0 16.8 5.2 12.5Gross Profit (VA-W) Z$mil 83.2 283.9 339.7 19.2 3.7 13.6
Production Volume (1964=100) Index 107.7 213.2 182.5 10.2 -4.0 4.9Labor Productivity (VA/L) Z$mil 1,844.0 3,222.0 4,348.0 8.3 7.8 8.1Labor Earnings (W/L) Z$mil 867.0 1,305.0 1,896.0 6.0 9.8 7.4Profit/value added (1 -W/VA) (%) 52.9 59.5 56.4 -- -- --
CPI (1964=100) Index 105.4 136.0 178.5 3.7 7.3 4.9GDP deflator (1965=100) Index 99.4 137.0 197.0 4.7 9.5 6.4
Sources: Census of Production, 1978/9, Monthly Digest of Statistics July 1980, and National Accountsof Zimbabwe Rhodesia, 1978 (compiled and issued by the Central Statistical Office, Zimbabwe).
0'1
0

- 30 -
ANNEX VPage 6 of 18
Table 4: ZIMBABWE - GROSS DOMESTIC PRODUCT, POPULATION ANDGROSS DOMESTIC PRODUCT PER CAPITA - SELECTED YEARS
Average AnnualPreliminary Growth Rates (%)
1965 1974 1978 1979 1965-74 1974-79
Current GDP (Z$ million) 737 1,859 2,337 2,627 10.9 7.2GDP in 1965 prices (Z$ million) 737 1,357 1,186 1,187 7.0 -2.7Population (million) 4.5 6.1 6.9 7.2 3.5 3.5Current GDP per capita (Z$) 164 305 339 365 7.2 3.6GDP per capita, 1965 prices (Z$) 164 223 171 165 3.5 -6.2
Source: Statistical Annex, table 2.04.

- 31 -
ANNEX VPage 7 of 18
Table 5: ZIMBABWE - GROSS DOMESTIC PRODUCT (FACTOR COST) BY INDUSTRY OF ORIGIN
(Z$ million and percent)
1965 1974 1979Value (%) Value (%) Value (%)
Share Share Share
Agriculture and Forestry 123 (18) 316 (18) 305 (12)Mining 48 (7) 134 (7) 193 (8)Manufacturing 135 (20) 422 (24) 609 (25)Other Industry a/ 114 (17) 263 (15) 360 (15)Distribution, Hotels and Restaurants 104 (15) 258 (14) 290 (12)Public Administration and Defense 39 (6) 109 (6) 270 (11)All Other 120 (17) 287 (16) 430 (17)
Total 683 (100) 1,789 (100) 2,457 (100)
a/ Electricity, water, construction, transportation and communications.
Source: Statistical Annex, table 2.01.

- 32 -
ANNEX VPage 8 of 18
Table 6: ZIMBABWE - INVESTMENT AND SAVINGS BY SECTORS - SELECTED YEARS
(Z$ million and percent)
1970 1974 1978Value (%) Value (%) Value (%)
Investment by
Personal Sector 26 (12) 49 (9) 27 (7)Companies 77 (34) 182 (35) 129 (34)Government 40 (18) 96 (18) 107 (28)Public Corporations 24 (11) 78 (15) 45 (12)Other /a 10 (4) -12 (-2) -1 -Increase in Stocks 47 (21) 128 (25) 73 (19)
Total Investment = Savings 224 (100) 521 (100) 380 (100)
Savings by
Personal Sector /a 42 (19) 78 (15) 213 (56)Companies 118 (53) 231 (44) 164 (43)Government 24 (11) 48 (10) -122 (-32)Public Corporations 16 (6) 52 (10) 74 (19)Other Domestic 11 (5) 32 (6) 63 (17)Net Borrowing from Abroad 13 (6) 80 (15) -12 (-3)
/a Including statistical discrepancy.
Source: National Accounts of Zimbabwe-Rhodesia, 1978.

- 33 -
ANNEX V
Page 9 of 18
Table 7: ZIMBABWE - SUMMARY BALANCE OF PAYMENTS, 1970 AND 1975-79 /a
(Z$ million)
1970 1975 1976 1977 1978 1979
Trade balance 24 44 155 140 188 131Exports, f.o.b. 266 526 563 554 627 717Imports, f.o.b. 242 482 408 414 439 586
Services (net) -34 -134 -127 -136 -145 -173Freight and insurance -19 -57 -37 -39 -42 -45Fares -1 -17 -20 -23 -23 -18Other transportation 19 27 37 36 30 30Travel -5 -23 -28 -34 -40 -60Investment income -19 -41 -52 -45 -35 -37Other services -9 -23 -26 -32 -34 -43
Unrequited transfers (net) -3 -26 -23 -15 -16 -19Private 3 -26 -23 -15 -16 -19Of which: (Migrant funds) (1) (-14) (-15) (-12) (-14) (-13)
(Pensions) (-2) (-2) (-4) (-5) (-5) (-10)Official -- -- - -- - --
Current account -13 -116 5 -11 27 -61
Capital (net) 18 84 15 8 78 82Government 1 -4 -4 -6 68 118Public Corporations -3 -2 3 -2 -4 -6Private /b 19 +90 16 16 14 -30
Overall balance 5 -32 20 -3 105 21
/a Totals may not add up because of rounding.lb Including errors and omissions.
Source: Statistical Annex, table 3.01.
- 34 -
ANNEX VPage 10 of 18
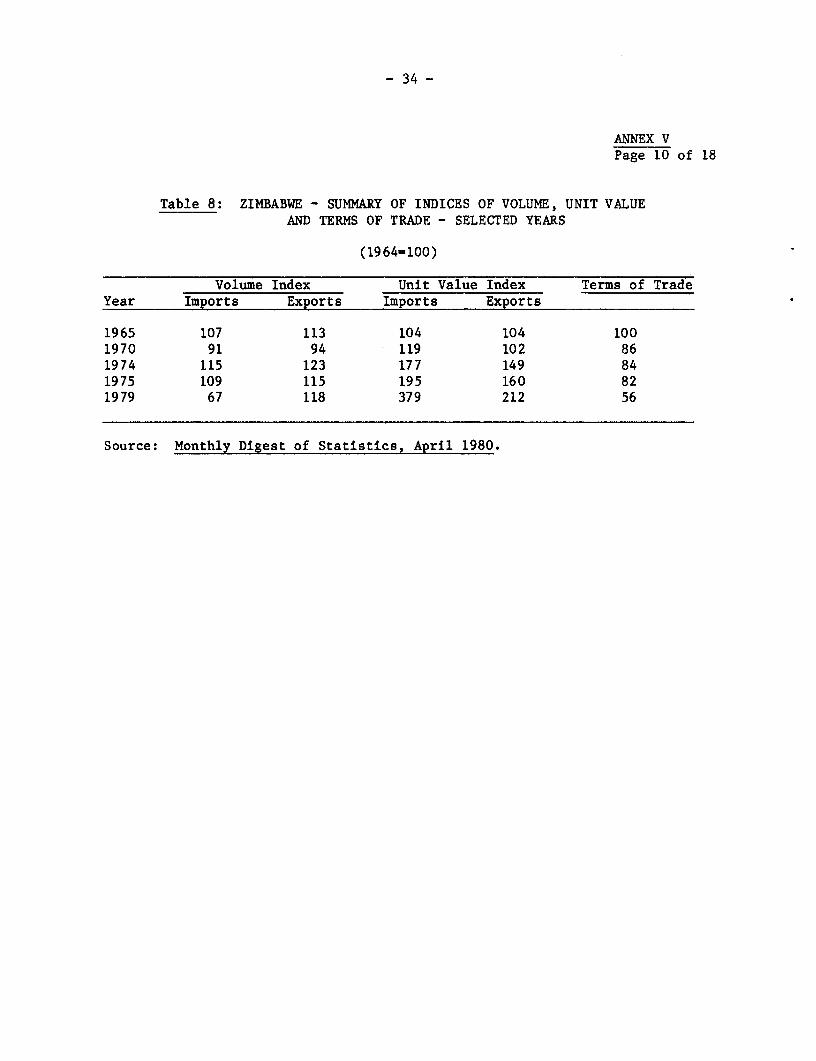
Table 8: ZIMBABWE - SUMMARY OF INDICES OF VOLUME, UNIT VALUEAND TERMS OF TRADE - SELECTED YEARS
(1964=100)
Volume Index Unit Value Index Terms of TradeYear Imports Exports Imports Exports
1965 107 113 104 104 1001970 91 94 119 102 861974 115 123 177 149 841975 109 115 195 160 821979 67 118 379 212 56
Source: Monthly Digest of Statistics, April 1980.
- 35 -
ANNEX VPage 11 of 18
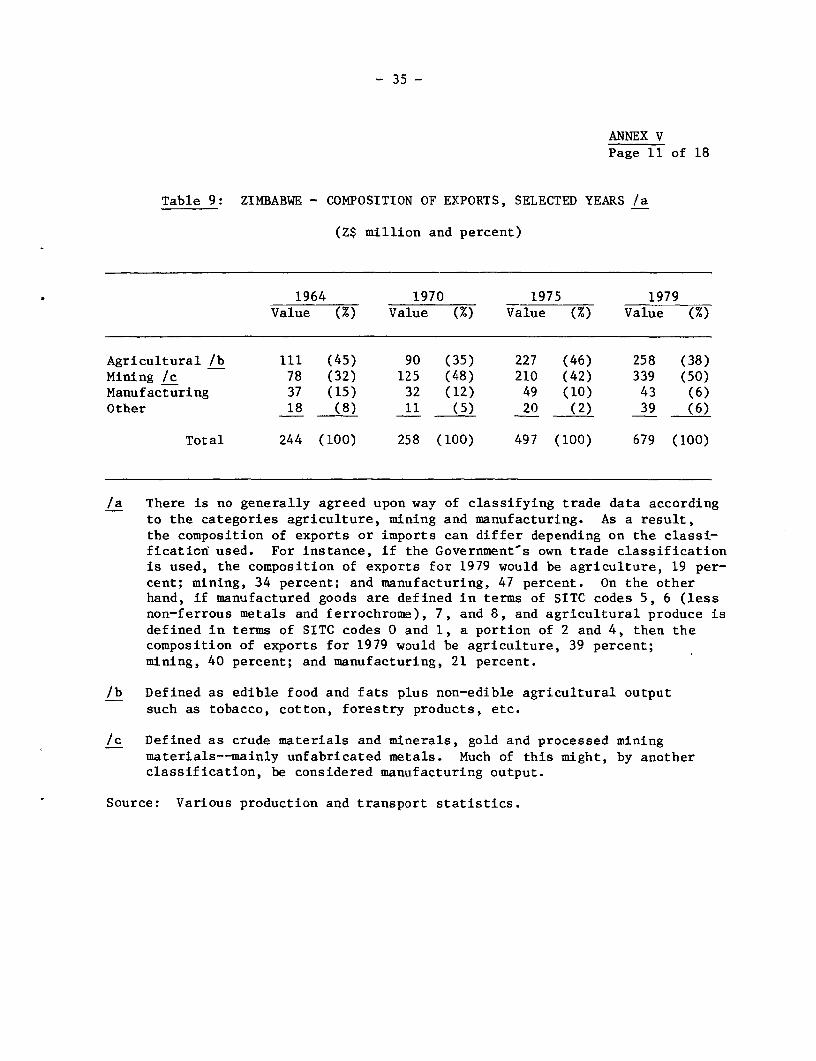
Table 9: ZIMBABWE - COMPOSITION OF EXPORTS, SELECTED YEARS /a
(Z$ million and percent)
1964 1970 1975 1979Value (%) Value (%) Value (%) Value (%)
Agricultural /b 111 (45) 90 (35) 227 (46) 258 (38)Mining /c 78 (32) 125 (48) 210 (42) 339 (50)Manufacturing 37 (15) 32 (12) 49 (10) 43 (6)Other 18 (8) 11 (5) 20 (2) 39 (6)
Total 244 (100) 258 (100) 497 (100) 679 (100)
/a There is no generally agreed upon way of classifying trade data accordingto the categories agriculture, mining and manufacturing. As a result,the composition of exports or imports can differ depending on the classi-ficaticf used. For instance, if the Government s own trade classificationis used, the composition of exports for 1979 would be agriculture, 19 per-cent; mining, 34 percent; and manufacturing, 47 percent. On the otherhand, if manufactured goods are defined in terms of SITC codes 5, 6 (lessnon-ferrous metals and ferrochrome), 7, and 8, and agricultural produce isdefined in terms of SITC codes 0 and 1, a portion of 2 and 4, then thecomposition of exports for 1979 would be agriculture, 39 percent;mining, 40 percent; and manufacturing, 21 percent.
/b Defined as edible food and fats plus non-edible agricultural outputsuch as tobacco, cotton, forestry products, etc.
/c Defined as crude materials and minerals, gold and processed miningmaterials--mainly unfabricated metals. Much of this might, by anotherclassification, be considered manufacturing output.
Source: Various production and transport statistics.
- 36 -
ANNEX VPage 12 of 18
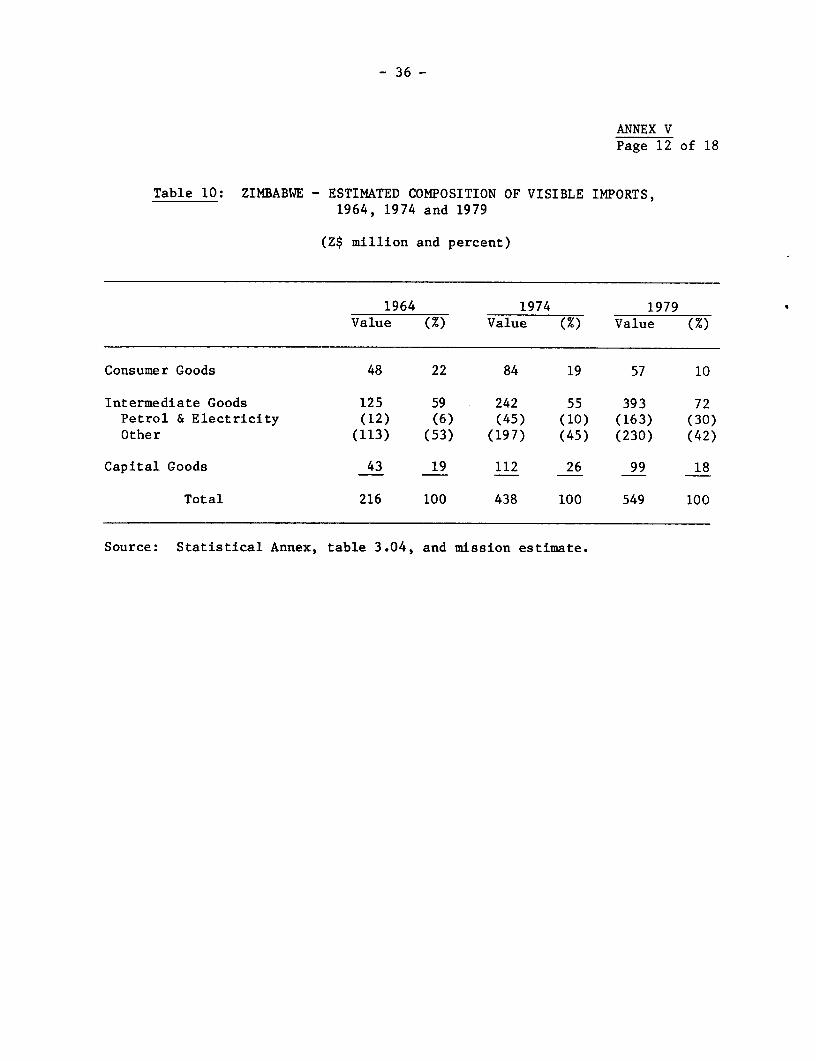
Table 10: ZIMBABWE - ESTIMATED COMPOSITION OF VISIBLE IMPORTS,1964, 1974 and 1979
(Z$ million and percent)
1964 1974 1979Value (M) Value (%) Value (e )
Consumer Goods 48 22 84 19 57 10
Intermediate Goods 125 59 242 55 393 72Petrol & Electricity (12) (6) (45) (10) (163) (30)Other (113) (53) (197) (45) (230) (42)
Capital Goods 43 19 112 26 99 18
Total 216 100 438 100 549 100
Source: Statistical Annex, table 3.04, and mission estimate.

- 37 -
ANNEX VPage 13 of 18
Table 11: ZIMBABWE - INDICES OF VOLUME OF IMPORTS, 1974 AND 1979
(1964 - 100)
1974 1979
Food 35.7 15.1Beverages and Tobacco 17.6 11.9Crude Materials 124.9 75.7Fuels and Electricity 158.7 151.9Oils and Fat 85.3 49.9Chemicals 153.2 111.2Machinery, Transport Vehicles and Spares 130.0 60.9Materials for Intermediate Consumption 136.1 74.5Goods for Final Consumption 69.9 48.9
Total 114.6 66.9
Source: Government trade data.
- 38 -
ANNEX VPage 14 of 18
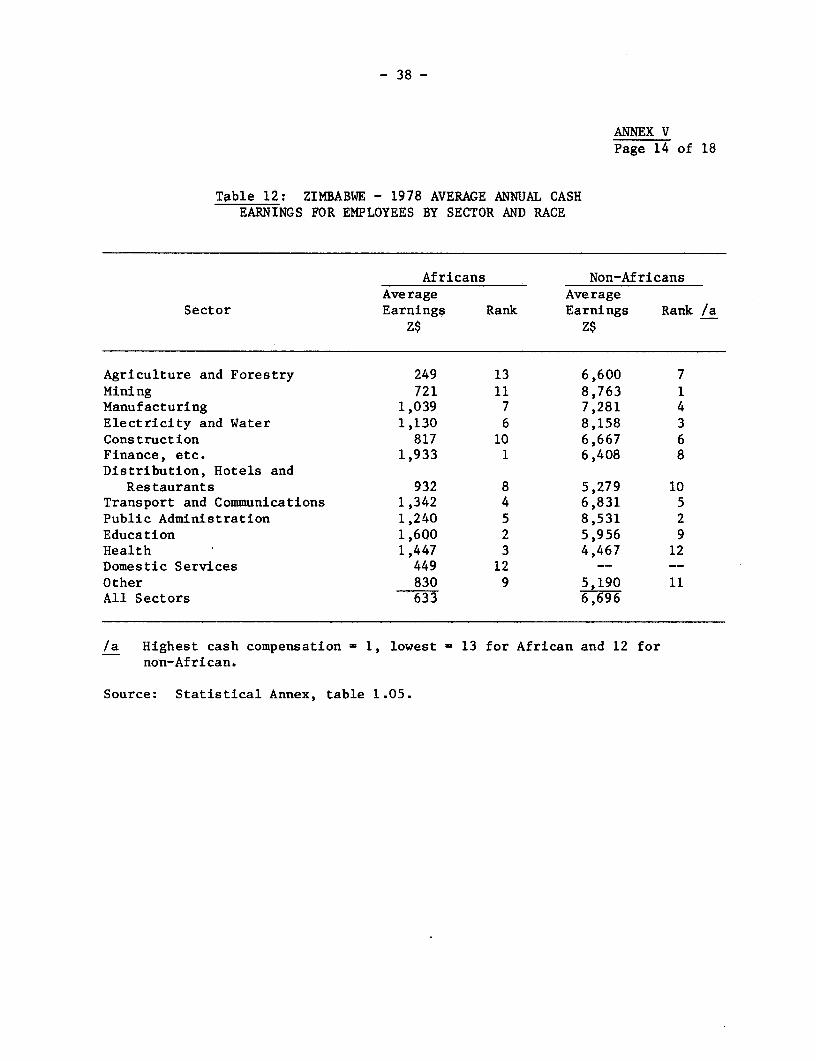
Table 12: ZIMBABWE - 1978 AVERAGE ANNUAL CASHEARNINGS FOR EMPLOYEES BY SECTOR AND RACE
Africans Non-AfricansAverage Average
Sector Earnings Rank Earnings Rank /aZ$ Z$
Agriculture and Forestry 249 13 6,600 7Mining 721 11 8,763 1Manufacturing 1,039 7 7,281 4Electricity and Water 1,130 6 8,158 3Construction 817 10 6,667 6Finance, etc. 1,933 1 6,408 8Distribution, Hotels and
Restaurants 932 8 5,279 10Transport and Communications 1,342 4 6,831 5Public Administration 1,240 5 8,531 2Education 1,600 2 5,956 9Health 1,447 3 4,467 12Domestic Services 449 12 -- --Other 830 9 5,190 11All Sectors 633 6,696
/a Highest cash compensation 1, lowest 13 for African and 12 fornon-African.
Source: Statistical Annex, table 1.05.

ANNEX VPage 15 of 18
- 39 -
Table 13: ZIMBABWE - SUMMARY OF CENTRAL GOVERNMENT FISCAL OPERATIONS,SELECTED YEARS
(Z$ million for years ending June 30)
Estimate*71/72 76/77 77/78 78/79 79/80 80/81
Revenue -/ 244 531 610 580 674 863of which:
Income Tax (104) (280) (288) (261) (316) (407)Sales & Excise Tax )__(77) (137) (172) (183) (213) (234)Customs Duty ) (24) (23) (22) (22) (42)Non-Tax Revenues (43) (81) (117) (105) (113) (164)
ExpenditureRecurrent 141 311 411 482 604 626Transfers 87 212 274 324 368 519(Interest & Pensions) (37) (66) (82) (110) (118) (170)(Subsidies & Grants) (41) (143) (189) (212) (245) (331)Capital 22 68 60 54 55 82Gross Long-term Loans & Investment 42 38 38 28 30 60Short-term Lending (net) -42 33 -3 -6 7 13
Total 250 662 780 881 1,064 1,300
Deficit 2 6 131 170 302 390 437Gross Financing Requirements - 224 238 365 487 576
FinancingLong-term Loan Recoveries 15 22 18 13 13 12External -- -- 70 129 97)Domestic )Banking System 15 45 19 48 123) … 564Other 3/ -14 157 131 175 254)
1/ Excluding recoveries from long-term loans and investments, and flows and extraordinaryincome.
2/ Deficit plus contributions to sinking funds and refinancing of maturing debt.3/ Including non-Bank sources, short-term borrowing, changes in cash balances and for
1978/79 and 79/80, the National Defense Levy.
Source: Annex, table 5.01

Table 14: ZIMBABWE - COMPOSITION OF CENTRAL GOVERNMENT EXPENDITURES - SELECTED CALENDAR YEARS(Z$ millions and percent)
AverageAnnualGrowth
1970 1974 1979 RateValue (%) Value (%) Value (%) 1970-79
General Administration & Defense 65 28.5 124 31 400 46 22.5%(of which Defense & Internal Security) (38) (17) (73) (18) (300) (34) 26.0%
Education and Health 55 24 90 23 165 19 13.0%Social and Recreational Services 6 3 11 3 42 5 24.0%Housing and Townships 3 1 4 1 5 0.5 5.9%Economic Services 65 28.5 116 29 168 19 11.1%Pensions 7 3 13 3 28 3 16.7%Public Debt 24 10.5 36 9 63 7 11.6%Other 3 1.5 4 1 3 0.5 -
Total 228 100 398 100 874 100 16.1%
Source: Economic Surveys and National Accounts Publications.
0
co

- 41 -
ANNEX VPage 17 of 18
Table 15: ZIMBABWE - MAIN MONEY AGGREGATES
(Z$ Million, end of period)
1970 1975 1976 1977 1978 1979 1980(June)
Money and Near Money 306 690 769 810 892 992 1,195
Currency in Circulation 34 67 79 84 75 108 135Draft Deposits 155 256 272 290 318 355 429Term Deposits 117 367 418 436 479 519 631
Source: Statistical Annex, table 6.01.
Table 16: ZIMBABWE - PERCENTAGE CHANGES IN CONSUMER PRICE INDICES
AND THE GDP DEFLATOR
Annual Averages /- Sept. 79-1965-70 1970-75 1975-79 1979 /b Sept. 80
Lower Income Urban CPI(1964=100) 1.9 5.1 11.5 13.7 -0.4
Higher Income Urban CPI
(1964=100) 2.6 5.3 9.0 13.4 7.3
GDP Deflator (1965=100) 1.9 6.5 10.2 12.3 -
/a Using average CPI for each year.
lb Increase during year.
Source: Statistical Annex, table 6.04.

- 42 -
ANNEX VPage 18 of 18
Table 17: ZIMBABWE - LIQUIDITY POSITION OF BANKING INSTITUTIONS
(Z$ million and percent)
RequiredLiabilities Liquidity Excess
Type of Institution Assets to the Public Ratio /a Liquidity /b
Commercial Banks1979 351 662 35% 1191978 261 636 25% 102
Accepting Houses1979 99 156 30% 521978 97 153 20% 66
Financial Institutions1979 20 88 15% 71978 20 89 15% 7
Total1979 470 906 - 1781978 378 878 - 175
/a The percentage of liabilities to the public which must be invested inliquid assets.
/b Liquid assets minus required liability ratio times liability to public.
Source: Executive Guide to the Economy June 1980, Quarterly Publication ofThe RAL Merchant Banks Ltd.

I BRD 15480t wAirE l; I^;EUx 8 , 0; T . : C i J ; E w j 0 i 0 X j J V br 2 DECEMbER 3l 9E;OEMBER 199
3 e e A ~INDA @ :utXi0 :;:X0 ;SE5 : ITV ;; ;i i|2(B. sz A <t = i :1 ;zZ:MABOCEAN-::X V
t M:1^ E r M f y 0, 2:::\ : ;)) #i i:J ,0, \ i i ( 0( 5i,f i, \,iji ;'i5 \00, , j i, A , :9 ':0 0(;
5 tf k i Sf t u T fl n 02\h - \ Jr \i F i-; - ' ' ' i'C l \;- \1 L 1 uS- i, ] ff M A S 0
t \ r-d4, . .. : : = e <: . . ................ =: : : ...... =E N,:
fh 9 /Ef.>{A^f ;; [ji09 ii (n l; :' ; j '' 7itl;0tAM'8lQ'UW E S
ZAM | 2: : Di ; : /2 / / ,:. ii A :
( 0 ZA1iABIA 0 N 0 R T ,\<
AfL :: ) M A: T A~ B~ %L9X D I RdlFMID'A J _, J < ,' t
RI - N M A %TA \ Ek NGel D c M_2A.r11\ /
-22- Chi-::\/>> ̂ r : = 22 <z i02\ 2 \ \<B<w76eK tts < t9>; 41; <{, OAMSIQU
;0 Ica lmr M R_ 05 h bh ots nIt \/ fL' :; 2 :00i8 :0 ( : 0 S9 ( X t / k X CT "aA g_{ :