world bank group lac trade training peruvian delegation october 21, 2010 logistics performance index...
TRANSCRIPT

WORLD BANK GROUP
LAC Trade Training Peruvian Delegation
October 21, 2010
LOGISTICS PERFORMANCE INDEX AND DOING BUSINESS INDICATORS
Souleymane COULIBALYECA Regional Trade Coordinator
Geneva, June 14th, 2011

The Logistics Performance Index and Doing Business Report
2
Two separate but complementary reports

The Logistics Performance Index
• Measures the trade logistics efficiency of a country
• Fundamental premise: Efficient logistics drives economic performance
3

The Doing Business Report
• Provides measures of the ease of doing business (regulations) for local firms in a given country
• Fundamental premise: economic activity requires effective regulations in all areas of setting up and operating a business
4
Agenda
2. Overview of Doing Business 20112. Overview of Doing Business 2011
1. Overview of LPI 20101. Overview of LPI 2010
3. LPI Results: CIS countries3. LPI Results: CIS countries
5. Want to Learn More?
4. DB Results: CIS Countries4. DB Results: CIS Countries

1. Overview LPI 20101. Overview LPI 2010
6

The Logistics Performance Index
• First report in 2007, every three years
• Source of data is suppliers of logistics services (freight forwarders, express carriers)
• Rates logistical performance on a scale of 1 to 5
7
8
LPI: Key messages
• Trade logistics is an important element of national competitiveness
• A country’s performance is only as good as its weakest link
• The LPI dataset can be used to identify key bottlenecks in your own country

Efficiency of the clearance process
Quality of trade and transport infrastructure
Ease of arranging competitively priced shipments
Logistics competence and quality of logistics services
Ability to track and trace shipments
Timeliness of shipment delivery
The LPI measures six dimensions of country performance:
What are efficient logistics?
9

10
Why Logistics Matter:
Result when a low income country reaches LPI of middle income average
Indicator/policy areaIncrease in trade
(%)
Logistics Performance Index 15.2
All trade barriers reduced to 10% 8.4
Regulatory reform measures 7.4
Tariffs reduced to 5% 5.7

Key Policy Implications:
• Expand the traditional development agenda beyond customs reform and infrastructure to be comprehensive—processes, services, and infrastructure.
• Increase border agency coordination
• Partner with the private sector
• Reform must be tailored to each country’s circumstances
11

The Logistics Performance Index
12

13
2. Overview Doing Business 20112. Overview Doing Business 2011

14
The Doing Business Report
• First report in Sept 2003, yearly
• Covers 183 countries
• Surveys in-country specialists with knowledge of regulatory system
• Provides a basis for measuring, understanding and improving the regulatory environment for business
• creates methodology and a database for policy makers

15
The Doing Business Report
Doing Business does not measure all aspects such as:
• macroeconomic stability• corruption• level of labor skills• proximity to markets, • regulations specific to foreign
investment or financial markets
16
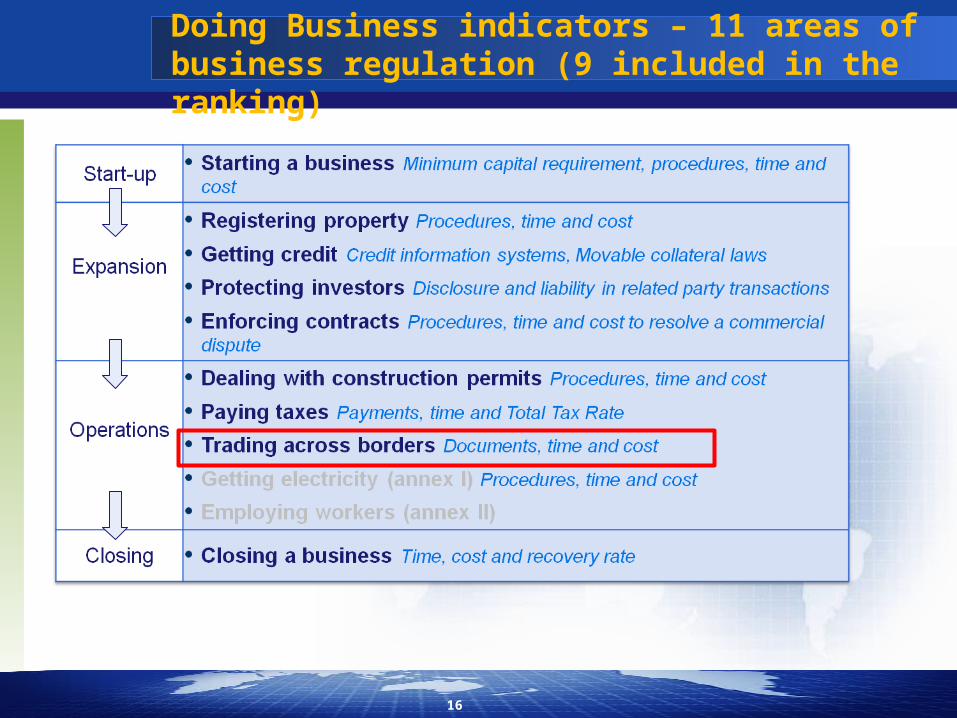
Doing Business indicators – 11 areas of business regulation (9 included in the ranking)
17
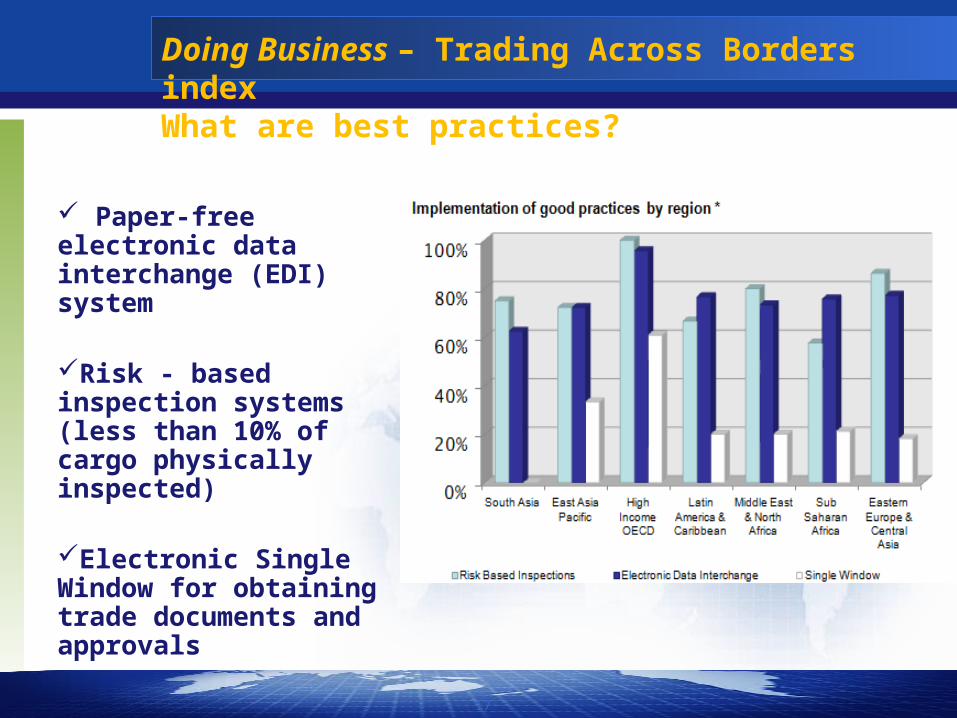
Doing Business – Trading Across Borders indexWhat are best practices?
Paper-free electronic data interchange (EDI) system
Risk - based inspection systems (less than 10% of cargo physically inspected)
Electronic Single Window for obtaining trade documents and approvals

The Doing Business Report
18

LPI and DB – separate but complementary
LPI DB
Source of data3rd country providers of Logistics services
In-country entities with knowledge of business regulations
Concept Performance outcomesAnalytic breakdown in component procedures
Frequency Every 3 years since 2007 Yearly since 2003
SignificanceSeveral indices of logistics performance
Metric of broader business regulatory environment.
Countries 155 183
19
Both indices provide basic input for policy-makers. Neither are in-depth analysis.

20
3. LPI Results: CIS countries3. LPI Results: CIS countries

LPI 2010 – performance varies around the world
Countries are improving around the worldNo data
Logistics friendly
Logistics unfriendly
Partial performersConsistent performers
21

More than income: the “logistics gap”
With the right investment and policies, lower income countries can also be high performers
22

Overperformers and underperformers
23

Country LPI Rank
South Africa 28Malaysia 29Poland 30Lebanon 33Latvia 37Turkey 39Brazil 41Lithuania 45Argentina 48Chile 49
TOP 10 COUNTRIES
LOWER MIDDLE INCOME
Country LPI Rank
China 27Thailand 35Philippines 44India 47Tunisia 61Honduras 70Ecuador 71Indonesia 75Paraguay 76Syrian Arab Republic 80
TOP 10 COUNTRIES
LOW INCOME
Country LPI Rank
Vietnam 53Senegal 58Uganda 66Uzbekistan 68Benin 69Bangladesh 79Congo, Dem. Rep. 85Madagascar 88Kyrgyz Republic 91Tanzania 95
TOP 10 COUNTRIES
UPPER MIDDLE INCOME
LPI 2010 Ranks
24
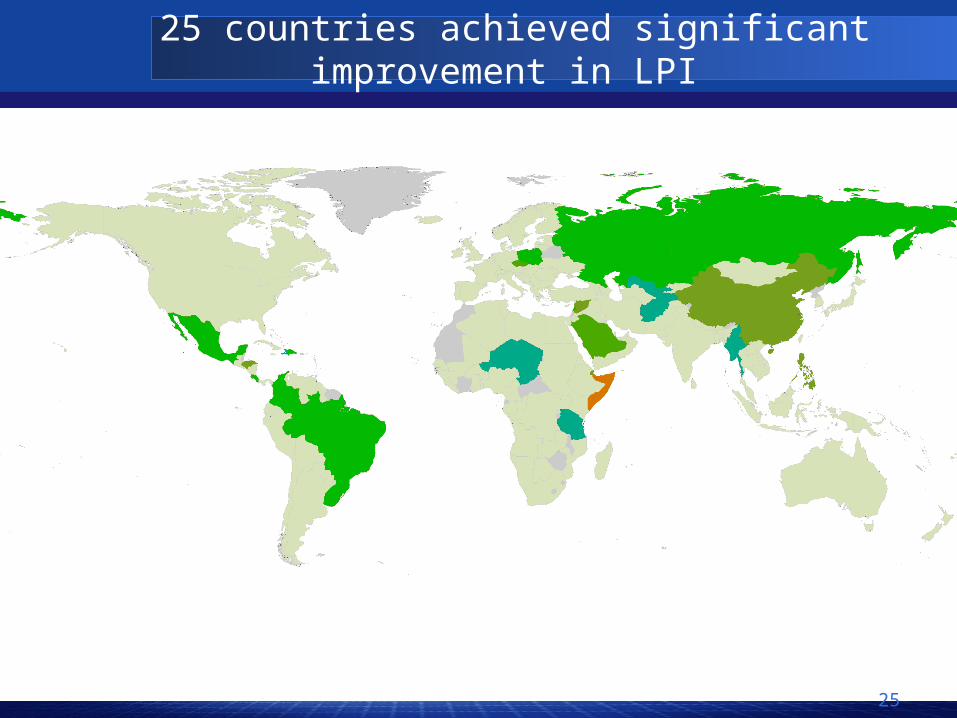
25 countries achieved significant improvement in LPI
25
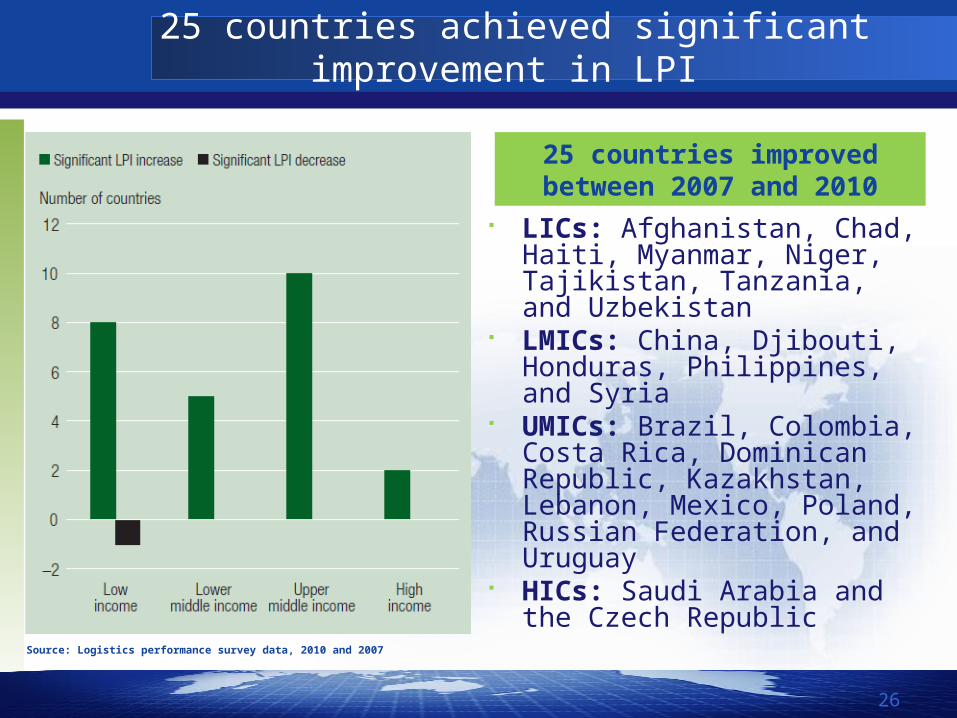
25 countries achieved significant improvement in LPI
LICs: Afghanistan, Chad, Haiti, Myanmar, Niger, Tajikistan, Tanzania, and Uzbekistan
LMICs: China, Djibouti, Honduras, Philippines, and Syria
UMICs: Brazil, Colombia, Costa Rica, Dominican Republic, Kazakhstan, Lebanon, Mexico, Poland, Russian Federation, and Uruguay
HICs: Saudi Arabia and the Czech Republic
Source: Logistics performance survey data, 2010 and 2007
25 countries improved between 2007 and 2010
26

LPI Scores by Region
27
2.0
2.2
2.4
2.6
2.8
3.0
3.2
3.4
3.6
3.8H
igh
inco
me:
O
ECD
Hig
h in
com
e:
nonO
ECD
Cent
ral
Amer
ica
East
Asi
a &
Pa
cific
Sout
h Am
eric
a
CIS
Mid
dle
East
&
Nor
th
Afric
a
Sout
h As
ia
Aver
age
2010
LPI
Sco
re
Lower Middle Income
Low Income
Upper Middle Income

LPI Scores
28
2.0
2.2
2.4
2.6
2.8
3.0
3.2
3.4
3.6
3.8
4.0
Aver
age
2010
LPI
Sco
re
Logisticsunfriendly
Consistentperformers
High Income: OECD
Middle East and N.Africa
Low income
CIS Avg.
Partialperformers

40
45
50
55
60
65
70
75
Kaza
khst
an (6
2)
Uzb
ekist
an (6
8)
Azer
baija
n (8
9)
Kyrg
yz R
epub
lic (9
1)
Geo
rgia
* (9
3)
Russ
ian
Fede
ratio
n (9
4)
Ukr
aine
(102
)
Mol
dova
(104
)
Arm
enia
(111
)
Turk
men
istan
(114
)
Tajik
istan
(131
)
% H
ighe
st P
erfo
rmer
CIS Country (Rank LPI 2010)
% Highest performer 2010% Highest Performer 2007
% of the highest performer
29
LPI 2010
Highest performer Germany 100%
Lowest performer Somalia 11%

Performance in the 6 areas of the LPI
302010 Average LPI Score
2
2.5
3
3.5
4Cu
stom
s
Infr
astr
uctu
re
Inte
rnati
onal
Sh
ipm
ents
Logi
stics
Qua
lity
and
Com
pete
nce
Trac
king
and
Tra
cing
Tim
elin
ess
Int'l
LPI
Com
pone
nts
Scor
e (1
=Ver
y lo
w; 5
=Ver
y hi
gh)
High income: OECD East Asia & PacificSouth America Middle East & North AfricaSouth Asia CIS

Infrastructure quality
31
0%
10%
20%
30%
40%
50%
60%
70%
80%
90%
100%
Port
s
Airp
orts
Road
s
Railr
oad
War
ehou
sing IC
T
Perc
enta
ge o
f res
pond
ents
indi
catin
g Q
ualit
y of
In
fras
truc
utre
is "
Low
" or
"Ve
ry L
ow"
High income: OECD East Asia & PacificSouth America Middle East & North AfricaSouth Asia CIS

Quality of services I
32
TRANSPORT SERVICES
0%
10%
20%
30%
40%
50%
60%
70%
80%
90%
100%
Wat
er Air
Road
Railr
oadPe
rcen
tage
of r
espo
nden
ts in
dica
ting
Qua
lity
of S
ervi
ces
(T
rans
port
) is
"Lo
w"
or "
Very
Low
"
High income: OECD East Asia & PacificSouth America Middle East & North AfricaSouth Asia CIS
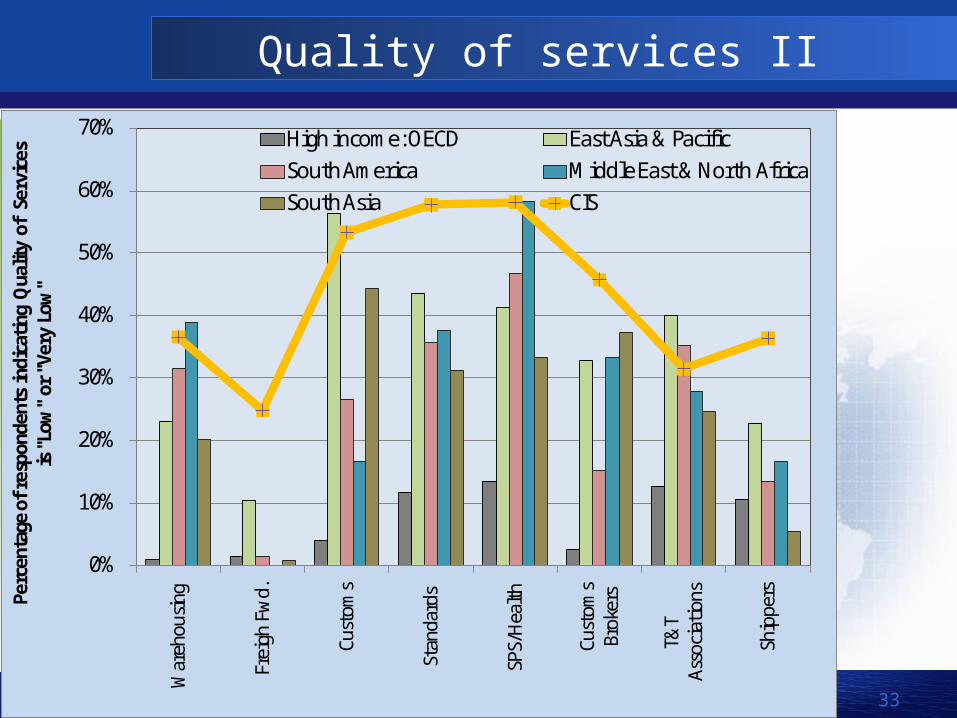
Quality of services II
33
0%
10%
20%
30%
40%
50%
60%
70%
War
ehou
sing
Frei
gh F
wd.
Cust
oms
Stan
dard
s
SPS/
Hea
lth
Cust
oms
Brok
ers
T&T
Asso
ciati
ons
Ship
persPe
rcen
tage
of r
espo
nden
ts in
dica
ting
Qua
lity
of S
ervi
ces
is "
Low
" or
"Ve
ry L
ow"
High income: OECD East Asia & PacificSouth America Middle East & North AfricaSouth Asia CIS

Border clearance procedures / corruption
34
0%
10%
20%
30%
40%
50%
60%
70%
80%
90%
Tim
ely
Clea
ranc
e an
d D
eliv
ery
of
Impo
rts
(Har
dly
ever
)
Tran
spar
ent
Cust
oms
Clea
ranc
e Pr
oces
s (H
ardl
y ev
er)
Brib
es a
re
sour
ce o
f Del
ay
(Alw
ays o
r ne
arly
alw
ays)
Perc
enta
ge o
f res
pond
ents
High income: OECD East Asia & PacificSouth America Middle East & North AfricaSouth Asia CIS
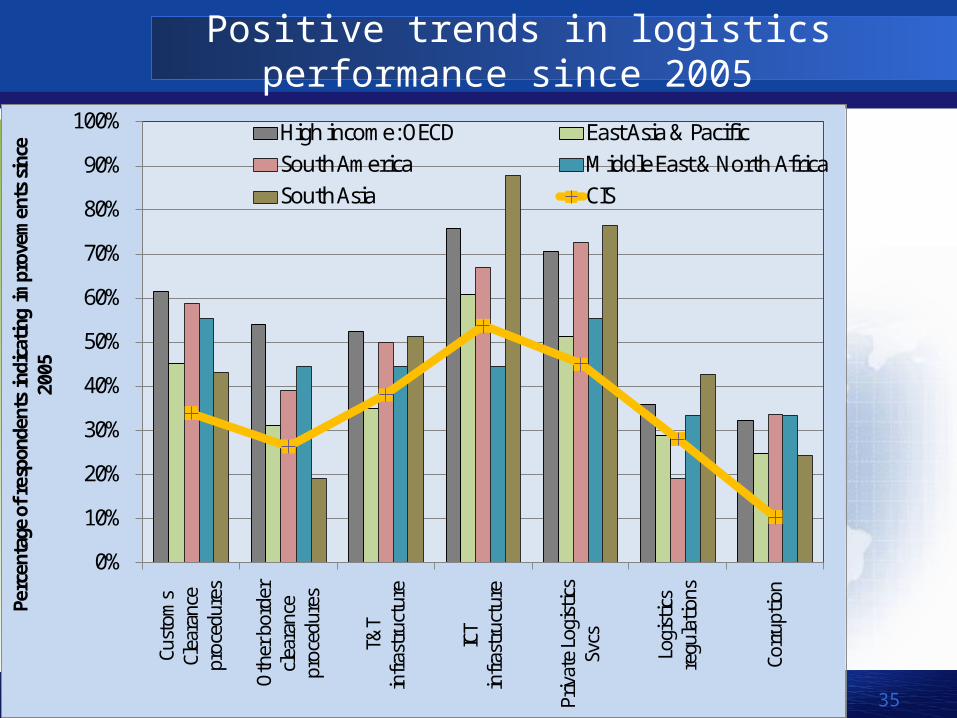
Positive trends in logistics performance since 2005
35
0%
10%
20%
30%
40%
50%
60%
70%
80%
90%
100%
Cust
oms
Clea
ranc
e pr
oced
ures
Oth
er b
orde
r cl
eara
nce
proc
edur
es
T&T
infr
astr
uctu
re
ICT
infr
astr
uctu
re
Priv
ate
Logi
stics
Sv
cs
Logi
stics
re
gula
tions
Corr
uptio
n
Perc
enta
ge o
f res
pond
ents
indi
catin
g im
prov
emen
ts s
ince
20
05
High income: OECD East Asia & PacificSouth America Middle East & North AfricaSouth Asia CIS

36
4. Doing Business Results: CIS Countries
4. Doing Business Results: CIS Countries

Top 30 economies on the ease of Doing Business 2009/10
37
1. Singapore 16. Korea, Rep.
2. Hong Kong SAR, China 17. Estonia
3. New Zealand 18. Japan
4. United Kingdom 19. Thailand
5. United States 20. Mauritius
6. Denmark 21. Malaysia
7. Canada 22. Germany
8. Norway 23. Lithuania
9. Ireland 24. Latvia
10. Australia 25. Belgium
11. Saudi Arabia 26. France
12. Georgia 27. Switzerland
13. Finland 28. Bahrain
14. Sweden 29. Israel
15. Iceland 30. Netherlands

Eastern Europe and Central Asia is the second best performing region in 2008/09
38
CIS economies: 12 Georgia13 Kyrgyz Republic48 Armenia54 Azerbaijan59 Kazakhstan68 Belarus89 Moldova123 Russian Federation 139 Tajikistan145 Ukraine150 Uzbekistan

Kazakhstan improved the most in the ease of doing business in 2009/10
EconomyStarting a business
Dealing with construction
permits
Registering property
Getting credit
Protecting investors
Paying taxes
Trading across borders
Enforcing contracts
Closing a business
Kazakhstan
Rwanda
Peru
Vietnam
Cape Verde
Tajikistan
Zambia
Hungary
Grenada
Brunei Darussalam
39
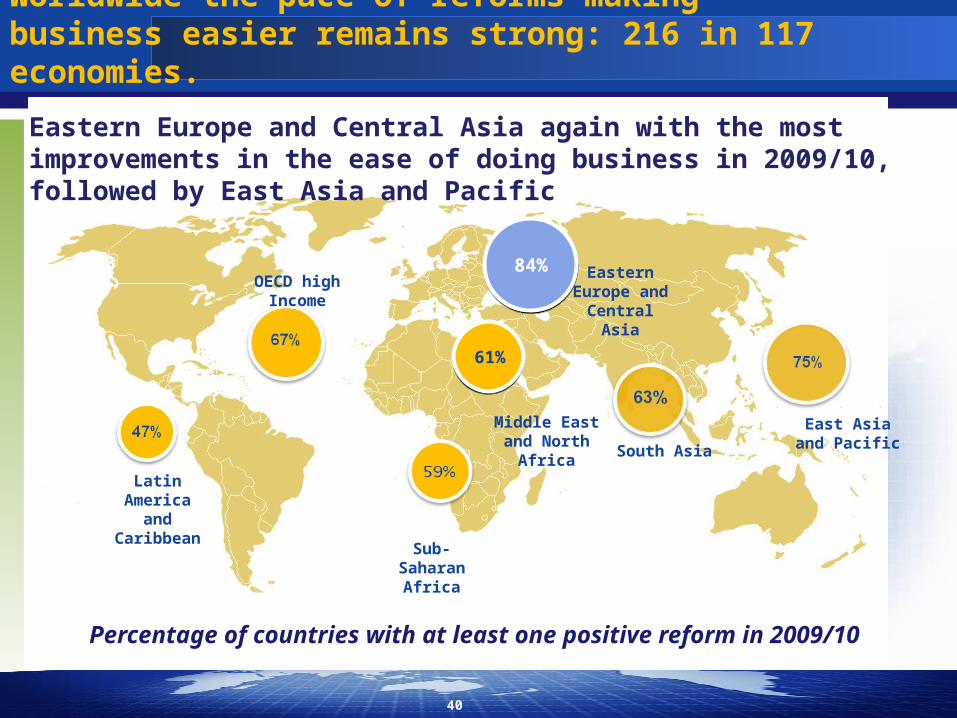
Percentage of countries with at least one positive reform in 2009/10
84%
61%
OECD high Income
Eastern Europe and Central Asia
Sub-Saharan Africa
Middle East and North Africa
Latin America and
Caribbean
South Asia
East Asia and Pacific
Worldwide the pace of reforms making business easier remains strong: 216 in 117 economies.
Eastern Europe and Central Asia again with the most improvements in the ease of doing business in 2009/10, followed by East Asia and Pacific
40

90% of the economies in the ECA region improved their business environment
While 85% of economies worldwide improved
business regulation over the last 5 years.
41

21 of 25 economies in Eastern Europe & Central Asia improved business regulations this year
6 economies eased trading across borders in the region
42

43
33 economies reformed making it easier to trade across borders in 2009/10
44
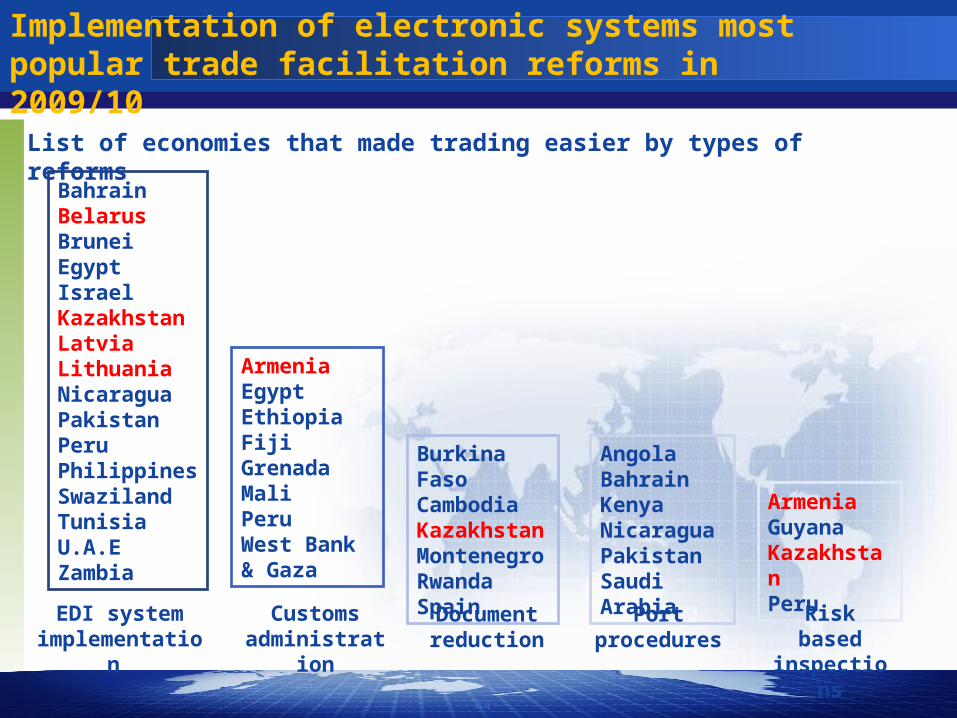
Implementation of electronic systems most popular trade facilitation reforms in 2009/10
BahrainBelarusBruneiEgyptIsraelKazakhstanLatviaLithuaniaNicaraguaPakistanPeruPhilippinesSwazilandTunisiaU.A.EZambia
ArmeniaGuyanaKazakhstanPeru
Burkina FasoCambodiaKazakhstanMontenegroRwandaSpain
AngolaBahrainKenyaNicaraguaPakistanSaudi Arabia
ArmeniaEgyptEthiopiaFijiGrenadaMaliPeruWest Bank & Gaza
EDI system implementation
Risk based inspections
Customs administration
Document reduction
Port procedures
List of economies that made trading easier by types of reforms
45
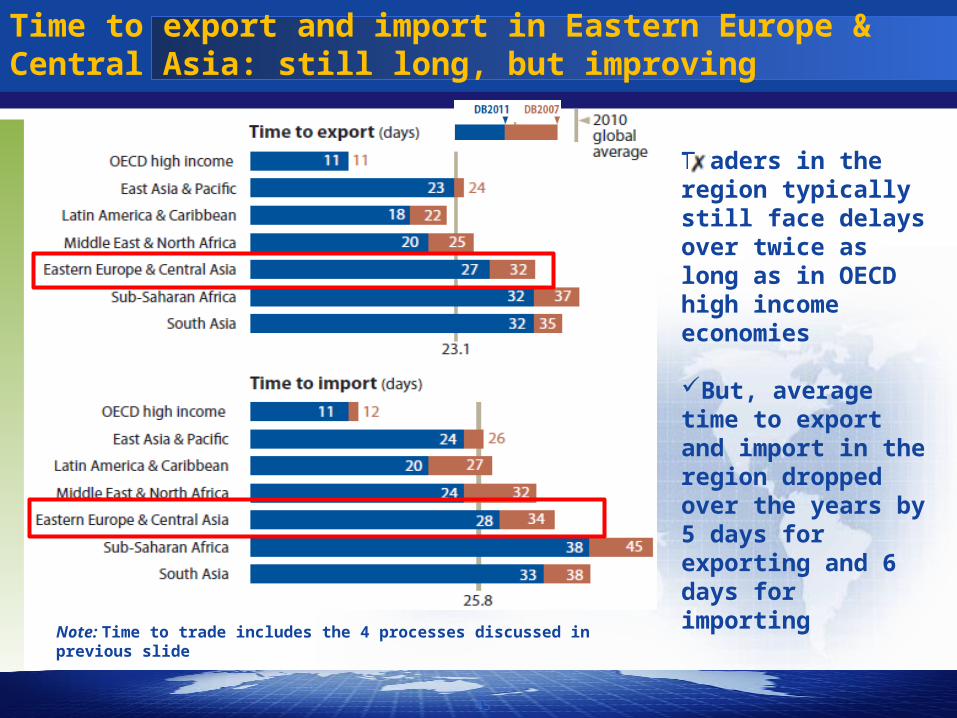
Time to export and import in Eastern Europe & Central Asia: still long, but improving
Note: Time to trade includes the 4 processes discussed in previous slide
Traders in the region typically still face delays over twice as long as in OECD high income economies
But, average time to export and import in the region dropped over the years by 5 days for exporting and 6 days for importing

46
Eastern Europe and Central Asia economies also made improvements in number of required documents
Traders in OECD high income economies require less than 5 documents on average to export and import
Whereas traders in Eastern Europe and Central Africa still require on average 2-3 additional documents

47
Emphasis on trade facilitation in many developing economies
Note: shows number of cumulative reforms easing trade across borders since DB2007 (counted as 1 reform per reforming economy per year)

48
The trade facilitation reforms impacted lower income countries the most
2006
2010
- 4.7 days
- 4.0 days
-2.9 days
- 0.9 days

49
New EDI systemImproved risk-based inspections Payment deferrals of import duties and taxes
Peru: the economy that most eased trade in 2009/10
50
5. Want to Learn More?

Contact Us
www.worldbank.org/tradewww.worldbank.org/tradefacilitationwww.worldbank.org/tradelogisticswww.worldbank.org/lpiwww.worldbank.org/tradestrategy
Washington Office1818 H Street NW
Washington DC 20433
Contact: [email protected]
The World Bank GroupInternational Trade Department
51

Thank you. For more information:www.doingbusiness.org
52