world bank poverty and social impact analysis...
TRANSCRIPT
WORLD BANK
POVERTY AND SOCIAL IMPACT ANALYSIS
(PSIA)
SOCIAL EXPENDITURE AND ITS RELATION TO POVERTY AND
EQUITY IN BOLIVIA
(Document prepared by the World Bank with contributions from the UPF and UDAPE)
World Bank Consultants
Juan Carlos Requena
Gustavo Canavire
Contributions from
Wilson Jimenez UDAPE
Mónica Loayza UDAPE
Fernando Espinoza UPF
John Newman World Bank
Carlos Mollinedo World Bank
Julio César Velasco World Bank
(Final revised version)
June 2004
2
ABBREVIATIONS AND ACRONYMS
AFP Pension Fund Administrator (Administradora de Fondos de Pensiones)
CNS National Health Care Fund (Caja Nacional de Salud)
DGC General Accountancy Direction (Dirección General de Contaduría)
ECLAC Economic Commission for Latin America and the Caribbean
ENDSA National Population and Health Survey (Encuesta Nacional de
Demografía y Salud)
GDP Gross Domestic Product
HIPC Heavily Indebted Poor Countries
IDB Interamerican Development Bank
IMF International Monetary Fund
INE National Statistics Bureau (Instituto Nacional de Estadística)
MECOVI Improvement of Surveys and Measurement of Living Conditions
(Mejoramiento de las Encuestas y Medición sobre las Condiciones de
Vida)
PAE Primary Adult Education
PAN Support Program for Children under 6 (Programa de Apoyo a la Niñez
menor de 6 años)
PEM Public Expenditure Management for Fiscal Sustainability and Equitable
and Efficient Public Services
PLANE National Emergency Employment Plan (Plan Nacional de Empleo de
Emergencia)
PSIA Poverty and Social Impact Analysis
SIGMA Integrated Administrative Management and Modernization System
(Sistema Integrado de Gestión y Modernización Administrativa)
SUMI Universal Mother-Child Insurance (Seguro Universal Materno Infantil)
TGN Treasury (Tesoro General de la Nación)
UBN Unsatisfied Basic Needs
UDAPE Social and Economic Policy Analysis Unit (Unidad de Análisis de
Políticas Sociales y Económicas)
UPF Fiscal Programming Unit (Unidad de Programación Fiscal)
VIPFE Vice-Ministry of Public Investment and External Funding (Viceministerio
de Inversión Pública y Financiamiento Externo)

3
PRESENTATION
One of the problems the public sector faces when preparing its budget is the lack of
information on the degree of equity, as well as on the efficiency and effectiveness of
public expenditure. Among other things, as this information is unavailable it is
impossible to focus public resources based on poverty criteria and criteria related to the
impact of the expenditure on the population that is supposedly benefited with the State
interventions.
The objective of this study is to provide the government with information and a basis for
its analysis to ensure inclusion of one of the mentioned deficiencies in public spending
policies aimed at a better allocation of public resources, that is to say, equity in public
expenditure.
Currently, public spending has an important social component; in 2003, 59% of
government expenditure was destined to education, health, pensions, rural development,
basic sanitation and urbanism. Nonetheless, no information is available on the
beneficiaries of this expenditure, or the pro-poor focus of expenditure.
Information on the incidence of public social expenditure in the poor and non-poor
population will enable economic authorities as well as other actors involved in or
influencing public policymaking, to have more criteria and elements for assessment as
regards distribution criteria and the definition of priorities in public expenditure, and
based on results of the study, to analyze possible resource reallocations.
The World Bank carried out this study with support from the Fiscal Programming Unit
(UPF) of the Ministry of Finance and the Social and Economic Policy Analysis Unit
(UDAPE), as the principal public entities in charge of social expenditure accounting and
analysis.
The document was prepared under the approach of the Poverty and Social Impact
Analysis (PSIA), which is defined as the analysis of the – wanted or unwanted – effects
of policy interventions on the welfare of different groups, especially the poorest groups.

4
INDEX
INTRODUCTION .............................................................................................................. 1
1. PUBLIC SOCIAL EXPENDITURE IN BOLIVIA ........................................................ 2
1.1 General background on the measurement of Public Social Expenditure ...................... 2
1.2 General background on the Methodology Applied in this Study ................................. 2
1.3 Bolivia’s Social Spending in the Latin American Context ........................................... 3
1.4 Recent Evolution of Social Expenditure in Bolivia ..................................................... 5
2. EQUITY IN PUBLIC SOCIAL EXPENDITURE ......................................................... 8
2.1 Equity in Current Expenditure ...................................................................................... 8
2.1.1 Overall Outcomes ...................................................................................................... 8
2.1.2 Outcomes from Different Components of Current Social Expenditure................... 10
2.1.2.1 Equity in Expenditure in Education ...................................................................... 10
2.1.2.2 Equity in Expenditure in Initial Education ........................................................... 12
2.1.2.3 Equity in Primary Education ................................................................................. 13
2.1.2.4 Equity in Higher Education .................................................................................. 14
2.1.2.5 Equity in Alternative Education............................................................................ 15
2.1.2.6 Equity in University Education ............................................................................. 16
2.1.3 Equity of Social Expenditure in Health ................................................................... 16
2.1.4 Equity in Social Expenditure in Pensions ................................................................ 18
2.3 Execution of Social Capital Expenditure .............................................................. 20
2.2.1 Social Capital Expenditure and Poverty ................................................................. 21
2.2.2 Equity in Social Capital Expenditure in Education ................................................. 24
2.2.3 Equity of Social Capital Expenditure in Health ....................................................... 26

5
2.2.4 Equity in Social Capital Expenditure in Rural Development .................................. 28
2.2.5 Equity in Social Capital Expenditure in Basic Sanitation ....................................... 29
2.2.6 Equity in Social Capital Expenditure in Urbanism .................................................. 31
2.2.7 Equity in Social Capital Expenditure in the PLANE ............................................... 33
3. CONCLUSIONS AND RECOMMENDATIONS ....................................................... 34
3.1 Conclusions ................................................................................................................. 34
3.2 Recommendations ....................................................................................................... 35
BIBLIOGRAPHICAL REFERENCES ............................................................................... 37

6
INDEX OF TABLES AND GRAPHS
TABLES
Table Nº 1: Social Expenditure……………………………………………………… 6
Table Nº 2: Composition of Social Expenditure…………………………………….. 8
Table Nº 3: Equity in Current Social Expenditure …………………………………. 9
Table Nº 4: Equity in Expenditure in Education……………………………………. 11
Table Nº 5: Equity and Efficiency of Public Expenditure in Education in Bolivia… 11
Table Nº 6: Equity in the Expenditure in Health…………………………………….17
Table Nº 7: Distribution and expenditure in pensions according to the poverty
situation of the pensioner’s household 2002…………………………… 19
Table Nº 8: Expenditure in pensions according to the Income Quintile of
the Household of which the Pensioner forms part …………………….. 19
Table Nº 9: Degree of Dependency of the Household Income with respect to
the Pensioner’s Retirement Income……………………………………. 19
Table Nº 10: Social Capital Expenditure according to expenditure groups…………. 20
Table Nº 11: Distribution of Social Capital Expenditure in Municipalities according
to their Level of Poverty (UBN)…………………………………………21
Table Nº12: Social Capital Expenditure in municipalities according to Poverty
Level (UBN) ……………………………………………………………22
Table Nº 13: Per Capita Social Expenditure in Municipalities according to the
Poverty Level (UBN) and Funding Source………………………………24
Table Nº 14: Distribution of Social Capital Expenditure in Education in
Municipalities, according to Poverty (UBN) ……………………………25
Table Nº 15: Social Capital Expenditure in Municipalities, according to Poverty
(UBN)……………………………………………………………………26
Table Nº 16: Distribution of Social Capital Expenditure in Health in
Municipalities, according to Poverty (UBN) .…………………….…… 27
Table Nº 17: Social Capital Expenditure in Health in Municipalities, according

7
to Poverty (UBN)………………………………………………………. 27
Table Nº 18: Distribution of Social Capital Expenditure in Rural Development
in Municipalities, according to Poverty (UBN)……………….……….. 29
Table Nº 19: Social Capital Expenditure in Rural Development in
Municipalities, according to Poverty (UBN)……………………………29
Table Nº 20: Distribution of Social Capital Expenditure in Basic Sanitation
in Municipalities, according to Poverty (UBN)…………………………31
Table Nº 21: Social Capital Expenditure in Basic Sanitation in
Municipalities, according to Poverty (UBN)……………………………31
Table Nº 22: Distribution of Social Capital Expenditure in Urbanism in
Municipalities, according to Poverty (UBN)……………………………32
Table Nº23: Social Capital Expenditure in Urbanism in Municipalities, according
to Poverty (UBN)………………………………………………………. 33
Table Nº 24: Social Capital Expenditure in PLANE Programs in
Municipalities, according to Poverty (UBN), 2003……………….…… 33
GRAPHS
Graph Nº 1: Gini Coefficient, Measured at the end of the nineties or beginning of
the 2002s……………………………………………………………….. 3
Graph Nº 2: Latin America: Public Social Expenditure in Latin America
2000-2001……………………………………………………………… 4
Graph Nº 3: Latin America: Public Social Expenditure in Latin America
2000-2001 Excluding Social Security…………………………………. 4
Graph Nº 4: General Government Spending and Social Expenditure………………. 5
Graph Nº 5: Latin America: Public Social Expenditure in education and health in
Latin America 2000-2001…………………………………...…………. 9
Graph Nº 6: Distribution of Expenditure in Initial Education according to
Income Deciles…………………………………………………...……..12
Graph Nº 7: Distribution of the Expenditure in Primary Education according to
Income Deciles……………………………………………………….....13
Graph Nº 8: Distribution of the Expenditure in Secondary Education according
8
to Expenditure Deciles…………………………………………...…….. 14
Graph Nº 9: Distribution of the Expenditure in Alternative Education according
to Income Deciles………………………………………………...……. 15
Graph Nº 10: Distribution of Expenditure in Higher Education according to
Expenditure Deciles……………………………………………….…… 16
Graph Nº 11: Distribution of Current Expenditure in Health, measured in
terms of Medical Attendance in State Hospitals, according to Poverty
of the Attended Person…………………………………………………. 17
Graph Nº 12: Number of Attendances, according to the place of attendance……….... 18
Graphs Nº 13: Distribution of Social Capital Expenditure in Municipalities
according to the Poverty Level (UBN) and Funding Source…….. 23
Graph Nº 14: Social Capital Expenditure in Education………………………………. 25
Graph Nº 15: Social Capital Expenditure in Health……………………………...…… 26
Graph Nº 16: Social Capital Expenditure in Rural Development…………………….. 28
Graph Nº 17: Social Capital Expenditure in Basic Sanitation……………………..…. 30
Graph Nº 18: Social Capital Expenditure in Urbanism………………………….…….32

9
INDEX OF ANNEXES
Annex 1: Applied Methodology
Annex 2: Current Social Expenditure in Education, Poverty and Inequality
Annex 3: Current Social Expenditure in Health, Poverty and Inequality
Annex 4: Current Social Expenditure in Pensions, Poverty and Inequality
.
Annex 5: Social Expenditure in Capital and Poverty

INTRODUCTION
In the last five years, the Bolivian economy has operated in a context characterized by a
deep crisis resulting from both internal and external factors, which has had an impact on
increasingly recurrent political instability and social protest.
From a fiscal perspective, the economic crisis has resulted in a strong increase of the
public deficit, as the income has been lower than projections and spending has turned out
to be considerably inflexible.
However, even in this unfavorable context, the participation of public social expenditure
in total expenditure has been on the increase, i.e. a growing proportion of public
expenditure is destined to health care, education, pensions, rural development, basic
sanitation and urbanism. Social expenditure in these areas increased from 53.5% of the
central government’s public expenditure in 1998 to 59.1% in 2003.
It is however important to not only measure this effort in quantitative terms, but also in
qualitative terms; in other words, to assess the incidence of public social expenditure in
terms of quality of the expenditure, considering the incidence thereof on certain
population groups.
This document assesses public expenditure in terms of the level of equity, with the
purpose of including more elements in discussions on budget policymaking and policies
for public resource allocation and prioritization that do not only consider the traditional
aspects considered in fiscal policymaking of a financial and macroeconomic nature, but
also aspects related to the incidence of public spending on the target population.
The study is subdivided into three chapters. After a short introduction on the way in
which social expenditure is measured in Bolivia and the methodology applied in the
study to measure the incidence of public expenditure (these aspects are further detailed in
the annexes), the first chapter analyzes Bolivian social expenditure in the Latin American
context and makes a summarized evaluation of its recent evolution.
The second chapter separately analyzes findings as regards equity in the current and
capital public social expenditure, and finally, the third chapter contains the conclusions
and recommendations of the study.

2
1. PUBLIC SOCIAL EXPENDITURE IN BOLIVIA
1.1 General background on the measurement of Public Social Expenditure
The Fiscal Programming Unit (UPF) in the Ministry of Finance is in charge of
measurement and follow-up of public social expenditure in Bolivia. Social expenditure
includes the current and capital expenses in the following sectors: health care, education,
basic sanitation, urbanism and housing, rural development and pensions.1
The information on current social expenditure mainly comes from the institutional
classification of this expenditure, i.e. social expenditure is associated with the
expenditure incurred by the public entities involved in this sector. For example, the
primary source of information for spending in education and health is the expenditure
executed by the ministries of education and health.2
The information on social capital expenditure comes from public investment projects
registered by the VIPFE, as well as from capital expenses made by municipalities with
HIPC resources, which are registered by the UPF.
1.2 General background on the Methodology Applied in this Study3
The current social expenditure quantified by the UPF includes expenses in education,
health and pensions. Estimates on equity in current public expenditure are based on
information from MECOVI surveys 1999 and 2002, the Ministry of Education and the
UPF.
In general terms, the methodology used to measure equity in the current social
expenditure consisted in obtaining poverty structures and income deciles based on
MECOVI surveys. This survey was used to identify the persons who used public
education and health services4; on the other hand, in the pension sector, pensioners were
identified, classifying them on the basis of their poverty status and income quintiles. The
calculated structures were used to distribute public expenditure and then make an analysis
on the progressivity or regressivity of expenditure.5
1 This study includes the PLANE as a new category of social capital expenditure (before, this program
formed part of Rural Development). For more details on this and other methodological issues, see
Annex on Methodology. 2 However, as is mentioned in the annex on methodology, a functional classification of public
expenditure would allow for more precision on social spending (see annex on methodology). 3 A more detailed explanation on the used methodology is included in the annex on methodology.
4 In the case of education, the children enrolled in public schools were identified, whereas in the case
of health, attendances in public health care centers were identified. 5 For example, in the case of education, the MECOVI survey established that 76.3% of enrolled
students come from poor households and 33.7% from non-poor households. The same proportion was
applied to public spending in primary education, i.e. the assumption is that 76.3% of expenditure at
this level of education favored students living in poor households.
3
In order to have a rough idea of the level of equity in capital expenditure, the amount of
the executed public investment in municipalities was related to Unsatisfied Basic Needs
(UBN) registered in the municipalities in the Census 2001. This was done taking into
account that in view of the fact that UBN allow for measurement of the structural poverty
level6 of a country, insofar as more public investment resources are destined to the
municipalities with higher UBN levels, through direct and indirect impacts, both the level of
absolute poverty of structural poverty and existing gaps or inequalities among the
municipalities will decrease.
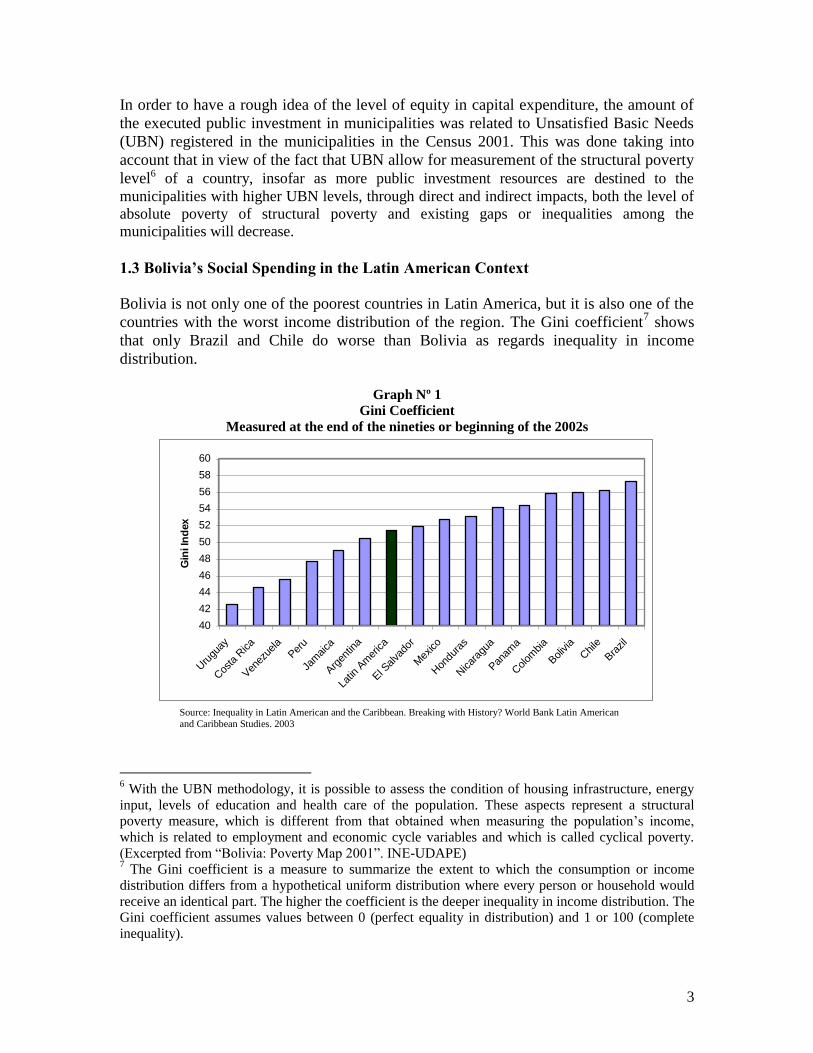
1.3 Bolivia’s Social Spending in the Latin American Context
Bolivia is not only one of the poorest countries in Latin America, but it is also one of the
countries with the worst income distribution of the region. The Gini coefficient7 shows
that only Brazil and Chile do worse than Bolivia as regards inequality in income
distribution.
Graph Nº 1
Gini Coefficient
Measured at the end of the nineties or beginning of the 2002s
40
42
44
46
48
50
52
54
56
58
60
Uru
guay
Cos
ta R
ica
Ven
ezue
laPer
u
Jam
aica
Arg
entin
a
Latin
Am
erica
El S
alva
dor
Mex
ico
Hon
dura
s
Nicar
agua
Pan
ama
Colom
bia
Bolivia
Chile
Bra
zil
Gin
i In
dex
Source: Inequality in Latin American and the Caribbean. Breaking with History? World Bank Latin American
and Caribbean Studies. 2003
6 With the UBN methodology, it is possible to assess the condition of housing infrastructure, energy
input, levels of education and health care of the population. These aspects represent a structural
poverty measure, which is different from that obtained when measuring the population’s income,
which is related to employment and economic cycle variables and which is called cyclical poverty.
(Excerpted from “Bolivia: Poverty Map 2001”. INE-UDAPE) 7 The Gini coefficient is a measure to summarize the extent to which the consumption or income
distribution differs from a hypothetical uniform distribution where every person or household would
receive an identical part. The higher the coefficient is the deeper inequality in income distribution. The Gini coefficient assumes values between 0 (perfect equality in distribution) and 1 or 100 (complete
inequality).
4
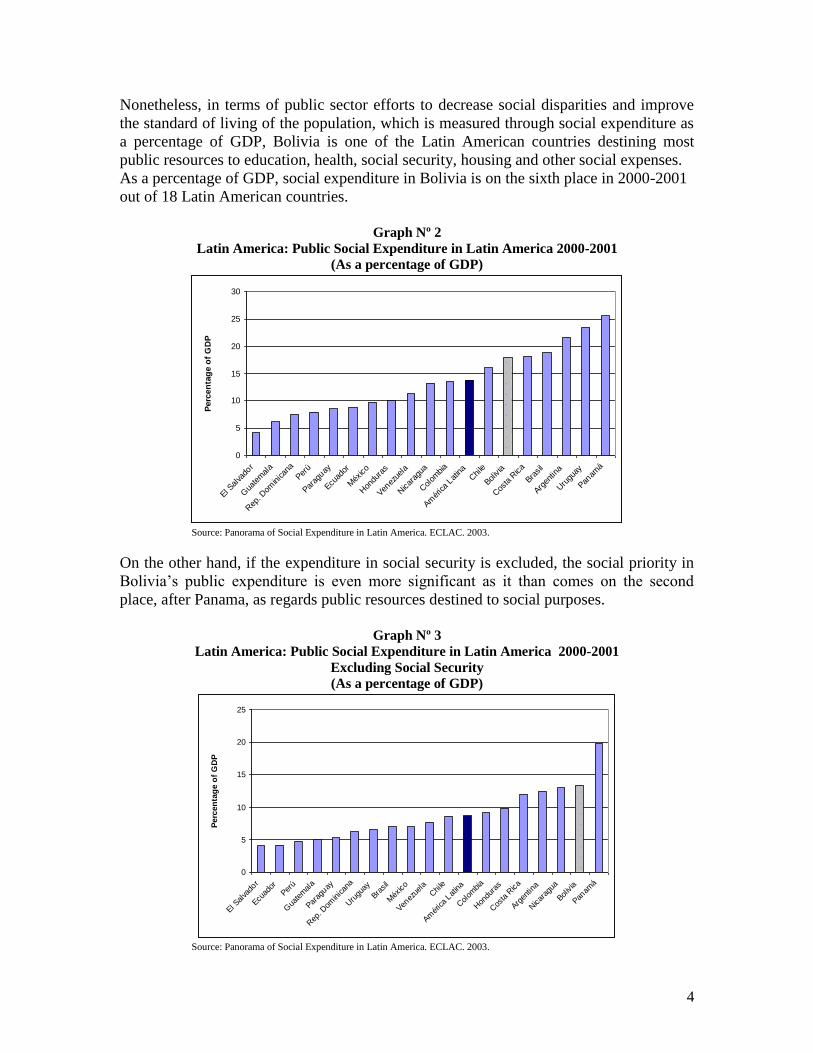
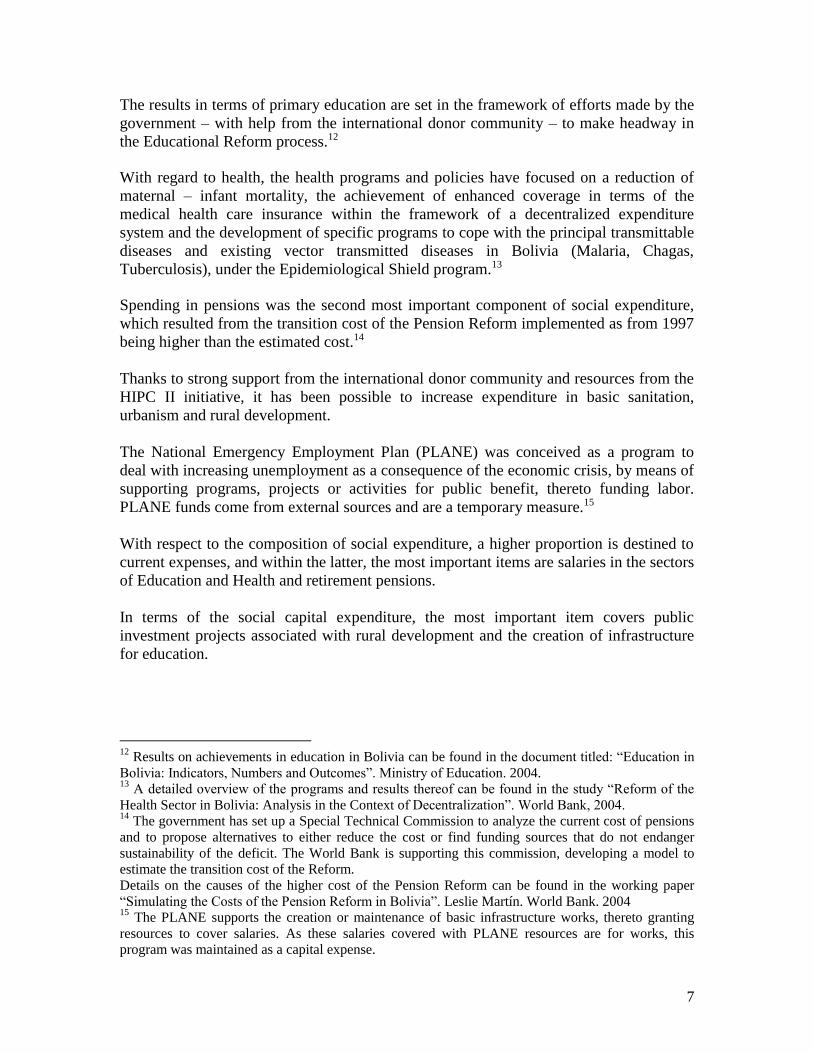
Nonetheless, in terms of public sector efforts to decrease social disparities and improve
the standard of living of the population, which is measured through social expenditure as
a percentage of GDP, Bolivia is one of the Latin American countries destining most
public resources to education, health, social security, housing and other social expenses.
As a percentage of GDP, social expenditure in Bolivia is on the sixth place in 2000-2001
out of 18 Latin American countries.
Graph Nº 2
Latin America: Public Social Expenditure in Latin America 2000-2001
(As a percentage of GDP)
0
5
10
15
20
25
30
El Sal
vado
r
Gua
tem
ala
Rep
. Dom
inican
a
Perú
Parag
uay
Ecuad
or
Méx
ico
Hon
dura
s
Venez
uela
Nicar
agua
Col
ombia
Amér
ica
Latina
Chi
le
Bolivia
Cos
ta R
ica
Brasil
Argen
tina
Uru
guay
Panam
á
Perc
en
tag
e o
f G
DP
Source: Panorama of Social Expenditure in Latin America. ECLAC. 2003.
On the other hand, if the expenditure in social security is excluded, the social priority in
Bolivia’s public expenditure is even more significant as it than comes on the second
place, after Panama, as regards public resources destined to social purposes.
Graph Nº 3
Latin America: Public Social Expenditure in Latin America 2000-2001
Excluding Social Security
(As a percentage of GDP)
0
5
10
15
20
25
El Sal
vado
r
Ecuad
or
Perú
Gua
tem
ala
Parag
uay
Rep
. Dom
inican
a
Uru
guay
Brasil
Méx
ico
Venez
uela
Chi
le
Amér
ica
Latina
Col
ombia
Hon
dura
s
Cos
ta R
ica
Argen
tina
Nicar
agua
Bolivia
Panam
á
Perc
en
tag
e o
f G
DP
Source: Panorama of Social Expenditure in Latin America. ECLAC. 2003.

5
This shows that even though Bolivia displays one of the worst panoramas in Latin
America as regards income distribution, at the same time it is one of the countries in the
region making most efforts to improve the standard of living of its population, so that the
population would have possibilities of increasing its income.
1.4 Recent Evolution of Social Expenditure in Bolivia
A large part – and a growing proportion – of resources collected by the Bolivian State
either through taxes or external assistance are destined to social expenditure. On average,
in the last four years, 59% of the General Government’s total expenditure8, was destined
to Education, Health, Rural Development, Basic Sanitation, Urbanism and Housing and
Pensions.9
Graph Nº 4
General Government Spending and Social Expenditure
(In percentage of GDP)
0,0
5,0
10,0
15,0
20,0
25,0
30,0
1999 2000 2001 2002 2003
years
Perc
en
tag
e o
f G
DP
Social Expenditure Rest
Source: Prepared on the basis of information from the UPF
Preliminary numbers for 2003 show a drop in social expenditure of approximately 1% of
GDP. Ninety percent (90%) of this drop is explained by the lower social capital
expenditure, which mainly results from the lack of government counterpart resources to
implement public investment projects and from the adjustment policies applied to
decrease the public sector deficit.
On the other hand, resources coming from the Dialogue Law 2000 (HIPC resources),
explain to a large extent the growth of social expenditure between 2001 and 2002 and
probably avoided a deeper drop in social expenditure in 2003. In other words, even
8 The financial public sector includes state companies, but as social expenditure forms part of the
expenditure of the general government and results from the public policies applied at this level, and as
the operations of public companies are not linked to social topics, reference is made to the proportion
of social expenditure as regards expenditure of the general government and not to expenditure of the
financial public sector as a whole. 9 In addition, a second categorization of social expenditure was established, called the “Pro-poor
Expenditure” or the “Basic Social Expenditure”, which does not include the expenditure in pensions and the expenditure in education for universities, as these are not considered pro-poor or do not
directly contribute to a decrease of poverty. This study measures equity of social expenditure as a
whole, i.e. both pro-poor social expenditure and pensions and universities.

6
though the expanded HIPC Initiative did not imply a fiscal alleviation, it did enable a
reorientation of public expenditure towards social objectives.10 Expenses in education
account for the highest proportion of social expenditure (7.5% of GDP in 2003), followed
by expenses in pensions (4.5% of GDP) and health (3.8% of GDP).
Table Nº 1
Social Expenditure
(In percentage of GDP) 1999 2000 2001 2002 2003 (e)
Total Social Expenditure 16.5 17.0 19.3 20.3 19.2
Health 3.3 3.5 3.8 3.8 3.8 Education 6.2 6.1 7.3 8.0 7.5 Basic Sanitation 1.2 1.1 0.9 0.6 0.5 Urbanism 0.6 0.6 0.8 0.8 0.7 Rural Development 1.2 1.3 1.7 1.7 1.5 O/w : Community roads 0.5 0.5 0.7 0.8 0.7
Multisectoral 0.0 0.0 0.0 0.0 0.1 PLANE 0.0 0.0 0.0 0.4 0.3
Pensions (1) 3.7 4.1 4.5 4.6 4.5 Rest (2) 0.3 0.3 0.3 0.3 0.3 Of which Expenditure with HIPC resources(3) 0.0 0.0 0.2 1.0 1.1
Source: Prepared on the basis of information from the UPF (1) Does not include contributions from the public sector to AFPs
(2) Includes contributions from the public sector to AFPs and expenditure in “Social Management of Prefectures”
(3) Considers the Solidarity Fund, SUMI and expenses of municipalities
(e) Estimate
As a result of orienting the expenditure more towards health care and education, the
country has achieved important progress in these two fields.
The second report “Progress of Millennium Development Goals” published by INE,
UDAPE and the United Nations in 2002, says that by 2015 probably Bolivia will achieve
the millennium goals related to universal primary education11, as well as regarding the
reduction of maternal mortality (the goal is to reduce this by three quarters between 1990 and
2015) and the reduction of infant mortality (the goal is to reduce the mortality rate of children
under 5 by two thirds between 1990 and 2015).
10
The Dialogue Law 2000 and the corresponding regulations create two main targets for HIPC II
resources: (i) the Municipal Solidarity Fund (FSM) for school education and health; and (ii) the
Special Account of the Dialogue 2000. As regards the FSM, an annual amount of USD 27 million was
destined for 2002-2016, which will be used mainly for salaries in education and health, and the
Universal Mother-Child Insurance (SUMI). The resources of the special account dialogue 2000 will
de destined as follows: 20% to improve the quality of public school education, 10% to improve the
quality of health care and 70% for productive and social infrastructure. In relation to the 70%, this
percentage must be distributed to municipalities according to the UBN index. 11
In Bolivia, primary education is obligatory and free and covers eight years. The report on progress
in achievement of the MDGs emphasizes that as opposed to other countries, where primary education covers five or six years, Bolivia must achieve the goal considering eight years of primary education,
which means that the country must make more efforts - as compared to other countries – to achieve
the goal of universal primary education.
7
The results in terms of primary education are set in the framework of efforts made by the
government – with help from the international donor community – to make headway in
the Educational Reform process.12
With regard to health, the health programs and policies have focused on a reduction of
maternal – infant mortality, the achievement of enhanced coverage in terms of the
medical health care insurance within the framework of a decentralized expenditure
system and the development of specific programs to cope with the principal transmittable
diseases and existing vector transmitted diseases in Bolivia (Malaria, Chagas,
Tuberculosis), under the Epidemiological Shield program.13
Spending in pensions was the second most important component of social expenditure,
which resulted from the transition cost of the Pension Reform implemented as from 1997
being higher than the estimated cost.14
Thanks to strong support from the international donor community and resources from the
HIPC II initiative, it has been possible to increase expenditure in basic sanitation,
urbanism and rural development.
The National Emergency Employment Plan (PLANE) was conceived as a program to
deal with increasing unemployment as a consequence of the economic crisis, by means of
supporting programs, projects or activities for public benefit, thereto funding labor.
PLANE funds come from external sources and are a temporary measure.15
With respect to the composition of social expenditure, a higher proportion is destined to
current expenses, and within the latter, the most important items are salaries in the sectors
of Education and Health and retirement pensions.
In terms of the social capital expenditure, the most important item covers public
investment projects associated with rural development and the creation of infrastructure
for education.
12
Results on achievements in education in Bolivia can be found in the document titled: “Education in
Bolivia: Indicators, Numbers and Outcomes”. Ministry of Education. 2004. 13
A detailed overview of the programs and results thereof can be found in the study “Reform of the
Health Sector in Bolivia: Analysis in the Context of Decentralization”. World Bank, 2004. 14
The government has set up a Special Technical Commission to analyze the current cost of pensions
and to propose alternatives to either reduce the cost or find funding sources that do not endanger
sustainability of the deficit. The World Bank is supporting this commission, developing a model to
estimate the transition cost of the Reform.
Details on the causes of the higher cost of the Pension Reform can be found in the working paper
“Simulating the Costs of the Pension Reform in Bolivia”. Leslie Martín. World Bank. 2004 15
The PLANE supports the creation or maintenance of basic infrastructure works, thereto granting
resources to cover salaries. As these salaries covered with PLANE resources are for works, this
program was maintained as a capital expense.

8
Table Nº 2
Composition of Social Expenditure
(In percentage of GDP) 1999 2000 2001 2002 2003 (p)
Current Social Expenditure 12.1 12.3 13.8 14.5 14.3
Health 2.8 2.8 3.1 3.0 3.2 (of which salaries) 1.1 1.1 1.3 1.4 1.5 Education 5.3 5.1 5.9 6.5 6.3 (of which salaries) 3.1 3.0 3.3 3.7 3.9 (of which Universities) 1.5 1.6 1.7 1.9 1.9 (of which TGN resources – Universities) 0.7 0.7 0.7 0.7 0.9 Pensions (1) 3.7 4.1 4.5 4.6 4.5 Others (2) 0.3 0.3 0.3 0.3 0.3
Social capital expenditure 4.4 4.7 5.5 5.8 4.8
Health 0.5 0.7 0.6 0.8 0.6 Education 0.9 1.0 1.4 1.5 1.1 Basic Sanitation 1.2 1.1 0.9 0.6 0.5 Urbanism 0.6 0.6 0.8 0.8 0.7 Rural Development 1.2 1.3 1.7 1.7 1.5 Of which Community Roads 0.5 0.5 0.7 0.8 0.7 Multisectoral 0.0 0.0 0.0 0.0 0.1 PLANE 0.0 0.0 0.0 0.4 0.3
Total Social Expenditure 16.5 17.0 19.3 20.2 19.1
Source: Prepared on the basis of information from the UPF. (1) Does not include public sector contributions to AFPs
(2) Includes public sector contributions to AFPs and the “Social Management Expenditure” of Prefectures
(p) Preliminary
2. EQUITY IN PUBLIC SOCIAL EXPENDITURE
As we will see in this chapter, the principal finding of this study is that public social
expenditure - excluding pensions – mostly benefits the poor population. However, based
on an analysis of the different components of social expenditure, it is possible to have a
better idea of the level of equity. It is important to discuss this aspect and take it into
account in resource allocation criteria, particularly within the framework of the strong
budget restrictions in the public sector.
In other words, in the discussions on the overall budget of the nation, the component of
progressivity or regressivity of public social spending should be one of the key elements
to decide on expenditure policies.
2.1 Equity in Current Expenditure
2.1.1 Overall Outcomes
In general terms, when pensions are included, on an aggregated basis current public
social expenditure benefited more non-poor than poor households in 2002 (54% versus
46%).16 But if pensions are excluded, then social expenditure benefited more poor
households as compared to non-poor households (60.4% versus 39.6%).
16
The overall equity of current expenditure is simply an aggregation of poverty-related equity
estimates for education, health and pensions. The estimates excluded the category of contributions to
AFPs, as these do not form part of the retirement pension of pensioners as well as the information on social expenditure of municipalities and prefectures, as no information is available on the destination
of theses expenses.

9
If a comparison is made with the year 1999, then there is a visible trend towards increasing
equity in the expenditure in education and health, as a higher proportion of the current
expenditure in both sectors favored poor households.
Table Nº 3
Equity in Current Social Expenditure
(In percentage) Type of
Expenditure
1999 2002
Poor Non-poor Total Poor Non-poor Total
Education (1) 58.1 41.9 100 60.6 39.4 100
Health (2) 56.9 43.1 100 60.1 39.9 100
Subtotal 57.7 42.3 100 60.4 39.6 100
Pensions (2) n.a. n.a. n.a. 17 83 100
Total n.a. n.a. n.a. 46.1 53.9 100
Source: Own elaboration based on information from UPF, INE, VIPFE, and the Ministry of Education
(1) Numbers from the Ministry of Education and UPF
(2) Numbers from the UPF
n.a. Not available
In 2002, the poor households were the ones that benefited most from public expenditure,
with 61% of current social expenditure. In health, a similar situation can be seen as
60.1% of current expenditure in health benefited the poor population.
In the Latin American context, Bolivia is the country that destines most resources, as a
percentage of GDP, to education. On the other hand, Bolivia occupies an average position
as regards efforts in terms of health.
Graph Nº 5
Latin America: Public Social Expenditure in education and health in Latin America 2000-2001
(As a percentage of GDP)
Education Expenditure as Percentage of GDP
0
1
2
3
4
5
6
7
Perú
El Sal
vado
r
Gua
tem
ala
Ecuad
or
Rep
. Dom
inican
a
Uru
guay
Brasil
Col
ombia
Parag
uay
Méx
ico
Chi
le
Amér
ica
Latina
Venez
uela
Cos
ta R
ica
Argen
tina
Hon
dura
s
Panam
á
Nicar
agua
Bolivia
Perc
en
tag
e o
f G
DP
Health Expenditure as Perecentage of GDP
0
1
2
3
4
5
6
7
8
9
Ecuad
or
Parag
uay
Gua
tem
ala
Venez
uela
El Sal
vado
r
Perú
Rep
. Dom
inican
a
Méx
ico
Chi
le
Uru
guay
Brasil
Hon
dura
s
Amér
ica
Latina
Bolivia
Col
ombia
Nicar
agua
Argen
tina
Cos
ta R
ica
Panam
á
Perc
en
tag
e o
f G
DP
Source: Panorama of Social Expenditure in Latin America. ECLAC. 2003.
The expenditure in pensions mainly benefited pensioners from non-poor households
(83% in 2002).
The expenditure in pensions is the result of an obligation the State assumed as a
consequence of the pension reform.17 The impact on public expenditure is still being
17
The Pension Reform consisted in changing from a pay-as-you-go system to an individual accounts system. This conversion implied that the State assumed the cost of the transition to pay pensions under
the old system, without benefiting from active contributors. (Leslie Martín: Simulating the Cost of the
Pension Reform in Bolivia. Working paper. World Bank. 2004).

10
analyzed, because after the reform governments have taken measures that affect the cost of
the reform and that have given rise to an increase of public spending in pensions as compared
to original estimates.
Therefore, it is necessary to take into account that the expenditure the public sector incurs in
this sense is not linked to social policies in terms of poverty reduction, but to a financial
obligation the State assumed with the people who contributed to the former pension system.
Hence, the expenditure in pensions corresponds to pensions the State pays to pensioners who
contributed to the then existing pension system in their labor life. It is therefore to be
expected that the people who receive pensions are not in the category of poor people as they
probably receive a pension that reflects the salary they perceived in the last years of their
active life, which was in most cases above the poverty line.18
2.1.2 Outcomes from Different Components of Current Social Expenditure
2.1.2.1 Equity in Expenditure in Education
In every component of expenditure in education, except for higher university education,
poor households are the ones that benefit most from public spending in education. Only
32% of the expenditure destined to higher education benefited students from poor
households.19
From the perspective of the incidence of public expenditure in terms of equity20, the
results are important, taking into account that the unequal access to educational opportunities
later gives rise to inequality in the income distribution (Public Expenditure Management -
PEM. 2004 World Bank - IDB).
18
This topic will be considered more thoroughly in another part of the document. 19
The possibilities of poor students having access to university are lower as compared to non-poor
students, taking into account that the student from a poor household is obliged to join the labor market
to contribute to the household income and therefore often does not even finish the complete school
cycle (primary and secondary school). This means that the process to reach higher education in itself
is excluding. 20
Numbers on education from the UPF are not disaggregated per level of instruction; therefore,
numbers from the Ministry of Education were taken for initial, primary, secondary and alternative
education. However, when aggregated, these numbers do not coincide with UPF numbers. One of the recommendations of this study is for the UPF, with support from the General Accountancy Direction
of the State and the Ministry of Education, to disaggregate the information on education, considering
levels of instruction. This would also enhance the conciliation of numbers.

11
Table Nº 4
Equity in Expenditure in Education
(In million USD and in percentage)
Level of instruction
Non-poor Poor Total Expenditure per Level
Structure (%)
Expenditure per student
(in USD) Expenditure % Expenditure % % Total
Expenditure
1999
Initial 3.6 27.4 9.6 72.6 100 13 3.3 70.5
Primary 49.1 23.7 158.1 76.3 100 207 51 131.3
Secondary 16.3 36 29.0 64 100 45 11.2 132.8
Alternative * 5.9 48.1 6.4 51.9 100 12 3 398.4
Higher University 95.3 74.4 32.9 25.7 100 128 31.6 658.9
Total 170.3 41.9 236.0 58.1 100 406 100 174.2
2002
Initial 3.9 28.7 9.8 71.3 100 14 2.9 68.3
Primary 55.9 23.1 186.0 76.9 100 242 51.1 140.9
Secondary 20.1 36.1 35.7 63.9 100 56 11.8 125.8
Alternative * 4.6 37.4 7.7 62.61 100 12 2.6 282.8
Higher University 101.1 67.7 48.3 32.3 100 149 31.6 621.4
Total 185.7 39.4 287.5 60.6 100 473 100 178.8
Source: Own elaboration based on information from the Ministry of Education.
Note: The expenditure in universities comes from the UPF and in other levels from the Ministry of Education.
(*) Considers Primary Adult Education (PAE)
On the other hand, in 2003, the per capita public resource spending destined to university
education is almost 5 times higher than that destined to secondary education and 4.4
times than that destined to primary education.
The analysis made in the study “Public Expenditure Management for Fiscal
Sustainability and Equitable and Efficient Public Services” (PEM), by the World Bank
and IDB provides a series of conclusions regarding the allocation of resources in
education that are worth underlining, simultaneously taking into account aspects on
equity and efficiency. According to results presented in that study, it is clear that
efficiency and equity in public resource allocation are an issue in Bolivia, when
considering primary and secondary education versus higher education.
Table Nº 5
Equity and Efficiency of Public Expenditure in Education in Bolivia PRIMARY SECONDARY HIGHER
Efficiency Indicators Social Rate of Return Low-income Countries 21.3 15.7 11.2 Latin American Countries 17.4 12.9 12.3
Equity Indicators Public Expenditure in Education Benefiting the poor Population (%) 76.9 63.9 32.3 Benefiting the Non-poor Population (%) 23.1 36.1 67.7
Source: Prepared on the basis of information from the study “Public Expenditure Management For Fiscal Sustainability and Equitable and
Efficient Public Services”, World Bank, and information from the Ministry of Education and the MECOVI survey.
Results in low-income countries and Latin American counties show that the social rate of
return21 is higher in primary and secondary education than in university education: hence,
21
The income an individual perceives depends on his level of education. But, as a result of the
education of individuals, there are positive externalities for society; therefore, if these externalities are
included, the social rate of return could be higher than the private rates of return (Returns to

12
using these social rates of return as a parameter to allocate the expenditure in education, the
resources destined to primary and secondary education should be a priority in yearly budget
discussions. In the case of Bolivia, this priority is complied with for primary education, but
not for secondary education, as higher education is being benefited with a higher and
growing public resource allocation in relation to secondary education.
If the efficiency issue is complemented with equity, a distortion is also observed in this
sense, as in the case of university education, a high proportion of students from non-poor
households are benefited22.
2.1.2.2 Equity in Expenditure in Initial Education
In Initial Education, public expenditure mainly benefits poor households (73% in 1999
and 71% in 2002) and data in the graph below show a progressive incidence as a higher
percentage of expenditure at this level is concentrated in the first 4 deciles (48% in 1999
and 46% in 2002).23
Graph Nº 6
Distribution of Expenditure in Initial Education according to Income Deciles
(In percentage)
0 10 20 30 40 50 60 70 80 90
100
0 1 2 3 4 5 6 7 8 9 10
1999 2002 Equal distribution
Source: Own elaboration based on information from the Ministry of Education
However, it is important to underline that at the initial level, according to the Ministry of
Education, “access is still low as only one quarter of the children between 4 and 5 years
Investment in Education: A Further Update. George Psacharopoulos and Harry Patrinos. Working
Paper. World Bank. 2002). 22
However, there are various other aspects of which the PEM says that they must be corrected,
specifically those related to the quality of secondary education, which will be discussed below. 23
The vertical axis measures the accumulated percentage of the expenditure in initial education and
the horizontal one the income deciles. The diagonal line shows that every income decile receives a
similar proportion of the expenditure; hence, if the distribution curve of the accumulated expenditure
per deciles is above the diagonal line, then expenditure is progressive, i.e. the lower deciles receive a
higher proportion of expenditure. The limit between poor and non-poor households is between the seventh and eighth deciles.

13
old attend initial schooling, probably because of the limited availability of schools,
teachers and the low level of understanding on behalf of society of the importance of
initial schooling for performance in the next educational levels”. (Education in Bolivia:
Indicators, Numbers and Outcomes, 2004).
2.1.2.3 Equity in Primary Education
In primary education, the poor population also benefits most from this service provided
by the public sector, with a progressive trend. In 1999, 76.3% of the expenditure in
primary education benefited students from poor households, in 2002, this percentage
increased to 76.9%.
On the other hand, at the income decile level, it is clear that the expenditure in primary
education is concentrated in the first 4 poorest deciles (50% of the expenditure in 2002
and 48% in 1999).
Graph Nº 7
Distribution of the Expenditure in Primary Education according to Income Deciles
(In percentage)
0 10 20 30 40 50 60 70 80 90
100
0 1 2 3 4 5 6 7 8 9 10
1999 2002 Equal distribution
Source: Own elaboration based on information from the Ministry of Education
According to the analysis in the PEM, this progressivity was an expected result, which is
explained by the fact that primary education in Bolivia is open to all and free. On the
other hand, the highest-income households prefer to send their children to private
schools, where they can better control the quality and continuity of the education of their
children.24
Moreover, this study also says that although Bolivia is about to achieve the universal
primary education goal, there are still municipalities where access to primary education
continues to be low, because of their serious isolation.
24
This aspect should be underlined as it shows education as an element that could perpetuate existing
inequalities, because the low-income households that enroll their children in state schools do not have
the same possibility of demanding quality in the education of their children.

14
Besides and from another perspective, the Ministry of Education says that problems
regarding school desertion during the school year and learning at school are prevailing
issues in primary education.25
The previous aspects show that although public spending in primary education is pro-
poor, there are still some equity issues (in terms of isolated municipalities where access
to primary education is still low), as well as quality issues. Hence, maintaining the
emphasis on achieving universal primary education, these two issues should also be
tackled.
2.1.2.4 Equity in Higher Education
Although public expenditure in secondary education mainly benefits students from poor
households (64% in 1999 and 2002), at decile level there is a regressive trend in
distribution of the expenditure because among the poor households, the households in the
lowest-income deciles are the ones that benefit the least from the expenditure in
secondary education. Students coming from the households in the four poorest deciles
benefited from the expenditure in education in 33.6% in 1999 and in 33.7% in 2002.
Graph Nº 8
Distribution of the Expenditure in Secondary Education according to Expenditure Deciles
(In percentage)
0 10 20 30 40 50 60 70 80 90
100
0 1 2 3 4 5 6 7 8 9 10
1999 2002 Equal distribution
Source: Own elaboration based on information from the Ministry of Education
On the other hand, and from the perspective of expenditure, the PEM states that, in spite
of the strong growth in secondary enrollment (41% between 1997 and 2002), one of the
most acute problems of public expenditure in Bolivia, is the low amount of resources
channeled to secondary education.26
25
The Ministry of Education says that school desertion in the first and seventh grades of primary school is high. (Education in Bolivia: Indicators, Numbers and Outcomes). 26
According to the PEM, Bolivia destines only about one third to secondary education of the
expenditure other developing countries destine to this level.

15
On the other hand, the Ministry of Education mentions that there are also problems
related to the quality of secondary education, as students show low levels of performance
in language, comprehension and mathematics.27
Therefore, besides improving equity in public expenditure at the level of secondary
education, the State must focus on increased efficiency in the use of public resources,
destining a higher amount to this level of instruction, and improving the quality of
secondary education.
2.1.2.5 Equity in Alternative Education
In 2002, 62.6% of alternative education28 benefited students from poor households, and
the equity of public expenditure at this level of instruction is higher as compared to 1999
(51.9%).
At decile level, there is a regressive trend of the public expenditure, even though at this
level, in 2002 the situation was less pronounced as compared to 1999 as the 4 lowest
deciles benefited from higher amounts of public expenditure (32% versus 15%).
Graph Nº 9
Distribution of the Expenditure in Alternative Education according to Income Deciles
(In percentage)
0 10 20 30 40 50 60 70 80 90
100
0 1 2 3 4 5 6 7 8 9 10
1999 2002 Equal distribution
Source: Own elaboration based on information from the Ministry of Education
Nonetheless, the study on Education in Bolivia of the Ministry of Education states that even
tough enrollment in adult education increased significantly (from 81,480 students in 1999 to
120,780 in 2002), there are difficulties to make headway in this level of instruction.
27
According to the Ministry of Education, results of the Academic Aptitude Test in 2001 show that
only nearly one third of young people have a high level of vocabulary and syntax and a little less than
half of the students in reading comprehension. In mathematics, only one third of the students show a
high performance in geometry, algebra and applied statistics. 28
Alternative education focuses on the completion of education for persons and on enabling access to
education for the people who, because of their age, exceptional physical and mental conditions, did not start or conclude their studies in formal education. Alternative education in Bolivia is divided into
three big areas: adult education, special education and permanent education. (Excerpted from the
document “Education in Bolivia: Indicators, Numbers and Outcomes, Ministry of Education, 2004).

16
These difficulties are related to training of facilitators, deficiencies in study plans, budget
allocation, a lack of teacher training schools, a shortage of teachers, etc.
Hence, although public expenditure in alternative education mainly benefits the poor,
there are problems regarding quality of the expenditure and a lack of budget.
2.1.2.6 Equity in University Education
It was said already that public expenditure in university education in Bolivia increased to
very high levels. In 1995, this level accounted for 26% of public expenditure in
education, while in 2003 that percentage rose to 30%. But this increase benefited students
from non-poor households.
Only 11.7% of the expenditure in higher education in 1999 benefited students living in
households in the first four poorest income deciles, and only 7.6% in 2002.
Graph Nº 10
Distribution of Expenditure in Higher Education according to Expenditure Deciles
(In percentage)
0
10
20
30
40
50
60
70
80
90
100
0 1 2 3 4 5 6 7 8 9 10
1999 2002 Equal distribution
Source: Own elaboration based on information from the Ministry of Education and UPF
As was mentioned before, besides equity issues, the expansion of state universities in
Bolivia in a context of strong budget restrictions did not take place within the framework
of a discussion on priorities in the field of resource allocation in the educational system
as a whole. This is probably one of the principal discussions that should be held when
discussing the General Budget of the Nation and allocating resources to the educational
system.
2.1.3 Equity of Social Expenditure in Health
In the case of health care expenses, equity was measured by distributing the expenditure
based on the poverty condition of the households of which the person who was attended

17
in a state health care facility forms part. The result obtained this way shows that 57% of
the expenditure in health benefits people from poor households.29
Table Nº 6
Equity in the Expenditure in Health Category Non-poor Poor Total
1999
Number of Attended Persons 2,489,412 3,289,884 5,779,296 Structure 43.1 56.9 100
Expenditure (In million USD) 85 112 197
2002
Number of Attended Persons 2,249,616 3,382,752 5,632,368 Structure 39.9 60.1 100
Expenditure (In million USD) 101 151 252
Source: Own elaboration based on information from MECOVI 1999- 2002 and UPF
On the other hand, when the expenditure in health is disaggregated according to income
deciles of the household to which the attended person belongs, it becomes clear that
although public expenditure in health benefited more persons of poor households, the
distribution was less favorable for households in the lowest (poorest) income deciles.
The four poorest deciles were benefited with 37.5% of the expenditure in health in 1999
and 34.2% in 2002.
Graph Nº 11
Distribution of Current Expenditure in Health, measured in terms of Medical Attendance in
State Hospitals, according to Poverty of the Attended Person
(In percentage)
0
10
20
30
40
50
60
70
80
90
100
0 1 2 3 4 5 6 7 8 9 10
1999 2002 Equal distribution
Source: Own elaboration based on information from MECOVI 1999- 2002 and UPF
On the other hand, complementary information from the MECOVI survey with respect to
the number of provided attendances, shows that cases of “not attended”, “attended at
home” or “in another place” are concentrated in poor households, which can be
interpreted in the sense that poor households have less access to public health care
services.
29
See Annex on Methodology for further explanations.

18
The number of attendances is higher in the lower deciles, which shows that the
probability of diseases or accidents in the lowest deciles is higher as compared to the
higher deciles. This is because the poorest people are normally more exposed to higher
risks for their health.
Graph Nº 12
Number of Attendances, according to the place of attendance
(In number of attendances)
Number of sick people by deciles, according to the place of attendance,
2002
-
200,000
400,000
600,000
800,000
1,000,000
1,200,000
1,400,000
1,600,000
1,800,000
2,000,000
Poorest
decil
2 3 4 5 6 7 8 9 Richest
decil
Nu
mb
er
of
att
en
dan
ce
Public Non Attendance, at home, other places Private Total number of attendance
Source: Own elaboration based on information from the MECOVI survey 2002
2.1.4 Equity in Social Expenditure in Pensions
If the poverty condition of the households to which the pensioner belongs (information
obtained from the MECOVI survey) is assumed as an approximation to measure the
incidence of public expenditure in pensions, the deduction is that most of the social
expenditure in pensions (83%) is destined to people from non-poor households. This
result was to be expected, taking into account that the average value of the pension
pensioners receive, exceeds the poverty line value (Bs. 1,096 versus Bs. 322 in the urban
area and Bs. 233 in the rural area rural30
) and that, in general, in case the pensioner does
not live alone (for example, if (s)he lives with his/her children or relatives), his/her
income forms part of the household income.
30
The poverty lines used are the ones calculated by UDAPE. See annex.

19
Table Nº 7
Distribution and expenditure in pensions according to the poverty situation of
the pensioner’s household 2002
(In million dollars and in percentage) Category Non-poor Poor Total
Retirement 84.15 15.85 100 Disability 88.24 11.76 100 Widowhood 76.63 23.37 100 Retirement and widowhood 100.00 - 100 Orphanhood 100.00 - 100
Total 83.04 16.96 100
Expenditure in Pensions, assuming the poverty condition of the pensioner’s household (In million USD) 276 53 333
Source: Own elaboration based on MECOVI 2002 and UPF
If the expenditure in pensions is broken down into income quintiles31 of the household to
which the pensioner belongs, then it becomes clear that most pensioners live in households
located in the higher or wealthiest quintiles.
Table Nº 8
Expenditure in pensions according to the Income Quintile of the Household of which the
Pensioner forms part
(In percentage) Quintile % Accumulated %
Quintile 1 (poorest) 10.0 10.0 Quintile 2 13.0 23.0 Quintile 3 14.0 37.0 Quintile 4 24.0 61.0 Quintile 5 (wealthiest) 39.0 100.0 Total 100.0
Source: Own elaboration based on MECOVI 2002 and UPF
Nonetheless, in the lowest quintiles, the level of dependency of the household income on
the pensioner’s income is higher than in the highest quintiles. This suggests that the
pensioner continues to be the head of the family (i.e. the household depends on his
income) or that the other members of the household – even those who can still work
considering their age – cannot find a job or they work but their average salary is very
low.
Table Nº 9
Degree of Dependency of the Household Income with respect to the Pensioner’s Retirement
Income
Quintile Number of
households
Average number of household members
Average number of
income perceivers
(1)
Average number of pensioners
per household
Average household income (In Bs./month)
Average income
from pensions
(In Bs./month)
Proportion of the
household income (In
percentage)
Quintile 1 7,301 1.6 0.2 1.0 1059 798 75 Quintile 2 10,560 2.7 0.5 1.0 1301 867 67 Quintile 3 19,099 3.2 0.8 1.0 1542 918 59 Quintile 4 24,519 4.1 1.2 1.1 2279 1,062 47 Quintile 5 43,008 4.5 1.3 1.2 4719 1,571 33
Source: Own elaboration based on MECOVI 2002
(1) Except pensioners
31
Considering characteristics of the sample, quintiles instead of deciles were used.

20
2.2 Execution of Social Capital Expenditure
The expenditure decentralization policies implemented as from the Popular Participation
Law and the Decentralization Law, as well as the Dialogue Law 2000 for the distribution
of HIPC II resources (which used to be destined to payment of the foreign debt service)
to municipalities, have provided municipalities with more resources for investment.
Most of the social capital spending is destined to public investment projects executed in
the municipalities (73% of the total capital expenditure in 2003), followed by
multimunicipal investment projects (projects benefiting two or more municipalities).
Besides, there is the so-called national category for public investment projects benefiting
the country as a whole.
At the municipal level, the public investment projects are mainly destined to Education,
Urbanism and Rural Development. The national projects concentrate on education and to
a lesser extent on Rural Development and Health. Finally, the multimunicipal projects
mostly focus on Rural Development and Health.
The multisectoral social expenditure category corresponds to a series of projects executed
at the municipal level with HIPC resources that do not correspond to any other category
of social capital expenditure, such as territorial organization, citizen safety, environment,
ethnias, gender and others. The participation of these areas in the composition of social
expenditure is little significant (0.06% of GDP in 2003).
Table Nº 10
Social Capital Expenditure according to expenditure groups
(As a percentage of GDP)
Category 2001 2002 2003 (e)
Nat. Multim. Mun. Total Nat. Multim. Mun. Total Nat. Multim. Mun. Total
Health 0.01 0.16 0.46 0.63 0.07 0.24 0.46 0.77 0.06 0.26 0.28 0.60 Education 0.54 0.18 0.67 1.38 0.31 0.05 1.09 1.45 0.20 0.04 0.87 1.12 Basic Sanitation 0.00 0.07 0.88 0.95 0.01 0.04 0.60 0.64 0.01 0.01 0.49 0.51 Urbanism 0.03 0.04 0.76 0.83 0.02 0.01 0.81 0.84 0.02 0.00 0.71 0.73 Rural Development 0.05 0.55 1.08 1.68 0.03 0.62 1.03 1.68 0.04 0.65 0.83 1.52
o/w Community Roads 0.00 0.15 0.59 0.74 0.00 0.43 0.37 0.80 0.00 0.43 0.28 0.71 Multisectoral 0.00 0.00 0.01 0.01 0.00 0.00 0.05 0.05 0.00 0.00 0.06 0.06 PLANE 0.00 0.00 0.00 0.00 0.00 0.00 0.00 0.35 0.00 0.00 0.28 0.28
Total 0.63 1.00 3.85 5.48 0.43 0.97 4.03 5.78 0.33 0.96 3.52 4.81
Percentage of Capital Expenditure 11.50 18.25 70.25 100 7.44 16.78 69.72 100 6.86 19.96 73.18 100
Source: Prepared on the basis of information from the UPF and VIPFE. (e) Estimate

21
2.2.1 Social Capital Expenditure and Poverty
In the last three years, a growing proportion of the social capital expenditure identified at
the municipal level (i.e. excluding national multimunicipal and departmental
multimunicipal capital expenditure) has been destined to municipalities with a UBN
index that is higher than the national UBN index (58.6%).32
Table Nº 11
Distribution of Social Capital Expenditure in Municipalities according to their Level of Poverty
(UBN)
(In percentage)
Category Number of
Municipalities
2001 2002 2003(p)
%
Accumulated % Population %
Accumulated % Population %
Accumulated % Population
Municip. with UBN between 100-90 162 15.3 15.3 1,714,193 17.2 17.2 1,737,075 17.1 17.1 1,759,829 89.9-80 66 8.2 23.5 1,025,811 10.0 27.2 1,045,535 12.6 29.7 1,065,392 79.9-70 29 3.7 27.2 369,213 5.6 32.9 374,546 4.1 33.7 379,892 69.9-60 18 4.5 31.7 956,835 5.0 37.8 992,133 9.6 43.3 1,028,290 59.9-50 17 9.7 41.4 758,695 8.7 46.5 764,492 7.8 51.1 769,990 49.9-40 12 8.5 49.9 486,780 5.6 52.1 508,998 6.5 57.5 532,220 39.9 and less 10 20.4 70.3 3,116,263 17.6 69.7 3,201,493 15.7 73.3 3,288,133 Total Municipalities 314 70.3 70.3 8,427,790 69.7 69.7 8,624,272 73.2 73.2 8,823,746 National 11.4 81.7 7.4 77.1 6.9 80.1 Multimunicipal 18.3 100 16.8 93.9 19.9 100 PLANE 0 100 6.1 100 0 100
Source: Own elaboration based on information from UPF, INE, PLANE
(p) Preliminary
(1) For the year 2003, the PLANE is included in expenditure at the municipal level.
In 2001, 70.3% of the capital expenditure was executed at the level of municipalities,
45% of which in municipalities with a UBN index above the national UBN index. In
2002 and 2003, these percentages rose to 70% and 54%, and 73% and 59%, respectively.
Adjusting – for every UBN category of municipalities – social capital expenditure in
terms of the per capita average, it is possible to compare the relative efforts of the public
sector to decrease disparities in the provision of social infrastructure. Considering this
aspect, it is clear that the per capita social capital expenditure in the relatively poorest
municipalities (with UBN indices under the national UBN index) is higher as compared
to the municipal per capita average and that the relatively less poor municipalities (with a
UBN index above the national UBN index) show a lower per capita expenditure pattern.
32
The higher the UBN percentage, the poorer the municipalities. For practical reasons, the assumption
is that municipalities above the national UBN index are those in the range of 100-60 and those under
the national UBN index are those with a UBN index between 59.9 and less.

22
Table Nº12
Social Capital Expenditure in municipalities according to Poverty Level (UBN)
Category
2001 2002 2003(p)
Capital Expenditure (Million USD)
Per Capita Expenditure
Capital Expenditure (Million USD)
Per Capita Expenditure
Capital Expenditure
(Million USD) Per Capita
Expenditure
Municip. with UBN between 100-90 66.7 38.9 79.1 45.5 63.9 36.3 89.9-80 35.9 35 46.1 44.1 46.9 44 79.9-70 16.1 43.6 25.9 69.3 15.2 40 69.9-60 19.7 20.6 22.9 23.1 35.9 34.9 59.9-50 42.4 55.9 39.8 52.1 29 37.6 49.9-40 37 76 25.7 50.4 24.1 45.3 39.9 and less 89.3 28.7 81 25.3 58.7 17.8 Total Municipalities 307.2 36.4 320.5 37.2 273.7 31 National 49.9 34 25.8 Multimunicipal 79.9 77.3 74.2 PLANE - 28 0
Total 437 459.8 373.7
Source: Own elaboration based on information from UPF, INE, PLANE
(p) Preliminary
(1) For the year 2003, the PLANE is included in expenditure at the municipal level.
From the point of view of funding sources for social capital expenditure, the following
graphs show that the resources are concentrated in the extremes, i.e. the poorest
municipalities (UBN between 100 and 80) and the least poor ones (UBN under 40) are
the ones receiving the highest proportion of the resources.
External donors tend to distribute their resources in a relatively similar proportion
between municipalities with a UBN under the national UBN Index (58.6%) and
municipalities with a UBN above the national UBN index.
On the other hand, based on the graphs it is possible to deduct that in 2003, more efforts
have been made to achieve more equity in social capital expenditure, as there is a trend of
the resources being destined more to municipalities with higher UBN indices.

23
Graphs Nº 13
Distribution of Social Capital Expenditure in Municipalities according to
the Poverty Level (UBN) and Funding Source
(In percentage)
Funding of Capital Expenditure, 2001
-
5
10
15
20
25
30
35
40
100-90 90-80 80-70 70-60 60-50 50-40 40 and less
VIPFE (Internal Funding + Municipal Estimate) HIPC External Funding TOTAL
Funding of Social Capital Expenditure, 2002
-
5
10
15
20
25
30
35
40
45
100-90 90-80 80-70 70-60 60-50 50-40 40 and less
VIPFE (Internal Funding + Municipal Estimate) HIPC External Funding TOTAL
Funding of Capital Expenditure, 2003
0
5
10
15
20
25
30
35
40
45
100-90 90-80 80-70 70-60 60-50 50-40 40 y
menos
VIPFE (Financiamiento Interno) HIPC Financiamiento Externo TOTAL
Source: Own elaboration based on information from UPF, INE, PLANE

24
The HIPC resources have influenced growing equity in social capital expenditure, as a
result of the Dialogue Law 2000 that says that 70% of the special account of the dialogue
2000 must be distributed according to the UBN index, that is to say, the poorest
municipalities must receive most resources.
Table Nº 13
Per Capita Social Expenditure in Municipalities according to the Poverty Level (UBN) and
Funding Source
(In USD)
VIPFE (Internal
Funding) HIPC(1) External Funding TOTAL
2001
Municipalities with UBN between
100-90 22.51 1.73 14.68 38.92 89.9-80 22.07 1.59 11.37 35.03 79.9-70 26.86 1.59 15.15 43.61 69.9-60 13.55 1.52 5.50 20.57 59.9-50 37.41 1.15 17.31 55.88 49.9-40 57.56 0.96 17.50 76.02 39.9 and less 16.06 0.27 12.33 28.67
2002
Municipalities with UBN between
100-90 19.52 13.14 12.85 45.51 89.9-80 18.34 10.43 15.34 44.12 79.9-70 36.78 9.19 23.32 69.28 69.9-60 12.24 5.74 5.13 23.11 59.9-50 32.96 5.42 13.72 52.10 49.9-40 35.46 5.07 9.89 50.41 39.9 and less 17.88 1.86 5.55 25.29
2003
Municipalities with UBN between
100-90 12.95 12.58 10.79 36.31 89.9-80 14.45 10.10 19.48 44.04 79.9-70 20.15 9.19 10.65 39.99 69.9-60 15.83 5.86 13.20 34.89 59.9-50 19.78 5.34 12.50 37.62 49.9-40 29.87 5.01 10.45 45.32 39.9 and less 8.27 2.04 7.54 17.85
Source: Own elaboration based on information from UPF, INE, PLANE
(1) Corresponds to resources coming from the Special Account of the dialogue 2000
2.2.2 Equity in Social Capital Expenditure in Education
On average, social capital expenditure in education has accounted for 31% of the social
capital expenditure between 2001 and 2003, the highest part of which is destined to
investment projects benefiting a specific municipality.
The multimunicipal public investment projects in education mainly include the Support
Program for Children under 6 (PAN), literacy programs, and technical education in
agriculture and livestock.
National public investment projects mainly include teacher training and education,
decentralization of educational management, curriculum development, environmental
plans and technical assistance.
25
Graph Nº 14
Social Capital Expenditure in Education
(In percentage)
0
10
20
30
40
50
60
70
80
90
100
2001 2002 2003
Rest of Capital Expenditure Capital Expenditure in Education
Source: Own elaboration based on information from UPF, INE, PLANE
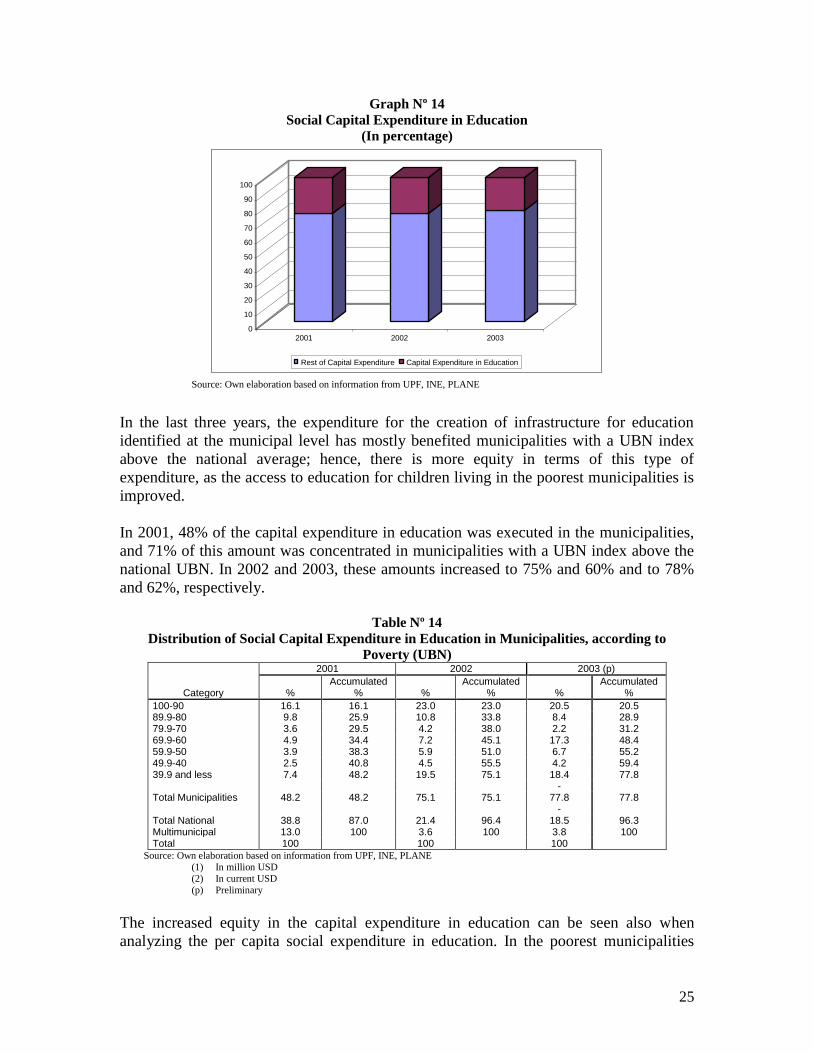
In the last three years, the expenditure for the creation of infrastructure for education
identified at the municipal level has mostly benefited municipalities with a UBN index
above the national average; hence, there is more equity in terms of this type of
expenditure, as the access to education for children living in the poorest municipalities is
improved.
In 2001, 48% of the capital expenditure in education was executed in the municipalities,
and 71% of this amount was concentrated in municipalities with a UBN index above the
national UBN. In 2002 and 2003, these amounts increased to 75% and 60% and to 78%
and 62%, respectively.
Table Nº 14
Distribution of Social Capital Expenditure in Education in Municipalities, according to
Poverty (UBN)
Category
2001 2002 2003 (p)
% Accumulated
% % Accumulated
% % Accumulated
%
100-90 16.1 16.1 23.0 23.0 20.5 20.5 89.9-80 9.8 25.9 10.8 33.8 8.4 28.9 79.9-70 3.6 29.5 4.2 38.0 2.2 31.2 69.9-60 4.9 34.4 7.2 45.1 17.3 48.4 59.9-50 3.9 38.3 5.9 51.0 6.7 55.2 49.9-40 2.5 40.8 4.5 55.5 4.2 59.4 39.9 and less 7.4 48.2 19.5 75.1 18.4 77.8 - Total Municipalities 48.2 48.2 75.1 75.1 77.8 77.8 - Total National 38.8 87.0 21.4 96.4 18.5 96.3 Multimunicipal 13.0 100 3.6 100 3.8 100 Total 100 100 100
Source: Own elaboration based on information from UPF, INE, PLANE
(1) In million USD
(2) In current USD
(p) Preliminary
The increased equity in the capital expenditure in education can be seen also when
analyzing the per capita social expenditure in education. In the poorest municipalities

26
with a UBN above the national UBN index, the per capita index in educational
infrastructure projects is the highest.
Table Nº 15
Social Capital Expenditure in Municipalities, according to Poverty (UBN)
Category
2001 2002 2003 (p)
Total Expenditure in Education (1)
Per capita Expenditure in Education (2)
Total Expenditure in Education (1)
Per capita Expenditure in Education (2)
Total Expenditure in Education (1)
Per capita Expenditure in Education (2)
100-90 17.8 10.4 26.5 15.3 17.5 9.9 89.9-80 10.8 10.6 12.5 11.9 7.1 6.7 79.9-70 4.0 10.6 4.9 13.0 1.9 5.0 69.9-60 5.4 5.6 8.3 8.3 14.7 14.3 59.9-50 4.3 5.8 6.8 8.8 5.7 7.5 49.9-40 2.8 5.7 5.2 10.3 3.6 6.8 39.9 and less 8.2 2.6 22.5 7.04 15.6 4.8 Total Municipalities 53.2 86.6 66.2 Total National 42.8 24.6 15.7 Multimunicipal 14.3 4.2 3.2 Total 110.4 115.4 85.0
Source: Own elaboration based on information from UPF, INE, PLANE
(1) In million USD
(2) In current USD
(p) Preliminary
2.2.3 Equity of Social Capital Expenditure in Health
On average, the social capital expenditure in health has accounted for 11% of the total
social capital expenditure. In 2001 and 2002, most public investment projects were
executed in the municipalities. However in 2003, most capital expenditure in health was
executed in national and multimunicipal projects. The reason is that in that year, the
execution in programs related to the Health Reform, integrated health care projects and
food security programs was higher.
Graph Nº 15
Social Capital Expenditure in Health
(In percentage)
0
10
20
30
40
50
60
70
80
90
100
2001 2002 2003
Rest of Capital Expenditure Capital Expenditure in Health
Source: Own elaboration based on information from UPF, INE, PLANE

27
The multimunicipal public investment projects include the health care reform, integrated
health care programs, hospital equipment and disease control programs. National
programs, on the other hand, include the epidemiological shield.
In 2001 and 2002, the expenditure in health care infrastructure mostly benefited the
relatively less poor municipalities (with a UBN under the national UBN index). In 2003,
the distribution was more equitable, as the relatively poorer municipalities benefited more
from capital expenditure in health.
Table Nº 16
Distribution of Social Capital Expenditure in Health in Municipalities, according to Poverty
(UBN)
Category
2001 2002 2003(p)
% Accumulated
% % Accumulated
% % Accumulated
%
100-90 11.1 11.1 11.6 11.6 10.4 10.4 89.9-80 9.6 20.7 6.9 18.5 9.1 19.5 79.9-70 3.8 24.5 3.4 21.9 3.0 22.5 69.9-60 5.1 29.6 5.1 26.9 5.4 27.9 59.9-50 12.4 42.0 5.2 32.2 6.1 34.1 49.9-40 8.9 50.9 1.2 33.4 2.4 36.5 39.9 and less 22.4 73.4 26.5 59.9 9.0 45.4 Total Municipalities 73.4 73.4 59.9 59.9 45.4 45.4 National 2.1 75.5 8.6 68.5 10.7 56.2 Multimunicipal 24.6 100 31.5 100.0 43.8 100.0 Total 100 100 100
Source: Own elaboration based on information from UPF, INE, PLANE
(1) In million USD
(2) In current USD
(p) Preliminary
In 2001, 73% of the capital expenditure in health was executed in the municipalities, and
57% of this amount was concentrated in municipalities with a UBN above the national
average; in 2002 and 2003, these amounts amounted to 60% and 54% and to 45% and
75%, respectively.
Table Nº 17
Social Capital Expenditure in Health in Municipalities, according to Poverty (UBN)
Category
2001 2002 2003
Total Expenditure in
Health (1)
Per capita Expenditure in
Health (2)
Total Expenditure in
Health (1)
Per capita Expenditure in
Health (2)
Total Expenditure in
Health (1)
Per capita Expenditure in
Health (2)
100-90 5.6 3.2 7.1 4.1 4.7 2.7 89.9-80 4.8 4.7 4.2 4.0 4.1 3.9 79.9-70 1.9 5.2 2.1 5.6 1.3 3.6 69.9-60 2.6 2.7 3.1 3.1 2.4 2.4 59.9-50 6.4 8.2 3.2 4.2 2.8 3.6 49.9-40 4.5 9.2 0.7 1.4 1.1 2.0 39.9 and less 11.3 3.6 16.3 5.1 4.0 1.2 Total Municipalities 37.1 36.9 20.7 National 1.1 5.2 4.9 Multimunicipal 12.4 19.4 20.0 Total 50.6 61.6 45.7
Source: Own elaboration based on information from UPF, INE, PLANE
(1) In million USD
(2) In current USD
(p) Preliminary

28
In terms of the per capita capital expenditure in health, the pattern is relatively similar,
i.e. in 2003, there is more equity in the distribution of the expenditure in health as
compared to the two previous years.
2.2.4 Equity in Social Capital Expenditure in Rural Development
The social expenditure in Rural Development mainly includes public investment projects
in electrification, agricultural and livestock development and community roads.
Between 2001 and 2003, the social capital expenditure in Rural Development averaged
30% of the total social capital expenditure. Most of the capital expenditure in Rural
Development is executed at the municipal level, and an important percentage of this
expenditure is destined to the construction of community roads.
Graph Nº 16
Social Capital Expenditure in Rural Development
(In percentage)
0
10
20
30
40
50
60
70
80
90
100
2001 2002 2003
Rest of Capital Expenditure Capital Expenditure in Rural Development
Source: Own elaboration based on information from UPF, INE, PLANE
The multimunicipal public investment projects in rural development include programs in
support of development strategies, agricultural and livestock programs, road paving and
rehabilitation, and rural electrification programs. On the other hand, the national
programs include programs for technical assistance in the rural area, road maintenance
and transportation plans.
The expenditure in the creation of infrastructure in rural areas has a high equity
component, as most of the public investment projects are executed in the poorest
municipalities, which is a trend maintained throughout the three analyzed years.
In 2001, 64% of the capital expenditure in rural development was executed in the
municipalities, and 60% of this amount was executed in municipalities with a UBN above
the national UBN; in 2002 and 2003, these amounts accounted for 61% and 84% and
55% and 84%, respectively.

29
Table Nº 18
Distribution of Social Capital Expenditure in Rural Development in Municipalities, according to
Poverty (UBN)
Category
2001 2002 2003(p)
% Accumulated
% % Accumulated
% % Accumulated
%
100-90 23.5 23.5 24.0 24.0 19.0 19.0 89.9-80 8.1 31.6 14.1 38.1 19.9 38.9 79.9-70 5.1 36.8 10.2 48.3 5.4 44.3 69.9-60 1.7 38.5 2.8 51.1 1.7 46.0 59.9-50 4.6 43.1 2.9 54.0 1.8 47.8 49.9-40 7.3 50.3 3.8 57.8 3.7 51.5 39.9 and less 13.8 64.2 3.3 61.1 3.0 54.5 Total Municipalities 64.2 64.2 61.1 61.1 54.5 54.5 National 2.9 67.1 1.7 62.8 2.6 57.0 Multimunicipal 33.0 100.0 37.2 100.0 43.0 100.0 Total 100 100 100
Source: Own elaboration based on information from UPF, INE, PLANE
(1) In million USD
(2) In current USD
(p) Preliminary
When analyzing the per capita capital expenditure, it is clear that the per capita
expenditure in the poorest municipalities (UBN of 100-90) is several times higher than
that registered in the wealthier municipalities (UBN of 40 or less), which shows that the
disparities in the provision of rural infrastructure will decrease if this trend is pursued.
Table Nº 19
Social Capital Expenditure in Rural Development in Municipalities, according to Poverty (UBN)
Category
2001 2002 2003(p)
Total Expenditure in
Rural Development (1)
Per Capita Expenditure in
Rural Development (2)
Total Expenditure in
Rural Development (1)
Per Capita Expenditure in
Rural Development (2)
Total Expenditure in
Rural Development (1)
Per Capita Expenditure in
Rural Development (2)
100-90 31.5 18.4 32.0 18.4 22.2 12.6 89.9-80 10.8 10.6 18.8 18.0 23.4 21.9 79.9-70 6.8 18.6 13.5 36.2 6.3 16.7 69.9-60 2.3 2.4 3.7 3.7 2.0 1.9 59.9-50 6.1 8.1 3.9 5.1 2.1 2.7 49.9-40 9.7 20.0 5.0 9.8 4.3 8.1 39.9 and less 18.5 5.9 4.4 1.3 3.4 1.0 Total Municipalities 86.0 81.6 64.0 National 3.8 2.2 3.0 Multimunicipal 44.2 49.6 50.5 Total 134.1 133.4 117.6
Source: Own elaboration based on information from UPF, INE, PLANE
(1) In million USD
(2) In current USD
(p) Preliminary
2.2.5 Equity in Social Capital Expenditure in Basic Sanitation
The social expenditure in basic sanitation includes public investment programs and
projects in drinking water and basic sanitation, as well as programs related to solid waste
collection and disposal.
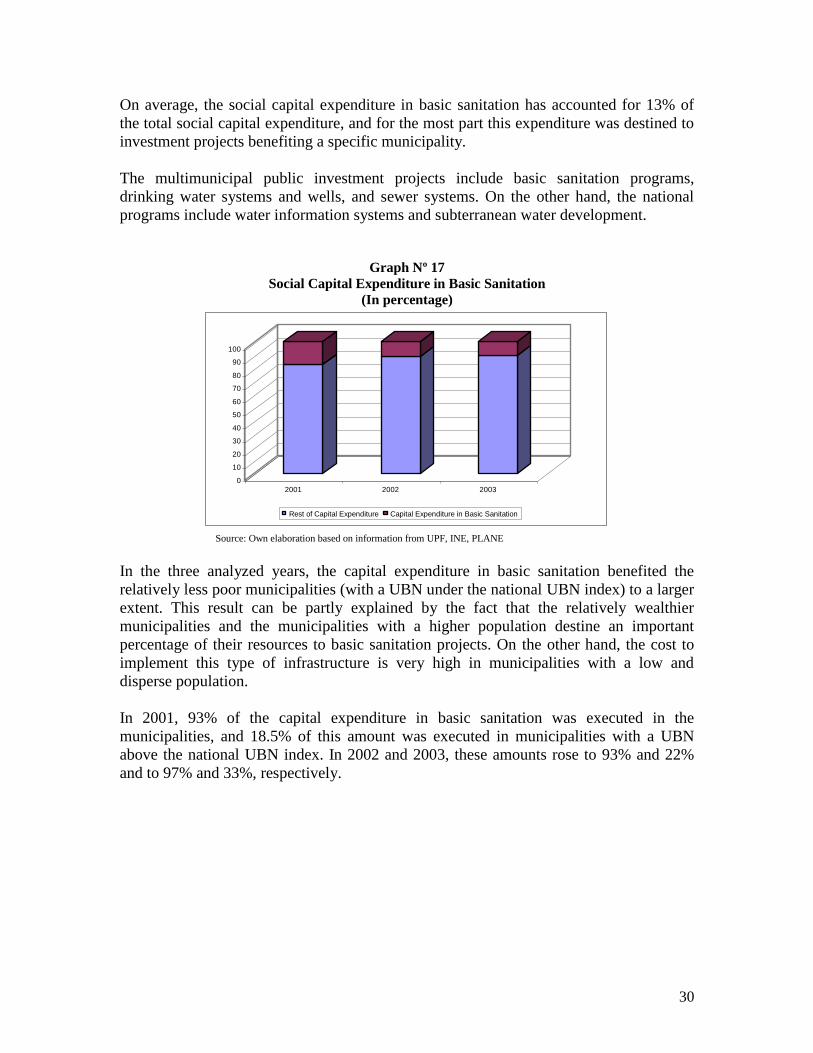
30
On average, the social capital expenditure in basic sanitation has accounted for 13% of
the total social capital expenditure, and for the most part this expenditure was destined to
investment projects benefiting a specific municipality.
The multimunicipal public investment projects include basic sanitation programs,
drinking water systems and wells, and sewer systems. On the other hand, the national
programs include water information systems and subterranean water development.
Graph Nº 17
Social Capital Expenditure in Basic Sanitation
(In percentage)
0
10
20
30
40
50
60
70
80
90
100
2001 2002 2003
Rest of Capital Expenditure Capital Expenditure in Basic Sanitation
Source: Own elaboration based on information from UPF, INE, PLANE
In the three analyzed years, the capital expenditure in basic sanitation benefited the
relatively less poor municipalities (with a UBN under the national UBN index) to a larger
extent. This result can be partly explained by the fact that the relatively wealthier
municipalities and the municipalities with a higher population destine an important
percentage of their resources to basic sanitation projects. On the other hand, the cost to
implement this type of infrastructure is very high in municipalities with a low and
disperse population.
In 2001, 93% of the capital expenditure in basic sanitation was executed in the
municipalities, and 18.5% of this amount was executed in municipalities with a UBN
above the national UBN index. In 2002 and 2003, these amounts rose to 93% and 22%
and to 97% and 33%, respectively.

31
Table Nº 20
Distribution of Social Capital Expenditure in Basic Sanitation in Municipalities, according to
Poverty (UBN)
Category
2001 2002 2003
% Accumulated % % Accumulated % % Accumulated %
100-90 9.5 9.5 5.7 5.7 14.1 14.1 89.9-80 3.1 12.7 7.2 12.8 10.4 24.5 79.9-70 4.0 16.7 6.8 19.6 5.0 29.5 69.9-60 0.4 17.1 1.3 20.9 2.7 32.2 59.9-50 15.6 32.7 23.2 44.1 12.5 44.6 49.9-40 9.3 42.0 4.2 48.2 7.9 52.5 39.9 and less 50.7 92.7 45.0 93.3 44.5 97.0 Total Municipalities 92.7 92.7 93.3 93.3 97.0 97.0 National 0.03 92.7 0.8 94.1 1.8 98.8 Multimunicipal 7.3 100.0 5.9 100.0 1.2 100.0 Total 100 100 100
Source: Own elaboration based on information from UPF, INE, PLANE
(1) In million USD
(2) In current USD
The higher per capita expenditure in municipalities with a UBN under the national
average is related to the fact that the departmental capital cities form part of these
municipalities where the highest capital expenditure in basic sanitation is concentrated.
Table Nº 21
Social Capital Expenditure in Basic Sanitation in Municipalities, according to Poverty (UBN)
Category
2001 2002 2003
Total Expenditure in
Basic Sanitation(1)
Per capita Expenditure in
Basic Sanitation (2)
Total Expenditure in
Basic Sanitation(1)
Per capita Expenditure in
Basic Sanitation (2)
Total Expenditure in
Basic Sanitation(1)
Per capita Expenditure in
Basic Sanitation (2)
100-90 7.2 4.2 2.8 1.6 5.4 3.1 89.9-80 2.4 2.2 3.6 3.4 4.0 3.8 79.9-70 3.0 8.1 3.4 9.2 1.9 5.1 69.9-60 0.3 0.3 0.6 0.6 1.0 1.0 59.9-50 11.8 15.5 11.7 15.4 4.8 6.2 49.9-40 7.0 14.3 2.1 4.1 3.0 5.7 39.9 and less 38.3 12.2 22.8 7.1 17.2 5.2 Total Municipalities 70.0 47.3 37.6 National 0.02 0.4 0.7 Multimunicipal 5.5 3.0 0.4 Total 75.5 50.8 38.8
Source: Own elaboration based on information from UPF, INE, PLANE
(1) In million USD
(3) In current USD
2.2.6 Equity in Social Capital Expenditure in Urbanism
The expenditure in urbanism corresponds to public investment programs and projects
related to the creation of urban infrastructure in general.
On average, the social capital expenditure in Urbanism accounted for 15% of total social
capital expenditure, and the highest proportion of that percentage is destined to
investment projects benefiting a specific municipality.

32
The multimunicipal public investment projects include progressive social housing
programs, sports infrastructure and housing improvement to combat endemic diseases.
On the other hand, the national programs mainly support housing policies.
Graph Nº 18
Social Capital Expenditure in Urbanism
(In percentage)
0
10
20
30
40
50
60
70
80
90
100
2001 2002 2003
Rest of Capital Expenditure Capital Expenditure in Urbanism and Housing
Source: Own elaboration based on information from UPF, INE, PLANE
In the three analyzed years, the capital expenditure in urbanism to a larger extent
benefited the relatively less poor municipalities (UBN under the national UBN).
In 2001, 92% of the capital expenditure in urbanism was executed in the municipalities;
of this amount, 34% was destined to municipalities with a UBN above the national
average. In 2002 and 2003, these amounts were 96% and 11% and 97% and 42%,
respectively.
Table Nº 22
Distribution of Social Capital Expenditure in Urbanism in Municipalities, according to Poverty
(UBN)
Category
2001 2002 2003
% Accumulated % % Accumulated % % Accumulated %
100-90 6.6 6.6 12.4 12.4 7.8 7.8 89.9-80 10.5 17.1 9.4 21.8 6.9 14.7 79.9-70 0.5 17.5 2.7 24.5 3.4 18.1 69.9-60 13.7 31.2 10.4 34.9 22.5 40.6 59.9-50 21.0 52.2 20.9 55.8 19.4 60.0 49.9-40 19.7 71.8 18.4 74.2 18.2 78.3 39.9 and less 19.7 91.5 22.1 96.3 18.7 96.9 Total Municipalities 91.5 91.5 96.3 96.3 96.9 96.9 National 3.3 94.8 2.1 98.4 2.7 99.6 Multimunicipal 5.2 100.0 1.6 100.0 0.4 100.0 Total 100 100 100
Source: Own elaboration based on information from UPF, INE, PLANE (1) In million USD
(2) In current USD
However, the highest per capita expenditure in urbanism is registered in the
municipalities with a UBN between 70 and 40.
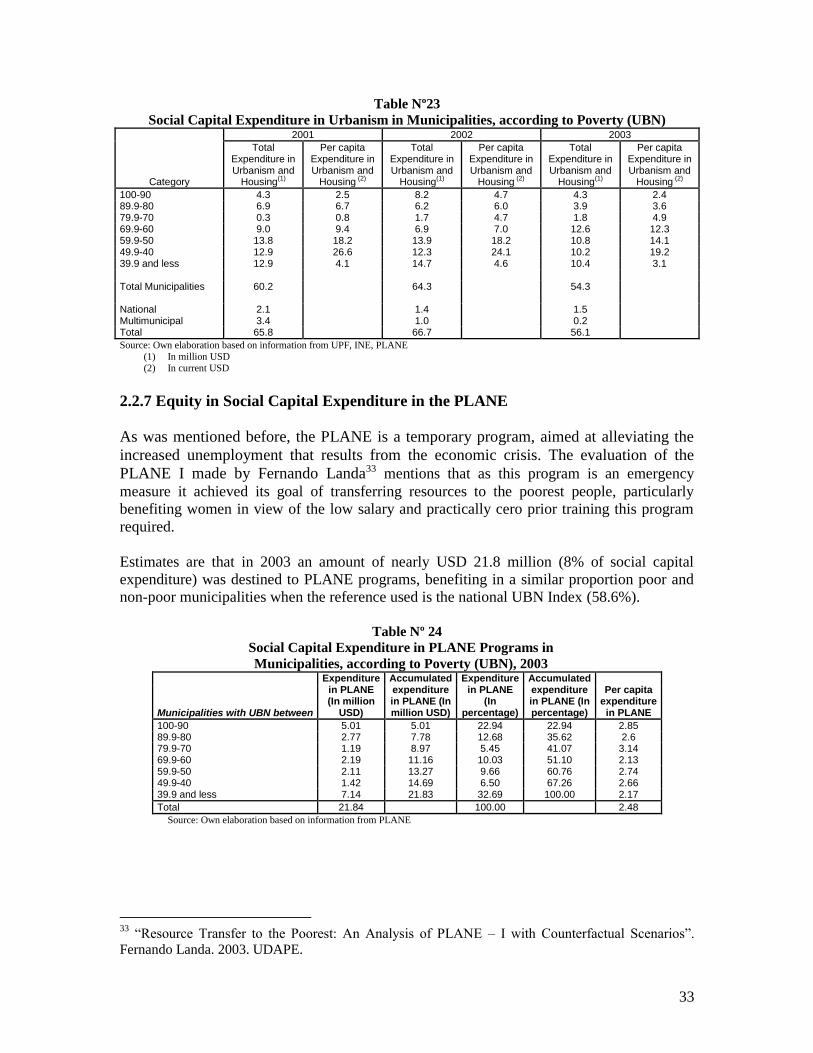
33
Table Nº23
Social Capital Expenditure in Urbanism in Municipalities, according to Poverty (UBN)
Category
2001 2002 2003
Total Expenditure in Urbanism and
Housing(1)
Per capita Expenditure in Urbanism and
Housing (2)
Total Expenditure in Urbanism and
Housing(1)
Per capita Expenditure in Urbanism and
Housing (2)
Total Expenditure in Urbanism and
Housing(1)
Per capita Expenditure in Urbanism and
Housing (2)
100-90 4.3 2.5 8.2 4.7 4.3 2.4 89.9-80 6.9 6.7 6.2 6.0 3.9 3.6 79.9-70 0.3 0.8 1.7 4.7 1.8 4.9 69.9-60 9.0 9.4 6.9 7.0 12.6 12.3 59.9-50 13.8 18.2 13.9 18.2 10.8 14.1 49.9-40 12.9 26.6 12.3 24.1 10.2 19.2 39.9 and less 12.9 4.1 14.7 4.6 10.4 3.1 Total Municipalities 60.2 64.3 54.3 National 2.1 1.4 1.5 Multimunicipal 3.4 1.0 0.2 Total 65.8 66.7 56.1
Source: Own elaboration based on information from UPF, INE, PLANE
(1) In million USD
(2) In current USD
2.2.7 Equity in Social Capital Expenditure in the PLANE
As was mentioned before, the PLANE is a temporary program, aimed at alleviating the
increased unemployment that results from the economic crisis. The evaluation of the
PLANE I made by Fernando Landa33 mentions that as this program is an emergency
measure it achieved its goal of transferring resources to the poorest people, particularly
benefiting women in view of the low salary and practically cero prior training this program
required.
Estimates are that in 2003 an amount of nearly USD 21.8 million (8% of social capital
expenditure) was destined to PLANE programs, benefiting in a similar proportion poor and
non-poor municipalities when the reference used is the national UBN Index (58.6%).
Table Nº 24
Social Capital Expenditure in PLANE Programs in
Municipalities, according to Poverty (UBN), 2003
Municipalities with UBN between
Expenditure in PLANE (In million
USD)
Accumulated expenditure in PLANE (In million USD)
Expenditure in PLANE
(In percentage)
Accumulated expenditure in PLANE (In percentage)
Per capita expenditure in PLANE
100-90 5.01 5.01 22.94 22.94 2.85 89.9-80 2.77 7.78 12.68 35.62 2.6 79.9-70 1.19 8.97 5.45 41.07 3.14 69.9-60 2.19 11.16 10.03 51.10 2.13 59.9-50 2.11 13.27 9.66 60.76 2.74 49.9-40 1.42 14.69 6.50 67.26 2.66 39.9 and less 7.14 21.83 32.69 100.00 2.17
Total 21.84 100.00 2.48
Source: Own elaboration based on information from PLANE
33
“Resource Transfer to the Poorest: An Analysis of PLANE – I with Counterfactual Scenarios”.
Fernando Landa. 2003. UDAPE.

34
3. CONCLUSIONS AND RECOMMENDATIONS
3.1 Conclusions
In the Latin American context, Bolivia is one of the counties that make most efforts - in
terms of the proportion of GDP and public expenditure itself (fiscal priority) - to destine
resources to social expenditure.
Public social expenditure in Bolivia – except for the expenditure in pensions and in
universities – benefits the poor population to a larger extent, both in current terms and in
capital terms.
The policies focusing a decentralization of expenditure have had a positive effect as they
have increased the municipalities’ access to resources – especially the poorest ones –,
which in turn were able to destine those resources to expenses that contribute to poverty
reduction.
In terms of current expenditure, there is a relatively similar equity in the expenditure in
education and health. In 2002, 60.6% of the public expenditure in education and 60.1% of
the expenditure in health benefited the poor population. The expenditure in pensions
rather favors persons living in non-poor households (83% of the total expenditure in
pensions).
When analyzing equity in the expenditure in education according to the level of
instruction, it becomes clear that public spending is more equitable in initial, primary and
secondary education, where a higher proportion of students from poor households are
benefited, with more inequity in higher education. In 2002, 74% of the expenditure in
initial, primary and secondary education favored students from poor households, in
relation to hardly 32% of the expenditure in higher education.
Although the expenditure in non-university education benefits students from poor
households to a larger extent, when dividing the households into income deciles, there is
a clear trend of progressivity of the expenditure in initial and primary education and of
regressivity in secondary and alternative education.
On the other hand, the last public expenditure review the World Bank and IDB made
mentions that the secondary school system faces problems related to the sub-allocation of
resources. This means that from the perspective of equity in expenditure, the distribution
of public resources in the educational system is inefficient, as higher education is being
benefited - where public expenditure mainly benefits non-poor households - to the
detriment of secondary education, where public expenditure is more favorable for poor
households.
The same study says that the social rate of return in less developed countries is higher in
primary and secondary education as compared to university education, which means that
besides equity issues in the distribution of public resources to the educational system,
there are also efficiency issues.

35
This equity issue – besides issues regarding quality in the different levels of instruction in
the Bolivian educational system – must be considered at the moment of discussing the
budget for education, taking into account the restrictive framework the public sector faces
as regards the availability of resources.
With regard to the expenditure in education, the poor population is benefited to a larger
extent, but within this group, the poorest households are not the most benefited ones,
which means that the poorest households continue to have problems to access health care
services.
As regards the expenditure in pensions, this item is the result of the cost of the transition
from the pay-as-you-go system to another system based on individual capitalization. As a
result of this reform, the State is obliged to pay the retirement pension of pensioners
under the previous system. Therefore, the expenditure associated with this item is not
related to poverty reduction policies, but rather to the conversion from one system to
another.
However, in the households with at least one pensioner (out of the 1,944,919 households
in Bolivia, 104,487 have at least one pensioner), dependency on the pension is relatively
high.
In relation to the social capital expenditure identified at the municipal level, in the last
three years, on average this expenditure has benefited the poorest municipalities to a
larger extent (i.e. municipalities with a UBN index above the national UBN index). In
addition, the per capita social expenditure is higher in the relatively poorer municipalities.
Hence, at an overall level, public capital resources benefit the poorest population and as
the per capita expenditure is higher in the municipalities with a lower UBN, the
conclusion is that the public sector is making efforts in financial terms to reduce
disparities in the provision of social infrastructure.
The mentioned results were considerably influenced by the HIPC II resources, coming
from the Special Account Dialogue 2000, as the Dialogue 2000 determined that these
resources should benefit the relatively poorer municipalities more.
As regards social capital expenditure at the municipal level, there is more equity in rural
development and education; besides, these sectors receive a higher proportion of the
capital public social expenditure (average of 30% and 25%, respectively, in the last three
years).
3.2 Recommendations
The higher or lower level of equity of social expenditure must form part of discussions in
public resource allocation. For example, results of this study show that in terms of equity
of current expenditure, the impact of one boliviano destined to education and health has a
bigger effect on poor households as compared to non-poor households. But the results

36
also show that within education, the distribution of expenditure is not too efficient, as
higher education receives more benefits than secondary education, in spite of the fact that
secondary education suffers a lack of resources.
Nonetheless, the evaluation of the level of equity of social expenditure must go hand in
hand with an analysis of the efficiency and effectiveness of social expenditure, as studies
like the World Bank and IDB PEM as well as other Bolivian public sector studies show
that there are also issues related to the quality of public social expenditure, in the sense
that in spite of public expenditure having a rather important pro-poor component, the
services provided by the public sector show deficiencies, particularly in education and
health.
With regard to social capital expenditure, it is important to continue with policies that
enhance progressivity in public resource allocation and that also ensure funding sources
for public investment. For example, the UBN-based HIPC resource allocation has a
positive impact in terms of equity because within a framework of strong budget
restrictions, it ensured resources for public investment in poor municipalities.
In social capital expenditure, the resources destined to rural development favor the
productive sector of the poorest municipalities through the construction of physical
infrastructure. It is important to further enhance this policy of destining resources to rural
development in the poorest municipalities as these resources will enhance the
competitiveness and productivity of their productive activities and will contribute to a
gradual decrease of the considerable disparities regarding the provision of physical
infrastructure that still prevail in the municipalities, especially in the rural area.
Nonetheless, as in the case of current social expenditure, besides equity considerations, it
is necessary to evaluate the efficiency of public social capital expenditure and to analyze
up to what extent the public investment projects executed in the municipalities truly reach
the population and effectively contribute to poverty reduction.
In terms of information for the follow-up of social expenditure, disaggregation in the
fields of education and health proposed in the study is highly recommended. In
education, we recommend disaggregating the information per level of instruction (initial,
primary, secondary, alternative and higher); and in health per level of attendance (first,
second and third level).
In capital expenditure, we recommend maintaining the disaggregation per sector
mentioned in this document, which mainly means separating the PLANE from the Rural
Development sector, as the objectives of this program are to create temporary
employment, not rural development.
Likewise, we recommend maintaining the changes suggested here as regards the sectoral
distribution of HIPC II resources, as this will enable enhanced precision in the destination
of those resources.

37
BIBLIOGRAPHICAL REFERENCES
World Bank, IDB. “Public Expenditure Management for Fiscal Sustainability and
Equitable and Efficient Public Services”. (Not published). 2004
World Bank “Reforma del Sector Salud en Bolivia” (Reform of the Bolivian Health
Sector). 2004.
World Bank “Country Assistance Strategy for the Republic of Bolivia”. 2004
CEPAL: Panorama Social de América Latina 2002-2003 (ECLAC: Social Panorama of
Latin America 2002-2003). August 2003.
Deaton, Angus, “The Analysis of Household Surveys, A microeconometric Approach to
Development Policy”, The John Hopkins Press. 1997.
De Ferranti, David; Ferreira, Francisco H.G.; Perry, Guillermo and Walton, Michael.
“Inequality in Latin America & the Caribbean: Breaking with History?” 2004. World
Bank.
Landa, Fernando “Transferencia de Recursos hacia los más Pobres. Un Análisis del
PLANE – I con Escenarios Contrafactuales” (Resource Transfer to the Poorest: An
Analysis of PLANE – I with Counterfactual Scenarios). 2003. UDAPE
Narváez, Rory “Inequidades en el estado de salud, acceso y uso de los servicios de salud
en Bolivia” (Inequities in the health status, the access to and use of health care services in
Bolivia). 2003. UDAPE
Nina, Osvaldo et. al. “Análisis de la Equidad en la Asignación de recursos educativos en
Bolivia” (Analysis of Equity in the Allocation of resources to education in Bolivia).
2004. Maestrías Para el Desarrollo. UCB
Martin, Leslie. “Simulando el costo de pensiones” (Simulating the pension cost). World
Bank (Not published). 2004
Ministry of Education, “La educación en Bolivia: Indicadores, Cifras y Resultados”
(Education in Bolivia: Indicators, Numbers and Outcomes). 2003.
Psacharoupoulos, George and Patricios Harry. “Returns to Investment in Education: A
Further Update”. 2002. Working Paper. World Bank.
Fiscal Programming Unit. “Dossier Estadístico 1990 – 2003” (Statistical Dossier 1990-
2003). 2003. UPF.
UDAPE-INE, “Mapa de Pobreza 2001, Síntesis” (Poverty Map 2001, Synthesis).2002

38
UDAPE-INE, “Pobreza y Desigualdad en Municipios de Bolivia: Estimación del gasto
combinando el Censo 2001 y las Encuestas de hogares” (Poverty and Inequality in
Bolivian Municipalities: Estimated Expenditure combining the Census 2001 and
household surveys). 2003

ANNEX Nº 1
APPLIED METHODOLOGY
SOCIAL EXPENDITURE IN BOLIVIA
General Aspects Related to the Information for Measurement of Social Expenditure in
Bolivia
The Fiscal Programming Unit of the Ministry of Finance, in charge of follow-up of public
funding mainly in the context of agreements with the IMF, is responsible for measuring
social expenditure.
The emphasis on social policies in Bolivia, including the country’s participation in the
initiative for Highly Indebted Poor Countries (HIPC) in which Bolivia was one of the first
participating nations, resulted in the need to have information to assess the efforts, in terms of
public resource allocation, the country was making to reduce poverty. Hence, the decision
was made to quantify public expenditure destined to social goals.
Two aspects were considered in quantification of the so-called “social” expenditure: the first
was to answer the question what aspects are considered under Social Expenditure, the second
one was related to the funding sources to be used for collecting the primary information,
which should be consistent with the information prepared by the UPF.
The aspects to be included as social expenditure were defined as a result of an
interinstitutional discussion and effort (UDAPE – UPF - VIPFE). The decision was that
social expenditure should include all (current and capital) expenses associated with (i) health,
(ii) education, (ii) basic sanitation, (iv) urbanism and housing, (v) rural development, and (vi)
pensions.
Subsequently, the decision was made to prepare information in a parallel way on basic social
expenditure or pro-poor expenditure, excluding expenses in pensions and universities from
social expenditure as these were considered expenses that do not contribute to a direct
reduction of poverty.
The UPF used its own sources of information created to follow up public finance to gather
information for the quantification of social expenditure, as well as information from the
General Accountancy Direction (DGC) that depends on the Vice-Ministry of the Budget in
the Ministry of Finance and the Vice-Ministry of Public Investment and External Funding
(VIPFE) in the Ministry of Finance.
Based on valuation criteria, there are differences between the numbers collected by the UPF
and the primary sources of information, particularly as regards the expenditure in education.
Therefore, the recommendation is for the UPF, DGC and UDAPE to promote technical
meetings, with the purpose of building a common and consistent database.
Likewise, and aimed at precisely determining the level of equity of social expenditure and
ensuring continuity of this study, we recommend disaggregating the information on the sector
education according to the levels of instruction (initial, primary, secondary, teacher training
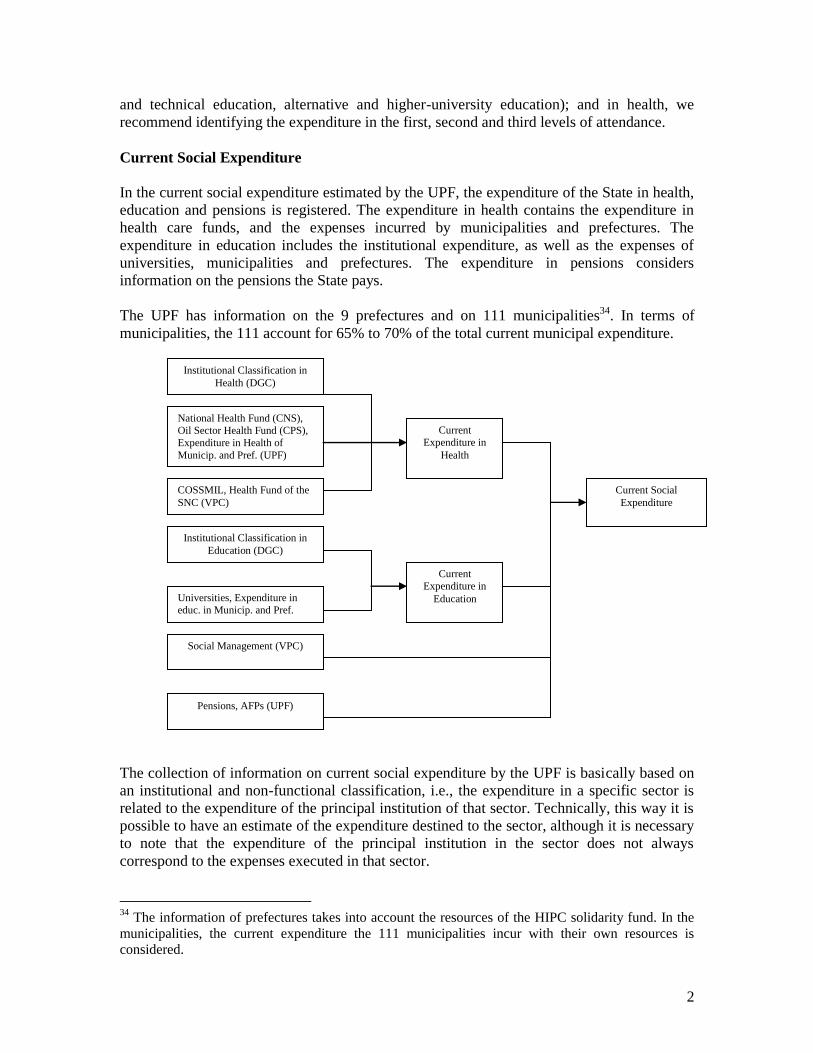
2
and technical education, alternative and higher-university education); and in health, we
recommend identifying the expenditure in the first, second and third levels of attendance.
Current Social Expenditure
In the current social expenditure estimated by the UPF, the expenditure of the State in health,
education and pensions is registered. The expenditure in health contains the expenditure in
health care funds, and the expenses incurred by municipalities and prefectures. The
expenditure in education includes the institutional expenditure, as well as the expenses of
universities, municipalities and prefectures. The expenditure in pensions considers
information on the pensions the State pays.
The UPF has information on the 9 prefectures and on 111 municipalities34. In terms of
municipalities, the 111 account for 65% to 70% of the total current municipal expenditure.
The collection of information on current social expenditure by the UPF is basically based on
an institutional and non-functional classification, i.e., the expenditure in a specific sector is
related to the expenditure of the principal institution of that sector. Technically, this way it is
possible to have an estimate of the expenditure destined to the sector, although it is necessary
to note that the expenditure of the principal institution in the sector does not always
correspond to the expenses executed in that sector.
34
The information of prefectures takes into account the resources of the HIPC solidarity fund. In the
municipalities, the current expenditure the 111 municipalities incur with their own resources is
considered.
Institutional Classification in
Health (DGC)
National Health Fund (CNS),
Oil Sector Health Fund (CPS),
Expenditure in Health of
Municip. and Pref. (UPF)
Pensions, AFPs (UPF)
Social Management (VPC)
Universities, Expenditure in
educ. in Municip. and Pref.
(UPF)
COSSMIL, Health Fund of the
SNC (VPC)
Institutional Classification in
Education (DGC)
Current
Expenditure in
Health
Current
Expenditure in
Education
Current Social
Expenditure

3
For example in health, the expenditure in national heroes is included, which on the basis of a
functional classification would not be included as part of the social expenditure in health; on
the other hand, the Ministry of Defense incurs in expenses in health and education that are
not included in the expenditure in health, but that would be included were a functional
classification used. In the future, we highly recommend developing a functional classification
to give a precise overview of social expenditure.
Capital Social Expenditure
As regards capital expenditure, the information comes from the public investment projects
registered by the VIPFE. As regards the HIPC resources destined to investment, the
information is provided by the UPF.
The information on public investment gathered by the VIPFE is composed of the investment
registered and identified in specific projects and an estimate based on the tax co-participation
resources. The information on the use of HIPC resources destined to investment is collected
by the UPF through the registration of bank balances for the 314 municipalities.
However, there is also detailed information on the HIPC resource allocation for 111 of the
314 municipalities. Based on these two sources of information almost all resources the
municipalities use for capital expenses are covered, as this would only leave out the capital
expenses made with own resources. But this category is not very important as most own
resources are used to cover current expenses. The own resources used in capital are mostly
destined to counterpart resources in projects, which are registered in the VIPFE.
On the basis of this information, and also as a result of the study, the destination of HIPC
resources was determined, making a detailed identification of the use in the different
Social Investment registered
314 Municipalities (VIPFE)
HIPC register consultants 111
Municipalities (UPF)
HIPC account balances 314
Municipalities (UPF)
Social Investment estimated
314 Municipalities (VIPFE)
Total HIPC 314
Municipalities
Total Public Social
Investment 314 Municipalities
Social capital
expenditure

4
components of social expenditure, especially those related to Rural Development, isolating
those municipalities that are clearly urban and therefore, it is considered that the HIPC
resources in these municipalities are not entirely destined to rural development, but rather to
other components of social expenditure.
In turn, various projects (activities) were detected that were not in any of the components of
the social expenditure structure, and for which a new category was opened under the heading
“multisectoral”, including activities related to gender, electrification projects in the capital
cities as well as other topics.35
On the other hand, this study considers the PLANE as a new category of social capital
expenditure, which is why this program is not included in the “Rural Development” category
of Social Expenditure. This is because of the characteristics of the PLANE, an emergency
and temporary program created for the generation of employment that, even though it fulfills
an important social function, is not aimed at rural development.
Even though the works implemented with PLANE support have an important salary
component (which is why this program could be included under current social expenditure),
definitely, these salaries are used to create or maintain infrastructure works. Because of this,
the PLANE was maintained as a component of capital expenditure.
General Aspects Related to the Methodology to Measure Equity in Current Public
Social Expenditure
The current social expenditure quantified by the UPF includes the expenditure in education,
health and pensions. The estimate of equity in the current public expenditure is based on
information from the MECOVI surveys 1999 and 2002, the Ministry of Education and the
UPF.
Although the MECOVI survey registers the expenditure of the households (private) in health
and education, the information it contains distinguishes whether the health or education
service the household used is public or private. Based on this information, it is possible to
isolate the individuals who receive public education or public health care. In the case of the
expenditure in pensions, the MECOVI survey identified whether the household does or does
not have a pensioner, which is useful to identify and separate pensioners.
In general, inequality and poverty structures36 were obtained in the groups that use public
health care and education, as well as in the persons receiving a pension. These structures
were used to distribute public expenditure in education, health and pensions between the poor
and non-poor and among income deciles. This way, it was possible to evaluate the
35
The statistical information on the composition of expenditure of HIPC resources is still rather
aggregated in this study. Insofar as more information is available on the municipalities (e.g. through
the SIGMA), we recommend a detailed follow-up on use of the HIPC resources, aimed at further
detailing the composition of use of the HIPC resources. 36
The poverty estimate according to the poverty line is based on a comparison of the per capita household income with the poverty line; in this sense, when a member of the household is poor, all
members of the households will be poor and when a student lives in a poor household then (s)he is
considered poor.

5
progressivity or regressivity of current public social expenditure, i.e. whether the poor are the
ones benefiting to a lesser or higher extent from public expenditure.
Methodology to Measure Equity in Current Expenditure in Education
The starting point for the analysis of equity in the current expenditure in education is the
identification of the expenditure in different levels of instruction, i.e. initial, primary,
secondary and higher-university education.37 On this basis and considering the information
on the expenditure in every level and on enrollment provided by the Ministry of Education
and the poverty and distribution structures from MECOVI surveys, these sources of
information were combined to estimate the level of progressivity or regressivity of the
expenditure in education.
Based on the MECOVI survey, it was possible to identify the students enrolled in public
schools according to the level of instruction, which was used to determine the groups to be
analyzed. These groups are then used to differentiate the poverty condition (in terms of the
poverty line) and income deciles, aimed at obtaining structures that are used to deduct
whether the expenditure in education reaches the poorest population segments. For example,
in the case of education, through the MECOVI survey it was possible to identify that 76.3%
of the enrolled students come from poor households and 33.7% from non-poor households.
This same proportion was applied to public expenditure in primary education, i.e. the
assumption is that 76.3% of the expenditure at this level favored students living in poor
households.
The structure of the survey was applied to both the expenditure in education and the number
of enrolled students informed by the Ministry of Education, so as to obtain the proportion of
the expenditure destined to the poor and non-poor, as well as per income decile.38 This way
the idea is to obtain an estimate on the progressivity or regressivity of the expenditure in
education according to the poverty condition and income deciles.
The information used for this analysis comes from the Ministry of Education as the
information the UPF has is not disaggregated and therefore, does not allow for an analysis
per level of instruction, i.e. initial, primary, secondary, alternative and technical education.
Methodology to Measure Equity in Current Expenditure in Health
The information from the UPF regarding the current expenditure in health corresponds to the
institutional classification of the DGC of the Ministry of Finance. This information is not
disaggregated according to the levels of state attendance, which would allow for a more
precise analysis of equity in the expenditure in health.
The public expenditure in health used in the estimate is that of the UPF, but eliminating the
expenditure in national heroes as this does not correspond to expenditure in health per se.
37
As it is not possible on the basis of the information of the household survey to make a
disaggregation for the levels of special and technical education, these two levels were omitted in the analysis. 38
The assumption used in the estimate is that the average cost per level is the same for all students
enrolled in the same level.

6
In order to make an estimate of the level of equity of the expenditure in health, first the
number of attendances in public sector facilities39 in one year was obtained.40
Based on the MECOVI survey, the income decile and poverty structure were obtained for the
provided attendances, i.e. the amount of poor and non-poor who were attended, as well as the
number of people attended in public facilities according to income deciles.
According to the structure resulting from the survey and with the information on the
expenditure in health of the UPF, the expenditure of the state destined to the poor and non-
poor was inferred, as well as per income decile, under the assumption that the expenditure is
the same for all attendances; hence, it is possible to establish parameters on the regressivity
or progressivity of the expenditure in health.41
There is no disaggregated information on the expenditure in different levels of attendance in
the health care sector that are comparable to those in the MECOVI survey or specific health
care surveys such as the ENDSA. In this sense, we opted for an estimate in aggregated terms.
Therefore and as was mentioned before, if disaggregated data were available on the different
levels42, it would be possible to obtain a better estimate on the regressivity or progressivity of
the expenditure, as this study assumes that the cost per attendance is the same.
Additionally, the analyses made in this study on equity of the expenditure in health could be
enriched with the results of the new ENDSA survey, which will be available in the next
months and which would allow for an analysis of the level of equity at the level of specific
programs.
Methodology to Measure Equity of Expenditure in Pensions
Based on the MECOVI survey, the objective of which is to measure the standard of living of
the population, it is possible to estimate the number of pensioners at the national level,
including the people who receive a pension for retirement, widowhood, invalidity or
orphanhood. The information from the MECOVI survey starts from a sample, not a formal
register. In this sense, it was used only to obtain an estimate of the socio-economic
characteristics of the pensioners and then infer the regressivity or progressivity of the
expenditure in pensions in Bolivia. When comparing the structure of the expenditure in
pensions derived from the MECOVI survey, with the information from the National Service
of the Pay-As-You-Go System, it can be seen that both structures are rather similar; hence,
39
Public attendances were considered to be the services provided in public hospitals, health care
centers, health posts and the National Health Care Fund (CNS) / Other funds. 40
The information per number of attended persons was also obtained from the MECOVI surveys 1999
and 2001. The information from the surveys is based on a monthly periodicity; the information was
annualized for the estimates. 41
Even though in the case of the funds, such as the National Health Care Fund (CNS) and the oil fund,
resources mostly come from contributions, they do form part of the non-financial public sector. 42
The levels of attendance are: the first level (immediate medical care), the second level (intermediate
medical care) and the third level (complex medical interventions). The assumption is that the cost increases when the level increases due to the increasing complexity of the interventions from one level
to the next. Probably, households in the upper deciles are the ones using the public health care
facilities the most.
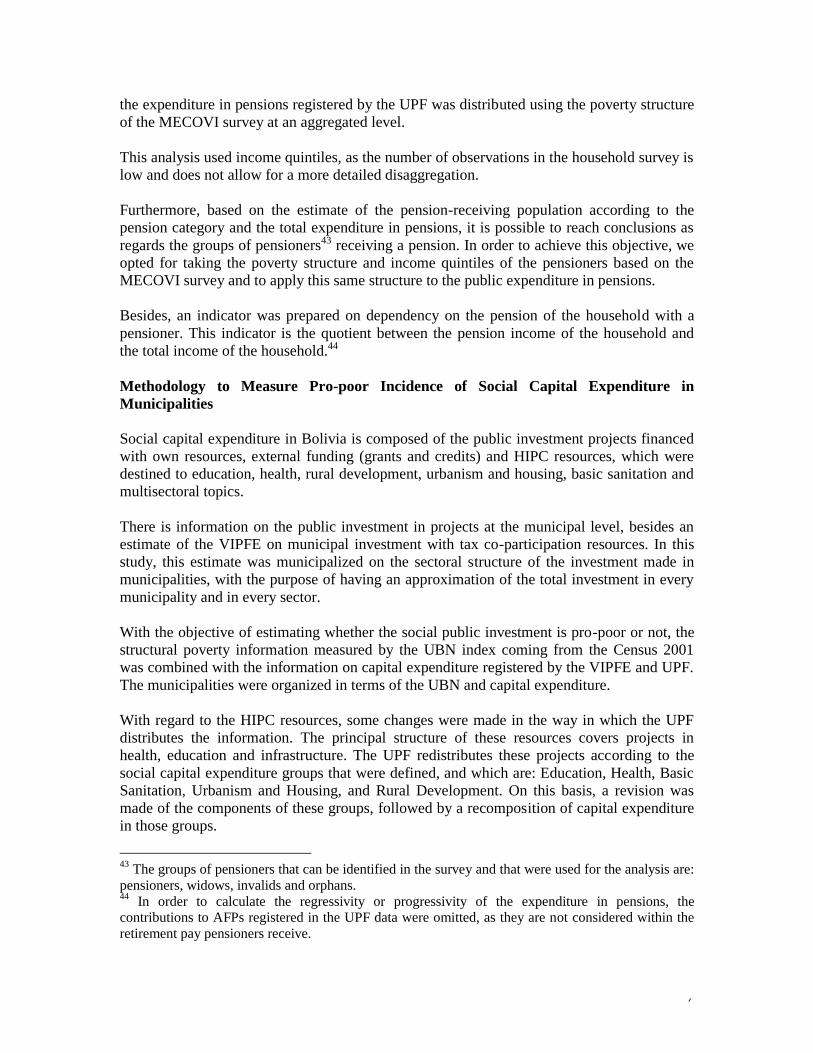
7
the expenditure in pensions registered by the UPF was distributed using the poverty structure
of the MECOVI survey at an aggregated level.
This analysis used income quintiles, as the number of observations in the household survey is
low and does not allow for a more detailed disaggregation.
Furthermore, based on the estimate of the pension-receiving population according to the
pension category and the total expenditure in pensions, it is possible to reach conclusions as
regards the groups of pensioners43 receiving a pension. In order to achieve this objective, we
opted for taking the poverty structure and income quintiles of the pensioners based on the
MECOVI survey and to apply this same structure to the public expenditure in pensions.
Besides, an indicator was prepared on dependency on the pension of the household with a
pensioner. This indicator is the quotient between the pension income of the household and
the total income of the household.44
Methodology to Measure Pro-poor Incidence of Social Capital Expenditure in
Municipalities
Social capital expenditure in Bolivia is composed of the public investment projects financed
with own resources, external funding (grants and credits) and HIPC resources, which were
destined to education, health, rural development, urbanism and housing, basic sanitation and
multisectoral topics.
There is information on the public investment in projects at the municipal level, besides an
estimate of the VIPFE on municipal investment with tax co-participation resources. In this
study, this estimate was municipalized on the sectoral structure of the investment made in
municipalities, with the purpose of having an approximation of the total investment in every
municipality and in every sector.
With the objective of estimating whether the social public investment is pro-poor or not, the
structural poverty information measured by the UBN index coming from the Census 2001
was combined with the information on capital expenditure registered by the VIPFE and UPF.
The municipalities were organized in terms of the UBN and capital expenditure.
With regard to the HIPC resources, some changes were made in the way in which the UPF
distributes the information. The principal structure of these resources covers projects in
health, education and infrastructure. The UPF redistributes these projects according to the
social capital expenditure groups that were defined, and which are: Education, Health, Basic
Sanitation, Urbanism and Housing, and Rural Development. On this basis, a revision was
made of the components of these groups, followed by a recomposition of capital expenditure
in those groups.
43
The groups of pensioners that can be identified in the survey and that were used for the analysis are:
pensioners, widows, invalids and orphans. 44
In order to calculate the regressivity or progressivity of the expenditure in pensions, the contributions to AFPs registered in the UPF data were omitted, as they are not considered within the
retirement pay pensioners receive.
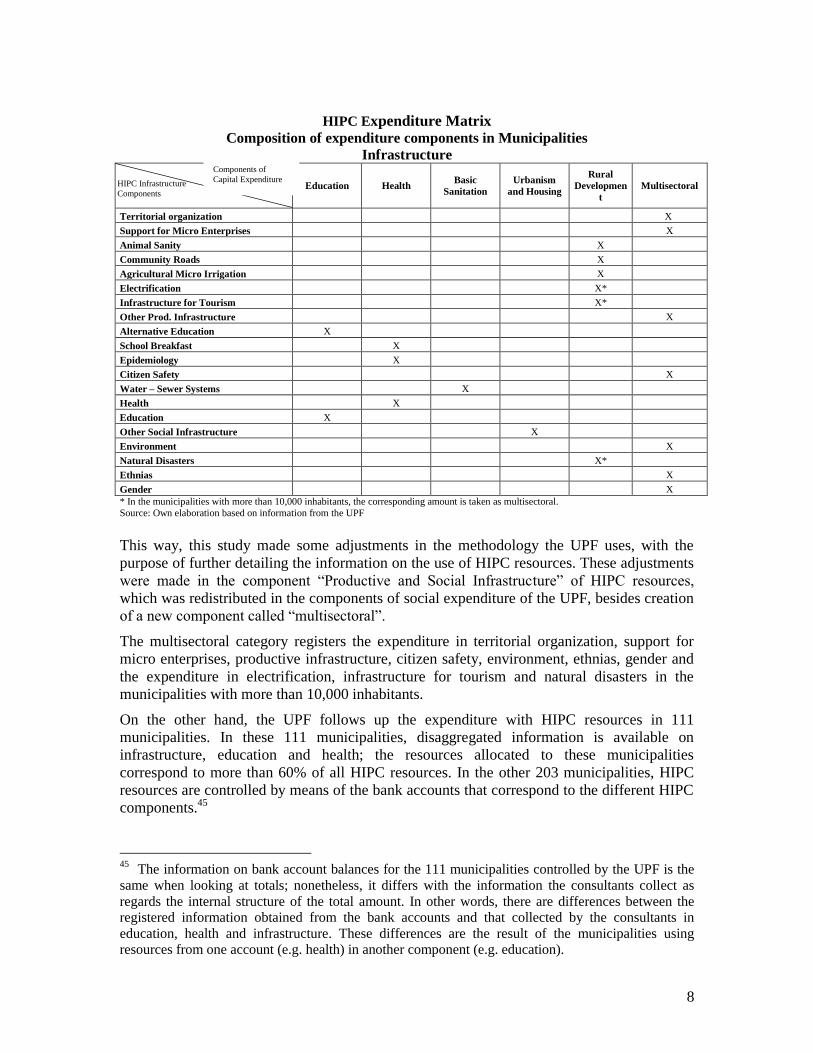
8
HIPC Expenditure Matrix
Composition of expenditure components in Municipalities
Infrastructure
Education Health Basic
Sanitation
Urbanism
and Housing
Rural
Developmen
t
Multisectoral
Territorial organization X
Support for Micro Enterprises X
Animal Sanity X
Community Roads X
Agricultural Micro Irrigation X
Electrification X*
Infrastructure for Tourism X*
Other Prod. Infrastructure X
Alternative Education X
School Breakfast X
Epidemiology X
Citizen Safety X
Water – Sewer Systems X
Health X
Education X
Other Social Infrastructure X
Environment X
Natural Disasters X*
Ethnias X
Gender X
* In the municipalities with more than 10,000 inhabitants, the corresponding amount is taken as multisectoral.
Source: Own elaboration based on information from the UPF
This way, this study made some adjustments in the methodology the UPF uses, with the
purpose of further detailing the information on the use of HIPC resources. These adjustments
were made in the component “Productive and Social Infrastructure” of HIPC resources,
which was redistributed in the components of social expenditure of the UPF, besides creation
of a new component called “multisectoral”.
The multisectoral category registers the expenditure in territorial organization, support for
micro enterprises, productive infrastructure, citizen safety, environment, ethnias, gender and
the expenditure in electrification, infrastructure for tourism and natural disasters in the
municipalities with more than 10,000 inhabitants.
On the other hand, the UPF follows up the expenditure with HIPC resources in 111
municipalities. In these 111 municipalities, disaggregated information is available on
infrastructure, education and health; the resources allocated to these municipalities
correspond to more than 60% of all HIPC resources. In the other 203 municipalities, HIPC
resources are controlled by means of the bank accounts that correspond to the different HIPC
components.45
45
The information on bank account balances for the 111 municipalities controlled by the UPF is the
same when looking at totals; nonetheless, it differs with the information the consultants collect as
regards the internal structure of the total amount. In other words, there are differences between the registered information obtained from the bank accounts and that collected by the consultants in
education, health and infrastructure. These differences are the result of the municipalities using
resources from one account (e.g. health) in another component (e.g. education).
HIPC Infrastructure
Components
Components of
Capital Expenditure

9
Considering that the characterization of HIPC resources proposed in the matrix above
requires disaggregated information for all municipalities, in the municipalities that do not
have disaggregated information for HIPC resources, as they are not covered by the UPF, the
following procedure was applied: in the first instance, municipal UBN deciles were generated
based on the Census 2001, with the purpose of grouping the municipalities with similar
poverty characteristics.
In every decile, the structures of the HIPC components were generated for those
municipalities that receive UPF control, and an average structure was calculated for every
decile based on the municipalities with UPF follow-up, i.e. the 111 municipalities. This
average structure was applied to the municipalities that correspond to every decile and that do
not have disaggregated information. Then, the balances of every municipality, and which are
reported by the UPF, were distributed on this average structure. This way, an estimate was
obtained of the HIPC resources for the remaining 203 municipalities.
The information obtained from the municipalities was combined with structural poverty
indicators (UBN) of the municipalities, with the objective of analyzing the progressivity or
regressivity of investments at the municipal level.
For the year 2003, the information available on HIPC resources is an estimate based on
expenditure until November. In the case of public investment, only preliminary information
was available.

10
ANNEX Nº 2
CURRENT SOCIAL EXPENDITURE IN EDUCATION, POVERTY AND
INEQUALITY
Expenditure in Initial Education, according to the Income Decile Structure
(In percentage)
-
2,00
4,00
6,00
8,00
10,00
12,00
14,00
16,00
Poorest decile Decile 2 Decile 3 Decile 4 Decile 5 Decile 6 Decile 7 Decile 8 Decile 9 Wealthiest decile
Percenta
ge o
f E
xpen
diture
1999 2002
Source: Own elaboration based on information from the Ministry of Education
Expenditure in Primary Education, according to the Income Decile Structure
(In percentage)
-
2,00
4,00
6,00
8,00
10,00
12,00
14,00
Poore
st
decile
Decile 2
Decile 3
Decile 4
Decile 5
Decile 6
Decile 7
Decile 8
Decile 9
Wealthie
st
decile
Perc
en
tag
e o
f exp
en
dit
ure
1999 2002
Source: Own elaboration based on information from the Ministry of Education

11
Expenditure in Secondary Education, according to the Expenditure Decile Structure
(In percentage)
-
2,00
4,00
6,00
8,00
10,00
12,00
14,00
16,00
18,00
Poorest decile Decile 2 Decile 3 Decile 4 Decile 5 Decile 6 Decile 7 Decile 8 Decile 9 Wealthiest
decile
Percenta
ge o
f expenditure
1999 2002
Source: Own elaboration based on information from the Ministry of Education
Expenditure in Alternative Education, according to the Income Decile Structure
(In percentage)
-
2,00
4,00
6,00
8,00
10,00
12,00
14,00
16,00
18,00
20,00
Poore
st decile
Decile 2
Decile 3
Decile 4
Decile 5
Decile 6
Decile 7
Decile 8
Decile 9
Wealthie
st decile
Perc
enta
ge o
f expendit
ure
1999 2002
Source: Own elaboration based on information from the Ministry of Education

12
Expenditure in Higher Education, according to the Expenditure Decile Structure
(In percentage)
-
5,00
10,00
15,00
20,00
25,00
30,00
Po
ore
st d
ec
ile
De
cile
2
De
cile
3
De
cile
4
De
cile
5
De
cile
6
De
cile
7
De
cile
8
De
cile
9
We
alth
ies
t
de
cile
Percenta
ge o
f expenditure
1999 2002
Source: Own elaboration based on information from the Ministry of Education and UPF
Current Expenditure of Public Education, 1999-2002
(In current bolivianos) ITEM 1999 2002* 1999 Modified 2002 Modified
CENTRAL ADMINISTRATION 21,655,418 61,365,749
DEPARTMENTAL AND DISTRICT DIRECTIONS 103,063,138 134,493,624
INITIAL EDUCATION 71,690,731 88,842,236 77,320,804 96,830,677
PRIMARY EDUCATION 1,121,981,264 1,560,824,525 1,210,093,584 1,701,169,412
SECONDARY EDUCATION 245,430,956 359,835,870 264,705,334 392,191,284
HIGHER NON-UNIVERSITY EDUCATION 62,981,418 56,695,590 67,927,525 61,793,496
ALTERNATIVE EDUCATION 66,794,498 79,242,543 72,040,056 86,367,807
SPECIAL EDUCATION 0 9,045,793 0 9,859,165
TECHNICAL EDUCATION 19,229,156 23,733,959 20,739,275 25,868,049
Universities 748,667,000 1,050,271,000
Source: Own elaboration based on information from the Ministry of Education and UPF Note: The modified expenditure considers resources of every level plus resources executed in the central administration and departmental
directions distributed according to expense structures.