world bank documentdocuments.worldbank.org/curated/en/... · project performance audit report india...
TRANSCRIPT

Document of
The World Bank
FOR OFFICIAL USE ONLY FLEC OP7
Report No. 1658
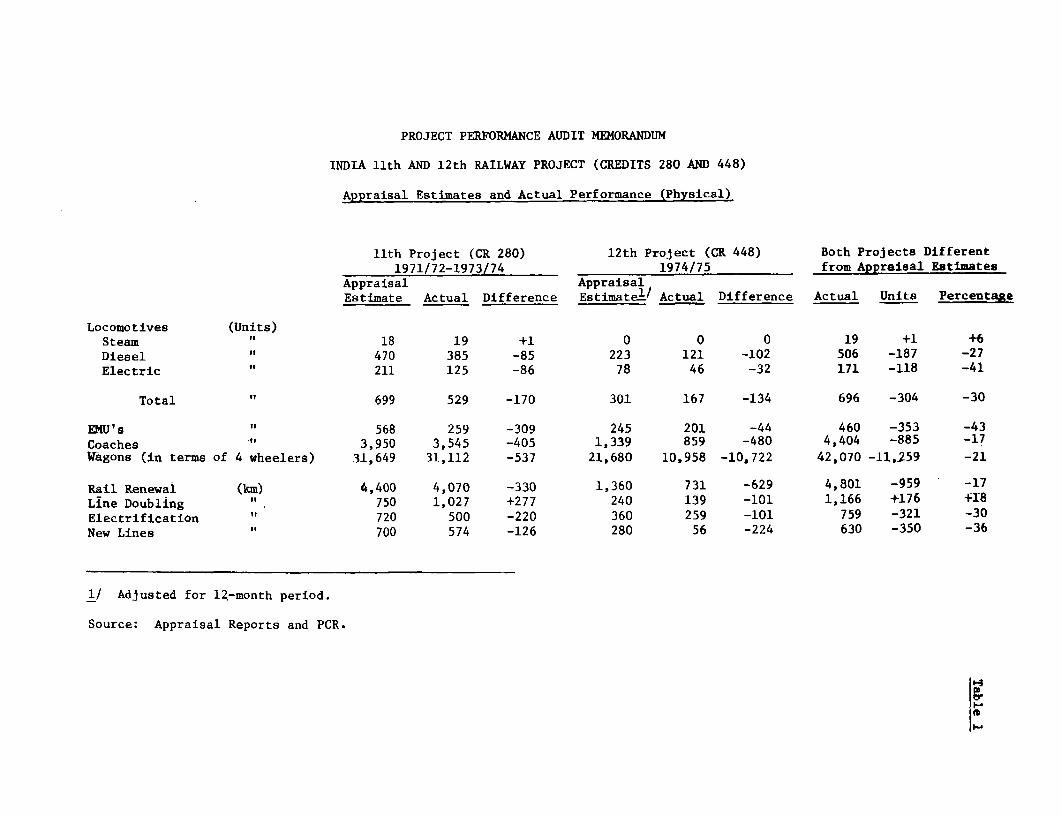
PROJECT PERFORMANCE AUDIT REPORT
INDIA ELEVENTH AND TWELFTH RAILWAY PROJECT (CREDITS 280- AND 448-IN)
June 30, 1977
Operations Evaluation Department
This document has a restricted distribution and may be used by recipients only in the performance oftheir official duties. Its contents may not otherwise be disclosed without World Bank authorization.
Pub
lic D
iscl
osur
e A
utho
rized
Pub
lic D
iscl
osur
e A
utho
rized
Pub
lic D
iscl
osur
e A
utho
rized
Pub
lic D
iscl
osur
e A
utho
rized


FOR OFFICIAL USE ONLY
PROJECT PERFORMANCE AUDIT REPORT
INDIA ELEVENTH AND TWELFTH RAILWAY PROJECT (CREDITS 280- AND 448-IN)
TABLE OF CONTENTS
Page No.
PREFACE
PROJECT PERFORMANCE AUDIT BASIC DATA SHEETS
HIGHLIGHTS
PROJECT PERFORMANCE AUDIT MEMORANDUM
I. Project Summary 1
II. Issues 7
III. Conclusions 20
TABLES
1. Appraisal Estimates and Actual Performance (Physical)
2. Appraisal Estimates and Actual Performance (Financial)3a Operating Performance 1966/67-1975/76 - Broad Gauge3b Operating Performance 1966/67-1975/76 - Meter Gauge4. Freight Traffic: Forecasts and Actual
ATTACHMENT A: PROJECT COMPLETION REPORT (ELEVENTH RAILWAY CREDIT 280-IN)
1. Summary of Bank Group Lending for Transport A.1
2. Summary of Credit 280-IN and Eleventh Railway Project A.13. Major Findings A.34. Recommendations or Action Taken A.45. Bank Group Lending to Transport Sector A.56. The Economy and the Transport Sector A.7
7. IR's Investment Program A.108. Project Execution and Disbursements A.11
9. Operating Results and Physical Performance A.12
10. Financial Aspects A.1411. Borrower's Observance of Commitments and Undertakings A.1712. Economic Evaluation A.18
ANNEX
Summary of Principal Covenants Included in Credit Agreements80-IN, 162-IN and 280-IN (9th, 10th and 11th Railway Projects)
This document has a restricted distribution and may be used by recipients only in the performanceof their official duties. Its contents may not otherwise be disclosed without World Bank authorization.

- 11 -
Page No.
TABLES
1. Statement of Bank Group Loans and Credits for Indian Railways2. Bank Group Lending for Transport Projects Other than
Indian Railways3. IR Freight Traffic 1969/70-1975/76 (Appraisal Estimates
and Actuals)4. IR Passenger Traffic 1969/70-1975/76 (Appraisal Estimates
and Actuals)5. Capital Expenditures during Fourth Plan and in Project
Period (1971/72-1973/74)6. Comparison Between Targets and Achievements of Principal
Project Items (1971/72-1973/74)7. Comparative Unit Costs of Locomotives and Rolling Stock
at the Beginning and End of Project Period 1971/72-1973/748. Estimated and Actual Schedules of Disbursements by Quarter9. Selected Operating Statistics 1965/66-1973/7410. Revenue and Expenditure Accounts for 1957/58; 1960/61;
1965/66 and 1969/70-1973/7411. Statement of IR Expenditure on Capital Account12. Summarized Revenue and Expenditure Accounts During the Years
Covered by the Project
ATTACHMENT B: PROJECT COMPLETION REPORT (TWELFTH RAILWAY CREDIT 448-IN)
I. Sector Background B.1II. The Role of the IBRD/IDA B.1
III. Project Preparation and Appraisal B.2IV. Traffic and Operations B.3V. Project Implementation and Cost B.4
VI. Financial Results B.6VII. Institutional Development B.6
VIII. Economic Evaluation B.7IX. Major Findings and Recommendations B.7
ANNEX
Summary of Covenants and Undertakings and Action TakenThereon
TABLES
1. Comparison Between Appraisal Estimates and Achievements ofFreight Traffic for 1974/75
2. Comparison Between Appraisal Estimates and Achievements ofPassenger Traffic for 1974/75
3. Selected Operating Statistics 1966/67-1974/754. Capital Expenditures for 1974/75

- iii -
TABLE OF CONTENTS (CONT'D)
5. Comparison Between Appraisal Estimates and Achievements ofPrincipal Project Items for 1974/75
6. Wholesale Price Index Numbers for Important Commodities
Used by IR7. Estimated and Actual Schedules of Disbursements by Quarter
8. Summarized Revenue and Expenditure Accounts 1973/74-1975/76
CHART
Indian Railways Organization Chart
MAP
India Railways

PROJECT PERFORMANCE AUDIT REPORT
INDIA ELEVENTH AND TWELFTH RAILWAY PROJECT (CREDITS 280 AND 448-IN)
Preface
This report presents the performance audit of the Eleventh andTwelfth Railway Projects for which Credits 280 and 448-IN were fully disbursedin October 1974 and October 1975, respectively. Since the credits formed partof a long-term association, the present report, which is the first audit onBank Group lending to Indian Railways, deals with some matters which werealready of concern in earlier projects. Some references are made to the year1975/76, because it represents a more normal situation than 1974/75, which wasthe last year of the twelfth project.
This performance audit is based mainly on the attached ProjectCompletion Reports (PCRs), prepared by the South Asia Regional Office, areview of IDA files, and discussions with IDA staff. In October 1976, a 2-1/2week visit was made to India on behalf of OED in connection with this per-formance audit. Extensive discussions were then held with officials of theIndian Railways and others in the Government of India. The valuable assist-ance of these officials is gratefully acknowledged.
The Project Performance Audit Memorandum (PPAM) which followshighlights the principal results of the two projects and then draws attentionto some main issues arising from past Bank Group lending to Indian Railwaysin general. More details concerning the projects and their implementation arecontained in the attached PCRs.


PROJECT PERFORMANCE BASIC DATA SHEET
INDIA ELEVENTH RAILWAY PROJECT (CREDIT 280-IN)
Key Project Data
Item Original Plan Actual
Total Project Cost (US$ millions) 1,084 1,200
Overrun () - 11
Credit Amount (US$ million) 75 75
Disbursed (US$ million) - 75Cancelled (US$ million) -Exchange adjustment (US$ million) - 5Outstanding to IDA (US$ million) 12/31/76 - 80First Year Economic Return (%) 10-20 10-20
Other Project Data
Item Original Plan Actual
Board Approval 1/11/72
Credit Agreement - 1/24/72Effectiveness 2/25/72 3/29/72Closing Date 9/30/74 9/30/74Borrower Government of India (GOI)Executing Agency India Railways (IR)
Mission Data
Month, No. of No. of Date ofYear Weeks Persons Manweeks Report
Identification 08/70 1 3 3 09/25/70Appraisal 03/71 3 4 12 10/05/71
Total 4 15
Supervision I 03&04/72 2 2 4 05/25/72Supervision II 03/73 2 3 6 05/15/73Supervision III 12/74 2 3 6 07/31/75
Total 6 16


PROJECT PERFORMANCE AUDIT BASIC DATA SHEET
INDIA TWELFTH RAILWAY PROJECT (CREDIT 448-IN)
Key Project Data
Item Original Plan Actual
Total Project Cost (US$ million) 654 543Underrun () - 17Credit Amount (US$ million) 80 80Disbursed (US$ million) - 80Cancelled (US$ million) - noneExchange adjustment (US$ million) - none
Outstanding to IDA (US$ million) 12/31/76 - 80Economic return (%) 13 13
Other Project Data
Item Original Plan Actual
First mention in files 02/05/73Board approval 12/15/73 12/18/73Credit agreement 12/21/73Effectiveness 03/21/74 02/25/74Closing date 09/30/75 09/30/75Borrower Government of India (GOI)Executing Agency Indian Railways (IR)
Mission Data
Month, No. of No. of Date ofItem Year Weeks Persons Manweeks Report
Identi fication)Preparation ) (Carried out together with the Preappraisal below)
Preappraisal 03/73 2 3 6 05/15/73Appraisal 06/73 3 3 9 12/ 6/73
Total 5 15
Supervision I 02/74 3 2 6 04/24/74Supervision II 06/74 1 1 1 07/10/74Supervision III 12/74 1 3 3 01/15/75Supervision IV 03/75 1 4 4 05/28/75Supervision V 12/75 1 2 2 12/29/75
Total 7 16
Follow-on Project
Thirteenth Railway Project (Credit 582), approved August 1975, for US$110 million.
COUNTRY EXCHANGE RATES
Name of Currency Indian Rupee (Rs)Year: 1971
Exchange Rate: US$ = Rs 7.50
1974 US$ = Rs 7.45
1975 US$ = Rs 8.11US$ = Rs 7.85


PROJECT PERFORMANCE AUDIT REPORT
INDIA ELEVENTH AND TWELFTH RAILWAY PROJECT (CREDITS 280- AND 448-IN)
Highlights
Credits 280-IN and 448-IN financed the 11th and 12th projects in
a continuous program to assist Indian Railways (IR) to modernize and toexpand. The above two credits covered most of the foreign exchange require-
ments of IR's investments from April 1971 to March 1975. The original
investment program was scaled down because of higher costs and lower thanexpected traffic. The projects were implemented on time. The reestimated
rates of return are similar to the appraisal forecast. Because of unusual
economic and political circumstances, the financial situation of IR deterio-
rated during the projects' period, but it has now improved.
Indian Railways constitute a large system which performs a vital
transport function in the country's economy. The system is mostly modern
and reasonably efficient, while efforts to make further improvements continue.
Freight traffic has not grown as rapidly as expected and there is now some
excess capacity; however, that may not be undesirable inasmuch as it would
help avoid transport constraints when economic activity accelerates. Improved
methods to calculate freight capacity would nevertheless help to achieve more
accurate estimates of investment requirements.
In spite of many years of dialogue between the Government and the
Bank, transport planning and coordination remains rather weak. Some progress
is now being made on the national level and IR's corporate planning exercise
has been successful.
The following points may be of particular interest:
- the importance of IR in Indian economy and the Bank Group's
involvement in India's transport sector (paras. 1, 3, 5 and
PCR 11th Project, Tables 1 & 2);
- reasons for lower than forecasted traffic (paras. 17, 18,PCR 11th Project, paras. 6.02, 6.03; PCR 12th Project,para. 4.02);
- risk of overinvestment through insufficient knowledge about
existing freight capacity (paras. 22 and 23);
- difficulties in estimating economic returns for specific invest-
ments in a vast railway system (paras. 26, 27; PCR 11th Project,paras. 12.05, 12.06; PCR 12th Project, para. 8.01); and
- slow progress in transport planning and recent improvements(paras. 24, 37, 38, 42, 45; PCR 11th Project, paras. 6.06-6.09).


PROJECT PERFORMANCE AUDIT MEMORANDUM
INDIA ELEVENTH AND TWELFTH RAILWAY PROJECT (CREDITS 280 AND 448-IN)
I. PROJECT SUMMARY
1. Indian Railways (IR) is the third largest railway system underone management in the world, being exceeded in size only by the railways inthe USSR and China. The system consists of 30,275 route km of broad gauge,25,550 route km of meter gauge and 4,476 route km of narrow gauge track;about 20% of the above routes are double tracked. Seven percent of theroute km is electrified. 1/ In April 1974 IR had about 11,000 locomotives,1,900 electrical multiple units, 34,000 passenger coaches and 390,000 freightwagons. In 1975/76 2/ IR moved 221 million tons and 1,252 million passengersor a total of 148,000 million ton km and 112,123 million passenger km. About80% of IR freight traffic consists of bulk transport. At the start of theproject period, in 1971, IR transported about two-thirds of all freightand about half of all passenger traffic, but there has been a marked shifttoward road transport in recent years. IR has a total staff strength of some1.7 million.
2. Formal jurisdiction over IR rests in the Minister of Railwayswho is a member of the Central Cabinet. Overall management is in the hands ofthe Railway Board (Ministry of Railways). There are nine railway zones, eachwith a General Manager who reports directly to the Railway Board. IR alsooperates manufacturing units consisting mainly of two locomotive and one coachfactory. IR has its own research and design organization (RDSO). Railwayoperating and capital budgets are discussed in detail by Parliament, whichalso frequently has a direct impact on the commercial results of IR by rulingon tariff increases, and on requiring the operation of services on groundsother than purely economic.
3. The two projects, which are now being audited, form part of along-term lending program to IR, started in 1949 and in which the thirteenthproject was approved in 1975. A fourteenth project is under preparationand will probably be appraised in May 1977. The lending so far has involveda total of US$896.5 million equivalent, of which US$379.0 million has beenextended in loans and US$517.5 million in credits, and was initiated to assistIR with its rehabilitation program after World War II. Industrial importcredits have also covered the cost of some parts and components for IR's
1/ All data for 1974/75.
2/ Provisional figures. The freight includes some 15 million tons ofexceptional traffic, required to reinstate normal stockpiles of indus-trial fuel and raw materials, which had been depleted due to transportinterruptions in previous years.

- 2 -
manufacturing activities. The last three credits have covered about 10% ofIR's total investment for the period. Until 1951, when the first steamlocomotives were produced in India, virtually all manufactured components hadto be imported. About 20 years ago foreign exchange expenditures were stillover 50% of investment costs, while this has now been reduced to only about14%.
4. The greatest problem which has faced IR until the early 1970s hasbeen to provide capacity to accommodate the increasing demand, caused byindustrialization and the resulting need for transport of fuel and raw mate-rials. Over the past fifteen years freight traffic has grown from 156 millionto 221 million tons. The Bank has viewed lending to GOI for IR favorably,because there was an established need, it was a well organized entity to lendto, with a role critical to India's overall economic development, and a smoothtransfer of resources was virtually ensured. Issues of IR's own planning andtransport planning and coordination for the entire country were discussedfrequently between Bank Group staff and officials of the GOI and IR. Theseissues have only become prominent, however, during the last five projectswhen they were covered in the Credit Agreements or side letters.
5. There have been seven lending operations amounting to US$254.6 mil-lion equivalent for transport projects other than railways. Except for ashipping loan in 1972, all of these took place between 1957 and 1962. Inaddition the Bank Group has provided US$342.9 million equivalent of indirectsupport to the road transport industry through ten industrial import credits.A small roads component has also been included in a number of agriculturalprojects.
6. The 11th and 12th Railway projects covered the period April 1971to March 1975, and included financing for part of the foreign exchange com-ponent of 18 steam, 693 diesel, and 289 electric locomotives; 813 ElectricalMultiple Units (EMUs); 5,289 coaches; 53,329 freight wagons (in terms of 4wheel equivalent); 1/ 5,760 km of track renewal; 990 km of line doubling;1,080 km of line electrification; and 980 km of new lines (Table 1). The11th project involved an IDA credit of US$75.0 million equivalent, whichcontributed to an investment program of US$1,084 million equivalent. The12th project consisted of an IDA Credit for US$80.0 million equivalent cover-ing part of the investment during the first 15 months (January 1974-March1975) of IR's fifth five-year plan; the total investment projected for thatperiod of 15 months amounted to US$654 million equivalent.
7. The final cost of the 11th project (IR's investment program for thethree years 1971/72-1973/74) increased by about 10%, which covered part ofadditional costs due to inflation, but funds were insufficient and cutsin the program had to be made. The 12th project, consisting mainly of IR's
1/ The official documents for the 11th project (Credit 280) mention twofigures for freight wagons: 31,649 and 21,000 (both in terms of fourwheelers), but we have been assured by the Projects Department that thehigher figure is the correct one.

- 3 -
investments during 1974/75, was reduced because of the lower than expecteatraffic growth and the eventual expenditure was 14% less than the originalestimate. About US$22 million equivalent of the proceeds of the credit wereused for the 13th project (PCR 12th project, para. 5.05 and Table 4). Otherreasons for the reduction in physical investment were cost increases due toproduction problems resulting from strikes, supply difficulties, and delaysresulting from the indigenization process which consists of the change fromimports to local production of parts and components. The funds provided underthe two credits were fully disbursed. In terms of physical output, however,there has been a considerable shortfall (Table 1). Some reallocations betweencredit categories have also taken place (Table 2).
8. Even though IR has experienced some financial difficulties duringthe past few years, its financial status still ranks high among the world'srailways. According to the agreements for the 11th and 12th projects IRis to generate sufficient revenues to cover all operating expenses (includingadequate appropriations for the Depreciation Reserve Fund and Pension Fund)and the dividend on the Government's investment in IR. The dividend rate,set by Parliament, is 5.5% on capital invested before March 31, 1964, and6% on capital invested after that date. Owing to India's economic recession,labor unrest and substantial wage increases for Railway staff, IR had dif-ficulties in meeting this target. IR requested that the earnings covenant bewaived for 1973/74, to which IDA agreed. During negotiations for the 12thproject in 1973, it was realized that time would be required to adjust ratesand fares, and it was therefore agreed that revenues for 1974/75 and 1975/76should be sufficient to cover 70% and 85%,respectivelyof the dividend forthose years (PCR 11th project, para. 10.05 and Annex 2). For 1974/75 IR didnot fully comply with the agreement, but for 1975/76 and 1976/77 the targetshave been met. At the time of presentation of the 12th project, the Boardwas concerned about the proposed waiver of earlier agreements on dividendpayment. It requested management for a report on IR's financial situation3 years later, by which time full recovery was anticipated. A paper on thiswas presented on March 9, 1977 (IDA/SecM77-55).
9. In connection with these projects it was also agreed that:
(a) the borrower would prepare and maintain a long-term "corporate"plan;
(b) the methodology for appraisal of investment projectswould be progressively improved and discounted cashflow criteria for such appraisals would be introduced;
(c) revenues or losses from mass transit systems, if included inthe railways' budget, would be separately identified; and
(d) the content of a timetable and plan of action for the estab-lishment of a framework for future Bank Group participationin the transport sector would be worked out by 1974. Thiswould be based on a full review of the transport sector whichthe Government was intending to do and which was discussedwith the Association during negotiations for the 11th project.

most of these agreements have been carried out. The preparation of a cor-
porate plan has taken more time, however, than was originally envisaged,
but has resulted in a useful framework for further detailed planning.
There was no agreement on the nature and timing of the improvements in the
methodology for appraisal of investment projects, and the covenant itselfis too vague to be meaningful. However, cash flow criteria and shadow
pricing of labor and foreign exchange are now being introduced in project
appraisals. The framework for future Bank Group participation in India'stransport sector has not yet been formulated.
10. The 12 loans and credits have all contributed to progressive
improvements of IR. Most of the achievements are on the technical side:
operations, at least on the main lines, are mostly modern and efficient;
the present carrying capacity seems to be ample for freight traffic, and
also satisfactory for passenger services with the exception of some suburban
services, where overcrowding persists. IR's rates and fares are low and
average receipts are USiO.7 per ton km and USJ0.2 per passenger km. A
major achievement of the 11th project is the introduction of the corporate
planning process, which has focussed on a 15-year planning period, in addition
to the customary 5-year period, and has resulted in a long range perspectiveplan for the period 1974-1989. Some specific planning issues remain to be
solved and are discussed in the next chapter.
11. In the appraisal reports the first year economic return for the 11th
project was estimated to be between 10% and 20%. The economic rate of returnof the 12th project was estimated at 13%. The re-estimation of these returns
in the PCR indicates that the appraisal forecasts have been achieved (PCR 11th
project, para. 12.05 and PCR 12th project, para. 8.01). Further discussion onthis point follows in Chapter II.
II. ISSUES
12. The implementation of the 11th and 12th Railway projects has been
complicated by unusual problems, resulting from the Indo-Pakistani war, the
oil crisis, strikes and other civil unrest. These problems have led to a
work stoppage at the railway for about 20 days in 1974, and also to electric
power cuts and irregular supply of parts and other necessities.
13. In view of the size and complexity of the Indian railways this audit
does not attempt any assessment of the system as a whole. In the following
paragraphs five special problems are discussed, which are directly related to
the implementation of the eleventh and twelfth projects. The audit mission
largely agrees with the PCRs, but feels that some issues deserve more emphasis.

-5-
(a) Project Implementation
14. Para. 7 above and Tables 1 and 2 summarize the physical and finan-
cial performance under the two projects. During the project periods con-
siderable changes were made in the contents of each project. The changes wereprimarily the result of lower than expected traffic, but were also influenced
by other factors such as parts availability and cost increases. A number ofreallocations took place between the different categories specified in sche-dule one of the Credit Agreements (Table 2).
15. In these two projects it is not possible to relate the particular
items financed by IDA to specific aspects of IR's operations. The creditshave really been to assist in the financing of a continuing program of railway
investment, with a specific period of time being regarded as a "project".
The appraisal reports and Credit Agreements do not carry any details as to thesections of line to be doubled and locations of new lines to be built under
the projects. Parts financed under the projects are mostly used for repairsin IR workshops and the building of new diesel and electric locomotives andpassenger coaches in IR's own factories. According to the Appraisal Reportthese production units are generally efficiently operated and produce at areasonable cost. However, the Bank intends to take a closer look at their
operations in connection with the next railway project.
(b) IR's Planning and Operations
16. As pointed out in the PCR for the 11th project (para. 6.02), at theend of the project period (1973/74), only 185 million tons were carried, com-pared with 240.5 million tons forecast in the appraisal report 1/ and 260 2/million tons forecast for the same year in the original fourth five-year plan.-
However, between 1969/71 and 1973/74 the distance over which the average tonwas carried increased by 7.9% for broad gauge (BG) and by 13% for meter gauge(MG). Passenger traffic forecasts were closer to what actually happened,
which was in part due to a higher than expected growth of suburban traffic.
17. Shortfalls in freight traffic can be partially explained by theevents described in para. 12. Also, in view of the rapidly increasing shareof freight traffic transported by road (28% in 1971 and 40% in 1975, PCR 11thproject, para. 6.04), it seems reasonable to conclude,even though adequate
statistics are lacking, that IR's relative position as goods carrier isdeclining. IR is strong in the field of bulk transport, but general goodstransport has stagnated for many years, while some other short and medium
distance traffic apparently also prefers road transport. It is not clearwhether this development is economically desirable, but some of the reasonsfor diversion are discussed in para. 31.
18. When preparing its investment programs, IR is assigned a task by the
Planning Commission, in terms of tonnage to be carried, which is based on thegeneral plan for the economy as a whole. These plans are usually rather
1/ For forecasts under the 11th, 12th and 13th railway projects and actualtraffic between 1960 and 1976, see Table 4.
2/ The investment plan was based on a traffic forecast of 240.5 million
tons.

- 6 -
optimistic, and are frequently reduced to more realistic levels during subse-quent consultations between IR and the Planning Commission. Nevertheless,for the two projects traffic forecasts have turned out to be consistentlyhigh. The appraisal forecasts for annual growth in the 11th and 12th projects(made in 1972 and 1973) were 4.1% and 5.1%, respectively, for tonnage carriedand 3.3% and 5.0% for ton km (Table 4). This compares with an actual annualtraffic growth over the last 15 years of 2.4% for tonnage and 3.6% for ton km.During the forecast period of the 11th project (1969/70-1975/76) actual growthwas 1.0% for tonnage and 2.4% for ton km carried. The first 4 years of the12th project, for which data are now available, show a growth of 2.8% fortonnage and 2.6% for ton km carried.
19. In 1966, under the 9th project, an economic unit was set up in theRailway Board. In 1972, under the 11th project, the Bank has speciallystressed the importance of project analysis. Due to the limited economicstaff available much of the planning still appears to be done on the basis oftechnical and financial criteria without much recourse to economic analysis,but the scope of involvement of the Economic Unit is gradually being expanded.
20. IR's planning has been predominantly based on the five yearnational plans. It was felt that a perspective plan which would evaluatethe effects of investments over the longer term was lacking. Under the11th project agreement was reached that a corporate plan for the period1974-1989 would be prepared. A first draft was completed on time and isbeing followed by further refinements.
21. Investments under the two projects were for replacement and toincrease IR's carrying capacity for both freight and passengers. Of thesefreight capacity has clearly greater economic significance since shortagesin freight capacity could lead to serious economic losses through reducedindustrial production and possible loss of export orders, while passengerservices could be curtailed to affect mostly passengers whose trips wouldhave little or no economic value. The crucial factor here is freight wagoncapacity and to a lesser extent motive power, because the latter can, ifnecessary and at the margin, be diverted from passenger services.
22. Most of India's heavy industries have considerable spare capacity.An increase in industrial activity could result in a sudden increasein freight transport. Such a change would not allow enough time to increasethe fleet of freight wagons. During a period of reduced economic activity,therefore, a certain excess capacity of the Railways would be desirable.According to IR's Planning Department the system's freight capacity in April1974 was more than sufficient at 221 million tons, which was calculated,however, by using better turnaround times and a higher average lead thanwere achieved at the time. Apparently no estimates could be provided on the1975/76 freight capacity. Further investments in freight wagons were madebetween April 1974 and 1975/76, when IR carried 223 million tons. Based oninformation for that year, it appeared that freight wagon capacity was ampleand orders could normally be filled immediately. This is also evident from

- 7 -
statistics which indicate that the number of outstanding requests for wagons
was very small. The turnaround time of 13.2 days in 1975/76 for wagons is
still above the target of 12.1 days for the fifth plan, which also points
at the fact that ample stock is available. Reductions in turnaround time are
expected to continue as a result of measures to rationalize yard operations,
the introduction of block trains and the fact that general merchandise, which
requires a much higher wagon capacity to move a ton km than is required for
instance for bulk coal movement to general users (about 2.7:1), is decreas-
ing as a proportion of total traffic. Based on the mission findings, it
appears that IR's knowledge of the carrying capacity of its freight wagon
fleet is not sufficiently detailed for the purpose of sound investment
planning. Improvements in this field would probably require a complete
breakdown for all aspects of freight car use for each major commodity group
(e.g., working in coal yards, loading/unloading, shunting, etc.). For each
activity at least three values should be used:
(a) operating time now required;
(b) shortest time in which activity can take place without
investments or major organizational changes (e.g., in one
colliery loaded wagons were always waiting for 12 hours
before being collected); and
(c) longer term improvements.
The use of a simple computer program would provide immediate information on
the spare freight capacity (difference between (a) and (b)), and the ultimate
capacity (c). It would also enable IR to better compare spare capacity against
changes in the mix of traffic and/or transport demand increases in one or
several sectors of the economy. 1/
23. IR's normal practice for doubling of a particular line is to start
with the most congested sections and delay other sections as long as possible.
IR has also made substantial progress with the introduction of longer andheavier trains in order to postpone the need for extra line capacity.Only a detailed review of terrain conditions, traffic composition, etc.,could lead to firm ex-post judgments on the timeliness of completed line
doubling and gauge conversion. The fact, however, that some lines are now
fully double tracked for about 20 train movements per day in each direction,
while work was started when there were about 10 - 12 train movements in each
direction, may point to an overly cautious, and costly, attitude of IR in
1/ IR feels that their methodology of assessment of freight car require-
ment is fairly comprehensive and that it appears unlikely that any
substantial improvement would result by following the system proposedby the Audit Mission, which they feel prima facie does not appearfeasible of being implemented easily.

-8-
avoiding line capacity constraints. 1_ This attitude probably reflects themany years that IR officials had to work under conditions of serious capacityshortages. As part of the Corporate Plan, IR is now broadening the considera-tion of alternatives to increase line capacity.
24. Little information is available on the new lines which were builtunder the projects (630 km). Some are spurlines serving new industrialand mining activities, while others are development lines, providing moderntransport to areas so far not served. IR suggests that the first categorywill carry large volumes of traffic, but agrees that the development linesdo not always meet economic criteria. On the basis of the audit mission'sfindings, it appears that, the Association has probably made, through the
project, a small contribution to the increase of the uneconomic lines, insteadof being instrumental in their decrease.
25. IR's operations are as a whole modern and efficient. IR is intro-ducing measures to increase the efficiency of equipment utilization. Theseinclude the introduction of block trains for bulk transport, the centraliza-tion of marshalling operations, and a reduction in wagon detentions duringloading and unloading (see PCR 11th project, para. 9.06). Statistics onequipment availability show a slight decrease over the past 10 years (seeTable 3). For locomotives part of this is due to technical problems (PCR 11thproject, paras. 9.04 and 9.05), but even before the deterioration availabilitywas below that of most developed countries. Availability of BG dieseland electric locomotives in India in recent years has been about 84% and 80%respectively, while in several European countries the availability was over90%. 2/ The main reason for this appears to be delays in importing and dis-tributing spare parts and problems with local parts production. The avail-ability of freight wagons has been high throughout. If IR could improveequipment availability significantly, it could substantially reduce futureinvestment requirements.
(c) Economic Evaluation
26. The appraisal reports for the eleventh and twelfth railway projectshave based the calculation of economic benefits on railway operations costreductions and the avoidance of extra cost to the economy for carrying goods
by a more expensive transport mode due to eventual rail capacity shortageswithout the investments. At the time of appraisal of the 11th project, thefirst year economic return was estimated at 10-20%, while a rate of returnwas only calculated for a number of subprojects. The PCR has not reevaluatedthe subprojects and the result would not be of overall significance, becausethey covered only 5% of the total investment. The PCR, however, concludes
that based on findings of the appraisal of the 13th project, the 11th project
1/ IR is of the opinion that their methodology for deciding on double
tracking is still satisfactory.
2/ Some of these countries achieve availabilities over 95%, but sometimes
the methodologies used for the calculations differ.

- 9 -
has met its objectives and has, therefore, had a first year return of at
least the appraisal range of 10-20%. The economic return on the 12th proj-ect was 13%. A reestimate has been made concluding that the expected 13%will be achieved (PCR 12th project, para. 8.01).
27. In view of the complexity of IR's system and the limited timeavailable for audit, the above estimate is considered acceptable. A moreaccurate estimate of the economic return, would require a detailed study todetermine what cost reductions have resulted from the investments. Further-more, economic benefits from avoiding traffic diversion to a more expensivemode cannot be calculated with any degree of accuracy. The first difficulty'is the estimation of the traffic volume which would have been diverted to othermodes without the investment. This requires an estimation of the sparecapacity of the railways without the investments which is not available(para. 22). It can be argued that if there is spare capacity on the railways,nothing would have been diverted and there would be no immediate benefits.However, rail transport investment, as much as planned requirements, haveto be seen in a longer perspective and without the present investments asudden upturn in the economy might have resulted in serious transport con-straints. Some of the excess demand could divert to road transport, butthe spare capacity of the vehicle fleet is apparently limited and productionlosses are likely to occur. Therefore, a simple comparison of the cost oftransporting the diverted traffic on the roads rather than on the railwaysas used in the two projects under consideration is, in our opinion, in thecase of India, a questionable way of assigning benefits. Avoidance ofpossible production loss due to lack of transport also should be consideredas an additional benefit of investment in the railways.
28. A long run perspective is required for a proper analysis of theeconomic returns of the investments in the IR. 1/ In the short run, theremay be fluctuations in the degree to which capacity is used, which may resultin low utilization of capacity in some years and in problems of moving thetraffic in others. If these fluctuations are not too large, the railway hasadequate procedures to face them properly (i.e., reducing or increasing wagonand locomotive scrapping as well as accelerating or reducing the volume andpriority of certain programs). But the problem appears when large discrepanciesdevelop between capacity and demand, something which apparently had not beenthe case in the recent past. Large discrepancies may produce: (a) overinvest-ment for long periods with serious consequences regarding the efficient useof resources or (b) underinvestment with serious consequences on total trans-port costs and the ability of the economy to reach its full productivepotential.
29. The development of a long term Corporate Plan for the IR is in-tended to place the analysis of investments and other policies affectingrailway efficiency and capacity in a long run perspective as well as inthe broader perspective of the complex interrelationships affecting differentactions that may be taken. Preparation of such a plan implies a complex
1/ In the appraisal of the 11th project the economic return calculated forthe subprojects was based on the long term growth of traffic, while this wasalso done for the economic return on the 12th project. Furthermore, theexpost economic return for the 12th project has been calculated consider-ing, as a basis, the average traffic developments over a 5 year periodand the anticipated long range developments.

- 10 -
process of progressive detail and revision on which, on the one hand, theproposed actions of original versions are improved as a result of the con-sideration of more interactions and, on the other hand, the programs aremodified and detailed as a result of the definition and analysis of specificsub-projects and policy measures. It is important that this iterative processbe based as much as possible on sound analytical procedures taking into properconsideration economic as well as technical and financial criteria. Analysisof the procedures in use indicates that more attention should be paid toeconomic criteria.
(d) Finances and Traffic Diversion
30. As has been explained in para. 8 and the PCRs, IR's finances haddeteriorated during the project period, but are now recovering. The factthat IR could not pay the required dividend on the Government capital investedin the Railways in itself is not surprising, because economic and politicalconditions during the period were particularly difficult; moreover, it nowappears that starting in 1975/76, the dividend requirement will again befulfilled. This does not mean, however, that IR's financial situation iswholly satisfactory because IR has received numerous short-term loans from theGOI, some of which have been used to pay dividends to the GOI. Furthermore,under the 10th project, agreement was reached that starting from 1970/71, IR'soperating ratio 1/ would not exceed 80. Subsequent projects no longer mentionoperating ratios. Actual operating ratios for 1970/71 to 1975/76 were 84, 83,85, 94, 94 and 91. 2/
31. No firm information is available on the extent that rates and fareshave been used to achieve a more economic distribution of traffic betweenmodes. Present freight rates are uniform per commodity or commodity group andtaper off when the transport distance increases. The rates are supposed to bebased on the actual cost incurred to carry each commodity plus overheads. Forbulk traffic such as coal, steel and fertilizers, rail transport would becheaper than road transport, assuming good service can be provided. Therefore,charging this traffic the total cost should not normally incur the risk oftraffic diversion. For other commodities and in general for short and mediumdistance traffic, road transport apparently is now taking a greater share.Charging this traffic with the full overheads of IR could easily lead to anuneconomic distribution of traffic between modes because (a) IR has to carry
1/ The operating ratio is the working expenses plus depreciation divided byoperating revenues, expressed as a percentage.
2/ Estimate.

- 11 -
a much heavier social burden than road transporters and (b) in many casessunk investments in track and other facilities would remain underutilizedwhile roads would have to be built or improved. A few years ago, zonalmanagers were authorized to use flexibility in rates as part of improvedmarketing efforts. Costing cells were created in the zonal railways, butthere is still a shortage of data on costs and rates charged by competingmodes.
32. Among the social burdens carried by IR, a major item is the laborforce, which per unit of traffic and in view of the large volume of bulktransport moved, appears very large. IR has been fairly successful over thelast years in slowing down further growth of the labor force. In a countrywith high unemployment it is difficult to reduce the labor force and a highdegree of mechanization would be undesirable. However, taking into accountrecent increases, wages represent over 70% of total operating costs. IR alsooperates hospitals, schools and other social services. It has a number ofuneconomic lines and services which are continued for social or strategicreasons, as well as losses on suburban commuter services. If all thesecosts were charged proportionally to the traffic, it would shift the compe-titive advantage to road transport, where the same social costs are carried bythe national Government. These problems were pointed out in the appraisalreport of the 11th project.
(e) Transport Sector Planning and Coordination
33. As mentioned earlier, agreements on transport planning have beenincluded under the two projects. Investment programs are prepared for eachmode within the appropriate agency and the programs are submitted to thePlanning Commission for approval. However, a comprehensive analysis of theproblem of intermodal coordination has not received the attention that itdeserves.
34. Railway planning has already been discussed earlier in this chapter.The investment plans proposed by IR are probably the most comprehensive in thetransport field, even though more emphasis on economic factors in the planningprocess would be desirable. The highway subsector is handicapped in preparinginvestment plans by the division of jurisdiction over the highway systembetween the Ministry of Shipping and Transport (Roads Wing) and the individualstates, as well as by a serious shortage of traffic data. There is no thoroughand systematic approach to traffic counting and hence inadequate information onpresent traffic volumes and traffic growth. Comprehensive data on trafficorigin and destination are also lacking. This information would be useful forhighway planning, and essential for the formulation of a policy for achievingthe most economic distribution of traffic between transport modes, throughbetter pricing, licensing (or the lack of it) and investment.
35. The Shipping Wing of the Ministry of Shipping and Transport isresponsible for port planning and investment as well as for shipping. Sincethe major investments are made for bulk transport, which have to rely on therailways for movement within the country, there is a definite effort tocoordinate port and railway investment, whenever relevant. Coastal shippingmostly for salt and a small quantity of coal, lightens IR's burden somewhat,

- 12 -
but is not very significant. Occasionally recommendations have been made touse coastal shipping for bulk transport on a large scale, specially for coalfrom the east to the coastal regions in the South and West of India. 1/ These
suggestions have never been carried out largely because of port capacityproblems and a lack of determination to enter into such a venture.
36. A number of Government measures affect the development of transport.This is specially the case for road transport which has been hampered by avariety of local taxes levied as tolls and restrictive licensing. The GOI has
made progress in eliminating some of the taxes, which slow down traffic.
37. There is much room for improvement in transport planning and coordi-
nation, before the optimum use can be made of funds spent on the sector. Theissue has been the subject of a continuous dialogue between the GOI and theBank. Transport planning has been discussed specifically during the negotia-tions for the two projects under review. When the 11th project was negotiatedthe GOI stated its intention to undertake a full review of the transportsector, with emphasis on the need for better coordination and effective insti-tutions to achieve policy objectives. The Association agreed to contribute tothis review by means of a comprehensive sector mission. The review wasexpected to take about 18 months and to lead to an understanding between theGovernment and the Association on the basis of future Bank Group activity in
the transport sector. Work on the review was underway when the 12th projectwas negotiated. At that time, a timetable for the completion of the activitieswas agreed on.
38. The transport review and sector survey were completed as plannedin late 1973. The Planning Commission is currently engaged in exploring thepossibilities of developing an analytical frame-work which may help in improvingthe basis on which resources are allocated to different modes of transport.Recently, a UNDP advisor has been appointed to help the GOI with these efforts.The above as well as the successful exercise of IR in preparing the corporateplan indicate that the considerable efforts made in the past have led to acertain amount of progress.
(f) The Bank Group's Role
39. IR is a very complex organization which for many years had to face ademand much higher than its capacity. In addition, the foreign exchange short-age of India was very serious, which implied that without Bank/IDA support atthe appropriate times, the replacement and expansion program of IR could have beenadversely affected, thus hampering industrial production and the vital supplyof farm inputs and foodstuffs.
I/ A new study was recently completed, but it is too early to know whetherit will lead to increased use of coastal shipping.

- 13 -
40. The Bank has not been very persistent on the specific andgeneral issues of national transport planning. It appears that during theproject periods (11th and 12th) when the capacity shortages were no longerserious, it would have been to India's benefit if agreements could havebeen reached on more rapid and specific improvements in the planning field.
The corporate plan is the most successful institutional result of IR/Bankcooperation. It appears essential that this effort be maintained and ex-
panded upon. In future contacts Bank staff should continue to support this
effort, and more so than in the past the staff should be supplemented byhighly specialized technicians to advise IR on various innovations and guidethe Bank in details of further lending efforts.
III. CONCLUSIONS
41. Bank/IDA lending to IR over the past 28 years has been importantto the development of India, because it provided the foreign exchangeresources without which IR's replacement and expansion program would havebeen very difficult. For a long period practically all IR's resources wereconcentrated on increasing capacity to avoid transport becoming a bottleneckfor economic expansion and the movement of vital food supplies.
42. Under the considerable operating pressures which prevailed overmany years, planning has not received rightful attention, leaving amongstothers traffic forecasting and feasibility studies of sub-projects much weakerthan could be expected from an advanced organization such as IR. For example,the system's freight carrying capacity appears higher than required forthe present demand. Some or maybe all of this excess capacity is desirable,since India's industrial establishment is capable of increasing its produc-tion at short notice. Based on the mission's findings, it appears that bettermethods for calculating the carrying capacity would be desirable. In addition,further improvements in the methods for operations and planning might resultin lower requirements for new investment; in percentage terms, even a smallsaving in the case of IR would amount to substantial sums. The corporate plan-ning exercise, started under the 11th project, is a substantial improvementand should be continued and broadened.
43. In terms of timing and procurement procedures project implementa-
tion has been satisfactory, but there is a lack of exact knowledge on what
has been achieved. When components are provided for an ongoing production
and building process, precise control is difficult, but more details on
what was achieved would be desirable. A better reporting system relatingcomponents financed by IDA more specifically to identified project items (such
as specified lines or particular types of locomotives), should be considered
for future projects, to serve as a management tool for IR and a better system
to account for loan funds.
44. IR has experienced some trouble meeting its financial commitments
during the project period, due to lower than expected traffic, sharplyincreasing costs and a lag in increases of rates and fares, but the
situation is now improving. IR's share of total freight transport has

- 14 -
decreased from 66% to 54% during the project period, to the advantage ofroad transport. In the last few years IR's marketing efforts have improvedand are assisted by a certain flexibility in rates. Moreover, it seemsthat the present rate structure may be conducive to diverting traffic toother modes, because of IR's high social charges which are distributed overtraffic. It appears advisable for IR to specially emphasize marketing andmake full use of flexible rates specially in areas where lines are now usedwell below capacity, and thus retain or regain traffic in areas where com-petition from other modes is very severe.
45. In spite of frequent discussions between the Bank and the GOI,relatively little progress has been made in the field of overall transportplanning and coordination. In its efforts to assist, the Bank has beenhampered by its very limited involvement in the highway sector, as well as bythe shortage of information on road transport. The present lack of coordina-tion of studies and investments for competing modes (mostly rail, road andpotentially coastal shipping) could be logically expected to have resultedin substantial economic losses. The process of coordinating investments indifferent modes of transport is now being improved (para. 38).
46. The Bank's influence on certain aspects of institutional develop-ment has been rather weak (e.g., see paras. 9 and 33). The Bank has beensomewhat hampered in pressing for more rapid progress by its own limitedknowledge of the transport sector and by the fact that lending to IR serveda primary role in transferring resources to the Indian economy. To gainimproved knowledge of problems in the transport field in India, an increaseduse of highly specialized consultants as part of the Bank's transport missionsto India may be useful, as has already been done occasionally (e.g., missions in1977 to review the manufacturing units of IR).
PROJECT PERFORMANCE AUDIT MEMORANDUM
INDIA 11th AND 12th RAILWAY PROJECT (CREDITS 280 AND 448)
Appraisal Estimates and Actual Performance (Physical)
11th Project (CR 280) 12th Project (CR 448) Both Projects Different1971/72-1973/74 1974/75 from Appraisal Estimates
Appraisal AppraisalEstimate Actual Difference Estimatel Actual Difference Actual Units Percentage
Locomotives (Units)Steam " 18 19 +1 0 0 0 19 +1 +6Diesel " 470 385 -85 223 121 -102 506 -187 -27Electric " 211 125 -86 78 46 -32 171 -118 -41
Total " 699 529 -170 301 167 -134 696 -304 -30
EMU's " 568 259 -309 245 201 -44 460 -353 -43Coaches 3,950 3,545 -405 1,339 859 -480 4,404 -885 -17Wagons (in terms of 4 wheelers) 31,649 31,112 -537 21,680 10,958 -10,722 42,070 -11,259 -21
Rail Renewal (km) 4,400 4,070 -330 1,360 731 -629 4,801 -959 -17Line Doubling " 750 1,027 +277 240 139 -101 1,166 +176 f18Electrification 720 500 -220 360 259 -101 759 -321 -30New Lines 700 574 -126 280 56 -224 630 -350 -36
1/ Adjusted for 12-month period.
Source: Appraisal Reports and PCR.

PROJECT PERFORMANCE AUDIT MEMORANDUM
INDIA llth AND 12th RAILWAY PROJECT (CREDITS 280 AND 448)
Appraisal Estimates and Actual Performance (Financial)
Eleventh Project Twelfth ProjectCr 280 Cr 448
Schedule One Final Schedule One Final Both Projects Togetherof Credit Disburse- of Credit Disburse- Percentage Change from
Category Agreement ment Agreement ment Credit Agreement
(in million US dollars)
1. Components and materials (including steel)required for manufacture of Electric Loco-
motives, Diesel Locomotives, Electric Mul-
tiple Units, Coaches and Wagons. 33.0 39.5 49.5 56.4 +16
2. Equipment and material for line capacity
works, electrical works, etc. 3.0 3.2 1.5 4.2 +64
3. Rails 5.0 1.0 2.5 2.0 -60
4. Equipment for signalling and tele-communication schemes. 3.0 2.2 2.0 1.0 -36
5. Equipment and material for electrificationschemes. 4.0 3.1 2.0 1.5 -33
6. Plant and machinery. 3.5 1.6 2.0 1.0 -57
7. Other railway equipment and material. 6.5 7.7 4.5 4.3 +9
8. Non-competitive procurement of components
for manufacture of Diesel Locomotives,
Electric Locomotives and Electric Multiple
Units. 17.0 16.7 16.0 9.6 -20
Total 75.0 75.0 80.0 80.0
Source: IDA files. MC

PROJECT PERFORMANCE AUDIT MEMORANDUM Table 3a
INDIA 11th AND 12th RAILWAY PROJECT (CREDITS 280 AND 448)
Operating Performance 1966/67-1975/76
Broad Gauge 1/
1966-67 1967-68 1968-69 1969-70 1970-71 1971-72 1972-73 1973-74 1974-75 1975-7&--
1. Percentage of serviceablelocomotivesSteam 85 86 86 86 85 86 86 86 84 85
Diesel 90 90 89 88 86 86 85 84 83 84
Electric 82 82 81 83 79 81 80 81 79 80
2. Percentage of serviceable
passenger cars 91 88 86 87 86 87 87 87 84 85
3. Percentage of serviceable
freight cars 96 96 96 96 95 96 96 96 96 96
4. Engine - km/day/engine in use
PassengerSteam 260 257 256 253 250 254 243 238 236 238
Diesel 592 623 658 670 669 665 669 694 652 641
Electric 339 348 379 416 437 437 432 408 408 450
FreightSteam 125 124 121 123 121 119 114 108 112 114
Diesel 357 361 361 356 347 343 329 307 306 321
Electric 339 335 349 340 316 308 306 272 296 369
5. Net tons/freight train 735 724 739 721 737 748 763 745 781 840
6. Wagon - km/freight wagon day 70 72 73 76 73 74 74 67 70 77
7. Punctuality of passenger
trains (%) 85 85 83 85 82 82 86 79 82 86
8. Average wagon load (tons) 18.5 18.1 18.2 17.9 17.9 17.9 18.1 17.9 18.6 20.7
9. Average speed of all goods
trains (km/h)Steam 12 12 12 12 12 12 12 12 12 12
Diesel 24 23 23 23 23 23 22 22 23 22
Electric 25 25 26 26 25 24 24 23 22 24
All traction 17 17 18 18 18 18 18 18 18 19
10. Average lead of a ton of
freight (km) 555 581 582 587 615 641 643 631 655 665
11. Wagon turn-around (days) 12.3 12.6 12.7 12.7 13.3 13.5 13.5 15.0 14.6 13.2
1/ Some 1975-76 data are provisional.
Source: Appraisal Reports and IR.

Table 3b
PROJECT PERFORMANCE AUDIT MEMORANDUM
INDIA 11th AND 12th RAILWAY PROJECT (CREDITS 280 AND 448)
Operating Performance 1966/67-1975/76
Meter Gauge
1966-67 1967-68 1968-69 1969-70 1970-71 1971-72 1972-73 1973-74 1974-75 1975-761/
1. Percentage of serviceablelocomotives
Steam 86 86 88 87 87 87 86 86 85 84Diesel 87 89 90 89 87 88 90 88 87 88Electric 87 91 88 93 92 90 87 88 88 85
2. Percentage of serviceable
passenger cars 93 91 88 88 88 89 89 88 87 89
3. Percentage of serviceablefreight cars 96 96 96 96 95 96 96 95 95 96
4. Engine km/day/engine in usePassenger
Steam 223 225 227 229 228 227 217 214 239 221Diesel 267 416 485 446 383 390 454 561 540 533Electric 298 379 394 374 376 382 379 375 361 401
FreightSteam 137 135 137 137 133 132 130 118 132 120Diesel 276 282 281 283 280 272 273 259 242 286Electric 181 197 233 254 245 247 254 248 232 225
5. Net tons/freight train 346 348 358 362 378 391 403 408 421 432
6. Wagon km/freight wagon day 58 57 59 60 58 59 60 51 53 57
7. Punctuality of passengertrains (%) 84 87 86 86 87 91 90 84 86 93
8. Average wagon load (tons) 11.5 11.6 11.7 11.8 12.1 12.5 12.4 12.7 13.2 13.9
9. Average speed of all goodstrains (km/h)Steam 13 13 13 14 13 13 13 13 13 12Diesel 18 18 18 19 19 19 19 19 19 19Electric 17 18 20 19 19 19 19 21 23 20All traction 14 14 14 15 15 15 15 16 15 15
10. Average lead of a ton offreight (km) 379 395 411 415 422 447 469 462 478 n/a
11. Wagon turn-around (days) 9.0 9.5 9.7 9.4 10.1 10.6 10.8 12.5 12.0 11.5
1/ Some 1975/76 data are provisional.
Source: Appraisal Reports and IR.
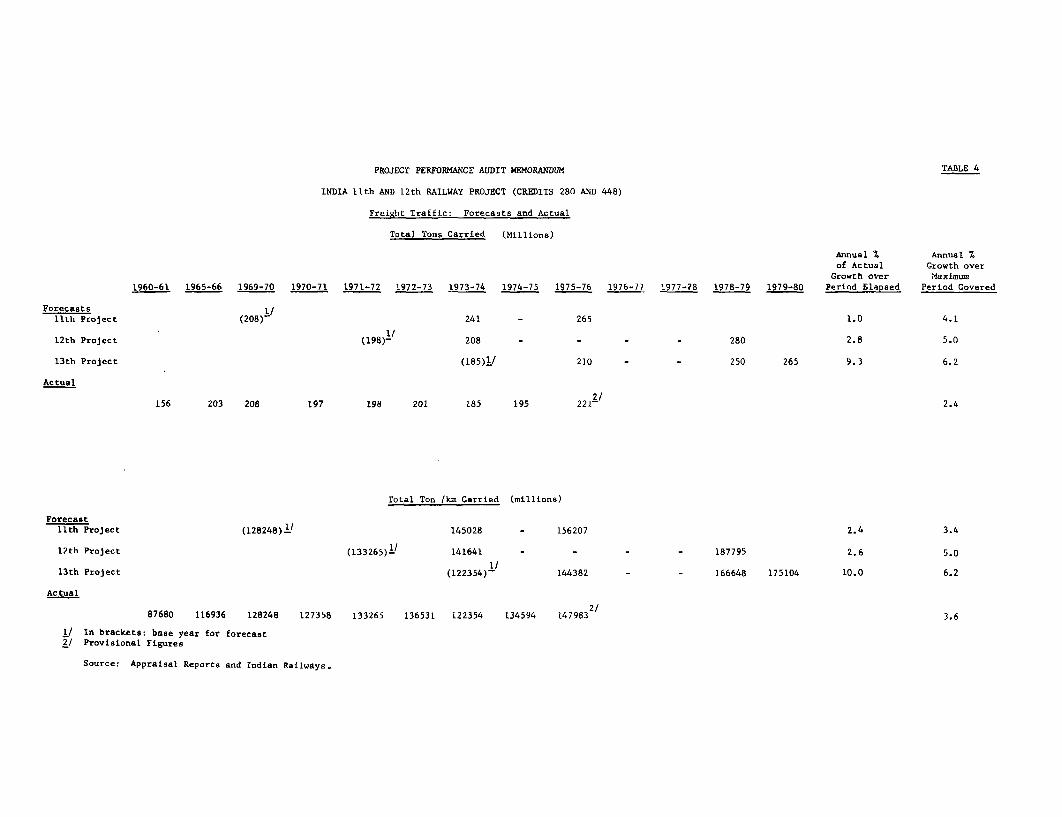
PROJECT PERFORMANCE AUDIT MEMORANDUM TABLE 4
INDIA Ith AND 12th RAILWAY PROJECT (CREDITS 280 AND 448)
Freight Traffic: Forecasts and Actual
Total Tons Carried (Millions)
Annual % Annual %of Actual Growth over
Growth over Maximum1960-61 1965-66 1969-70 1970-71 1971-72 1972-73 1973-74 1974-75 1975-76 1976-77 1977-78 1978-79 1979-80 Period Elapsed Period Covered
Forecasts 1/11th Project (208)- 241 - 265 1.0 4.1
12th Project (198) 208 - - - - 280 2.8 5.0
13th Project (185)1/ 210 - - 250 265 9.3 6.2
Actual
2/156 203 208 197 198 201 185 195 2212 2.4
Total Ton /km Carried (millions)
Forecast11th Project (128248)1L 145028 - 156207 2.4 3.4
12th Project (133265)1L 141641 - - - - 187795 2.6 5.0
13th Project (122354) 144382 - - 166648 175104 10.0 6.2
Actual
2/87680 116936 128248 127358 133265 136531 122354 134594 1479832 3.6
l/ In brackets: base year for forecast2/ Provisional Figures
Source: Appraisal Reports and Indian Railways.


ATTACHMENT A
INDIA
ELEVENTH RAILWAY PROJECT
COMPLETION REPORT I/
1. Summary of Bank Group Lending for Transport
1.01 A summary of Bank Group lending for Indian Railways (IR) is pro-vided in Table 1. This lending amounts to US$786.5 million equivalent pro-vided through twelve railway projects. A thirteenth project, to be con-sidered by the Board in August 1975, has been appraised and negotiated; itis to be supported by an IDA credit of US$110.0 million equivalent.
1.02 Table 2 provides a summary of Bank Group lending for transportprojects other than railways. There have been seven such lending operationsamounting to US$254.6 million equivalent. In addition, the Bank Group hasprovided indirect support to the road transport industry through ten indus-trial Imports Credits in the amount of US$342.9 million equivalent (para5.06).
1.03 Total Bank Group lending to the transport sector thus amounts toUS$1,384.0 million equivalent, including the US$342.9 million indirectsupport to the road transport industry.
2. Summary of Credit 280-IN and Eleventh Railway Project
2.01 Credit 280-IN
(1) Borrower: Government of India (GOI)(2) Beneficiary: Indian Railways (IR)(3) Amount and Terms of Credit: US$75.0 m. equivalent on usual
IDA terms(4) Date of Credit Agreement: January 24, 1972(5) Effective Date: March 29, 1972(6) Closing Date: September 30, 1974(7) Date Fully Disbursed:
-estimated: March 31, 1974-actual: October 22, 1974
(8) Amount Cancelled: None(9) Current Exchange Rate: US$1.00 - Rs. 8.00
(floating with Pound Sterlingin relation to US$)
(10) Exchange RateNovember 30, 1971 (Date of Appraisal Report);
US$1.00 = Ra. 7.50
I/ This report was completed in July 1975, and is based on data collectedby Bank Missions to India in December 1974 and April 1975, made inconnection with the Thirteenth Railway Project.

- A.2 -
2.02 Eleventh Project
(1) Description:
Eleventh Railway Project - Consisted of IR's investment programfor the three years from April 1, 1971 to March 31, 1974 (end ofIndia's Fourth Five-Year Plan). The Project was a continuationof the previous, IDA financed (Credit 162-IN) Tenth Railway Project.The main Project components were: manufacture and putting intoservice of 700 locomotives, 570 electric multiple units (EMU's),30 diesel railcars, 4,000 coaches and 31,600 freight wagons (interms of 4-wheelers). In addition, the project included trackrenewal, line capacity, electrification and other works andconstruction of new lines and expenditures for workshops, machinery,plants and investories.
(2) Project Cost (appraisal estimate):
US$ millionLocal Foreign Total
Locomotives and Rolling Stock 292.8 142.6 435.6
Track Renewals 172.0 5.0 177.0
Line Capacity Works 160.6 4.5 165.1
Other works, including signalling,electrification, new lines andmachinery 289.0 17.9 306.9
Total 914.0 170.0 1,084.4
US$ million
(3) Financing of Project:
(i) Funds generated by IR 522.0
(ii) Government contribution (including proceedsof IDA credits and bilateral loans) 562.0
Total required funds 1,084.0

- A.3 -
(4) Foreign Exchange Components
US$ million
(i) IDA (Credits 280-IN and 162-IN) 100.0
(ii) Bilateral Assistance 58.3
(iii) GOI foreign exchange reserves 11.7
Total foreign exchange 170.0
(5) Procurement Arrangements: Through ICB except for US$17.0(for components financed million for certain componentsthrough IDA credit only) procured for local manufacture
under license or required to bepurchased from the originalsuppliers in the interest ofstandardization.
(6) Estimated Disbursement US$ million1971/72 1972/73 1973/74
11.0 39.0 25.0
(7) Economic Rate of Return: Ranging from 6% to 20% dependingon subproject.
(8) Appraisal Report: Report No. PTR-96a, Transportation
Projects Department, November 30, 1971.
Note: A comparison between the estimated andactual project cost with foreign ex-change expenditure is shown on theattached form 590 (Annex 1) and in
Table 5 of the present report.
3. Major Findings
3.01 The major findings resulting from project completion review are:
(i) IR's freight traffic, in terms of tons carried, fell considerablyshort of the original forecast during the project period, mainlybecause of the lower than expected growth within the heavy indus-trial sector, which generates the major part of IR's freighttraffic (para. 6.02). However, there was an increase in theaverage freight transport distance (para 9.06) and a higher thanexpected growth in IR's passenger traffic (para 6.02). These twofactors almost compensated, in terms of traffic units, for theshortfall in the tonnage carried (para 7.03);

- A.4 -
(ii) IR's investments during the project period (1971/72-1973/74)corresponded relatively well to estimated needs; in fact, theinvestment program was in physical terms reduced slightly morethan the shortfall in railway traffic (para 7.03);
(iii) operating performance was generally satisfactory over theproject period (para 9.03), although there was a deteriorationin availability of locmotives as well as turnround of freightwagons; corrective measures were subsequently taken (para 9.04to 9.06);
(iv) the Borrower has generally met the various covenants in thepast Credit Agreements (para 11.01); however,
(v) the earnings covenant was not met in 1973/74 because ofexceptional cost increases and interruptions to traffic(the requirement was subsequently waived, para 11.03);in the first two project years the covenant was satis-factorily complied with;
(vi) the results of the economic evaluation undertaken duringthe Eleventh Project appraisal appear generally to becorrect; if anything, the economic rates of return mayhave been higher than those estimated at the time ofappraisal, because recent cost developments have inrelative terms tended to increase the advantage of railtransport over road (para 12.05); and
(vii) as a whole, the Eleventh Railway Project met its objectives(para 12.06).
4. Recommendations or Action Taken
4.01 There are no recommendations to be made regarding the generalapproach used in preparation, appraisal and implementation of the EleventhRailway Project, which would have implications for subsequent appraisals.The review indicates, however, that more efforts could have been devotedto the assessment of future traffic development, to a more detailed ex-amination of various subprojects included in IR's investment program, tothe likely development of investment and operating costs and to an assess-ment of the revisions required in the structure and level of rates and faresin the light of cost trends. All these factors affected the financialposition of the railways and caused changes in the project in real terms.Attempts have already been made during the appraisals of the Twelfth andThirteenth Projects to achieve improvements in these areas and therefore,no further action is recommended other than to continue these efforts inthe future.

- A.5 -
4.02 Assoclatad with railway project issues, those relating to thewhole transport ,ector have been of major importance during the past tenyears. It Is recommended that efforts should continue to improve overallsector management and planning; however, these efforts should not be madeat the cost of solving project related issues, which may to some extenthave been the case in the past. Similarly, it appears to be of lesservalue to try to reach formalized agreements regarding overall issues;attempts should rather be made to reach agreements on performance targetsfor individual projects.
4.03 In respect of future completion reviews of IR projects, it isrecommended that a full review of Bank Group lending operations should beundertaken in 1979/80, after the current IR 1974/75-1978/79 investmentprogram has been completed, while for individual projects, 1/ short sum-mary completion reports should be prepared on the basis of subsequentsupervision and appraisal reports.
5. Bank Group Lending to Transport Sector
5.01 Bank Group lending to India started with the First Railway Loan(17-IN) made in August 1949 in the amount of US$34.0 million equivalent.Since then, the Bank Group has contributed to the financing of 19 transportprojects. 2/, 3/ The total of these loans/credits is US$1,041.1 millionequivalent, which represents 21.0% of the total Bank Group lending to Indiaof US$4,953.3 million equivalent (as of May 31, 1975). This share has de-creased since Credit 280-IN for the Eleventh Railway Project was made inJanuary 1972; at that time, the Bank Group had provided financing for 16transport projects to the total amount of US$803.1 million equivalent,amounting to 28.9% of Bank Group lending to India (US$2,784.0 millionequivalent as of December 31, 1971). All these lending operations havebeen satisfactorily completed. Details on Bank Group lending are providedin Table 1 for railways and in Table 2 for other transport projects.
5.02 As shown in these two tables, most of the Bank Group direct lendingto the transport sector consists of loans/credits to the Indian Railways (IR).These loans/credits amount to US$786.5 million equivalent made through 12lending operations, representing 75.9% of the total lending for transportprojects and 15.9% of total Bank Group lending to India. In January 1972,at the time Credit 280-IN was made for the Eleventh Railway Project, thecorresponding percentages were 79.1% and 22.7%.
5.03 The main reason for IR's large share of total lending has beenits central position within the economy, not only as transport carrier, butas by far the largest enterprise in India, closely involved in the develop-ment of major industries in the country. There have, however, been other
1/ Twelfth, Thirteenth and a possible Fourteenth Railway Project.2/ Excluding the proposed US$110 million equivalent IDA credit for the
Thirteenth Railway Project to be considered by the Board in August 1975.3/ There has, however, been substantial indirect lending to the transport
sector through Industrial Imports credits, as indicated in para. 5.06.In addition, the Bank Group has supported the transport sector throughagricultural projects, some of which have included a substantial com-ponent for rural roads.

- A.6 -
reasons, such as difficulties experienced in preparation of projects in theother modes of transport or in reaching agreements between GOI and the BankGroup on the project implementation and procurement procedures to be followed.
5.04 The most active period of Bank Group lending for the transportsector was between 1957 and 1962 with a total of 11 lending operations inthe amount of US$516.6 million equivalent, which at 1975 prices would pro-bably correspond to at least US$1.0 billion. During this period, fourlending operations were undertaken for ports, one for highways and onefor aviation, in addition to the five lending operations for railways.This was a period when the Second Five-Year Development Plan 1955/56-1959/60was successfully completed, with a considerable increase in traffic demandand with good prospects for a continuation in these trends. However, duringthe Third Five-Year Development Plan period 1960/61-1964/65 economic growthwas slower than expected and there were difficulties in implementation ofBank Group financed highway and port projects.
5.05 During the years following the early 1960's, direct Bank Grouplending for the transport sector has been limited to the railways, exceptfor Credit (328-IN) made in 1972 for the first shipping project. Althoughthere has been talk about a Second Highway Project over the past 5-6 years,the project has not yet reached identification stage. There are someprospects for a Coal Transport Project which has been under preparation forsome time and which may be ready for a Bank Group appraisal within the nextyear.
5.06 The Bank Group has provided indirect support for highway transportsince 1964 through the Industrial Import Program Credits, which have helpedto import parts, components and materials required for indigenous productionby a number of industries. Among these, commercial vehicle and ancillaryequipment and parts manufacturing have been two of the more importantindustries supported through the Industrial Imports Credits. Out of thetotal of US$930 million equivalent made under the first nine fully disbursedCredits from 1964 to 1974, an amount of US$302.9 million equivalent, or32.6%, was allocated to meet import requirements of these two industries 1/.In addition, US$40.0 million equivalent was allocated for the same two in-dustries out of the US$200 million equivalent Tenth Industrial ImportsCredit (528-IN) made in February 1975 2/. Therefore, including this in-direct lending of US$342.9 million equivalent, the total Bank Group supportfor the transport sector amounts to US$1,384.0 million equivalent, represent-ing 27.9% of total Bank Group lending to India (as of May 31, 1975). The in-direct lending can be supported on sector grounds, because shortale of com-mercial vehicles appears to have been an even greater constraint on economicgrowth than deficient highway infrastructure.
1/ Project Performance Audit Report, India, Seventh and Eighth IndustrialImports Projects, Operations Evaluation Department, June 9, 1975.
2/ President's Report No. P-1558-N, Tenth Industrial Imports Program Credit,January 16, 1975.

- A.7 -
5.07 Including the above mentioned indirect support of road transportindustry, the Bank Group lending to the two main modes, rail and road trans-port, has been about equal during the past ten-year period 1964-1974; thelending to railways amounted to US$340.0 million equivalent, while lendingfor road transport amounted to US$342.9 million equivalent.
6. The Economy and the Transport Sector
A. The Economy and Traffic Development
6.01 Credit 280-IN for the Eleventh Railway Project was made inJanuary 1972, about half-way through the Fourth Five-Year Development Plan(1969/70-1973/74). Although some difficulties had been experienced inachieving the Plan targets during the two first years 1969/70 and 1970/71,there were, at the time of the appraisal, prospects for continued economicgrowth: "according to the Bank's latest (1971) economic report on India,there is little question that India's economy should grow substantially inthe remaining years of the Plan and that the transport sector can thereforeanticipate a significant increase in demand for its services." 1/
6.02 However, adverse developments took place in 1971 and in the nextyear's (1972) economic report it was stated that: "it became obvious as1971 wore on that the refugee problem, the war and the uncertain future offoreign aid made a definitive forecast of the last three years of the Planvery difficult." 2/ The Government undertook a Mid-Term Appraisal of thePlan, which resulted in a series of downward adjustments to the 1973/74physical production targets, particularly for the heavy industrial sectorgenerating the major part of the railways' freight traffic. For instance,the target for ingot steel production in 1973/74 was reduced by 2.6 milliontons to 8.2 million tons, which for railways implied a reduction in trafficof about 10 million tons, including the related raw materials.
6.03 As a result of difficulties experienced during the Fourth Planperiod, only 185 million tons of freight was carried by IR at the end ofthe period in 1973/74, compared with 240.5 million tons forecast in theappraisal report 3/ and 260 million tons forecast at the time of preparationof the Plan. However, in terms of ton-km, the shortfall was substantiallyless, because the average load increased from 556 km in 1965/66 to 649 kmin 1973/74 (para 9.06). A comparison with the appraisal forecast and actualfreight traffic is shown in Table 3. On the other hand, IR's passengertraffic did meet the forecast (Table 4), partly because the forecast wasin the first place conservative and partly because passenger traffic isdependent on population growth and was thus less affected by difficultiesexperienced within industries generating most of the railway's bulk freight.
1/ Appraisal of An Eleventh Railway Project, India, Report Nol PTR-96a,November 30, 1971, para. 2.01.
2/ Economic Situation and Prospects of India, Report No. SA-32a, May 10,1972, para. 1.26.
3/ The difference in revenue earning traffic was however smaller, 172.0versus 207.5 million tons, because there was a substantial reduction inIR's non-revenue earning departmental traffic from 33.0 to 22.8 milliontons.

- A.8 -
B. The Transport Sector
6.04 At the time of appraisal of the Eleventh Railway Project, railwaysaccounted for about 66% of freight and about 50% of passenger traffic,while road transport accounted for about 28% and 48% respectively. Of theother modes, coastal shipping and pipelines accounted then about 3% eachof total freight traffic, while air transport accounted for about 1-2% oftotal passenger transport. No great changes have taken place during thepast 4 years, although road transport may have slightly increased its share
to about 40% of freight and 55% of passenger traffic. Overall, both freightand passenger traffic have increased by about 4-5% a year, railway trafficincreasing slightly less and road traffic slightly above this trend. Theother modes are still insignificant in the overall context, but perform anincreasingly important function within their respective, specialized areas.
6.05 The development in recent years which may have the most signif-icant effect on the transport sector was the substantial increase in priceof crude oil, which may continue its upward trend in future. There is notyet any empirical evidence on the effect on traffic distribution betweenthe various modes, but it is bound to reduce the competitive position ofhighway transport, because fuel represents a substantially higher share ofthe total costs for this mode than for railways, shipping and pipelines.Furthermore, India's foreign exchange position may impose additionallimitations on the expansion of road transport, the import content of whosefuel is much higher than that of the railways, which to a large extent usesdomestic energy resources (steam and electric traction). It is safe toassume, on the basis of the above considerations, that any major shift inthe relative importance of the two main modes is unlikely; the railwayswill continue to carry about 60% of the total freight and close to 50% ofpassenger traffic. It will continue to remain the single most importantmode of transport in India.
C. Transport Policy and Planning
6.06 In the course of railway lending, there has been a continuousdialogue between the Government and the Bank Group since the early 1960'son various issues relating to transport policy and planning for the sectoras a whole as well as concerning the individual modes. During this dialogue,the Bank Group has primarily been concerned about an apparent lack of a welldefined Government policy regarding the planning and management of the trans-port sector and about various constraints which may have reduced competitionbetween the various modes. Some particular concern was in the past also ex-pressed about road transport, which appeared to receive too little attentionby the Government.
6.07 Issues relating to the transport sector were therefore discussed
during the negotiations for the Eleventh Railway Project. It was agreedthat the Government would undertake a review of the transport sector, with

- A.9 -
emphasis on the need for better coordination and effective institutions to
achieve policy objectives. It was also agreed that the Association wouldcontribute to this review by means of a sector mission. The objective of thereview was to lead to an understanding between the Government and the Asso-ciation on the basic policies to be followed as a framework for future BankGroup activity in the transport sector.
6.08 The agreements reached during the negotiations for the Eleventh
Railway project have substantially been met. The Government completed itsreview by the end of 1973 and Bank Group transport review missions visitedIndia on two occasions (in March 1972 and April 1974). The review work has
resulted in a number of important findings.
6.09 The transport sector review provided the Bank Group with a useful
opportunity to re-examine the extent to which the issues raised by it inthe past were relevant in its continued participation in India's transport
sector. Most of the issues were related to the transport sector as a whole,reflecting the Association's concern to support institution building or to
correct or remove pricing distortions or other constraints impeding anoptimum economic distribution of traffic among the various modes. Thetransport sector review concluded that although it was worthwhile to con-tinue the dialogue with the Government on these overall issues, it wouldbe even more important to concentrate on project related issues. The ex-perience gained through past Bank Group lending operations and the perform-ance of the various sectors of the economy in general indicates that mostof the failures in completing projects can be attributed to deficiencies in
project preparation and implementation and to the operational practices ofthe various transport entities. The transport sector review undertaken bythe Bank Group concluded therefore that the Bank's primary emphasis shouldbe put on the preparation and implementation of projects which involved ormight involve Bank Group financing. It also concluded that increasedattention should be given to operational and engineering practices, whichin most cases determine the economic and financial outcome of the projectand/or the entity as a whole.
6.10 It is difficult to confirm to what extent the Bank Group hasachieved institutional improvements because of the non-quantifiable natureof the issues concerned. However, within the railways, economic projectevaluation techniques were introduced and an Economic Unit was establishedin the Railway Board at the initiative of the Bank; similarly long term
corporate planning was started on the Bank initiative. On the financialside, the covenants incorporated by the Bank in the credit agreements haveresulted in increased financial discipline not only by the railways, but alsoby the Government. Not only have the rates and fares been increased, buttraffic costing studies have been introduced and the tariff structure has
gradually been changed to increasingly reflect actual costs of various trafficcategories. Much of this was undertaken as a result of suggestions made bythe Bank. The effects have been smaller within other modes, where direct

- A.10 -
Bank Group involvement has been less 1/. However, even there the Bank Grouphas had some influence. Improved accounting procedures were introduced formajor ports and project preparation procedures within the federal highwayadministration have been improved. For the sector as a whole, the impact iseven more difficult to measure, but it is likely that the continuous attentionpaid by the Bank Group to overall sector issues has contributed to a closerscrutiny of investment needs at the time of preparation of annual and five-year plans. The 1974/75 and 1975/76 budgets give a clear indication of this.
7. IR's Investment Program
7.01 The Eleventh Railway Project consisted of investments undertakenduring the last three years 1971/72-1973/74 of IR's Fourth Five-Year Plan1969/70-1973/74. It formed a direct continuation to the Tenth RailwayProject which covered the first two years of the Plan.
7.02 Table 5 shows the original planned expenditures in the FourthPlan Rs 12,300 million, and the appraisal estimate of expenditures in theproject period, Rs 8,095 million, in both cases by main categories of expen-diture and with details of actual expenditures. The increases in totalPlan and Project expenditure, to Rs 13.423 million and Rs 8,998 millionrespectively, became necessary after a mid-term review which allowed forprice increases which had already taken place. The largest increases inexpenditures as compared with original estimates were for locomotives,rolling stock, line capacity works, signalling and safety works; all theseincreases were attributable to increased prices of materials, components andlabor and in 1973/74 to some accelerated spending in preparation for FifthPlan works.
7.03 The extent to which the actual level of investment has duringthe project period been in real terms in accordance with appraisal estimatesmay be measured by comparing actual and estimated traffic development andphysical investment with each other. The Table in para. 9.03 indicates thaton average, about 90% of the planned investment in physical terms was under-taken during the project period. This is to be compared with the actualtraffic development, which for the first two project years 1971/72 and 1972/73,marginally exceeded (Tables 3 and 4) the appraisal forecast in terms oftraffic units (pas-km + ton-km). However, in the last project year 1973/74,the actual traffic was 6.7% less than forecasted as a result of deterioratingindustrial relations within the railways and a general economic slow-down.Over the whole project period, freight traffic fell short of expectations,but this, particularly in the first two years, was compensated by a higherthan expected passenger traffic volume. For the project period as a whole,the railways traffic volume was 786 billion traffic units, compared with802 billion traffic units forecast.
1/ The Bank Group support of road transport industry, although substantial(para. 5.07), has been part of program lending (Industrial Imports Credits)and thus indirect; this has limited possibilities to achieve institutionalimprovements within the road transport sector.

- A.11 -
7.04 It may be concluded on the basis of the above, that in real terms,the investments during the project period were less than what was estimatedto be required during appraisal. It is also to be noted that the year1973/74 was disastrous for the railways because of continuous slow-downs andother difficulties with railway labor. Railway freight traffic was reducedto a much lower level than could have reasonably been anticipated. Althoughthere was a nationwide railway strike during the following year, railwaytraffic in 1974/75 exceeded that of 1973/74.
8. Project Execution and Disbursements
8.01 The execution of the Project, IR's investment program for thethree years 1971/72-1973/74 1/ was affected by a number of adverse develop-ments. The Indo-Pakistan hostilities in December 1971 and their aftermathdiverted IR activities from its normal course; in 1972/73 and 1973/74,electric power cuts seriously affected work in the manufacturing units; in1973/74, in addition to general labor unrest, the strike of locomotiverunning staff immobilized about a fourth of the railways' wagon fleet inAugust and December 1973.
8.02 Table 5 gives capital expenditures in the Project period, originaland revised. Briefly, the original cost, estimated at Rs 8,095 million,with a foreign exchange content of US$170 million, was revised to Ra 8,998million, with a foreign exchange content of US$168.3 million, indicating an11% increase in Rupee terms. This was mainly caused by price increasesduring the project period (para 7.02).
8.03 Because of the continuing nature of IR's production program oflocomotives and rolling stock and of track renewals and other works, it isdifficult to determine exactly the actual physical output during the Projectperiod 1971/72-1973/74 and compare it with estimates made at the time ofappraisal. In fact, part of the investment undertaken during the Projectperiod is for completion of works in progress; part of the investment isfor starting new works. However, IR made an attempt to compare major targetswith estimated achievements during the Project period in accordance with theProject description (Annex 11, Appraisal Report, PTR-96a). Table 6 showsthe results of this comparison, and a summary follows:
1/ Financial year starting April 1 and ending March 31.

- A.12 -
PercentageTargets Achievements Ratio
(A) (B) (B)+(A) x 100
LocomotivesSteam 18 19 106Diesel 470 385 82Electric 211 125 59Total Locomotives 699 529 76
Electric Multiple Units 568 259 46Coaches 3,950 3,545 90Wagons (four-wheeler equivalent) 31,649 31,112 98Rail Renewals (km) 4,400 4,070 93Line Doubling (km) 750 1,027 137Electrification (km) 720 500 69New Lines (km) 700 574 82
Except for steam locomotive production and line doubling, the achievementswere less than anticipated at the time of appraisal. This is partly aresult of the various events which affected IR's activities (para 8.01).The outturn of electric locomotives suffered a temporary set-back becauseof design deficiencies in traction motors (para 9.05). Another factor is,of course, substantial cost increases in labor and materials which causedIR to curtail its output targets.
8.04 Identifying unit cost increases during the Project period by itemis extremely difficult. However, IR provided some indicative informationfor locomotives and rolling stock, which is presented in Table 7.
8.05 Table 8 compares estimated and actual schedules of disbursementsat the end of each quarter during the Project period. The reason for rela-tively fast disbursements at an early stage of the Project was that theamount of retroactive financing was increased from US$5.5 million, as stipu-lated in Schedule 1 of the Credit Agreement, to US$9.0 million, on thegrounds that the presentation of the Project was held up because of the Indo-Pakistan hostilities. Except for this, disbursements were made generallyin line with the appraisal estimate. Category-wise disbursements were largelyin line with the original allocation, although components and materials forlocomotives and rolling stock absorbed about 10% more than the originalestimate; reduction in the allocation for plant and machinery was attributableto the procurement of some heavy machinery under trade agreements with East-European countries. Table 5 shows the category-wise comparison between ori-ginal and revised allocations.
9. Operating Results and Physical Performance
9.01 As of March 31, 1974, IR operated 60,234 route-km. In the lasttwo decades, IR has placed emphasis on line-doubling in order to increase

- A.13 -
its line capacity; 7,177 route-km have been doubled over the period; thelength of double track reached 20% of total route-km in 1973/74, as comparedwith 10% in 1950/51.
9.02 Introduction of diesel locomotives in 1957 and a further extensionof electrification since 1960 have replaced steam traction, reducing theproportion of traffic hauled by steam locomotives; in 1973/74, 65% offreight train-km and 31% of passenger train-km were diesel or electricallyhauled. The following table shows the percentage proportion of train-km bytype of traction in 1950/51 and 1973/74:
Percentage Proportion of Train-km1950/51 1973/74
FreightSteam 99 35Diesel -) 48)
) 65Electric 17)
Total Freight 100 100Passenger
Steam 93 69Diesel -) 13)
) 7 ) 31Electric 7) 18)Total Passenger 100 100
Around 1971, IR decided to discontinue the manufacture of steam locomotives.Production of BG steam locomotives ceased in July 1970; that of MG steamlocomotives, in January 1972. 1/
9.03 Table 9 summarizes operating statistics for the nine year period1965/66-1973/74. Operating performance during the Project period 1971/72-1973/74 was generally satisfactory as compared with the preceding years,except for: (a) availability of locomotives, and (b) wagon turnround.
9.04 Availability of diesel locomotives on GB lines deteriorated from90% in 1965/66 to an 85% level during the Project period 2/. One of the
1/ After the oil crisis, IR reexamined its future traction policy and con-cluded that there was no justification to resume the manufacturer ofsteam locomotives.
2/ After the oil crisis, the sulphure content in diesel fuel oil increased,nearing the 1.2% ceiling stipulated in IR specifications. Because ofthe faster deterioration of engine parts, IR has continued to urge theBombay refineries to reduce the sulphur content and is reported to havehad some success.
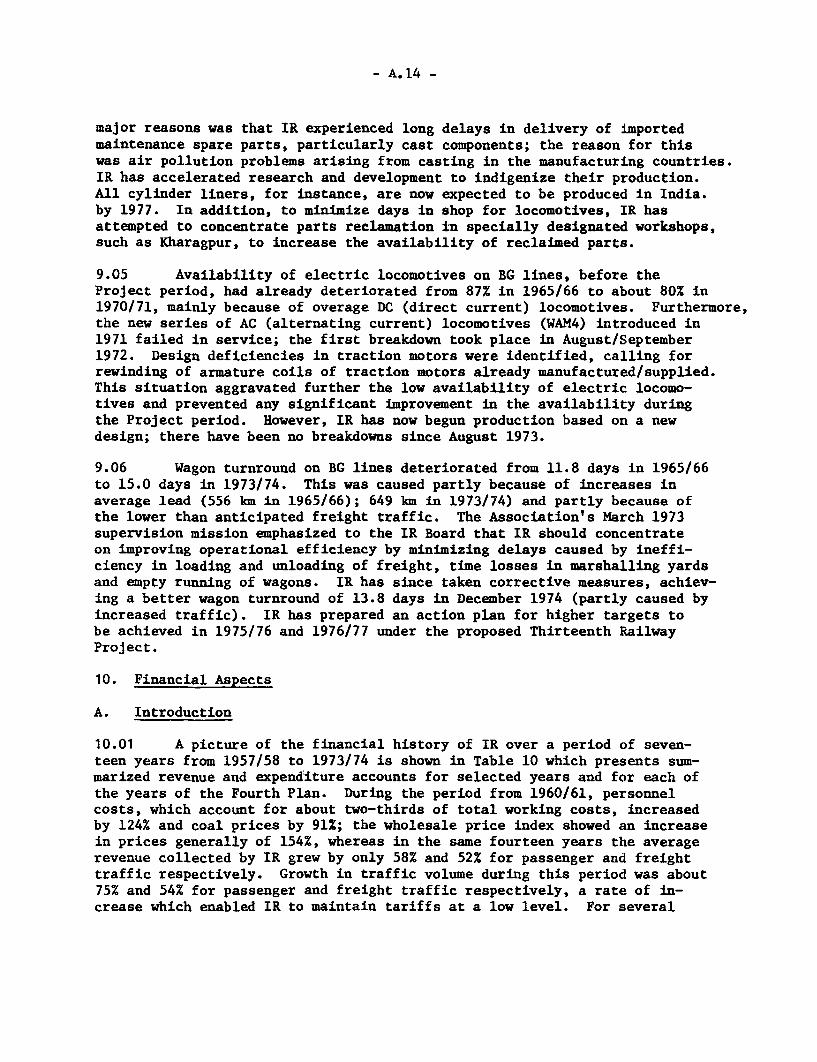
- A.14 -
major reasons was that IR experienced long delays in delivery of importedmaintenance spare parts, particularly cast components; the reason for thiswas air pollution problems arising from casting in the manufacturing countries.IR has accelerated research and development to indigenize their production.All cylinder liners, for instance, are now expected to be produced in India.by 1977. In addition, to minimize days in shop for locomotives, IR hasattempted to concentrate parts reclamation in specially designated workshops,such as Kharagpur, to increase the availability of reclaimed parts.
9.05 Availability of electric locomotives on BG lines, before theProject period, had already deteriorated from 87% in 1965/66 to about 80% in1970/71, mainly because of overage DC (direct current) locomotives. Furthermore,the new series of AC (alternating current) locomotives (WAM4) introduced in1971 failed in service; the first breakdown took place in August/September1972. Design deficiencies in traction motors were identified, calling forrewinding of armature coils of traction motors already manufactured/supplied.This situation aggravated further the low availability of electric locomo-tives and prevented any significant improvement in the availability duringthe Project period. However, IR has now begun production based on a newdesign; there have been no breakdowns since August 1973.
9.06 Wagon turnround on BG lines deteriorated from 11.8 days in 1965/66to 15.0 days in 1973/74. This was caused partly because of increases inaverage lead (556 km in 1965/66); 649 km in 1973/74) and partly because ofthe lower than anticipated freight traffic. The Association's March 1973supervision mission emphasized to the IR Board that IR should concentrateon improving operational efficiency by minimizing delays caused by ineffi-ciency in loading and unloading of freight, time losses in marshalling yardsand empty running of wagons. IR has since taken corrective measures, achiev-ing a better wagon turnround of 13.8 days in December 1974 (partly caused byincreased traffic). IR has prepared an action plan for higher targets tobe achieved in 1975/76 and 1976/77 under the proposed Thirteenth RailwayProject.
10. Financial Aspects
A. Introduction
10.01 A picture of the financial history of IR over a period of seven-teen years from 1957/58 to 1973/74 is shown in Table 10 which presents sum-marized revenue and expenditure accounts for selected years and for each ofthe years of the Fourth Plan. During the period from 1960/61, personnelcosts, which account for about two-thirds of total working costs, increasedby 124% and coal prices by 91%; the wholesale price index showed an increasein prices generally of 154%, whereas in the same fourteen years the averagerevenue collected by IR grew by only 58% and 52% for passenger and freighttraffic respectively. Growth in traffic volume during this period was about75% and 54% for passenger and freight traffic respectively, a rate of in-crease which enabled IR to maintain tariffs at a low level. For several

- A.15 -
years, IR and GOI had exercised a degree of restraint in tariff policy 1/which, because of rapidly rising costs has resulted in IR's earnings beinginsufficient to meet the dividend payable on Government capital.
10.02 Over the years from 1957/58, the operating ratio was maintained ata level of around 80, until 1973/74, when it rose to 93.7 because of excep-tional increases in personnel and fuel costs which were estimated to put anadditional annual burden on IR of over Rs 1 billion, or about 15% of totalworking expenses. The results for 1973/74 were also affected by inter-ruptions to traffic through many labor disputes. Return on capital-at-charge had been very steady at around four or five percent up to 1972 butdropped to 1.4% in 1973/74 because of the exceptional cost increases.
10.03 During the years 1957/58 to 1973/74, the period in which theBank Group has been associated on a continuing basis with IR's development,total capital expenditures amounted to Rs 47.3 billion, of which Rs 27.9billion was for additions financed by the Government and the balance repre-senting 41% of the total was financed from IR's own cash generation 2/.Details of annual expenditures are shown in Table 11.
B. Financial Results
10.04 Financial results during the years covered by the Project disburse-ments are shown in Table 12 together with the appraisal report estimates forthe same years. The two sets of figures are not strictly comparable, sincethe appraisal estimates were made on the basis of constant prices. The mostsignificant feature of the figures is the very substantial increase in per-sonnel costs which have developed as follows:
1972/73 1973/74 1974/75
Cost of Personnel) Rs million A 5,231 6,526 8,105Total Working Expenses .. B 8,566 9,773 11,496Percentage of A to B % 61.1 66.8 70.5Increase in personnel
costs over previous year % 24.7 24.2
It will be seen that personnel costs in 1974/75 were 70% of total workingexpenses compared with 61% in 1972/73. The exceptionally large increasesin personnel costs resulted from a recommendation of the Pay Commission inlate 1973 and from a succession of increases in dearness allowances which
1/ In 1975 however, substantial tariff increases were introduced.
2/ Part of this expenditure was met from Government loans, of which Rs 226million was outstanding at March 31, 1974.

- A.16 -
are granted in line with the increase in the official cost of living index.Since most of these increases were declared with retroactive effect, it wasnot possible to effect full recoveries from tariff increases. Furthermore,in 1973/74, mainly as a result of labor unrest in the country generally andmajor strike activity on the railways, the level of traffic carried by IRwas much lower than anticipated at the time of appraisal. The drop intraffic and the increased personnel costs meant that net revenue was notsufficient to meet the dividend for 1973/74 as required by the earningscovenant and, because of the exceptional circumstances, the requirement ofthe covenant was waived for that year.
10.05 At the time of negotiating the Twelfth Credit (448-IN), it wasrealized that because of the rapid rise in personnel cost, IR would need somelittle time to introduce the necessary tariff increases and it was thereforeagreed that net revenue should be sufficient in 1974/75 and 1975/76 to meet70% and approximately 85% respectively of the total dividend payment for thoseyears. From Table 12 it will be seen that the estimated "adjusted" net reve-nue from operations for 1974/75 was Rs 1,031 million and after allowing forcharges of a capital nature, net revenue from operations amounted to Rs 1,206million, equivalent to 63.7% of the dividend payment. However, accounts for1974/75 are not yet finalized and latest estimates indicate that "adjusted"net revenue from operations may be Rs 1,305 million which is almost equal tothe 70% required by the covenant.
10.06 In April 1974, and again in August 1974, IR introduced substantialtariff increases designed to recover increased costs. These two tariffincreases were together estimated to bring in additional revenue, of Rs2,764 million annually and it is likely that the hard decisions leading tothese increases were influenced by the Associations' earnings covenant. Forsome years previously IR had been very slow to adjust tariffs followingregular cost increases, but there now seems to be a distinct change of policyrequiring more prompt action to be taken.
10.07 The manner in which IR's gross revenues are absorbed by fuel, otherworking costs, depreciation and the balance left to meet the dividend paymentsdue to the Government is shown in Table 10. Throughout the period 1957/58to 1972/73, fuel abosrbed about 12 to 15% of total revenue, other workingexpenses about 60%, depreciation about 10% and the balance available fordividends varied between 14 and 19% of gross revenue. In 1973/74, the situa-tion changed quite materially; other working expenses (mostly personnelcosts) absorbed over 70% of gross revenue while the amount available tomeet the dividend payments fell to 5%. These material changes in financialresults from operations led to the large tariff increases in 1974 whichare expected to provide a basis on which IR may achieve a reasonable levelof net revenue in future years. From Table 10 it will be seen that theservices provided by IR in 1973/74 were carried out at a charge to thepublic of Paise 2.71 per pass-km and Paise 5.89 per ton-km. Since US Cent1.00 = Paise 8.00, it is clear that in over-all terms the railway servicesare provided at a very low cost.

- A.17 -
11. Borrower's Observance of Commitments and Undertakings
11.01 Prior to the 9th Credit, the covenants in agreements were of ageneral nature concerning prudent management; even in the 9th Credit, therewas only a side letter agreeing to set up an Economic Unit with a definitionof its work program. In the 10th and 11th projects, covenant requirementsbecame more specific; a summary of them is included in Annex 2 with detailsof the degree to which they were fulfilled. The covenants have been fairlywell observed.
11.02 The tenth Credit introduced an earnings covenant for the firsttime; its terms were slightly changed in the Eleventh Credit (280-IN) whichrequired:
(i) Earnings from 1971/72 to be sufficient to pay the dividendon capital-at-charge;
(ii) Preparation of a Corporate Plan; and
(iii) Methodology of investment appraisal to be improved.
In addition, in a letter from the Ministry of Finance, GOI undertook to re-view past studies on transport investment planning and rationalization ofpricing and regulatory policies.
11.03 The earnings covenant was compiled with in 1971/72 and 1972/73 but,because of exceptional cost increases and interruptions to traffic throughlabor disputes, the covenant was waived for 1973/74 at the time of negotia-tions for the Twelfth Credit 448-IN in November 1973, and for 1974/75 and1975/76, it was agreed that net revenue should be not less than 70% and 85%of the respective dividend payments for those years. It is expected thatfinal accounts for 1974/75 may show that net revenue from operations willbe about 69% of the 1/ dividend payment and for 1975/76, unless there areany major unforeseen events, it is expected that earnings should be suffi-cient to meet the agreed 85% of the dividend payment. The other commitments:investment appraisal methodology and the review of transport sector planningand policies have been reviewed in the appraisal report of the ThirteenthRailway Project. In general, progress has been satisfactory.
11.04 Review of the covenants contained in the various agreements indi-cates that there may be a case for restricting the content of future cove-nants to matters upon which we would feel justified in taking some action ifthe Covenants are not fulfilled. As an example, in Credit 280-IN, Section4 .04(a) provided that "Methodology for appraisal of investment projects for
1/ This is after adjusting for expenditure charged in 1974/75 which relatesto 1973/74.

- A.18 -
the Railways will continue to be progressively improved..." While it isclearly desirable for the Association to seek such improvements, it is ex-tremely doubtful whether a clause in an Agreement contributes to the likelyachievement of the objective.
12. Economic Evaluation
12.01 The complexity of IR's investment program was recognized in theeconomic evaluation of the Eleventh Railway Project. Each year's invest-ment program includes a very large number of individual items, of whichmore than 2,000 exceed Rs 500,000 in cost. These subprojects, which rangefrom modernization of workshops to construction of new lines, are eitherstarted or are at various stages of completion during each fiscal year.
12.02 In view of its complexity, IR's investment program for the projectperiod 1971/72-1973/74 was examined during the appraisal of the EleventhProject by reviewing the expected economic return of a limited number ofsubprojects included in the program. In addition, an overall evaluationwas made of the estimated economic rate of return of IR's investment programas compared with the second best alternative mode, road transport.
12.03 It was concluded that, except for an electrification subproject,the economic rates of return on the subprojects would be adequate, varyingfrom 11% up to 35%. The economic return on the electrification subprojectwas estimated at about 6%. The return on this subproject has, however, sub-stantially increased since the price increase of crude oil. The evaluationwas undertaken by comparing the alternatives of electric and diesel tractionand the economic cost (calculated net of taxes and shadow priced to reflectscarcity of foreign exchange) of high speed diesel oil (HSDO) was estimatedat US$30 equivalent per kilo-liter, whereas the cost in 1975 is around US$150equivalent.
12.04 In retrospect, it may not have been advisable to present the resultsof a few subprojects in the appraisal report, although such examination perse is to be supported. Results for a few subprojects tend to give the impres-sion that they are representative either for the whole or large parts of theinvestment programs. The investment value of the five subprojects analyzedduring the Eleventh Railway Project appraisal represented about 5% of thetotal cost of projects included in the investment program. References tothese in isolation, especially since they were not representative of thewhole investment, led, during Board presentation to an executive directorconcluding that IR's electrification schemes did not appear to be economicand questioning why such subprojects were included in the projects for IDAfinancing.

- A.19 -
12.05 The appraisal report concluded that the first-year return on IR'sinvestment program as a whole would under conservative assumptions be atleast 10%; it could be as high as 40% under the most optimistic assumptions.The likely first-year return was considered to be between 10% and 20%. Inretrospect, these assumptions appear to be correct. In terms of trafficunits, railway traffic fell by about 7% short of the appraisal estimate inthe last project year 1973/74 (para. 7.03), but this was more than offsetby a cost development which increased the economic advantage of bulk trans-port by rail over road transport. The recent appraisal of the ThirteenthRailway Project concluded that the economic rate of return of IR's 1974/75-1978/79 investment program could be about 20%, while the return on thesubprojects examined could vary between 10% and 25%.
12.06 It is to be concluded that as a whole, the Eleventh Railway Project(IR's investment program for the years 1971/72-1973/74) did fairly well inmeeting its objectives: to provide for investments in essential renewals,cost saving works and limited expansion of capacity to carry forecast traffic.Had the last project year 1973/74 not become such an exceptionally bad yearfor both the railways and the whole economy, the targets set during appraisalmight have been exceeded.


ANNEXPage 1
INDIA
ELEVENTH RAILWAY PROJECT (CREMT 280-IN)
COMPLETION REPORT
Summary of Principal Covenants Included in CreditAgreements H0-IN, 162-IN and 280-IN (9th, 10th and
11th Railway Projects)
Requirements Observations
Credit 80-IN
There were no specific covenants other The Unit was set up and is stillthan those of a "standard" nature. functioning - work program wasThere was a side letter agreeing to carried out.set up an Economic Unit and a definitionof its work program.
Credit 162-IN
Section 4.04 - Borrower to prepare a This requirement was supersededplan for phased retirement of steam in Credit 280-IN by covenant tolocomotives and related facilities. prepare a corporate plan.
Section 4.05 - Earnings covenant Actual operating ratios:required net revenue to be sufficient 1970/71 84.2 1972/73 84.5to meet dividend payment in full and 1971/72 83.1 1973/74 93.7a contribution toDevelopment Fund. A new covenant, applicable fromOperating ratio from 1970/71 to be 1971/72, required net revenuenot higher than 80. to be sufficient only to meet
the dividend payment - with nospecific operating ratio (seebelow).
Section 4.06 - Economic Unit to carry These were carried out.out various studies as listed inSchedule 4.
Section 4.07 - Borrower to make costing This has been done on a system-wisestudies of passenger service to determine and gauge-wise basis; costing cellswhich fares for individual services cover have since been established in eachthe cost of such services. Zonal Railway and in 1974 further
work was being done to identifyunprofitable services.
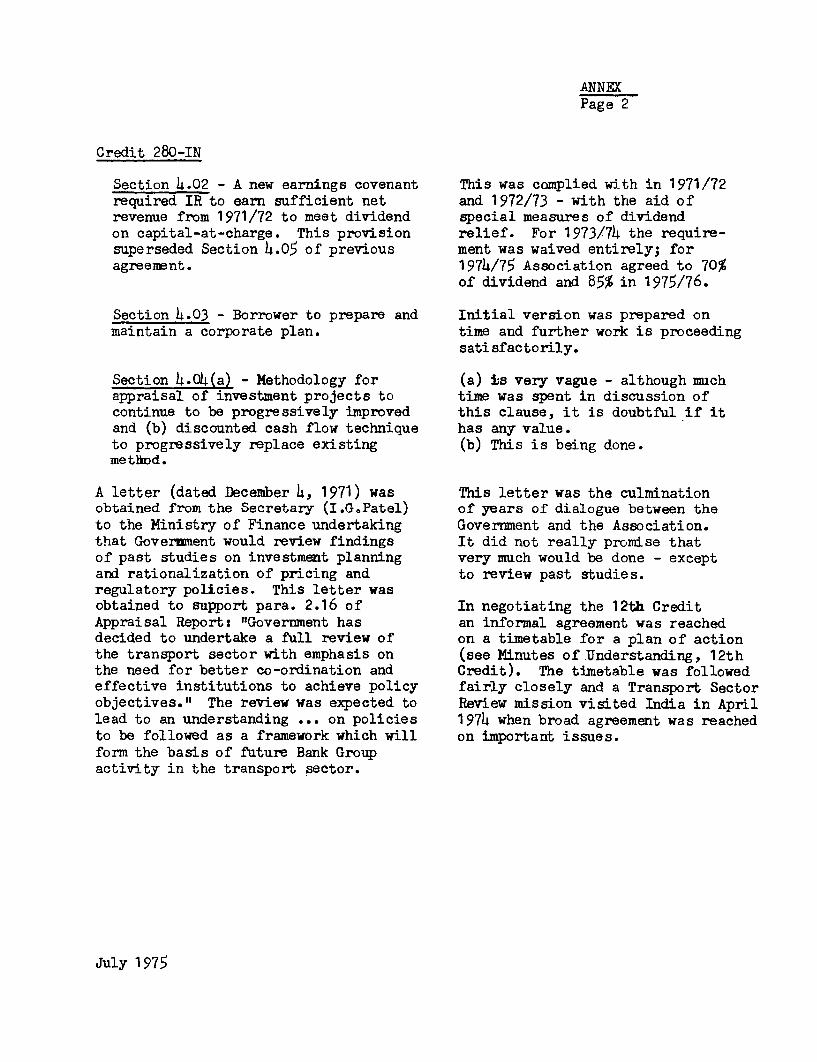
ANNEXPage 2
Credit 280-IN
Section 4.02 - A new earnings covenant This was complied with in 1971/72required IR to earn sufficient net and 1972/73 - with the aid ofrevenue from 1971/72 to meet dividend special measures of dividendon capital-at-charge. This provision relief. For 1973/74 the require-superseded Section 4.05 of previous ment was waived entirely; foragreement. 1974/75 Association agreed to 70%
of dividend and 85% in 1975/76.
Section 4.03 - Borrower to prepare and Initial version was prepared onmaintain a corporate plan. time and further work is proceeding
satisfactorily.
Section 4.04(a) - Methodology for (a) is very vague - although muchappraisal of investment projects to time was spent in discussion ofcontinue to be progressively improved this clause, it is doubtful if itand (b) discounted cash flow technique has any value.to progressively replace existing (b) This is being done.method.
A letter (dated December 4, 1971) was This letter was the culminationobtained from the Secretary (I.G.Patel) of years of dialogue between theto the Ministry of Finance undertaking Goverment and the Association.that Government would review findings It did not really promise thatof past studies on investment planning very much would be done - exceptand rationalization of pricing and to review past studies.regulatory policies. This letter wasobtained to support para. 2.16 of In negotiating the 12th CreditAppraisal Report: "Government has an informal agreement was reacheddecided to undertake a full review of on a timetable for a plan of actionthe transport sector with emphasis on (see Minutes ofUnderstanding, 12ththe need for better co-ordination and Credit). The timetable was followedeffective institutions to achieve policy fairly closely and a Transport Sectorobjectives." The review was expected to Review mission visited India in Aprillead to an understanding ... on policies 1974 when broad agreement was reachedto be followed as a framework which will on important issues.form the basis of future Bank Groupactivity in the transport sector.
July 1975

TABLE 1
INDIA
ELEVENTH RAILWAY PROJECT (CREDIT 280-IN)
CCMPLETION REPORT
Statement of Bank Group Loans and Credits for Indian Railways
Loans No. Date Amount in US$ millions
1st 17 August 18, 1949 34.0
( 167 July 12, 1957 24.0 )2nd ( 168 July 12, 1957 19.1 ) 90.0( 169 July 12, 1957 11.2 )
( 170 July 12, 1957 35.7 )
3rd 207 September 16, 1958 85.0
4th 233 July 15, 1959 50.0
5th 262 July 29, 1960 70.0
6th 298 October 13, 1961 50.0
Total Loans 379.0
Credits No. Date Amount in US$ millions
7th 36 March 22, 1963 67.5
8th 67 October 26, 1964 62.0
9th 88 June 29, 1966 68.0
10th 162 September 24, 1969 55.0
11th 280 January 24, 1972 75.0
12th 448 December 21, 1973 80.0
Total Credits 407.5
Total Loans and Credits for IR US$786.5 million
Source: IBRD Statistics

TABLE 2
INDIA
ELEVENTH RAILWAY PROJECT (CREIET 280-IN)
COMPLETION REPORT
Bank Group Lending for Transport ProjectsOther than Indian Railways
Project Loan/CreditNo. Date Amount
US$ millions
Aircraft (Air India) Ln. 161-IN March 5, 1957 5.6
Calcutta Port I Lin. 198-IN Jane 25, 1958 29.0
Madras Port Ln. 199-IN June 25, 1958 14.0
Calcutta Port II Ln. 294-IN August 17, 1961 21.0
Highway Construction andImprovement Cr. 3-IN June 21, 1961 60.0
Bombay Port Cr. 27-IN September 14, 1962 42.0
Shipping Cr. 328-IN September 26, 1972 83.0
Total US$254.6 million
July 1975
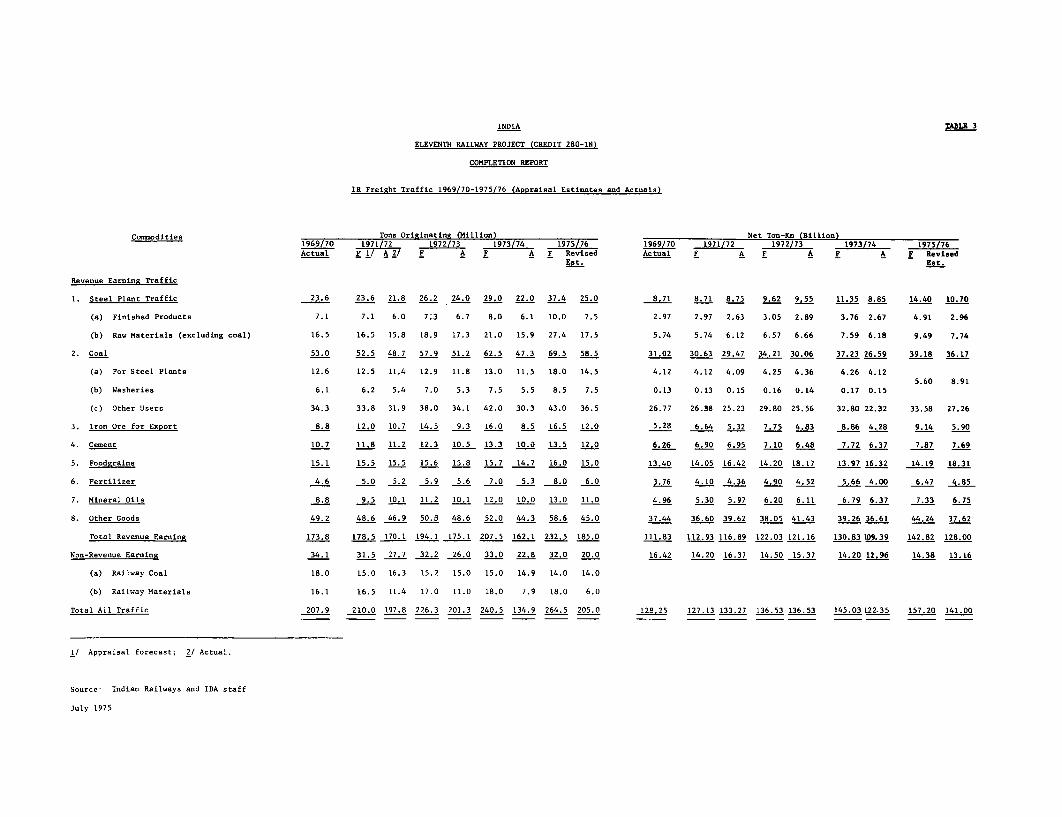
INDIA IABLE 3
ELEVENTH RAILWAY PROJECT (CREDIT 280-IN)
COMPLETION REPORT
IR Freight Traffic 1969/70-1975/76 (Appraisal Estimates and Actuals)
Commodities Tons Originating (Million) Net Ton-Km (Billion)1969/70 1971/7L 1972/73 1973/74 1975/76 1969/70 1971/72 1972/73 1973/74 1975/76Actual F 1/A2/ F A F A F Revised Actual F A F A F A F Revised
Est. Est.
Revenue Earning Traffic
1. Steel Plant Traffic 23.6 23.6 21.8 26.2 24.0 29.0 22.0 37.4 25.0 8.71 8.71 8.75 9.62 9.55 11.35 8.85 14.40 10.70
(a) Finished Products 7.1 7.1 6.0 7.3 6.7 8.0 6.1 10.0 7.5 2.97 2.97 2.63 3.05 2.89 3.76 2.67 4.91 2.96
(b) Raw Materials (excluding coal) 16.5 16.5 15.8 18.9 17.3 21.0 15.9 27.4 17.5 5.74 5.74 6.12 6.57 6.66 7.59 6.18 9.49 7.74
2. Coal 53.0 52.5 48.7 57.9 51.2 62.5 47.3 69.5 58.5 31.02 30.63 29.47 34.21 30.06 37.23 26.59 39.18 36.17
(a) For Steel Plants 12.6 12.5 11.4 12.9 11.8 13.0 11.5 18.0 14.5 4.12 4.12 4.09 4.25 4.36 4.26 4.125.60 8.91
(b) Washeries 6.1 6.2 5.4 7.0 5.3 7.5 5.5 8.5 7.5 0.13 0.13 0.15 0.16 0.14 0.17 0.15
(c) Other Users 34.3 33.8 31.9 38.0 34.1 42.0 30.3 43.0 36.5 26.77 26.38 25.23 29.80 25.56 32.80 22.32 33.58 27.26
3. Iron Ore for Export 8.8 12.0 10.7 14.5 9.3 L6.0 8.5 16.5 12.0 5.28 6.64 5.32 7.75 4.83 8.86 4.28 9.14 5.90
4. Cement 10.7 11.8 11.2 12.3 10.5 13.3 10.0 13.5 12.0 4.26 6.90 6.95 7.10 6.48 7.72 6.37 7.87 7.69
5. Foodgrains 15.1 15.5 15.5 15.6 15.8 15.7 14.7 16.0 15.0 13.40 14.05 16.42 14.20 18.17 13.97 16.32 14.19 18.31
6. Fertilizer 4.6 5.0 5.2 5.9 5.6 7.0 5.3 8.0 6.0 3.76 4.10 4.36 4.90 4.52 5.66 4.00 6.47 4.85
7. Mineral Oils 8.8 9.5 10.1 11.2 10.1 12.0 10.0 13.0 11.0 4.96 5.30 5.97 6.20 6.11 6.79 6.37 7.33 6.75
8. Other Goods 49.2 48.6 46.9 50.5 48.6 52.0 44.3 58.6 45.0 37.44 36.60 39.62 38.05 41.43 39.26 36.61 44.24 37.62
Total Revenue Earning 173.8 178.5 170.1 194.1 175.1 207.5 162.1 232.5 185.0 111.83 112.93 116.89 122.03 121.16 130.83 109.39 142.82 128.00
Non-Revenue Earning 34.1 31.5 27.7 32.2 26.0 33.0 22.8 32.0 20.0 16.42 14.20 16.37 14.50 15.37 14.20 12,96 14.38 13.16
(a) Railway Coal 18.0 15.0 16.3 15.2 15.0 15.0 14.9 14.0 14.0
(b) Railway Materials 16.1 16.5 11.4 17.0 11.0 18.0 7.9 18.0 6.0
Total All Traffic 207.9 210.0 197.8 226.3 201.3 240.5 134.9 264.5 205.0 185 127.13 133.27 136.53 136.53 145.03 122.35 157.20 141.00
1/ Appraisal forecast; 2/ Actual.
Source- Indian Railways and IDA staff
July 1975

TABLE 4
INDIA
ELEVENTH RAILWAY PROJECT (CREDIT 280-IN)
COMPLETION REPORT
IR's Passenger Traffic 1969/70-1975/76(Appraisal Estimates and Actuals)
No. of PassengersYear (million) Pass-km (billion)
Forecast Actual Forecast Actual
1969/70 - 2,338 - 113.38
1970/71 2,405 2,431 116.78 118.12
1971/72 2,478 2,536 120.28 125.33
1972/73 2,548 2,653 123.89 133.53
1973/74 2,618 2,654 127.61 135.66
1974/75 2,689 2,410 131.h 122.20
1975/76 2,758 2,654 135.38 137.50
(est.)
Source: IR and IDA staff
July 1975
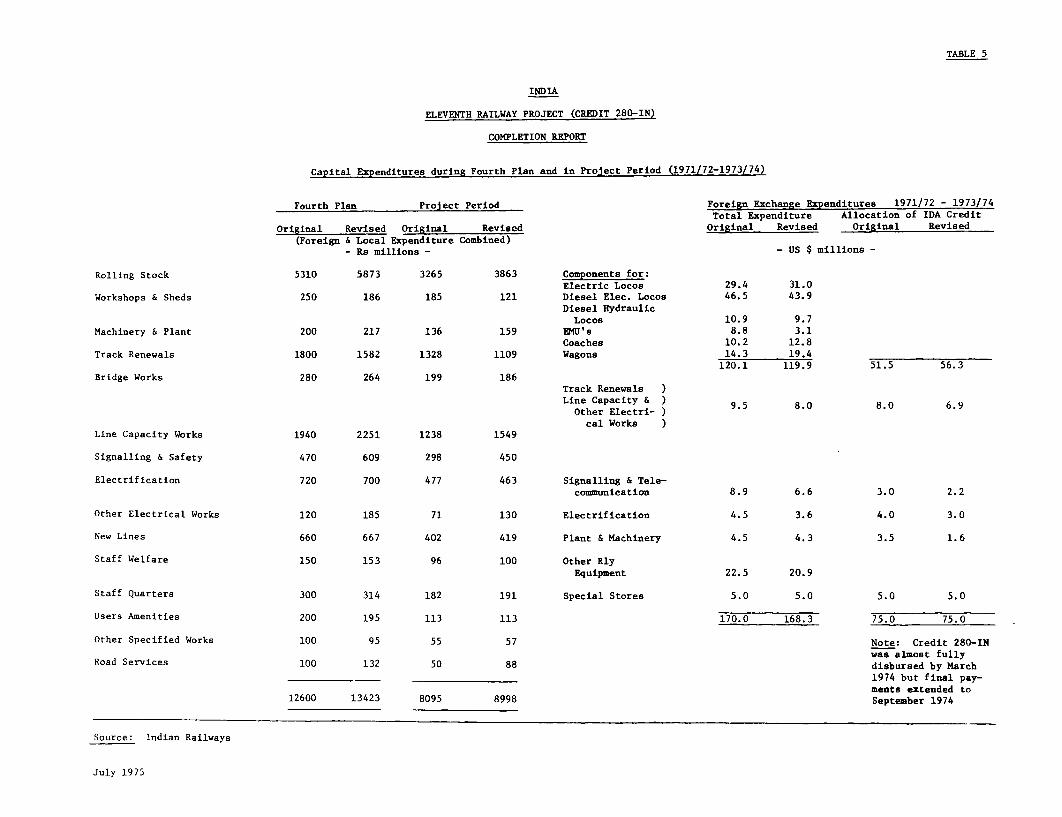
TABLE 5
INDIA
ELEVENTH RAILWAY PROJECT (CREDIT 280-IN)
COMPLETION REPORT
Capital Expenditures during Fourth Plan and in Project Period (1971/72-1973/74)
Fourth Plan Project Period Foreign Exchange Expenditures 1971/72 - 1973/74Total Expenditure Allocation of IDA Credit
Original Revised Original Revised Original Revised Original Revised
(Foreign & Local Expenditure Combined)- Re millions - - US $ millions -
Rolling Stock 5310 5873 3265 3863 Components for:Electric Locos 29.4 31.0
Workshops & Sheds 250 186 185 121 Diesel Elec. Locos 46.5 43.9
Diesel HydraulicLocos 10.9 9.7
Machinery & Plant 200 217 136 159 EMU's 8.8 3.1Coaches 10.2 12.8
Track Renewals 1800 1582 1328 1109 Wagons 14.3 19.4120.1 119.9 51.5 56.3
Bridge Works 280 264 199 186Track Renewals )Line Capacity & 9.5 8.0 8.0 6.9
Other Electri- )cal Works)
Line Capacity Works 1940 2251 1238 1549
Signalling & Safety 470 609 298 450
Electrification 720 700 477 463 Signalling & Tele-communication 8.9 6.6 3.0 2.2
Other Electrical Works 120 185 71 130 Electrification 4.5 3.6 4.0 3.0
New Lines 660 667 402 419 Plant & Machinery 4.5 4.3 3.5 1.6
Staff Welfare 150 153 96 100 Other RlyEquipment 22.5 20.9
Staff Quarters 300 314 182 191 Special Stores 5.0 5.0 5.0 5.0
Users Amenities 200 195 113 113 170.0 168.3 75.0 75.0
Other Specified Works 100 95 55 57 Note: Credit 280-INwas almost fully
Road Services 100 132 50 88 disbursed by March1974 but final pay-ments extended to
12600 13423 8095 8998 September 1974
Source: Indian Railways
July 1975

TABLE 6Page 1
INDIA
ELEVENTH RAILWAY PROJECT (CREDIT 280-IN)
COMPLETION REPORT
Comparison Between Targets and Achievements of Principal Project Items(1971/72/1973/74)
1/Principal Items Targets Achievements Percentage Ratio
(A) (B) (B)+(A) x 100
1. Motive Power and Rolling Stock
Cost (Rs million) 3,265 3,863 118
Locomotives- Steam (unit) 18 19 106- Diesel (unit) 470 385 82- Electric (unit) 211 125 59- Total (unit) 699 529 76
Electric Multiple Units (EMU's) (car) 568 259 46
Diesel Railcars (DRC's) (car) 28 - 0
Coaches (car) 3,950 3,545 90
Wagons- BG (4-wheeler equivalent) 26,781 27,841 104- Total (4-wheeler equivalent) 31,649 31,112 98
Condemnation Program- Steam Locos. (unit) 543 586 108- Electric Locos. (unit) 53 5 9- EMU's (car) 123 149 121- Coaches (car) 2,061 2,489 121- Wagons (4-wheeler equivalent) 12,000 15,716 131
2. Track Renewals and Bridge Works
Cost (Rs million) 1,527 1,295 85
Rail Renewals- BG (km) 3,700 3,100 84- MG (km) 700 970 139- Total (km) 4,400 4,070 93
Sleeper Renewals- BG (km) 4,600 3,680 80- MG (km) 2,500 1,150 46- Total (km) 7,100 4,830 68

TABLE 6
Page 2
INDIA
ELEVENTH RAILWAY PROJECT (CREDIT 280-IN)
COMPLETION REPORT
Comparison Between Targets and Achievements of Principal Project Items
(1971/72 /1973/74)
Principal Items Targets Achievements Percentage Ratio(A) (B) (B)(A) x 100
3. Line Capacity Works and Signalling
Cost (Rs million) 1,536 1,999 130
Line Doubling (km) 750 1,027 137
Gauge Conversion (Rs million) 95 58 61
4. Electrification
Cost (Rs million) 477 463 97
Electrified Route-km 720 500 69
5. New Lines
Cost (Rs million) 402 419 104
Completion (km) 700 574 82
.6. Workshop, Machinery, Plant, Staffand Passenger Amenities, etc.
Cost (Rs million) 888 959 108
7. Total Capital Expenditure (Rs million) 8,095 8,998 111
Note: 1/ Referred to in Annex 11 of Appraisal Report.
Source: IR
July 1975

TABLE 7
INDIA
ELEVENTH RAILWAY PROJECT (CREDIT 280-IN)
COMPLETION REPORT
Comparative Unit Costs of Locomotives andRolling Stock at the Beginning and End of Project Period 1971/72-1973/7.
Rs thousandUnit Cost Uit-- Cost Percentagein Aril 1971 in March 1974 Ratio
(A) (B) Bt(A) x 100
1. Locomotives- Diesel Mainline
- BG 2,300 2,754 120- MG 1,864 2,200 118- NG 1,080 1,787 165
- Diesel Shunter- BG 1,225 1,787 146
- Electric- BG 1,893 2,878 152
2. Electric Multiple Units(EMU's) (per car)
- BG- DC ) 590 128- AC ) 699o143
- MG 200 312 156
3. Coaches (per car)- BG 217 400 184- ND 183 210 115- NG 68 100 147
4. Wagons (per bogie)- BG 51 117 229- MG 30 35 117- NG 20 30 150
Source: IR
July 1975

TABLE 8
INDIA
ELEVENTH RAILWAY PROJECT (CREDIT 280-IN)
COMPLETION REPORT
Estimated and Actual Schedules of Disbursements by Quarter
IDA Fiscal Year Cumulative Disbursement in US$ Million at End of Quarterand Quarter Estimated Actual
1971/72
December 31, 1971March 31, 1972 0.6 6.2June 30, 1972 11.0 15.6
1972/73
September 30, 1972 17.0 25.7December 31, 1972 26.0 31.8March 31, 1973 38.0 38.9June 30, 1973 50.0 52.0
1973/74
September 30, 1973 60.0 59.4December 31, 1973 69.0 69.2March 31, 1974 75.0 74.1June 30, 1974 74.4
1974/75
September 30, 1974 75.01/
Closing Date: September 30, 1974.
Note: 1/ This figure is rounded up; the Credit was fully disbursed on October 22, 1974.
July 1975

TABLE 9INDIA
ELEVENTh RAILWAY PROJECT (CREDIT 280-IN)
COMPLETION REPORT
Selected Operating Statistics 1965/66-1973/7.
BROAD GAUGE1965/66 1966167 1i6U/K iiiif/69 LVOV/IV0 1 1971/72 1972/713 1973/74 1965/66 1966/67 71 A 72 973741. Percentage of serviceable
locomtives-Stem 86 85 85 86 86 85 86 86 86 87 86 86 88 87 87 87 86 86
t iee90 9 90 89 88 86 86 85 84 87 87 89 808 7 a8 90 as-Electric 87 82 82 81 83 79 81 80 81 83 92 90 87 a8 0 12 87 91 88 93 2 97 82. Percentage of sernj9eablepasenger vehicle n... n.e. 88 86 87 86 87 87 87 n... n.s. 91 88 88 88 69 89 883. Perceotag of serviceable wagoes 96 96 96 96 96 95 96 96 96 97 96 96 96 96 95 96 96 954. Eng"ne-km per day per engine in use
Passenger:N atn 260 260 257 256 253 250 24 243 238 222 223 225 f58 29 228 227 M03 216
7 ipers a d79 592 623 658 670 .669 665 669 690 249 267 416 S 446t tEectric 331 339 348 379 416 437 437 432 685 237 980 379 3 374 376 30 378 58-Stea 125 12 124 121 123 121 119 114 10a 138 137 135 137 137 133 132 130 1189 Diesl 353 357 361 361 356 37 343 329 307 283 276 282 281 283 280 272 273 2-Electric 327 339 335 349 340 316 308 306 272 143 181 197 2.33 254 245 267 254 2485. Ora-e toss per freight trite .1,470 1,484 1,484 1,514 1,496 1,507 1,518 1,539 1,528 716 712 718 734 734 753 768 783 7856. Net tens per freight train 725 735 724 739 721 737 748 763 745 347 346 348 388 362 378 391 403 4087
. Wsgon-it per wagon day 73 70 72 73 76 73 74 74 67 60 58 57 59 60 58 59 60 518. Net ton-km per wagon day 934 892 889 903 916 908 935 953 837 507 480 474 303 322 324 540 358 6829. Gross ton-kcm per freight train boor 22,252 22.356 22,967 24,399 24,385 25,011 25,637 25,847 26,018 9,036 8,883 8,979 9,578 9,963 .10,212 10,574 11,042 11,33410. Net ton-km per freight train hour 12,202 12.400 12,433 13,200 13,036 13,692 13,939 14,088 13,969 5,047 4,949 4.985 5,340 5,617 5,824 6,097 6,06 6,61611. Punctuality of passenger trains (1) 88 85 85 83 85 82 82 86 79 88 84 87 86 86 87 91 90 8412. Average wagon load (tone) 18.6 18.5 18.1 18.2 17.9 17.9 17.9 18.1 17.9 11.6 11.5 11.6 11.7 1128 12.1 12.5 12.4 12.713. L-ocootive utilization (number
of hour worked per day perengine available for use - 1)
- Stem 48 48 49 48 50 50 50 50 48 44 45 45 45 45 45 43 43 39-Dieel 81 77 80 80 80 78 79 79 75 73 70 73 75 73 73 74 67 66- Electric 72 67 70 76 76 73 73 70 68 43 45 48 51 50 49 51 50 48- All traction 51 52 53 53 55 55 55 56 54 46 46 4 46 47 47 45 45 42
14. Average speed of all freighttrains (km/h)
-len 13 12 12 12 12 12 12 12 12 13 13 13 13 14 13 13 13 13-Dicese 24 24 23 23 23 23 23 22 22 18 18 18 18 19 19 18 19 19- Electric 23 25 25 26 26 25 24 24 23 18 17 18 20 19 19 19 19 21- All traction 16 17 17 18 18 18 18 18 18 14 14 14 14 15 15 15 15 16
15. Average speed of throughfreight trains (km/h)
-Stem 15 15 16 16 16 16 16 16 16 16 16 16 16 16 16 16 16-Diesel 24 24 24 23 23 23 23 22 22 18 18 18 18 19 19 18 19 19- Electric 2. 25 25 26 26 25 24 24 23 18 17 18 20 19 19 19 19 21-All traction 20 20 20 21 21 22 22 21 21 17 17 17 17 19 17 17 18 18
16. Average lead of a ton offreight (km) 556 555 581 582 585 615 644 643 649 368 379 395 411 409 422 478 469 46217. Wagon turnround (days) 11.8 12.3 12.6 12.7 12.7 13.3 13.5 13.5 15.0 8.4 9.0 9.5 9.7 9.4 10.1 10.6 10.8 12.5
Note. 1/ The procedure for tho compilation for passenger vehicles under or awaiting repairs has been changed since Septeober 1967, and hence these figuresare not comparable with those of earlier years.
Source: 1R
July 1975

TABLE 10
INDIA
ELEVENTH RAILWAY PROJECT (CREDIT 280-IN)
COMPLETION REPORT
Revenue end Expenditure Accounts for 1957/58; 1960/61; 1965/66 and 1969/70-1973/74
FOURTH PLAN1957158 1960/61 1965/66 1969/70 1970/71 1971/72 1972/73 1973/74
(Ra Crores) -
Operating RevenuePassenger 119.1 131.6 219.2 278.9 295.5 320.1 343.8 367.1Freight a/ 225.2 280.5 452.4 578.1 600.7 655.7 695.9 644.2All other 35.6 48.3 62.1 94.6 110.7 121.1 123.0 126.6
Total Operating Revenue 379.9 460.4 733.7 951.6 1006.9 1096.9 1162.7 1137.9
Operating ExpensesFuel b/ 48.0 52.5 101.0 151.1 146.9 155.9 162.4 158.9Other Working Expenses- 229.2 275.0 412.9 558.9 615.3 667.0 725.9 808.6
277.2 327.5 513.9 710.0 762.2 822.9 888.3 967.5Depreciation Reserve 45.0 45.0 85.0 95.0 100.0 105.0 110.0 115.0
Total Operating Expenses 322.2 372.5 598.9 805.0 862.2 927.9 998.3 1082.5
Net Surplus available for Dividend 57.7 87.9 134.8 146.6 144.7 169.0 164.4 55.4
Dividend to Central Covernment 44.4 55.9 116.2 156.4 164.5 151.2 161.5 170.9
Surplus (Deficit) 13.3 32.0 18.6 c (9.8) (19.8) 17.8 2.9 (115.5)
Operating Ratio 81.5 78.4 79.5 83.0 84.2 83.1 84.5 93.7
Deficit expressed as apercentage of GrossReceipts c/ 1% 2% 10%
Total Cost of Staff-/ Re Crores 173.6 205.2 310.4 420.5 459.9 495.2 518.8 570.2
Average Cost of Employee Re 1587 1799 2331 3137 3398 3593 3714 4033
Percentage-wise Claimson Gross Receipts:
Fuel 12.6 11.4 13.8 15.9 14.6 14.2 14.0 14.0
Other Working Expenses (about80% labour costs) 60.4 59.7 56.2 58.7 61.1 60.8 62.4 71.1Depreciation 11.8 9.8 11.6 10.0 9.9 9.6 9.5 10.1Surplus available for Dividend 15.2 19.1 18.4 15.4 14.4 15.4 14.1 4.8
Average Receipt - Paise -
Per pass-km 1.72 1.71 2.28 2.46 2.50 2.55 2.57 2.71Per ton-ku 3.57 3.87 4.57 5.17 5.43 5.61 5.74 5.89
(in 1974 US Cent 1.00 was equivalent to Paise 8.00)
- Percentages -
Return on AverageCapital at Charge 4.7 5.8 5.0 4.6 4.3 4.8 4.4 1.4
a/ Excluding wharfage and demurrage charges.b/ Includes some expenditure of a capital nature which in published accounts is shown separately.c/ There were also deficits in 1966/67 of Rs 18.3 Crores = 2.4% of Gross Receipts.
1967/68 " " 31.5 " 3.8% "1968/69 " " 7.9 " 0.9% " "
d/ Includes costs charged to capital works.
Source: Indian Railways Annual Report 1972/73: (A twenty-four Year Summary).
July 1975

TABLE 11
INDIA
§LEVENTH RAILWAY PROJECT (CREDIT 280-IN)
COMPLETION REPORT
Statement of IR Expenditure on Capital Account
Year Charged toCapital D.R.F. D.F. Rev. Total Foreign %
(Rs millions) Exchange of(A) (B) B to A
1957/58 1519.0 636.2 255.3 104.2 2514.7 932.6 37
1958/59 1258.2 807.2 278.7 107.6 2451.7 906.8 37
1959/60 746.9 683.6 248.9 118.1 1797.5 291.3 16
1960/61 894.8 640.4 233.2 115.0 1883.4 413.8 22
1961/62 1449.0 582.4 211.4 96.0 2338.8 405.2 17
1962/63 2148.9 753.7 231.7 109.5 3243.8 600.1 18
1963/64 2605.2 724.0 299.4 114.4 3743.0 530.5 14
1964/65 2753.7 753.8 282.5 106.2 3896.2 411.6 11
1965/66 2450.9 789.1 289.1 107.4 3636.5 452.6 12
1966/67 16Q7.0 796.9 279.5 100.3 2783.7 391.6 14
1967/68 1359.4 938.2 191.5 93.2 2582.3 408.9 16
1968/69 1214.6 893.9 165.9 76.7 2261.1 266.0 12
1969/70 942.4 737.8 170.8 73.0 1924.0 207.8 11
1970/71 1355.2 906.8 182.3 68.1 2512.4 351.7 14
1971/72 1901.4 908.8 208.2 73,0 3091.4 394.6 13
1972/73 2065.5 1136.0 214.9 70.8 3487.2 404.7 12
1973/74 1669.8 1251.3 193.9 67.6 3182.6 435.3 14
27,941.9 13,850.1 3,937.2 1,601.1 47,330.3 7,805.1
July 1975

TABLE 12
INDIA
ELEVENTH RAILWAY PROJECT (CREDIT 280-IN)
COMPLETION REPORT
Bummarized Revenue and Expenditure Accounts during the Years Covered by the Project
1971/72 1972173 1973/74 1974/75
Appraisal Actual Appraisal Actual Appraisal Actual Appraisal Estimates
Re millions
Gross Revenue 10702 10966 11474 11624 12075 11379 12628 14012
Working Expenses 7654 7953 7985 8566 8282 9353 8546 11916
Depreciation Reserve Fund 1050 1050 1100 1100 1150 1150 1200 1150
Pension Fund 150 114 175 160 200 160 200 160
Operating Expenses 8854 9117 9260 9826 9632 10663 9946 13226
Other Charges (of a Capital nature) 179 158 198 154 198 162 195 175
9033 9275 9458 9980 9830 10825 10141 13401
Net Revenue 1669 1691 2016 1644 2245 554 2487 611
Dividend on Capital-at-Charge 1738 1513 1822 1615 1913 1709 1994 1893
Net Surplus (Deficit) ( 69) 178 194 29 332 (1155) 493 (1282)
Operating Ratio 82.7 83.1 80.7 84.5 79.8 93.7 78.8 94.4
NOTES
1. Results for 1973/74 and 1974/75 are distorted by a"Throw-forward" of personnel costs (in Working
Expenses) of Re 420 million which although relating
to 1973/74 was actually charged in 1974/75. After
allowing for this adjustment the figures would 1973/76 1974/75
become:
Gross Revenue 11379 14012
Working Expenses 9773 11496
Depreciation, Pension Fund & Other Charges 1472 1485
Net Revenue 134 1031
Dividend 1709 1893
Net Surplus (Deficit) (1575) 862
Operating Ratio 97.4 91.4
2. Because of the "Throw-forward" of expenditure from1973/74 to 1974/75, it becomes a little difficultto give a clear explanation of the changes whichhave occurred. After examining all the explanationsgiven in IR Budget publications and details ofincreased personnel costs -- as supplied by IR,the following figures should clarify the situation:
Working Expenses 1972/73 1973/74 1974/75
Published figures 8566 9353 11916
Adjusted figures (for "Throw-forward") 8566 9773 11496
Increase over previous year 1207 (14.1%) 1723 (17.6%)
Breakdown of Increase in Coste:
Personnel Costs 1295 1579
Fuel 84 327
Other factors and savings (172) (183)
1207 1723
Breakdown of Adjusted Working Expenses % % 7
Personnel Costs 5231 61.1 6526 66.8 8105 70.5
Other Costs 3335 3247 3391
8566 9773 11496
Percentage increase in Personnel Costs 24.7% 24.2%
July 1975


ATTACHMENT B
INDIA
TWELFTH RAILWAY PROJECT
COaPLETION REPORT-
I. Sector Background
1.01 During the period 1950/51-1970/71, the railways' share was re-duced from 90% to 63% of estimated total freight and from 75% to 50% ofestimated total passenger traffic in India, while road transport ex-perienced a corresponding increase. The change in traffic composition in-dicated an increasing specialization of the railways in bulk commoditytransport, while because of its inherent advantages, higfway transportgradually captured a greater share of the market for high value goodsmoving over short and medium distances. This development has tended toreduce the area of competition between the two modes and they have becomeincreasingly complementary to each other in the transport of freight. Inrespect to passenger traffic, the main reason for the railways' reducedrelative share of the market is that long distance passenger traffic hastended to increase at a slower rate than that for short distances (commutertraffic) because of continuing rapid urbanization and suburbanization. IRhas adopted a policy to promote diversion of short distance traffic fromrail to road, which is appropriate. Activities of other modes in the tran-sport sector are at present relatively minor although growing in importance;coastal shipping and pipelines each carry about 3% of the total freighttraffic; air transport carries about 1% of the total passenger traffic.
1.02 The Government is gradually moving away from primarily railwayoriented transport planning by seeking feasible solutions to capacity prob-lems within other modes of transport. An example of this approach is theproposed project for coastal shipping of coal from Bengal/Bihar coal-fields to power stations and other major coal consumers in Southern andWestern India. The transport review mission, which visited India in April1974, recognized that the various issues relating to transport policy andplanning could only be solved gradually and would require a continuousdialogue between Government departments and the Association.
II. The Role of the IBRDADA
2.01 Total Bank Group lending to the Indian transport sector amountedto US$1,521 million equivalent; US$896 million was for IR through 13 rail-way projects, US$430 million for roads and road transport industry, andthe remaining US$195 million for ports, shipping, and aviation.
2.02 The Bank Group's first lending operation for IR was in 1949 andit was the first lending operation for India. The next loan for IR came in1957, and since then there has been a continuous relationship between theBank Group and IR. In the first five years of our lending, IR's averageannual investment included a 27% foreign exchange component (US$124 million).
1/ This report was completed in June 1976, and is based on data collectedduring preceding supervision missions.
- B.2 -
In the last four years, the foreign element in annual investment expenditureshas been only about 14% (US$50 million). In constant prices, the foreLgexchange spending of PR is now running at a level of only about 25% of whatthey were spending 18 years ago. While foreign exchange spending has de-clined substantially, the services provided by IR have continued to grow.During the above mentioned period, the volume of freight traffic has increasedby about 75% and passenger traffic has almost doubled.
III. Project Preparation and Appraisal
3.01 The Project consisted mainly of investments during the first year1974/75 of IR's Fifth Five-Year Plan 1974/75-1978/79. It also covered a smallportion of the investment during the last three months (January to March 1974)of IR's Fourth Five-Year Plan 1968/69-1973/74 because the funds of the thenongoing Credit 280-IN (Eleventh Project) were expected to be exhausted byDecember 1973, due to price increases. Therefore, the Project covered theperiod of 15 months between January 1, 197k and March 31, 1975.
3.02 At the time of appraisal, the Fifth Five-Year Plan was still underpreparation. However, agreement was reached that IR should base its plan onan expected increase in freight tonnage to 280 million in 1978/79 (220million in 1974/75), representing an annual increase of 6.1%, and in the numberof passengers to 3,017 million in 1978/79 (2,778 million in 1974/75), represen-ting an annual increase of 2.1%.
3.03 Total expenditure in the Fifth Plan period was then estimated atRs 23.8 billionl/(US$3.2 billion equivalent), slightly more than one-thirdof which was earmarked for the provision of locomotives and rolling stock.
3.04 Total expenditure on the Project during the 15-month programamounted to Rs 4,874 million (US$654 million), with a foreign exchange con-tent of US$97 million equivalent. After excluding investments not directlyrelated to operational performance of the railways (staff welfare, etc.),about 40% of the expenditures were for cost reducing investments and the re-maining 60% for capacity increasing investments. The main elements of theProject were for the continued replacement of steam by diesel or electriclocomotives, additions to freight-carrying capacity through wagon replace-ments and increases in the wagon fleet, further electrification of mainlines,track renewal works, and increases in workshop capacity.
3.05 The length of the period between the appraisal mission and Boardpresentation was six months, which is deemed normal.
1/ This amount was later revised to Rs 23.5 billion, a substantial decreasein real terms-- on which the thirteenth Railway project was based.

- B.3 -
IV. Traffic and Operations
Freight Traffic
4.01 In 1974/75, IR carried 196.6 million tons, falling short of theappra sal forecasts by about 11%. However, as a result of increased averagehaull/, the shortfall was 9% in ton-km.
4.02 The reason for this shortfall is explained by the followingfactors:
(a) In 1974/75, economic activities in India were lessthan anticipated. The overall agricultural produc-tion was lower than in 1973/74. Industrial produc-tion showed some recovery from the state of semi-stagnation of 1973/74, but the growth rate was onlyabout 2.5% in the industrial sector. Except forcoal, none of commodities were carried as projected(Table 1);
(b) During the latter part of 1973 and the first half of1974, there was a succession of railway workers'strikes and disputes, and these culminated in an allIndian strike in May 1974; and
(c) Appraisal forecast was optimistic.The last factor was carefully reexamined by the appraisal mission for thethirteenth railway project, and this resulted in appraisal estimates andactuals for 1975/76 of 210 and 214 million tons, respectively.
Passenger Traffic
4.03 In 1974/75, the number of passengers totalled 2,429 million, 13%lower than appraisal estimates (see Table 2). Passenger-km totalled 126billion, 12% lower than appraisal estimates. The decline in the volume ofpassenger traffic was due mainly to the strike in May 1974. In the strike-bound month alone, IR lost 110 million passengers and the scope of recoveryof passenger traffic once lost was limited. IR deliberately allowed theburden of curtailed services to fall on passenger traffic in order to safe-guard the movement of essential freight as much as possible.
Operations
4.04 Table 3 summarizes selected operating statistics for the nine years1966/67-1974/75. In 1974/75, operating performance continued to be satis-factory. Gross tons per freight train reached a record high of 1,567 tons on
1/ In 1974/75, the average haul was 656 km as compared with 670 km, whidiwas projected in the appraisal report, Annex II, Page 2.

- B.4 -
BG lines and 800 tons on M lines. Wagon turnround showed a slight im-provement as compared with that for the previous year. Under the thirteenthRailway project, an action plan was drawn up to further improve the wagonturnround; in 1975/76 (April-December), it averaged 13.7 days on BG linesand 11.9 days on MG lines. The low availability of electric locomotives(79% in 1974/75 on BG lines) was because of design deficiencies in tractionmotors (para 5.03).
V. Project Implementation and Cost
5.01 The execution of the Project was affected by a number of adversedevelopments. First, wholesale prices increased by 31% over the 12-monthperiod ending in September 1974. Second, the nationwide railway strikecommenced on May 8, 1974, and was not formally called off till 20 days later.Third, electric power cuts because of a coal shortage seriously affectedwork in the manufacturing units.
5.02 Table 4 gives capital expenditures for 1974/75, appraisal estimatesand actuals. Briefly, the appraisal estimate of Rs 4,050 million was revisedto Rs 3,467 million, a 14% decrease in Rupee terms, to reflect the less thananticipated traffic development.
5.03 Because of the continuing nature of IR's production program oflocomotives and rolling stock and of track renewals and other works, it isdifficult to determine exactly the actual physical output and compare it withestimates made at the time of appraisal. In fact, part of the investmentundertaken during 1974/75 was for completion of works in progress; part ofthe investment was for starting new works. However, an attempt has been madeto compare major targets with achievements during 1974/75 in accordance withthe appraisal estimates. Table 5 shows the results of this comparison, anda summary follows:
Appraisal Achievements PercentageEstimates Ratio
(A) (B) (B)(A)x 100
LocomotivesElectric 78 46 9Diesel 223 121 54Total Locomotives 301 167 55
Electric Multiple Units 245 201 82Coaches 1,339 859 64Wagons (four-wheeler
equivalent) 21,680 10,958 51Scrapping of Steam Locomo-tives 14 165 115
Rail Renewals (km) 1,360 731 54Line Doubling (km) 240 139 58Electrification (km) 360 259 72New Lines (km) 280 56 20

- B.5 -
Except for the scrapping of steam locomotives, all achievements were far lessthan anticipated at the time of appraisal, ranging from 20 to 82% of theappraisal estimates. This is mainly a result of substantial cost increasesin labor and materials which caused IR to curtail its original output tar-gets, and the less than anticipated traffic development in 1974/75. Pastdesign problems1./ with traction motors for electric locomotives were resolvedduring 1974/75.
5.04 Identifying unit cost increases during 1974/75 by item is extremelydifficult. Relevant data cannot be presented in this report. Only some in-dicative information on wholesale price index numbers for important commodi-ties used by IR is given in Table 6. The inflation rate during the fiscalyear 1974/75 ranged from a low of 18% for timber and logs to a high of 66%for mineral oils. These price rises clearly indicate the inflationarypressures on IR's costs.
5.05 Table 7 compares estimates and actual schedules of disbursementsat the end of each quarter up to the Closing Date of Credit 448-IN. Thereason for relatively slow disbursements was: (a) delays in shipments asships were not available; and (b) slippage in production by suppliers. Thesetwo factors resulted from the oil crisis. Another factor was, of course,the curtailed budget for 1974/75, reflecting the less than anticipated traffic;eventually, of a total allocation of US$80 million of the Credit proceedsabout US$22 million was thrown forward into the thirteenth project. Table 4shows category-wise disbursements comparison between estimated allocation andactuals during 1974/75. The shortfall resulted mainly from materials andcomponents for locomotives and rolling stock, reflecting the low output. Theoverrun for the heading "track renewals, bridge works, and electric works"took place because of price increases in high tensile steel materials forbridges. Relatively large shortfalls under the heading, "signalling andtelecommunications" and "plant and machinery" resulted from longer deliveryperiods after the oil crisis.
5.06 Annex 1 gives a summary of covenants and undertakings and actiontaken thereon. In general the borrower has complied with the covenants al-though progress has been slow in accounting reforms and the earnings covenantin 1975/76 was not quite met (see para 6.02).
1/ Completion Report for Eleventh Railway Project dated July 31, 1975,para 9.05.

- B.6 -
VI. Financial Results
6.01 Financial results for the years 1973/74-1975/76 are shown inTable 8, together with the appraisal report estimates. Although appropriatesteps were taken during the appraisal to take account of future increasesin labor and material costs, the results have been poorer than expected.The most significant feature of the results is the substantial increase inpersonnel costsa
- Rs million-1973/74 1974/75 1975/76 Estimates
Cost of Personnel (A) 6,526 8,105 10,324Working Expenses (B) 9,773 11,496 14,419Percentage of A to B % 66.8 70.5 71.5Increase in Personnel costsover previous year % 24.2 27.4
The exceptionally large increases in these costs are due to recommendationsof the Pay Commission in late 1973 for a succession of increases in dearnessallowances which are granted in line with official cost of living index.
6.02 In the past, IR has been slow in adjusting tariffs to recover in-creases in cost. Since 1974, there has been a distinct change in the policyand more prompt action has been taken. As a result, there have been sub-stantial tariff increases in 1973/74 and 1974/75 which are estimated to haveincreased revenues by 3,054 million annually. However, the rapid rises inpersonnel, fuel and material costs, have prevented the IR from achieving thelevel of net revenue stipulated in Section 4.02(a) of Development CreditAgreement. The Association's earning covenant required that IR's net revenueshould be sufficient to meet full dividend payment on capital-at-charge. Sub-sequently, this requirement was waived for 1973/74. For 1974/75 IR was toearn 70% of dividend, 85% in 197 /76 and 100% thereafter. From Table 8 itwill be seen that the adjusted- net revenue from operations for 1974/75 wasRs 1158 million. After allowance is made for charges to net revenue of acapital nature, net revenue from operations amounted to Rs 1330 million(1158+172) which is equivalent to 70% of the dividend payment. The revisedestimates for 1975/76 indicate about Rs 1,357 million net revenue from opera-tions, and after allowing for charges of a capital nature, the net revenueis expected to amount to Rs 1,566 million (1357+209). This is equivalent toabout 80% of dividend payment and thus falls slightly short of the require-ment of 85% by 1975/76.
VII. Institutional Development
7.01 Following the completion in January 1974 of an initial version ofIR's Corporate Plan covering a period of 15 years between April 1974 toMarch 1989, IR began the preparation of a detailed Zonal-Railway-based versionof the Corporate Plan, in accordance with Section 4.03 of Credit AgreementNo. 448-IN, For this purpose, a Planning Cell was created on each ZonalRailway in 1974.
1/ See Note 1, Table 8.

- B.7 -
7.02 The Railway Board's on Corporate Planning Cell coordinated thepreparation of the Zonal Plan by each Zonal Cell, reconciling inconsis-tencies between individual proposals with user Ministries and the PlanningCommission. The Zonal-Railway-based version was submitted to the RailwayBoard for consideration in April 1976 and is expected to be forwarded tothe Association for comment in June 1976.
VIII. Economic Evaluation
8.01 The investments in remunerative services during the projectperiod amounted to Rs 4,192 million, including both the cost-reducing andcapacity-increasing investments; this is about 9% lower than estimated atappraisal. Because of the very limited project period and the considerabletraffic fluctuations during this period caused by railway strikes andeconomic dislocations following the oil price increases, the first yearbenefits have been estimated as the average of the period 1971/72-1975/76.The resulting first year benefits thus have been estimated at Rs 495 millionin 1974/75 or about 6% below the appraisal estimate. The first year economicreturn from the investments has been calculated at 11% or as estimated atappraisal. Assuming that benefits will grow with traffic at an average ofabout 3% annually over the coming 25 years, compared to an average annualtraffic growth of 4% over the past 25 years, the overall economic returnfrom the investments has been estimated at 13% or as estimated at appraisal.
TX. Major Findings and Recommendations
9.01 The following are the main features of the preceding review:
(a) In 1974/75, due to the sluggish economy and rail-way labor slow-down action, IR's freight trafficfell short of the appraisal forecasts by about11% in net tons carried and by about 9% in ton-km.Passenger traffic also fell short of the appraisalforecasts by about 13% in the number of passengerscarried and by about 12% in the pass-km (paras 4.01,4.02, and 4.03). These shortfalls were beyond IR'scontrol;
(b) Reflecting decreases in traffic, coupled with priceescalation affected by the energy crisis, the Projectwas scaled down (pares 5.ol, 5.02, and 5.03). Dis-bursements of the Credit proceeds were also scaleddown (para 5.05). These adjustments were appropriate;
(c) Operating statistics continued to be satisfactory
(para 4.04);
(d) The Borrower's compliance with financial covenantsof the Credit Agreement was satisfactory (pare 6.02);
(e) Because of the very limited Project period involved,the review of the economic returns from the projectwill be undertaken as part of a larger analysis in1979/80 (pare 8.01).

- B.8 -
9.02 Due to the magnitude of Indian Railways and the extent of itstransport role, associated with the railway projects are issues which in-volve the entire transport sector and are intimately linked with Indianeconomy as a whole, particularly agriculture, and the extractive and heavyindustries. At the same time IR carried about 50% of total passengertraffic in India. Therefore, having this in mind and IR's continuous largeinvestment requirements, the following recommendations are made:
(a) Railway Project Completion Reports for IR shouldbe complemented by a more comprehensive review onthe transport sector at 4-5 year intervals (seeNote); and
(b) The project periods should be extended (to about30-36 months) thus allowing more time for super- 1/visicn and reducing time spent on credit processing-'.
1/ Since the appraisal of the Twelfth Railway Project in June 1973 thefollowing reports (in addition to supervision reports) have been preparedby the Transportation Projects staff concerning Indian Railways.
- Preappraisal Report, Thirteenth Railway Project(April 24, 1974)
- Preappraisal Report, Thirteenth Railway Project(February 12, 1975)
- Discussions on Transport Sector, Planning andManagement with Government of India, Full Report(July 10, 1974)
- Appraisal Report, Thirteenth Railway Project(July 28, 1975)
- Project Completion Report, Eleventh Railway Project(July 31, 1975)

ANNEXpage 1
INDIA
TWELFTH RAILWAY PROJECT (Credit h8-IN)
COMPLETION REPORT
Summary of Covenants and Undertakings and Action Taken Thereon
Requirements Action Taken
Credit Agreement
Section No.
4.02 Net revenue to be sufficient Accounts for 1974/75to meet all operating ex- narrowly met the 70%penses and dividend. Depre- dividend requirements.ciation figures for years For 1975/76 the net revenue1973/74 to 1975/76, to be is estimated to cover aboutnot less than Rs 1,150 million, 80% of the dividend payment.Rs 1,200 million, and 1,250 Charges for depreciation formillicn respectively. 1974/75 were Rs 50 million
less than the provision ofRs 1,200 million, but thisissue was taken over by thethirteenth project, underwhich a global sum for thefive years was stipulated.
4.03 Corporate Plan to be kept up Zonal-Railway-based Planto date. is now being finalized.
Side Letter
Earnings covenant requiring IR Mentioned above.to earn sufficient to pay dividendin full was retained but waivergranted for 1973/74. For 1974/75IR is required to earn 70% of divi-dend, in 1975/76 85% and 100%thereafter.

ANNEXpage 2
Minutes of Understanding
Minutes No.
1. Agreement reached on timetablefor transport policy and planning:(a) November 1975, completion Done in November 1973.
by GOI of Transport PolicyReview;
(b) March/April 1974, Sector Done in April 1974.Review Mission by IDA; and
(c) October 1974, completion of Agreement was reached, exoeptMinutes of Understanding for two outstanding issues:between GOI and IDA. (i) establishment of cen-
tralized Government agencyfor transport policy andplanning; and (ii) de-sirability of subjectingIR investment programs tothe Public Investment Boardscrutiny.
3. Accounting procedures. The study groups completedStudy groups to be at work on the their work and made recommen-matters referred to by the Railway dations. Implementation isConvention Committee up to October very slow because of the com-1974; presentation of budget docu- plex nature of the changesments in 1975 and of accounts for required.1974/75 should be improved, followingthe study groups' work.
6. Procurement procedures. Exemption No major problem has beenfrom IDA's prior approval for contract experienced in applying theaward for steel, non-ferrous metals, exemption.wheels, tires, and wheelsets.
June 1976

INDIA
TWELFTH RAILWAY PROJECT (CREDIT 448-IN)
CCPLETICK REPORT
Comparison Between Appraisal Estimates and Achievements of Freight Traffic for 1974/75
Filures in Millions _ Percentage RatioAppraisal Estimates (A) Achievements- (B) (B)(A)xlOO
Tons Net Tons Net Tons NetOriginating Ton-km Originating Ton-km Originating Ton-ka
Revenue Earning Traffic
1. Steel Plantsa) Finished Produets 7.5 6.7 7,172 89b) Raw Material (exclu. Coal) 18.8 17.4 3,283 93
2. Coala7 For Steel Plants 12.6 12.4 4,A35 98b) Washeries 6.3 6.7 191 106c) Other Users 36.0 36.2 28,281 101
3. Iron Ore for Export 12.7 9.1 5,358 724. emenr 13.0 9.2 6,o95 715. Ueneral Goods
a) Foodgrains 17.5 13.7 15,172 78b) Fertilisers 7.5 6.0 4,788 80c) Mineral Oil (POL) 11.8 10.8 6,901 92d) Others 50,0 45.5 39 698 91
Total Revenue Earning Traffic 1 3-.7 173.7 121,37 90
Non-Revenue Traffic
Railway Coal 14.3 15,6 12,337 109Railway Materials 12.0 7.3 1,126 61
TOTAL ALL TRAFFIC 220.0 147.400 196.6 134,837 89 91
1/ Appraisal Report, Table 13-A.2/ Supplement to IR Report and Accounts 1974/75.
June 1976

INDIA
IWELFTH RAILWAY PROJECT (CREDIT 448-IN)
COMPLETICN REPORT
Comparison Between Appraisal Estimates and Achievements of Passenger Traffic for 1974/75
Appraisal Estimatesl/ Achievements Percentage Ratio(Al) (B) (B)t(A)el00
Non-Suburban
Number of passengers originating (million ) 1,327 1,056 80Passenger-km (billion) 115.6 99.1 86Average journey (lan) 87 94 108
2/Suburban-
Number of passengers originating (million) 1,)41 1,373 95Passenger-km (billion) 27.4 27.2 99Average journey (km) 19 20 105
Total
Number of passengers originating (million) 2,778 2,29 87Passenger-km (billion) 143.0 126.3 88Average journey (km) 51 52 102
1/ Appraisal Report, Annex 2.7/ Metropolitan passenger traffic in and around the four largest cities, Bombay, Calcutta, Madras, and Secunderabad.
June 1976
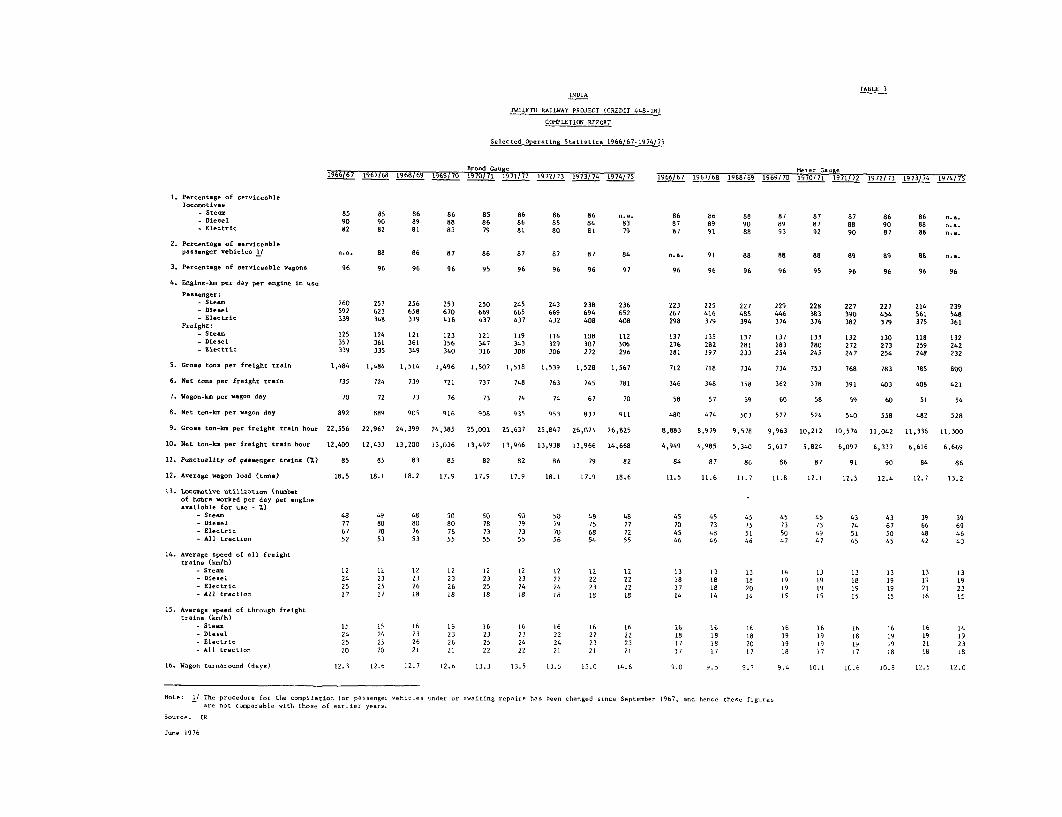
TABLE 3INDIA
TWELFTH RAILWAY PROJECT (CREDIT 448-IN)
COMPLETION REPORT
Selected Operating Statistics 1966/67-1974/75
SBroad Gaupe Meter Gauge1966167 1967/68 196869 1969/70 1970/71 1971/72 1972/73 1973/74 1974/75 1966/67 1967/68 1968/69 1969/70 1970/71 1971/72 1972/73 1973/74 1974/75
1. Percentage of serviceablelocomotives
-Steam 85 85 86 86 85 86 86 86 n.e. 86 86 88 87 87 87 86 86 n.a.-Dieel 90 90 89 88 86 86 NS 84 83 87 89 90 89 87 88 90 88 n.a.* Electric 82 82 81 83 79 81 80 81 79 87 91 88 93 92 90 87 88 n.a.
2. Percentage of serviceablepassenger vehicles 1/ n.a. 88 86 87 86 87 87 87 84 n.a. 91 88 88 88 89 89 8 n.a.
3. Percentage of serviceable wagone 96 96 96 96 95 96 96 96 97 96 96 96 96 95 96 96 96 96
4. Engine-km per day per engine in use
Passenger:- Steam 260 257 256 253 250 245 243 238 236 223 225 227 229 228 227 227 214 239- Diesel 592 623 658 670 669 665 669 694 652 267 416 485 446 383 390 456 561 548Ei ectric 339 348 379 416 437 437 432 408 408 298 379 394 374 376 382 379 375 361PreIgh t:
- Steam 125 124 121 123 121 119 114 108 112 137 135 137 137 133 132 130 118 132- Diesel 357 361 361 356 347 343 329 307 306 276 282 281 283 280 272 273 259 242- Electric 339 335 349 340 316 308 306 272 296 181 197 233 254 245 247 254 248 232
5. Gross tons per freight train 1,484 1,484 1,514 1,496 1,507 1,518 1,539 1,528 1,567 712 718 734 734 753 768 783 785 800
6. Net tons per freight train 735 724 739 721 737 748 763 745 781 346 348 358 362 378 391 403 408 421
7. Wagon-km per wagon day 70 72 73 76 73 74 74 67 70 58 57 59 60 58 59 60 51 54
8. Net ton-km per wagon day 892 889 909 916 908 935 953 837 911 480 474 503 522 524 540 558 482 528
9. Gross ton-km per freight train hour 22,556 22,967 24,399 24,385 25,001 25,637 25,847 26,021 26,825 8,883 8,979 9,578 9,963 10,212 10,574 11,042 11,336 11,300
10. Net ton-km per freight train hour 12,400 12,433 13,200 13,036 13,492 13,946 13,938 13,966 14,668 4,949 4,985 5,340 5,617 5,824 6,097 6,337 6,616 6,669
11. Punctuality of passenger trains 85 85 83 85 82 82 86 79 82 64 87 86 86 87 91 90 84 86
12. Average wagon load (tons) 18.5 18.1 18.2 17.9 17.9 17.9 18.1 17.9 18.6 11.5 11.6 11.7 11.8 12.1 12.5 12.4 12.7 13.2
13. Loconootive utilization (nuoberof habre worked per day per engineavailable for use - %)
-Steam 48 49 48 50 50 50 50 48 48 45 45 45 45 45 43 43 39 39-Diesel 77 80 80 80 78 79 79 75 77 70 73 75 73 73 74 67 66 69- Electric 67 70 76 76 73 73 70 68 72 45 48 51 50 49 51 50 48 46- All traction 52 53 53 55 55 55 56 54 55 46 46 46 47 47 45 45 42 43
14. Average speed of all freighttrains (km/h)
-Steam 12 12 12 12 12 12 12 12 12 13 13 13 14 13 13 13 13 13-Diesel 24 23 23 23 23 23 22 22 22 18 18 18 19 19 18 19 19 19- Electric 25 25 26 26 25 24 24 23 22 17 18 20 19 19 19 19 21 23- All traction 17 77 1s 18 18 18 18 10 18 14 14 I4 15 15 15 15 16 15
15. Average speed of through freighttraine (km/h)
-Steam 15 15 16 16 16 16 16 16 16 16 16 16 16 14 16 16 16 14-Diel 24 24 23 23 23 23 22 22 22 18 18 18 19 19 18 19 19 19- Electric 25 25 26 26 25 24 24 23 23 17 18 20 19 19 19 19 21 23- All traction 20 20 21 21 22 22 21 21 21 17 17 17 18 17 17 18 18 18
16. Wagon turnaround (days) 12.3 12.6 12.7 12.6 13.3 13.5 13.5 15.0 14.6 9.0 9.5 9.7 9.4 10.1 10.6 10.8 12.5 12.0
Note: 1/ The procedure for the compilation for passenger vehicles under or awaiting repairs has been changed since September 1967, and hence these figuresare not comparable with those of earlier years.
Source. IR
June 1976

TABLE 4
INDIA
TWELFTH RAILWAY PROJECT (CREDIT 448-IN)
COMPLETION REPORT
Capital Expenditures for 1974/75
------- Rs million-------- ------ ----------- US$ million------------------Foreign Exchange Expenditure for 1974/75Total
Total Cost for 1974/75 Expenditure
Appraisail1/ 2/ Appraisal Credit 448-IN Credit 448-IN
Estimates 1 Actuals - Estimates Allocation 2! Actuals fj/
Locomotives and Rolling Stock
Electric Locomotives 13.1Diesel Electric Locomotives 17.6Diesel Hydraulic Locomotives 3.9Electric Multiple Units 4.1Coaches 3.2Wagons 21.2
Sub-total 1,765 1,742 63.1 52.4 42.6
Track Renewals, Bridge Works,and Electric Works 1,328 982 3.1 3.2 6.1
Signalling and Telecommunications 162 134 2.0 1.6 0.5
Electrification 151 220 2.1 1.6 1.1
Workshops and Sheds 108 64 - -
Plant and Machinery 86 69 2.0 1.6 0.7
New Lines 132 188 - - -
5/Miscellaneous- 318 68 8.5 3.6 3.8
TOTAL 4,050 3,467 80.8 64.0 54.8
If Appraisal Report, Table 4.2/ Actuals, Explanatory Memorandum for 1976/77 Budget, page 22.3/ Estimated allocation for 1974/75.4/ Including about US$ 0.9 million from proceeds of Credit 280-IN.5/ Including other works, services, inventories, staff welfare, etc.
June 1976

TABLE 5
INDIA
TWELFTH RAILWAY PROJECT (CREDIT 448-IN)
COMPLETION REPORT
Comparison Between Appraisal Estimates and Achievements of Principal Project Items for 1974/75
Appraisal
Principal Items Estimates Achievements Percentaae Ratio
(A) (B) (B)- (A) x 100
1. Locomotives and Rolling Stock
Cost (Rs million) 1,765 1,742 99
Electric Locomotives 78 46 59
Diesel Electric Locomotives 170 87 51
Diesel Hydraulic Locomotives 53 34 65Sub-total, Locomotives 301 167 55
Electric Multiple Units 245 201 82Coaches 1,339 859 64Wagons (4-wheeler equivalent) 21,680 10,958 51
Scrapping of Steam Locomotives 144 165 115
2. Track Renewals, Bridge Works,and Electrical Works
Cost (Re million) 1,328 982 74
Rail Renewals (km) 1,360 731 54Sleeper Renewals (km) 1,360 990 73Line Doubling (km) 240 139 58
Gauge Conversion (km) 240 53 22Road Over/Under Bridges (no.) n.a. 15 n.a.Bridge Rehabilitation (no.) n.a. 810 n.a.
3. Signalling and Telecommunications
Cost (Rs million) 162 134 83
Automatic Block Signalling (track-km) n.a. 42 n.a.Microwave Links (route-km) n.a. 1,508 n.a.
4. Electrification
Cost (Re million) 151 220 146
Completion (km) 360 259 1/ 72
5. Workshops. Sheds, Plant, andMachinery
Cost (Rs million) 194 133 69
6. New Lines
Cost (Re million) 132 188 142
Completion (km) 280 56 20
7. Miscellaneous2
Cost (Re million) 318 68 21
8. TOTAL COST (Re million) 4,050 3,467 86
Note: 1/ Including a section of about 59 km, which was also energized during the year, butwhich was opened to traffic later.
2/ Including other works, services, inventories, staff welfare, etc.
Source: Appraisal Report, IR's Year Book 1974/75, and IR's Annual Report and Accounts 1974/75.
June 1976

TABLE 6
INDIA
TWELFTH RAILWAY PROJECT (Credit 448-IN)
COMPLETION REPORT
Wholesale Price Index Numbers for Important Commodities Used by IR
Percentage Ratio1961/62 = 100 1974/75 1974/75
1972/73 1973/74 1974/75 1973/74 1972/73(A) (B) (C) (C)- (B)x100 (C)- (A)x 100
Coal 177 190 224 128 138
Mineral Oils 180 236 391 166 217
Electricity 159 167 206 123 130
Metal Products (Rolling
stock parts andfittings, Permanent
way materials, Bridge
works, etc.) 198 227 278 122 140
Metals (ferrous and non-
ferrous intermediates) 239 316 397 126 166
Electrical Stores 171 183 240 131 140
Chemical Products (Paints,Varnishes, Acids, etc.) 156 171 240 140 154
Non-Metallic Products
(Abrasives, Refractories,etc.) 160 184 248 135 155
Cotton Manufactures 166 184 223 121 134
Timber and Logs 178 202 238 118 134
Cement 166 171 224 131 135
Source: IR's Year Book 1974/75, pages 11 and 12.
June 1976
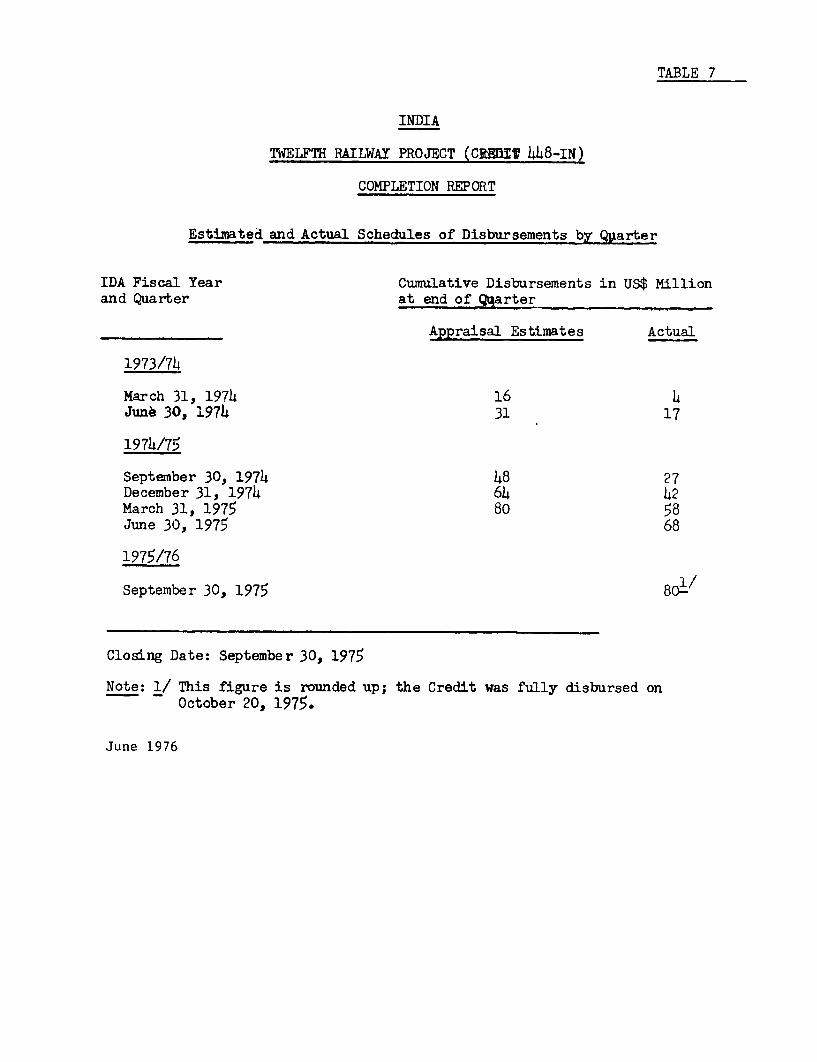
TABLE 7
INDIA
TWELFTH RAILWAY PROJECT (CRD!T 448-IN)
COMPLETION REPORT
Estimated and Actual Schedules of Disbursements by Qgarter
IDA Fiscal Year Cumulative Disbursements in US$ Millionand Quarter at end of Qqarter
Appraisal Estimates Actual
1973/74
March 31, 1974 16 4Junk 30, 1974 31 17
1974/75
September 30, 1974 48 27December 31, 1974 64 42March 31, 1975 80 58June 30, 1975 68
1975/76
September 30, 1975 801-/
Closing Date: September 30, 1975
Note: 1/ This figure is rounded up; the Credit was fully disbursed onOctober 20, 1975.
June 1976

TABLE 8
INDIA
TWELFTH RAILWAY PROJECT (CREDIT 448-IN)
COMPLETION REPORT
Summarized Revenue and Expenditure Accounts 1973/74-1975/76
1973/74 1974/75 1975/76Revised
Appraisal Actual Appraisal Actual Appraisal Estimates
Gross Revenue 12,236 114379 13,154 14,081 132809 17,377
Working Expenses 10,296 9,353 10,519 11,862 10,912 14,419
DepreciationReserve Fund 1,150 1,150 1,200 1,150 1,250 1,150
Pension Fund 160 160 160 159 170 242
Operating Expenses 11,606 10,663 11,879 13,171 12,332 15,811
Other Charges (ofa Capital nature) 175 162 193 172 216 209
11,781 10,825 12,072 13,343 13,548 16,020
Net Revenue 455 554 1,082 738 1,263 1,357
Dividend onCapital-at-Charge 1,726 1,709 1,840 1,874 19980 1,982
Net Surplus(Deficit) (1,271) (1,155) (758) (1,136) (717) (625)
Operating Ratio 94.9 93.7 89.3 93.5 87.6 91.0
NOTES
1. Results for 1973/74 and1974/75 are distorted by a"Throw-forward" of personnelcosts (in Working Expenses)of Rs 420 million whichalthough relating to 1973/74was actually charged in1974/75. After allowingfor this adjustment thefigures would become: Adjusted Results
1973/74 1974/75Gross Revenue 11,379 14,081
Working Expenses 9,773 11,442
Depreciation, PensionFund & Other Charges 1,472 1,481
Net Revenue 134 1,158Dividend 1,709 1,874Net Surplus (Deficit) (1,575) (716)Operating Ratio 97.4 91.7
2. Upon finalization of 1975/76 accountsthe results for 1974/75 will have to beadjusted for "Throw-forward" portion ofthe expenditures (e.g. retroactiveportion of increases in dearness allowanceschargeable to 1974/75).
Source: IR and mission estimates
June 1976

INDIAN RAILWAYS ORGANIZATION CHART
As of February 12, 1976MINISTRY OF RAILWAYS
Minister for RailwaysMinister of State in the Ministry of RailwaysDeputy Minister in the Ministry of Railways
RAILWAY BOARD
ChairmanFinancial CommissionesMember MechanicalMember StaffMember TrafficAdditional Member Electrical EngineeringAdditional Member FinanceAdditional Member MechanicalAdditional Member StaffAdditional Member TrafficAdditional Member VigilanceAdditional Member Works
DIRECTORS (23) ZONAL RAILWAYS MANUFACTURING UNITS PROJECTS RESEARCH, DESIGNSAND STANDARDS
Accounts General Managers 19) General Managers (3) General Managers (2) ORGANIZATION,Civil Engineering LUCKNOWEfficiency Bureau Central Railways,1-ombay Chittaranian Locomotive Works, Chittaranjan Construction, SouthernElectrical Engineering Eastern Railway, -lcutta Diesel Locomotive Works, Varanasi Railway, Bangalore Director GeneralEstablishment Northern Railway, New Delhi Integral Coach Factory, Madras Metropolitan TransportFinance (Budget) North Eastern Railway, Gorakhpur Project (Railways),Gange Bridge Northeast Frontier Railway, Maligeon (Gauhatil CalcuttaHealth Southern Railway, MadrasIntelligence South Central Railway, SecunderabadMechanical Engineering South Eastern Railway, CalcuttaMechanical Engineering (Workshops) Western Railway, BombayMetropolitan TransportOfficial LanguagePay CommissionRail Movement (Cost PlanningiRailway PlanningRailway StoresSafety and CoachingSecuritySignalling & TelecommunicationStatistics & EconomicsTraffic CommercialTraffic Transportation
ADVISERS (2)
Economic AdviserLegal Adviser
May 1975
World Bank-9795


졈