world bank documentdocuments.worldbank.org/curated/en/... · report no. 89182-tj. tajikistan....
TRANSCRIPT
Policy Note No. 3Review of PublicExpenditures onEducation
TajikistanPolicy Notes onPublic Expenditures
Pub
lic D
iscl
osur
e A
utho
rized
Pub
lic D
iscl
osur
e A
utho
rized
Pub
lic D
iscl
osur
e A
utho
rized
Pub
lic D
iscl
osur
e A
utho
rized
Pub
lic D
iscl
osur
e A
utho
rized
Pub
lic D
iscl
osur
e A
utho
rized
Pub
lic D
iscl
osur
e A
utho
rized
Pub
lic D
iscl
osur
e A
utho
rized

Report No. 89182-TJ
TajikistanPolicy Notes on Public Expenditures
Policy Note No. 3Review of Public Expenditures on Education
August 2013
Poverty Reduction and Economic Management UnitEurope and Central Asia Region
REPUBLIC OF TAJIKISTANGovernment Fiscal Year: January–December
Currency Equivalents(Exchange rate as of August 1, 2013)
Currency Unit = Tajikistan SomoniUSD 1.00 = TJS 4.7679TJS 1.00 = USD 0.2097
Weights and MeasuresMetric System
Abbreviations and Acronyms
ECA Europe and Central Asia PER Public Expenditure ReviewEGRA Early Grade Reading Assessment PIP PTU Public Investment Program
Primary Professional Technical Education SchoolsELC Early Learning Center R&D Research and Development
EMIS Education Management and Information System SABER Systems Approach to Better Education ResultsGBAO Gorno-Badahshan Autonomous Oblast STR Student Teacher Ratio
GDP Gross Domestic Product TJS Tajik SomoniGER Gross Enrollment Rate TLSS Tajikistan Living Standards SurveyGPE Global Partnership for Education TPE Total public expenditureHOI Human Opportunity Index UN United Nations
ISCED International Standard Classification of Education UNICEF United Nations Children’s FundMICS Multiple Indicator Cluster Survey USAID United States Agency for International DevelopmentMOE Ministry of Education USD US Dollar
OECD Organization for Economic Cooperation and Development VET Vocational Education And TrainingPCF Per-capita Financing WDR World Development Report
Vice President Philippe Le HouérouCountry Director Saroj Kumar Jha
Country Manager Marsha M. OliveSector Director Yvonne M. Tsikata
Sector Manager Ivailo V. IzvorskiSector Coordinator Francisco Galrao CarneiroTask Team Leaders Marina Bakanova and Ilyas Sarsenov
Principal Author Sachiko Kataoka
Tajikistan Policy Notes on Public Expenditures | August 2013
iv │
Contents
Abbreviations and Acronyms iv
Preface ix
1. Main Messages 1
2. Educational System in Tajikistan: Structure and Outcomes 4A. The Structure of the Educational System 4B. Enrollment Trends: Access and Equity 4C. Quality of Education 8
3. Public Spending on Education 10A. Size, Composition and Trends in Public Spending on Education 10B. Per student spending by level of education 12
4. General Education Financing 14A. History of Per Capita Financing (PCF) in Tajikistan 14B. Sub-national Variation in Education Expenditures 15C. Teacher Wages 17
5. Demographic Trends and the Implications for Public Spending on Education 21A. Enrollment Projections 21B. Scenarios for Recurrent Expenditures 22C. Scenarios for Capital Investment 23D. Feasibility of Extending General Secondary Education to 12 Years 24E. Fiscal Implications of Demographic Developments 25
6. Conclusions 27
Annexes 29
References 33
Contents │ v
Policy Note No. 3: Review of Public Expenditures on Education

List of Figures
Figure 1. Educational System in Tajikistan 4Figure 2. Enrollment Trends by Subsector, 1991–2011 6Figure 3. Enrollment by Gender and by Level of Education, 2001–2011 7Figure 4. Number of Graduates by Type of Post-basic Education, 1991/92–2011/12 7Figure 5. Public Expenditure on Education in Selected ECA and Other Comparator Countries 11Figure 6a. Public Expenditure on Education Correlate With the Size of the Budget, 2009 11Figure 6b. Countries with a Large Proportion of Young Population Tend to Spend a Higher Percentage of Total
Public Expenditure on Education, 2009 11Figure 7. Public Education Expenditure by Education Subsector and Expenditure Category, percent of GDP,
2007–2011 12Figure 8. Minimum Standards (norms) for Per Pupil and Per School, 2008–2013 14Figure 9. Maximum and Minimum STRs by Oblast and Rayon, 2007/2008–2011/2012 16Figure 10. Per Student Unit Cost and Wage Bill Vary Among Oblasts, but Without a Clear Correlation 17Figure 11. STRs Correlate with Elevation and Population Density, But there are Intra-Oblast Variations
Among Rayons with Similar Conditions 17Figure 12. Teacher Salaries Have Considerably Increased in Real Terms During the Last Few Years 18Figure 13. School Age Population by Level of Education and Average Number of Children Per Age Cohort 21Figure 14. Population and Enrollment Projections by Level of Education and Different Enrollment Rates 22Annex Figure 2.1. Projected Number of Births per Year 32
Tajikistan Policy Notes on Public Expenditures | August 2013
vi │ Contents
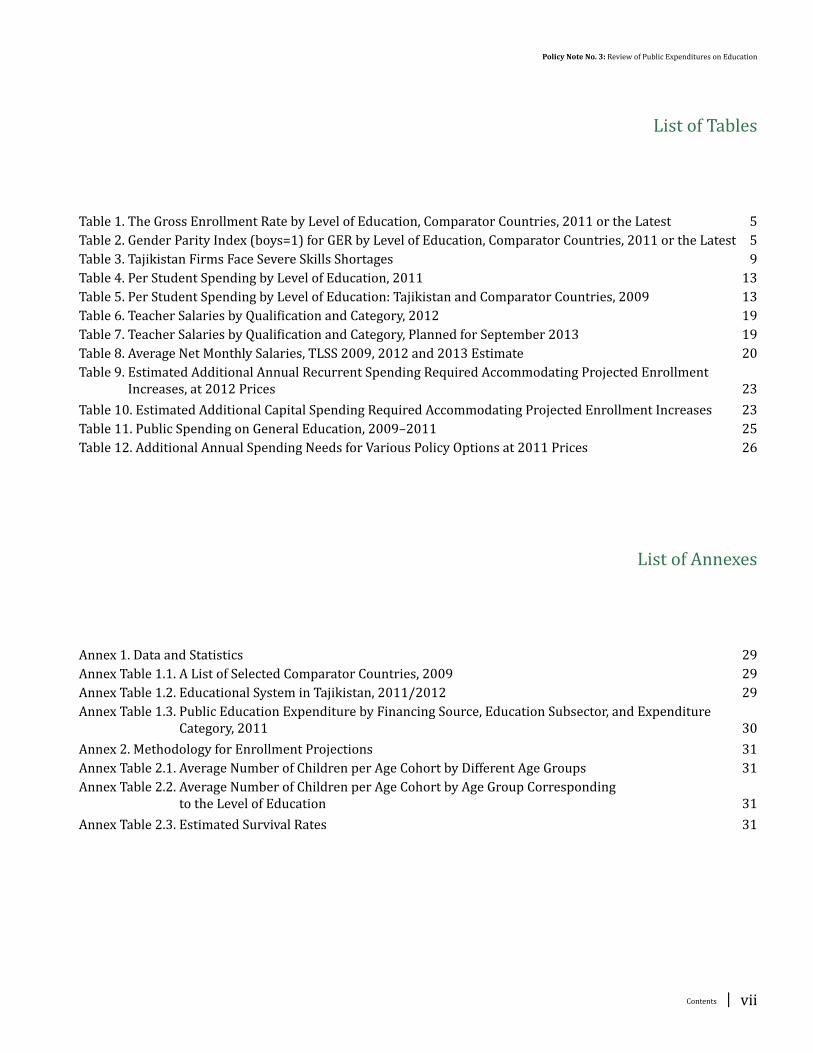
List of Tables
Table 1. The Gross Enrollment Rate by Level of Education, Comparator Countries, 2011 or the Latest 5Table 2. Gender Parity Index (boys=1) for GER by Level of Education, Comparator Countries, 2011 or the Latest 5Table 3. Tajikistan Firms Face Severe Skills Shortages 9Table 4. Per Student Spending by Level of Education, 2011 13Table 5. Per Student Spending by Level of Education: Tajikistan and Comparator Countries, 2009 13Table 6. Teacher Salaries by Qualification and Category, 2012 19Table 7. Teacher Salaries by Qualification and Category, Planned for September 2013 19Table 8. Average Net Monthly Salaries, TLSS 2009, 2012 and 2013 Estimate 20Table 9. Estimated Additional Annual Recurrent Spending Required Accommodating Projected Enrollment
Increases, at 2012 Prices 23Table 10. Estimated Additional Capital Spending Required Accommodating Projected Enrollment Increases 23Table 11. Public Spending on General Education, 2009–2011 25Table 12. Additional Annual Spending Needs for Various Policy Options at 2011 Prices 26
List of Annexes
Annex 1. Data and Statistics 29Annex Table 1.1. A List of Selected Comparator Countries, 2009 29Annex Table 1.2. Educational System in Tajikistan, 2011/2012 29Annex Table 1.3. Public Education Expenditure by Financing Source, Education Subsector, and Expenditure
Category, 2011 30Annex 2. Methodology for Enrollment Projections 31Annex Table 2.1. Average Number of Children per Age Cohort by Different Age Groups 31Annex Table 2.2. Average Number of Children per Age Cohort by Age Group Corresponding
to the Level of Education 31Annex Table 2.3. Estimated Survival Rates 31
Contents │ vii
Policy Note No. 3: Review of Public Expenditures on Education


Preface
This policy note is part of the World Bank’s Programmatic Public Expenditure Review (PER) work program for FY2012–13. It aims to provide the Government of Tajikistan with recommendations to strengthen budgetary processes and analysis. The work is led by Marina Bakanova (TTL, ECSP1), Ilyas Sarsenov (co-TTL, ECSP1) and Salman Zaidi (TTL in FY2012, SASEP).
The work is being carried out in close collaboration with a counterpart Government of Tajikistan team led by the Ministry of Finance, which includes staff from the Ministries of Education and Healthcare, the state-owned enterprise monitoring unit in the Ministry of Finance, and Barki Tajik. An initial consultation on the proposed scope of work was held with the Ministry of Finance in late 2011.
This policy note has been prepared by a Bank team, including Sachiko Kataoka (principal author, ECSH2), Igor Kheyfets (Economist, ECSH2) and Lucas Gortazar (Junior Professional Associate, ECSH2). Saodat Bazarova (Sr. Operations Officer, ECSH2) and Ayshe Muratova (Program Assistant, ECCTJ) provided support to the team.
The peer reviewers were Chiara Bronchi (Lead Public Sector Specialist, AFTP5), Ekaterina Vostroknutova (Senior Economist, LCSPE), and Dina Abu-Ghaida (Senior Economist, MNSHE). The team benefited from the guidance and advice of Ivailo V. Izvorski (Sector Manager, ECSP1), Francisco Galrao Carneiro (Lead Economist and Country Sector Coordinator, ECSP1), Marsha M. Olive (Country Manager, ECCTJ), and Alberto Rodriguez (Sector Manager, ECSH2). This note also benefited from comments that colleagues from the World Bank and the International Monetary Fund (IMF) made in internal presentations and informal discussions, including comments received at several review stages.
This policy note examines public expenditures on education in Tajikistan, focusing on assessing efficiency and equity of general education spending. The Note is structured as follows. Section 2 reviews the characteristics of Tajikistan’s educational system, including access and equity in enrollment and quality of education. Section 3 analyzes overall public spending on education and a breakdown by financing source, subsector, and expenditure category, as well as unit costs by level of education. Section 4 examines general education financing—the largest spending unit within the education sector—in more depth. Section 5 covers demographic trends and enrollment projections and their implications on education spending. Section 6 provides brief conclusions.
Preface │ ix
Policy Note No. 3: Review of Public Expenditures on Education


1. Main Messages
Public spending on education has increased in recent years to just above 4 percent of GDP, broadly in line with the level in countries at a similar level of economic development and demographic structure. However, as Tajikistan maintains a relatively large education system with high completion and enrollment rates at all levels after preschool, per pupil spending remains relatively low. Furthermore, the education sector still faces many challenges, including low pre-school enrollment, gender disparity beyond lower secondary education, poor learning outcomes, cost-ineffective primary vocational education, and inequitable access to higher education. Demographic developments are projected to put an additional upward pressure on the sector financing during the next decade, including for additional capital investments. As the introduction of per capita financing of general education resulted in the increased efficiency of public spending on this education sub-sector; most of the efficiency gains are expected to be derived from the other sub-sectors, which are relatively small. The largest source of an increased fiscal space for education is expected from sound macroeconomic policies and accelerated structural reforms that would support high economic growth and increased government revenues and, in turn, make it affordable to invest more in education in response to the projected demographic trends and reforms needed for quality improvements. A continued reform of the whole education system is needed to be able to deliver the skills required to the country to grow and develop at a high pace.
1. Public spending on education rose steadily from 2.3 percent of GDP in 2000 to 4.2 percent in 2012. The current level is comparable to that in countries with similar level of development and is in line with Tajikistan’s overall size of the budget and demographic structure.
2. Further increase in the education expenditures is envisaged in the Government Programs. As stated in the National Education Development Strategy Up To 2020, the government aims to increase education spending to six percent of GDP by 2015 and not less than seven percent of GDP by 2020. Such increases will lift Tajikistan’s education outlays to well above most countries in ECA. They will compare with the 4 percent of GDP Korea and Singapore spent during their takeoffs in the 1980s and 1970s.
3. While there is room to increase education spending, several issues have to be considered. One is the need to sustain effective cost control to ensure taxpayers receive the highest value for money. There are potential areas for efficiency and equity gains in spending within the education sector, in particular, in pre-school and tertiary education, which must be addressed before additional outlays are authorized. Second is the need to consider spending on education within the overall government budget envelope to identify priority policy interventions and assess their efficiency and costs.
4. Tajikistan lags behind comparator countries at a similar level of economic development in pre-primary enrollment and gender parity. In comparison with selected comparator countries at a similar level of economic development, Tajikistan’s gross enrollment rates (GERs) are high throughout the education levels, except the pre-primary GER which is one of the lowest. At the extremely low pre-school enrollment rate, most children in Tajikistan do not have an opportunity to attain a certain set of emotional, behavioral, and cognitive skills needed to learn,
1. Main Messages │ 1
Policy Note No. 3: Review of Public Expenditures on Education

work, and function successfully in school before entering primary school. The gender disparity sharply widens after lower secondary, limiting educational opportunities for females.
5. The quality of early learning at preprimary and primary levels is low. At present, Tajikistan does not utilize national student assessments to collect data on student learning outcomes. However, available evidence suggests poor quality of early learning. At the primary level, 30 percent of girls and 31 percent of boys in grade 2 did not meet the national standards for reading fluency, rising to 45 percent and 56 percent, respectively, in grade 4. One of the contributing factors for the poor performance is likely to include the short official hours of instruction combined with heavy learning loads for students.
6. The introduction of per capita financing (PCF) has led to a number of positive outcomes. They include: more equitable and efficient distribution of resources, increased budget autonomy at school level, and greater transparency and community involvement in school planning and budgeting. Between 2007/08 and 2011/12, the student teacher ratio increased from 17.0 to 18.0 nationwide on average. Over the same period, the share of personnel costs in local governments’ education expenditures fell from 86.8 percent to 75.9 percent, freeing resources for improving the quality of education. In terms of equity, whereas in 2010 only 82 percent of all general secondary schools had an approved budget in line with the formula-based budget, in 2011 95 percent of schools had a PCF-compliant budget.
7. The current wage system does not provide strong incentives for highly qualified new teachers to enter and remain in the profession. The government has considerably raised salaries for general education teachers in recent years: by 30 percent in September 2011 and by another 60 percent a year later. However, the relatively low entry level salaries compared to experienced teachers and the existing promotion system that is largely based on seniority are not conducive to attract and retain high quality new teachers. Furthermore, a systemic and transparent performance evaluation mechanism is still missing in defining wage categories. The focus on salaries for general education teachers has also created imbalances with teachers in other subsectors.
8. Current financing model of higher education is inequitable, non-transparent, and ineffective. It is expected that an introduction of the unified university entrance examination in 2014 will help improve transparency in the current system of “merit-based” financing of rigidly defined state-funded places and presidential quotas for the disadvantaged. Taking this opportunity, higher education financing needs a fundamental reform, including liberalization of the state-funded places, improvement of needs-based financing, and an introduction of performance-based and/or competitive financing for institutions. Moreover, opening up higher education to the private sector should be considered not only to reduce financing burden on the government, but also to diversify and improve the quality of higher education in more competitive environment.
9. Demographic developments put an additional pressure on the education budget. To accommodate the projected increase in general education enrollment, the recurrent budget needs to be increased by 1.2 percent annually in real terms. Capital investment needs will also increase—both for the construction of new schools/classrooms and for renovation of existing schools/classrooms.
10. Policy recommendations focus on seven areas: addressing demographic challenges, pre-school expansion, curriculum reform and student assessments, wage reform, monitoring of per capita financing (PCF), addressing early dropouts and gender disparity, and higher education financing.
Tajikistan Policy Notes on Public Expenditures | August 2013
2 │ 1. Main Messages
y Explore most cost effective models for school construction and rehabilitation as capital investment needs are massive in the foreseeable future.
y Expand pre-school education, while carefully considering the efficiency and effectiveness of different models.
y Reform the curriculum to strengthen foundational skills at primary level and increase actual hours of instruction.
y Introduce national and international assessments of student learning throughout the pre-university system, which would provide crucial information to analyze efficiency and effectiveness of public spending.
y Reform wage system for the entire education sector to provide incentives to enter into the profession and remain in it. Any wage increase should be done in a fiscally sustainable way without crowding out other essential expenditures.
y Strengthen the monitoring function of rayon government to ensure efficient implementation of PCF at school level. Simultaneously, improve the PCF formula to accommodate different geographical needs and other factors.
y Address early dropouts and gender disparity through the development of supply and demand-side interventions.
y Comprehensively review the existing higher education financing mechanism as a part of a wider higher education reform.
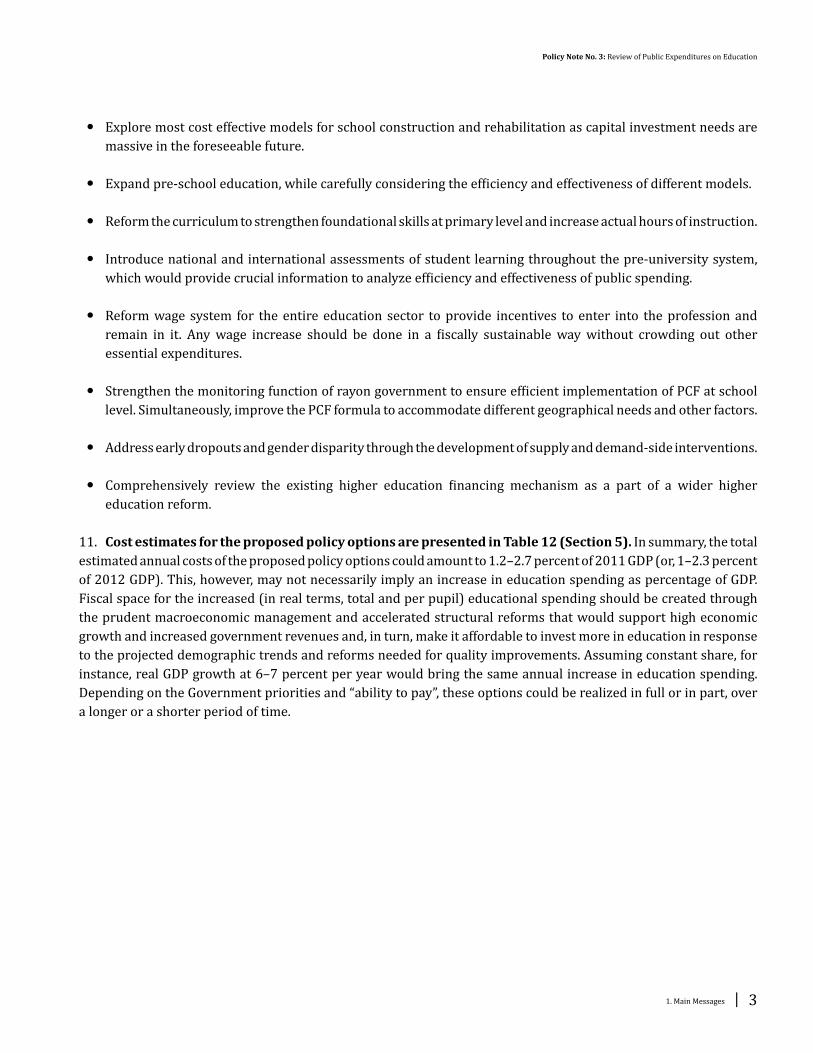
11. Cost estimates for the proposed policy options are presented in Table 12 (Section 5). In summary, the total estimated annual costs of the proposed policy options could amount to 1.2–2.7 percent of 2011 GDP (or, 1–2.3 percent of 2012 GDP). This, however, may not necessarily imply an increase in education spending as percentage of GDP. Fiscal space for the increased (in real terms, total and per pupil) educational spending should be created through the prudent macroeconomic management and accelerated structural reforms that would support high economic growth and increased government revenues and, in turn, make it affordable to invest more in education in response to the projected demographic trends and reforms needed for quality improvements. Assuming constant share, for instance, real GDP growth at 6–7 percent per year would bring the same annual increase in education spending. Depending on the Government priorities and “ability to pay”, these options could be realized in full or in part, over a longer or a shorter period of time.
1. Main Messages │ 3
Policy Note No. 3: Review of Public Expenditures on Education

2. Educational System in Tajikistan: Structure and Outcomes
A. The Structure of the Educational System
12. The educational system in Tajikistan is dominated by general secondary education establishments. It includes three to four years of pre-school, 11 years of general education (compulsory basic education (grades 1–9), and non-compulsory upper secondary education (grades 10–11)), one to four years of primary and secondary vocational education and training (VET), and higher education (Figure 1). In total, just over 2 million students or almost one-quarter of the total population are enrolled in the entire educational system in Tajikistan, 85 percent of whom are enrolled in general education.
B. Enrollment Trends: Access and Equity
13. While overall enrollment rates are relatively high at upper levels, Tajikistan lags behind comparator countries at a similar level of economic development in pre-primary enrollment and gender parity. Tajikistan’s gross enrollment rates (GERs) are high throughout the education levels, except the pre-primary GER (Table 1). For gender parity of the GER, Tajikistan is on par with comparator countries from primary to lower secondary education, but low at the pre-primary level, and sharply drops at the upper secondary and tertiary levels (Table 2).
Figure 1. Educational System in TajikistanAge Grades
. .
Higher education
Ph.DDoes PhD belong to higher education?
. .
. .23 XVII Master22 XVI21 XV
Bachelor20 XIV Secondary VET
Specialized secondary education
19 XIII Primary VET (former PTUs)
Secondary VET Specialized secondary education
18 XIIPrimary VET
(former PTUs)17 XI
General secondary education
High school Upper secondary16 X15 IX
Basic education
Lower secondary14 VIII13 VII12 VI11 V10 IV
Primary9 III8 II7 I
Sources: ETF, 2010, Torino Process 2010: Republic of Tajikistan, and modified based on government resolution #388 on National Standards on Primary Vocational Education, August 2, 2010.
Tajikistan Policy Notes on Public Expenditures | August 2013
4 │ 2. Educational System in Tajikistan: Structure and Outcomes

Table 1. The Gross Enrollment Rate by Level of Education, Comparator Countries, 2011 or the LatestGER
Pre-PrimaryGER
PrimaryGER Lower
sec. All ProgramsGER Upper
sec. All ProgramsGER. Tertiary
(ISCED 5 and 6)
Cote d’Ivoire 4.4 88.0 n.a. n.a. 8.28Senegal 14.1 86.2 41.0 17.4 7.92Nepal n.a. n.a. 67.2 24.2 7.26Low income 15.1 105.4 52.6 29.0 7.41Lao PDR 23.6 126.0 57.1 31.1 17.67Cameroon 30.0 119.4 63.7 34.3 12.45Bangladesh 13.4 95.1 66.3 39.9 10.59Kenya 51.8 113.3 90.9 43.8 4.03Gambia, The 30.4 80.5 62.3 44.7 4.12Lower middle income 45.2 104.2 75.9 48.2 18.25Tajikistan 8.7 100.5 97.8 65.1 18.74Kyrgyz Republic 20.8 100.9 92.6 78.1 41.35
Source: World Bank EdStats.
Table 2. Gender Parity Index (boys=1) for GER by Level of Education, Comparator Countries, 2011 or the LatestGER
Pre-primaryGER
PrimaryPrimary
completion rateGER Lower
sec. All programsGER Upper
sec. All programsGER. Tertiary
(ISCED 5 and 6)
Cote d’Ivoire 1.00 0.83 0.80 n.a. n.a. 0.52Senegal 1.14 1.07 1.06 0.83 0.68 0.60Tajikistan 0.84 0.96 0.96 0.93 0.70 0.41Low income 1.00 0.95 0.93 0.90 0.79 0.64Cameroon 1.03 0.87 0.86 0.86 0.80 0.74Lao PDR 1.06 0.94 0.94 0.86 0.83 0.74Gambia, The 1.04 1.03 1.03 1.04 0.85 0.22Nepal n.a. n.a. n.a. 0.89 0.87 0.60Kenya 0.99 0.98 0.98 0.93 0.87 0.70Lower middle income 1.01 0.97 0.96 0.94 0.90 0.84Bangladesh 0.99 n.a. 1.09 1.25 0.99 0.61Kyrgyz Republic 1.00 0.99 0.99 1.00 1.00 1.24
Source: World Bank EdStats.
14. A low level of pre-school enrollment affects school readiness for the majority of young children. Pre-school enrollments sharply dropped throughout the 1990s and have not increased much since the lowest level in 1999 (Figure 2). As a result, current pre-school enrollment is only one-half of that in 1991 and the net enrollment rate for pre-school (ages 3–6) is only 8.9 percent—the lowest rate in the region—with some gender disparity (Figure 3).1 In 2010/11, 84 percent of pre-schools were provided in urban areas, while only 16 percent in rural areas. The enrollment rate was 29 percent among the wealthiest income quintile, while one percent among the poorest in 2005.2 At the extremely low pre-school enrollment rate, most children in Tajikistan do not have an opportunity to attain a certain set of emotional, behavioral, and cognitive skills needed to learn, work, and function successfully in school before entering primary school.
1 World Bank, forthcoming, SABER-Early Childhood Development Country Report: Republic of Tajikistan.2 The Multiple Indicator Cluster Survey (MICS) 2005. The Multiple Indicator Cluster Survey (MICS) 2005.
2. Educational System in Tajikistan: Structure and Outcomes │ 5
Policy Note No. 3: Review of Public Expenditures on Education

15. Access to pre-school is influenced by multiple circumstances. According to a Tajikistan Living Standards Survey (TLSS) 2007, the most common reason for non-enrollment was unavailability of pre-school facilities (52 percent), while 27 percent of parents preferred to keep their children at home and 11 percent felt that their children were too young to attend pre-school.3 In order to increase pre-school enrollments, the government, in collaboration with development partners, has developed alternative low-cost preschool models and started setting up early learning centers (ELCs), although its coverage is still very limited.
16. Despite the relatively high general education enrollment rate, the gender disparity becomes evident by upper secondary grades. General education enrollments (grades 1–11) steadily and sizably increased between 1993 and 2003, and the growth rate dropped after 2003 with a slight decrease in total enrollments in some years. Enrollment and completion of the primary cycle are near universal with gender parity. The completion rate in grade 9 (the last year of compulsory basic education) is more than 90 percent, but with gender disparity at 92 percent for boys and 88 percent for girls. The dropout rate for girls increases toward the end of the basic education cycle—0.9 percent for grade 7, 6.7 percent for grade 8, and 13.8 percent for grade 9.4 The gross enrollment rate for general upper secondary education as a percentage of population aged 16–17 is 59 percent with a gender ratio of 57:43 (boys:girls), and that for all upper secondary education programs, including both general and VET, is 65 percent with a 60:40 gender ratio.5
17. While fewer students graduate from primary VET, secondary VET enrollment and completion have gradually increased during the last 10 years. There are two levels of vocational education and training (VET) in Tajikistan. The main differences between primary and secondary VET are entry age and duration as well as the type of diploma.6 In general, primary VET (PTUs) has become a less preferred path for post-basic education compared
3 As cited in UNICEF, 2012, Global Initiative on Out-of-School Children: Tajikistan Country Study.4 UNICEF, 2012, Global Initiative on Out-of-School Children: Tajikistan Country Study.5 Source: TransMonee 2012.6 Students who have completed 9-year compulsory basic education can access primary VET offered at vocational education schools. The standard
duration of primary VET is 3 years after basic education (including a certificate for general secondary education) or 1–2 years (excluding a certificate for general secondary education). In contrast, students who have completed 11-year general secondary education may proceed to primary VET for a slightly shorter periods or specialized secondary (technical) education schools (colleges, technical schools and trade schools) for 1–3 years.
Figure 2. Enrollment Trends by Subsector, 1991–2011thousands thousands
1,800
1,700
1,600
1,500
1,400
1,300
1,200
1,100
1,000
1999199719951993 2001 2003 2005 2007 2009 2011
1,688 1,693 1,703
180
160
140
120
100
80
60
40
20
0
19991997199519931991 2001 2003 2005 2007 2009 2011
152
68
40
24
78
52
142
▬▬ General education ▬▬ HEIs ▬▬ Preschool ▬▬ Secondary VET ▬▬ Primary VET
Source: TajStat, http://www.stat.tj/en/database/socio-demographic-sector/ (extracted on January 23, 2013).Note: Linear interpolations for a few missing values.
Tajikistan Policy Notes on Public Expenditures | August 2013
6 │ 2. Educational System in Tajikistan: Structure and Outcomes
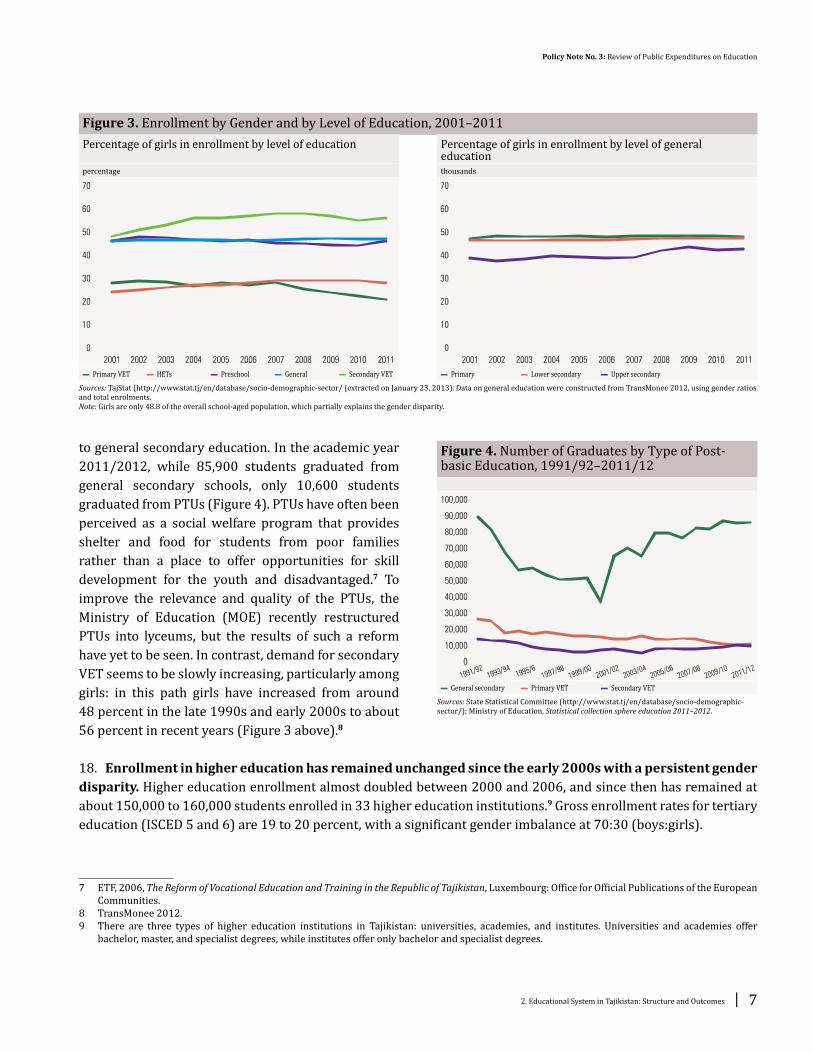
to general secondary education. In the academic year 2011/2012, while 85,900 students graduated from general secondary schools, only 10,600 students graduated from PTUs (Figure 4). PTUs have often been perceived as a social welfare program that provides shelter and food for students from poor families rather than a place to offer opportunities for skill development for the youth and disadvantaged.7 To improve the relevance and quality of the PTUs, the Ministry of Education (MOE) recently restructured PTUs into lyceums, but the results of such a reform have yet to be seen. In contrast, demand for secondary VET seems to be slowly increasing, particularly among girls: in this path girls have increased from around 48 percent in the late 1990s and early 2000s to about 56 percent in recent years (Figure 3 above).8
18. Enrollment in higher education has remained unchanged since the early 2000s with a persistent gender disparity. Higher education enrollment almost doubled between 2000 and 2006, and since then has remained at about 150,000 to 160,000 students enrolled in 33 higher education institutions.9 Gross enrollment rates for tertiary education (ISCED 5 and 6) are 19 to 20 percent, with a significant gender imbalance at 70:30 (boys:girls).
7 ETF, 2006, The Reform of Vocational Education and Training in the Republic of Tajikistan, Luxembourg: Office for Official Publications of the European Communities.
8 TransMonee 2012.9 There are three types of higher education institutions in Tajikistan: universities, academies, and institutes. Universities and academies offer
bachelor, master, and specialist degrees, while institutes offer only bachelor and specialist degrees.
Figure 3. Enrollment by Gender and by Level of Education, 2001–2011Percentage of girls in enrollment by level of education Percentage of girls in enrollment by level of general
educationpercentage thousands
70
60
50
40
30
20
10
0
2001 2002 2003 2004 2005 2006 2007 2008 2009 2010 2011
70
60
50
40
30
20
10
0
2001 2002 2003 2004 2005 2006 2007 2008 2009 2010 2011
▬▬ Primary VET ▬▬ HETs ▬▬ Preschool ▬▬ General ▬▬ Secondary VET ▬▬ Primary ▬▬ Lower secondary ▬▬ Upper secondary
Sources: TajStat (http://www.stat.tj/en/database/socio-demographic-sector/ (extracted on January 23, 2013). Data on general education were constructed from TransMonee 2012, using gender ratios and total enrolments.Note: Girls are only 48.8 of the overall school-aged population, which partially explains the gender disparity.
Figure 4. Number of Graduates by Type of Post-basic Education, 1991/92–2011/12
100,000
90,000
80,000
70,000
60,000
50,000
40,000
30,000
20,000
10,000
0
1991/921993/94
1995/61997/98
1999/002001/02
2003/042005/06
2007/082009/10
2011/12
▬▬ General secondary ▬▬ Primary VET ▬▬ Secondary VET
Sources: State Statistical Committee (http://www.stat.tj/en/database/socio-demographic-sector/); Ministry of Education, Statistical collection sphere education 2011–2012.
2. Educational System in Tajikistan: Structure and Outcomes │ 7
Policy Note No. 3: Review of Public Expenditures on Education

19. Circumstances render educational opportunities inequitable in Tajikistan.10 An analysis of the Tajikistan Living Standards Survey (TLSS) 2003, 2007, and 2009 addresses inequality in accessing education by adopting the concept of “Human Opportunity Index (HOI)”.11 The HOI takes into account “circumstances”—such as economic status, gender, parental education, and ethnicity—factors, for which individuals have no control and children are born into—when analyzing inequity in access to a particular opportunity. The study identified three factors that contribute the most to overall inequality in education opportunities in Tajikistan: (i) education of the household head, (ii) overall economic status of the household (consumption), and (iii) region (oblast) in which the child resides. Interestingly, the most important influence varies by kind of opportunity. For example, the geographical location is more prominent for completion of primary and basic education, education of the household head appears most important for pre-school attendance, gender of the child contributes to inequality in school attendance, and economic status of the household is thought to have the most influence on reading and writing ability.
C. Quality of Education
20. Available evidence suggests that the quality of pre-school and primary education can be significantly improved. Tajikistan currently does not systemically conduct national student assessments or participate in international assessments. A recent assessment of reading abilities among a sample of primary grade children—Early Grade Reading Assessment (EGRA) 2011—addressed a concern about the quality and effectiveness of pre-school and primary education.12 It found that those who had attended preschool (state kindergartens only) performed significantly better only on one indicator—unfamiliar word reading—compared to those who had not. Hence, not only do few children attend pre-school, the benefits of attending pre-school might be limited without assuring quality. At the primary level, 30 percent of girls and 31 percent of boys in grade 2 did not meet the national standards for reading fluency, rising to 45 percent and 56 percent, respectively, in grade 4.
21. The quality of education is affected by low hours of instructions. There are 5,632 hours of required instruction for students aged 7–15 years, which is 17 percent fewer than the Russian Federation (6,747 hours) and 24 percent fewer than OECD countries on average (7,384 hours). In addition, most schools operate in double-shifts (let alone three-shifts schools) and may not be able to offer the official hours of instruction in full.
22. Within the fewer hours of instruction, Tajik students are expected to learn many languages and subjects. In grade 2, students start a second language (Russian for Tajik-speaking children and vice versa); in grade 3, they start a third language (often English); and in grade four, Tajik mother-tongue students learn a third, Persian script. In contrast, no OECD country (not even those that are multilingual) imposes a mandatory third language by the third
10 This paragraph and the ones on private spending heavily rely on findings from Abras, A., et al., 2012, The State of Human Opportunities for Children in Tajikistan, The World Bank.
11 The World Bank’s World Development Report 2013 applied the concept of the Human Opportunity Index (HOI) to measuring the level of inequality of job opportunities among countries in the ECA region. The inequality in the opportunity to work—defined as having a job of 20 or more hours per week and attributed to differences in circumstances at birth (including gender, ethnicity, and parental educational attainment and political affiliation) or to the individual’s attributes (including educational attainment and age). In Tajikistan, “circumstances” contribute considerably to the inequality of opportunity to work (see WDR 2013 Box 4.7 for details).
12 Tvaruzkova, M. and Shamatov, D., 2011. Review of Early Grade Teaching and Skills. The Kyrgyz Republic and Tajikistan. Final Report. USAID: Bishkek and Dushanbe.
Tajikistan Policy Notes on Public Expenditures | August 2013
8 │ 2. Educational System in Tajikistan: Structure and Outcomes

grade. At the lower secondary level, students are assigned a large number of courses without electives; students are expected to take 17–18 courses in each of grades 8 and 9. In contrast, OECD countries require nine to13 subjects at the lower secondary level.13
23. Despite the heavy curriculum, Tajikistan’s education and training system is unable to provide the skills needed for the economy. According to the Enterprise Surveys 2008, 34 percent of firms identify an inadequately educated workforce as a major constraint. These numbers are much higher than those for ECA and world averages as well as the share of unskilled workers (Table 3). Part of the reason for the skills shortage is because the education and training system provides limited formal training opportunities: only 22 percent of workers have received formal training. In addition, only one-fifth of firms provide formal training to fill the skills gap.
Table 3. Tajikistan Firms Face Severe Skills ShortagesPercent of firms
offering formal trainingPercent of workers
offered formal training Percent of unskilled workers
(out of all production workers) Percent of firms identifying
an inadequately educated workforce as a major constraint
Tajikistan 21.1 21.7 40.8 34.2World 35.1 47.2 31.0 26.9ECA 33.7 34.2 24.6 29.5
Source: World Bank and International Finance Corporation, 2008, Enterprise Surveys: Tajikistan Country Profile 2008.
13 World Bank, 2013, Project Appraisal Document for the Fourth Global Partnership for Education Fund Grant (GPE-4), March 4, 2013 version. World Bank, 2013, Project Appraisal Document for the Fourth Global Partnership for Education Fund Grant (GPE-4), March 4, 2013 version.
2. Educational System in Tajikistan: Structure and Outcomes │ 9
Policy Note No. 3: Review of Public Expenditures on Education

3. Public Spending on Education
A. Size, Composition and Trends in Public Spending on Education
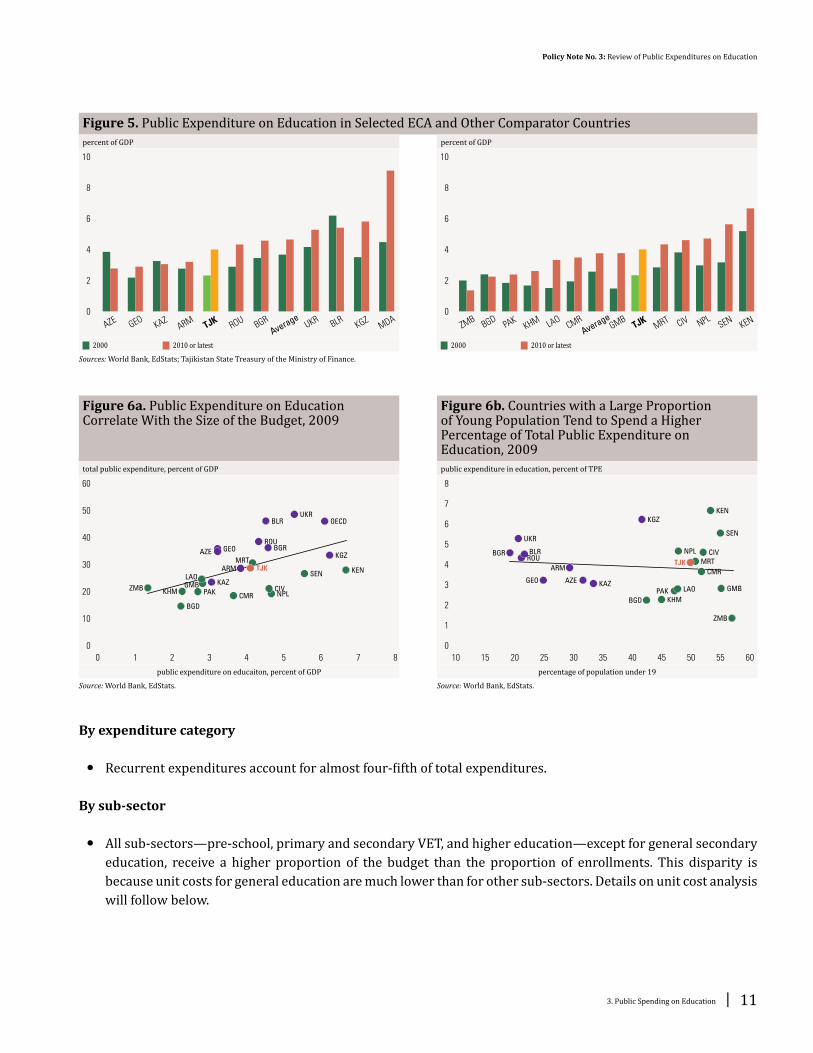
24. Public spending on education has grown steadily in real terms since the mid-2000s to the level, comparable to other countries at a similar level of development. Government spending on education sharply dropped after independence and the subsequent civil war but it started to increase gradually since the early 2000s. As a share of GDP, public spending on education increased from 2.3 percent in 2000 to 4.2 percent in 2009 and remained at approximately this level with a slight decline in 2010–2012. This is still below the ECA average (4.8 percent of GDP) but just about the average among the countries at a similar level of economic development and demographic compositions (Figure 5).14 This level is also in line with the size of the budget and the demographic composition of the country (Figure 6a and Figure 6b).
25. The structure of education financing in Tajikistan could be described as follows:
By financing source:15
y Overall, 69 percent of educational expenditures (or 73 percent when extra-budgetary funds and donor funds are excluded) is decentralized to local governments.16 Eighty-four percent of recurrent expenditures and 35 percent of capital expenditures are executed at the local government level.
y Capital expenditures for general education financing are mostly centralized. Out of TJS 125 million of the republican budget for general education, TJS 109 million (or, over 87 percent) was allocated to capital investment, while only TJS 53 million out of TJS 699 million (or, less than 8 percent) of the local governments’ budget for general education was allocated to capital investment.
y Pre-school is exclusively financed by local governments, while PTU and higher education is almost exclusively financed by the republican government. In contrast, secondary professional education is evenly financed by local and republican governments.
y Donor funding that flows through the public investment program (PIP) is only 3 percent of the total education budget. It should be noted, however, that most other donor funding is likely to be off-budget, for which data are not available.
14 Excluding extra-budgetary funds and donor-funded public investment programs (PIP).15 The rest of the data are 2011 data as the last year BOOST database is compiled.16 The sub-national region/oblast level administrative units consists of Gorno-Badakhshan Autonomous Province (GBAO), two oblasts (Khatlon and
Sughd), the Districts of Republican Subordination (RRS), and the capital city of Dushanbe. Below the oblast-level administrative units consists of towns, rayons (rural districts), and jamoats (subdistricts).
Tajikistan Policy Notes on Public Expenditures | August 2013
10 │ 3. Public Spending on Education
By expenditure category
y Recurrent expenditures account for almost four-fifth of total expenditures.
By sub-sector
y All sub-sectors—pre-school, primary and secondary VET, and higher education—except for general secondary education, receive a higher proportion of the budget than the proportion of enrollments. This disparity is because unit costs for general education are much lower than for other sub-sectors. Details on unit cost analysis will follow below.
Figure 5. Public Expenditure on Education in Selected ECA and Other Comparator Countriespercent of GDP percent of GDP
10
8
6
4
2
0
AZEGEO
KAZARM
TJKROU
BGR
Average
UKRBLR
KGZMDA
10
8
6
4
2
0
ZMBBGD
PAKKHM LAO
CMR
Average
GMBTJK
MRT CIV NPLSEN
KEN
▬J 2000 ▬J 2010 or latest ▬J 2000 ▬J 2010 or latest
Sources: World Bank, EdStats; Tajikistan State Treasury of the Ministry of Finance.
Figure 6a. Public Expenditure on Education Correlate With the Size of the Budget, 2009
Figure 6b. Countries with a Large Proportion of Young Population Tend to Spend a Higher Percentage of Total Public Expenditure on Education, 2009
total public expenditure, percent of GDP public expenditure in education, percent of TPE
60
50
40
30
20
10
0
0 1 2 43 65 87
BGD
ZMBKHM PAK
GMB
LAO
CMR NPLCIV
MRT
KENSEN
TJK
KGZ
OECDUKR
BLR
GEOAZE
ROUBGR
ARM
KAZ
10 15 20 3025 4035 60555045
BGD
ZMB
KHM
PAK GMBLAO
CMR
NPL CIV
MRT
KEN
SEN
TJK
KGZ
GEO AZE
ARM
KAZ
8
7
6
5
4
3
2
1
0
BLRROU
BGR
UKR
public expenditure on educaiton, percent of GDP percentage of population under 19
Source: World Bank, EdStats. Source: World Bank, EdStats.
3. Public Spending on Education │ 11
Policy Note No. 3: Review of Public Expenditures on Education

B. Per student spending by level of education
26. A unit cost analysis suggests that there is potential to enhance spending efficiency and equity within the education sector. An analysis of the available information about per student spending by level of education in Tajikistan (Table 4) and in OECD and other comparator countries (Table 5) points to several important policy implications for overall educational spending, as well as sub-sector allocations:
y Pre-school. The unit cost for preschool is typically lower than that for general education (e.g. OECD average is 0.86). Per student spending for pre-school, however, is considerably higher in Tajikistan. The high cost of providing full-day pre-school/daycare services for a small number of children suggests that pre-school financing is highly-subsidized, inefficient, and inequitable. In contrast, the central government does not finance ELCs that are currently financed primarily by communities and parents.
y Primary and secondary VET. VET is typically more expensive than general secondary education, but, unfortunately, no comparison data for the unit cost of vocational education are available. In Tajikistan, both primary and secondary VET are almost twice as expensive as general secondary education. Taking into account the declining demand for and perceived low quality of primary VET, and the slowly increasing demand for secondary VET, a further investigation is needed to assess the overall cost-effectiveness of VET.
y Higher education. When the number of total students in higher education is used to calculate per student spending on higher education, it is only 35 percent higher than that for general secondary education. However, under the current financing model—which is mostly “merit-based” financing of rigidly defined state-funded places and presidential quotas17 for the disadvantaged—this amount is spent only on 40 percent of students,
17 A UNICEF study (2012b) found that many youth suggest that regulation and monitoring of the presidential quota system be improved.
Figure 7. Public Education Expenditure by Education Subsector and Expenditure Category, percent of GDP, 2007–2011(a) As percentage of GDP by sub-sector, 2009–2011 (b) As percentage of GDP by expenditure category, 2007–
20114.5
4.0
3.5
3.0
2.5
2.0
1.5
1.0
0.5
0
2009 2010 2011
0.3
0.4
0.10.1 0.1
2.8
0.2
0.3
0.4
0.20.1 0.1
2.7
0.2
0.3
0.30.2
0.1 0.1
2.7
0.2
4.5
4.0
3.5
3.0
2.5
2.0
1.5
1.0
0.5
0
2007 2008 2009 2010 2011
▬J Pre-primary education ▬J General secondary education ▬J Personal costs ▬J Goods and services ▬J Other recurrent expenditures
▬J Vocational (professional-technical) education ▬J Secondary professional education ▬J Capital expenditures ▬J Unclassified other expenditures
▬J Other secondary education ▬J Higher education ▬J Other/unclassified
Source: Tajikistan BOOST v0.4 government expenditure database.Note: The “unclassified other expenditures” category was dropped and more accurately presented by expenditure category after 2009.
Tajikistan Policy Notes on Public Expenditures | August 2013
12 │ 3. Public Spending on Education

while other students pay tuition that should be considered for a unit cost analysis. Data on tuition paid by self-funded students are not available, so Table 5 shows per student spending based on state-funded students alone, which is more than double general secondary education. In OECD countries, per student spending on tertiary education, including research and development (R&D) activities, is 78 percent higher than general secondary education, but that on tertiary education, excluding R&D activities, is only 21 percent higher than general secondary education. Given that Tajik universities are rarely engaged in R&D, per student spending on tertiary education seems too high. In addition, lack of private universities (there is only one) is a major concern from both financial and diversification points of view. More detailed analysis is necessary to improve the efficiency and equity of higher education financing.
Table 4. Per Student Spending by Level of Education, 2011Level of education Total budget (TJS mil.)
(FY2011)1/No. of students (AY2011/12) 1/
Unit cost (TJS)
Unit cost (US dollars)2/
Ratio (general sec.=1)
Relative to GDP per capita
(percent)
Pre-school 58.9 67,8643/ 867 188 1.79 20.2General secondary 824.6 1,702,313 484 105 1.00 11.2PTUs 22.8 23,857 955 207 1.97 22.2Secondary prof. 37.5 40,095 936 203 1.93 21.7Higher education 99.4 151,207 657 143 1.36 15.3
Of which state-funded 99.4 59,742 1,663 361 3.43 38.6Other spending 140.1 - - - -Total 1,183.4
Sources: Tajikistan BOOST v0.4 government expenditure database; Statistical Agency under President of the Republic of Tajikistan; calculated by World Bank staff. Notes:1/ Budget data are for calendar year, while the student numbers are for academic year (Sept–June). 2/ At an exchange rate TJS 4.61= USD 1. GDP per capita=934.8 USD.3/ The number of students does not include those enrolled in ELCs because they are mostly not government-funded.
Table 5. Per Student Spending by Level of Education: Tajikistan and Comparator Countries, 2009
Ratio (primary = 1)
Preprimary Secondary Tertiary
Tajikistan 1.79 1.00/1.401/ 1.36/3.43Armenia n.a. 1.40 0.43Bulgaria n.a. 1.03 1.06Georgia n.a. 1.05 0.77Moldova n.a. 0.94 1.09Romania n.a. 0.89 1.20Bangladesh n.a. 1.38 3.19Cambodia n.a. 1.01 4.06Senegal n.a. 1.48 0.92OECD avg. 0.86 1.21 1.78Argentina 1.06 1.74 2.03Brazil 0.71 0.93 4.88Indonesia 0.13 0.82 2.16Russian Fed. n.a. 1.00 1.79
Sources: World Bank, EdStats; OECD, Education At A Glance 2012.Note: 1/ The breakdown of unit costs for primary and secondary is based on the normatives for per capita financing formula, as discussed below.
3. Public Spending on Education │ 13
Policy Note No. 3: Review of Public Expenditures on Education

4. General Education Financing
A. History of Per Capita Financing (PCF) in Tajikistan
27. Since 2010, all general secondary schools receive their budgets according to a per capita financing (PCF) formula. In Tajikistan, PCF for general education was first piloted in five cities and rayons in 2005, with budget allocation primarily based on the number of students.18 After successful implementation during the pilot phase, the PCF reform was gradually expanded and adopted nationwide— to all schools in 68 rayons—by 2010. The norms (unit costs) per student and per school have increased considerably over years (Figure 8), and the formula has been revised to better reflect the different needs of schools such as geographic location, type of schools, and multi-language requirements.
28. The introduction of PCF has considerably increased the role of schools and the central government in general education financing but it reduced the role of rayons. Schools prepare their budgets according to the norms and formula set by the Ministries of Finance and Education of the republican government. They then submit them to rayons, which in turn submit an aggregated education budget to their respective oblasts and finally to the Ministry of Finance of the republican government.19 There remains a room for budget negotiations between the different levels of the government, and rayons may also allocate a significant portion of their local budget to education. However, the introduction of PCF has considerably reduced the role rayons in general education financing because the larger part of it is determined by the centrally defined formula. On the other hand, because the formula-
18 Yovon, Kulob, and Vahdat rayons, and the cities of Khorog and Khojand.19 See World Bank, 2012, Tajikistan Public Expenditure Review Interim Report, Box 2 (p. 17) on the local government budget preparation process.
Figure 8. Minimum Standards (norms) for Per Pupil and Per School, 2008–2013per student norm, in TJS per school norm, in TJS
900
800
700
600
500
400
300
200
100
0
2008 2009 2010 2011 2012 2013
100,000
90,000
80,000
70,000
60,000
50,000
40,000
30,000
20,000
10,000
0
2008 2009 2010 2011 2012 2013
▬▬ Primary ▬▬ General ▬▬ Secondary ▬▬ Primary ▬▬ General ▬▬ Secondary
Source: Ministry of Education.
Tajikistan Policy Notes on Public Expenditures | August 2013
14 │ 4. General Education Financing

based budget allocation cannot fully accommodate various factors and needs of schools under different conditions, the PCF model gives rayons the right to reallocate up to five percent of the formula-based allocations from schools with a surplus to those with a deficit. At the school level, schools may flexibly determine their budgets as long as they meet educational requirements and norms for wages.
B. Sub-national Variation in Education Expenditures
29. Overall, the introduction of PCF has led to a more equitable distribution and efficient use of resources, increased budgetary autonomy at the school level, and greater transparency and community involvement in school planning and budgeting. Between 2007/2008 and 2011/2012, the nationwide student-teacher ratio increased from 17.0 to 18.0 on average. Over the same period, the share of personnel costs in local government education expenditures fell from 86.8 percent to 75.9 percent, freeing resources to improve the quality of education. In terms of equity, in 2010 only 82 percent of all general secondary schools had an approved budget in line with the formula-based budget, but in 2011 95 percent of schools had a PCF-compliant budget.20 The switch to PCF provides greater budgetary autonomy for schools and gives them responsibility to manage resources effectively and efficiently, and work closely with communities to plan school development, formulate budgets and monitor expenditures. There has been regular monitoring and evaluation of reform implementation by the Ministry of Education.21 The success of PCF in general education has encouraged the MOE to extend it to other levels of education.
30. A comparison of student-teacher ratios between oblasts and rayons illustrates wide regional variations in terms of efficiency outcomes. Between 2007/2008 and 2011/2012, the overall STR improved from 17.0 to 18.0 ranging from 5.7 in Roshtkalla rayon in GBAO to 25.0 in the city of Dushanbe in 2007/2008 and from 6.5 to 25.5, respectively, in 2011/2012. Between the maximum and minimum, there are wide variations within each oblast (though all data are not shown in the graphs), but not all oblasts and rayons observed the similar change (Figure 9). As a result, per student spending and the percentage distribution of recurrent spending widely vary between oblasts, but without a clear correlation (Figure 10). Part of these variations can be explained by conditions—elevation and population density—but there also are considerable variations between rayons that have similar conditions (Figure 11). The remaining variations may be explained by other factors such as multi-language requirements, type of school, or catchment areas, but also by the inefficiencies in school network, managing class size, and recruitment of teachers and non-teaching staff. The Ministry of Education has observed irregularities in school financing, for example, payment of full-year salaries for seasonal workers (e.g., heating staff in winter) and electricity bills in schools without electricity. In-depth analysis of school-level data for each rayon is necessary to identify potential areas for further efficiency gains.
20 Being in compliance was defined as having a budget that was 95 percent or greater as calculated using the PCF formula. This cut-off is based on the regulation that districts are entitled to reallocate up to 5 percent of the district-level budget, while ensuring that no school receives less than 95 percent of the budget as calculated by the PCF formula.
21 The PCF reform has been supported under the Fast Track Initiative grants and the Ministry has engaged consultants to monitor and evaluate the implementation and produced a number of reports analyzing the outcomes and aiming to improve the mechanism.
4. General Education Financing │ 15
Policy Note No. 3: Review of Public Expenditures on Education

31. The successful implementation of the PCF reform is undermined by distorted incentives for schools reducing their wage bills. General education budget for each rayon is approved by the central government according to the PCF formula. However, if some rayons fail to raise revenues as estimated based on their fiscal capacity, education budget could be reduced. However, local governments continue to finance “protected” budget items (e.g.), whereas other (non-wage) expenditures are the first to be reduced. This means that schools, that have
Figure 9. Maximum and Minimum STRs by Oblast and Rayon, 2007/2008–2011/2012Dushanbe Khatlon30
25
20
15
10
5
0
2009/10 2010/11 2011/12
30
25
20
15
10
5
0
2009/10 2010/11 2011/12
▬▬ Shohmansur (max.) ▬▬ Dushanbe avg. ▬▬ Somoni (min.) ▬▬ National avg. ▬▬ Yovon (max.) ▬▬ Khatlon avg. ▬▬ National avg. ▬▬ Shurobod (min.)
RRS GBAO30
25
20
15
10
5
0
2009/10 2010/11 2011/12
30
25
20
15
10
5
0
2009/10 2010/11 2011/12
▬▬ Rudaki (max.) ▬▬ RRS avg. ▬▬ National avg. ▬▬ Tavildara (min.) ▬▬ National avg. ▬▬ Khorog (max.) ▬▬ GBAO avg. ▬▬ Roshtkalla (min.)
Sughd30
25
20
15
10
5
0
2009/10 2010/11 2011/12
▬▬ Istaravshan (max.) ▬▬ National avg. ▬▬ Sughd avg. ▬▬ Asht (min.)
Source: MOE, EMIS.Note: The average STRs widely vary not only between oblasts but also within each oblast. There has been little change, if any, in STRs in the most recent years.
Tajikistan Policy Notes on Public Expenditures | August 2013
16 │ 4. General Education Financing

rationalized staffing and increased their non-wage budget for quality improvement, get penalized, whilst those that have kept many teachers are rewarded. The gap between the approved budget according to the formula and the actual execution has compromised the successful implementation of the PCF reform.
C. Teacher Wages
32. The wage system for teachers has been simplified, which improves transparency. In the past, the wage system for teachers was extremely complicated, with several supplements and benefits in addition to the base salary per teaching load (stavka). In 2007, the government eliminated all except (i) 20 percent additional pay for checking notebooks for some subjects, including mathematics, literature, and Russian language, (ii) 15 percent for
Figure 10. Per Student Unit Cost and Wage Bill Vary Among Oblasts, but Without a Clear Correlationper student spending by oblast/rayon, 2011 in TJS percentage distribution of recurrent spending, 2011
1,000
900
800
700
600
500
400
300
200
100
0
Dushanbe Khatlon Sughd Total GBAORRS
100
90
80
70
60
50
40
30
20
10
0
Dushanbe Khatlon Sughd Total GBAORRS
▬J Personnel ▬J Food ▬J Heat and utilities ▬J Maintenance/repairs ▬J Personnel ▬J Food ▬J Heat and utilities ▬J Maintenance/repairs
▬J Other recurrent ▬J Capital ▬J Other recurrent
Source: Tajikistan BOOST v0.4 government expenditure database.
Figure 11. STRs Correlate with Elevation and Population Density, But there are Intra-Oblast Variations Among Rayons with Similar Conditionsstudent-teacher ratio student-teacher ratio
30
25
20
15
10
5
0
400 300 200 100 0
30
25
20
15
10
5
0
0 1,000 2,000 3,000 4,000
population per km2 elevation (meters)
Sources: MOE, EMIS for STRs; Wikipedia (http://en.wikipedia.org/wiki/Provinces_of_Tajikistan) for the population density; and Avaneyan, Vahram, 2012, Improving the system of school financing in the Republic of Tajikistan on the basis of normative formula funding, final, for elevation.
4. General Education Financing │ 17
Policy Note No. 3: Review of Public Expenditures on Education
form masters, and (iii) 10 percent for maintaining subject-related classrooms and equipment (e.g., mathematics, chemistry, physics, and computers).22 This reform helped increase transparency and predictability of wages.
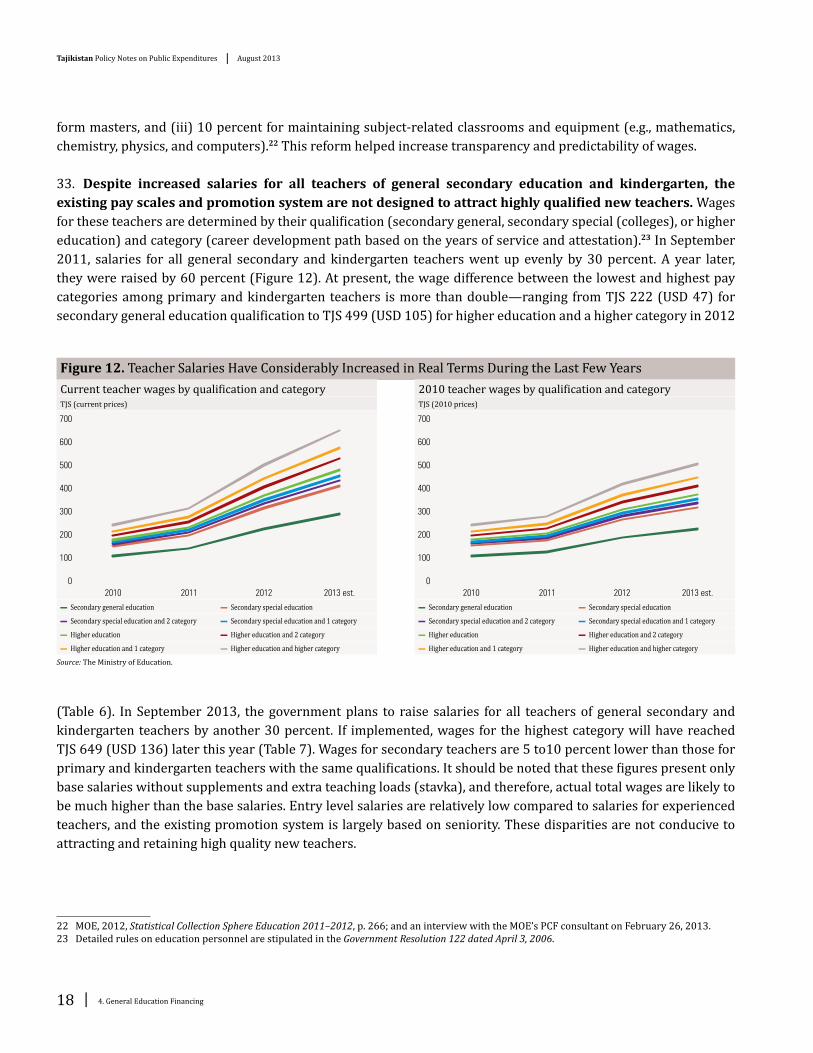
33. Despite increased salaries for all teachers of general secondary education and kindergarten, the existing pay scales and promotion system are not designed to attract highly qualified new teachers. Wages for these teachers are determined by their qualification (secondary general, secondary special (colleges), or higher education) and category (career development path based on the years of service and attestation).23 In September 2011, salaries for all general secondary and kindergarten teachers went up evenly by 30 percent. A year later, they were raised by 60 percent (Figure 12). At present, the wage difference between the lowest and highest pay categories among primary and kindergarten teachers is more than double—ranging from TJS 222 (USD 47) for secondary general education qualification to TJS 499 (USD 105) for higher education and a higher category in 2012
(Table 6). In September 2013, the government plans to raise salaries for all teachers of general secondary and kindergarten teachers by another 30 percent. If implemented, wages for the highest category will have reached TJS 649 (USD 136) later this year (Table 7). Wages for secondary teachers are 5 to10 percent lower than those for primary and kindergarten teachers with the same qualifications. It should be noted that these figures present only base salaries without supplements and extra teaching loads (stavka), and therefore, actual total wages are likely to be much higher than the base salaries. Entry level salaries are relatively low compared to salaries for experienced teachers, and the existing promotion system is largely based on seniority. These disparities are not conducive to attracting and retaining high quality new teachers.
22 MOE, 2012, Statistical Collection Sphere Education 2011–2012, p. 266; and an interview with the MOE’s PCF consultant on February 26, 2013.23 Detailed rules on education personnel are stipulated in the Government Resolution 122 dated April 3, 2006.
Figure 12. Teacher Salaries Have Considerably Increased in Real Terms During the Last Few YearsCurrent teacher wages by qualification and category 2010 teacher wages by qualification and categoryTJS (current prices) TJS (2010 prices)
700
600
500
400
300
200
100
0
2010 2011 2012 2013 est.
700
600
500
400
300
200
100
0
2010 2011 2012 2013 est.
▬▬ Secondary general education ▬▬ Secondary special education ▬▬ Secondary general education ▬▬ Secondary special education
▬▬ Secondary special education and 2 category ▬▬ Secondary special education and 1 category ▬▬ Secondary special education and 2 category ▬▬ Secondary special education and 1 category
▬▬ Higher education ▬▬ Higher education and 2 category ▬▬ Higher education ▬▬ Higher education and 2 category
▬▬ Higher education and 1 category ▬▬ Higher education and higher category ▬▬ Higher education and 1 category ▬▬ Higher education and higher category
Source: The Ministry of Education.
Tajikistan Policy Notes on Public Expenditures | August 2013
18 │ 4. General Education Financing

34. Salary increases for general secondary and kindergarten teachers have resulted in lack of incentives for teachers to take management positions in schools.24 While the government kept raising salaries for teachers, those for school principals and deputy principals remained low. This has made management positions unattractive and there has been a high turnover of principals.25 The government has recognized this widening wage gap as an issue and is planning to increase wages for school administrators in 2013.26 This is an important step to balance salary scales within the education sector.
Table 6. Teacher Salaries by Qualification and Category, 2012Secondary
general education
Secondary special education Higher education
No category
Category 2 Category 1 No category
Category 2 Category 1 Higher category
In TJSPrimary & KG teachers 222 314 333 349 368 406 442 499Secondary teachers 202 296 317 333 349 387 406 459
In USD (1 TJS = USD 4.76)Primary & KG teachers 47 66 70 73 77 85 93 105Secondary teachers 42 62 67 70 73 81 85 96
Source: The Ministry of Education.
Table 7. Teacher Salaries by Qualification and Category, Planned for September 2013Secondary
general education
Secondary special education Higher education
No category
Category 2 Category 1 No category
Category 2 Category 1 Higher category
In TJS Primary & KG teachers 289 408 433 454 478 528 575 649Secondary teachers 263 385 412 433 454 503 528 597
In USD (1 TJS = USD 4.76)Primary & KG teachers 61 86 91 95 101 111 121 136Secondary teachers 55 81 87 91 95 106 111 125
Source: The Ministry of Education.
35. Given recent rapid increases, base salaries for teachers in the highest category may reach a comparable level with the economy-wide average, but not for teachers in the lower categories. Table 6 shows net monthly salaries by education level that is estimated based on the Tajikistan Living Standards Survey (TLSS) 2009. As a comparison, it also shows estimated salaries for 2012 based on an assumption that salaries have gone up proportionately to the inflation rate (compared to 2009, 27 percent up in 2012 and 37 percent up in 2013).27 In 2012, men with secondary general and special education on average earned much more than the base salary (not including supplements and overtime pay for more than one teaching load) for teachers with any educational qualifications.
24 World Bank, 2008, Republic of Tajikistan Public Sector Pay Reform: Policy Note on Medium-Term Pay Reform in Public Sector Civil Service, Education, Health, Social Protection, Science, Culture and Sport, Part 2 Background Note.
25 An interview with the Ministry of Education’s PCF consultant on February 26, 2013.26 An interview with the Deputy Minister of Finance on February 26, 2013.27 It should be noted that this assumption does not take into account potential impacts of the economic crisis in 2009 or any other factors on wages.
4. General Education Financing │ 19
Policy Note No. 3: Review of Public Expenditures on Education

36. Unfortunately, there are no comparable salary data for those with higher education qualifications. However, given that university graduates typically have higher salaries than less educated, base salaries for teachers are most likely lower than average salaries in the economy. The base salaries for teachers with higher education and the highest category would catch up with average net monthly salaries of secondary educated men in 2013, if the planned increase is materialized, but not those in lower categories. On the other hand, for females who, on average, earn less than one-half of what men earn in the overall economy, teacher salaries are in general much higher than the economy-wide average. It should be noted that these comparisons provide limited implications to assess the adequacy of teacher salaries without more detailed data on economy-wide wages by education level as well as the actual net earnings of teachers after adding supplements and extra teaching loads.
Table 8. Average Net Monthly Salaries, TLSS 2009, 2012 and 2013 EstimateMean net monthly salary, TLSS 2009 2012 est. (27 percent up from 2009) 2013 est. (37 percent up from 2009)
Gender Location Gender Location Gender Location
Male Female Urban Rural Male Female Urban Rural Male Female Urban Rural
Basic (grade 9) 393 183 320 296 498 232 405 375 538 250 438 406Secondary general (grade 11) 474** 167 351 359** 601 212 444 455 649 229 480 492Secondary special or technical 445 227 398 388** 564 288 504 492 610 311 545 532
Source: Dasgupta, B. et al., 2011, Drivers of Secondary Education Participation in Tajikistan: the Link with Poverty, Labor Market and Migration Outcomes. World Bank: Washington, D.C.Notes: *p<.10, **p<.05, ***p<.01 reflect t-tests for sign. difference between secondary general or secondary special/technical versus basic education. The sample size was 1,563, which excluded working-students. Two-sided t-tests comparing the mean of net monthly salary for male/female/urban/rural respondents with secondary general or secondary special/technical versus basic education. Standard errors are adjusted for intra-cluster correlation.
37. While teacher salaries increased, the norms (unit costs) for the PCF formula did not increase as much, resulting in increasing wage bills as a percentage of the total general education budget. In 2011, teacher salaries went up by 30 percent, while the norms for the PCF formula rose by 22 percent. In 2012, the former increased by 60 percent, but the latter by 52 percent.28 As a result, wage bills increased from 75 percent of the general education budget in 2011 to 85 percent in 2012. The government is planning a further salary increase by 30 percent in September 2013, but it is not clear whether the norms for the PCF formula will increase proportionately. An analysis by the Ministry of Education warns that some rayons might face difficulty in financing wages, let alone non-wage recurrent items, if the overall budget does not increase proportionately. It is essential that the existing inter-ministerial dialogue continue to address this potential problem.
28 Avanesyan, 2012; and an interview with the Ministry of Education’s PCF consultant on February 26, 2013.
Tajikistan Policy Notes on Public Expenditures | August 2013
20 │ 4. General Education Financing
5. Demographic Trends and the Implications for Public Spending on Education
A. Enrollment Projections
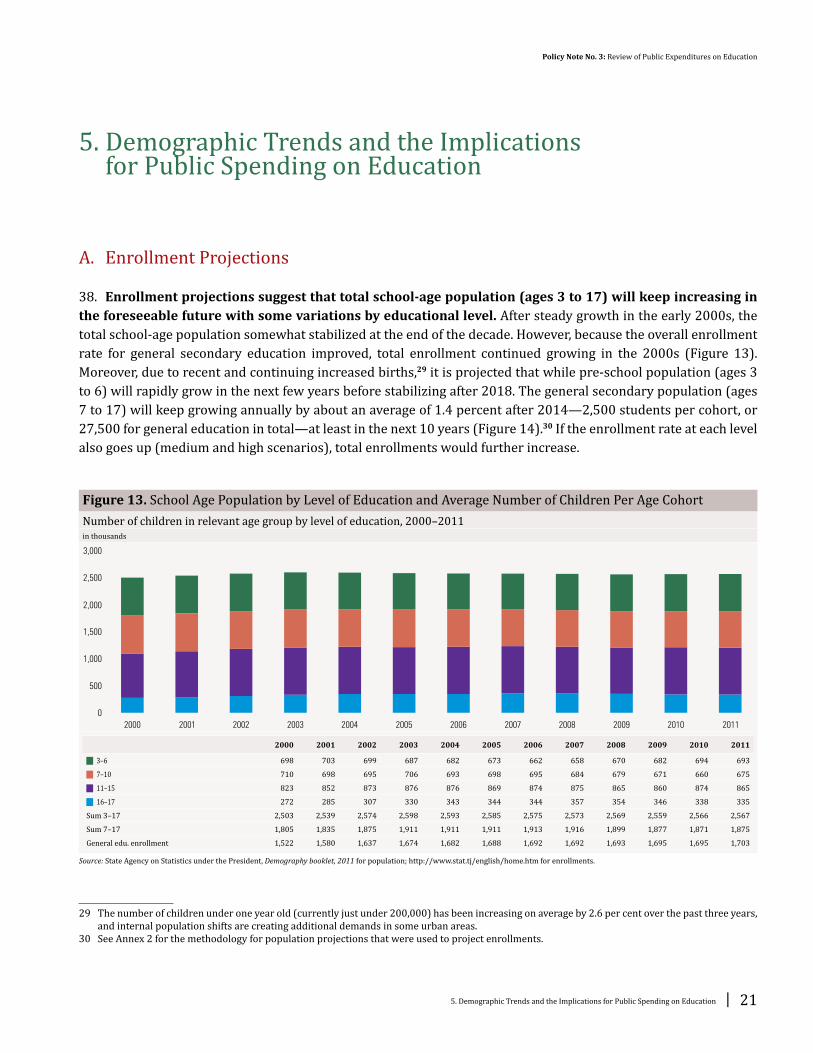
38. Enrollment projections suggest that total school-age population (ages 3 to 17) will keep increasing in the foreseeable future with some variations by educational level. After steady growth in the early 2000s, the total school-age population somewhat stabilized at the end of the decade. However, because the overall enrollment rate for general secondary education improved, total enrollment continued growing in the 2000s (Figure 13). Moreover, due to recent and continuing increased births,29 it is projected that while pre-school population (ages 3 to 6) will rapidly grow in the next few years before stabilizing after 2018. The general secondary population (ages 7 to 17) will keep growing annually by about an average of 1.4 percent after 2014—2,500 students per cohort, or 27,500 for general education in total—at least in the next 10 years (Figure 14).30 If the enrollment rate at each level also goes up (medium and high scenarios), total enrollments would further increase.
29 The number of children under one year old (currently just under 200,000) has been increasing on average by 2.6 per cent over the past three years, and internal population shifts are creating additional demands in some urban areas.
30 See Annex 2 for the methodology for population projections that were used to project enrollments.
Figure 13. School Age Population by Level of Education and Average Number of Children Per Age CohortNumber of children in relevant age group by level of education, 2000–2011in thousands
3,000
2,500
2,000
1,500
1,000
500
0
20012000 2002 2003 2004 2005 2006 2007 2008 2009 2010 2011
2000 2001 2002 2003 2004 2005 2006 2007 2008 2009 2010 2011
▬J 3–6 698 703 699 687 682 673 662 658 670 682 694 693
▬J 7–10 710 698 695 706 693 698 695 684 679 671 660 675
▬J 11–15 823 852 873 876 876 869 874 875 865 860 874 865
▬J 16–17 272 285 307 330 343 344 344 357 354 346 338 335
Sum 3–17 2,503 2,539 2,574 2,598 2,593 2,585 2,575 2,573 2,569 2,559 2,566 2,567
Sum 7–17 1,805 1,835 1,875 1,911 1,911 1,911 1,913 1,916 1,899 1,877 1,871 1,875
General edu. enrollment 1,522 1,580 1,637 1,674 1,682 1,688 1,692 1,692 1,693 1,695 1,695 1,703
Source: State Agency on Statistics under the President, Demography booklet, 2011 for population; http://www.stat.tj/english/home.htm for enrollments.
5. Demographic Trends and the Implications for Public Spending on Education │ 21
Policy Note No. 3: Review of Public Expenditures on Education

B. Scenarios for Recurrent Expenditures
39. To accommodate projected increases in general education enrollment, the government needs to increase the recurrent budget for general education by 1.2 percent annually in real terms. Table 9 illustrates estimated increases in annual recurrent expenditures required to accommodate a projected enrollment increase by 27,500 students per year. At 2012 prices, the government will need to spend an additional TJS 9.5 million (USD 2 million) on recurrent expenses just to finance projected enrollment increases, without considering other costs such as wage increases and teacher training, among other costs. This is equivalent to 1.2 percent of the total general education budget in 2011.
Figure 14. Population and Enrollment Projections by Level of Education and Different Enrollment RatesPopulation projections per age cohort by level of education: medium variant
Preschool: enrollment projections per age cohort
in thousands in thousands
210
200
190
180
170
160
150
2007 2009 2011 2013 2015 2017 2019 2021 2023 2025 2007 2009 2011 2013 2015 2017 2019 2021 2023 2025
70
60
50
40
30
20
10
0
▬▬ Preschool (ages 3–6) ▬▬ Basic (ages 7–15) ▬▬ General secondary (ages 7–17) ▬▬ High scenario ▬▬ Medium scenario ▬▬ Baseline
Basic education (grades 1–9): enrollment projections per age cohort
Upper secondary (grades 10–11): enrollment projections per age cohort
in thousands in thousands
210
200
190
180
170
160
150
2007 2009 2011 2013 2015 2017 2019 2021 2023 2025
150
140
130
120
110
70
80
90
100
2007 2009 2011 2013 2015 2017 2019 2021 2023 2025
▬▬ High scenario ▬▬ Baseline ▬▬ High scenario ▬▬ Medium scenario ▬▬ Baseline
Source: Calculated by World Bank staff based on data from the State Agency on Statistics under the President, Demography booklet, 2011 and the UN population projection.
Tajikistan Policy Notes on Public Expenditures | August 2013
22 │ 5. Demographic Trends and the Implications for Public Spending on Education

Table 9. Estimated Additional Annual Recurrent Spending Required Accommodating Projected Enrollment Increases, at 2012 PricesType of schools Per student cost (TJS)1/ Projected enrollment increase2/ Total cost increase (TJS) Total cost increase (USD)3/
Primary schools 510 399 203,561 42,765Basic schools 407 2,051 834,635 175,343General secondary schools 327 23,904 7,816,610 1,642,145Others4/ 510 1,146 584,539 122,802Total 27,500 9,439,345 1,983,056
Source: World Bank staff estimates.Notes: 1/ Per student unit costs are differentiated by type of school (primary, basic or general secondary school), but not by level of education (i.e. primary, lower secondary, or upper secondary level). 2/ Of total general secondary education students, 1.5 percent are enrolled in primary schools, 7.5 percent in basic schools, and 87 percent in general secondary schools. The remaining four percent of students are enrolled in gymnasium, lyceums, boarding, and special schools. No information about the unit costs for these schools is available. 3/ An exchange rate of TJS 4.76=1 USD was used.4/ Since per student unit costs are not available for other types of schools, and it is likely that these schools cost more than general secondary schools, the highest unit cost (i.e. primary schools) was used.
C. Scenarios for Capital Investment
40. To provide all children with an adequate learning environment, the government needs to address two major issues simultaneously—restorate damaged schools and create new space for more students, and reduce crowded schools. The dire state of schools is the result of damages caused during the severe civil war in the mid-1990s and chronic underinvestment that afflicted the sector for much of the 1990s and early 2000s. In 2012, the MOE estimated that of 3,747 schools in the country, 18 percent display emergency conditions (with the majority unsafe) and 3.5 percent are situated in railway cars and private homes. In addition, 30 percent of schools require major rehabilitation. Many of these facilities lack lighting, heating, water and basic sanitation. Due to insufficient heating, they are either closed or poorly attended by students and teachers during the cold period, which can last up to five months in mountainous areas. A UNICEF’s study found that more than one-third of Tajikistan’s youth say that heating and electricity do not function consistently in their schools.31 Currently, 4 percent of students are enrolled in three-shift schools, with the bulk of the remainder enrolled in two-shift schools.
Table 10. Estimated Additional Capital Spending Required Accommodating Projected Enrollment Increases
No. of classrooms Unit cost (US dollars) Total cost (million US dollars.)
Renovation and furnishing
400
25,700
10.3500 12.9600 15.4700 18.0
New construction 55062,500 34.435,000 19.3
Source: World Bank staff estimates.Note: As a comparison, a typical school built under donor-financed projects such as Fast Track Initiative (FTI) and German development bank (KfW) which includes classrooms, computer class, director’s office, teachers’ room and library costs approx. USD 35,000 per classroom.
31 See UNICEF, 2012, Youth Perspectives of Education Quality in Tajikistan: A Case Study of Education Quality for Youth in the CEECIS Region, UNICEF: Dushanbe, for interesting perspectives of the youth on quality of education.
5. Demographic Trends and the Implications for Public Spending on Education │ 23
Policy Note No. 3: Review of Public Expenditures on Education

41. The government will need to maintain the current high level of annual capital investments for school renovation and new construction to accommodate demographic trends and improve the learning environment. The government has increased investments in school infrastructure in recent years.32 In 2011, public investment in construction and maintenance increased to USD 55.9 million, allowing (i) renovation and furnishing of 92 schools (692 classrooms) with USD 17.8 million mainly from local budgets, and (ii) construction of 42 new schools (610 classrooms) with USD 38.1 million from the republican budget and the President’s Reserve Fund.33 On average, renovation and furnishing costs USD 25,700 per classroom, and new construction USD 62,500 per classroom. Total public investment is expected to remain on average at USD 42.8 million per year in 2012 to 2015.34 Table 10 illustrates various scenarios of capital investment to renovate and furnish existing schools, as well as new construction of classrooms to accommodate projected enrollment increases. Just to accommodate projected population growth, the country needs an additional 550 classrooms of 25 students in two-shift schools annually. Depending on the number of classrooms to be renovated, the government might need to spend USD 10 to 18 million per year to eliminate schools in poor conditions. In addition, depending on the unit cost of new construction, the government might need USD 19 to 34 million to accommodate projected enrollment increases.
D. Feasibility of Extending General Secondary Education to 12 Years
42. Adding grade 0 below grade 1 might be a practical option for the government to extend the current 11-year general secondary education to 12 years in line with international practice. The government intended to extend general secondary education to 12 years (compulsory basic education grades 5–10 and upper secondary grades 11–12) by 2016, but it has been postponed due to uncertain feasibility. There are two options to extend general secondary education from 11 to 12 years: (i) add grade 0 below grade 1 and start primary education at the age of six, instead of seven; or (ii) add grade 12. Starting primary education at the age of seven is late, compared to other countries that typically start at age five or six. The pre-school enrollment rate is currently extremely low, so the government may wish to choose the first option by gradually expanding one-year pre-school education nationwide and eventually making it part of compulsory basic education.
43. The cost of extending general secondary education from the current 11 years to 12 years would be substantial, but it is an achievable goal in the medium term. As illustrated in Figure 14, the average age cohort for pre-school (ages three to six) will dramatically rise in the next several years before stabilizing at about 190,000 to 200,000 after 2018. Assuming that there will be 195,000 children per age cohort, and that 9 percent of them will
32 The government allocated USD 170 million for school infrastructure in 2009–2011, consisting of USD 138.7 million from state and local government budgets and USD 31.3 million from external investments. During the three years, 395 schools were rehabilitated or constructed from the state budget, and 111 from the investment projects (Ministry of Education database).
33 1,079 school desks in grades 1–4, 1,315 school desks in grades 5–10, and 1,414 school desks in grades 10–11 were furnished. In addition, 1,122 items for mathematics classes, 60 tables for teachers, 125 chalkboards, and 70 bookshelves for school libraries were furnished and financed directly out of the state budget (Ministry of Education, 2011, Statistical Bulletin of the Education Sector of the Republic of Tajikistan; EMIS, 2010). Of these refurbished and newly constructed classrooms, nearly 643 classrooms were located in Khatlon oblast, where 17 new schools were constructed. Khatlon oblast accounts for the highest crude births (per 1,000 population) ratio of 31.1 in the country, and 63.4 percent of all children between 0–18 years old live in Khatlon oblast (Agency on Statistics under the President of the Republic of Tajikistan, 2011, Demographic Yearbook of the Republic of Tajikistan.).
34 Ministry of Finance, 2010, Medium-Term Expenditure Framework for 2011–13.
Tajikistan Policy Notes on Public Expenditures | August 2013
24 │ 5. Demographic Trends and the Implications for Public Spending on Education

be enrolled in the existing kindergartens or ELCs, additional financing is needed to accommodate the remaining 177,000 six year-olds into one-year pre-school education (or possibly grade 0 of general education in the future). If the per student unit cost for general secondary schools in 2012 is applied, the total additional recurrent cost to enroll the additional children will be TJS 58 million (USD 12.6 million), without considering training for pre-school teachers. In addition, the country will need to establish 3,550 new classrooms per 25 students in two-shift schools to accommodate those children. Even if the low unit cost of USD 35,000 per classroom (from Table 9) is applied, this will total USD 124 million. It should be noted, however, that the Ministry of Education’s Working Group on pre-school education has estimated that there may be up to 2,000 unused classrooms in existing school facilities nationwide that can be used for pre-school.35 If this is the case, substantial cost saving can be expected.
E. Fiscal Implications of Demographic Developments
44. The government intends to further increase educational spending. In the short-term, the planned increase will be focused on increasing teachers’ and principals’ wages and investing in school infrastructure. In the long-run, as stated in the National Education Development Strategy Up To 2020, the government aims to increase education spending—up to 6 percent of GDP by 2015 and not less than 7 percent of GDP by 2020.
Table 11. Public Spending on General Education, 2009–2011Million TJS Million US dollars1/ Percentage of GDP
2009 2010 2011 2009 2010 2011 2009 2010 2011
Personnel costs 390.5 451.5 536.9 94.3 103.1 116.5 1.89 1.83 1.79Goods and services 87.3 109.1 122.7 21.1 24.9 26.6 0.42 0.44 0.41Other rec. expenditures 1.0 1.3 1.7 0.2 0.3 0.4 0.00 0.01 0.01Capital expenditures 106.7 113.0 163.3 25.8 25.8 35.4 0.52 0.46 0.54Total 585.5 675.0 824.6 141.3 154.1 178.9 2.84 2.73 2.74
Source: Tajikistan BOOST v0.4 government expenditure database.Note: 1/ Exchange rates at 1USD = TJS 4.14 in 2009, TJS 4.38 in 2010, and 4.61 in 2011.
45. To accommodate various investment needs, higher spending on general secondary education may be warranted. Table 11 shows public spending on general secondary education in 2009 to 2011, which remained stable at around 2.7 to 2.8 percent of GDP. Using 2011 spending as a baseline, Table 12 illustrates potential additional public spending to (i) accommodate projected enrollment increases in the next decade, (ii) expand one-year pre-school for all six year-olds, (iii) increase salaries for educational personnel, and (iv) increase instruction hours. This may drive the general secondary education expenditures up for additional 1.2 to 2.7 percent of GDP (in 2011 prices). Any increase in education spending should be considered within the overall government budget envelope with the identification of priority policy interventions and assessment of their efficiency and costs. Moreover, as suggested by the analysis presented in this Note, there could be efficiency gains from rationalizing and reforming pre-school and tertiary education systems and their financing mechanisms and using the savings to increase outlays
35 An interview with the UNICEF staff on March 5, 2013.
5. Demographic Trends and the Implications for Public Spending on Education │ 25
Policy Note No. 3: Review of Public Expenditures on Education
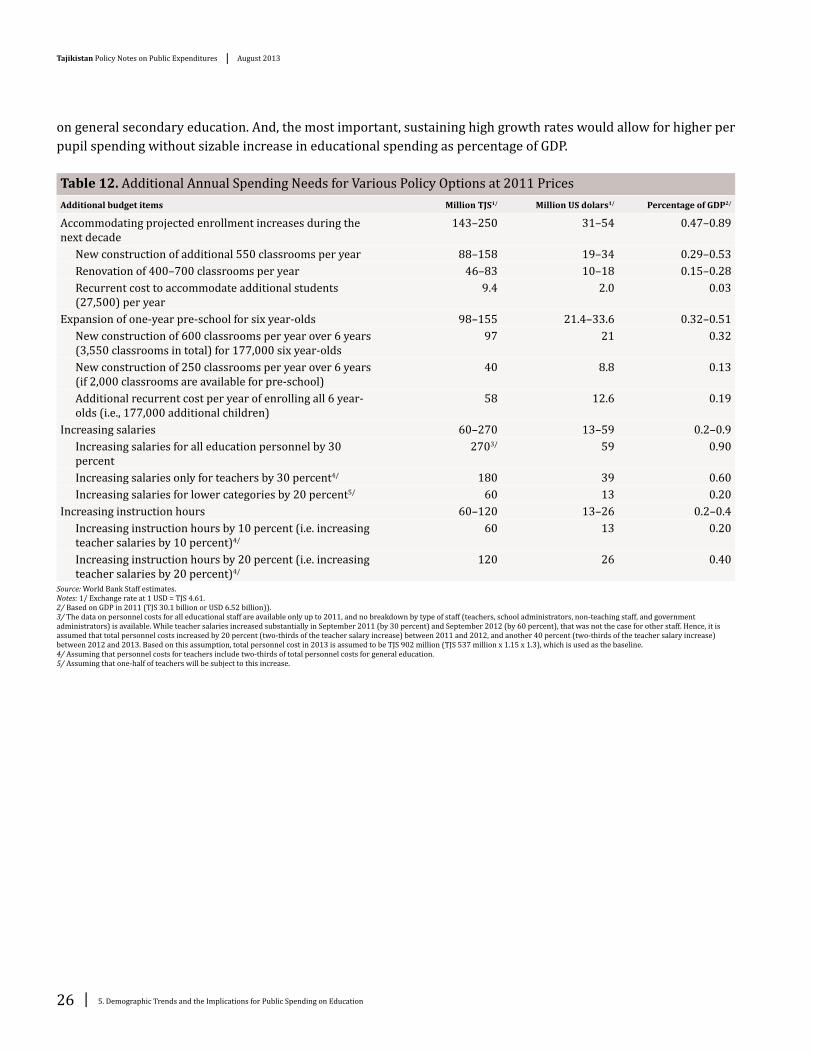
on general secondary education. And, the most important, sustaining high growth rates would allow for higher per pupil spending without sizable increase in educational spending as percentage of GDP.
Table 12. Additional Annual Spending Needs for Various Policy Options at 2011 PricesAdditional budget items Million TJS1/ Million US dolars1/ Percentage of GDP2/
Accommodating projected enrollment increases during the next decade
143–250 31–54 0.47–0.89
New construction of additional 550 classrooms per year 88–158 19–34 0.29–0.53Renovation of 400–700 classrooms per year 46–83 10–18 0.15–0.28Recurrent cost to accommodate additional students (27,500) per year
9.4 2.0 0.03
Expansion of one-year pre-school for six year-olds 98–155 21.4–33.6 0.32–0.51New construction of 600 classrooms per year over 6 years (3,550 classrooms in total) for 177,000 six year-olds
97 21 0.32
New construction of 250 classrooms per year over 6 years (if 2,000 classrooms are available for pre-school)
40 8.8 0.13
Additional recurrent cost per year of enrolling all 6 year- olds (i.e., 177,000 additional children)
58 12.6 0.19
Increasing salaries 60–270 13–59 0.2–0.9Increasing salaries for all education personnel by 30 percent
2703/ 59 0.90
Increasing salaries only for teachers by 30 percent4/ 180 39 0.60Increasing salaries for lower categories by 20 percent5/ 60 13 0.20
Increasing instruction hours 60–120 13–26 0.2–0.4Increasing instruction hours by 10 percent (i.e. increasing teacher salaries by 10 percent)4/
60 13 0.20
Increasing instruction hours by 20 percent (i.e. increasing teacher salaries by 20 percent)4/
120 26 0.40
Source: World Bank Staff estimates.Notes: 1/ Exchange rate at 1 USD = TJS 4.61.2/ Based on GDP in 2011 (TJS 30.1 billion or USD 6.52 billion)).3/ The data on personnel costs for all educational staff are available only up to 2011, and no breakdown by type of staff (teachers, school administrators, non-teaching staff, and government administrators) is available. While teacher salaries increased substantially in September 2011 (by 30 percent) and September 2012 (by 60 percent), that was not the case for other staff. Hence, it is assumed that total personnel costs increased by 20 percent (two-thirds of the teacher salary increase) between 2011 and 2012, and another 40 percent (two-thirds of the teacher salary increase) between 2012 and 2013. Based on this assumption, total personnel cost in 2013 is assumed to be TJS 902 million (TJS 537 million x 1.15 x 1.3), which is used as the baseline. 4/ Assuming that personnel costs for teachers include two-thirds of total personnel costs for general education.5/ Assuming that one-half of teachers will be subject to this increase.
Tajikistan Policy Notes on Public Expenditures | August 2013
26 │ 5. Demographic Trends and the Implications for Public Spending on Education

6. Conclusions
46. The main conclusions of this Note are as follows:
y At 4.2 percent of GDP, the level of public spending on education in Tajikistan is comparable now to that in countries at a similar level of development and is in line with the Tajikistan’s overall size of the budget and demographic structure.
y At the extremely low pre-school enrollment rate, most children in Tajikistan do not have an opportunity to attain a certain set of emotional, behavioral, and cognitive skills needed to learn, work, and function successfully in school before entering primary school.
y While primary education is near universal with gender parity, about 10 percent of students do not complete nine-year compulsory basic education. Early dropouts are results of both supply-side constraints—such as lack of relevant and high quality education and basic facilities—and demand-side constraints—lack of interest among parents and affordability.
y Available evidence suggests poor quality of early learning at pre-primary and primary levels. One of the contributing factors for the poor performance is short official hours of instruction combined with heavy learning loads.
y The current wage system does not provide strong incentives for highly qualified new teachers to enter the profession, or for experienced teachers to take school management positions as a systemic and transparent performance evaluation mechanism is still missing in defining wage categories.
y Overall, per capita financing of general education has resulted in many positive outcomes, including not only efficiency gains and equity, but also school autonomy and quality improvement. However, not all rayons have implemented PCF efficiently.
y Unit costs for new construction of school infrastructure vary considerably, depending on financing sources. It seems necessary to review the existing standards for school construction and explore most cost-effective models so that the government can afford as many new classrooms as possible to meet the increasing demand.
y High unit costs of pre-school, VET and tertiary education suggest about significant inefficiencies within these educational sub-sectors.
y Demographic developments put an upward pressure on educational spending, namely, for increasing general secondary education spending. The largest source of an increased fiscal space for education is sound macroeconomic policies and accelerated structural reforms that would support high economic growth and increased government revenues and, in turn, make it affordable to invest more in education in response to the
6. Conclusions │ 27
Policy Note No. 3: Review of Public Expenditures on Education
projected demographic trends. The fiscal space should also be created through the efficiency gains within the sector as well as through continued reform of the whole educational system to deliver skills necessary for the country development and growth at a high pace.
Tajikistan Policy Notes on Public Expenditures | August 2013
28 │ 6. Conclusions
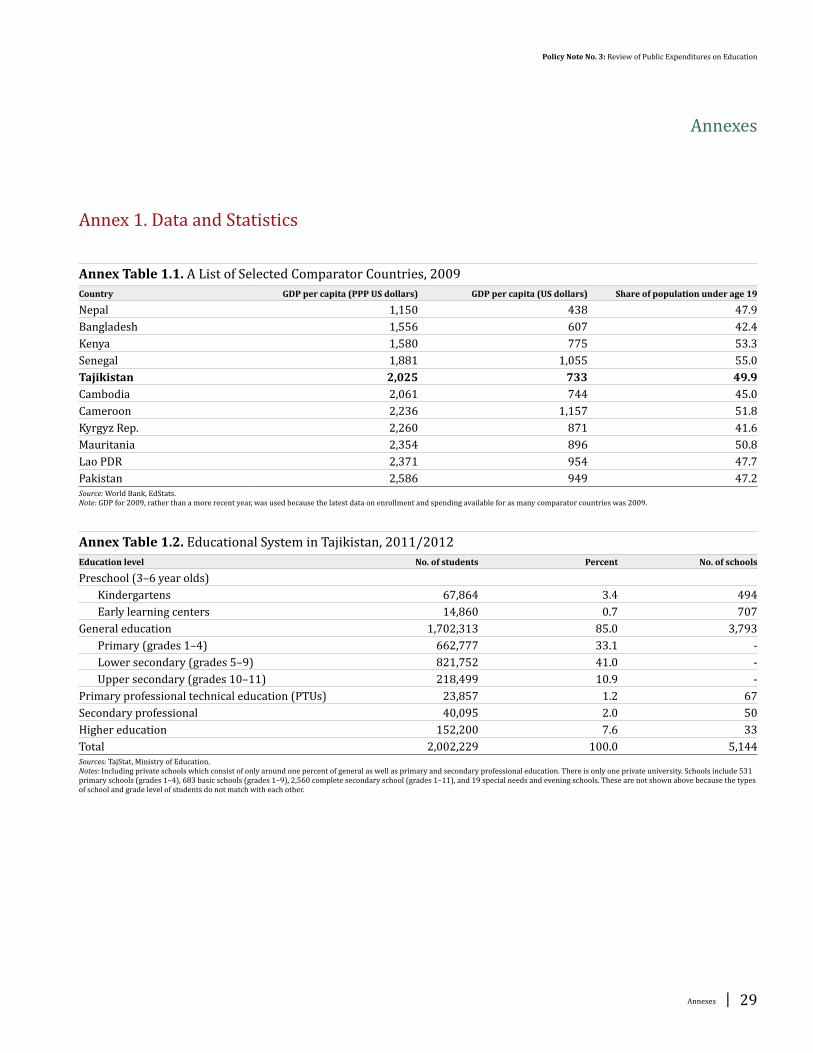
Annexes
Annex 1. Data and Statistics
Annex Table 1.1. A List of Selected Comparator Countries, 2009Country GDP per capita (PPP US dollars) GDP per capita (US dollars) Share of population under age 19
Nepal 1,150 438 47.9Bangladesh 1,556 607 42.4Kenya 1,580 775 53.3Senegal 1,881 1,055 55.0Tajikistan 2,025 733 49.9Cambodia 2,061 744 45.0Cameroon 2,236 1,157 51.8Kyrgyz Rep. 2,260 871 41.6Mauritania 2,354 896 50.8Lao PDR 2,371 954 47.7Pakistan 2,586 949 47.2Source: World Bank, EdStats.Note: GDP for 2009, rather than a more recent year, was used because the latest data on enrollment and spending available for as many comparator countries was 2009.
Annex Table 1.2. Educational System in Tajikistan, 2011/2012Education level No. of students Percent No. of schools
Preschool (3–6 year olds)Kindergartens 67,864 3.4 494Early learning centers 14,860 0.7 707
General education 1,702,313 85.0 3,793Primary (grades 1–4) 662,777 33.1 -Lower secondary (grades 5–9) 821,752 41.0 -Upper secondary (grades 10–11) 218,499 10.9 -
Primary professional technical education (PTUs) 23,857 1.2 67Secondary professional 40,095 2.0 50Higher education 152,200 7.6 33Total 2,002,229 100.0 5,144Sources: TajStat, Ministry of Education.Notes: Including private schools which consist of only around one percent of general as well as primary and secondary professional education. There is only one private university. Schools include 531 primary schools (grades 1–4), 683 basic schools (grades 1–9), 2,560 complete secondary school (grades 1–11), and 19 special needs and evening schools. These are not shown above because the types of school and grade level of students do not match with each other.
Annexes │ 29
Policy Note No. 3: Review of Public Expenditures on Education

Annex Table 1.3. Public Education Expenditure by Financing Source, Education Subsector, and Expenditure Category, 2011in millions of TJS and percentage
Preschool General PTU Other secondary
Secondary prof.
Higher Other unallocated
Total
Republican 0 125.4 22.8 8.9 18.0 98.3 42.2 315.5Local 58.9 699.3 0.01 48.6 19.5 1.1 40.4 867.8
Subtotal 58.9 824.6 22.8 57.6 37.5 99.4 82.6 1,183.3Extra-budgetary funds (local funds only) - - - - - - - 36.9Donor-financed public investment program - - - - - - - 43.8
Total 58.9 824.6 22.8 57.6 37.5 99.4 82.6 1,264.0Percentage distributions by level of education
Republican 0% 40% 7% 3% 6% 31% 13% 100%Local 7% 81% 0% 6% 2% 0% 5% 100%
Subtotal 5% 70% 2% 5% 3% 8% 7% 100%Percentage distributions by level of education and financing source
Republican 0% 10% 2% 1% 1% 8% 3% 25%Local 5% 55% 0% 4% 2% 0% 3% 69%
Subtotal 5% 65% 2% 5% 3% 8% 7% 94%Extra-budgetary funds (local funds only) - - - - - - - 3%Donor-financed public investment program - - - - - - - 3%
Total 5% 65% 2% 5% 3% 8% 7% 100%
Republican Local Total
Capital expenditures 169.6 54% 90.4 10% 259.9 22%Recurrent expenditures 145.9 46% 777.4 90% 923.4 78%
Personnel costs 72.6 23% 613.2 71% 685.8 58%Goods and services 55.7 18% 158.9 18% 214.6 18%Other recurrent expenditures 17.1 5% 5.3 1% 22.4 2%Other expenditures 0.6 0% 0% 0.6 0%
Total 315.5 100% 867.8 100% 1,183.3 100%Capital expenditures 65.2% 34.8% 100.0%Recurrent expenditures 15.8% 84.2% 100.0%
Personnel costs 10.6% 89.4% 100.0%Goods and services 26.0% 74.0% 100.0%Other recurrent expenditures 76.3% 23.7% 100.0%Other expenditures 100.0% 0.0% 100.0%
Total 26.7% 73.3% 100.0%Source: Tajikistan BOOST v0.4 government expenditure database (prepared by World Bank staff on the basis of data from the State Treasury of the Ministry of Finance).
Tajikistan Policy Notes on Public Expenditures | August 2013
30 │ Annexes

Annex 2. Methodology for Enrollment Projections
Step 1: Consistency of data
Population data from the State Agency on Statistics of Tajikistan and the UN were compared. Table A1-1 shows the average number of children per age cohort by different age groups. While the UN data is available for 5-year age groups, the Tajik data was aggregated to the age groups that correspond to the level of education, i.e., 0–6 year olds for preschool age group, 7–10 year olds for primary education age group, 11–15 for lower secondary education, and 16–17 year olds for upper secondary.
Annex Table 2.1. Average Number of Children per Age Cohort by Different Age GroupsUN 2000 2005 2010 TajStat 2000 2005 2010
0–4 176.6 170.8 174.2 0–6 175.6 169.5 183.15–9 175.2 170.8 166.2 7–10 177.5 174.6 165.010–14 171.0 172.0 168.6 11–15 164.6 173.8 174.715–19 136.6 164.8 167.6 16–17 135.8 171.8 168.8
The UN data was converted to the same age groups that correspond to the level of education based on the TajikStats data. Equal weights were assumed for all years. As shown in Table A1-2, the two data sources are more or less consistent. Hence, it is concluded that the data from the two sources can be used for enrollment projections.
Annex Table 2.2. Average Number of Children per Age Cohort by Age Group Corresponding to the Level of EducationUN 2000 2005 2010 TajStat 2000 2005 2010
0–6 176.1 170.8 171.5 0–6 175.6 169.5 183.17–10 174.4 171.0 166.7 7–10 177.5 174.6 165.011–15 164.1 170.6 168.4 11–15 164.6 173.8 174.716–17 136.6 164.8 167.6 16–17 135.8 171.8 168.8
Step 2: Survival rates
Survival rates (including deaths and migrations) were estimated based on the average historical data from 2010–2011.
Annex Table 2.3. Estimated Survival RatesAge 0 1 2 3 4 5 6 7 8 9
Avg. 0.9943 0.9961 0.9926 0.9943 0.9975 0.9963 0.9959 0.9967 0.9986 1.0158Age 10 11 12 13 14 15 16 17 18
Avg. 0.9996 0.9964 0.9987 1.0019 0.9986 0.9959 0.9970 0.9973 0.9989
Step 3: Population projections
Based on the current population by age cohort from the TajikStats, the newborns estimation by the UN (Figure A1-1), and the estimated survival rates, population dynamics for 2012–2025 was projected.
Annexes │ 31
Policy Note No. 3: Review of Public Expenditures on Education

Annex Figure 2.1. Projected Number of Births per YearAnnual birth projections, all variants 2000–2030 Population projections by age group, medium variant
2000–2030in thousands in thousands
250
200
150
100
50
0
2000–05 2005–10 2010–15 2015–20 2020–25 2025–30
4,000
3,500
3,000
2,500
2,000
1,500
1,000
500
0
2005 2010 2015 2020 20302025
▬▬ Medium variant ▬▬ High variant ▬▬ Low variant 2005 2010 2015 2020 2025 2030
▬J 15–19 824 838 825 805 827 885
▬J 10–14 860 843 822 843 900 934
▬J 5–9 854 831 851 907 941 927
▬J 0–4 854 871 925 957 941 899
Source: United Nations, Department of Economic and Social Affairs (extracted from http://esa.un.org/unpd/wpp/unpp/panel_population.htm on January 21, 2013).
Tajikistan Policy Notes on Public Expenditures | August 2013
32 │ Annexes

References
Abras, A., et al., 2012, The State of Human Opportunities for Children in Tajikistan, World Bank: Washington, D.C.
Avaneyan, Vahram, 2012, Improving the System of School Financing in the Republic of Tajikistan on the Basis of Normative Formula Funding, final report.
Dasgupta, B. et al., 2011. Drivers of Secondary Education Participation in Tajikistan: the Link with Poverty, Labor Market and Migration Outcomes, World Bank: Washington, D.C.
European Training Foundation (ETF), 2006, The Reform of Vocational Education and Training in the Republic of Tajikistan, Luxembourg: Office for Official Publications of the European Communities.
_____, 2010, Torino Process 2010: Republic of Tajikistan.
Government of the Republic of Tajikistan, 2010, Government Resolution #388 on National Standards on Primary Vocational Education dated on August 2, 2010.
Ministry of Education, 2011a, Statistical Bulletin of the Education Sector of the Republic of Tajikistan.
_____, 2011b, National Education Development Strategy of the Republic of Tajikistan Up To 2020.
_____, 2012, Statistical Collection Sphere Education 2011–2012.
Ministry of Finance, 2010, Medium-Term Expenditure Framework for 2011–13.
Organisation for Economic Cooperation and Development (OECD), 2012, Education At A Glance 2012.
State Agency on Statistics under the President of the Republic of Tajikistan, 2011a, Demographic Yearbook of the Republic of Tajikistan.
_____, 2011b, Demography Booklet 2011.
Tvaruzkova, M. and Shamatov, D., 2011, Review of Early Grade Teaching and Skills. The Kyrgyz Republic and Tajikistan. Final Report, USAID: Bishkek and Dushanbe.
United Nation Children’s Fund (UNICEF), 2012a, Global Initiative on Out-of-School Children: Tajikistan Country Study.
_____, 2012b, Youth Perspectives of Education Quality in Tajikistan: A Case Study of Education Quality for Youth in the CEECIS Region, UNICEF: Dushanbe.
World Bank, 2008, Republic of Tajikistan Public Sector Pay Reform: Policy Note on Medium-Term Pay Reform in Public Sector Civil Service, Education, Health, Social Protection, Science, Culture and Sport, Part 2 Background Note, World Bank: Washington, D.C.
_____, 2012a, World Development Report 2013, World Bank: Washington, D.C.
_____, 2012b, Tajikistan Public Expenditure Review Interim Report, World Bank: Washington, D.C.
References │ 33
Policy Note No. 3: Review of Public Expenditures on Education
_____, 2013, Project Appraisal Document for the Fourth Global Partnership for Education Fund Grant (GPE-4), March 4, 2013 version.
_____, forthcoming, SABER – Early Childhood Development Country Report: Republic of Tajikistan (draft).
World Bank & International Finance Corporation, 2008, Enterprise Surveys: Tajikistan Country Profile 2008.
Tajikistan Policy Notes on Public Expenditures | August 2013
34 │ References


