world economic and market developmentsmddb.apec.org/documents/2018/fmp/sfom16/18_sfom16_002.pdf ·...
TRANSCRIPT
___________________________________________________________________________
2018/SFOM16/002 Agenda Item: 1.1
World Economic and Market Developments
Purpose: Information Submitted by: IMF
16th Senior Finance Officials’ MeetingMadang, Papua New Guinea
7-8 June 2018

I N T E R N A T I O N A L M O N E T A R Y F U N D
APEC Senior Finance Officials’ Meeting
Madang, Papua New Guinea
June 7, 2018
World Economic and Market Developments
Ken KashiwaseDeputy Head of OfficeInternational Monetary FundRegional Office for Asia and the Pacific

Main Message
1
• The upswing in global investment and tradecontinued in the second half of 2017…
• … which has contributed to a further pick-up in global growth in 2017, strongest since 2011.
• Headline inflation picked up, core inflationremains sluggish.
• Financial conditions still accommodative.
• Outlook is for higher annual growth in 2018 and 2019.
Adv. Economies:Faster closing of output gaps than expected, but still subdued potential growthin medium term.
EMGMKT and Dev Economies: Divergence in growth rates of commodity exporters and commodity importers.
• Upside and downside risks to the short-term outlook are broadly balanced.
• Risks beyond the next several quartersclearly lean to the downside.Examples include:(a) a sharp tightening of financial conditions, (b) waning popular support for global economic integration, (c) growing trade tensions and risks of a shift toward protectionist policies, and (d) geopolitical strains.
• Window of opportunity exists to advance policies and reforms …
• … secure the current upswing and raise medium-term growth to the benefit of all. Examples include:(a) strengthening the potential for higher and more inclusive growth, (b) building buffers to deal more effectively with the next downturn, (c) improving financial resilience to contain market risks and stability concerns, and (d) fostering international cooperation.
Developments Outlook
Risks Policies
Takeaway

Global growth strengthened amid a pickup in industrial production and trade …
Source: IMF, Global Data Source.
World Trade, Industrial Production (three-month moving average; annualized percent change, unless noted otherwise)
2
17-6
-4
-2
0
2
4
6
8
10
12
2011 12 13 14 15 16
Industrial production World trade volumes
18(Feb)
Developments

After two years of weakness, trade recovered in advanced economies …
3
-1
0
1
2
3
4
5
6
7
2011 2012 2013 2014 2015 2016 2017
Germany JapanUnited Kingdom United StatesOther AEs Total
-1
0
1
2
3
4
5
6
7
2011 2012 2013 2014 2015 2016 2017
Germany JapanUnited Kingdom United StatesOther AEs Total
Source: IMF staff estimates.Note: Trade growth reflects export and import volumes from external sector data; black line excludes Ireland.
Export Growth Import Growth(Percent) (Percent)
Advanced Economies
Developments

… and especially in emerging market anddeveloping economies
4
Export Growth Import Growth(Percent) (Percent)
Source: IMF staff estimates.Note: Trade growth reflects export and import volumes from external sector data; selected commodity exporters = Angola, Brazil, Ecuador, Nigeria, Russia.
Emerging Market and Developing Economies
-2
0
2
4
6
8
10
2011 2012 2013 2014 2015 2016 2017
Other EMDEsEmerging Asia excl. ChinaSelected commodity exportersChinaEMDE total
-4
-2
0
2
4
6
8
10
12
14
2011 2012 2013 2014 2015 2016 2017
Other EMDEsEmerging Asia excl. ChinaChinaSelected commodity exportersEMDE total
Developments

High frequency indicators point to continued near-term momentum …
Manufacturing PMI(three-month moving average; deviations from 50)
Consumer confidence(2010=100)
5
18(Mar)
18(Mar)
-4
-2
0
2
4
6
8
10
2012 13 14 15 16 17
Advanced economiesEmerging market economies
90
95
100
105
110
115
120
125
130
2012 13 14 15 16
Advanced economiesEmerging market economiesWorld
17
Source: IMF, Global Data Source.
Developments

Global financial conditions remain accommodative and supportive of near-term growth …
6
Developments
-6
-5
-4
-3
-2
-1
0
1
2
3
Mar
-12
Sep-
12
Mar
-13
Sep-
13
Mar
-14
Sep-
14
Mar
-15
Sep-
15
Mar
-16
Sep-
16
Mar
-17
Sep-
17
Mar
-18
Global Financial Conditions Index (FCI)(Standard deviations)
Source: IMF Global Financial Stability Report.
Tightening
Components of Global FCI
1. Short-term rates2. Long-term rates3. Term spread4. Corporate spread5. Interbank spread6. Equity price growth7. Equity return volatility8. Credit to GDP9. Credit growth
10. House price growth
Global FCI (1-10)
Oct. 2017 GFSRGlobal FCI Components

The upswing in global fixed investment is expected to continue, supporting the global growth …
7
Source: IMF World Economic Outlook database.1/ The projection (2018 and 2019) is based on the investment growth in Russia.
80
100
120
140
160
180
200
220
240
260
280
2007
2009
2011
2013
2015
2017
2019
World
Advanced Economies
Emerging Market and DevelopingEconomies
World
80
100
120
140
160
180
200
220
240
260
280
2007
2009
2011
2013
2015
2017
2019
LAC CIS 1/
Asia SSA
EMG EUR
EMG and Dev. Economies
80
100
120
140
160
180
200
220
240
260
280
2007
2009
2011
2013
2015
2017
2019
APEC x China and U.S.
United States
China
APEC
APEC(Index, 2007=100)
Outlook

Trade has picked up in 2017, with its growth moderating over the medium-term
8
Source: IMF World Economic Outlook database.
15
25
35
45
55
65
75
2007
2009
2011
2013
2015
2017
2019
World
Advanced Economies
Emerging Market and DevelopingEconomies
Global Trade
15
25
35
45
55
65
75
2007
2009
2011
2013
2015
2017
2019
LAC MENA, PKS, AFG
CIS Asia
SSA EMG EUR
EMG and Dev. Economies
15
25
35
45
55
65
75
2007
2009
2011
2013
2015
2017
2019
APEC x China and U.S.
United States
China
APEC
APEC(Percent of GDP)
Outlook

Global growth is expected to strengthen further, and so is the growth in many APEC economies …
9
WorldAsia-Pacific Economic
CooperationAdvancedEconomies
EMGMKT and DevelopingEconomies
Low IncomeDeveloping Economies
2017 3.8 4.1 2.3 4.8 4.7
2018 3.9 4.2 2.5 4.9 5.0
Revision from Apr.
20170.3 0.5 0.5 0.2 -0.3
2019 3.9 4.1 2.2 5.1 5.3
Revision from Apr.
20170.3 0.3 0.4 0.2 0.1
Sources: IMF, World Economic Outlook April 2017; and IMF, World Economic Outlook April 2018.
Real GDP Growth(percent change from a year earlier)
Outlook

… the current recovery offers a window of opportunity to raise medium-term growth
10
Source: IMF World Economic Outlook database.
-2
0
2
4
6
8
10
12
Wor
ld
Adv
. Eco
n.
EM
GM
KT
and
Dev
. Eco
n.
Aus
tralia
Bru
nei D
arus
sala
m
Can
ada
Chi
le
Peo
ple'
s R
epub
licof
Chi
na
Hon
g K
ong,
Chi
na
Indo
nesi
a
Japa
n
Kor
ea
Mal
aysi
a
Mex
ico
New
Zea
land
Pap
ua N
ew G
uine
a
Per
u
Phi
lippi
nes
Rus
sia
Sin
gapo
re
Chi
nese
Tai
pei
Thai
land
Uni
ted
Sta
tes
Vie
t Nam
2001-07 2011-17 2018-22 Avg (2001-07) Avg (2011-17) Avg (2018-22)
Real GDP Growth: APEC and Member Economies 1/(Percent )
4.04.6 3.9
1/ APEC members account for 55 percent of the global economy based on their GDP (PPP) weights .
Outlook

… but be aware that a bumpy road is ahead in the global financial markets …
11
Outlook
• Signs of contagion to the broader EM asset class have been limited so far.
• However, as monetary policy normalization continues in some AEs, more EMs with weaker fundamentals and policy frameworks may be tested.
• Sudden USD appreciation and rise in US long-term rates has put some EMs into the spotlight.
• Sudden shift in investor risk appetite, for example triggered by geopolitical events, may affect EMs more broadly.

Global economy faces a moment of considerable uncertainty …
12
Risks
1. Monetary policy normalization
2. Prospects for trade
3. Spillovers from US tax reform
4. Other risks (e.g. geopolitical risks,
climate change, etc.)

Historically, market turmoil has often followed monetary normalization…
13
Risks
0
5
10
15
20
25
1954
1958
1962
1966
1970
1974
1978
1982
1986
1990
1994
1998
2002
2006
2010
2014
2018
Latin American debt crisis
Scandinavian banking crises 1997
AFC
1998 Russia
Dot-com bubble
2007-08 GFC
Source: Board of Governors of the Federal Reserve System (US).
Recession(Effective Federal Funds Rate, Percent)

(15.6) (23.5)
(27.6)
(14.9) (22.5)
(27.7)
(18.1) (27.2)
(28.6)
0
1,000
2,000
3,000
4,000
5,000
6,000
7,000
8,000
Emerging Europe, theMiddle East, & Africa
Latin America & theCaribbean
Asia
Billi
ons
of U
SD
Total Portfolio Investment Liabilities(Percent of GDP in parentheses)
2010 2013 2016
Sources: IMF IFS database, and staff calculations.
Asia could be materially affected, given the large capital flows it has attracted …
14
Risks
Total EM Portfolio Flows, Net (12-month sum; billions of USD)
050
100150200250300350400450500
2012 2013 2014 2015 2016 2017 2018
Debt Flows
Equity Flows
Total Flows
Source: IIF
Total Portfolio Investment Liabilities (stock)(Percent of GDP in parentheses)
Sources: IMF, IFS database, and staff calculations.
Source: IIF.

15
Risks
-2.0
-1.5
-1.0
-0.5
0.0
0 1 2 3 4 5
Long-term outcome Short-term effects
-5
-4
-3
-2
-1
0
0 1 2 3 4 5-18
-16
-14
-12
-10
-8
-6
-4
-2
0
0 1 2 3 4 5
Global GDP(percent difference from baseline)
Global investment(percent difference from baseline)
Global real exports(percent difference from baseline)
Note: A 10 percent increase in import prices has been assumed. Source: IMF, World Economic Outlook; and IMF staff calculations.
A move toward protectionism would be damaging…
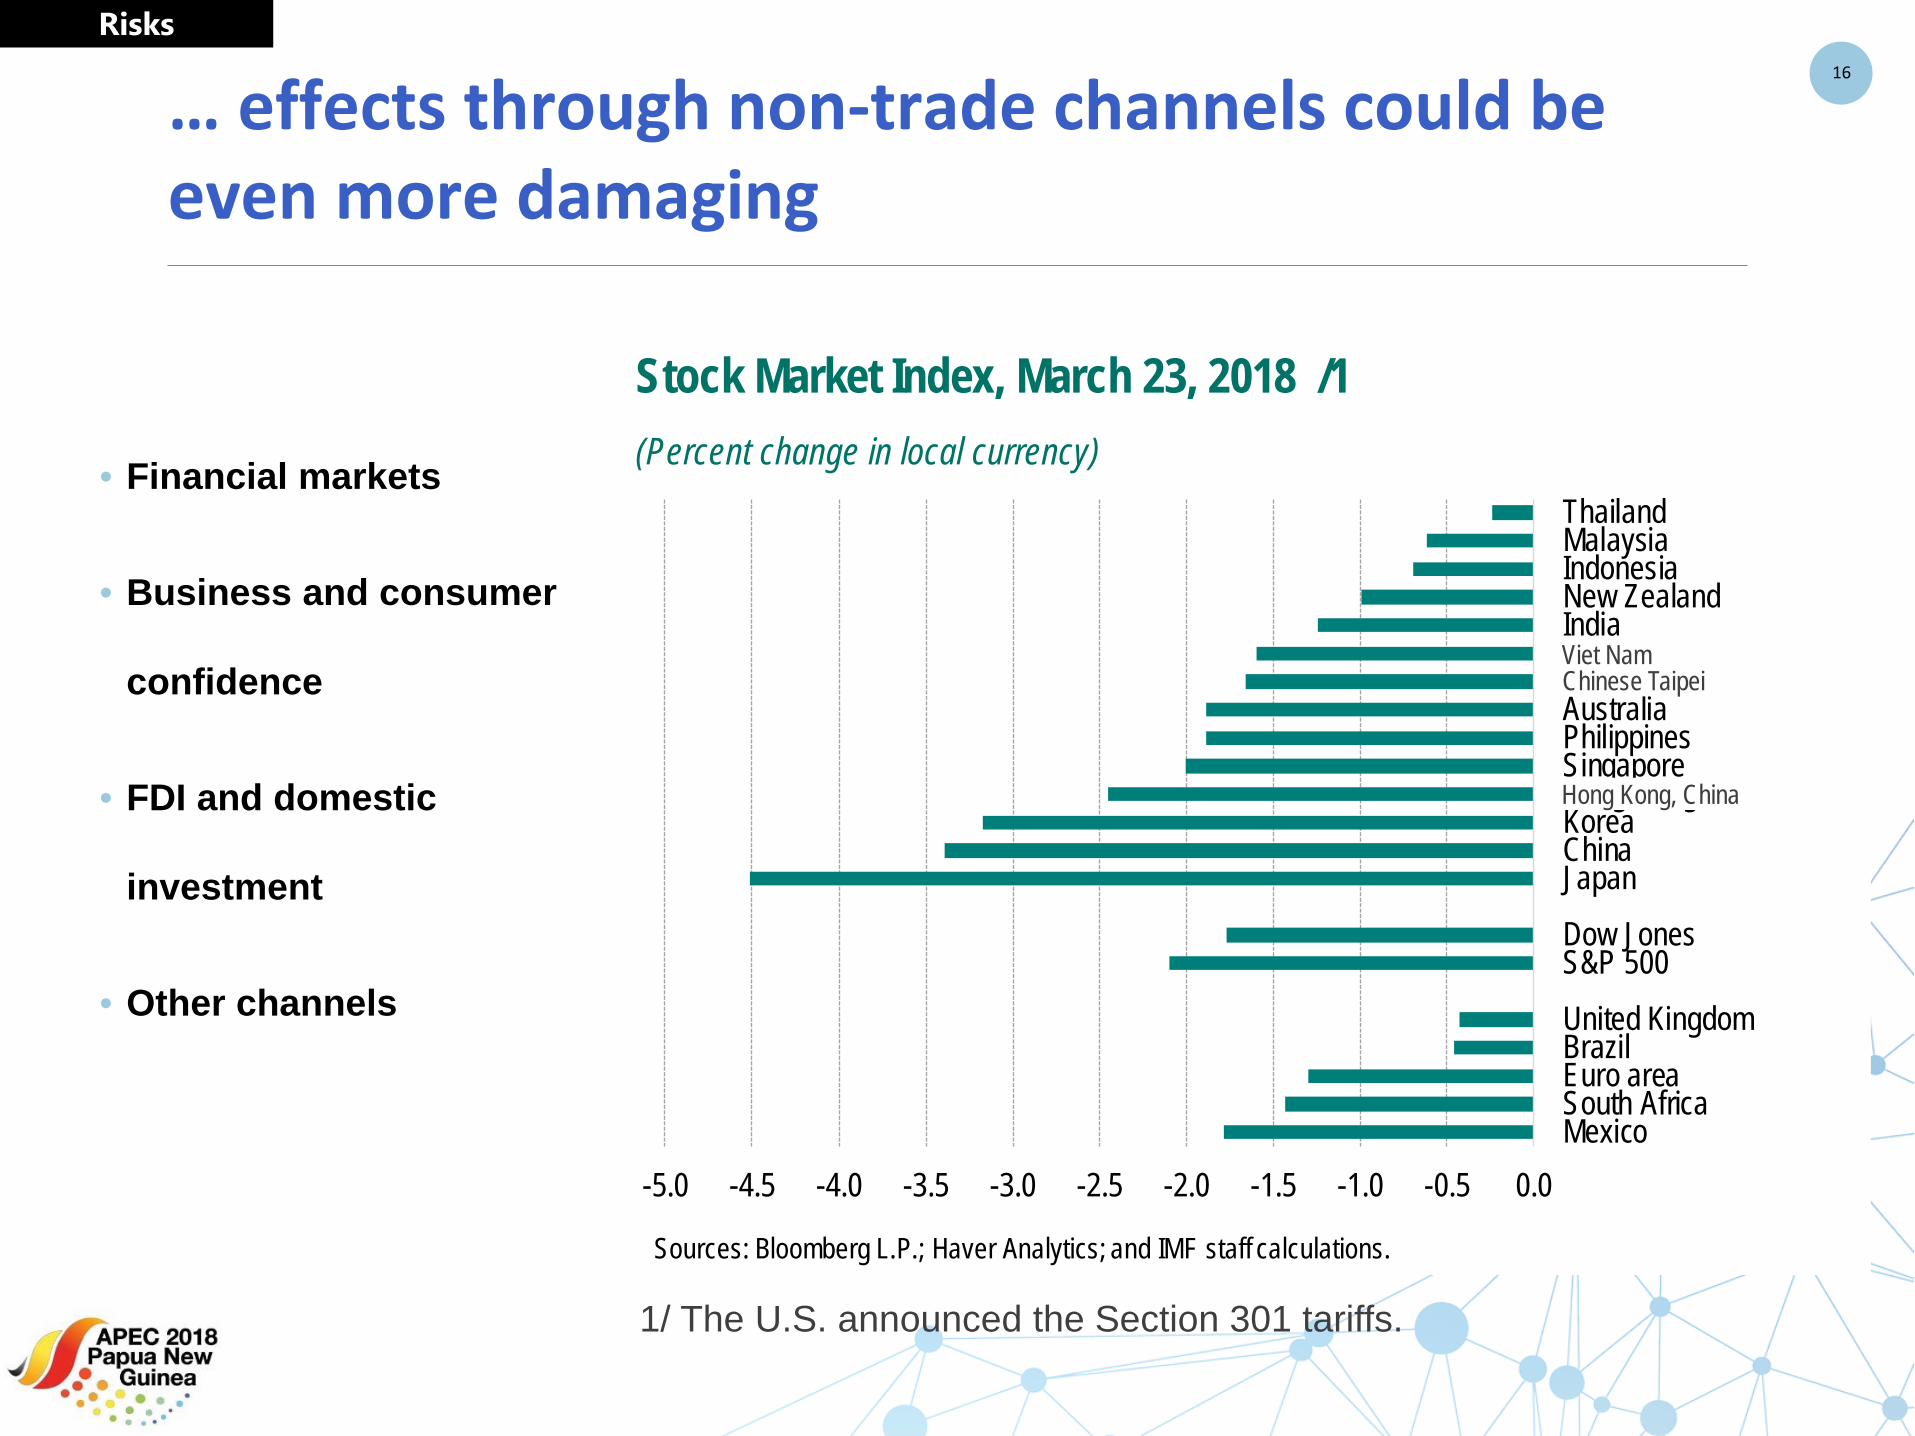
… effects through non-trade channels could be even more damaging
16
Risks
• Financial markets
• Business and consumer
confidence
• FDI and domestic
investment
• Other channels
-5.0 -4.5 -4.0 -3.5 -3.0 -2.5 -2.0 -1.5 -1.0 -0.5 0.0
ThailandMalaysiaIndonesiaNew ZealandIndiaVietnamTaiwan Province of ChinaAustraliaPhilippinesSingaporeHong Kong SARKoreaChinaJapanDow JonesS&P 500United KingdomBrazilEuro areaSouth AfricaMexico
Stock Market Index March 23, 2018(Percent change; in local currency)
Sources: Bloomberg L.P.; Haver Analytics; and IMF staff calculations.
Chinese TaipeiViet Nam
Hong Kong, China
1/ The U.S. announced the Section 301 tariffs.
Stock Market Index, March 23, 2018 /1(Percent change in local currency)

The Tax Cuts and Jobs Act could affect APEC economies in many different ways ...
17
Risks
A. Key elements of the corporate tax reform:
1. Rate cut from 35 to 21 percent
2. Expensing for 5 years (investment fully deductible for income tax purposes)
3. Shift from Worldwide to Territorial taxation
B. Many possible spillover channels:
1. Higher U.S. investment / growth positive spillovers to the economies that
have a strong trade linkage with the U.S.
2. Tax competition loss of U.S. investment? fiscal loss?
3. Deemed repatriation capital outflows

Profit repatriation: Substantial FDI from the U.S. goes to Europe, Latin America and Asia …
18
Risks
Canada7%
Europe59%
Latin America and Other Western
Hemisphere16%
Africa1%
Middle East1% Asia and
Pacific16%
U.S. Direct Investment Position Abroad (Millions of dollars, 2016)
Note: On a historical cost basis; Source: Bureau of Economic Analysis
0
10
20
30
40
50
60
Europe LatinAmerica
Asia Africa MiddleEast
Foreign Pre-Tax Income Reported byU.S. MNEs (Percent of total foreign pre-tax income; 2010–13)
Sources: US Bureau of Economic Analysis; and IMF staff calculations.

… many economies—particularly the PICs—are highly vulnerable to natural disasters
19
Risks
Note: The size of circle denotes the probability that each economy is hit by a severe (above 75th percentile) natural disaster.
Probability of a severe natural disaster during a given year

The time to repair the roof is when the sun is shining …
20
Policies
1. Look beyond the cyclical recovery: raise potential GDP and resilience with a three-pronged approach
• Make the most of the upswing; build buffers in most economies and implement structural reforms in all economies
• Fiscal policy should avoid procyclicality: improve government balances, anchor public debt, target inclusive growth
• Continue to normalize monetary policy gradually, avoid de-anchoring expectations away from inflation objectives2. Enhance fiscal and financial stability by reducing vulnerabilities
• Investors and policymakers must remain attuned to risks associated with higher interest rates and greater volatility
• Micro and macroprudential policies should be deployed and developed, as needed• Emerging market and low income economies should actively manage the level and
composition of their debts3. Continue to adapt the multilateral system to a changing global economy
• Preserve an open global trading system, avoid competitive races to the bottom, and deepen international cooperation on taxation to promote equitable and growth-friendly tax systems
• Complete and implement the financial regulatory reform agenda, while avoiding backtracking; enhance transparency of corporate and sovereign debt terms
• Cooperate to address other public-good problems (e.g., climate, migration flows, cyber risks, infectious disease)
I N T E R N A T I O N A L M O N E T A R Y F U N D
Thank you!