world invest - fundsquare.net
TRANSCRIPT

3
WORLD INVEST SICAV
Investment Company with Variable Share Capital (Société d’Investissement A Capital Variable)
with Sub-funds
Luxembourg
Audited Annual Report December 3 1,2000
a Subscriptions may not be received on the basis of financial reports. Subscriptions are valid only if made on the basis of the current prospectus supplemented by the last annual report and the most
recent semi-annual report if published thereafter.

WORLD INVEST, SICAV
Investment Company with Variable Share Capital (Societe d’Investissement A Capital Variable)
with Sub-funds
Luxembourg
Audited Annual Report December 3 1,2000

World Invest. Sicav
Table of Contents
Directors and Administration ....................................................................................................................................... 4
Board of Directors ' Report .......................................................................................................................................... 6
Auditor's Report .......................................................................................................................................................... 9
Statement of net assets as at December 31. 2000 ....................................................................................................... 10
Statement of operation for the year ended December 31. 2000 ................................................................................... 13
Statement of changes in net assets for the year ended December 31. 2000 ................................................................. 16
Main data .................................................................................................................................................................. 18
Notes io theJinancial statements as at December 31. 2000 ................................................................... .................... 20 0 Statement of assets and sectoral breakdown as at December 31. 2000 ....................................................................... 24
WORLD INVEST . BOND ....................................................................................................................................... 24 Statement of investments in securities and other net asseb ................................................................................. 24 Economic and geographical breakdown of the investment portfolio and other net assets .................................... 25
WORLD INVEST . SHARE ..................................................................................................................................... 26 Statement of investments in securities and other net assets ................................................................................. 26 Economic and geographical breakdown of the investment portfolio and other net assets .................................... 27
WORLD INVEST . NIPPON ................................................................................................................................... 28 Statement of investments in securities and other net assets ................................................................................. 28 Economic and geographical breakdown of the investment portfolio and oiher net assets .................................... 31
WUR L l l INVEST . MIXED .................................................................................................................................... -32 Sialement of investments in securities and other net assets ................................................................................. 32 Economic and geographical breakdown of the investment portfolio and other net assets .................................... 34
WORLD INVEST - FIXED INclOA4E ...................................................................................................................... 35 Statement of investments in securities and other net assets ................................................................................. 35 Economic andgeographical breakdown of the investment portfolio and other net assets .................................... 36
WORLD INVEST . T ~ C H ....................................................................................................................................... 37 Statement oj'investments in securities and other net assets ................................................................................. 37 Economic and geographical breakdown of the investment portfolio and other net assets .................................... 39
WORLD INVEST . G7 ROND ................................................................................................................................ 40 Statement of investments in securities and other net assets ................................................................................. 40 Economic and geographical breakdown of the investment port/blio and other net assets .................................... 41 I
WORLD INVEST . LA TIN AMERICA ..................................................................................................................... 42 Statement (if investment3 in securities and other net assets ................................................................................. 42 Economic and geographical breakdown of the investment portfolio and other net assets .................................... 43
Statistical information ............................................................................................................................................... 44
3
..........
World Invest, Sicav
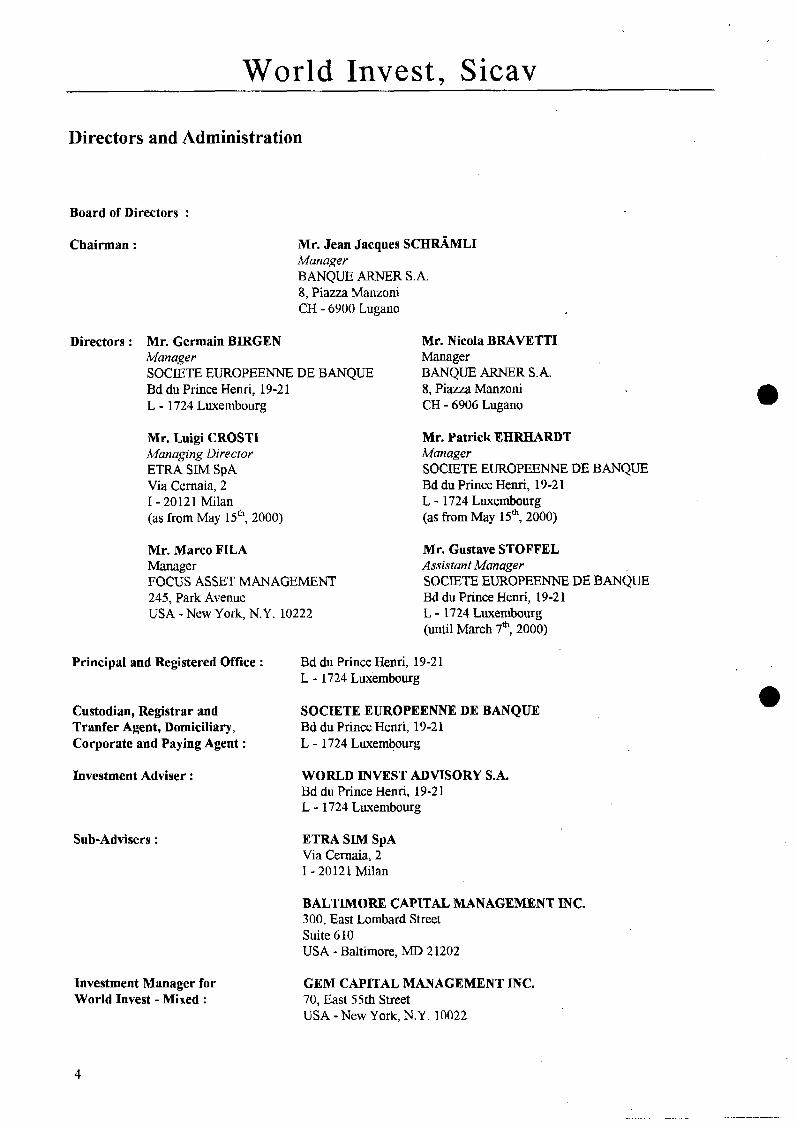
Directors and Administration
Board of Directors :
Chairman : Mr. Jean Jacques S C H R h L I Manager BANQUE ARNER S.A. 8, Piazza Manzoni CH - 6900 Lugano
Directors : Mr. Germain BLRGEN Mr. Nicola BRAVETTI Manager Manager SOCIETE EUROPEENNE DE BANQUE Bd du Prince Henri, 19-21 L - 1724 Luxembourg
BANQUE ARNER S.A. 8, Piazza Manzoni CH - 6906 Lugano
Mr. Luigi CROSTT Managing Director E T M SIM SpA Via Cernaia, 2 I - 20121 Milan (as from May 15*, 2000)
Mr. Marco FILA Manager FOCUS ASSET MANAGEMENT 245, Park Avenue USA - New York, N.Y. 10222
Mr. Patrick EHRHARDT Manager SOCETE EUROPEENNE DE BANQUE Bd du Prince Henri, 19-2 I L - 1724 Luxembourg (as from May 15*, 2000)
Mr. Gustave STOFFEL Assistant Manager
Bd du Prince Henri, 19-2 1 L - 1724 Luxembourg (until March 7th, 2000)
SOCIETE EUROPEENNE DE BANQUE
Principal and Registered Office : Bd du Prince Henri, 19-2 1 L - 1724 Luxembourg
Custodian, Registrar and Tranfer Agent, Domiciliary, Corporate and Paying Agent :
SOCIETE EUROPEENNE DE BANQUE Bd du Prince Henri, 19-2 1 L - 1724 Luxembourg
Investment Adviser :
Sub-Advisers :
lnvestment Manager for World Invest - Mixed :
WORLD INVEST ADVISORY S.A. Bd du Prince Henri, 19-21 L - 1724 Luxembourg
ETRA SLM SpA Via Cernaia, 2 I - 20121 Milan
BALTIMORE CAPITAL MANAGEMENT INC. 300, East Lombard Street Suite 6 10 USA - Baltimore, MD 2 1202
GEM CAPITAL MANAGEMENT INC. 70, East 55th Street USA - New York, N.Y. 10022
4
. . .. . . . .. . . . .. . -.

World Invest, Sicav
Investment Manager for World Invest - Tech :
Investment Manager for World Invest - G7 Bond :
Investment Manager for World Invest - Nippon :
Representation Agent, Distributor and Paying Agent in Switzerland :
Transfer Agent for Italy :
Correspondent Banks in Italy :
Auditor :
HUSK CAPITAL MANAGEMENT INC. 555, California Street Suite 2900 USA - San Francisco, CA 94104
TRENDCONCEPT VERM~GENS- VERWALTUNG GmbH Daimlerring II D - 65205 Wiesbaden
SPARX ASSET MANAGEMENT CO LTD. 2-9-3 1-201 Shiro G a n e h Minato-Ku Japan - 108-001 1 Tokyo
BANQUE ARNER S.A. 8, Piazza Manzoni CH - 6900 Lugano
FIRST EUROPEAN TRANSFER AGENT S.A. Ed Grande Duchesse Charlotte, 11 L - 13 3 1 Luxembourg (until June 30h 2001)
BANCA BRIGNONE SpA Via Verdi, 4-6 I - 20 12 1 Milano
BANCA POPOLARE COMMERCIO E INDUSTRIA Scrl Via Moscova, 33 I - 20121 Milano
DELOITTE & TOUCHE S.A. Route d'Arlon, 3 L - 8009 Strassen
The Articles of incorporation, the prospectus, the annual report and the semi-annual report may be obtained free of charge at the principal and registered office of the Sicav ox at the representation agent's office in Switzerland.
. . . . ..
5
.

Board of Directors’ Report
World Invest, Sicav
To the Shareholders of World Invest SICAV
Ladies and Gentlemen,
The evolution of financial markets in the year 2000 can be divided into two periods, the turning point being the shift from the first to second quarters. During the first part, the prosecution of the previous year’s euphoric trend particularly fostered the “New Economy” sectors, but growing doubts about the sustainability of prices and corporate earnings’ perspectives, as well as looming worries about US economy’s hard landing in early summer, soon determined less rosy stances, leading to a huge volatility, sudden sector rotations, more‘ orientation towards value rather than growth potentials. In autumn series of profit warnings and macro data pointing to a major economic slowdown, even a recession, fuelled volatility and sharper corrections, particularly among NASDAQ listings and pushed all other European and Asian indices down. The last part of the year thus saw major shifts of investments from tech sectors to more defensive and traditional choices, including large money market placements, in a wait-and-sec environment looking for fresh cconomic data and next monetary policy decisions by central banks, the Federal Reserve in particular, now playing the role of reference point for global financial markets. The same dual pattern can be found in the currency market during 2000 : until the first economic and financial troubles and uncertainties emerged in the US, the euro stayed undcr pressure, also due to Euroland’s structural problems, doubts about the enlargement process and the crratic strategy of the European Central Bank, The common currency’s collapse to historic lows compelled the ECB to take action through both rate and forex support interventions. Such moves took to a recovery, but the euro upturn still was to prove pretty frail. One of the main issues which contributed to fuel inflative concerns - particularly in Europe - and global uncertainties, was the price of oil, as a result of moody OPEC policies : after a price decline in July induced by a declared availability to increase production levels, proposed cuts inverted the price trend by year’s end. The outcome of all such causes was a huge move of capitals towards the bond market, in search of quality and safe havens, such as the US Treasuries and other top rating instruments, whilst corporate sectors were suffering due to excessive issuc volumes and the related high risk premiums. Also secondary and emerging countries had to temporarily face some sort of crisis with financial troubles in Turkey and Argentina, subsequently solved with interventions and supports by international financial institutions.
For the year 200 1, slowing growths and lower earnings momentums are to be expected, together with more expansive monetary policies, continuing volatility and turbulence likely to stabilize only in the second half of the year.
More detailed comments Follow about the scenarios in whch the SICAV’s subhnds operated and their investment policies :
WORLD rNVEST BOND
The subfund’s evolution during 2000 was affected by the central banks’ policies, which were restrictive during the first part of the year, then becoming more expansive, when evidences of economic slowdowns emerged.
The increased spread between government, top rating issues in general, and corporate, hlgh yield, emerging and secondary ones, induced high volatilities which could be overcome only in the last part of the year. The subfund, with the Swiss Franc as its reference currency, kept a large portion of CHF denominated securities in its portfolio (more than 45%), with much cash at hand and full hedging of positions in other currencies.
The ovcrall performance (+0.8% in CEIF) should then be evaluated considering a particularly rough year, and can be rated as satisfactory, also taking into account the high costs of currency hedging against the Swiss Franc, in terms of wide market rate spreads.
6

World Invest, Sicav
WORLD INVEST FIXED rNCOME
In a year marked by high volatility and diverging trends, the subfund’s cumulative performance (+3.2% in EUR) can bc viewed as positive, also compared with reference benchmarks. The fund was fully invested in its reference currency with a policy of wide issuer diversfication, and benefited both ftom top rating and primary markets situations, as well as appreciation potcntials coming from secondary issuers such as Mexico and Australia. Particularly promising are Mexican issuers, well favoured by the current political and energy orientations of the new US Presidency. In the US, we think the Federal Reserve’s expccted cuts to benefit benefit Western bond markets in general and consequently our fund’s result.
WORLD INVEST G7 BOND
The subfund’s performance (+7.7% in EUR) was particularly positive in 2000, despite a not so favourable global environment. This was made possible thanks to the fund’s peculiar features : a well diversified currency allocation (14.5% in USD, 11.8% in GBP); the quality of issuers (Government and public agencies only) and a peculiar mechanism ablc to effectively hedge the portfolio when the scenario turns set for negative rate trends (which actually happened in the first part of the year) : the model shortens maturities and neutralizes market risks, thus turning bond placements into monetary-like ones. Such pattern had the opportunity to be widely implemented during 2000, and contributed to manage both the high risk phase and the erratic scenario of uncertainty and volatility, so leading to higher performances and lower overall risk profiles in comparison to similar products.
0
WORLD INVEST MIXED
The subfund is denotninated in USD and mainly invested in US convertibles. It was negatively affected by the high volatility and huge corrections in the New Economy sectors, particularly in techs. While the year’s end performance (- 14.15Y0 in USD) looks disappointing, it should nevertheless be related to the large losses in underlying shares and reference benchmarks, not to say of the medium term fund’s return which is still remarkable. The excessive negative market mood which followed the long exuberant phase has produced a state of oversold which looks set to be overcome, thanks to the Federal Reserve’s expansive policy, the fiscal cuts proposed by the new Administration and better selectivity in the credit and US corporate issues markets. Such environment, together with an upturn at Wall Street, could take to favourable condition for thc fund’s growth, also thanks to the high quality of its portfolio.
WORLD INVEST SHARE
The equity subfund, denominated in E m , posted a negative performance of a%, however beating its major global benchmarks, such as the Morgan Stanley Cup. Int. and many market indices, due to its defensive approach, quality orientation, portfolio value and decreased positions in tech sectors.
Moreover, the giving up of Japanese and other Asian invcstments as well as the currency hedgmg of residual positions in USD, contributed to mitigate the effects of strong market turbulences. Contributions also came from the presence in the fund’s portfolio of defensive and traditional shares, with high quality Swiss groups, and the well balanced portfolio’s currency diversification (43% in USD, 12% in GBP and 11.6% in CKF).
The large portion of cash available (more than 15%) and increasing orientation to quality should lead to good results once the current period of uncertainty about the path of US economy is over.
7
.

World Invest, Sicav
WORLD INVEST TECH
Strong downturns and endless corrections penalized the US tech sectors - the core of the subfund’s portfolio. The year end’s performance (-35.26% in USD) is slightly better if compared with the NASDAQ index and other major benchmarks, but nevertheless reflects the diffused pessimism which wrapped the markets after a long period of strong and continuing rally. The fund still stands in the top range among competitors’ scoreboards on a short term basis and particularly for its mediutn term high returns. There are some peculiar features to consider : even if many valuations of New Economy sharcs can be vicwed as inflated in terms of corporate fundamentals, the fund actually holds high quality shares, with intrinsec value and rosy perspectives. Moreover, an upturn in tech sectors is set to materialize in the coming months, because tcch investmcnts are now essential in maintaining and increasing corporate productivity and keeping market positions. Many US groups have strong competitive advantages in domains (e.g. semiconductors, telecommunications, advanced media) well present in the fund’s portfolio, together with promising companies on the hedge between Old and New Economies, such as aerospace and defence, likely set for interesting growths in the coming years.
WORLD INVEST NIPPON
While Japan went through huge economic and institutional transformations, the subfund’s investment policy proved particularly valid in the year 2000. Although reforms in the banlung and conglomerate sectors are just begnning to produce positive results, and Government interventions so long failed to substantially fuel domestic consumes and investments, the overall scenario is set to improve during 200 1. The revolutionary move by the Bank of Japan, the first rate increase in ten years, was a signal due to break the deflative syndrome, at least psychologically, and accelerate reform momentums for banks and corporations. The fund’s policy just reflects such evolutive scenario, the volatility and sector decoupling which marked the Japanesc stock market: while the new scenario looks more favourable to the yen devaluation, the sclection included the best positioned global exporters and the innovative sectors with hgher growth potentials, e.g. advanced scrvices, electric equipments, distribution and logMiCs, plus a share of cash (more than 13%). The year’s end performance (-7.2yo in JPY), unsatisfactory in absolute terms, can be however rated much better than the Nikkei index itself by more than 20%.
WORLD INVEST LATIN AMERICA
For the Latin American markets the year 2000 was a period of transition and attainment of a more specific identity, also through the declared plans of the newly elected US Administration.
Despite high, and sometimes not so much reasonable correlations to US equity indices - the NASDAQ in particular - local markets started to develop local own themes, in line with huge transformations in local banking systems, utilities and infrastructure networks - mainly telecoms - more rational exploitations of natural resources.
Countries such as Mexico can greatly benefit from the new US global plans and energy policies, aimed to make North America less depcndent on Arab oil imports. During the year 2000 the fund’s manager made the most of such themes, holding Brazilian and Mexican high quality shares, listed in the form of American Depositary Receipts on the US markets.
The year’s performance (-13.7% in USD) although some bettcr than regional benchmarks, was negatively affected by the high correlation with US domestic indices and the worries induced by the Argentinian financial crisis in October, soon overcome thanks to the interventions of international financial institutions.
Luxembourg, 2 1 ”, March 200 1 The Board of Directors
8

World Invest, Sicav
Auditor's Report
To the Shareholders of W O W D INVEST (Investment Company with Variable Share Capital with Sub-Funds)
Luxembourg
We have audited the financial statements, which consist of the combined statement of net assets, the combined statement of operations and the notes to the financial statements of WORLD INVEST as well as the statement of net assets, the statement of operations, the statcment of changes in net assets and the statements of investments in securitities and other net assets of each of its sub-funds for the year ended December 31,2000. These financial statements are the responsibility of the Board of Directors of the SICAV. Our responsibility is to express an opinion on these financial statements based on our audit.
We conducted our audit in accordance with International Standards on Auditing. Those Standards require that we plan and perform the audit to obtain reasonable assurance about whether the financial statements are free of material misstatement. An audit includes examining, on a test basis, evidence supporting the amounts and disclosures in the financial statements. An audit also includes assessing the accounting principles used and significant estimates made by the Board of Directors of WORLD INVEST in preparing the financial statements, as well as evaluating the overall financial statements' presentation. We believe that our audit provides a reasonable basis for our opinion.
I)
In our opinion, the attached financial statements described above give, in accordance with the Luxembourg legal and regulatory requirements, a true and fair view of the financial position of WORLD INVEST and each of its sub-funds at December 3 1,2000 and the results of thcir operations and changes in its net assets for the year then ended.
Supplementary information included in the annual report has been reviewed in the context of our mandate but has not been subject to specific audit procedures carried out in accordance with the standards described above. Consequently, we express no opinion on such information. We have no observations to make concerning such information in the contcxt of the financial statemcnts taken as a whole.
DELOITTE & TOUCHE S.A.
Rhseur d'Entreprises
E. van de Kerkhove
Partner
Luxembourg, 2 1'' March 200 1
9
World Invest, Sicav ~ ~~ ~
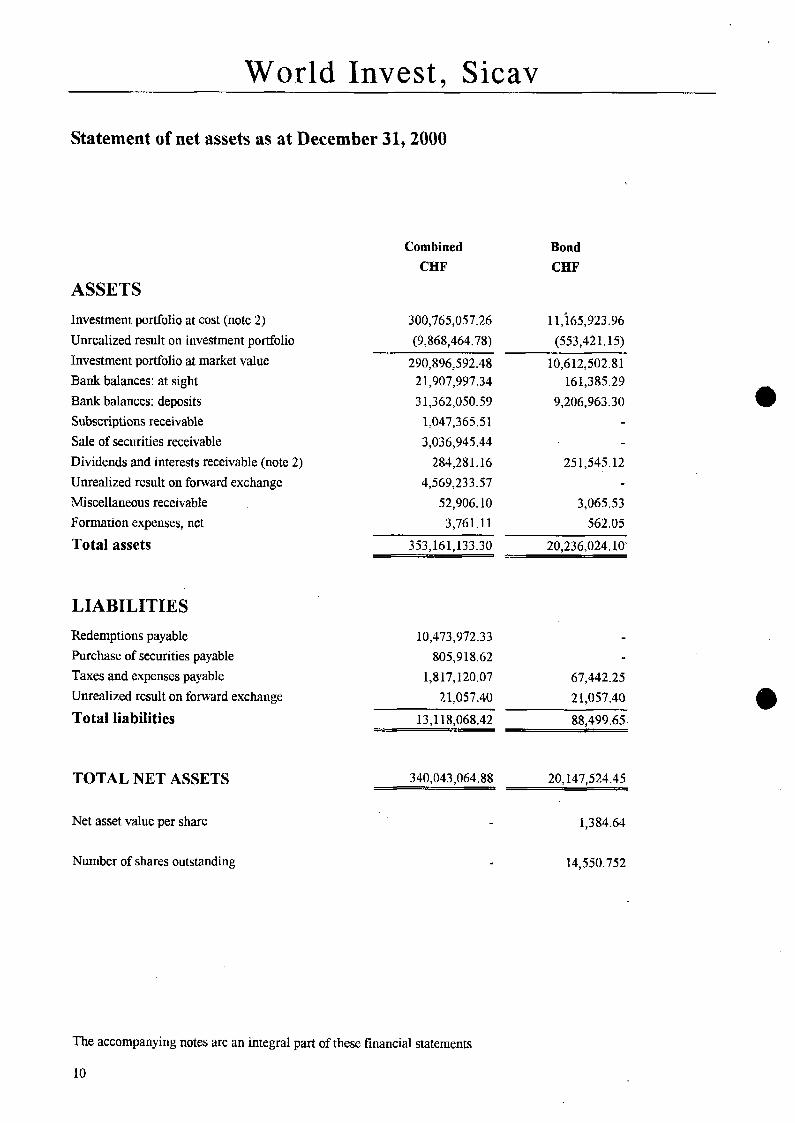
Statement of net assets as at December 31,2000
Combined CHF
Bond CHF
ASSETS Investment portfolio at cost (note 2) Unrealized result on investment portfolio Investment portfolio at market value Bank balances: at sight Bank balances: deposits Subscriptions receivable Sale of securities receivable Dividends and interests receivable (note 2) Unrealized result on forward exchangc Miscellaneous receivable Formation expenses, net
Total assets
LIABILITIES Redemptions payable Purchase of securities payable Taxes and expenses payable Unrealized rcsult on forward exchange
Total liabilities
TOTAL NET ASSETS
Net asset value per share
Number of shares outstandlng
300,765,057.26 11,165,923.96 (9,868,464.78) (553,421.15)
290,896,592.48 10,612,502.81 2 1,907,997.34 161,385.29 3 1,362,050.59
1,047,365.5 1 3,036,945.44
284,281.16 4,569,233.57
52,906.10 3,761.11
353,161,133.30
9,206,963.30
25 1,545.12
3,065.53 562.05
20.236.024.10'
10,473,972.33 805,918.62
1,817,120.07 67,442.25 2 1,057.40 2 1,057.40
13,118,068.42 88,499.65-
340,043,064.88 20,147,524.45
1,384.64
14,550.752
The accompanying notes are an integral part of these financial statements
10

World Invest, Sicav
Share EUR
45,474,400.54 1,939,826.95
37,414,227.49 5,442,004.74 4,000,000.00
19,411.60
18,185.87 1,475,125.70
7,641.09 676.96
58,377,273.45
Nippon Mixed Fixed Income JPY USD EUR
1,93 1,539,984 30,983,599.42 6,25 1,433.20 (298,45 1,984) (1,198,609.12) 4,459.82
1,633,088,000 27,784,990.30 6,255,893.02 276,303,642 2,009,776.86 298,947.04
400,000.00 2,02 1,304
26,816,643 274,963 (76 1,649.48) 17 1,702.37
192,3 16 4,587.10 1,25 1.18 6,157 540.83 57.75
1,938,703,025 3 1,038,445.61 - 7,127,853.36
587,605.92 20,228,400 2,026,323.83 142,311.96 20,237,867
350,817.98 11,242,458 169,863.30 27,884.80
938,423.90 5 1,708,725 2,196,187.13 170,196.76 0
57,438,849.55 1,886,994,300 28,842,258.48 6,957,656.60
1,528.56 3733 1 205.79 565.12
37,577.056 50,278.199 140,152.347 12,3 11.873
The accompanying notcs are an integral part of these financial statements
11

World Invest, Sicav
Tech 6 7 Bond Latin America USD EUR USD
ASSETS Investment portfolio at cost (note 2) Unrealized result on investment portfolio Investment portfolio at market value Bank balances: at sight Bank balances: deposits Subscriptions receivable Sale of securities receivable Dividends and interests receivable (note 2) Unrealized result on forward exchange Miscellaneous receivable Formation expenses, net
Total assets
44,6 15,870.64 35,883,719.94 4,759,079.91 (3,543,265.01) (63,038.92) ’ (203,527.35)
4 1,072,605.63 35,820,68 1.02 4,555,552.56 2,774,865.24 244,981.62 660,689.65
10,200,689.94 07,663.02 548,376.90
1,650,669.87 2,946.65 612,359.62 2 1,02 1.79
1,536,039.74 9,730.43 6,426.74 509.57
43 1.99 5 10.40
45,608,912.83 48,969,6 15.58 5,238,283.97
LIABILITIES Redemptions payable 3,506,8 17.70 110,203.30 Purchase of sccurities payable 323,366.30 Taxes and expenses payable 251,676.22 189,098.16 31,449.40 Unrealized result on forward exchange
Total liabilities 4,081,860.22 299,301.46 3 1,449.40
TOTAL NET ASSETS 4 1,527,052.6 1 48,670,3 14.12 5,206,834.57 -
Net asset value per share 448.48 659.46 79.68
Number of shares outstanding 92,595.570 73,802.926 65,348.176
The accompanying notes are an integral part of these financial statements
12

World Invest, Sicav
Statement of operation for the year ended December 31,2000
Combined Bond CHF CHF
INCOME
Income from investment portfolio, net (note 2) Bank interests, net Recovery of provisions
Total income
EXPENSES e Custodian fees Advisory fees (notc 3) Performance fees (note 3) Subscription tax (notc 4) Audit fees Domiciliation fees Safecustody fees Correspondent bank fees Administration fees Miscellaneous fees Amortization of formation expenses (note 2)
Total expenses
Net investment income (loss)
Net realized gain (loss) on: a investment portFolio foreign exchange forward exchange futures
Net realized gain (loss)
Variation of the unrealized result on: investment portfolio foreign exchange forward exchange futures
Result of the operations
5,402,200.08 737,778.3 1
1,374,176.59 315,983.61 28,580.09 1,055.91
7,404,956.76 1,054,817.83
630,881.75 6,796,O 19.27 3,362,234.56
228,185.15 53,7 15 -43 5,907.22 8,407.22
5 I, 194.08 149,508.30 324,329.59
7,538.75
38,652.18 202,725.20
12,129.03 6,509.15
397.07
3,741.17 3,826.4s 9,800.91
748.72
1 1,6 17,92 1.32 278,529.88
(4,2 12,964.56) 776,287.95
7,287,147.14 386,549.34 2,382,456.64 367,876.46
(3,074,135.79) ' (597,883.16) (675,122.83) 12,599.34
5.920.345.16 169.14 1.98
(59,891,170.60) (71 1,418.88) (1,773,557.17) (207,124.61).
5,925,977.60 155,274.10 (161,249.25)
(54,192,618.82) 182,160.54
The accompanying notes are an integral part of these financial statements
13

World Invest, Sicav
Share EUR
Nippon JPY
INCOME
Income from investment portfolio, net (note 2) Bank interests, net Recovery of provisions
Total income
EXPENSES
Custodian fees Advisory fees (note 3) Performance fees (note 3) Subscription tax (note 4) Audit fees Domiciliation fees Safecustody fees Correspondent bank fees Administration fees Miscellaneous rees Amortization of formation expenses (note 2)
Total expenses
497,726.95 8,341,302 218,451.36 6,166
3,64 1.26 83,646 719,819.57 8,43 1,114
94,050.71 1,188,994.81
35,467.88 8,380.16
870.49 1,604.4 1
3,012.34 27,732.40 65,53 1.62
830.41
3,03 5,949 33,430,763
1,016,485 276,226
20,3 19 424,198 264,623 475,855
3,266,094 7,417
1,426,484.28 42,217,929
Net investment income (loss) (706,664.71) (3 3,786,8 15) -- 2
Net realized gain (loss) on: investment portfolio forcign exchange forward exchangc futures
Net realized gain (loss)
Variation of the unrealized result on: investment portfolio foreign exchange forward exchange futures
8,211,105.45 123,848,669 (173,796.79)
8,037,308.66 123,848,669
(12,504,968.25) (284,395,694) (5 3,979.28) 12,681
1,475,125.70
Result of the operations (3,753,177.88) (194,321,159)
The accompanying notes are an integral part of these financial statements
14

World Invest, Sicav
Mixed Fixed Income Tech G7 Bond Latin America USD EUR USD EUR USD
539,714.24 298,125.76 3,875.55 1,559,138.83 60,669.33 79,322.33 3 1,228.51 333,823.86 368,020.33 , 34,259.24
3,797.16 711.69 6,222.38 1,704.12 628.85
622,833.73 330,065.96 34332 1.79 1,928,863.28 95,557.42
55,544.67 14,974.27 103,076.44 74,032.78 10,021.86 679,708.47 82,823.44 1,313,244.81 553,243.10 88,404.16
26,85 1.5 1 2,017,226.45 42,860.97 20,228.24 4,12 1.71 39,121.74 27,554.98 2,632.43 4,426.00 1,030.62 6,259.79 7,010.78 734.44
538.16 171.79 934.62 779.14 54,.29
3,436.87 1,203.17 14,287.36 3,403.02 2,241.58 25,620.64 1,427.13 24,15 1.93 8,662.39 870.88 18,331.59 3,541.33 48,446.80 33,892.05 2,928.17
720.45 470.88 575.30 745.12 926.02
835,406.60 109,764.34 3,567,325.24 709,323.96 15 1,674.80
(2 12,572.87) 220,301.62 (3,223,403.45) 1,219,539.32 (56,117.38)
e (8 1,85 1.63)
-
(81.85 1.63)
(4,926,808.69)
(5.221.233.19)
(384,996.85) (4,558,844.55) 606,664.18 (100,877.85) (3,83 3.3 0) (45.47) 1,505,331.03
- (1,63 1,904.96) - (453,224.04)
(388,830.15) (4,558,890.02) 26,866.2 1 -- (100,877.85)
372,745.53 (18,287,498.40) 888,357.31 (443,07 1.63) (28.01) (708.57) (977,634.59) (3 4.84)
2,327,894.86 - (106,266.80)
(26,070,500.44) 3,378,756.31 (600,101.70) 204,188.99
The accompanying notes are an integral part of these financial statements
15

World Invest, Sicav
Statement of changes in net assets for the year ended December 31,2000
Bond
CHF
Share
EUR Nippon
SPY
Net assets at the beginning of the year 22,780,855.65 53,248,490.27 1,142,107,021
Net investment income (loss) 776,287.95 (706,664.7 1) (33,786,8 15)
Net realized gain (loss)
Subscriptions
Redemptions
Variation of the unrealized result on:
investment portfolio
foreign exchange
forward exchange
futures
Net assets at the end of the year
169,141.98 8,037,308.66 123,848,669
23,726,285.58 60,579,134.22 1,232,168,875
220,234.35 16,258,119.07 1,234,897,928
(3,035,726.09) (8,3 1438 1.9 1) (295,689,490)
(2,815,491.74) 7,943,537.16 ' 939,208,438
(711,418.88) (12,504,968.25) (284,395,694)
(207,124.61) (53,979.28) 12,681
155,274.10 1,475,125.70
20,147,524.45 57,438,849.55 1,886,994,300
The accompanying notes are an integral part of these financial statements
16
World Invest, Sicav
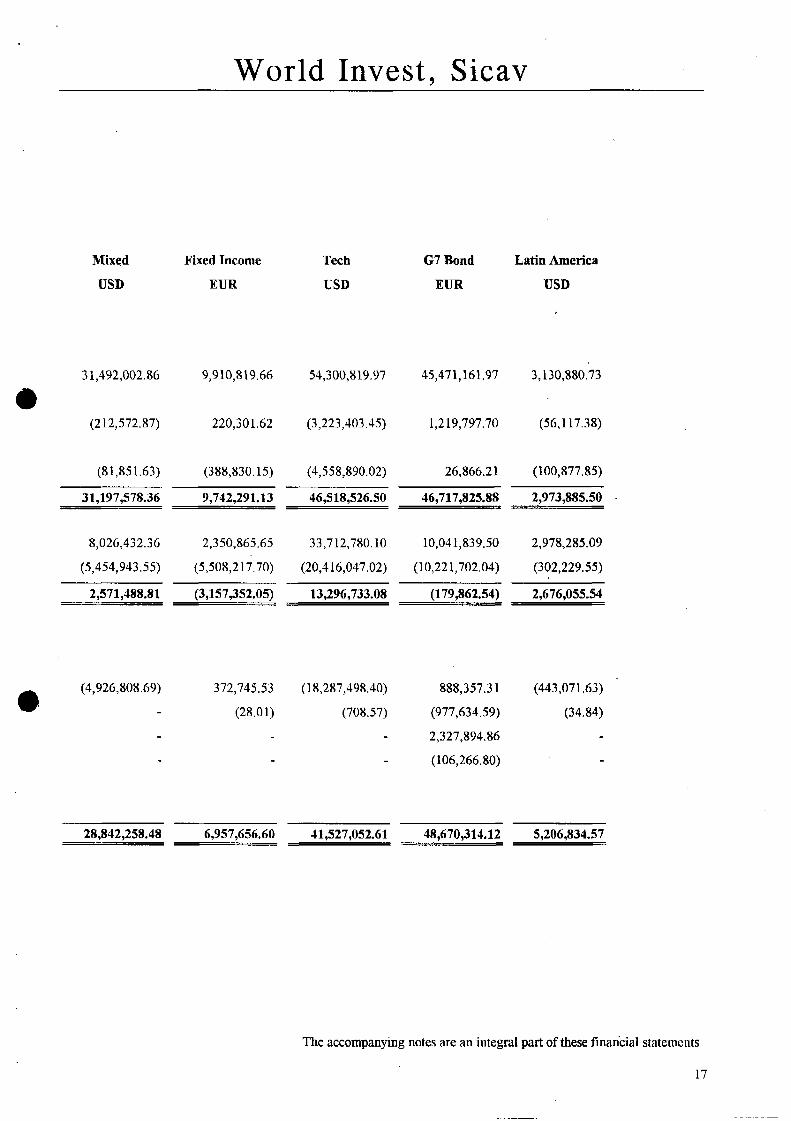
Mixed Fixed Income Tech
USD EUR USD 6 7 Bond Latin America
EUR USD
3 1,492,002.86 9 3 10,819.66 54,300,819.97 45,471,161.97 3,130,880.73
(2 12,572.87) 220,301.62 (3,223,403.45) 1,2 19,797.70 (56,117.38)
(81,851.63) (388,830.15) (4,558,890.02) 26,866.21 (100,877.85)
31,197,578.36 9,742,291.13 46,518,526.50 46,717,825.88 2,973,885.50 . A s - ,
8,026,432.36 2,350,865.65 33,712,780.10 10,041,839.50 2,978,285.09
(5,454,943.55) (5,508,217.70) (20,416,047.02) (10,221,702.04) (302,229.55)
2,571,488.81 (3,157,352.05) 13,296,733.08 (179,862.54) 2,676,055.54
372,745.53 (18,287,498.40) 888,357.3 1 (443,071.63)
(28.0 1) (708.57) (977,634.59) (34.84)
2,327,894.86
(106,266.80)
28,842,258.48 6,957,656.60 41,527,052.61 48,670,314.12 5,206,834.57
The accompanying notes are an integral part of these financial statemcnts
17

World Invest, Sicav
Main data
Bond
31/12/00 3 111 2/99 3 111 2/98
CHF CHF CHF
Nct assets
Number of shares outstanding
Net asset value per share
20,147,524.45 22,780,855.65 31,353,593.27
14,550.752 16,585.752 22,949.280
1,384.64 1,373.52 1,366.21
Share
3 11 12100 31/12/99 3111 2/98
EUR EUR XEU
Net assets
Number of shares outstanding
Net asset value per share
S7,43 8,849.5 5 53,248,490.27 43,967,479.07
37,577.056 . 32,759.999 38,278.327
1,528.5G 1,625.41 1,148.63
Nippon
31/12/00 3 111 2/99 31/12/98
P Y JPY JPY
Nct assets
Number of shares Outstanding
Net asset valuc per share
1,886,994,300 1,142,107,021 49,072,555
50,278.199 28,223.394 1,456.751
37,531 40,467 33,686
Mixed
3 1/12/00 31/12/99 31/12/98
USD USD USD
Net assets
Number of shares outstanding
Net asset valuc per slkxe
28,842,258.48 3 1,492,002.86 32,552,949.30
140,152.349 131,375.328 169,795.363
205.79 239.71 191.72
The accompanying notes are an integral part of these financial statements
18

World Invest, Sicav
Fixed Income
31/12/00 31/12/99 31/12/98
EUR EUR XEU
Net assets
Number of shares outstanding
Net asset value per share
6,957,656.60 9,910,819.66 , 9,392,054.17
18,109.095 16,954.114
565.12 547.28 553.97
12,311.873
Tech
3 111 2/00 31/12/99 31/12/98
USD USD USD
Net assets
Number of shares outstanding
Net asset value per sharc
6 7 Bond
Net assets
Number of shares outstanding e
Net assct value per share
Latin America
Net assets
Number of shares outstanding
Net asset value per share
41,527,052.61 54,300,819.97 20,682,249.46
923 95.570 78,384.863 68,622.700
448.48 692.75 301.39
31/12/00
EUR
48,670,055.74
73,802,926
659.46
31/12/00
USD
5,206,834.57
65,348.176
79.68
31/12/99
EUR
45,47 1,161.97
74,323 .O 16
61 1.80
31/12/99
USD
3,130,880.73
3 3,8 18.066
92.58
31/12/98
DEM
78,430,570.91
66,878.972
1,172.72
3 1/12/98
USD
2,188,385.4 1
32,199.246
67.96
The accompanying notes are an integral part of these financial statements
19

World Invest, Sicav
Notes to the financial statements as at December 31,2000
Note 1 - General
WORLD INVEST, hereafter named “the SICAV”, is an open-ended investment company under Luxembourg law. It was incorporated For an unlimited duration in Luxembourg on October 24, 1990 in accordance with the provisions of the law of March 30, 1988 on undertakings for collective investment and of the law of August 10, 1915 on commercial companies. In particular, it is subject to the provisions of part I of the law of March 30, 1988, specific to undertakings for collective investmcnt in transferable securities (UCITS) as def!ned in the Directivc of the Council of the European Community of December 20, 1985 (8516 1 l//EEC).
The company is qualified as a “Socictc d‘Investissement ii Capital Variable” (SICAV) composed of different sub- funds, each of them having spccific asscts resulting from a stated investment policy. Every sub-hnd is represented by a different share class.
The objective of the SICAV is to offer its shareholders easy access to the different markets of transferable securities while ensuring observance of the principle of risk spreading. All transferable securities purchased are quoted on an official stock exchange or dealt in on a regulated market which operates regularly, is recognised and open to the public.
The share classes represent the following sub-funds, all operational :
- WORLD INVEST - BOND - WORLD INVEST - SHARE - WORLD INVEST - NWPON (” - WORLD INVEST - MIXED (*)
WORLD INVEST - TECH (3)
WORLD INVEST - G7 BOND (4)
- WORLD INVEST - FMED INCOME - - - WORLD INVEST - LATIN AMERICA
SPARX ASSET MANAGEMENT Co LTD, 2-9-3 1-201 Shino Ganedai Minato-Ku, Japan-108-0011 Tokyo has been appointed “Tnvestmcnt Manager” for the management of the net assets of the sub-fund World Invest - Nippon. A copy of the contract signed by the Sicav and the Manager can be obtained at the principal and registered office of the Sicav and of the Representation agent in Switzerland.
GEM CAPITAL MANAGEMENT Inc., 70, East 55th Street, New York has been appointed “Investment Manager” €or the management of the net assets of the sub-fund World Invest - Wxed. A copy of the contract signed by the Sicav and the Manager can be obtained at the principal and registered office of the Sicav and of the Representation agent in Switzerland.
HUSIC CAPITAL MANAGEMENT, 555 California Street, Suite 2900 San Francisco has been appointed “Investment Manager” for the management of the net assets of the sub-fund World Invest - Tech. A copy of the contract signed by the Sicav and the Manager can be obtained at thc principal and registered office of the Sicav and of the Representation agent in Switzerland.
TRENDCONCEPT VERM6GENSVERWALTUNG GmbH, Daimlerring 1 1, Wiesbaden has been appointed “Investment Manager” for the management of the net assets of the sub-fund World Invest - G7-Bond. A copy of the contract signed by the Sicav and the Manager can be obtained at the principal and registered ofice of the Sicav and of the Representation agent in Switzerland.
Note 2 - Summary of significant accounting policies
a) Valuation of the investment sccurities’ portfolio : - securities listed on any official stock exchange or traded on any other regulated market whch operates
regularly and is recogniscd and open to the public, are valued at the last quoted price;
20

World Invest, Sicav
- for securities not listed on an offcial stock exchange or not traded on another regulated market or on any other market which operates regularly and is recogniscd and open to the public, the value is the most lrkely sale price prudently and in good faith;
- thc difference betwecn the value of zero coupon bonds, as disclosed in the statement of investments in securities and other net asscts, and the cost is recorded as “dividends and interests receivable” in the statement of net assets and as “income from investtnent portfolio, net” in the statement of operations;
- net realiscd gains or losses on investment securities are calculated on the basis of average cost of the securities sold.
b) Formation expenses : - Formation expenses are written off over 5 years.
c) Forcign exchange transaction per sub-fund : - The accounting records of each sub-rimd are kept in the corresponding valuation currency; Statements of net
assets are established in the referencc currency of the sub-fund and the combined statcment in CHF; Bank balances, other net assets, as well as the valuation of securities in the portfolio expressed in any currency other than the refercnce currency of thc sub-fund, are transferrcd into the reference currency of the sub-fund at the exchange rate of the valuation day; Income and expcnscs in any currency other than the reference currency of the sub-fund are calculated at the cxchange rate of the calculation day; Gains or losses on foreign exchange transactions are taken into considcration in the Statemcnt of operations.
The main exchange rates used as at December 3 I , 2000 were the following : 1 EUR = 1.517400CHF 1OOJPY = 1.407995 CHF 1 USD. = 1.611084 CHF
Note 3 - Advisory fee
On October 24, 1990 the SICAV signed a contract for an unlimited duration with WORLD INVEST ADVISORY S.A. in order to receive its rccommendations and advice on the choice of investments and the securities to buy and sell.
0 WORLD INVEST ADVISORY S.A. was incorporated on Octobcr 24, 1990 as a holding company under Luxembourg law. Its subscribed capital amounts to EUR 75,000.- and its only activity consists in giving investment advice to WORLD INVEST.
At the end of every quarter, the Investment Advisor receives, in remuneration for its services, a fee bascd on the Net Asset Value of every sub-fund calculatcd at the end of the same quarter.
The annual rates per sub-fund are as follows : - World Invest - Bond : - World Invest - Share : - World Invest - Nippon : - World Invest - Mixed : - World Invest - Fixed Income : - World Invest - Tech : - World Invest - G7 Bond : - World Invest - Latin America :
1.00 % p.a. of net assets 2.00 % p.a. of net assets 2.00 % p.a. of net assets 2.00 % p.a. of net assets 1.20 ‘YO p.a. of net assets 2.00 % p.a. of net assets 1.20 ‘YO p.a, of net assets 2.00 % p.a. of net assets
21

World Invest, Sicav Moreover, the sub-funds are subject to a performance fee as follows :
WORLD INVEST-MIXED For this sub-fund, a performance fee, if applicable, shall be paid and calculated as follows : The commission will be based on the difference between the last computed net asset value per share as at the end of a 12 month period and the first computcd net asset value per share as at the beginning of that 12 month period. The fee shall be equal to 10% of the difference so determined multiplied by the average number of shares of the respective sub-fund outstanding during that period and will be payable to the Advisor at the beginning of the following period. No performance fee shall be paid in the case the net asset value as at the end of a period is lower than the highest net asset value as at the end of any prior period.
WORLD INVEST-TECH For this sub-hnd, a performance fee, if applicable, shall be calculated and paid as follows : The commission will be based on the difference between the last computed net asset value per share as at the end of a 12 month period and the first computed net assct value per share as at the beginning of that 12 month period (the first period starting on 1 October 1996). The fee shall be equal to 15% of the difference so determined multiplied by the average number of shaes of the respective sub-fund outstanding during that period and will be payable to the Advisor (and in part to the Manager) at the beginning of the following period. No performance fee shall be paid if the net asset value as at the end of a period is lower than the highest nct asset value as at the end of any prior period.
e
WORLD INVEST-LATIN AMERICA For this sub-fund, a performance fee, if applicable, shall be calculated and paid as Follows : The commission will be based on the difference between the last computed net asset value per share as at the end of a 12 month period and the first computed net asset value per share as at the beginning of that 12 month period (the first period starting on 1 October 1999). The fee shall be equal to 10% of the diffcrence so determined multiplied by the average number of shares of the respective sub-fund outstanding during that period and will be payable to the Advisor at the bepnning of the following period. No performance fee shall be paid if the net asset value as at the end of a period is lower than any net asset value due as at the end of any former period starting October la*, 1999.
WORLD INVEST-NLPPON For this sub-fund, a performance fee, if applicable, shall be calculated and paid as follows : The commission will be based on the difference between the net asset value per share at the end of the relevant financial year and the net asset value per share of the same sub-fund at the end of the previous financial year. The fee shall be equal to 15% of the difference so determined multiplied by the average number of shares of the respective sub-hnd outstanding during the year and will be payable to the Advisor at the beginning of the following financial year. No performance fee shall be paid in the case the net asset value per share at the end of the relevant period is lower than the highest net asset value per share of any closing period at a date some time after January 15'h, 2000 or if the net asset value per share at the end of the former period is lower than the net asset value per share calculated on January 17fh, 2000.
The performance fees shall be calculated each time the net asset value is determined and, if necessary, charged to the net asset value of the relevant sub-fund, but in no case shall be computed on a pro-rata basis during the financial year or period.
22

World Invest, Sicav Note 4 - Subscription fee (“Taxe d’Abonnement”)
The annual subscription tax is 0.06% of the Net Assets. The basis for taxation is represented by the total Net Assets of the Sicav calculated at the end of each quarter.
Note 5 - Changes in the composition of the investment securities portfolio of each sub-fund
The list of all transactions in the investment securities portfolio of each sub-fund of the Sicav may be obtained free of charge upon request at the registered office of the Sicav, the Representation Agent in Switzerland and thc Correspondent Banks in Italy.
Note 6 - Memorandum accounts
Forwurd exchanges transactions :
World Invest - Bond
Purchase CHF 2,102,100.00 against EUR 1,400,000.00 Val. 17.01.01
World Invest - Share
Purchase Purchase Purchase Purchase Purchase Purchase Purchase Purchase
EUR EUR EUR EUR EUR EUR EUR EUR
2,964,817.50 against 3,061,344.64 against 3,419,972.64 against 2,897,542.88 against 2,963,841.14 against 2,s 15,3 15.32 against 2,793,296.09 against 2,694,836.69 against
CHI: USD GBP USD USD USD USD USD
4,500,000.00 Val. 2,600,000.00 Val. 2,000,000.00 Val. 2,500,000.00 Val. 2,500,000.00 Val. 2,500,000.00 val. 2,500,000.00 Val. 2,500,000.00 Val.
3 1.01 .O 1 3 1.01.01 31.01.01 31.01.01 3 1 .O 1 .O 1 31.01.01 30.03.01 30.03.01
World Invest - G7 Bond
Purchase EUR 6,193,868.07 against JPY 600,000,000.00 Val. 07.03.01 Purchase EUR 4,971,002.49 against GBP 3,000,000.00 val. 28.02.01 Purchase EUR 2,984,183.83 against CAD 4,000,000.00 Val. 15.02.01
I) Purchase EUR 6,768,189.51 against USD 6,000,000.00 val. 07.03.01 Purchase EUR 2,993,563.84 against CAD 4,000,000.00 Val. 15.02.01
23

.- - ..- . . . . .. .
World Invest, Sicav
Statement of assets and sectoral breakdown as at December 31,2000
WORLD INVEST - BOND
Statement of investments in securities and other net assets as at December 3 1, 2000
(in CHI?)
Currency Qty Description
% of cost Valuation net
as at 3 1.12.00 assets
Transferable securities admitted to an official listing on a s-tnck exchange - shares EUR 500 World Invest - G7 Bond 41 1,663.58 Total transferable securities admitted tu an otllcial listing on a stock exchange - shares 41 1,663.58
Transferuble securities admitted to an official lis-ting on a stock exchange - bonds USD 400,000 UK Treasury FRN 96/10.10.01 549,995.02 GBP 490,000 EIB 7,25%, 97/07.06.02 1,227,857.14 CHF 480,000 Conseil Europe 5,594 86/15.04.49 53 1,898.08 CAD 1,400,000 Provincc of Ontario FRN 00/24.01.05 1,495,432.24 EUR 620,000 BRD FRN 94/20.09.04 988,505.15 EUR 500,000 CCB Step-up 5?4 -6.1% 99/05.11.04 796,587.76 EUR 500,000 Deutsche Tclek6,625% 00/06.07.10 782,049.93 EUR 400,000 EIB 5,25yo 98/15.04.04 670,475.89 EUR 500,000 Greece FRN 9W22.01.04 801,280.00 EUR 500,000 Italy 6% 97/02.04.04 870,326.77 EUR 500,000 Wolters Kluwer 5,5% 99122.09.06 782,845.96 Total transferable securities admitted to an official listing on a stock exchange - bonds 9,497,253.94
Unlisted bonds DEM 500,000 Banco Mayo 93% 98/08.05.01 417,341.80 ITL 1,000,000,000 EIB 10,594 92/01.06.02 839,664.64 Total unlisted bonds 1,257,006.44 Total portfolio 11,165,323.96
Other net assets
Total net assets
500,332.3 1
500,332.31
643,643.65 1,205,212.65
506,400.00 1,500,894.5 1
938,153.81
766,802.93 6 15,663.82 76 1,127.85 784,647.55 748,457.56
749,443.87
2.48
2.48
3.19 5.98 2.5 1 7.45 4.66 3.72 3.81 3.06 3.78 3.89 3.71
9,220,448.20 45.76
50,254.80 0.25 84 1,467.50 4.18 891,722.30 4.43
10,612,502.81 52.67
9.535,021.64 47.33
20,147,524.45 100.00
24

World Invest, Sicav
Economic and geographical breakdown of the investment portfolio and other net assets as at December 3 1,2000
in percentage of the total net assets
Governments and local authorities 22.97 European institutions 15.73
7.78 3.71
Banking Paper Undertakings for collective investmcnts 2.48 Other net assets 47.33 Total net assets 100.00
European Union 15.73 Netherlands 7.52
Germany 4.66 Italy 3.89 Greece 3.78 Belgium 3.72 United Kingdom 3.19 Luxemburg 2.48 Argentina 0.25
e Canada 7.45
Other net assets 47.33 Total net assets 1oo.uo
25
. .. . . -.

World Invest, Sicav
WORLD INVEST - SHARE
Statement of investments in securities and other net assets as at December 31,2000
(in EUR)
Currency Qty Description
% of cost Valuation net
as at 3 1.12.00 assets
Transferable securities udmitted to an official listing on a stock exchange - shares USD USD USD USD USD USD USD USD USD USD USD USD USD USD USD USD USD GBP GBP GBP GBP CHF CHF CHF CHF EUR EUR EUR EUR EUR EUR
34,000 30,000 26,667 92,000 19,000 14,000 34,000 13,000 34,000 14,000 50,000 13,000 23,500 37,000 10,000 55,000 19,500
165,000 158,000 9 1,000
138,4 19 650 900 700
9,400 33,000 25,000 20,000 43,000 1 1,000 60,000
Avery Dennison Corp Bank Of America Corp Citigroup Inc Dell Computer Corp Emerson Electric Co Exxon Mobil Corp General Motors Corp IBM Corp Ingersoll-Rand Co Johnson & Johnson McDonald's Corp Mcrck & Co Pfizer Inc Praxair Tnc Procter And Gamble Co Sara Lee Corp United Technologes Corp BP Amoco Plc Diageo Plc Otd HSBC Holding Plc 0,5 Usd Lloyds TSB Group PIC Nestle SA (Nom) Novartis AG (Nom) Swiss Reinsurance Co (Nom) UBS AG (Nom) Aegon NV Assicurazioni Generali SPA Ing Groep NV Koninklijke Ahold NV Siemens AG (Nom) Wolters Kluwer Cert V Akt
Total transferable securities admitted to an official listing on a stock exchange - shares Total portfolio
Other net assets
Total net assets
2,171,728.65 1,612,974.19 1,152,987.22 2,542,164.94 1,475,831.64 1 ,00 1,180.63 2,236,441.82 1,256,344.08 1,555,398.50 1,294,369.44 1,679,459.7 1
804,7 18.89 859,015.35
1,560,853.62 796,873 3 6
1,573,497.60 1,565,363.49 1,476,228.74 1,804,797.28 1,2 18,575.04 1,617,640.89 1,149,414.5 1 1,356,325.06 1,80 1,839.84 1,435,595.33 1,480,264.12
869,19 1.46 1,452,402.00 1,509,470.12 1,440,108.34 1,723,344.18
45,474,400.54 45,474,400.54
1,980,941.41 1,461,2 19.68 1,445,754.04 1,703,296.40 1,589,889.29 1,292,270.30 1,838,800.96 1,173,222.70 1,511,652.33 1,561,694.25 1,804,958.00 1,292,270.30 1,147,740.94 1,743,244.36
832,802.31 1,434,344.38 1,627,846.50 1,4 12,492.50 1,878,567.47 1,420,973.80 1,553,593.56 1,6 19,2 17.05 1,699,288.23 1,792,210.33 1,638,526.40 1,453,980.00 1,050,750.00 1,70 1,600.00 1,477,480.00 133 1,200.00 1,742,400.00
47,414,227.49 47,414,227.49
10,024,622.06
57,438,849.55
3.45 2.54 2.52 2.97 2.77 2.25 3.20 2.04 2.63 2.72 3.14 2.25 2.00 3.04 1.45 2.50 2.83 2.46 3.27 2.47 2.71 2.82 2.96 3.12 2.85 2.53 1.83 2.96 2.57 2.67 3.03
82.55 82.55
17.45
100.00
26

World Invest, Sicav
Economic and geographical breakdown of the investment portfolio and other net assets as at December 3 1,2000
in percentage of the total net assets
Banking 16.05 Chemicals 14.42 Foods 8.59 Insurance 7.48 Paper 6.48 Automobile, nautical and aircraft industry 6.03 Electronics 5.44 Computers 5.01 Energy products and mining 4.71 Leisure 3.14 Industrial machinery 2.63 Commerce 2.57 Other net asscts 17.45 Total net assets 100.00
United States of America 44.30 Switzerland 11.75 Netherlands 11.09
Germany 2.67 Italy 1.83 Other net assets 17.45 Total net assets 100.00
United Kingdom 10.91
27

World Invest, Sicav WORLD INVEST - NIPPON
Statement of investments in securities and other net assets as at December 3 1,2000
(in TPY)
Currency Qty Description
% of cost Valuation net
as at 31.12.00 assets
Transferrable securities udmitted to ran official listing on a stock -change - shares JPY JPY PY JPY JPY JPY JPY JPY JPY P Y JPY JPY JPY JPY JPY JPY JPY JPY JPY JPY PY JPY JPY JPY JPY JPY JPY JPY JPY JPY JPY JPY JPY JPY JPY JPY P Y JPY JPY JPY JPY JPY JPY
4,000 3,000 3,700 5,000
10,000 56
75,000 7,000
25,300 2,000 6,000 2,000 7,100 7,700
13,000 8,000 1,500
17,000 18,000
900 6,600 4,000 8,000 5,300 1,000
24,000 40,000 15,000 6,600 2,000
20,000 10,000 1 5,000 2,500
12,000 20,000 2,600 1,500 9,100 6,400
12,000 100,000
5,000
Aderans Co Ltd Asatsu Dk Inc Avex Inc Canon lnc
DDI Corp Dowa Mining Co Ltd Enomoto Co Ltd Exedy Corp Fancl Corp Fuji Photo Film Co Ltd Fuji Soft Abc Inc Hakuto Co Ltd Happinet Corp Hard Off Corp Co Ltd Himiko Co Ltd Hirosc Electric Co Ltd Hitachi Electronic Engineering Hitachi Ltd Itochu Techno-Science Corp Iuchi Seieido Co Ltd Japan Airport Terminal Co Ltd Japan Digital Laboratory Co Judtsystem Corp Kadokawa Shoten Publishing Co Kibun Food Chemifa Co Ltd Koa Fire Marine Insurance Co Koyo Seiko Co Ltd K's Denki Corp Kyocera Corp Kyushu Matsushita Electric Co Marubun Corp Marui Co Ltd Matsushita Communication Indus Matsushita Electric Industrial Mitsui Mining Smelting Co Ltd Moshi Hotline Inc Murata Manufacturing Co NIC Corp Nagano Keilu Co Ltd
Nichimen Corp Nidec Copal Electronics Corp
CMK Corp
NEC Corp
18,3 85,960 16,450,405 38,231,133 22,672,079 15,9 16,048 36,768,332 13,960,300 7,762,413
19,579,3 57 31,915,157 23,913,507 15,416,773 18,656,154 22,595,389 15,024,750 12,217,438 19,787,977 14,136,469 26,695,353 6,633,000
19,539,888
15,007,067 20,260,661 14,956,541 10,604,068 9,343,225
11,940,933 20,488,368 33,215,638 21,523,489 11,858,112 25,426,732 35,164,789
11,137,531 25,925,42 1 23,070,599 20,732,713 11,288,521 3 1,194,325 9,868,698 6,378,237
3,947,479
32,768,105
18,800,000 8,250,000
25,900,000 20,000,000 16,750,000 30,856,000 3 7,200,000 4,550,000
19,734,000 6,600,000
28,680,000 14,740,000 22,862,000 15,323,000 13,390,000 9,600,000
16,500,000 9,605,000
18,324,000 19,071,000 11,814,000 4,200,000
10,448,000 16,430,000 3,030,000 9,000,000
15,760,000 12,225,000 10,758,000 24,940,000 20,300,000 12,500,000 25,875,000 35,875,000 32,760,000 17,600,000 25,948,000
14,105,000 15,424,000 25,080,000 11,000,000 6,050,000
20,100,000
1.00 0.44 1.37 1.06 0.89 @ 1.63 1.97 0.24 1.05 0.35 1.52 0.78 1.21 0.81 0.71 0.51 0.87 0.51 0.97 1.01 0.63 0.22 0.55 0.87 0.16 0.48 0.84 0.65 0.57 1.32 1.08 0.66 1.37 1.90 1.74 0.93 1.38 1.07 0.75 0.82 1.33 0.58 0.32
28

World Invest, Sicav
Currency
JPY JPY JPY JPY JPY JPY e py JPY JPY JPY JPY JPY JPY JPY JFY JPY JPY JPY JPY JPY JPY JPY JPY SPY JPY e JPY JPY JPY JPY JPY JPY JPY JPY JPY JPY JPY JPY JPY JPY JPY JPY JPY JPY
Q ~ Y 3,000
22,000 11,100 2,000 6,000
13,000 30,000 50,000
30 320
15,000 4,000
18 7
16 14,400 8,000
6 1,500
10,000 1,000 5,000
40,000 4,000
124,000 3,000
30,000 4,000 7,000 5,000 2,000 4,000
35,000 5,000 3,000
13,000 7,000 2,000 5,000
55,000 4 1,000
6,000 53,000
Description
Nidec Corp Nifco Inc Nihon Jumbo Co Ltd Nintendo Co Ltd Nippon Broadcasting System Nippon Comsys Nippon Express Co Ltd Nippon Shokubai Co Ltd Nippon Telegraph & Telephonc Nippon Television Network Corp Nomura Sccurities Co Ltd Noritsu Koki Co Ltd NTT Data Corp NTT Docomo Inc Okinawa Cellular Telephone Co Paltek Corp Pioneer Corp Plat'home Co Ltd Plenus Co Ltd Ralse Co Ltd Rohm Co Ltd Ryohin Keikaku Co Ltd Sakura Bank Ltd Sccom Co Ltd Seiyu Ltd Seven-Eleven Japan Co Ltd Shimadzu Corp Shinko Electric Industries Co Skylark Co Ltd Sony Corp Sugi Pharmacy Co Ltd Suruga Seiki Co Ltd Tachi-S Co Ltd Takeda Chemical Industries Ltd TDK Corp Tokyo Biso Kogyo Corp Tokyo Electric Power Co Inc Tokyo Electron Ltd Top Culture Co Ltd Toyo Trust Banking Toyoda Machine Works Ltd Toyota Motor Corp Unipres Cop, Fuji
cost
22,053,519 ,
11,415,071 37,108,320 34,247,542 28,327,34 1 2 1,541,84 1 25,370,957 38,165,032 22,170,858 34,124,147 19,085,112 25,215,530 23,382,773 12,60 1,226 34,OO 1,693 29,584,085 36,351,05 1 4,756,107
25,3 14,166 27,894,177 39,887,9 14 28,724,240 36,680,033 27,692,839 22,597,304 12,235,172 19,163,2 10 18,3 18,296 45,360,334 7,035,000 5,086,410
15,574,834 3 1,970,244 39,241,382
18,907,542 27,2 13,968 10,3673 10 18,090,935 31,661,069 24,257,825 20,561,986
26,441,485
15,893,604
Valuation as at 3 I . 12.00
16,200,000 23,540,000
5,550,000 35,980,000 25,920,000 26,650,000 20,700,000 21,900,000 24,690,000 12,3 84,000 30,825,000
13,680,000 13,790,000 3,616,000
30,816,000 24,400,000 32,100,000
5,520,000 7,000,000
21,700,000 2 1,900,000 27,600,000 29,800,000 37,572,000 19,500,000 11,490,000 12,800,000 22,400,000 39,500,000 6,200,000
18,000,000 17,675,000
33,360,000 5,278,000
19,845,000 12,560,000 4,750,000
19,800,000 25,256,000 21,900,000 9,434,000
10,000,000
3 3 ,noo,ooo
Yo of net
assets
0.86 1.25 0.29 1.91 1.37 1.41 1.10 1.16 1.3 1 0.66 1.63 0.53 0.72 0.73 0.19 1.63 1.29 1.70 0.29 0.37 1.15 1.16 1.46 1.58 1.99 I .03 0.61 0.68 1.19 2.09 0.33 0.95 0.94 1.79 1.77 0.28 1.05 0.67 0.25 1.05 1.34 1.16 0.50
-
29
World Invest, Sicav
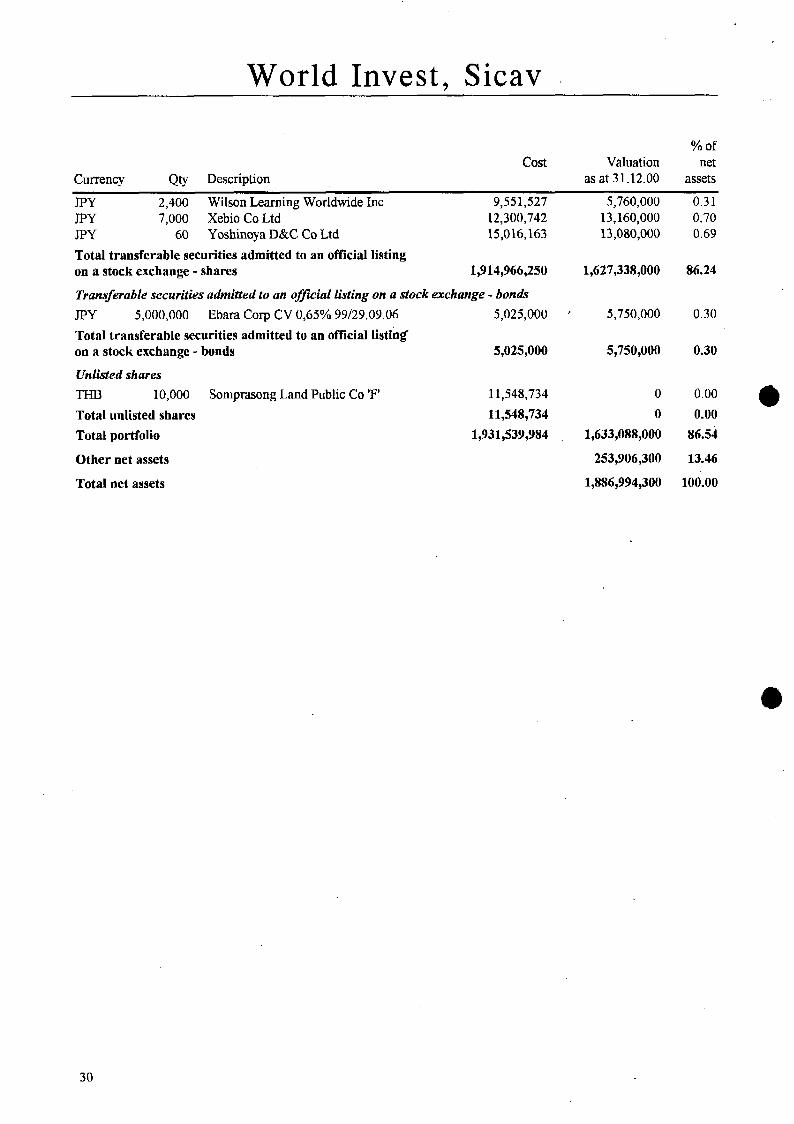
% OF
cost Valuation net Currency Qty Description as at 31.12.00 assets
JPY 2,400 Wilson Learning Worldwide Inc 9,551,527 5,760,000 0.3 1 JPY 7,000 Xebio Co Ltd 12,300,742 P Y 60 Yoshinoya D&C Co Ltd 15,016,163 Total transferable securitics admitted to an official listing on a stock exchange - shares 1,914,966,250
Transferable securities admitted to an official listing on a stock exchange - bonds JPY 5,000,000 Ebara Corp CV 0,65% 99l29.09.06 5,025,000 Total transferable securities admitted to an official listing on a stock exchange - bonds 5,025,000
Unlisted shares THB 10,000 Somptasong Land Public Co 'F' 11,548,734 Total unlisted shares 11,548,734 Total portfolio 1,931,539,984
Other net assets
Total net assets
13,160,000 13,080,000
1,627,338,000
5,750,000
5,750,000
0
0 1,633,088,000
253,906,300
1,886,994,300
0.70 0.69
86.24
0.30
0.30
0.00 I) 0.00
86.54
13.46
100.00
30
World Invest, Sicav
Economic and geographical breakdown of the investment portfolio and other net assets as at December 3 1,2000
in percentage of the total net assets
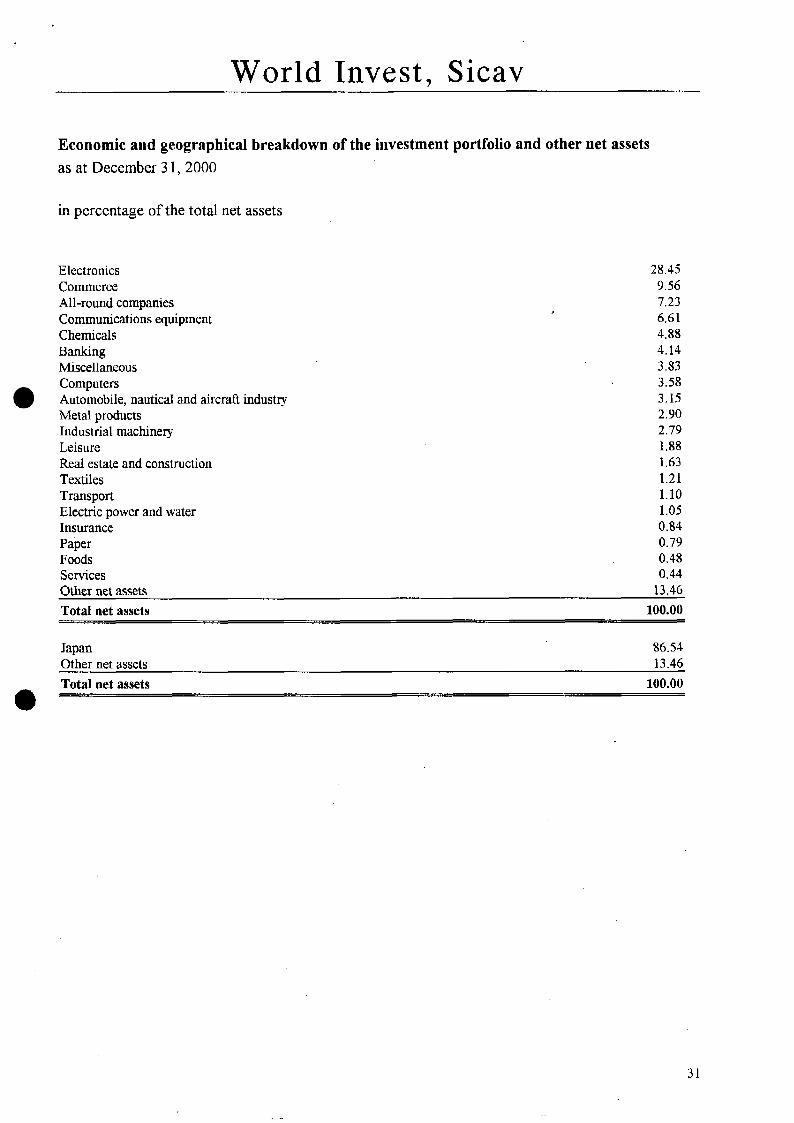
Electronics 28.45 Commerce 9.56 All-round companics 7.23 Communications equipment 6.61 Chemicals 4.88 Banking 4.14 Miscellaneous 3.83 Computers 3.58 Automobile, nautical and aircraft industry 3.15 Metal products 2.90 Industrial machinery 2.79 Leisure 1.88 Real estate and construction 1.63 T e x ti 1 e s 1.21
Electric power and water 1.05 Insurancc 0.84 Paper 0.79 FOQdS 0.48 Scrvices 0.44 Other net assets 13.46 Total net assets 100.00
Transport 1.10
Japan 86.54 Other net assets 13.46 Total net assets 100.00 e -'
31

World Invest, Sicav
WORLD INVEST - MIX&D
Statement of investments in securities and other net assets as at December 3 1,2000
(in USD)
Currency Qty Description cost Valuation
as at 31.12.00
% of net
assets
Transferable securities admitted to an official listing on a stock exchange - shares and warrants USD USD USD USD USD USD USD USD USD USD USD USD USD USD
18,000 24,000
101,500 1,401
10,000 50,400 9,712
2 1,000 27,500 25,000
5,400 25,000 28,000 15,800
Aes Trust Iii 6,75% CV Pref Cendant Rts Prides 00/14.02.0 1 Cendant Corp PFD 7,5% 16.02.01 Crown Castle Intl Corp Estee Lauder 6.2% Exch Sec K-Mart Financing 7,75% CV PFD Mediaone Group Inc Exch Shs Metlife Inc CV 8% 15.05.03 National Australia Bank Ltd CV Pogo Trust 'A' 6 3 % CV Pref 99/29 Six Flags CV 7,5% 01 04 01 Southern Energy 'A' Conv PFD Sovereign Bancorp 7,5 Pref Tribune Co CV Sub 2% 99115.05.29
902,250.00 0.00
1,909,277.24 37,494.00
705,484.3 1 1,897,723.95
895,483.65 1,052,625.00
790,809.60 1,565,466.4 1
292,329.00 1,484,376.69 1,397,485.00 2,098,368.48
1,548,000.00 139,500.00
1,382,937.50 37,914.56
760,000.00 1,345,050.00
789,100.00 2,299,500.00
787,187.50 1,828,125.00
191,025.00 1,550,000.00 1,358,000.00 1,422,000.00
Total transferable securities admitted to an official listing on a stock exchange - shares and warrants 15,029,173.33 15,438,339.56
Transferable securities admitted to another regulated market - shares USD 29,000 Calpine Cap Trust 5% FRN CV USD 40,000 Crown Castle CV 6.25 Pref USD 51,619 Winstar Comm 6% CV PFD Shs USD 6,300 Xo Communications Inc PFD CV
1,590,158.18 ' 1,518,875.00 1,967,506.00 1,645,000.00 2,032,02 1.89 1,313,058.31
967,823.67 455,962.50 Total transferable securities admitted to another regulated market - &ares 6,557,509.74 4,932,895.81
Transferable securities admitted to an official listing on a stock exchange - bonds USD 7,805,000 Asia Pulp & Paper 0% 97/18.11.12 1,593,460.13 USD 450,000 Berkshire Hat CV 1% 96102.12.01 579,908.82 USD 1,000,000 Clear Chan.CV 2,625% 98/01.04.03 1,175,461.51 USD 910,000 Kerr Mcgee Conv 5,25% 00/15.02.10 912,275.00 USD 972,000 Nextel Comm Inc 4,75% 99101.07.07 2,122,184.62 Total transferable securities admitted to an official listing on a stock exchange - bonds 6,383,290.08
Transferable securities admiited to another regulaied market - bonds USD 1,350,000 Centocor Inc CV 4,75% 98/15.02.05 1,610,126.27 Total transferable securities admitted to another rcgulated market - bonds 1,610,126.27
1,593,460.13 1,398,573.00 1,000,100.00 1,145,508.00 1,169,218.80
6,306,859.93
1,848,0.15.00
1,848,015.00
5.37 0.48 4.80 0.13 2.64 4.66 2.74 7.97 2.73 6.34 0.66 5.37 4.71 4.93
53.53
5.27 5.70 4.55 1.58
17.10
5.52 4.85 3.47 3.97 4.05
21.86
6.41
6.41
32
. .

World Invest; Sicav
% of Cost Valuation net
Currency Qty Description as at 3 1.12.00 assets
Unlisted bunds USD 750,000 USD 1,400,000 Total unlisted bonds Total portfolio
Other net assets
Total net assets
Ch Energy 0% 150703 Clear Channel CVI,5% 99/01 1202
0.00 0.00 0.00 ,403,500.00 ,258,880.00 4.36 ,403,500.00 ,258,880.00 4.36
30,983,539.42 29,784,990.30 103.26
-942,731.82 -3.26
2s,s42,2ss.48 ino.00
33

World Invest, Sicav
Economic and geographical breakdown of the investment portfolio and other net assets as at December 3 1, 2000
in percentage of the total net assets
Financial companies 34.51 All-round companies 23.12 Communications equipment 16.20 Chemicals 6.41 Computers 5.28
Insurance 4.85
Banking 2.73 Real estate and construction 0.66 Other net assets -3.26 Total net assets 100.00
Paper 4.93
Energy products and mining 3.97
United States of America 100.53 Australia 2.13 Other net assets -3.26 Total net assets 100.00
34

World Invest, Sicav
WORLD INVEST - FlX€D INCOME
Statement of investments in securities and other net assets as at December 3 1,2000
(in EUR)
Currency Qty Description
Yo of cost Valuation net
as at 31.12.00 assets
Transferable securities admitted to an official listing on a stock exchange - bonh NLG DEM DEM ~~
DEM DEM DEM DEM DEM DEM EUR EUR EUR EUR EUR EUR EUR EUR EUR EUR
155,000 200,000 200,000 200,000 200,000 200,000 500,000 600,000 400,000 700,000 700,000 800,000
1,200,000 700,000 400,000 100,000 100,000 100,000 100,000
Commerzbank 8,5% 92103.04.02 BMW Australia 4375% 97106.05.02 Daimlerchrysler 575% 86/28.05.0 I Goldman Sachs GP 5% 98/28.02.03 IBM Int. Fin. 4,875% 97128.05.02 McDonald's 2,5% 97119.02.02 Mexico 10,375(% 96129.01.03 Turquie 8,75% 93l09.07.03 Turquie 7,6234 96105.12.01 BRD 3% 99/15.06.01 BRD 3% 99116.03.01 BRD 5% 96/20.08.01 BRD 5% 96/21.05.01 BRD 3 3 % 99114.09.01 BRD 5,25% 96/21.02.01 Francc Telecom FNR 00/10.11.03 GMAC 5375% 00/30.05.03 IBM 5 3 % 00127.06.03 Seat Pagine Gial FRN 00/01.07.03
73,712.82 101,306.23 102,512.89 10 1,132.40 101,398.28 98,719.11
277,425.85 3 16,335.16 207,225.46 689,340.00 692,140.00 799,250.00
1,200,450.00 690,740.00 400,490.00 99,897.00 99,750.00 99,700.00 99,908.00
Total transferable securities admitted to an official listing on a stock exchange - bonds 6,251,433.20 Total portfolio
Other net assets
Total net assets
6,251,433.20
72,804.72 101,849.34 102,452.67 101,225.57 10 1,726.63 98,986.11
273,541.16 308,309.00 205,334.82 694,470.00 697,480.00 80 1,040.00
1,200,480.00 694,470.00 400,140.00
99,450.00 100,855 .OO 10 1,258.00 100,020.00
1.05 1.46 1.47 1.46 1.46 1.42 3.93 4.43 2.95 9.98
10.03 11.51 17.25 9.98 5.75 1143 1.45 1.46 1.44
6,255,893.02 89.91 6,255,893.02 89.91
701,763.58 10.09
6357,656.60 100.00
35

World Invest. Sicav
Economic and geographical breakdown of the investment portfolio and other net assets as at December 3 1,2000
in percentage of the total net assets
Governments and local authorities 75.81 Undertakings for collective investments 5.85 Banking 2.49 Computers 1.46 Automobile, nautical and aircraft industry 1.45 All-round companies 1.43 Foods 1.42 Other net assets 10.09 Total net assets - 100.00
Germany 65.55 Turkey 7.38 United States of America 5.79 Mexico 3.93 Netherlands 2.93 Australia 1.46 Italy 1.44 France 1.43 Other net assets 10.09 Total net assets 100.00
36

World Invest, Sicav
WORLD INVEST - TECH
Statement of investments in securities and other net assets as at December 3 1,2000
(in USD)
Currency Qty Description
Yo of Cost Valuation net
asat 31.12.00 assets
Trunsferable securities admitted to an official listing on a stock exchange - shares USD USD USD USD USD USD USD USD USD USD USD USD USD USD USD USD U SD USD USD USD USD USD USD USD USD USD USD USD USD USD USD USD USD USD USD USD
8,800 13,400 17,000 16,600 26,500
139,300 17,850 52,800 18,300 29,700 22,800 3 1,000 19,000 48,200 14,000 25,900 15,500 11,900 69,100 21,800 26,300 25,100 33,800 90,200 45,100 82,000 51,500 40,350 50,700 34,600 40,300 44,700
4,400 11,700 8,300 8,000
Adclphia Communications Corp Adobc Systems Inc Agile Software Corp Automatic Data Processing Inc Boeing Co Broadbase Software Inc Cablevision Systems Corp 'A' Charter Communications Tnc Choicepoint Inc Comcast Corp 'A' Special Commerce One Inc Concord Efs Inc Countrywide Credit Industries Dell Computer Corp DST Systems Inc E. Piphany Inc Electronic Data Systems Corp EMC Corp Fairchild Semicond Tntl 'A' Finisar C o p Gemstar-Tv Guide Intl Inc Handspring Inc Integrated Device Technology Integrated Silicon Solution Inc Kana Communications Inc LAM Research Corp LSI Logic Corp Mckesson Hboc Inc Mcron Technology Inc Nokia Corp ADR Palm Inc Peoplcsoft Inc PMC Sierra Tnc Power Onc Inc Sanmina Corp Schlumberger Ltd, Curacao
428,969.75 1,027,070.84
755,659.00 1,112,106.33 1,764,14 1.62 1,210,785.84 1,349,184.27
987,527.02 997,618.65
1,280,346.44 833,955.38
1,342,800.2 1 906,261.00 956,2 13 .?I 1 922,776.13
836,202.29 1,062,556.75 2,007,996.27
595,299.10 1,829,206.02 1,237,374.12 1,411,108.76
935,225.83 453,716.17
1,343,463.71 1,554,365.16 1,402,820.54 1,767,93 1.51 1,420,737.46 1,577,691 .O 1 1,390,980.16
507,868.16 655,518.79
644,879.38
I ,264,964. an
583,985.5n
454,300.00 779,712.50 839,375.00
1,050,987.50 1,749,000.00
870,625.00 1 3 16,134.38 1,197,900.00 1,199,793.75 1,239,975.00
577,125.00 1,362,062.50
840,487.50 938,000.00
1,396,98 1.25 895,125.00 79 1,350.00 997,631.25 632,200.00
1,2 13,087.50 977,331.2s
1,119,625.00 1,296,625.00
5 18,650.00 1,189,000.00
880,135.00 1,448,16 1 S O 1,799,850.00 1,505,100.00 1,140,993.75 1,662,281.25
345,950.00 459,956.25 635,987.50 639,500.00
954,750.00
1.09 1.88 2.02 2.53 4.21 2.10 3.65 2.89 2.89 2.99
3.28 2.30 2.02 2.26 3.36 2.16 1.91 2.40 1.52 2.92 2.35 2.70 3.12 1.25 2.86 2.12 3.49 4.34 3.62 2.75 4.00 0.83 1.11 1.53 1.54
1.39
37

World Invest, Sicav
Yo of Cost Valuation net
Currency Qty Description as at 3 1.12.00 assets
USD 19,000 Siebel Systems Inc 1,125,774.43 1,284,875.00 3.09 USD 28,200 Triquint Semiconductor Inc 1,378,460.96 1,231,987.50 2.97 USD 30,802 Viacom Inc 'B' 1,752,327.81 1,439,993.50 3.47 Total transferable securities admitted to an official listing on a stock exchange - shares 44,615,870.64 41,072,605.63 98.91 Total portfolio 44,615,870.64 41,072,605.63 98.91
Other net assets 454,446.98 1.09
Total net assets 4 1,527,052.6 1 100.00
38

World Invest, Sicav
Economic and geographical breakdown of the investment portfolio and other net assets as at December 3 1,2000
in percentage of the total net assets
Computers 37.49 Electronics 15.61
Communications equipment 9.35 Services 5.62 Mmellaneous 5.18
All-round companies 11.84
Transport 4.21 Undertakings for collective investrnents 3.69 Commerce 2.86 Energy products and mining 1.54 Foods 1.52 Other net assets 1.09 Total net assets 100.00
United States of America 97.37 Nethcrlands Antilles 1.54 Other net assets 1.09 Total net assets - 100.00
39
9 . ..
World Invest, Sicav
WORLD INVEST - G7 BOND
Statement of investments in securities and other net assets as at December 3 1, 2000
(in EUR)
Currency Qty Dcscription
Yo of cost Valuation net
as at 31.12.00 assets
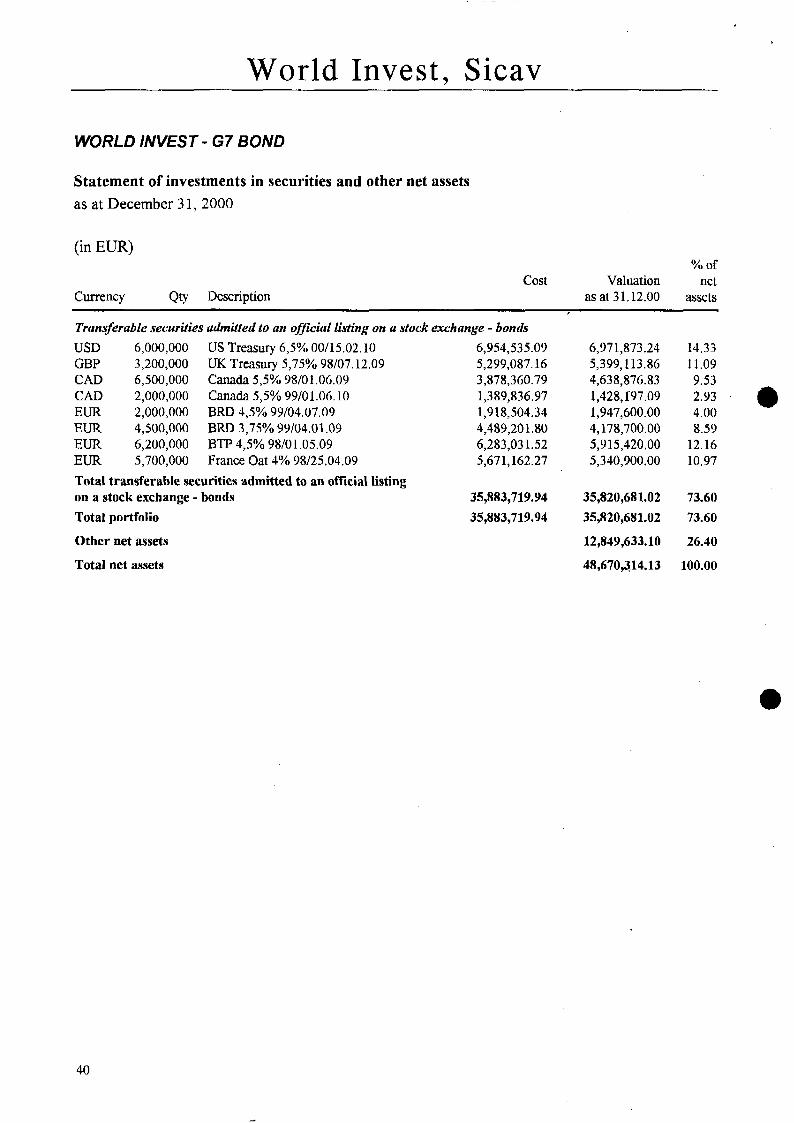
Transferable securities udmitted to an official listing on a stock exchange - bonds USD 6,000,000 US Treasury 6,5% 00/15.02.10 6,954,535.09 GBP 3,200,000 UK Treasury 5,75% 98/07.12.09 5,299,087.16 CAD 6,500,000 Canada 5,5% 98/01.06.09 3,878,360.79 CAD 2,000,000 Canada 5 3 % 99/01.06.10 1,389,834.97 EUR 2,000,000 BRD 4,5% 99/04.07.09 1,918,504.34 EUR 4,500,000 BRD 3,75% 99/04.01.09 4,489,201.80 EUR 6,200,000 BTP 43% 98/01.05.09 6,283,03 1.52 EUR 5,700,000 France Oat 4% 9W25.04.09 5,671,162.27 Total transferable securities admitted to an official listing on a stock exchange - bonds 35,883,719.94 Total portfolio 35,883,719.94
Other net assets
Total net assets
6,97 1,873.24
4,638,876.83 1,428,197.09 1,947,600.00 4,178,700.00 5,9 15,420.00 5,340,900.00
5,399,113.86 14.33 11.09 9.53 2.93 4.00 8.59
12.16 10.97
35,sz0,681.02 73.60 35,820,681.02 73.60
12,849,633.10 26.40
48,670,314.13 100.00
40

World Invest, Sicav
Economic and geographical breakdown of the investment portfolio and other net assets as at December 3 1,2000
in percentage of the total net assets
Governments and local authorities 73.60 Other net assets 26.40 Total net assets 100.00
United States of America Germany Canada Italy
14.33 12.59 12.46 12.16
United Kingdom 11.09 France 10.97 Other net assets 26.40 Total net assets 100.00
-.
41
.. .

World Invest, Sicav
WORLD INVEST - LATIN AMERICA
Statement of investments in securities and other net assets as at December 3 1, 2000
(in USD)
Currency Qty Description
Yo of Cost Valuation net
as at 31.12.00 assets
Transferable securities admitted to an official listing on a stock exchange - shares and wurrants USD USD USD USD USD USD USD USD USD USD USD USD USD USD USD USD USD USD USD USD USD USD USD USD USD USD USD USD USD USD
7,000 9,000 4,000 7,000
10,169 7,000
16,000 5,000 4,000 3,000
10,000 5,000 7,000 9,000 8,000 3,000
15,000 5,000 8,000
20,000 5,000
14,000 13,000 7,000
5,000 15,000 9,000 1,000
24,000
10,000
A.F.P Provida SA ADR Banco Frances ADR Banco Latinoameric Exportaciones Ca Nacio Telef Venezuela ADR Cementos De Mexico SA ADR Cia De Bebidas Americas ADR Cia De Minas Buenaventura ADR Cia Vale Do fio Doce ADR Comp. Brasil Dist. Acucar ADR Controladora Commerc. Mexic. GDR Credicorp Ltd Desc SA IC' ADR Embraer Emp Bras Aero ADR Pref Embratel Particip. Pref ADR Fomento Economic0 Mex ADR Grupo Televisa GDS Mavesa SA ADR Panamerican Beverages Inc 'A' Petroleo B r a d SA ADR Quilmes Industrial SA ADR Socquimich PFD 'B' ADR Tele Centro Oeste Celular Pref Tele Norte Leste Particip ADR Telecom Argentina ADR Telefonos De Mexico SA ADR 'L' Terra Networks ADR Ultrapar Participacoes SA Unibanco GDR Vina de Concha y Toro SA ADR WTS Cemex Sp. Ad
Total transferable securities admitted to an official listing on a stock exchange - shares and warrants Total portfolio
Other net assets
Total net assets
134,433.95 177,276.83 92,3 55.6 1
195,72 1.26 201,723.14
78,892.42 238,517.47 114,335.12 70,387.42 53,237.77
121,8r) 1.47 64,523.41
162,657.12 107,195.7 1 3 14,2 14.99 189,601.57 43,835.14 8 1,676.39
208,204.22 203,749.13 145,635.7 1 102,388.96 253,807.33 216,3 12.47 598,3 18.72 142,550.9 1 157,819.66 187,136.44 3 1,830.88 68,848.69
4,759,079.91
4,759,079.91
141,750.00 189,000.00 138,250.00 132,562.50 183,677.56 180,250.00 232,000.00 123,125.00 146,000.00 56,250.00 60,000.00 3 1,875.00
278,250.00 141,187.50 239,000.00 134,812.50 90,000.00 70,937.50
202,000.00 180,000.00 105,000.00 13 5,625.00 296,562.50 109,8 12.50 451,250.00
52,s 12.50 125,625.00 264,937.50
39,000.00 24,000.00
2.72 3.63 2.66 2.55 3.53 3.46 4.46 2.36 2.80 1 .ox 1.15 0.61 5.34 2.71 4.59 2.59 1.73 1.36 3.88 3.46
2.60 5.70 2.11 8.67 1.01 2.41 5.09 0.75 0.46
2.02
4,555,552.56 87.49
4,555,552.56 87.49
651,282.01 12.51
5,206,834.57 100.00
42

World Invest, Sicav
Economic and geographical breakdown of the investment portfolio and other net assets as at December 3 1,2000
in percentage of the total net assets
Communications equipment Foods Banking Chemicals All-round companies Automobile, nautical and aircraft industry Energy products and mining Real estate and construction Commerce Insurancc
26.93 13.34 11.38 5.90 5.74 5.34 4.46 3.99 2.80 2.12
Metal products 2.36 Miscellaneous 1.36 Undertakings for collective investments 1.15 Other net assets 12.51 Total net assets 100.00 - Brazil 34.35 Mexico 21.53 Argentina 5.14 Chili 5.49 Peru 4.46 Venezuela 4.28 Panama 4.02 Luxemburg 3.46 Bermuda 1.15 Spain 1.01 Other net assets 12.51 Total net assets . 100.00
43

World Invest, Sicav
Statistical information
Bond Share
Evolution of the shares outstanding
Number of shares outstanding at the beginning of thc year 16,585.752 32,759.999
issued during the year redeemed during the year at the end of thc year
158.000 (2,193.000) 14,550,752
9,952.360 (5,135.303) 37,577.056
Evolution of the net asset value CHF BUR
Net asset value per share at the end of the year the lughest
1,3 84.64 1 , 4 1 2 3
(301 1 O/OO) 1,360.26
( 19/06/00)
1,528.56 1,745.00
. (09/08/00)
(2 I! 12/00) 1,493.20 the lowest
Nippon Mixed Evolution of the shares outstanding
Number of shares outstanding at the beginning of thc year 28,223.394 131,375.328
issued during the year redeemed during the year at the end of the year
29,O 19.204 (6,964.399) 50,278,199
33,268.895 (24,491.874) 140,152.349
Evolution of the net asset value JPY USD
Net asset value per share at the end of the year the highest
3733 1 46,084
(10/07/00) 37,460
(27/12/00)
205.79 251.01
(13/03/00) 202.35
(04/ 12/00) the lowest
44

World Invest, Sicav .
Fixed Income Tech
Evolution of the shares outstanding
Number of shares outstanding at the beginning of the year 18,109.095 78,384.863
4,240.756 (10,037.978)
12,311.873
45,774.245 - (31,563.538)
92,595.570
issued during the year redeemed during the ycar at the end of the year
' I)
Evolution of the net asset value EUR USD
Net asset value per share at the end of the year the highest
565.12 565.12
(31/12/00) 544.28
(14/02/00)
448.48 1 ,O 18.30
(1 3/03/00) 404.90
(22/12/00) the lowest
6 7 Bond Latin America
Evolution of the shares outstanding
Number of shares outstanding at the beginning of the year 74,323.016 3 3,8 18.066
issued during the year redeemed during the ycar at the end of the year
15,893.129 ( 16,4 13.2 19)
73,802.926
34,949.159 (3,4 19.049) 65,348.176
Evolution of the net asset value EUR USD
Net asset value per share at the end of the year the highest
659.46 659.90
(27/12/00) 603.36
(10/0 1/00)
79.68 94.73
(27/03/00) 75.13
(04/ 12/00) the lowest
45