world investment report2016 - unctad |...
TRANSCRIPT

U N I T E D N AT I O N S C O N F E R E N C E O N T R A D E A N D D E V E L O P M E N T
KEY MESSAGES AND OVERVIEW
WORLD INVESTMENT
REPORT2016INVESTOR NATIONALITY: POLICY CHALLENGES
New York and Geneva, 2016

World Investment Report 2016 Investor Nationality: Policy Challengesii
NOTE
The Division on Investment and Enterprise of UNCTAD serves as
the focal point for all matters related to foreign direct investment and
multinational enterprises in the United Nations System. It builds on more
than four decades of experience and international expertise in research
and policy analysis on investment and enterprise development, fosters
intergovernmental consensus-building, and provides technical assistance
to over 160 countries.
The copyright of the material in this publication rests with UNCTAD. It may
be freely quoted or reprinted, but acknowledgement is requested, together
with a reference to UNCTAD and this Report. A copy of the publication
containing the quotation or reprint should be sent to the UNCTAD Secretariat
(e-mail [email protected]).
The Overview is prepared based on the in-depth analysis contained in World
Investment Report 2016. Investor Nationality: Policy Challenges (United
Nations publication, Sales No. E.16.II.D.4).
UNCTAD/WIR/2016 (Overview)
Copyright © United Nations, 2016
All rights reserved
Printed at United Nations, Geneva

iii
BAN Ki-moon Secretary-General of the United Nations
PREFACE
In 2015, global flows of foreign direct investment rose by about 40 per cent, to $1.8 trillion, the highest level since the global economic and financial crisis began in 2008. However, this growth did not translate into an equivalent expansion in productive capacity in all countries. This is a troubling development in light of the investment needs associated with the newly adopted Sustainable Development Goals and the ambitious action envisaged in the landmark Paris Agreement on climate change. This latest World Investment Report presents an Investment Facilitation Action Package to further enhance the enabling environment for investment in sustainable development.
The Addis Ababa Action Agenda calls for reorienting the national and international investment regime towards sustainable development. UNCTAD plays an important role within the United Nations system in supporting these endeavours. Its Investment Policy Framework and the Road Map for International Investment Agreements Reform have been used by more than 100 countries in reviewing their investment treaty networks and formulating a new generation of international investment policies.
Regulations on the ownership and control of companies are essential in the investment regime of most countries. But in an era of complex multinational ownership structures, the rationale and effectiveness of this policy instrument needs a comprehensive re-assessment. This Report provides insights on the ownership structures of multinational enterprises (MNEs), and maps the global network of corporate entities using data on millions of parents and affiliates. It analyses national and international investment policy practices worldwide, and proposes a new framework for handling ownership issues.
This latest edition of the World Investment Report is being issued as the world embarks on the crucial work of implementing the landmark 2030 Agenda for Sustainable Development and the Paris Agreement on climate change. The key findings and policy recommendations of the Report are far reaching and can contribute to our efforts to uphold the promise to leave no one behind and build a world of dignity for all. I therefore commend this Report to a wide global audience.
World Investment Report 2016 Investor Nationality: Policy Challengesiv
ACKNOWLEDGEMENTSThe World Investment Report 2016 (WIR16) was prepared by a team led by James X. Zhan. The team members included Richard Bolwijn, Bruno Casella, Joseph Clements, Hamed El Kady, Kumi Endo, Michael Hanni, Joachim Karl, Hee Jae Kim, Ventzislav Kotetzov, Guoyong Liang, Hafiz Mirza, Shin Ohinata, Diana Rosert, Astrit Sulstarova, Claudia Trentini, Elisabeth Tuerk, Joerg Weber and Kee Hwee Wee.
Research support and inputs were provided by Eleonora Alabrese, Dafina Atanasova, Jorun Baumgartner, Giannakopoulos Charalampos, Malvika Monga, Francesco Tenuta and Linli Yu. Contributions were also made by Thomas van Giffen, Natalia Guerra, Isya Kresnadi, Kálmán Kalotay, Abraham Negash, Elizabeth Odunlami, Jacqueline Salguero Huaman, Ilan Strauss, Tadelle Taye and Paul Wessendorp.
Statistical assistance was provided by Bradley Boicourt, Mohamed Chiraz Baly and Lizanne Martinez.
The manuscript was edited with the assistance of Caroline Lambert and copy-edited by Lise Lingo; it was typeset by Laurence Duchemin and Teresita Ventura. Pablo Cortizo was responsible for the overall design of the report, including charts, tables, maps and infographics, as well as DTP. Sophie Combette and Nadège Hadjemian designed the cover. Production and dissemination of WIR16 were supported by Elisabeth Anodeau-Mareschal, Anne Bouchet, Rosalina Goyena, Peter Navarette and Katia Vieu.
At various stages of preparation, in particular during the experts meetings organized to discuss drafts of WIR16, the team benefited from comments and inputs received from these experts: Rolf Adlung, Carlo Altomonte, Paul Beamish, Nathalie Bernasconi, Martin Brauch, Jansen Calamita, Jeremy Clegg, Davide Del Prete, Henrik Dellestrand, Chantal Dupasquier, Xiaolan Fu, Masataka Fujita, Thomas Jost, Markus Krajewski, John Lee, Hemant Merchant, Loukas Mistelis, Premila Nazareth, Sheila Page, Svein Parnas, Markus Perkams, Sergey Ripinsky, Leslie Robinson, Armando Rungi, Pierre Sauvé, Boštjan Skalar, Roger Strange and Jan van den Tooren. The report also benefitted from the discussions of the G20 Trade and Investment Working Group and the UNCTAD Expert Meeting “Taking Stock of IIA Reform”, as well as comments received from the WAIPA Secretariat.
Also acknowledged are comments received from other UNCTAD divisions as part of the internal peer review process, as well as comments from the Office of the Secretary-General as part of the clearance process. The United Nations Cartographic Section provided advice for the regional maps.
Numerous officials of central banks, government agencies, international organizations and non-governmental organizations also contributed to WIR16. In addition, UNCTAD appreciates the support of all the MNE and IPA executives who responded to its 2016 World Investment Prospects and Investment Promotion Agencies surveys. The financial support of the Governments of Finland, Sweden and Switzerland is gratefully acknowledged.

KEY MESSAGES v
KEY MESSAGES
GLOBAL INVESTMENT TRENDS
Recovery in FDI was strong in 2015. Global foreign direct investment (FDI)
flows jumped by 38 per cent to $1.76 trillion, their highest level since the
global economic and financial crisis of 2008–2009. A surge in cross-border
mergers and acquisitions (M&As) to $721 billion, from $432 billion in 2014,
was the principal factor behind the global rebound. The value of announced
greenfield investment remained at a high level, at $766 billion.
Part of the growth in FDI was due to corporate reconfigurations. These
transactions often involve large movements in the balance of payments but
little change in actual operations. Discounting these large-scale corporate
reconfigurations implies a more moderate increase of around 15 per cent in
global FDI flows.
Inward FDI flows to developed economies almost doubled to $962 billion.
As a result, developed economies tipped the balance back in their favour
with 55 per cent of global FDI, up from 41 per cent in 2014. Strong growth in
inflows was reported in Europe. In the United States FDI almost quadrupled,
albeit from a historically low level in 2014.
Developing economies saw their FDI inflows reach a new high of $765
billion, 9 per cent higher than in 2014. Developing Asia, with FDI inflows
surpassing half a trillion dollars, remained the largest FDI recipient region in
the world. Flows to Africa and Latin America and the Caribbean faltered.
Developing economies continue to comprise half of the top 10 host
economies for FDI flows.
Outward FDI flows from developed economies jumped by 33 per cent to
$1.1 trillion. The increase notwithstanding, their outward FDI remained 40

World Investment Report 2016 Investor Nationality: Policy Challengesvi
per cent short of its 2007 peak. With flows of $576 billion, Europe became
the world’s largest investing region. FDI by MNEs from North America stayed
close to their 2014 levels.
Primary sector FDI activity decreased, manufacturing increased. A flurry of
deals raised the share of manufacturing in cross-border M&As above 50 per
cent in 2015. FDI in the primary sector declined because of reductions in
planned capital expenditures in response to declining commodity prices, as
well as a sharp fall in reinvested earnings as profit margins shrank. Services
continue to hold over 60 per cent of global FDI stock.
Looking ahead, FDI flows are expected to decline by 10–15 per cent in
2016, reflecting the fragility of the global economy, persistent weakness
of aggregate demand, sluggish growth in some commodity exporting
countries, effective policy measures to curb tax inversion deals and a slump
in MNE profits. Over the medium term, global FDI flows are projected to
resume growth in 2017 and to surpass $1.8 trillion in 2018, reflecting an
expected pick up in global growth.
REGIONAL INVESTMENT TRENDS
FDI flows to Africa fell to $54 billion in 2015, a decrease of 7 per cent over
the previous year. An upturn in FDI into North Africa was more than offset by
decreasing flows into Sub-Saharan Africa, especially to West and Central
Africa. Low commodity prices depressed FDI inflows in natural-resource-
based economies. FDI inflows to Africa are expected to increase moderately
in 2016 due to liberalization measures and planned privatizations of state-
owned enterprises.
Developing Asia saw FDI inflows increase by 16 per cent to $541 billion – a
new record. The significant growth was driven by the strong performance
of East and South Asian economies. FDI inflows are expected to slow down
in 2016 and revert to their 2014 level. Outflows from the region dropped by
about 17 per cent to $332 billion – the first decline since 2012.
KEY MESSAGES vii
FDI flows to Latin America and the Caribbean – excluding offshore financial
centres – remained flat in 2015 at $168 billion. Slowing domestic demand
and worsening terms of trade caused by falling commodity prices hampered
FDI mainly in South America. In contrast, flows to Central America made
gains in 2015 due to FDI in manufacturing. FDI flows to the region may slow
down in 2016 as challenging macroeconomic conditions persist.
FDI flows to transition economies declined further, to levels last seen almost
10 years ago, owing to a combination of low commodity prices, weakening
domestic markets and the impact of restrictive measures/geopolitical
tensions. Outward FDI from the region also slowed down, hindered by the
reduced access to international capital markets. After the slump of 2015,
FDI flows to transition economies are expected to increase modestly.
After three successive years of contraction, FDI inflows to developed countries
bounced back sharply to the highest level since 2007. Exceptionally high
cross-border M&A values among developed economies were the principal
factor. Announced greenfield investment also remained high. Outward FDI
from the group jumped. Barring another wave of cross-border M&A deals
and corporate reconfigurations, the recovery of FDI activity is unlikely to
be sustained in 2016 as the growth momentum in some large developed
economies weakened towards the end of 2015.
FDI flows to structurally weak and vulnerable economies as a group
increased moderately by 2 per cent to $56 billion. Developing economies
are now major sources of investments in all of these groupings. Flows
to least developed countries (LDCs) jumped by one third to $35 billion;
landlocked developing countries (LLDCs) and small island developing
States (SIDS) saw a decrease in their FDI inflows of 18 per cent and 32 per
cent respectively. Divergent trends are also reflected in their FDI prospects
for 2016. While LLDCs are expected to see increased inflows, overall FDI
prospects for LDCs and SIDS are subdued.

World Investment Report 2016 Investor Nationality: Policy Challengesviii
INVESTMENT POLICY TRENDS
Most new investment policy measures continue to be geared towards
investment liberalization and promotion. In 2015, 85 percent of measures
were favourable to investors. Emerging economies in Asia were most
active in investment liberalization, across a broad range of industries.
Where new investment restrictions or regulations were introduced, these
mainly reflected concerns about foreign ownership in strategic industries.
A noteworthy feature in new measures was also the adoption or revision of
investment laws, mainly in some African countries.
National security considerations are an increasingly important factor in
investment policies. Countries use different concepts of national security,
allowing them to take into account key economic interests in the investment
screening process. Governments’ space for applying national security
regulations needs to be balanced with investors’ need for transparent and
predictable procedures.
The universe of international investment agreements (IIAs) continues to
grow. In 2015, 31 new IIAs were concluded, bringing the universe to 3,304
treaties by year-end. Although the annual number of new IIAs continues to
decrease, some IIAs involve a large number of parties and carry significant
economic and political weight. Recent IIAs follow different treaty models
and regional agreements often leave existing bilateral treaties between the
parties in force, increasing complexity. By the end of May 2016, close to
150 economies were engaged in negotiating at least 57 new IIAs.
With 70 cases initiated in 2015, the number of new treaty-based investor-
State arbitrations set a new annual high. Following the recent trend, a high
share of cases (40 per cent) was brought against developed countries.
Publicly available arbitral decisions in 2015 had a variety of outcomes,
with States often prevailing at the jurisdictional stage of proceedings, and
investors winning more of the cases that reached the merits stage.
KEY MESSAGES ix
IIA reform is intensifying and yielding the first concrete results. A new
generation of investment treaties is emerging. UNCTAD’s Investment
Policy Framework and its Road Map for IIA Reform are shaping key reform
activities at all levels of policymaking. About 100 countries have used these
policy instruments to review their IIA networks and about 60 have used
them to design treaty clauses. During this first phase of IIA reform, countries
have built consensus on the need for reform, identified reform areas and
approaches, reviewed their IIA networks, developed new model treaties and
started to negotiate new, more modern IIAs.
Despite significant progress, much remains to be done. Phase two of IIA
reform will require countries to focus more on the existing stock of treaties.
Unlike the first phase of IIA reform, where most activities took place at the
national level, phase two of IIA reform will require enhanced collaboration
and coordination between treaty partners to address the systemic risks and
incoherence of the large body of old treaties. The 2016 World Investment
Forum offers the opportunity to discuss how to carry IIA reform to the next
phase.
Investment facilitation: a policy gap that needs to be closed. Promoting and
facilitating investment is crucial for the post-2015 development agenda. At
the national level, many countries have set up schemes to promote and
facilitate investment, but most efforts relate to promotion (marketing a
location and providing incentives) rather than facilitation (making it easier to
invest). In IIAs, concrete facilitation measures are rare.
UNCTAD’s Global Action Menu for Investment Facilitation provides policy
options to improve transparency and information available to investors,
ensure efficient and effective administrative procedures, and enhance
predictability of the policy environment, among others. The Action Menu
consists of 10 action lines and over 40 policy options. It includes measures
that countries can implement unilaterally, and options that can guide
international collaboration or that can be incorporated in IIAs.

World Investment Report 2016 Investor Nationality: Policy Challengesx
INVESTOR NATIONALITY: POLICY CHALLENGES
More than 40 per cent of foreign affiliates worldwide have multiple
“passports”. These affiliates are part of complex ownership chains with
multiple cross-border links involving on average three jurisdictions. The
nationality of investors in and owners of foreign affiliates is becoming
increasingly blurred.
“Multiple passport affiliates” are the result of indirect foreign ownership,
transit investment through third countries, and round-tripping. About 30
per cent of foreign affiliates are indirectly foreign owned through a domestic
entity; more than 10 per cent are owned through an intermediate entity in
a third country; about 1 per cent are ultimately owned by a domestic entity.
These types of affiliates are much more common in the largest MNEs: 60
per cent of their foreign affiliates have multiple cross-border ownership links
to the parent company.
The larger the MNEs, the greater is the complexity of their internal ownership
structures. The top 100 MNEs in UNCTAD’s Transnationality Index have on
average more than 500 affiliates each, across more than 50 countries. They
have 7 hierarchical levels in their ownership structure (i.e. ownership links
to affiliates could potentially cross 6 borders), they have about 20 holding
companies owning affiliates across multiple jurisdictions, and they have
almost 70 entities in offshore investment hubs.
Rules on foreign ownership are ubiquitous: 80 per cent of countries restrict
majority foreign ownership in at least one industry. The trend in ownership-
related measures is towards liberalization, through the lifting of restrictions,
increases in allowed foreign shareholdings, or easing of approvals and
admission procedures for foreign investors. However, many ownership
restrictions remain in place in both developing and developed countries.
KEY MESSAGES xi
The blurring of investor nationality has made the application of rules
and regulations on foreign ownership more challenging. Policymakers in
some countries have developed a range of mechanisms to safeguard the
effectiveness of foreign ownership rules, including anti-dummy laws, general
anti-abuse rules to prevent foreign control, and disclosure requirements.
Indirect ownership structures and mailbox companies have the potential
to significantly expand the reach of IIAs. About one third of ISDS claims
are filed by claimant entities that are ultimately owned by a parent in a third
country (not party to the treaty on which the claim is based). Some recent
IIAs try to address the challenges posed by complex ownership structures
through more restrictive definitions, denial of benefits clauses and substantial
business activity requirements, but the vast majority of existing treaties does
not have such devices.
Policymakers should be aware of the de facto multilateralizing effect of
complex ownership on IIAs. For example, up to a third of apparently intra-
regional foreign affiliates in major (prospective) megaregional treaty areas,
such as the Trans-Pacific Partnership (TPP), the Transatlantic Trade and
Investment Partnership (TTIP), and the Regional Comprehensive Economic
Partnership (RCEP), are ultimately owned by parents outside the region,
raising questions about the ultimate beneficiaries of these treaties and
negotiations. Policymakers should aim to avoid uncertainty for both States
and investors about the coverage of the international investment regime.
Rethinking ownership-based investment policies means safeguarding
the effectiveness of ownership rules and considering alternatives. On the
one hand, policymakers should test the “fit-for-purpose” of ownership
rules compared to mechanisms in investment-related policy areas such
as competition, tax, and industrial development. On the other, policymakers
can strengthen the assessment of ownership chains and ultimate ownership
and improve disclosure requirements. However, they should be aware of the
administrative burden this can impose on public institutions and on investors.

World Investment Report 2016 Investor Nationality: Policy Challengesxii
Overall, it is important to find a balance between liberalization and regulation
in pursuing the ultimate objective of promoting investment for sustainable
development.
Mukhisa KituyiSecretary-General of UNCTAD

OVERVIEW xiii
TABLE OF CONTENTS
PREFACE . . . . . . . . . . . . . . . . . . . . . . . . . . . . . . . . . . . . . . . . . . . . . . . . . . . . . . . .iii
ACKNOWLEDGEMENTS . . . . . . . . . . . . . . . . . . . . . . . . . . . . . . . . . . . . . . . . . . . . . iv
KEY MESSAGES . . . . . . . . . . . . . . . . . . . . . . . . . . . . . . . . . . . . . . . . . . . . . . . . . . . v
OVERVIEW . . . . . . . . . . . . . . . . . . . . . . . . . . . . . . . . . . . . . . . . . . . . . . . . . . . . . . 1
GLOBAL INVESTMENT TRENDS . . . . . . . . . . . . . . . . . . . . . . . . . . . . . . . . . . . . . . 1
REGIONAL INVESTMENT TRENDS . . . . . . . . . . . . . . . . . . . . . . . . . . . . . . . . . . . 11
INVESTMENT POLICY TRENDS . . . . . . . . . . . . . . . . . . . . . . . . . . . . . . . . . . . . . 19
INVESTOR NATIONALITY: POLICY CHALLENGES . . . . . . . . . . . . . . . . . . . . . . . . . 27

World Investment Report 2016 Investor Nationality: Policy Challengesxiv
OVERVIEW 1
OVERVIEW
GLOBAL INVESTMENT TRENDS
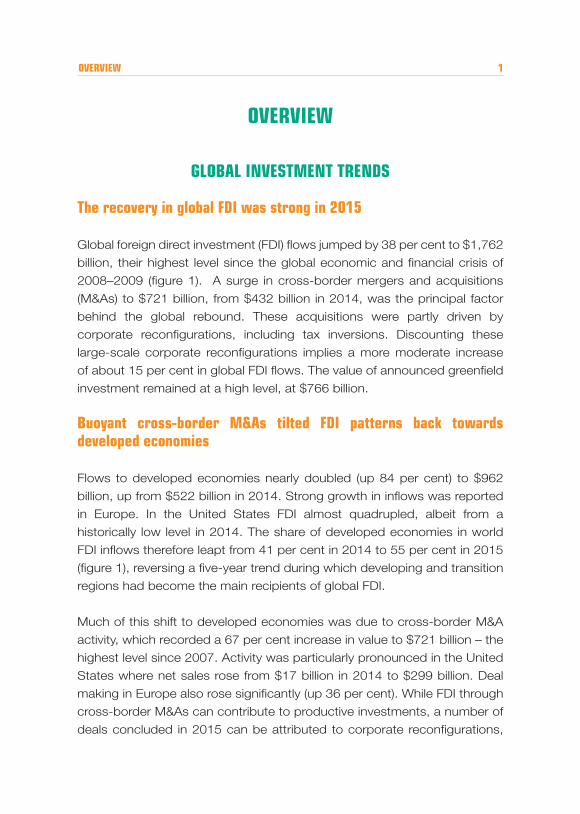
The recovery in global FDI was strong in 2015
Global foreign direct investment (FDI) flows jumped by 38 per cent to $1,762
billion, their highest level since the global economic and financial crisis of
2008–2009 (figure 1). A surge in cross-border mergers and acquisitions
(M&As) to $721 billion, from $432 billion in 2014, was the principal factor
behind the global rebound. These acquisitions were partly driven by
corporate reconfigurations, including tax inversions. Discounting these
large-scale corporate reconfigurations implies a more moderate increase
of about 15 per cent in global FDI flows. The value of announced greenfield
investment remained at a high level, at $766 billion.
Buoyant cross-border M&As tilted FDI patterns back towards developed economies
Flows to developed economies nearly doubled (up 84 per cent) to $962
billion, up from $522 billion in 2014. Strong growth in inflows was reported
in Europe. In the United States FDI almost quadrupled, albeit from a
historically low level in 2014. The share of developed economies in world
FDI inflows therefore leapt from 41 per cent in 2014 to 55 per cent in 2015
(figure 1), reversing a five-year trend during which developing and transition
regions had become the main recipients of global FDI.
Much of this shift to developed economies was due to cross-border M&A
activity, which recorded a 67 per cent increase in value to $721 billion – the
highest level since 2007. Activity was particularly pronounced in the United
States where net sales rose from $17 billion in 2014 to $299 billion. Deal
making in Europe also rose significantly (up 36 per cent). While FDI through
cross-border M&As can contribute to productive investments, a number of
deals concluded in 2015 can be attributed to corporate reconfigurations,

World Investment Report 2016 Investor Nationality: Policy Challenges2
including tax inversions. This trend was especially apparent in the United
States and Europe, with several mega-deals concluded to transfer the tax
domicile of an MNE to jurisdictions that offer lower corporate tax rates, and
do not levy tax on global earnings.
FDI to developing economies – excluding Caribbean financial centres –
increased to a new high of $765 billion (up 9 per cent). Developing Asia,
with its FDI inflows surpassing half a trillion dollars remained the largest FDI
recipient region in the world (figure 2). Developing economies continued to
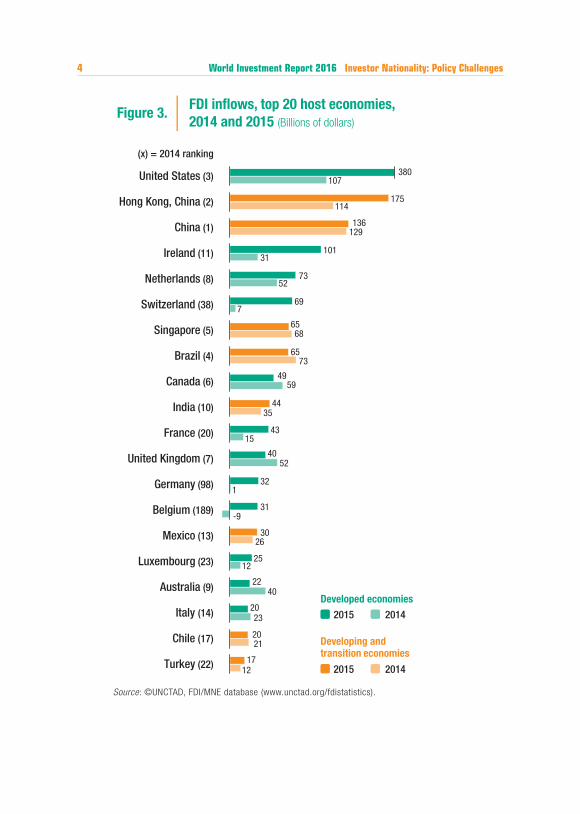
comprise half of the top 10 host economies for FDI flows (figure 3).
Developed economies
World total
Transition economies
Developing economies
Figure 1. Global FDI in�ows by group of economies, 2005−2015, and projections, 2016−2018 (Billions of dollars and per cent)
0
500
1 000
1 500
2 000
2 500
2005 20102006 2007 2008 2009 2011 2012 2013 2014 2015 2016 2017 2018
$1762+38%
35
962+84%
-38%
765+9%
55%
P R O J E C T I O N S
Source: ©UNCTAD, FDI/MNE database (www.unctad.org/fdistatistics).

OVERVIEW 3
Figure 2. FDI in�ows, by region, 2013–2015 (Billions of dollars)
2013 2014 2015
North America
283
165
429
Latin Americaand the Caribbean
176 170168
Africa
52 58 54
Transitioneconomies
8556 35
Developing Asia
431468
541
Europe
323 306
504
Source: ©UNCTAD, FDI/MNE database (www.unctad.org/fdistatistics).
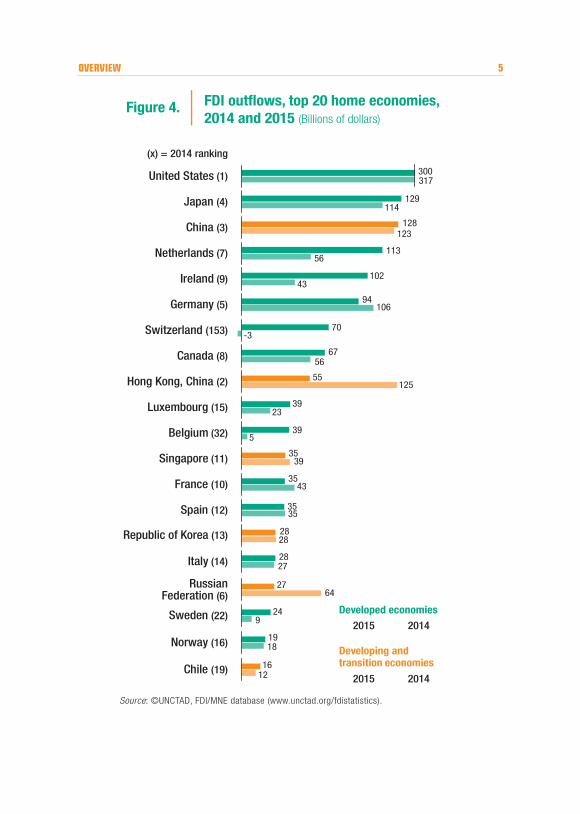
Developed economies also led a rebound in FDI outflows
Following three years of decline, FDI outflows from developed economies
increased by 33 per cent to $1.1 trillion. As a result, developed countries
accounted for 72 per cent of global FDI outflows in 2015, up from 61 per cent
in 2014. This 11 percentage point increase broke the nearly uninterrupted
decline that began in 2007. The increase notwithstanding, the level of
outward FDI from developed economies remained 40 per cent short of its
2007 peak. Europe became the world’s largest investing region in 2015,
with FDI outflows of $576 billion. Foreign investment by North American
MNEs, in contrast, remained flat, with a significant gain in Canada being
offset by a moderate decline in the United States. Nevertheless, the United
States remains the largest investor in the world, followed by Japan (figure 4).
By contrast, FDI outflows declined in most developing and transition
regions. A combination of challenges, including declining commodity
prices and depreciating national currencies, and geopolitical risks were
contributing factors. Against the general downward trend in FDI outflows
World Investment Report 2016 Investor Nationality: Policy Challenges4
Source: ©UNCTAD, FDI/MNE database (www.unctad.org/fdistatistics).
FDI in�ows, top 20 host economies, 2014 and 2015 (Billions of dollars)
Figure 3.
Developed economies
Developing and transition economies
20142015
20142015
(x) = 2014 ranking
380
175
136
101
73
69
65
65
49
44
43
40
32
31
30
25
22
20
20
17
107
114
129
31
52
7
68
73
59
35
15
52
1
-9
26
12
40
23
21
12
United States (3)
Hong Kong, China (2)
China (1)
Ireland (11)
Netherlands (8)
Switzerland (38)
Singapore (5)
Brazil (4)
Canada (6)
India (10)
France (20)
United Kingdom (7)
Germany (98)
Belgium (189)
Mexico (13)
Luxembourg (23)
Australia (9)
Italy (14)
Chile (17)
Turkey (22)
OVERVIEW 5
2014 and 2015 (Billions of dollars)Figure 4.
317
114
123
56
43
106
-3
56
125
23
5
39
43
35
28
27
64
9
18
12
300
129
128
113
102
94
70
67
55
39
39
35
35
35
28
28
27
24
19
16
Developed economies
Developing and transition economies
20142015
20142015
(x) = 2014 ranking
United States (1)
Japan (4)
China (3)
Netherlands (7)
Ireland (9)
Germany (5)
Switzerland (153)
Canada (8)
Hong Kong, China (2)
Luxembourg (15)
Belgium (32)
Singapore (11)
France (10)
Spain (12)
Republic of Korea (13)
Italy (14)
RussianFederation (6)
Sweden (22)
Norway (16)
Chile (19)
Source: ©UNCTAD, FDI/MNE database (www.unctad.org/fdistatistics).

World Investment Report 2016 Investor Nationality: Policy Challenges6
from developing and transition economies, China was a notable exception:
its outward FDI remained high, rising from $123 billion to $128 billion, as a
result of which it held its position as the third largest investor in the world.
Major economic groups or initiatives account for a significant share of global FDI
The G20, Transatlantic Trade and Investment Partnership, Asia-Pacific
Economic Cooperation, Trans-Pacific Partnership, Regional Comprehensive
Economic Partnership and the BRICS account for a significant share of
global FDI flows (figure 5). With the exception of the BRICS, intra-group
FDI is significant, accounting for some 30 per cent to 63 per cent of inflows
in these groups. Although the actual impact on FDI patterns of these
Source: ©UNCTAD, FDI/MNE database (www.unctad.org/fdistatistics).Note: In descending order of 2015 inward FDI stock. G20 = only the 19 member countries of the G20 (excludes
the European Union); TTIP = Transatlantic Trade and Investment Partnership (under negotiation); APEC = Asia-Pacific Economic Cooperation; TPP = Trans-Pacific Partnership; RCEP = Regional Comprehensive Economic Partnership (under negotiation); BRICS = Brazil, Russian Federation, India, China and South Africa.
Figure 5. FDI in�ows in selected megagroupings, 2014 and 2015(Billions of dollars and per cent)
Megagrouping FDI in�owsShare inworld FDI FDI in�ows
Inward FDI stock
652
353
341
271
G20
TPP
RCEP
BRICS
926
593
330
256
20152014
51%
28%
27%
21%
53%
34%
19%
15%
399 TTIP 81931% 46%
669 APEC 95352% 54%
14 393
9 037
4 156
2 373
13 361
12 799
Share inworld FDI

OVERVIEW 7
overlapping partnerships varies, a majority of MNE executives expect
the emergence of mega economic groups to influence their companies’
investment decisions over the next few years.
Primary sector FDI down, manufacturing up
Cross-border M&A sales in manufacturing reached a historical high in
absolute terms ($388 billion in 2015), surpassing the previous record set in
2007. This raised the share of manufacturing to more than 50 per cent of
cross-border M&As in 2015. FDI in the primary sector, in contrast, suffered
from sluggish commodity prices, which resulted not only in reductions in
planned capital expenditures but also in a sharp fall in reinvested earnings.
At the global level, reduced FDI in extractive industries has affected the
total amount of FDI flows, especially in developing countries. In 2014, the
services sector accounted for 64 per cent of the world’s total FDI stock
(figure 6).
Source: ©UNCTAD, FDI/MNE database (www.unctad.org/fdistatistics).
Figure 6. Global inward FDI stock, by sector, 2014 (Trillions of dollars and per cent)
Manufacturing
Primary
Services
Unspeci�ed
7
27
64
$26 tn
2

World Investment Report 2016 Investor Nationality: Policy Challenges8
Investment flows through offshore financial hubs remain significant
Investment flows to offshore financial hubs – including those to special purpose entities (SPEs) and offshore financial centres – declined in 2015 but remain high (these flows are excluded from UNCTAD’s FDI statistics).
The magnitude of quarterly flows through SPEs rose sharply compared with
2014, reaching the levels registered in 2012–2013. Pronounced volatility,
with flows swinging from large-scale net investment in the first three
quarters to drastic net divestment in the last quarter, tempered the annual
total, which dipped to $221 billion. Investment flows to offshore financial
centres were down to an estimated $72 billion in 2015, a retreat from their
anomalous peak of $132 billion in 2013. They include growing flows from
MNEs located in developing and transition economies, sometimes in the
form of round-tripping and transit FDI.
The proportion of investment income booked in low tax, often offshore,
jurisdictions is high despite the slowdown in offshore financial flows. The
disconnect between the locations of income generation and productive
investment which results in substantial fiscal losses is a key concern for
policy makers.
The persistence of financial flows routed through offshore financial hubs
and the potential fiscal losses due to the disconnect between income
generation and productive investment underscore the pressing need to
create greater coherence among tax and investment policies at the global
level. The international investment and tax policy regimes are both the object
of separate reform efforts. Better managing their interactions would help to
make them coherent and mutually supportive. UNCTAD has proposed a set
of guidelines for coherent international tax and investment policies (WIR15).
International production continues to expand
International production by foreign affiliates of MNEs expanded in 2015. Sales and value added rose by 7.4 per cent and 6.5 per cent, respectively.

OVERVIEW 9
Employment of foreign affiliates reached 79.5 million (table 1). However, the return on FDI of foreign affiliates in host economies worsened, falling from 6.7 per cent in 2014 to 6.0 per cent in 2015.
Table 1. Selected indicators of FDI and international production, 2015 and selected years
ItemValue at current prices (Billions of dollars)
1990 2005–2007 (pre-crisis average)
2013 2014 2015
FDI inflows 207 1 418 1 427 1 277 1 762FDI outflows 242 1 445 1 311 1 318 1 474FDI inward stock 2 077 14 500 24 533 25 113 24 983FDI outward stock 2 091 15 104 24 665 24 810 25 045Income on inward FDI 75 1 025 1 526 1 595 1 404
Rate of return on inward FDI 4.4 7.3 6.5 6.7 6.0Income on outward FDI 122 1 101 1 447 1 509 1 351
Rate of return on outward FDI 5.9 7.5 6.1 6.3 5.6Cross-border M&As 98 729 263 432 721
Sales of foreign affiliates 5 101 20 355 31 865 34 149 36 668Value added (product) of foreign affiliates 1 074 4 720 7 030 7 419 7 903Total assets of foreign affiliates 4 595 40 924 95 671 101 254 105 778Exports of foreign affiliates 1 444 4 976 7 469 7 688 7 803Employment by foreign affiliates (thousands) 21 454 49 565 72 239 76 821 79 505
MemorandumGDP 22 327 51 288 75 887 77 807 73 152Gross fixed capital formation 5 072 11 801 18 753 19 429 18 200Royalties and licence fee receipts 29 172 298 311 299Exports of goods and services 4 107 15 034 23 158 23 441 20 861
Source: ©UNCTAD.
FDI flows are expected to decline by 10–15 per cent in 2016, but to pick up over the medium term
FDI flows are expected to decline in 2016 in both developed and developing
economies, barring another wave of cross-border megadeals and corporate
reconfigurations. UNCTAD forecasts that FDI flows are likely to contract
by 10–15 per cent in 2016, reflecting the fragility of the global economy,

World Investment Report 2016 Investor Nationality: Policy Challenges10
the persistent weakness of aggregate demand, sluggish growth in some
commodity exporting countries, effective policy measures to curb tax
inversion deals and a slump in MNE profits in 2015 to the lowest level since
the global economic and financial crisis of 2008–2009. Elevated geopolitical
risks and regional tensions could further amplify the expected downturn.
Over the medium term, FDI flows are projected to resume growth in 2017
and to surpass $1.8 trillion in 2018.
Cross-border M&A activity in early 2016 confirms the projected decline of
FDI flows. The value of transactions announced during the first four months
(including divestments) was 32 per cent lower than during the same period
in 2015. This decline reflects new measures imposed by the United States
Treasury Department to rein in corporate inversions, which have already
resulted in the cancellation of the $160 billion merger of pharmaceutical
company Pfizer (United States) with Ireland-based Allergan Plc.
This year’s UNCTAD business survey of MNE executives reveals muted
overall expectations for 2016, improving over the following two years. In
particular, 45 per cent of top MNEs expect to spend less in 2016, compared
with 32 per cent spending more; by 2018 this trend will reverse with 44 per
cent expecting to spend more.
OVERVIEW 11
REGIONAL INVESTMENT TRENDS
Global FDI inflows rose in 2015 but with considerable variance between
country groups and regions (table 2).
Low commodity prices hold back FDI to Africa
FDI flows to Africa fell to $54 billion in 2015, a decrease of 7 per cent over the
previous year. Dynamic flows into Egypt boosted FDI to North Africa, which
rose by 9 per cent to $12.6 billion in 2015. Yet this was offset by decreasing
flows into Sub-Saharan Africa, as lower commodity prices depressed FDI
inflows in natural-resource-based economies. FDI inflows to West Africa
declined by 18 per cent to $9.9 billion, largely because of a slump in FDI
to Nigeria. FDI flows to Central Africa fell by 36 per cent to $5.8 billion,
as FDI flows to commodity-rich Congo and the Democratic Republic of the
Congo declined significantly. East Africa received $7.8 billion in FDI – a
2 per cent decrease from 2014. FDI flows to Kenya, however, reached a
record level of $1.4 billion in 2015, resulting from renewed investor interest
and confidence in the country’s business climate and booming domestic
consumer market. In Southern Africa, FDI flows increased by 2 per cent
to $17.9 billion, mainly driven by a record $8.7 billion inflows in Angola,
largely due to intracompany loans. Lacklustre economic performance, low
commodity prices and higher electricity costs pushed FDI in South Africa to
$1.8 billion – the lowest level in 10 years.
FDI outflows from Africa fell by 25 per cent to $11.3 billion. Investors from
South Africa, Nigeria and Angola reduced their investment abroad owing to
factors such as lower commodity prices, weaker demand from main trading
partners, and depreciating national currencies.
FDI inflows to Africa are expected to return to a growth path in 2016,
increasing to $55–60 billion. This increase is already becoming apparent
in announced greenfield projects in the first quarter of 2016, particularly

World Investment Report 2016 Investor Nationality: Policy Challenges12
Region FDI inflows FDI outflows2013 2014 2015 2013 2014 2015
World 1 427 1 277 1 762 1 311 1 318 1 474Developed economies 680 522 962 826 801 1 065
Europe 323 306 504 320 311 576
North America 283 165 429 363 372 367
Developing economies 662 698 765 409 446 378
Africa 52 58 54 16 15 11
Asia 431 468 541 359 398 332
East and South-East Asia 350 383 448 312 365 293
South Asia 36 41 50 2 12 8
West Asia 46 43 42 45 20 31
Latin America and the Caribbean 176 170 168 32 31 33
Oceania 3 2 2 2 1 2
Transition economies 85 56 35 76 72 31
Structurally weak, vulnerable and small economies
52 55 56 14 14 8
LDCs 21 26 35 8 5 3
LLDCs 30 30 24 4 7 4
SIDS 6 7 5 3 2 1
Memorandum: percentage share in world FDI flows
Developed economies 47.7 40.9 54.6 63.0 60.7 72.3
Europe 22.7 24.0 28.6 24.4 23.6 39.1
North America 19.8 12.9 24.3 27.7 28.2 24.9
Developing economies 46.4 54.7 43.4 31.2 33.8 25.6
Africa 3.7 4.6 3.1 1.2 1.2 0.8
Asia 30.2 36.6 30.7 27.4 30.2 22.5
East and South-East Asia 24.5 30.0 25.4 23.8 27.7 19.9
South Asia 2.5 3.2 2.9 0.2 0.9 0.5
West Asia 3.2 3.4 2.4 3.4 1.5 2.1
Latin America and the Caribbean 12.3 13.3 9.5 2.5 2.4 2.2
Oceania 0.2 0.2 0.1 0.2 0.1 0.1
Transition economies 5.9 4.4 2.0 5.8 5.5 2.1
Structurally weak, vulnerable and small economies
3.6 4.3 3.2 1.1 1.1 0.5
LDCs 1.5 2.1 2.0 0.6 0.4 0.2
LLDCs 2.1 2.3 1.4 0.3 0.5 0.2
SIDS 0.4 0.6 0.3 0.2 0.1 0.1
Source: ©UNCTAD, FDI/MNE database (www.unctad.org/fdistatistics).
Table 2. FDI flows, by region, 2013–2015 (Billions of dollars and per cent)
OVERVIEW 13
in North Africa, but also in Mozambique, Ethiopia, Rwanda and United
Republic of Tanzania. FDI flows are expected to increase in Kenya and the
United Republic of Tanzania which now allow 100 per cent foreign ownership
of companies listed on their stock exchanges. Furthermore, privatization of
State-owned commodity assets in countries such as Algeria and Zambia
should also provide a boost to inflows.
FDI flows to Developing Asia hit new records
Developing Asia, with FDI inflows reaching $541 billion – a 16 per cent
increase – remained the largest FDI recipient region in the world. The growth
was primarily driven by increased FDI in East and South Asian economies.
In East Asia, FDI rose by 25 per cent to $322 billion, reflecting large equity
investments related to a corporate restructuring in Hong Kong (China) and
dynamic FDI flows to China’s services sector. In South-East Asia, FDI
to low-income economies such as Myanmar and Viet Nam soared, but
this was offset by the lacklustre performance of higher-income countries,
including Singapore, Indonesia and Malaysia. India’s and Bangladesh’s FDI
performance pushed inflows to South Asia to $50 billion, an increase of 22
per cent from 2014. India became the fourth largest recipient of investment
in developing Asia and the tenth largest in the world. In West Asia, rising
inflows to Turkey partly offset the negative impact of commodity prices and
geopolitical challenges on FDI to oil-producing economies, resulting in an
overall 2 per cent decline to $42 billion.
After the jump in values recorded in 2015, FDI inflows are expected to revert
to their 2014 level. Data on cross-border M&A sales in the first quarter of
2016 and announced greenfield investment projects support the expected
slowdown.
Despite the decline in outflows from developing Asia by 17 per cent to
$332 billion, the region’s outward FDI in 2015 remained the third highest
ever. Outward FDI from a number of Asian economies, including China and
World Investment Report 2016 Investor Nationality: Policy Challenges14
Thailand, increased. With outflows worth $128 billion, China remained the
third largest investing country worldwide. After a surge of outward FDI in
2014, flows from Hong Kong (China) more than halved to $55 billion, due to
a large corporate restructuring. South-East Asia’s outward FDI decreased
by 11 per cent to $67 billion, due to a decline in outflows from Singapore.
Outward FDI from India, South Asia’s dominant investor, dropped by more
than one third which resulted in an overall 36 per cent decline of outflows
from the region to $8 billion. Outflows from West Asia, in contrast, soared
by 54 per cent to $31 billion mainly due to a turnaround by Kuwait – a major
investor in the region.
FDI flows to Latin America and the Caribbean remain flat
FDI to Latin America and the Caribbean – excluding the Caribbean
offshore financial centres – stayed flat in 2015 at $168 billion. There were
contrasting performances in Central and South America, however. FDI flows
to Central America rose by 14 per cent to $42 billion, thanks to strong
flows to Mexico and higher FDI in manufacturing across the subregion. FDI
flows to South America, on the other hand, contracted by 6 per cent to
$121 billion, reflecting slowing domestic demand and worsening terms of
trade caused by falling commodity prices. FDI flows to Brazil, the region’s
principal recipient, fell 12 per cent to $65 billion. The decline in commodity
prices also significantly affected flows to the Plurinational of State of Bolivia,
Chile, Colombia, and Peru. In Argentina, FDI surged, albeit compared with
abnormally low flows in 2014.
FDI outflows from the region rose by 5 per cent to $33 billion in 2015.
In Brazil, outward FDI expanded by a strong 38 per cent, an increase
predominantly reflecting a significant reduction in reverse investment by
Brazilian foreign affiliates. In Chile, outflows rose 31 per cent to $16 billion.

OVERVIEW 15
FDI flows to the region may slow down further in 2016 as challenging
macroeconomic conditions persist. In 2015, the value of announced
greenfield projects dropped 17 per cent from their 2014 level, led by an 86
per cent decline in the extractive industry. Lower announced project values
were also registered in the services sector. On the upside, national currency
depreciation may motivate the acquisitions of assets. Cross-border M&As
in the first quarter of 2016 were sharply up thanks to higher sales in Brazil,
Chile and Colombia.
FDI flows in transition economies declined further in 2015
In 2015, FDI flows to transition economies fell by 38 per cent to $35
billion. The FDI performance of transition subgroups differed: in South-
East Europe, FDI inflows increased by 6 per cent to $4.8 billion, as
better macroeconomic conditions and the EU accession process continue
to improve investors’ risk perception. In contrast, FDI flows to the
Commonwealth of Independent States (CIS) and Georgia declined by
42 per cent to $30 billion in a situation of low commodity prices, weakening
domestic markets, regulatory changes, and the direct and indirect impact of
restrictive measures/geopolitical tensions. Flows to the Russian Federation
slumped to $9.8 billion as new FDI almost dried up due to the scaling back
of operations and a string of divestment deals. The economic crisis and
regulatory changes in the country have also reduced the scale and scope
of round-tripping FDI.
MNEs from transition economies more than halved their FDI flows abroad.
Geopolitical tensions, sharp currency depreciation and constraints in capital
markets reduced outward FDI to $31 billion in 2015 – a value last recorded
in 2005.
After the significant decline recorded in 2015, FDI flows to transition
economies are expected to increase modestly in 2016, barring any
further escalation of geopolitical tensions in the region. In the CIS, several

World Investment Report 2016 Investor Nationality: Policy Challenges16
countries, including Kazakhstan, the Russian Federation and Uzbekistan,
have announced large privatization plans, which if realized, will open new
avenues for foreign investment.
FDI inflows to developed countries increased sharply
Flows to developed economies nearly doubled to $962 billion due to
buoyant cross-border M&As sales. Inflows to Europe rose to $504 billion,
accounting for 29 per cent of global inflows. This rebound was driven
by large increases in Ireland, Switzerland and Netherlands. Other major
recipients were France and Germany, both of which recovered sharply from
the low points in 2014. Inflows into the United Kingdom fell to $40 billion
but remained among the largest in Europe. In 2015, FDI inflows to North
America reached $429 billion, surpassing the record high of 2000. In the
United States FDI almost quadrupled, albeit from a historically low level in
2014.
In 2015, MNEs from developed economies invested $1.1 trillion abroad – a
33 per cent increase from the previous year. Europe became the world’s
largest investing region owing to a strong rebound in their cross-border
M&A purchases. Foreign investment by MNEs from North America
remained flat, with a significant increase in outflows from Canada being
offset by a moderate decline of flows from the United States. Japanese
MNEs continued to seek growth opportunities abroad, investing more than
$100 billion for the fifth consecutive year.
Barring another wave of cross-border M&A deals and corporate
reconfigurations, the recovery of FDI activity recorded in 2015 is unlikely
to be sustained at the same level in 2016. Recent regulatory measures
meant to curb tax inversion deals are likely to discourage cross-border M&A
deals and corporate reconfigurations. In addition, the economic growth
momentum observed in some large developed economies weakened
towards the end of 2015.

OVERVIEW 17
FDI to structurally weak and vulnerable economies remains concentrated in extractives industries
FDI flows to the least developed countries (LDCs) rose by 33 per cent to a
record high of $35 billion. In Asia, prospects of deeper economic integration
in the ASEAN region spurred FDI in the Lao People’s Democratic Republic
and Myanmar. FDI flows to Bangladesh hit a record high. Firms from China
have become the largest holders of FDI stock in the LDCs, ahead of the
United States.
FDI to LDCs as a whole is expected to decrease in 2016, reflecting the
continuing lull in FDI to a large number of African economies relying heavily
on natural resources. Nevertheless, some major FDI recipients in the group,
such as Bangladesh, Ethiopia and Myanmar, are likely to see a rise in their
FDI inflows in 2016.
In the landlocked developing countries (LLDCs), FDI flows fell for the
fourth consecutive year to $24.5 billion – a drop of 18 per cent. Transition
economy LLDCs accounted for the fall, particularly Kazakhstan, where
flows halved. Inflows to the African subgroup also declined, while FDI flows
to Asian LLDC economies increased by more than a quarter. In spite of low
commodity prices, Asian State-owned firms have been increasingly involved
in Central Asia’s primary sector. Developing country investors, in particular
from China, are holding an increasing share of FDI stock in LLDCs, as they
do in LDC economies.
Looking ahead, a surge in the value of announced greenfield investments
in the LLDCs provides grounds for optimism. FDI flows to LLDCs, in
particular the transition economy subgroup, are expected to increase if
large privatization plans materialize.
World Investment Report 2016 Investor Nationality: Policy Challenges18
FDI flows to the small island developing States (SIDS) dipped by 32
per cent to a five-year low of $4.8 billion. Reduced investment by energy
firms contributed to a contraction in FDI flows to Trinidad and Tobago, the
largest FDI host in the group. In Africa, FDI flows to Mauritius fell by 50 per
cent, while in Asia and Oceania, the drop in FDI to Maldives and Fiji was
less significant. Developing and transition economies now account for the
majority of the top 10 investors in SIDS.
FDI prospects in SIDS remain subdued, owing to the lack of large-scale
investments in extractive industries and construction. This, however, can
be easily overturned by a single investment in, for example, liquefied natural
gas or a resort complex project.
OVERVIEW 19
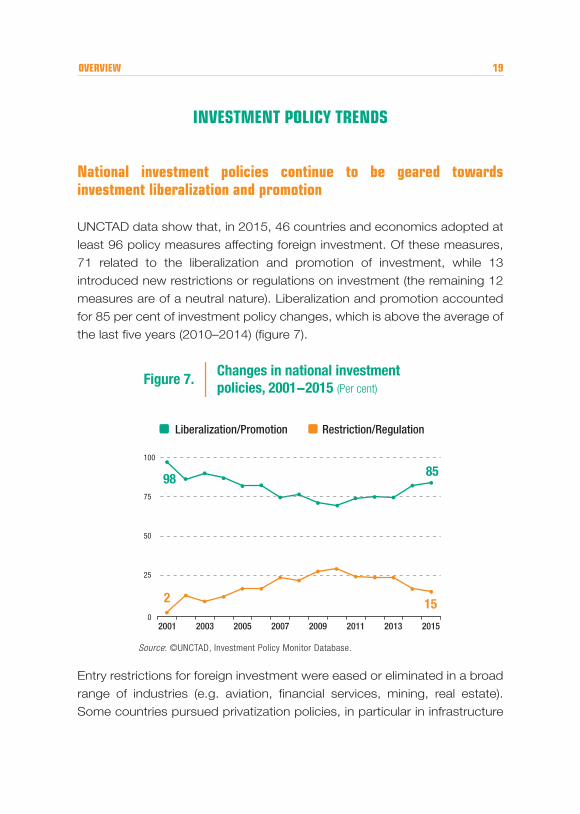
Figure 7. Changes in national investment policies, 2001−2015 (Per cent)
0
25
50
75
100
2
98 85
15
Liberalization/Promotion Restriction/Regulation
2001 2003 2005 2007 2009 2011 2013 2015
Source: ©UNCTAD, Investment Policy Monitor Database.
INVESTMENT POLICY TRENDS
National investment policies continue to be geared towards investment liberalization and promotion
UNCTAD data show that, in 2015, 46 countries and economics adopted at
least 96 policy measures affecting foreign investment. Of these measures,
71 related to the liberalization and promotion of investment, while 13
introduced new restrictions or regulations on investment (the remaining 12
measures are of a neutral nature). Liberalization and promotion accounted
for 85 per cent of investment policy changes, which is above the average of
the last five years (2010–2014) (figure 7).
Entry restrictions for foreign investment were eased or eliminated in a broad
range of industries (e.g. aviation, financial services, mining, real estate).
Some countries pursued privatization policies, in particular in infrastructure

World Investment Report 2016 Investor Nationality: Policy Challenges20
sectors. Others improved business licensing procedures, established
special economic zones or provided other forms of investment incentives.
Another noteworthy feature was the adoption or revision of investment
laws, mainly in African countries. Newly adopted investment restrictions or
regulations largely reflected concerns about foreign ownership in strategic
industries or agricultural land. There is a trend towards tightening screening
procedures for investments in these sectors.
National security considerations are increasingly part of investment policies; they often cover broader national economic interests
In recent years, national security considerations have gained prominence
in investment policies. More countries have adopted legislation in this area
or have reviewed foreign investment projects on grounds related to national
security. This has a number of policy implications. First, countries use different
concepts of national security, ranging from a relatively narrow definition to
broader interpretations that extend investment review procedures to critical
infrastructure, strategic industries and/or national-interest considerations.
Second, countries follow different approaches when restricting foreign
investment due to national-security considerations, ranging from formal
restrictions in specific sectors to complex review mechanisms that provide
the review bodies with ample discretion. Third, review procedures can
differ substantially in their disclosure requirements for foreign investors.
Governments’ space for applying national security regulations needs to be
balanced with investors’ need for transparent and predictable procedures.
The IIA universe continues to grow
With the addition of 31 new international investment agreements (IIAs) – 20
bilateral investment treaties (BITs) and 11 treaties with investment provisions
(TIPs) — the IIA universe grew to 3,304 agreements (2,946 BITs and 358
TIPs) by year-end (figure 8). Although the annual number of new IIAs
continues to decrease, some treaties involve a large number of parties and
carry significant economic and political weight. Recent IIAs follow different
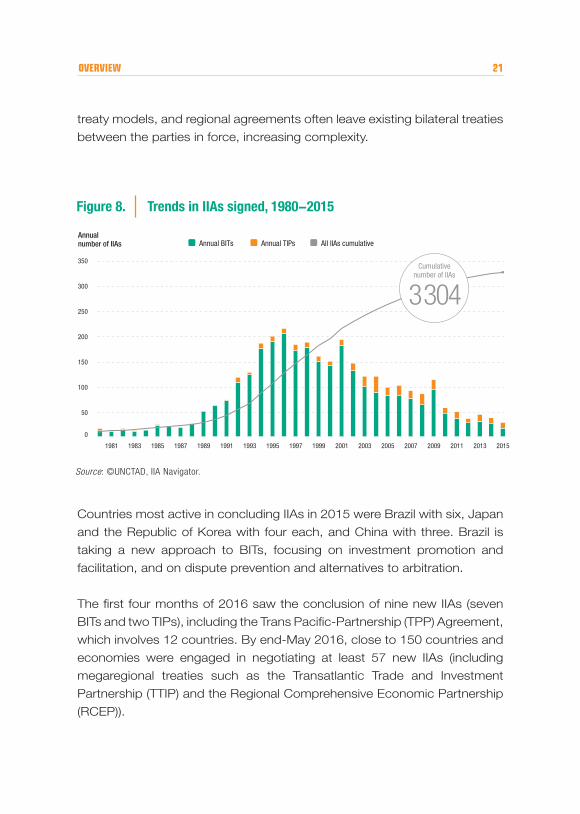
OVERVIEW 21
0
50
100
150
200
250
300
350
Annual TIPs All IIAs cumulativeAnnual BITsAnnual number of IIAs
1981 1983 1985 1987 1989 1991 1993 1995 1997 1999 2001 2003 2005 2007 2009 2011 2013 2015
Figure 8. Trends in IIAs signed, 1980−2015
Cumulativenumber of IIAs
3304
Source: ©UNCTAD, IIA Navigator.
treaty models, and regional agreements often leave existing bilateral treaties
between the parties in force, increasing complexity.
Countries most active in concluding IIAs in 2015 were Brazil with six, Japan
and the Republic of Korea with four each, and China with three. Brazil is
taking a new approach to BITs, focusing on investment promotion and
facilitation, and on dispute prevention and alternatives to arbitration.
The first four months of 2016 saw the conclusion of nine new IIAs (seven
BITs and two TIPs), including the Trans Pacific-Partnership (TPP) Agreement,
which involves 12 countries. By end-May 2016, close to 150 countries and
economies were engaged in negotiating at least 57 new IIAs (including
megaregional treaties such as the Transatlantic Trade and Investment
Partnership (TTIP) and the Regional Comprehensive Economic Partnership
(RCEP)).

World Investment Report 2016 Investor Nationality: Policy Challenges22
At the same time, some countries terminated their IIAs in 2015. Typically,
however, by virtue of survival clauses, investments made before the
termination of these IIAs will remain protected for periods ranging from 10
to 20 years, depending on the relevant provisions of the agreements and
the terms of termination.
The number of new treaty-based ISDS cases reached a record high, with a continued large share of cases against developed countries
In 2015, investors initiated 70 known ISDS cases pursuant to IIAs, which
is the highest number of cases ever filed in a single year (figure 9). As
arbitrations can be kept confidential under certain circumstances, the actual
number of disputes filed for this and previous years is likely to be higher.
As of 1 January 2016, the total number of publicly known ISDS claims had
reached 696. One hundred and seven countries have been respondents to
one or more known ISDS claims.
Figure 9. Known ISDS cases, annual and cumulative, 1987−2015
Annual number of cases
1987 1993 1995 1997 1999 2001 2003 2005 2007 2009 2011 2013 20150
10
20
30
40
50
60
70 696Cumulative number
of known ISDS casesICSID Non-ICSID
Source: ©UNCTAD, ISDS Navigator.

OVERVIEW 23
Following the recent trend, a high share of cases (40 per cent) was brought
against developed countries, including many cases by European investors
against European Union member States. The majority of new cases were
brought under BITs; the Energy Charter Treaty was invoked in about one third
of cases. Publicly available arbitral decisions in 2015 indicated that States
often prevailed at the jurisdictional stage of proceedings, and investors won
more of the cases that reached the merits stage.
IIA reform is intensifying and yielding the first concrete results
Reform to bring the IIA regime in line with today’s sustainable development
imperative is gaining momentum. A new generation of investment treaties
is emerging. In 2015, UNCTAD’s WIR laid out a road map for IIA reform,
providing six guidelines, addressing five reform areas, and outlining options
for action at four levels of policymaking. UNCTAD’s Investment Policy
Framework and its Road Map for IIA Reform are shaping key reform
activities.
At the national level, numerous countries are reviewing their IIA network
and/or developing a new treaty model. About 100 countries (including
those that undertook a review as part of the Regional Economic Integration
Organization (REIO)) have used the UNCTAD’s Investment Policy Framework
to reassess their IIA networks. About 60 of these have used the Framework
to design treaty clauses.
At the bilateral level, the reform drive is most prominently reflected in the
negotiation of new IIAs. Most of the treaties recently concluded include
several sustainable-development-friendly clauses.
At the regional level, IIA reform actions include collective treaty reviews
and IIA action plans, which can result in common IIA models, joint
interpretations, renegotiations, and/or the consolidation of treaties.
Megaregional agreements could consolidate and streamline the IIA regime
World Investment Report 2016 Investor Nationality: Policy Challenges24
and help enhance the systemic consistency of the IIA regime, provided they
replace prior bilateral IIAs between the parties (WIR14).
IIA reform at the multilateral level is the most challenging path. The UNCTAD
Road Map identifies several possible options for multilateral IIA reform with
different levels of intensity. The importance of multilateral consultations on
IIAs for the pursuit of today’s sustainable development agenda has been
recognized in the Addis Ababa Action Agenda, the outcome document
of the Third UN Conference on Financing for Development, held in July
2015. In the Addis Ababa Action Agenda, Member States asked UNCTAD
“to continue its existing programme of meetings and consultations with
Member States on investment agreements.”
During this first phase of IIA reform, countries have built consensus on the
need for reform, identified reform areas and approaches, reviewed their
IIA networks, developed new model treaties and started to negotiate new,
more modern IIAs. Despite significant progress, much remains to be done.
First, comprehensive reform requires a two-pronged approach: negotiating
new, more modern IIAs, but also modernizing the existing stock of treaties.
Second, reform has to address the challenge of increasing fragmentation:
only a common approach will effectively and efficiently deliver an IIA regime
in which stability, clarity and predictability help achieve the objectives of all
stakeholders. Unlike the first phase of IIA reform, where most activities took
place at the national level, phase two of IIA reform will require countries to
intensify collaboration and coordination among treaty partners to address
the systemic risks and incoherence of the large body of old treaties. The
2016 World Investment Forum offers the opportunity to discuss how to
carry IIA reform to the next phase.
Filling a systemic gap in investment facilitation
Facilitating investment is crucial for the post-2015 development agenda.
Facilitation is different from investment promotion. Promotion is about
OVERVIEW 25
marketing a location as an investment destination and is therefore often
country-specific and competitive in nature. Facilitation is about making it
easier for investors to establish or expand their investments and to conduct
their day-to-day business.
Investment facilitation can include improvements in transparency and
information available to investors; work towards efficient and effective
administrative procedures for investors; enhancing the consistency and
predictability of the policy environment for investors through consultation
procedures; and mitigating investment disputes through ombudspersons.
To date, national and international investment policies pay relatively little
attention to investment facilitation. From the 173 new investment promotion
and facilitation policies that were introduced around the world between
2010 and 2015, only a minority relate to investment facilitation. At the
international level, concrete investment promotion and facilitation actions
are either absent or weak in the great majority of the existing 3,304 IIAs.
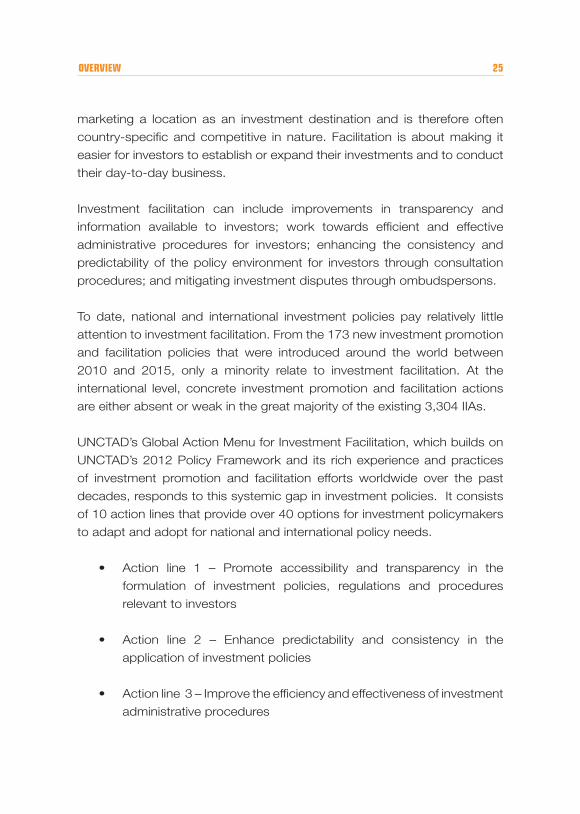
UNCTAD’s Global Action Menu for Investment Facilitation, which builds on
UNCTAD’s 2012 Policy Framework and its rich experience and practices
of investment promotion and facilitation efforts worldwide over the past
decades, responds to this systemic gap in investment policies. It consists
of 10 action lines that provide over 40 options for investment policymakers
to adapt and adopt for national and international policy needs.
• Action line 1 – Promote accessibility and transparency in the
formulation of investment policies, regulations and procedures
relevant to investors
• Action line 2 – Enhance predictability and consistency in the
application of investment policies
• Action line 3 – Improve the efficiency and effectiveness of investment
administrative procedures

World Investment Report 2016 Investor Nationality: Policy Challenges26
• Action line 4 – Build constructive stakeholder relationships in
investment policy practice
• Action line 5 – Designate a lead agency or investment facilitator
with a specific mandate for disputes prevention and mediation
• Action line 6 – Establish monitoring and review mechanisms for
investment facilitation
• Action line 7 – Enhance international cooperation for investment
facilitation
• Action line 8 – Strengthen investment facilitation efforts in
developing-country partners through technical assistance
• Action line 9 – Enhance investment policy and proactive investment
attraction in developing-country partners
• Action line 10 – Enhance international cooperation towards
investment for development, including through provisions in IIAs
The Action Menu includes measures that countries can choose to implement
unilaterally and options that can guide international collaboration or can be
incorporated in IIAs.
Any investment facilitation initiative cannot be considered in isolation from
the broader sustainable development agenda. It is important to address
weaknesses in investment facilitation capabilities where they exist in
developing countries. Effective investment facilitation efforts should be an
integral part of the overall investment policy framework (including regulation,
liberalization, protection and promotion) aimed at maximizing the benefits of
investment and minimizing any negative side effects or externalities.
OVERVIEW 27
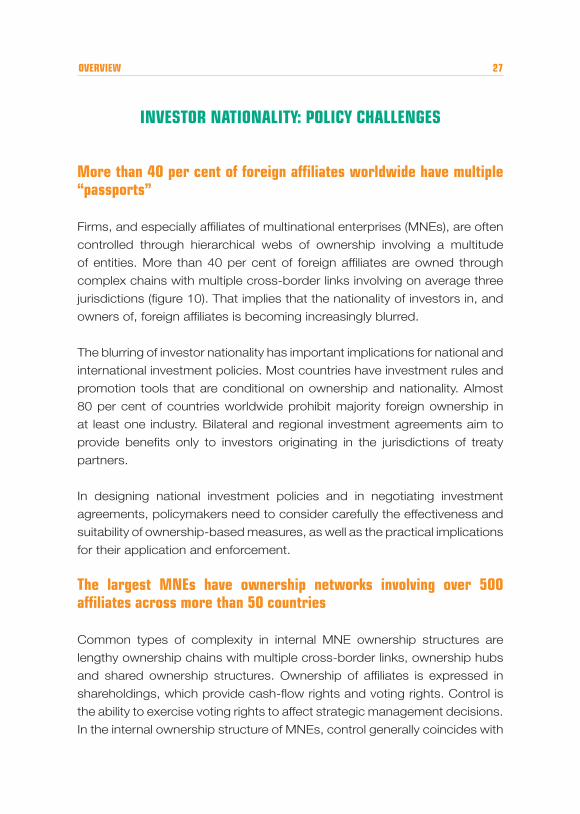
INVESTOR NATIONALITY: POLICY CHALLENGES
More than 40 per cent of foreign affiliates worldwide have multiple “passports”
Firms, and especially affiliates of multinational enterprises (MNEs), are often
controlled through hierarchical webs of ownership involving a multitude
of entities. More than 40 per cent of foreign affiliates are owned through
complex chains with multiple cross-border links involving on average three
jurisdictions (figure 10). That implies that the nationality of investors in, and
owners of, foreign affiliates is becoming increasingly blurred.
The blurring of investor nationality has important implications for national and
international investment policies. Most countries have investment rules and
promotion tools that are conditional on ownership and nationality. Almost
80 per cent of countries worldwide prohibit majority foreign ownership in
at least one industry. Bilateral and regional investment agreements aim to
provide benefits only to investors originating in the jurisdictions of treaty
partners.
In designing national investment policies and in negotiating investment
agreements, policymakers need to consider carefully the effectiveness and
suitability of ownership-based measures, as well as the practical implications
for their application and enforcement.
The largest MNEs have ownership networks involving over 500 affiliates across more than 50 countries
Common types of complexity in internal MNE ownership structures are
lengthy ownership chains with multiple cross-border links, ownership hubs
and shared ownership structures. Ownership of affiliates is expressed in
shareholdings, which provide cash-flow rights and voting rights. Control is
the ability to exercise voting rights to affect strategic management decisions.
In the internal ownership structure of MNEs, control generally coincides with

World Investment Report 2016 Investor Nationality: Policy Challenges28
Figu
re 1
0.Co
mpl
ex o
wne
rshi
p of
MNE
fore
ign
af�l
iate
s(S
hare
of f
orei
gn a
f�lia
tes,
per
cen
t)
100
41
Econ
omic
wei
ght:
~50
%Av
erag
e nu
mbe
r of
coun
tries
in o
wne
rshi
p ch
ains
: 2.5
Shar
e at
60%
for f
orei
gn
af�l
iate
s of
larg
est M
NEs
Cros
s-bo
rder
ow
ners
hip
links
be
twee
n di
rect
ow
ner a
nd
ultim
ate
owne
r
Dire
ct o
wne
r an
d ul
timat
e ow
ner i
n sa
me
coun
try
Dire
ctly
ow
ned
by
ultim
ate
owne
rDi
rect
ow
ner
diffe
rent
from
ul
timat
e ow
ner
MNE
fore
ign
af�l
iate
s
Blur
ring
of in
vest
or
natio
nalit
y…
44
5615
Sour
ce: ©
UNC
TAD
ana
lysi
s ba
sed
on O
rbis
dat
a.

OVERVIEW 29
(direct or indirect) majority ownership. However, MNEs can exercise control
over affiliates even when they have a minority stake.
The universe of MNEs is highly skewed: a very large group of MNEs is
simple, with few affiliates directly and fully owned by the parent company.
A very small group of MNEs accounts for a large share of foreign affiliates.
Less than one per cent of MNEs have more than 100 affiliates, but these
account for more than 30 per cent of all foreign affiliates and almost 60 per
cent of global MNE value added.
The larger the MNEs, the greater the complexity of their internal ownership
structures is. The top 100 MNEs in UNCTAD’s Transnationality Index have
on average more than 500 affiliates across more than 50 countries, seven
hierarchical levels in their ownership structure (i.e. affiliates could potentially
have seven “passports”), about 20 holding companies owning affiliates
across multiple jurisdictions, and almost 70 entities in offshore investment
hubs.
MNE ownership structures are often the result of historical accident or
haphazard growth patterns. Even when MNEs wish to simplify ownership
structures in “entity reduction programmes”, they are often prevented from
doing so because of legal and fiscal constraints, or arrangements with banks.
Where MNEs deliberately incorporate elements of complexity (e.g. lengthy
ownership chains, multiple owners of affiliates, or different locations of direct
versus ultimate owners), these are most often dictated by governance rules
and risk management, financing, tax, and other institutional or policy-related
considerations. Investment policy is one of several policy drivers behind
complex ownership structures.
The long-term trends causing an increasing share of international production
to be concentrated in the largest MNEs are also likely to result in increasing
complex MNE ownership worldwide.

World Investment Report 2016 Investor Nationality: Policy Challenges30
“Multiple passport affiliates” are the result of indirect foreign ownership, transit investment through third countries, and round-tripping
Insights on the ownership structures of MNEs as a whole (top-down
perspective) are useful to show overall complexity. However, for investment
policymakers, a bottom-up perspective looking at the ownership chain
starting from the foreign affiliate, through its direct owners, and up to its
ultimate owner can be more helpful. For WIR16, UNCTAD has developed
a firm-level dataset including some 4.5 million companies that enables a
bottom-up approach.
Comparing domestic and foreign direct owners and ultimate owners (in
a two-by-two ownership matrix) leads to the identification of ownership
scenarios relevant to investment policy in which the direct owners and
ultimate owners of an affiliate are based in different jurisdictions. These
nationality “mismatch” cases – more than 40 per cent of all foreign affiliates
and 50 per cent when measured by revenues – include:
• Indirectly foreign owned companies – about 30 per cent of foreign
affiliates are owned through a domestic entity
• Transit investments – just over 10 per cent of foreign affiliates are
owned through an intermediate entity in a third country
• Round-tripping – about 1 per cent of foreign affiliates are ultimately
owned by a domestic entity
The investor nationality “mismatch index” is considerably higher for the
largest MNEs: 60 per cent of their foreign affiliates have multiple cross-
border ownership links to the parent company.
Mismatches involve almost half of foreign affiliates in developed economies,
and more than a quarter in developing economies. Whereas most
mismatches in developed countries are caused by multi-layered ownership
structures within host countries, in developing countries they are more often
the result of investments transiting through third countries (figure 11).

OVERVIEW 31
Figu
re 1
1.Th
e in
vest
or n
atio
nalit
y m
ism
atch
inde
x by
regi
on
Glob
al2.
541
%
Deve
lope
d ec
onom
ies
2.4
47%
Deve
lopi
ng e
cono
mie
s2.
927
%
Deve
lopi
ng A
sia
2.9
27%
Afric
a2.
926
%
Latin
Am
eric
a2.
926
%
Carib
bean
2.8
26%
Tran
sitio
n ec
onom
ies
2.5
30%
Shar
e of
for
eign
af�
liate
s w
ith d
irect
and
ulti
mat
e ow
ners
from
diff
eren
t cou
ntrie
s (m
ism
atch
inde
x)Av
erag
e nu
mbe
r of
coun
trie
s cr
osse
d
Fore
ign
dire
ct o
wne
r and
fore
ign
ultim
ate
owne
r (di
ffere
nt n
atio
nalit
ies)
Fore
ign
dire
ct o
wne
r and
dom
estic
ulti
mat
e ow
ner
Dom
estic
dire
ct o
wne
r an
d fo
reig
n ul
timat
e ow
ner
Sour
ce: ©
UNC
TAD
ana
lysi
s ba
sed
on O
rbis
dat
a.

World Investment Report 2016 Investor Nationality: Policy Challenges32
Rules on foreign ownership are widespread: 80 per cent of countries restrict majority foreign ownership in at least one industry
National and international investment policy measures that differentiate
between domestic and foreign companies or between foreign investors
of different nationalities include entry restrictions and ownership caps;
operating restrictions or performance requirements; investment facilitation
and incentives; and investment protection. These measures are most often
driven by national security concerns; protection of national and strategic
assets; industrial development and competition policies; social, cultural or
political concerns; and regional integration policies.
Complex ownership structures and investor nationality mismatches
make the application of rules and regulations on foreign ownership more
complex. They also raise important questions about the coverage of IIAs.
For national investment policies, the distinction between domestic and
foreign investment is important. Therefore, the most relevant nationality
mismatches are investments that are indirectly foreign owned through a
domestic entity, and round-tripping investments. For IIAs, the distinction
between different nationalities of investors is important. Therefore, the most
relevant mismatch cases are transit investments through third countries
and, again, round-tripping investments.
At the national policy level, rules and regulations about foreign ownership
are widespread. Services are relatively more affected by foreign equity
limitations, in particular in media, transportation, communication, utilities
and financial and business services. Extractive industries and agriculture
are also frequently regulated through ownership restrictions. The trend in
ownership-related measures since 2010 is towards liberalization, through
the lifting of restrictions, increases in allowed foreign shareholdings, easing
of approvals and admission, and greater access to land for foreign investors.
However, many ownership restrictions remain in place in both developing
and developed countries.

OVERVIEW 33
The blurring of investor nationality has made the application of rules and regulations on foreign ownership more challenging
The determination of investor nationality is part of foreign-investment
registration and approval procedures; sector-specific licensing (when
foreign ownership restrictions apply); and national-security-related foreign
investment reviews. Approval procedures covering all sectors, including
those without ownership restrictions, exist in many countries. Disclosure
requirements for investors vary by country; not all regulators and authorities
require disclosure of ultimate ownership. National-security reviews tend to
examine the full ownership structure of MNEs.
Ownership complexity has made the effective implementation and
enforcement of ownership restrictions and ownership-based rules and
regulations difficult and burdensome. Key challenges for national investment
policymakers are (i) how to assess aggregate direct and indirect ownership,
(ii) how to prevent de facto foreign control, and (iii) how to avoid undue
access to benefits reserved for foreign investors by host State nationals.
Policymakers in some countries have developed a range of mechanisms to
safeguard the effectiveness of foreign ownership rules, including anti-dummy
laws, general anti-abuse rules to prevent foreign control, and disclosure
requirements aimed at monitoring ownership- and non-ownership-based
control.
Indirect ownership structures and mailbox companies have also raised challenges for IIAs
In international investment policymaking, ownership chains have the potential
to significantly expand the reach of IIAs. About one third of investor-State
dispute settlement (ISDS) claims in 2010–2015 are filed by claimant entities
that are ultimately owned by a parent in a third country (not party to the
treaty on which the claim is based). More than a quarter of these claimants
do not have substantial operations in the treaty country – this share can
increase up to 75 per cent considering claims based on treaties concluded
by major ownership hub locations.

World Investment Report 2016 Investor Nationality: Policy Challenges34
IIAs increasingly circumscribe their coverage in response to three specific
challenges: claims brought (i) by entities controlled by a third-country or
host-State entity (round-tripping), (ii) by mailbox companies, or (iii) by entities
with ownership links to the investment that were purposely created in
anticipation of a claim (time-sensitive restructuring). They can do so through
more restrictive definitions and through denial of benefits (DoB) clauses.
In addition, IIAs can clarify the meaning of effective control, if necessary
urging tribunals to ascertain the ultimate owner controlling the relevant
investment. To rule out claims by mailbox companies, IIAs can require that
claimants have substantial business activities (SBA) and provide indicators
for what might constitute SBA. Finally, IIAs can deny ISDS access to entities
that have restructured at a time when a dispute had already arisen or was
foreseeable. However, only half of the new IIAs (those concluded since
2012) and hardly any of the older IIAs include DoB clauses.
Ownership-based investment policies need a re-think to safeguard their effectiveness
The increasing complexity of MNE ownership networks is largely a
consequence of globalization. The practical difficulty of determining ultimate
ownership of, and control over, foreign affiliates call into question the
effectiveness of some ownership-based investment policies. Policymakers
should evaluate the rationale for rules and regulations on foreign ownership
and assess their relative effectiveness and “fit-for-purpose” compared
with alternative policies (such as competition or industrial development
policies), where this is feasible and appropriate. Some countries may require
assistance, including by international organizations, to build the necessary
regulatory and institutional capacity.
Where ownership-based policies are considered necessary, investment
authorities can improve disclosure requirements to assess ownership
chains and ultimate ownership. They should be aware of the administrative
burden this can impose on public institutions and on investors. Synergies
with other agencies in policy areas that investigate ownership chains, such
as competition authorities and tax authorities, should be exploited.
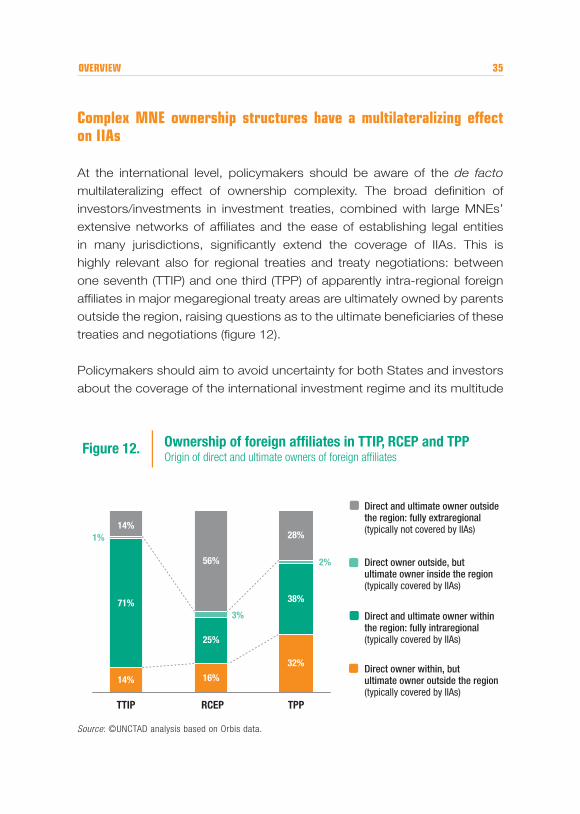
OVERVIEW 35
Complex MNE ownership structures have a multilateralizing effect on IIAs
At the international level, policymakers should be aware of the de facto
multilateralizing effect of ownership complexity. The broad definition of
investors/investments in investment treaties, combined with large MNEs’
extensive networks of affiliates and the ease of establishing legal entities
in many jurisdictions, significantly extend the coverage of IIAs. This is
highly relevant also for regional treaties and treaty negotiations: between
one seventh (TTIP) and one third (TPP) of apparently intra-regional foreign
affiliates in major megaregional treaty areas are ultimately owned by parents
outside the region, raising questions as to the ultimate beneficiaries of these
treaties and negotiations (figure 12).
Policymakers should aim to avoid uncertainty for both States and investors
about the coverage of the international investment regime and its multitude
Figure 12.
Direct and ultimate owner outside the region: fully extraregional (typically not covered by IIAs)
Direct owner outside, but ultimate owner inside the region (typically covered by IIAs)
Direct and ultimate owner within the region: fully intraregional (typically covered by IIAs)
Direct owner within, but ultimate owner outside the region (typically covered by IIAs)
14% 16%
32%
71%
25%
38%
1%
3%
2%
14%
56%
28%
RCEPTTIP TPP
Source: ©UNCTAD analysis based on Orbis data.

World Investment Report 2016 Investor Nationality: Policy Challenges36
of bilateral, regional and megaregional treaties. International collaboration
could aim to build a common understanding of “effective control” and a
common set of criteria for substantial business activity and for identifying
the origin of investors, as a basis for a more consistent interpretation of
investment rules and treaty coverage, and as an integral part of global
efforts to facilitate international investment.
* * *
In conclusion, the overarching objective of investment policy is to make
investment work for sustainable development, maximizing its benefits and
minimizing its negative effects. Complex ownership structures call into
question the effectiveness of ownership-based policy tools widely used for
this purpose, both nationally and internationally. This requires a re-evaluation
of these tools for the pursuit of the common goal.
One approach is to enhance the application of ownership-based regulations
by improving disclosure requirements and procedures to identify the
ultimate owner of an investment. Another approach is to replace, where
feasible and appropriate, ownership-based regulations with other policies
such as competition, taxation, industrial development, public services
or cultural policies. It is important to find the right policy mix, effective
and proportionate. Whichever approach is chosen, a balance between
liberalization and regulation must be found in pursuing the ultimate objective
of promoting investment for sustainable development.
To help policymakers chart a way forward, WIR16 provides insights on
the global map of ownership links in MNEs and on how national and
international policymakers around the world can respond to the challenges
posed by complex ownership structures. The new data, empirical analysis,
and policy responses presented here can inspire further research to support
better informed policy decisions. They also make a strong case for targeted
technical assistance and capacity building, and for more international
consensus building. UNCTAD will continue to support these efforts.

OVERVIEW 37
WIR 2015: Reforming International Investment Governance
WIR 2014: Investing in the SDGs: An Action Plan
WIR 2013: Global Value Chains: Investment and Trade for Development
WIR 2012: Towards a New Generation of Investment Policies
WIR 2011: Non-Equity Modes of International Production and Development
WIR 2010: Investing in a Low-carbon Economy
WIR 2009: Transnational Corporations, Agricultural Production and Development
WIR 2008: Transnational Corporations and the Infrastructure Challenge
WIR 2007: Transnational Corporations, Extractive Industries and Development
WIR 2006: FDI from Developing and Transition Economies: Implications for Development
WIR 2005: Transnational Corporations and the Internationalization of R&D
WIR 2004: The Shift Towards Services
WIR 2003: FDI Policies for Development: National and International Perspectives
WIR 2002: Transnational Corporations and Export Competitiveness
WIR 2001: Promoting Linkages
WIR 2000: Cross-border Mergers and Acquisitions and Development
WIR 1999: Foreign Direct Investment and the Challenge of Development
WIR 1998: Trends and Determinants
WIR 1997: Transnational Corporations, Market Structure and Competition Policy
WIR 1996: Investment, Trade and International Policy Arrangements
WIR 1995: Transnational Corporations and Competitiveness
WIR 1994: Transnational Corporations, Employment and the Workplace
WIR 1993: Transnational Corporations and Integrated International Production
WIR 1992: Transnational Corporations as Engines of Growth
WIR 1991: The Triad in Foreign Direct Investment
WORLD INVESTMENT REPORT PAST ISSUES

World Investment Report 2016 Investor Nationality: Policy Challenges38
The sales publications may be purchased from distributors of United Nations publications throughout the world. They may also be obtained by contacting:
United Nations Publications Customer Servicec/o National Book Network15200 NBN WayPO Box 190Blue Ridge Summit, PA 17214email: [email protected]
unp.un.org
For further information on the work on foreign direct investment and multinational enterprises, please address inquiries to:
Division on Investment and EnterpriseUnited Nations Conference on Trade and DevelopmentPalais des Nations, Room E-10052CH-1211 Geneva 10 Switzerland
Telephone: +41 22 917 4533Fax: +41 22 917 0498unctad.org/diae
HOW TO OBTAIN THE PUBLICATIONS
World Investment Reportworldinvestmentreport.org
Investment Policy Framework for Sustainable Developmentinvestmentpolicyhub.unctad.org/ipfsd
UNCTAD Entrepreneurship Policy Frameworkunctad.org/en/PublicationsLibrary/diaeed2012d1_en.pdf
World Investment Forumunctad-worldinvestmentforum.org
Sustainable Stock Exchanges Initiativesseinitiative.org
Business Schools for Impactbusiness-schools-for-impact.org
Investment Policy Hubinvestmentpolicyhub.unctad.org
FDI Statisticsunctad.org/fdistatistics
Investment Trends and Policies Monitorsunctad.org/diae
Internatinal Investment Agreementsunctad.org/iia
Investment Policy Reviewsunctad.org/ipr
ISAR Corporate Transparency Accountingunctad.org/isar
Transnational Corporations Journalunctad.org/tnc
SELECTED UNCTAD PROGRAMMES ONINVESTMENT AND ENTERPRISE
worldinvestmentreport.org