world markets for raising new capital from two perspectives. first, we examine the relation between...
TRANSCRIPT

World Markets for Raising New Capital
Brian J. Henderson University of Illinois
Narasimhan Jegadeesh
Emory University
and
Michael S. Weisbach University of Illinois and
National Bureau of Economic Research
December 12, 2003
Abstract Financial markets are increasingly integrated globally. We examine the extent to which firms from countries around the world rely on different sources of capital, the locations where they raise capital, and the factors that affect these choices during the 1990-2001 period. Firms raised about $25.9 trillion of new capital, including $4.7 trillion from abroad. International debt issuances are substantially more common than equity, accounting for over 90% of the international security issues, and about 20% of all public debt issues. In contrast, international equity issues account for about 4.4% of all international security issues, and about 6% of all equity issues during our sample period. Market timing considerations appear to be very important in security issuance decisions. Firms all around the world are more likely to issue equity prior to periods of low market returns. Most of the cross-border equity is issued in the U.S. and the U.K., and these issues tend to occur in ‘hot’ markets and prior to relatively low market returns. Finally, firms issue more debt when interest rates are lower, and issue debt overseas when interest rates in the place of issue are lower than they are at home.
We thank David Weisbach, Jeff Wurgler and participants in presentations at Columbia University, Georgetown University, the University of Central Florida, the University of Illinois, and the University of Toronto for helpful suggestions. The authors can be reached via email at [email protected], [email protected], and [email protected].

1
1. Introduction
The financial markets are increasingly integrated globally. Corporations now have tremendous
amounts of flexibility in deciding on the type of securities that they can issue to fund their investments,
and also on the locations where they can issue these securities. For instance, firms in Europe can issue
bonds, convertible bonds, or stocks in the U.S. or in Japan to raise capital. However, we know very little
about the extent to which firms make use of this wide array of financing choices in practice, and how the
practice varies internationally. For example, we do not have hard empirical evidence to answer the
following questions: How do firms across the world raise capital to fund their investments? To what
extent do firms rely on capital domestically, and to what extent do they raise capital internationally? Are
some countries more dependent on foreign capital than the others? Do firms find it easier to raise some
form of capital, such as debt, more easily outside their borders than other forms of capital, such as equity?
To what extent do the conditions of the financial markets, and factors such as interest rates and equity
valuations affect the decision of what security to issue, and where to issue that security?
The answers to these questions will broaden our understanding of corporate finance in a globally
integrated environment. In perfectly frictionless markets, the fundamental Modigliani and Miller (1958)
theorem implies that just as the type of securities a firm issues is irrelevant, the location where these
securities are issued is also irrelevant. However, market frictions and a less than perfect integration of
capital markets make the choice of marketplace an important consideration for practitioners.
Understanding this choice, i.e., which geographic market a firm should use when it acquires capital, is an
important issue that has received little attention in the corporate finance literature.
In an international context, Stulz (1999) points out that expanding the shareholder base
internationally improves risk sharing, and thereby lowers the cost of capital. Of course, shareholders can
diversify their portfolios internationally, and hence in perfectly integrated markets it would not be
necessary for firms to raise capital from outside their borders to expand their base of shareholders.
However, because of investors' home-bias, regulatory frictions, and tax considerations, firms sometimes
have to directly raise capital from abroad to take advantage of any lower cost-of-capital abroad. In fact,

2
Edison and Warnock (2003) document that foreign ownership increases after firms cross-list their shares
abroad.
There are also several other advantages in raising capital abroad. As Coffee (1999) and Reese
and Weisbach (2002) point out, when firms issue stocks in countries with strict capital market regulations
and tighter reporting standards than in their home countries, they commit to abide by these higher
standards. Also, when foreign secondary markets are more liquid, firms can take advantage of the better
liquidity when they raise capital in these markets (see Pagano, Roell, and Zechner, 2002). These benefits
in turn potentially allow firms to lower their cost of capital.
Although we know many of the advantages of raising capital internationally from a theoretical
perspective, we do not have empirical evidence on the extent to which firms rely on foreign markets
relative to domestic markets for their capital needs. Several recent papers, including Alexander, Eun, and
Janakiraman (1988), Bancel and Mittoo (2001), Pagano et al. (2002), and Sarkissian and Schill (2003),
examine the characteristics of firms that list their equity abroad, and the price effects of cross-listings.
These papers typically focus on the effects of cross-listing a firm’s equity, rather than on raising new
capital. In contrast, we focus on the amount of new capital that firms in countries across the world raise
abroad. In addition, most of the existing academic literature focuses on cross-listings of equity,
neglecting international issuances of other types of securities such as debt.
This paper addresses a number of questions about where and what kinds of securities firms issue
to raise capital. We examine all forms of public securities that are issued to raise new capital.
Specifically, we examine the amount of capital that firms in different countries raised in the 1990-2001
period, and the forms of securities that they issue to raise the capital. We also examine the extent to
which firms rely on domestic capital relative to foreign capital to fund their investments. We evaluate the
importance of different factors that affect their choice of when and where to issue different kinds of
securities.
The extant literature finds that one of the important factors that influence issuance of new
securities is market timing. For example, Ritter (1991), Spiess and Affleck-Graves (1995) and Loughran

3
and Ritter (1995) find that firms are more likely to issue stocks prior to a decline in their value. At the
aggregate level, Baker and Wurgler (2000) document that firms in the U.S. tend to issue a larger
proportion of equity relative to debt when the market as a whole is overvalued.
This paper examines whether, internationally, firms time the market when they issue new equity.
In addition, we also examine whether firms time debt issuances the same way as they appear to time
equity issuances. Specifically, we examine at the aggregate level whether firms issue more debt when
interest rates are relatively low and are expected to rise. We examine whether firms are more likely to
issue debt when issuing equity is relatively unattractive because the market is undervalued.
Furthermore, the ability to raise capital internationally allows firms an added dimension of timing
opportunity. Firms can raise capital in countries when the cost of a particular form of capital is relatively
low. We examine the extent to which firms take advantage of this opportunity.
We find that firms raised about $25.9 trillion of new capital during the period 1990 – 2001.
International security issues are common, amounting to a total of $4.7 trillion. International issuances of
debt securities are substantially more common than international equity issuances. For instance, 20.24%
of corporate bonds (about $4.2 trillion), are issued outside the home country of issuing firms, compared
with 6.09% of public equity offerings (about $0.2 trillion) that is issued outside the home country.
During our sample period, the percentage of equity issued abroad increased from 4.7% in 1991 to 9.9% in
2001. The percentage of debt issued abroad, however, decreased from 26.6% in 1991 to 18.6% in 2001.
A number of cross-country patterns are evident from the data on international security issues.
First, companies are drawn to the most liquid markets; the U.S. and the U.K. are by far the most popular
sources of new cross-border equity. Firms from countries with illiquid equity markets issue a larger
fraction of new equity outside their countries than do firms from countries with relatively liquid and well-
developed equity markets. Proximity seems important; firms are more likely to issue securities in
countries geographically close to them. European debt markets are more attractive to foreign issuers than
are their equity markets. Finally, firms in the U.S. and Canada are by far the largest issuers of non-
convertible preferred stocks, while convertible bonds are popular in Japan. Large fractions of both

4
preferred stocks and convertibles are issued internationally, although the absolute magnitude of these
securities is relatively small compared to common equity and non-convertible debt.
Our next set of tests examine whether firms attempt to time the market when they issue debt and
equity from two perspectives. First, we examine the relation between security issues and
contemporaneously observable market conditions. We find that firms issue more equity domestically,
both in absolute magnitude and as a fraction of total capital, following a run-up in the domestic stock
market. Similarly, firms issue more debt when domestic interest rates are low. Firms also issue more
debt abroad when the foreign rates are low relative to domestic interest rates.
The second dimension of timing that we examine is whether new debt and equity issues predict
future changes in these markets. We find that firms successfully time their equity issues when the stock
market appears to be overvalued. Specifically, we find that stock market returns are abnormally low
following periods of high equity issues. International equity issues also predict future market returns in
the countries where firms issue equity. However, we find only weak evidence that debt issues
successfully time future changes in interest rates. Although firms do tap into the debt market when the
contemporaneous rates are low, large debt issues do not necessarily precede a rise in interest rates.
The remainder of the paper proceeds as follows: Section 2 describes the sample and the data
sources. Section 3 analyzes the securities that firms in different parts of the world issue to raise new
capital, and where they issue them. Section 4 examines the correlation of new security issues across
countries. Section 5 examines the extent to which firms time the market, both domestically and
internationally, when they issue equity. Section 6 investigates the relationship between debt issuances
and interest rates, both domestically and internationally, and the relation between debt issues and future
equity market and interest rate movements. Section 7 concludes the paper.
2. Data Sources
Our primary data source for security issues is Security Data Corporation’s (SDC) new issues
database. SDC maintains an international transaction-level database on new issues of common equity,

5
preferred equity, and bonds with original maturities greater than one year dating back to 1990. SDC
collects the data from a variety of different sources in each country. For example in the U.S., SDC
collects new issues data from SEC filings, prospectuses, news sources, wires, and daily surveys of
underwriters and financial contacts. In contrast, SDC collects the Asia-Pacific database from “more than
200 English and foreign language news sources, trade publications, wires, foreign stock exchange filings,
and proprietary surveys of investment banks and other advisors.”
Our sample period is from 1990 to 2001. The SDC database contains 195,375 observations of
security issues during this period, which includes both public and private offerings. For a few countries,
however, the SDC data are incomplete in 1990. Therefore we conduct some of our later analyses within
the 1991 to 2001 sample period.
The other data sources that we use are the following: We obtain aggregate market capitalization
and GDP data from the Global Market Information and the WDI databases, which are both produced by
the World Bank. We obtain inflation data from the International Financial Statistics database and interest
rate swap data from Datastream. We use the Datastream “total return” indices to measure the stock
market returns for the larger countries in our sample. For the smaller countries, we use the regional
value-weighted total return indices that Datastream provides. For example, for the “Other Asia’’ category
in our sample, we use the Datastream value-weighted index for “Other Asia excluding Japan’’ as the
market index.
To rank the general market environment of each country, we use the Euromoney ratings of
country risk and measures of market openness. Euromoney conducts an annual survey of 30 economists
from “leading financial and economic institutions” and ranks 180 countries on their relative country risks.
This index aggregates the score in nine categories for each country: Political risk (25%), economic
performance (25%), debt indicators (10%), debt in default or rescheduled (10%), credit ratings (10%),
access to bank finance (5%), access to short-term finance (5%), access to financial markets (5%), and
discount on forfeiting (5%). The Euromoney total index score and access to financial markets score are
our measures of market openness.

6
3. Security Issues: Who issues what securities and where?
This section provides an analysis of the locations where firms from various countries raise
capital, and the forms of capital that they raise domestically and internationally. We start by
characterizing the trends in capital raising activities across countries and the extent of globalization over
our sample period. Our analysis here will help us understand the important factors that affect the demand
and supply of capital across countries. We also investigate whether some types of securities are more
suitable for global issues than other types of securities.
3.1. Global Capital Markets
Table 1 presents the aggregate statistics on international capital markets in the countries in our
sample during our sample period. We report the market size, GDP, and a measure of market openness
compiled by Euromoney in 1997 for each region. We report the results for the Group of Seven (G7) 1
most developed countries separately and we aggregate the results for the other countries into ‘regions.’
Table 1 also reports the Euromoney country risk and openness ratings for each country or region.
The Euromoney index is clearly correlated with the level of financial development. The developed
countries all have market openness ratings at or close to 5 (the maximum possible rating) while the
developing countries have lower rankings. The developed countries also receive a better overall risk
rating than the developing countries. In later analyses, we examine the relation between the Euromoney
ratings and the extent to which countries rely on outside capital or the extent to which they supply capital.
3.2. Trends in Capital-Raising
We first examine the magnitude of capital that firms raise during the 1991 to 2001 sample period.
We consider both public and private issues of all securities except debt less than one year to maturity.
Firms typically rely on bank debt or commercial paper for short-term debt, and SDC does not collect
complete data on these types of short-term debt. Table 2 presents the magnitudes of security issues over
1 The group of most developed seven countries, commonly called the G7 countries, comprise Britain, Canada, France, Germany, Italy, Japan and the United States.

7
time. The amount of capital raised increases from $931 billion in 1991 to over $3.8 trillion in 2001, about
4.1 times as much. Both domestic and international issues increase substantially over the sample period,
but the magnitude of domestic issues increase proportionately faster. Specifically, the capital raised
domestically increases by 4.36 times during this sample period, compared with the growth of 3.14 for
capital raised internationally. Therefore, although the extent to which firms go abroad to raise capital has
increased in magnitude, the amount of new foreign capital as a proportion of total new capital has
declined over time.
Table 2 also breaks down security issuances by type of security. Non-convertible bonds are by
far the most common type of security that firms issue to raise capital. Firms issued over $20.81 trillion of
debt over the 1990-2001 period, representing over 82% of total capital raised. In comparison, firms raise
only $3.408 trillion, or 13.5% of total capital by issuing equity. Of course, the magnitude of debt issues is
not directly comparable to the magnitude of equity issues because unlike equity, bonds have finite
maturities. Firms typically roll over bonds at maturity, and hence a part of the debt issues go towards
refinancing old debt and only the remaining part is new capital. Although we do not observe these
components of debt issues separately, we can estimate the division between these two components if we
were to assume a growth rate of capital raised from outside sources. If we were to assume a growth rate
of five to ten percent, then with the appropriate adjustments (see Appendix III for details), the amount of
new debt that firms raised during this period is between $5.6 trillion to $7.4 trillion. Therefore, debt
provides a significantly larger fraction of the external financing used by firms in our sample than does
equity.2
In addition to being the more important source of new outside funding, debt is also more
commonly issued abroad than is equity. In our sample period, over 20% of debt is issued internationally,
compared to only about 6.1% of equity. Among the bond issues, firms raise more international debt for
long-maturity bonds than for short-maturity bonds. For example, 23% of bonds with maturities longer
2 Consistent with these findings are the results from Rajan and Zingales (1995), who find that in an earlier sample period (1984-1991), debt provides the majority of new financing for firms in all G-7 countries except France.

8
than five years are issued internationally, compared with 17% of the shorter-term bond issues. Quite
likely, firms go abroad more frequently for bonds with longer maturities because of the incremental fixed
costs associated with issuing securities abroad.
The greater internationalization of debt markets than equity markets is especially striking when
we consider the fact that cross-border issues of debt do not offer many of the advantages of cross-listings
of equity that the papers in the literature discuss.3 For example, Karolyi (1998) notes that cross-border
equity issues increase issuers' visibility in the foreign markets, and Coffee (1999) and Reese and
Weisbach (2002) emphasize the governance implications of cross-listing of a firm’s equity in well-
regulated markets such as the U.S. In contrast, cross-border debt issues do not offer increased visibility
for the issuer, and also, regulations typically do not require that the debt issuers abide by the reporting
standards in the country of issues.4
Cross-border debt issues, however, do offer some advantages that cross-border equity issues do
not provide. One important advantage of foreign debt is the potential to hedge exchange rate risk. For
example, firms that have significant revenues in foreign currencies can hedge their exchange rate risks by
issuing debt in those currencies. Since, unlike bonds, equity does not promise fixed periodic cash flows,
it is not suitable for hedging cash flow risks. Therefore, it is likely that firms with significant foreign
exchange risk will issue foreign debt in the currency to which they have exposures.5
There are also important tax considerations in the decision of where to issue debt. The ability to
utilize an interest deduction in an international context depends on a number of factors, including the
location of the income and the interest payment. The process for “allocating” the interest deduction
depends on where the bond is issued. The ultimate choice of the optimal place to issue a bond from a tax
3 The debt instruments have finite maturities and hence the fixed costs associated with foreign issues would tend to favor issuance of equity. 4 The rating agencies in the country of issue may require accounting and other disclosures that are more stringent than the regulations in the issuer's home country. However, these are private disclosures, and they do not lend credibility to the same extent as public disclosures mandated by regulatory bodies. 5 Of course, firms can issue domestic debt, and enter into exchange rate swaps to separately hedge their exchange rate risk exposures. This hedge, however, entails additional transactions in the swap market. In addition, the tax implications of issuing domestic debt and swapping currencies are substantially different from issuing debt overseas.

9
perspective depends on a firm’s distribution of incomes across countries, and companies that derive
significant foreign income would likely issue debt in the countries that generate the income.6
In addition, debt is also more suitable than equity for taking advantage of cheaper financing
opportunities that may be available abroad. Firms issue new equity at the prevailing market prices
regardless of whether they issue the equity at home or abroad, and hence the cost of equity is the same
both locally and abroad. However, interest rates vary across countries and firms can issue debt in
countries where the rates are the cheapest. The extent to which they are able to do so is an unexplored
empirical issue that we address in a later section.
Finally, potential informational asymmetry would also favor cross-border debt issues over cross-
border equity issues. Bond prices are much less sensitive to any information about firm value than are
stock prices, and hence informed investors are more likely to trade in stocks than in bonds. Since
domestic investors are likely to have an informational advantage, foreign investors would be more
receptive to cross-border bond issues than to cross-border stock issues.
Among these factors, a survey of chief financial officers by Graham and Harvey (2001) lists the
hedging consideration as the most important factor for issuing foreign debt, followed by tax
considerations and interest rate timing. Graham and Harvey’s survey does not address the importance of
potential asymmetry of information, perhaps because this factor is not specific to any particular firm, but
it does affect the investor acceptance of a particular type of security. Overall, our evidence indicates that
the advantages of cross-border debt issues are much more important for the issuers than the advantages of
cross-border equity issues.
Other types of securities, such as preferred stocks and convertible bonds, are much less frequently
issued than either equity or debt in all countries. Issuers used either debt or equity to raise about 96
percent of the new capital during our sample period. Convertible bond and preferred stock issues account
for 2.6 percent and 1.4 percent of the new capital, respectively. Interestingly, however, a bigger fraction
of preferred stocks and convertible bonds are issued abroad than stocks. Specifically, 15.9 percent of
6 For a detailed discussion of the tax codes, see Shaviro (2001).

10
preferred stocks and 23.8 percent of convertibles are issued overseas. The markets for these securities are
not particularly well developed in many countries and hence firms are likely to go abroad (particularly to
the U.S.) when they issue these securities.
Figure 1 plots the time series of the fraction of various forms of securities that firms issue abroad.
Although on average we find the smallest fraction of international issues for equities among all types of
securities, cross-border equity issues have increased over time. For example, only 4.8% of equity was
issued outside its home country in 1991, compared with 9.9% in 2001. In contrast, the fraction of the
debt issued internationally has actually declined from 26.6% in 1991 to 18.6% in 2001.
There are several factors that have contributed to the growth of international equity issuances.
First, the U.S. and the U.K. markets grew faster than the rest of the world during this period. Therefore,
these two markets, which are the primary sources of cross-border equity capital, were able to supply more
capital internationally. Second, the financial crises of the 1990s in many countries have been attributed to
corporate governance failures (see for example Johnson et al., 2000). Since cross-listing in the U.S. and
the U.K. pre-commits the firms to more stringent disclosure standards and corporate governance
practices, the perceived benefits of listing abroad increased during this period. Finally, issuing equity
across borders was a relatively new practice in the early 1990s. Investor acceptance and the success of
the early issues likely led to the growth of cross-border equity issues over the next decade.7
3.3. Foreign and domestic sources of capital across countries
This section examines the extent to which firms in different countries rely on domestic capital
and foreign capital. Table 3 presents the quantity of each security raised by each country or region, both
inside and outside the region. Panel A presents the data for equity, Panel B for debt, Panel C for preferred
stocks, and Panel D for convertibles. The first column of each panel presents the quantity of capital
raised by firms in each region inside their home country. The second column presents the amount of
7 La Follette et al. (1992) describes the case of Compania de Telefonos de Chile, which issued one of the first South American ADRs in 1990. In this case, the authors describe how there was much uncertainty about whether it would be possible for a South American firm to issue substantial quantities of equity outside its home country. After the success of this ADR, it became common for South American firms to raise capital from the U.S. with ADR issues.

11
capital raised by foreign firms in each region and the third column presents the amount of equity that the
firms from each country raise abroad.
Equity Markets. Panel A indicates that over the entire sample period, firms raised over $3,201 billion by
issuing equity domestically, and $207 billion through cross-border equity issues. The U.S. ranks as the
most desirable location for cross-border equity issues. Foreign firms raised $153 billion in the U.S.,
which is about 74 percent of the total amount of global cross-border equity issues. Of course, it is not
surprising that the U.S. ranks first in the volume of foreign equity issues since it is the largest market.
However, the U.S. share of cross-border issues is almost twice the size of the U.S. market relative to the
world market. It is also twice the fraction of new equity issues by domestic firms in the U.S. relative to
domestic new issues in all countries.
The U.K. is the second-largest country for cross-border equity issues, accounting for about ten
percent of the cross-border equity capital raised by foreign firms. Both the U.S. and the U.K. are the
dominant markets for foreign equity capital, and their importance has grown over time. In an earlier
study, Pagano et al. (2002) examine the importance of different stock exchanges across the world and
conclude that Britain has gradually lost its attractiveness for foreign companies to cross-list their stocks.
However, our results indicate just the opposite trend.8 The U.K. share of cross-border equity issues
increased from 4.4% in 1991 to 9.6% in 2001. The dominance of U.S. and U.K. here indicates that the
size of the market is by far the most important factor in determining the country where firms raise cross-
border equity.
Among the group of seven most developed countries, Japan and Italy attract the least amount of
foreign equity issuers relative to the size of their domestic issues (0.26% in Japan and 0.29% in Italy).
Italy Euromoney market openness score of 3.9 is the lowest among all G7 countries,9 and the lack of
market openness likely resulted in the low volume of foreign equity issues here. Japan, however, has a
large and open market but yet does not attract many foreign issuers. Perhaps, the geographic distance
8 Our sample includes all firms while Pagano et al.’s sample includes only manufacturing firms. 9 The G-7 countries other than Italy all have a close to perfect score of 5 for market openness.

12
form the countries that need new capital and language barriers are partly responsible for Japan’s marginal
role. Future research that compares institutional and regulatory differences between Japan and other
countries, particularly the U.K., could potentially shed light on the factors other than market size that are
important for attracting issuers from abroad.
The fourth column in the table presents the ratio of the amount of new equity capital that firms
raise in their home countries to the amounts that they raise abroad. This ratio provides a measure of the
extent to which firms in each country rely on foreign capital for funding their investment demands. The
U.S. has the lowest ratio of .63 percent, and both the Central American and Caribbean and the Middle
East countries have the highest ratios of 102.66 percent and 113.68%, respectively. A striking pattern that
we observe here is that this ratio is significantly smaller for the developed countries than for the other
countries. Also, the correlation between this ratio and Euromoney market openness rating is -.68 and with
the country risk rating is -.63. Both these correlation coefficients are reliably less than zero. This
evidence indicates that the countries that close their markets to foreign investors end up starving the
domestic firms of the capital they need, and the firms in these countries are forced to incur the additional
costs of going abroad to raise funds.
The fifth column in this panel presents the ratio of equity capital that firms in each country raise
abroad to the amount of equity capital that foreign firms raise in that country. A ratio greater than one for
any country indicates that more foreign capital in the form of new equity flows into that country than the
amount that the domestic investors invest in new equity abroad. In other words, a ratio greater than one
indicates that the country is a net importer of new equity capital, and a ratio less than one indicates that
the country is a net exporter of new equity capital.
The U.S and Britain are the only countries that are net exporters of new equity capital. For all the
other countries, the ratio is greater than one. The extent to which a country’s market is open is clearly an
important determinant of net import of new equity from that country. The correlation between the new
equity import ratio and Euromoney market openness score is -.65, which is reliably less than zero.

13
Therefore, firms in countries with closed markets gradually increase their foreign ownerships cross-
border equity issues.
Debt Issues. Panel B presents the amount of new debt issued by firms in various countries. Firms raised
$16.2 trillion of debt domestically and $4.2 of debt from abroad. The debt markets are much more
international than equity markets, with about 20.3% of debt being issued overseas compared with only
about 6.1% of equity. In addition, the pattern of foreign issues of debt across countries is substantially
more dispersed than of equity.10
The Eurobond market is far more popular than the U.S. for foreign debt, although the U.S. has the
largest domestic market. The popularity of the European markets for foreign debt issues is also evident
when we consider the amount of foreign debt raised in the U.K. and Germany. For example, the domestic
debt issues in the U.S. is almost six times as that in the U.K., but the foreign debt issues in the U.S. is
only about ten percent more than that in the U.K. However, the U.S. is still a net exporter of debt, and the
import to export ratio for new debt is 86.4%. In comparison, the corresponding ratio for new equity is
only 5%. The U.K. is a large exporter of debt, exporting about 3 times as much debt as it imports.
Germany is the only other net exporter of debt (excluding the “other Europe’’ category, which includes
all Eurobond issues) with an import to export ratio of 94.7%.
The results in Panel B indicate that the markets for public debt are not well developed in many of
the developing countries. Firms in Africa, Eastern Europe, the Middle East, and South America issue
virtually no public debt in their home countries. They do, however, have demands for public debt but
they rely mostly on foreign issues to meet this demand.
Preferred and Convertible Issues. Panels C and D present the comparable statistics on preferred equities
and convertible debt. These markets are much smaller than the market for common equity and
nonconvertible debt, but are more commonly issued internationally. Slightly over 20% of preferred
10 An important issue in studying international debt issues is how one classifies Eurobonds. SDC classifies most Eurobonds as being listed on Luxembourg exchange. However, these bonds are issued all over the continent and, as in the U.S., most of the secondary market trades take place over the counter. We include the Eurobonds in the foreign issue category, although we do not assign the issue to any particular country from which firms raise capital.

14
equity is sold internationally and over 30% of convertible securities are sold overseas. The United States
is the biggest destination for international issues of preferred stock, while the Other Europe region is the
biggest issuer of convertibles.
4. Correlation of new issues across countries
This section examines the correlation of new capital issues across countries. The time series
correlations across countries reflect the extent to which the supply and demand for capital tend to move
together. We also examine whether the preference for the form of new capital (either debt or equity) is
correlated across countries.
Panel A of Table 4 presents the time-series correlations of the quarterly equity share of all new
issues across countries. In this panel, 66 out of the 105 pairwise correlations are positive. The probability
that at least 71 estimates out 105 estimates are positive, under the hypothesis that the correlations equal
zero, is less than 1 percent. Therefore, when firms decide to raise capital, their preference for whether to
raise it in the form of debt or equity is correlated across countries. If managers perceive the costs of debt
and equity as irrelevant or constant over time, then there would be no reason to expect their preferences to
be correlated across countries. Our evidence, therefore, indicates that the relative costs of debt and equity
capital, at least as perceived by the issuers, tend to move together across countries.
Panel B of Table 4 presents the volume of equity issues, normalized by the GDP in the
contemporaneous quarter. Panels C and D report the correlations for new debt issues and for all new
capital issues respectively. In all cases, we find that the correlations are predominantly positive. For
example, we find that 93 out of the 105 pairwise correlations are positive for new equity issues. In all
three panels, binomial tests reject the hypothesis that the correlations are equal to zero. This evidence
confirms our general intuition that investment opportunities, and hence the demand for new capital, tend
to move together across countries.

15
5. Equity Market Timing
The results we present in the previous section indicate that the capital-raising activities of firms
around the world are strongly correlated. A natural explanation for this phenomenon is that the
investment opportunities are correlated across countries. It is also possible that a part of this inter-country
relation is driven by predictable changes in cost of capital. For example, when firms anticipate lower cost
of equity they would tend to accept more projects by issuing equity than otherwise, and the cost of capital
may be correlated across countries.
We examine whether market timing influences new debt and equity issues from two perspectives.
First, we examine the relation between security issues and contemporaneous market conditions such as
the past market returns or interest rates. Second, we examine whether firms are able to issue debt or
equity prior to a downturn in these markets. We examine the timing considerations for both domestic and
international issues of debt and equity. 11
5.1. Domestic Equity Issues.
5.1.1 Equity issues and past returns
We first examine the extent to which firms’ decisions to issue new equity are driven by changes
in investment opportunity sets, both at home and abroad. We use the past one-year domestic-market
return to proxy for changes in the domestic investment opportunities, and the difference between the past
world returns and domestic returns to proxy for changes in the investment opportunity set globally that
are not captured by changes in home country returns.
We estimate two regression specifications to examine the relation between equity issues and
changes in investment opportunity sets. The first specification is:
(1) 12 ,1,,
,titi
ti
ti bRaGDP
Eε++= −
11 There is already a substantial literature on market timing. A number of papers have documented that firms tend to issue equity when it appears to be overvalued; see Baker and Wurgler (2002) and Ritter (2002) for surveys. The literature on debt is much older; see Bosworth (1971), White (1974), Taggart (1977), and Marsh (1982). A recent related paper focusing on timing considerations in debt maturity (as opposed to debt levels) is Baker, Greenwood,

16
where tiE , and tiGDP , are the amount of new equity issued in region i in month t, and the region’s GDP,
respectively, and 1,12 −tiR is the stock market return for region i and over the 12-month period from t-12
to t-1. For any region made up of more than one country, the market return is the market capitalization
weighted average of the domestic stock market returns in the constituent countries. We estimate this
regression individually for each country or region, and we also estimate it globally, allowing for region-
specific fixed effects.
Regression (1) examines whether the total amount of new equity is related to past returns. In the
second specification, we examine whether the share of equity in total new capital is related to past returns.
Specifically, our second regression specification is:
(2) 12 ,1,,,
,titi
titi
ti bRaDE
Eε++=
+ −
where tiD , is the total new debt in region i in month t. We fit these regressions with monthly
observations. Since the quantity of new debt and equity that firms raise tend to be serially correlated, we
use the Hansen and Hodrick (1980) approach to estimate the standard errors used in computing the t-
statistics for the regression coefficients.12
Panel A of Table 5 presents the estimates of these equations. While the estimates vary somewhat
across regions, the coefficients on past domestic returns are mostly positive in each specification. These
coefficients are statistically significant in the pooled specification and using the Fama-Macbeth statistics
using Specification (1) and are marginally significant using Specification (2). These results indicate that
the amount of equity that firms raise increases as the domestic investment opportunities become more
attractive.
5.1.2. Equity issues and future returns
and Wurgler (2003). This part of our analysis extends this prior work to countries besides the U.S., and it focuses on both domestic and international issues. 12 For detail on how we applied the Hansen/Hodrick procedure, see Appendix 4.

17
This subsection examines whether the amount of new equity that firms issue is related to future
stock market returns. To do so, we estimate the following regressions for each country or region
individually, and for all regions pooled:
(3) , ,, e
GDPE
baFR i,ti,t
titi +
+=
where tiFR , is the future 12-month market return in region i from month t to t+12.
We also examine whether the share of equity issues in total new capital is related to future returns
using the following regression:
) ( e DE
EbaFR i,t
i,ti,t
i,ti,t 4.+
++=
We estimate both Regressions (3) and (4) with monthly observations. Because we use overlapping 12-
month returns as the dependent variable, we again use the Hansen and Hodrick standard errors to compute
the t-statistics.
Panel B of Table 5 presents the estimates of Regressions (3) and (4) for each region, and for the
pooled regression with country fixed effects. In addition, the table also presents the estimates of a
‘global’ regression. In the global regression, we aggregate all issues across the world to compute the
independent variables, and use the value-weighted world market return as the dependent variable.
The coefficients on total equity issues in Regression (3) are negative in 10 out of 13 regions.
Additionally, the slope coefficient is significantly less than zero in the pooled regression. These results
indicate that, across the world, firms tend to issue more equity when they expect future returns to be
lower. We find that the slope coefficient is significantly negative in the global regression as well.
Therefore, as with domestic market returns, the world market return also tends to be low following
periods of high new equity issues.
The slope coefficients in Regression (4) are also negative in 11 out of 13 regions. The slope
coefficient in the global regression, however, is only marginally significant. Overall, the results indicate
that across all countries, the share of new equity capital rises when firms expect market returns to be

18
lower, although this evidence is weaker than the relation between aggregate equity issues and future stock
returns.
To assess the economic significance of the timing of equity issues, we examine the market
performance following periods of high and low equity issues. We classify the months with equity issues
below and above the sample median as low and high issue periods, respectively. Figure 2 plots the
average returns in the 12-month period after low and high equity issues. In every region except ‘Other
Asia’, the returns are higher in the period after low equity issue months than after high equity issue
months.
As we discussed earlier, equity issues may predict future market returns either because firms tend
to issue more equity when the market is overvalued, or because firms issue more equity when the market
rationally demands lower return on equity. Baker and Wurgler investigate the relative merits of these
explanations for the U.S. evidence, and they conclude that their results support the market overvaluation
explanation. 13 The difference between the future returns following high and low issues in the U.S. during
our sample period is similar in magnitude to that in Baker and Wurgler. The average return differences
for the other countries are also of a similar magnitude. Therefore, our findings would likely provide
support for the overvaluation hypothesis internationally, but we leave any direct tests to differentiate
between these hypotheses for future research.
Overall, our results indicate that the relation between equity issues and future returns is a global
phenomenon. In addition to predicting returns within individual countries and regions, we find that world
equity issues predict world market returns. For example, the world market returns following high and
low issue periods are 2.2% and 13.4% respectively. Of course, it is likely that many of the managers of
the issuing firms do not have special skills individually to predict world market returns. Most likely,
managers only factor in their assessment of the extent to which their respective firms are overvalued in
their equity issue decision. However, when a large number of firms decide to issue equity at any point in

19
time, then their collective decision indicates that the overvaluation is not entirely firm specific.
Therefore, large equity issues signal aggregate market overvaluation, and predict low future returns, even
though each individual manager is focused only on his or her specific firm.
5.2. Cross-border Equity Offerings.
So far, our results indicate that firms attempt to time their domestic markets when they issue
equity. With increased globalization, firms also have the choice of timing the markets globally. For
example, firms that issue equity in initial public offerings (IPOs) would likely get higher prices in a
foreign market if the market abroad is overvalued relative to their domestic markets. Of course, if a firm
issuing seasoned equity were to raise new capital, the issue price abroad would be linked to the domestic
stock price because of arbitrage between the two markets. However, if the cost of equity capital were
lower in a foreign country, either because that foreign market is overvalued or because investors in that
country rationally require lower returns on equity, firms would likely find it easier to sell their stocks
abroad since they would be more attractively priced relative to the stocks in that country.14
In this section we examine whether firms time the foreign markets when they issue new equity.
Since we find that most of the cross-border equity issues occur in the U.S. and the U.K., we examine the
extent to which foreign equity issues in these countries predict their future stock market returns. To do
so, we fit the following regressions:
(6) ,)1212(
(5) and ,12
,1
1,,
,1
1,
tit
it
itwti
tit
it
i
ti
eGDPFEb a FRFR
eGDPFEb a FR
++=−
++=
−
−
−
−
13 Ritter (1991), Spiess and Affleck-Graves (1995), Loughran and Ritter (1995) examine stock issues by individual firms and find that firms issue new equity when their stocks are overvalued. Baker and Wurgler (2000) complement these studies and examines the relation between aggregate stock issues and future market returns. 14 Of course, investors could directly invest abroad if they find that the foreign stock market offers higher returns. In practice, however, investors exhibit a home bias in investments and do not seek out investments abroad. Edison and Warnock (2003) find evidence suggesting that firms get over investors home bias when they list in the investors’ home market.

20
where, itFE is the total foreign equity issue in country i (either the U.S. or the U.K.) in month t, and
tiFR ,12 and twFR ,12 are the stock market return in country i, and the world market return over the 12-
month return from month t through t+11, respectively. We fit these regressions separately for the U.S.
and the U.K. Within each market, we fit the regressions with FE equal to all new foreign equity, and also
with FE equal to aggregate IPOs from abroad. As before, we estimate these regressions using monthly
data on issues, and we use the Hansen and Hodrick standard errors to compute the t-statistics.
Table 6 presents estimates of these regressions. The slope coefficients are significantly negative
in all regressions, both in the U.S. and the U.K. They are also negative regardless of whether all equity
issues, or only IPOs are used as the independent variable. We include ADR issues when we consider all
equity issues and the price of these issues is determined by the underlying stock prices at home and does
not reflect the valuation of the foreign markets. At least for these issues, the issuers choose to issue
abroad rather than at home perhaps because the foreign market is more active, or “hot,” for new issues,
than the domestic markets.
Figure 3 evaluates the economic significance of the relation between aggregate foreign equity
issues in the U.S. and U.K. and future returns. As before, we classify months with below and above
median equity issues in each country as low and high issue months. Figure 3 plots the average 12-month
market returns, and market returns in excess of the world market returns, after the low and high issue
periods. In all cases, the returns are higher following low issue periods than high issue periods. This
figure emphasizes the interpretation that foreign companies issue equities internationally in relatively
‘hot’ markets.
6. Debt Market Timing.
6.1. Domestic Debt Issuance.
Early papers by White (1974) and Taggart (1977) examine new debt and equity issues by
individual firms, and find that firms are more likely to issue debt than equity when interest rates are low.

21
More recently, in Graham and Harvey’s (2001) recent survey, CFOs claim that they actively attempt to
issue debt at times of low interest rates. This subsection empirically tests this claim and examines
whether, at an aggregate level, firms do issue more debt when interest rates are low. Unlike White and
Taggart, we examine the relation between debt and interest rate at an aggregate level rather than at the
level of individual firms. In addition, we examine whether firms’ propensity to issue debt in a low
interest rate environment allows them to time the market and raise more debt prior to increases in interest
rates.
We use the fixed-rate paid in an interest rate swap contract as our measure of corporate interest
rates. 15 Since we are able to obtain swap rate data only for the G7 countries, we restrict our analysis of
the effect of interest rates on debt issues to these countries.
We fit the following regressions to examine the relation between debt issues and interest rates:
(8) ,
(7) and ,
,,
,
,,
,
i,trealti
ti
ti
i,tnomnalti
ti
ti
e b SR a GDP
D
e b SR a GDP
D
++=
++=
where nomnaltiSR , is the domestic swap rate in country i at the end of month t, and real
tiSR , is the real rate.
We compute the real rate from the nominal swap rate as:
,1),11(1
1 ,, −
−+
+=
ttInfSR
SRnomnaltireal
ti
where, Inf(t-11,t) is the ex-post inflation over the 12-month period ending in month t. Ideally, we would
like to use expected inflation data to determine the real rate. However, since we do not have expectations
data, we use the realized level of inflation as a proxy for expected ex ante inflation. Therefore, our real
rate estimates contain measurement errors and the results of Regression (8) should be interpreted with this
in mind.
15 The swap rate equals the yield on a par bond issued by firms with the highest credit rating. Firms with lower credit rating, therefore, will not be able to borrow at the swap rate. For our purposes, however, the swap rate is more

22
We fit these regressions within each G7 country individually, and in a pooled regression across
all countries containing country fixed-effects. Panel A of Table 7 presents the regression estimates, with
the ten-year swap rate as the independent variable. We find a negative relation between the level of
interest rates and the amount of debt issues in all countries, and in most cases this relation is statistically
significant. The slope coefficients are negative when we use either the nominal or the real rates as the
independent variable. The slope coefficients are generally larger in magnitude for the regressions with
nominal rates than with real rates. This finding suggests that managers may focus more on nominal
yields than on real yields when they make decisions about debt issues. It is also possible that the slope
coefficients are biased downward from errors-in-variables because we use the realized inflation as a proxy
for expected inflation.
To check the robustness of our results, we also estimated Regressions (7) and (8) separately for
short-term debt (original maturity of one to five years), and long-term debt (original maturity greater than
five years). We used the two-year swap rate short-term debt regressions and the ten-year swap rate in the
long-term debt regressions. In unreported results, we found that in all these regressions the coefficients
on interest rates are negative and generally significantly different from zero. Both long-term and short-
term debt issues appear to be negatively related to their respective interest rates. Therefore, firms time
their debt issues for both long-term and short-term bonds.
One limitation of these results is that they are from a relatively short time series. While the data
we use are the longest time series available for a number of different countries, for the U.S., it is possible
to obtain a longer time series. The debt issues exhibit a secular increase during this period, going from an
average of 1.81 percent of the U.S. GDP in the 50s to an average of 7.20 percent of the U.S. GDP in the
nineties. To account for this secular increase, we include decade-specific dummy variables and
reestimate Regression (7). The equation below presents the estimated coefficients:
appropriate than the rates paid by individual firms since it reflects the overall level of interest rates in particular countries, and it includes a credit spread above government bonds.

23
(-5.060) (11.626) (7.384) (6.722) (7.010) (7.351)
,SR0.006 123.0115.0076.0051.00.041 GDP
D Nominal,1990s1980s1970s1960s1950s
ti,
ti,tiIIIII ⋅−⋅+⋅+⋅+⋅+⋅= (9)
where the dummy variable 1950I equals one in the 1950s and zero otherwise, 1960I equals one in the
1960s and zero otherwise, and so on. The estimated coefficients on the dummy variables increase over
time because of the secular increase in debt issues. We also find that the slope coefficient on the interest
rate is negative and significantly different from zero. This finding is once again consistent with the view
that managers issue more debt during periods of low interest rates even over the longer sample period in
the U.S.
Firms could conceivably issue more debt when interest rates are low for two reasons, which are
not mutually exclusive. First, firms are likely to have more positive net present value projects when
interest rates are lower, leading to an increased demand for new capital to finance these projects. Second,
firms may substitute debt for equity when the rates are low. To examine whether firms indeed substitute
debt for equity, we estimate the following regressions:
(11) .
(10)
,,,
,
min,
,,
,
i,trealti
titi
ti
i,talno
tititi
ti
e b SR a ED
D
e b SR a ED
D
++=+
++=+
Panel B of Table 7 presents the regression estimates. The coefficients on interest rates are
generally negative, and they are significant for some countries. However, in the pooled specification, the
coefficient is only marginally significant using the nominal interest rate as the explanatory variable, and
not significant using the real rate. These results suggest that debt issues increase when interest rates are
low mainly because firms have a larger capital demands, and the substitution of debt for equity is of
secondary importance.
Instrumental Variables Estimation: Another econometric approach to differentiate between the ‘demand
for capital’ and ‘supply of capital’ explanations for the relation between debt issues and interest rates is to
use instrumental variables to isolate the effect of the exogenous component of interest rates on the
24
issuance of debt securities. Intuitively, the interest rate is affected by the demand for capital, while at the
same time, the quantity of capital demanded is affected by its cost. The two effects combine to determine
both the interest rate and the quantity of debt issued. The instrumental variables approach allows us to
isolate the demand effect, and measure how much the demand for capital is affected by exogenous
changes in interest rates.
Using the instrumental variables approach requires instruments that are related to a particular
country’s interest rates, but are unrelated to the residual from the ‘demand for capital’ equation. Such a
variable is the contemporaneous interest rate in the rest of the world, which generally moves with a
country’s interest rate, but is unlikely to be affected by a shock to demand in one country, especially a
relatively small one. Therefore, we use the contemporaneous swap rate averaged across all the other G7
countries but the one in question as the instrument for a particular country’s swap rate. When we estimate
the equation (7) using this approach, the results are very similar to those reported in Panel A of Table 7.
In particular, the coefficients on swap rates remain negative and statistically significantly different from
zero at all conventional levels using short-term debt, long-term debt, or total debt as the dependent
variable in the pooled equations, and in the majority of individual country equations. These findings
suggest that the endogeneity of interest rates are not the driving force behind the relation between debt
issuances and interest rates.
Future interest rates and debt issues:
Why do firms issue more debt when interest rates are low? Perhaps, managers perceive the cost
of debt capital to be low when they see low interest rates, and hence take on new debt-financed projects
that would not have been undertaken in a high interest rate environment. Alternatively, managers may
view periods of low interest rates as opportune times for issuing new debt, and therefore issue debt to
acquire capital prior to increases in interest rates. If managers are able to time debt issuances
successfully, then at the aggregate level the quantity of new debt issued would predict future changes in
interest rates. To examine whether firms are indeed able to successfully time their debt issues prior to
interest rate increases, we estimate the following regressions:

25
t,i,,,
, e ++
+=∆titi
tii,t ED
DbaSR (12)
t,i,,
, e ++=∆ti
tii,t GDP
DbaSR (13)
where i,tSR∆ is the change in the 10-year swap rate over the 12-month period from month t to t+11. We
fit the separate regressions for each of the G7 countries and we also estimate a pooled regression allowing
for country fixed-effects.
We present estimates of this equation in Table 8. Using specification (12), the estimated
coefficient on b is positive and significantly different from zero for three of the G7 countries (Japan, the
U.K., and the U.S.). For the other four countries, the slope coefficients are close to zero and insignificant.
In the pooled specification, the estimate of b is .196, with a marginally significant t-statistic of 1.6. When
we estimate specification (13) the effect is still weaker. The estimates of b are generally positive,
although the coefficient in the pooled equation is not significantly different from zero.
As a further check, we also examined the relation between debt issues and future changes in
corporate bond rates in the U.S. over the 1950 to 1999 period using the data we described earlier. Here
again, we did not find any statistical relation between debt issues and future changes in interest rates, once
we control for the secular increase in debt issues over time. These results are consistent with the results in
Table 8 and indicate that debt issues do not reliably predict future changes in interest rates.
Our findings raise an interesting question. Why are aggregate debt issues not able to predict
changes in interest rates while aggregate equity issues predict futures stock market returns? It is hard to
find a definitive answer, although one possible explanation is the following: Firms base their debt issue
decision on the level of interest rates, which is the same for all firms with similar levels of credit ratings.
The firms’ borrowing rates are public information, and the firms have no unique information to assess the
likely direction of future changes in interest rates. However, firms do have superior information about
their own future cash flows. When their information indicates that the firm is overvalued, insiders would

26
issue equity rather than debt since the value of equity is much more sensitive to such inside information
than debt. Therefore, insiders’ assessments of their respective firm values that lead to equity issue
decisions are collectively more useful for predicting equity returns than for predicting bond returns.
6.2. International Debt Issues.
As we document earlier, firms raise large amounts of debt from outside their own country. In
Graham and Harvey’s (2001) survey, CFOs claim that they are more likely to issue debt abroad when
foreign interest rates are lower than domestic interest rates. In this subsection, we empirically examine
the extent to which foreign debt issues are related to the interest rates abroad in practice.
If the markets were perfectly integrated and efficient, promised interest rates could differ across
countries but the expected, currency-adjusted rates would be the same in each country, and the principle
of uncovered interest parity would hold. In this scenario, shareholders would be indifferent about where
their firms issued debt. However, extensive empirical evidence in the literature indicates that the
uncovered interest rate parity does not hold in practice (see Froot and Thaler (1990) for a review of this
literature). In fact, this literature finds that not only does uncovered interest rate parity fail to hold, but
exchange rates tend to move so as to exacerbate nominal interest rate differences. In other words, this
literature finds that the currency from the country with a lower rate depreciates on average, making
borrowing in that country even more attractive. Thus, the strategy of issuing bonds internationally in
countries with lower interest rates is likely to add value to the shareholders by lowering borrowing costs.
Another possibility is that firms could use swaps or other derivatives to hedge exchange rate risk,
and that these instruments implicitly adjust for differences in interest rates across countries. We cannot
observe these transactions, so we cannot measure their impact directly. The use of derivative instruments
to offset differences in interest rates across countries would mitigate any advantages of issuing debt in
different countries because of interest rate differences. However, managers themselves overwhelmingly
cite interest rate differences as an important reason for choosing a location for issuing debt. Whether or
not they in fact do so despite the fact that some derivative contracts could offset this advantage therefore
like a good subject for empirical inquiry.

27
As we report earlier, aside from the Eurobond market, firms typically issue foreign debt either in
the U.S. or in the U.K. Therefore, we examine the relation between cross-border bond issues in the U.S.
and the U.K. by firms in the G7 countries, and the domestic interest rates in these countries. To do so, we
estimate the following equations:
[ ] ,,,
i,tjti
jt
jt
ti
ji,t e-SRSR c SR b a
GDPFD
+⋅+⋅+= (14)
where, ji,tFD is the debt issue in country j (the U.S. or the U.K.) by firms in country i in month t, and
tiSR , and jtSR are the swap rates in countries i and j, respectively.
Table 9 presents the regression estimates. The coefficients on the U.S. swap rate and on the
difference between the U.S. rate and the home rate in Panel B are both negative and significantly different
from zero, using both nominal and real interest rates in the pooled specification. This finding holds for
both short-term and long-term debt, as well as for total debt. Therefore, firms are more likely to issue
debt in the U.S. when the U.S. rate is low at an absolute level, and also when it is low relative to the home
country interest rate.
The results for the U.K. also follow the same general pattern, although the results are not as
consistent across specifications as for the U.S. The U.K. swap rate is negative and significant in all
specifications, but the difference between the home country rate and the U.K. rate is negative and
significant in the nominal rate specification but not in the real rate specification. Overall, however, the
findings from these two panels are consistent with the survey evidence suggesting that one reason why
firms issue debt overseas is to take advantage of the lower interest rates abroad.

28
7. Conclusions
When firms decide to raise capital from public markets, they have discretion over the type of
securities they can issue, as well as the location of the source of capital, and the timing of the capital-
raising activity. We examine the extent to which firms from countries around the world rely on different
sources of capital, the locations of various sources of capital, and the factors that affect these choices
during the 1990-2001 period.
Globally, firms raised about $25.9 trillion of new capital during the period from 1990 to 2001.
International security issuances are fairly common, and they account for about $4.6 trillion of new capital.
International debt issues are much more common than equity issues, accounting for over 90% of the
international security issues, and about 20% of all public debt issues. In contrast, cross-border equity
issues account for only about 4.4% of all cross-border security issues, and about 6% of all equity issues
during the our sample period.
Firms are drawn to the most liquid and well-regulated markets when they issue new securities.
The U.S. and the U.K. are by far the most common locations for cross-border equity issues, and are the
only ‘net exporters’ of new equity capital. These two countries also attract significant cross-border debt
issues, but they are not as dominant for cross-border debt as they are for cross-border equity.
Timing considerations appear to be particularly important in security issuance decisions. Firms
all around the world are more likely to issue equity preceding low market returns and more likely to issue
debt preceding high market returns. Foreign equity issues tend to occur in ‘hot’ markets, and the market
returns are low following periods of high equity issues from abroad. Finally, firms issue more debt when
interest rates are lower, and issue debt overseas when interest rates in the country of issue are lower than
they are at home.
An important caveat when interpreting these results is that they are obtained over a fairly short
time period, and one that was unusual for capital markets. However, this is the only period for which
security issue data are available for most of the countries outside the U.S. Therefore, as a robustness
check, we supplement our timing tests over a longer sample period with the U.S. data. The timing results

29
that we find with the U.S. data for the longer sample period are consistent with those we find across the
global markets over the shorter sample period from 1990 to 2001. Although the timing results withstand
the robustness check with the U.S. data, the extent to which these findings hold internationally over other
periods, and are likely to hold in the future, is an open question.
Firms have a much wider set of choices when they issue securities than typically is emphasized in
corporate finance textbooks. In addition to the choice of the type of securities they use, firms can decide
where and when they should issue the securities. As markets continue to become more globally
integrated, these choices will become increasingly important for firms. Thus, the importance of studying
these issues is likely to grow. This paper provides a first look at the way in which firms across the world
raise new capital and at the factors that influence firms’ choices of when and where to issue securities.
We expect that subsequent analysis of these issues will build on this work, and provide additional insights
into how firms raise capital in a globally-integrated environment.

30
References
Alexander, G., Eun, C., Janakiramanan, S., 1988. International Listings and Stock Returns: Some International Evidence. Journal of Financial and Quantitative Analysis 23, 35-151. Baker, M. and J. Wurgler, 2000, The Equity Share in New Issues and Aggregate Stock Returns, Journal of Finance, 55, 2219-2257. Baker, M. and J. Wurgler, 2002, Market Timing and Capital Structure, Journal of Finance, 57, 1-32. Baker, M., R. Greenwood, and J. Wurgler, 2003, The Maturity of Debt Issues and Predictable Variation in Bond Returns, Journal of Financial Economics, forthcoming. Bancel, Franck and Usha Mittoo, 2001, “European Managerial Perceptions of the Net Benefit of Foreign Stock Listings,” European Financial Management 2(7), 213-236. Bosworth, Barry, 1971, Patterns of external corporate financing, Brookings Papers on Economic Activity, 2, 253-279. Coffee, J., 1999, The future as history: the prospects for global convergence in corporate governance and its implications, Northwestern Law Review, 93, 641-708. Doidge, C., Karolyi, G.A., Stulz, R.M., 2003, Why are foreign firms listed in the U.S. worth more? forthcoming, Journal of Financial Economics. Edison, Hali and Francis Warnock, 2003, U.S. Investors’ Emerging Market Equity Portfolios: A Security-Level Analysis, forthcoming, Review of Economics and Statistics. Froot, Kenneth A., and Richard H. Thaler, 1990, Anomolies: Foreign Exchange, Journal of Economic Perspectives, 4, Number 3, 179-192. Graham, John R. and Campbell R. Harvey, 2001, The theory and practice of corporate finance: Evidence from the field, Journal of Financial Economics, 187-244. Hansen, Lars Peter, and Robert J. Hodrick, 1980, Forward Exchange Rates as Optimal Predictors of Future Spot Rates: An Econometric Analysis. The Journal of Political Economy, Vol. 88, No, 5, 829-853. Johnson, S., P. Boone, A. Breach and E. Friedman, 2000, Corporate Governance in the Asian Crisis, 1997-98, Journal of Financial Economics, 58, 141-186. Engel, E., M. Erickson, and E. Maydew, 1999, Debt-Equity Hybrid Securities, Journal of Accounting Research, 37, No.2, pp. 249-274. Karolyi, G. A., 1998. Why Do Companies List Their Shares Abroad? (A Survey of the Evidence and its Managerial Implications) Volume 7, Number 1. Salomon Brothers Monograph Series, New York University, January 1998. La Follette, C., Kester, C., and E. Ostale, 1992, Compania de Telefonos de Chile, Harvard Business School Case 9-293-015, Harvard Business School Press, Boston.

31
Lee, Charles, Andrei Shleifer, and Richard Thaler, 1991, Investor Sentiment and the Closed-End Fund Puzzle, Journal of Finance, 46. Loughran, T. and J. Ritter, 1995, The New Issues Puzzle, Journal of Finance, 50, 25-51. Marsh, Paul, 1982, The choice between equity and debt: An empirical study, Journal of Finance, 37, 121-144. Modigliani, F. and M. Miller, 1958, The Cost of Capital, Corporation Finance, and the Theory of Investment, American Economic Review, 48, 655-669. Pagano, M., A. Roell, and J. Zechner, 2002, The Geography of Equity Listing: Why do Companies list abroad? Journal of Finance, 57, 2651-2694. Rajan, R. and L. Zingales, 1995, What do we know about Capital Structure? Some Evidence from International Data, Journal of Finance, 50, 1421-1460. Reese, W., and M. Weisbach, 2002, Protection of Minority Shareholder Interests, Cross-Listings in the United States, and Subsequent Equity Offerings, Journal of Financial Economics, 66, 65-104. Ritter, J., 1991, The Long-Run Performance of Initial Public Offerings, Journal of Finance, 46, 3-27. Ritter, J. 2002, Investment Banking and Security Issuance, in G. Constantinides, M. Harris, and R. Stulz, eds., Handbook of the Economics of Finance, (North-Holland) forthcoming. Sarkissian, S. and M. Schill, 2003, The Overseas Listing Decision: New Evidence of Proximity Preference, Review of Financial Studies, forthcoming. Spiess, J. and K. Affleck-Graves, 1995, The Long-Run Performance following Seasoned Equity Issues, Journal of Financial Economics, 38, 243-267. Shaviro, D., 2001, Does more sophisticated mean better? A Critique of alternative approaches to sourcing the interest expense of American Multinationals, 54 Tax L. Rev. 353 (2001). Stulz, R., 1999. Globalization of Equity Markets and the Cost of Capital. Journal of Applied Corporate Finance 12, 8-25. Taggart, Robert A., 1977, A model of corporate financing decisions, Journal of Finance 32, 1467-1484. White, William L., 1974, Debt management and the form of business financing, Journal of Finance, 29, 565-577.

Figure 1: The Fractions of Foreign Issues to Total Issues of Each Security Type The following plot reports the fraction of total equity, non-convertible debt, preferred stock, and convertible securities whichwere issued in foreign markets for each sample year. For example, the Foreign Equity plot reports the percentage of totalequity issues in each year that were issued by companies across borders.
The Fractions of Foreign Issues to Total Issues of Each Security Type
0
0.05
0.1
0.15
0.2
0.25
0.3
0.35
0.4
1990 1991 1992 1993 1994 1995 1996 1997 1998 1999 2000 2001
Year
Frac
tion
Issu
ed A
broa
d
Foreign Equity
Foreign Debt
Foreign PFDs
Foreign Convertibles

Figure 2: Average Annual Equity Returns Following Above/Below Median Equity Shares of New Issues The following plots present the average value-weighted future annual returns for each of the G7 countries and the geographicregions following quarters of above and below median equity issues. For each country, we only consider domestic equity issues.Following quarters when domestic equity issues are above the sample median for that county/region, we average the future one-year domestic equity returns. The same is done for returns following quarters of below-median equity issues. We define the levelof equity issues in each domestic country/region as the equity share of new debt and equity issues E/(E+D). Average Annual Returns Following Above/Below Median Shares of Equity
-10.0%
-5.0%
0.0%
5.0%
10.0%
15.0%
20.0%
25.0%
30.0%
Cana
da
Fran
ce
Germ
any
Italy
Japa
nUn
ited K
ingd
omUn
ited S
tates
Austr
alia
Cent
ral A
m +
Carri
bean
Easte
rn E
urop
e
Othe
r Asia
Othe
r Eur
ope
South
Ame
rica
Wor
ld
Country/Region
Ave
rage
Ann
ual N
ext Y
ear
Ret
urn
ReturnsfollowingHighE/(E+D)ReturnsfollowingLow E/(E+D)

Figure 3: Foreign Timing of US and UK Equity Markets The following plots present aggregate one-year equity market returns following quarters when foreign equity issues in the US and UKmarkets are above and below their median level. We define the level of foreign equity issues in the US market as the dollar value ofequity proceeds raised in the US by foreign firms divided by the US GDP. We compute this for all foreign equity offerings and for allforeign IPO offerings. Quarters where issues are above the median for our sample are considered to be high issue months. For thequarters when foreign equity issues are above median, we calculate the average value-weighted annual return for the following 12months. The same is done for below median equity issues. In addition to calculating the average US and UK returns followingquarters in which foreign equity issues in their domestic markets were above and below average, we calculate the excess returnsexperience by the US and UK domestic markets in excess of value-weighted world returns.
Average Market Returns Following Above & Below Median Foreign Equity Issues in US and UK Markets
0.0% 2.0% 4.0% 6.0% 8.0% 10.0% 12.0% 14.0% 16.0% 18.0%
UK - World Returns (Foreign IPOs)
UK - World Returns (All Foreign Equity)
UK Returns (Foreign IPOs)
UK Returns (All Foreign Equity)
US - World Returns (Foreign IPOs)
US - World Returns (All Foreign Equity)
US Returns (Foreign IPOs)
US Returns (All Foreign Equity)
Average Next Year Return
ReturnsFollowing LowEquity IssuePeriods
ReturnsFollowing HighEquity IssuePeriods

Our sample of new capital issues is drawn from the SDC database for the years 1990-2001. The following table presents the sample descriptivestatistics. Observations are classified into the G7 countries or the geographical region of the issuing country. The market capitalization and GDPnumbers are from the World Bank data and are in current US dollars. The reported Euromoney market openness rating is the reported category“access to capital markets” from the March 1997 edition of Euromoney’s annual report. Each year, Euromoney reports overall country riskscores for 180 countries. One component of the annual report is a score for “access to capital markets.” This score is on the interval [0,5] wherea score of 5 indicates that a country imposes no restrictions to any investors investing capital in that country. The Euromoney measurespresented in the table below are the weighted average score of the Euromoney measures for each country of each geographical region using eachcountry’s GDP as its weight in the region.
Table 1 Sample Characteristics
Country/Region Number Observations 1997
Canada 21,556 Market Capitalization (in millions US$) 567,635 GDP (in millions US$) 627,595 Euromoney Ratings: (Overall Risk, Market Openness Rating) 94.400 4.900 France 6,672 Market Capitalization (in millions US$) 674,368 GDP (in millions US$) 1,406,120 Euromoney Ratings: (Overall Risk, Market Openness Rating) 92.400 5.000 Germany 12,480 Market Capitalization (in millions US$) 825,233 GDP (in millions US$) 2,110,965 Euromoney Ratings: (Overall Risk, Market Openness Rating) 94.650 5.000 Italy 3,008 Market Capitalization (in millions US$) 344,665 GDP (in millions US$) 1,166,795 Euromoney Ratings: (Overall Risk, Market Openness Rating) 85.390 3.900 Japan 16,371 Market Capitalization (in millions US$) 2,216,699 GDP (in millions US$) 4,313,229 Euromoney Ratings: (Overall Risk, Market Openness Rating) 93.040 5.000 United Kingdom 6,793 Market Capitalization (in millions US$) 1,996,225 GDP (in millions US$) 1,327,798 Euromoney Ratings: (Overall Risk, Market Openness Rating) 95.730 5.000 United States 38,314 Market Capitalization (in millions US$) 11,308,779 GDP (in millions US$) 8,256,500 Euromoney Ratings: (Overall Risk, Market Openness Rating) 97.090 5.000 Africa 478 Market Capitalization (in millions US$) 255,959 GDP (in millions US$) 355,195 Euromoney Ratings: (Overall Risk, Market Openness Rating) 52.465 2.460
9,431 Market Capitalization (in millions US$) 326,296 Australia, New Zealand GDP (in millions US$) 482,409 Euromoney Ratings: (Overall Risk, Market Openness Rating) 91.680 4.986
11,259 Market Capitalization (in millions US$) 161,600 Central America & Caribbean GDP (in millions US$) 524,058 Euromoney Ratings: (Overall Risk, Market Openness Rating) 55.869 2.830 Eastern Europe 1,123 Market Capitalization (in millions US$) 241,591 GDP (in millions US$) 1,025,218 Euromoney Ratings: (Overall Risk, Market Openness Rating) 50.484 2.988 Middle East 773 Market Capitalization (in millions US$) 121,123 GDP (in millions US$) 325,307 Euromoney Ratings: (Overall Risk, Market Openness Rating) 63.553 2.966 Other Asia 31,285 Market Capitalization (in millions US$) 1,077,652 GDP (in millions US$) 2,678,451 Euromoney Ratings: (Overall Risk, Market Openness Rating) 74.187 3.728 Other Europe 27,736 Market Capitalization (in millions US$) 2,172,168 GDP (in millions US$) 2,666,545 Euromoney Ratings: (Overall Risk, Market Openness Rating) 89.638 4.747 South America 8,096 Market Capitalization (in millions US$) 441,140 GDP (in millions US$) 1,479,853 Euromoney Ratings: (Overall Risk, Market Openness Rating) 59.285 3.315

Table 2 Aggregated Proceeds From New Capital Issues
The following table reports the annual proceeds of capital raising activities in our sample. The new issues data are taken from Security Data Corporation’s (SDC) New IssuesDatabases. Each observation of a capital raising activity in our dataset is identified as either equity, non-convertible debt, non-convertible preferred, or convertible instrument.Securities are classified as either “Domestic,” indicating that the securities are sold in the domestic market of the issuing firm, or as “International,” indicating that the proceeds areraised in a marketplace outside the issuer’s home country. Debt securities are broken into three categories based on their original term-to-maturity: Less than one year, One to fiveyears, or Greater than five years. A few debt issues in our sample do not have a stated maturity date in the SDC database and are included in the total amount of debt issued butnot in the categories which specify the original term-to-maturity.
Year 1990 1991 1992 1993 1994 1995 1996 1997 1998 1999 2000 2001 Total
Domestic 47,719.9 124,766.4 134,169.3 260,087.9 261,305.0 214,644.4 280,174.7 336,909.3 323,247.4 442,827.3 491,524.4 283,309.9 3,200,685.9
International 4,357.1 6,124.3 5,465.2 12,413.4 11,765.4 14,304.0 20,022.5 20,000.0 15,823.5 29,730.9 36,172.2 31,246.1 207,424.6 Equity
Total 52,077.0 130,890.7 139,634.5 272,501.3 273,070.4 228,948.4 300,197.2 356,909.3 339,070.9 472,558.2 527,696.6 314,556.0 3,408,110.5
Domestic 833.9 2,382.9 4,578.7 1,620.8 14,787.9 3,615.3 13,050.9 5,229.5 7,026.0 194,976.2 223,531.9 184,403.1 656,037.1
International 192.3 270.0 0.0 25.4 40.1 244.2 740.5 295.6 370.0 5,149.5 9,048.0 10,625.9 27,001.5 Non-Convertible Debt (Original Maturity <
1year) Total 1,026.2 2,652.9 4,578.7 1,646.2 14,828.0 3,859.5 13,791.4 5,525.1 7,396.0 200,125.7 232,579.9 195,029.0 683,038.6
Domestic 83,297.1 135,705.2 142,756.4 239,182.8 333,907.6 392,681.3 489,464.1 653,572.8 901,935.2 1,398,288.0 927,807.4 1,189,874.7 6,888,472.6
International 47,402.1 53,588.3 43,939.1 61,379.7 95,009.2 77,976.3 116,698.0 118,069.7 107,093.5 257,587.6 224,330.3 222,030.6 1,425,104.4 Non-Convertible Debt (Original Maturity 1-
5years) Total 130,699.2 189,293.5 186,695.5 300,562.5 428,916.8 470,657.6 606,162.1 771,642.5 1,009,028.7 1,655,875.6 1,152,137.7 1,411,905.3 8,313,577.0
Domestic 157,651.8 412,633.2 499,366.5 718,106.0 585,979.4 692,811.8 883,424.0 914,323.2 1,317,569.8 792,784.2 891,263.4 1,195,219.1 9,061,132.4
International 96,880.2 145,431.5 178,191.2 271,901.3 191,595.7 155,154.3 241,594.3 262,376.0 305,063.6 248,768.0 314,203.5 349,987.4 2,761,147.0 Non-Convertible Debt (Original Maturity >
5years) Total 254,532.0 558,064.7 677,557.7 990,007.3 777,575.1 847,966.1 1,125,018.3 1,176,699.2 1,622,633.4 1,041,552.2 1,205,466.9 1,545,206.5 11,822,279.4
Domestic 241,782.8 550,520.4 646,701.6 958,704.6 934,580.9 1,088,878.3 1,385,739.9 1,573,125.5 2,226,337.0 2,386,039.8 2,042,190.3 2,565,424.3 16,600,025.4
International 144,474.6 199,289.8 222,130.3 333,306.4 286,645.0 233,374.8 359,032.8 380,695.7 412,520.2 511,495.1 547,535.0 581,788.2 4,212,287.9 All Non-Convertible Debt
Total 386,257.4 749,810.2 868,831.9 1,292,011.0 1,221,225.9 1,322,253.1 1,744,772.7 1,953,821.2 2,638,857.2 2,897,534.9 2,589,725.3 3,147,212.5 20,812,313.3
Domestic 7,932.4 20,466.5 28,291.1 26,149.2 15,650.3 11,963.6 23,420.6 35,982.2 31,563.5 27,005.9 21,486.3 36,624.2 286,535.8
International 1,868.1 1,280.3 1,637.0 4,710.2 2,036.9 2,019.7 2,522.7 5,341.9 8,453.1 6,414.8 10,976.1 6,715.2 53,976.0 Preferred Stock
Total 9,800.5 21,746.8 29,928.1 30,859.4 17,687.2 13,983.3 25,943.3 41,324.1 40,016.6 33,420.7 32,462.4 43,339.4 340,511.8
Domestic 30,236.3 22,364.7 19,112.0 43,498.7 53,030.4 27,765.6 67,137.7 40,162.9 39,976.4 51,260.9 37,878.3 72,363.7 504,787.6
International 1,576.2 3,874.7 2,533.7 10,531.7 11,910.8 10,301.5 20,822.7 15,595.5 13,918.6 15,487.9 19,441.5 31,616.9 157,611.7 Convertibles
Total 31,812.5 26,239.4 21,645.7 54,030.4 64,941.2 38,067.1 87,960.4 55,758.4 53,895.0 66,748.8 57,319.8 103,980.6 662,399.3
Domestic 328,505.3 720,500.9 832,852.7 1,290,061.2 1,279,354.5 1,346,867.2 1,769,523.8 1,991,409.4 2,628,150.3 3,102,110.1 2,816,611.2 3,142,125.2 21,248,071.8
International 152,468.3 210,839.1 231,766.2 360,987.1 312,398.2 260,244.2 403,141.2 421,928.7 451,085.4 568,278.2 623,172.8 661,992.3 4,658,301.7 All Capital
Total 480,973.6 931,340.0 1,064,618.9 1,651,048.3 1,591,752.7 1,607,111.4 2,172,665.0 2,413,338.1 3,079,235.7 3,670,388.3 3,439,784.0 3,804,117.5 25,906,373.5

Table 3 Domestic and Cross-Border Security Issues
Panel A. Equity Issues The following table reports the aggregated amounts of equity capital raised by firms in the G7 countries and by firms in non-G7 regions for our sample period of 1990-2001.Equity data for Italy, as well as for Australia and New Zealand, are not available until 1991 so the numbers reported below are for 1991-2001 for these countries. Column [a]reports the gross proceeds raised by firms who issued equity in their domestic marketplace during the sample period. Column [b] reports the gross proceeds of equity capitalraised in each of country/region by firms from other countries/regions. Column [c] reports the gross proceeds from the sale of equity securities by firms from the homecountry/region in markets which are not their home market.
Equity Issues, Publicly Sold and Privately Placed Equity 1990 - 2001 (Converted to millions of US$)
Total Issues in own Market
[a]
Foreign Issues in this Market
[b]
Home Firms' Foreign Issues
[c]
Size of Foreign Issues Relative to
Home Issues [c] / [a]
Measure of Net Importers of Equity
Capital [c] / [b]
Size of Foreign Issues In Home
Market Relative To Home Market Issues
[b] / [a] Canada 130,462.6 5,009.3 20,096.2 15.40% 401.18% 3.84%
France 133,409.3 8,859.4 10,402.4 7.80% 117.42% 6.64%
Germany 163,949.9 6,566.7 7,756.6 4.73% 118.12% 4.01%
Italy 130,506.8 342.9 1,511.9 1.16% 440.92% 0.26%
Japan 289,956.4 833.1 7,638.0 2.63% 916.82% 0.29%
United Kingdom 278,261.7 20,015.1 14,979.6 5.38% 74.84% 7.19%
United States 1,209,244.0 153,322.3 7,668.1 0.63% 5.00% 12.68%
Africa 7,110.9 5.8 3,550.4 49.93% 61213.79% 0.08%
Australia and New Zealand 82,505.3 2,919.6 6,471.4 7.84% 221.65% 3.54%
Central Am + Caribbean 29,752.8 391.8 30,544.5 102.66% 7795.94% 1.32%
Eastern Europe 12,956.0 234.6 4,079.7 31.49% 1739.00% 1.81%
Middle East 6,770.8 47.2 7,697.0 113.68% 16307.20% 0.70%
Other Asia 338,427.3 869.5 21,336.0 6.30% 2453.82% 0.26%
Other Europe 323,752.6 7,976.8 59,975.7 18.53% 751.88% 2.46%
Country
South America 63,619.5 30.5 3,717.1 5.84% 12187.21% 0.05%
Sum 3,200,685.9 207,424.6 207,424.6
% of Equity sold in foreign markets 6.086%

Table 3 (contd.)
Panel B. Debt Issues (non-convertible) The following table reports the aggregated amounts of Debt sold by firms in the G7 countries and by firms in non-G7 regions for our sample period of 1990-2001. Debt datafor Italy’s domestic debt market are not available until 1991 so the numbers reported below for Italy in Column [a] are for the years 1991-2001. Additionally, domestic debtmarket issuance data for Australia and New Zealand are available starting in 1997 so the number reported for Australian and New Zealand in column [a] is for the period 1997-2001. Column [a] reports the gross proceeds raised by firms who issued debt in their domestic marketplace during the sample period. Column [b] reports the gross proceeds ofdebt capital raised in each of country/region by firms from other countries/regions. Column [c] reports the gross proceeds from the sale of debt securities by firms from thehome country/region in markets which are not their home market.
Non-Convertible Debt Issues, Publicly Sold and Privately Placed Debt Proceeds 1990 - 2001 (Converted to US$)
Total Issues in own Market
[a]
Foreign Issues in this Market
[b]
Home Firms' Foreign Issues
[c]
Size of Foreign Issues Relative to Home
Issues [c] / [a]
Measure of Net Importers of Debt Capital [c] / [b]
Size of Foreign Issues In Home
Market Relative To Home Market Issues
[b] / [a] Canada 506,264.4 3,591.8 312,364.3 61.70% 8696.60% 0.71% France 450,945.1 77,281.2 343,216.2 76.11% 444.11% 17.14% Germany 2,101,925.8 420,709.5 398,498.7 18.96% 94.72% 20.02% Italy 721,465.1 4,999.0 242,666.6 33.64% 4854.30% 0.69% Japan 1,426,906.7 60,544.5 252,847.0 17.72% 417.62% 4.24% United Kingdom 667,952.4 766,104.5 262,612.6 39.32% 34.28% 114.69% United States 7,719,959.0 836,577.3 722,907.4 9.36% 86.41% 10.84% Africa 119.1 0.0 19,818.7 16640.39% N/A 0.00% Australia and New Zealand 60,365.8 3,179.8 159,042.9 263.47% 5001.66% 5.27% Central Am + Caribbean 39,919.4 357.8 336,145.5 842.06% 93947.88% 0.90% Eastern Europe 12,912.3 36.3 88,324.9 684.04% 243319.28% 0.28% Middle East 0.0 0.0 31,004.6 N/A N/A N/A Other Asia 287,975.0 40,694.3 151,940.7 52.76% 373.37% 14.13% Other Europe 2,503,627.4 1,998,148.2 671,483.3 26.82% 33.61% 79.81%
Country
South America 99,687.9 63.7 219,414.5 220.10% 344449.76% 0.06%
Sum 16,600,025.4 4,212,287.9 4,212,287.9
% of Debt sold in foreign markets 20.239%

Panel C. Preferred Equity Issues (non-convertible)
Non-Contertible Preferred Equity Issues, Publicly Sold and Privately Placed Preferred 1990 - 2001 (Converted to millions of US$)
Total Issues in own Market [a]
Foreign Issues in this Market
[b]
Home Firms' Foreign Issues
[c]
Size of Foreign Issues Relative to Home Issues [c] /
[a]
Measure of Net Importers of
Preferred Equity Capital [c] / [b]
Size of Foreign Issues In Home
Market Relative To Home Market Issues
[b] / [a]
Canada 16,652.20 226.60 3,035.80 18% 1340% 1%
France 89.60 0.00 619.20 691% 0%
Germany 4,186.20 627.60 1,533.80 37% 244% 15%
Italy 207.40 0.00 925.70 446% 0%
Japan 0.00 0.00 0.00
United Kingdom 5,079.90 2,433.00 15,079.20 297% 620% 48%
United States 234,252.30 38,020.10 1,390.50 1% 4% 16%
Africa 0.00 0.00 0.00
Australia and New Zealand 138.40 17.40 1,361.90 984% 7827% 13%
Central Am + Caribbean 445.50 0.00 15,653.40 3514% 0%
Eastern Europe 5.50 0.00 0.00 0% 0%
Middle East 0.00 0.00 53.30
Other Asia 3,659.30 0.00 4,556.10 125% 0%
Other Europe 7,880.30 12,651.30 7,781.40 99% 62% 161%
Country
South America 13,939.20 0.00 1,985.70 14% 0%
Sum 286,535.8 53,976.0 53,976.0
% of Preferreds sold in foreign markets 15.851%
Table 3 (contd.)
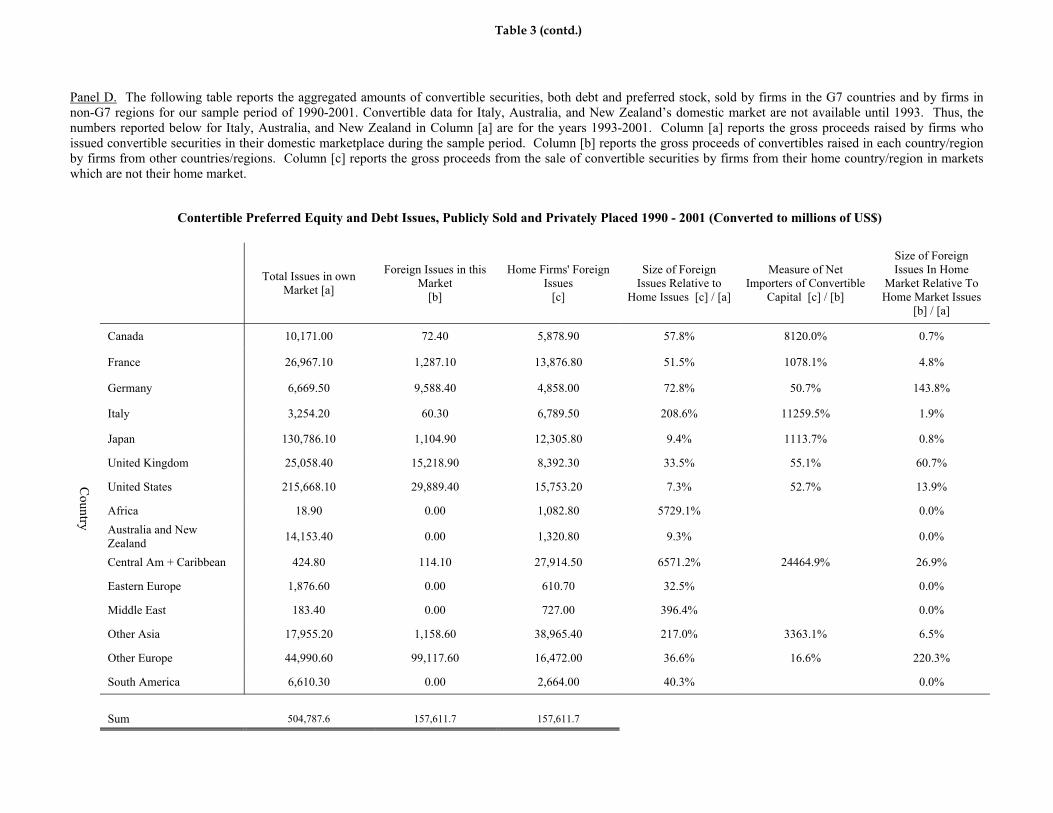
Table 3 (contd.)
Panel D. The following table reports the aggregated amounts of convertible securities, both debt and preferred stock, sold by firms in the G7 countries and by firms innon-G7 regions for our sample period of 1990-2001. Convertible data for Italy, Australia, and New Zealand’s domestic market are not available until 1993. Thus, thenumbers reported below for Italy, Australia, and New Zealand in Column [a] are for the years 1993-2001. Column [a] reports the gross proceeds raised by firms whoissued convertible securities in their domestic marketplace during the sample period. Column [b] reports the gross proceeds of convertibles raised in each country/regionby firms from other countries/regions. Column [c] reports the gross proceeds from the sale of convertible securities by firms from their home country/region in marketswhich are not their home market.
Contertible Preferred Equity and Debt Issues, Publicly Sold and Privately Placed 1990 - 2001 (Converted to millions of US$)
Total Issues in own Market [a]
Foreign Issues in this Market
[b]
Home Firms' Foreign Issues
[c]
Size of Foreign Issues Relative to
Home Issues [c] / [a]
Measure of Net Importers of Convertible
Capital [c] / [b]
Size of Foreign Issues In Home
Market Relative To Home Market Issues
[b] / [a]
Canada 10,171.00 72.40 5,878.90 57.8% 8120.0% 0.7%
France 26,967.10 1,287.10 13,876.80 51.5% 1078.1% 4.8%
Germany 6,669.50 9,588.40 4,858.00 72.8% 50.7% 143.8%
Italy 3,254.20 60.30 6,789.50 208.6% 11259.5% 1.9%
Japan 130,786.10 1,104.90 12,305.80 9.4% 1113.7% 0.8%
United Kingdom 25,058.40 15,218.90 8,392.30 33.5% 55.1% 60.7%
United States 215,668.10 29,889.40 15,753.20 7.3% 52.7% 13.9%
Africa 18.90 0.00 1,082.80 5729.1% 0.0% Australia and New Zealand 14,153.40 0.00 1,320.80 9.3% 0.0%
Central Am + Caribbean 424.80 114.10 27,914.50 6571.2% 24464.9% 26.9%
Eastern Europe 1,876.60 0.00 610.70 32.5% 0.0%
Middle East 183.40 0.00 727.00 396.4% 0.0%
Other Asia 17,955.20 1,158.60 38,965.40 217.0% 3363.1% 6.5%
Other Europe 44,990.60 99,117.60 16,472.00 36.6% 16.6% 220.3%
Country
South America 6,610.30 0.00 2,664.00 40.3% 0.0%
Sum 504,787.6 157,611.7 157,611.7

The following tables report the time-series correlations of the capital-raising activities of firms in our sample countries and regions. In Panel A, we define the equity share of newissues as the proceeds (converted to US$) from equity issues divided by the proceeds from both equity and debt issues by firms from each country and region. The tables reportquarterly correlations. In Panel B, the total equity proceeds raised by firms from each country and region are normalized by the GDP of that particular country or region and thetime series correlations between countries are computed. In Panel C, the total debt proceeds raised by firms from each country and region are normalized by the GDP of thatparticular region and the correlations of these time-series are presented. In Panel D, the total proceeds from all forms of security issues are aggregated as a measure of the totalcapital raised by firms in each country and region. The total proceeds are normalized by that country’s GDP and the time-series correlations are reported in Panel D.
Table 4 Correlations of Capital Issues
PANEL A: Correlation Matrix The Equity Share of New Issues
Canada France Germany Italy Japan United
Kingdom United States Africa Australia and
New Zealand Central Am &
Caribbean E. Europe Middle East Other Asia Other
Europe South
America
France -0.035 1.000
Germany 0.318 0.043 1.000
Italy 0.280 0.383 0.249 1.000
Japan -0.122 0.109 -0.275 -0.023 1.000
United Kingdom -0.293 0.170 -0.385 0.042 0.320 1.000
United States 0.523 -0.053 0.487 0.422 -0.085 -0.265 1.000
Africa -0.037 0.200 -0.035 0.228 -0.200 0.069 -0.076 1.000 Australia and New Zealand 0.025 0.449 0.170 0.389 0.177 0.031 0.161 0.036 1.000
Central Am & Caribbean 0.001 -0.214 0.339 0.114 -0.215 -0.309 0.524 -0.103 0.212 1.000
E. Europe -0.387 0.059 -0.203 0.000 0.047 0.463 -0.348 -0.062 -0.048 -0.259 1.000
Middle East 0.103 0.028 0.324 0.398 -0.306 -0.082 0.550 0.039 0.103 0.466 -0.017 1.000
Other Asia 0.267 -0.152 0.216 0.325 -0.082 -0.175 0.517 -0.165 0.141 0.584 0.005 0.423 1.000
Other Europe 0.037 0.574 -0.073 0.337 -0.036 0.134 -0.180 0.267 0.488 -0.260 0.137 -0.113 -0.113 1.000
South America 0.041 0.135 0.105 0.162 0.316 0.096 0.215 -0.098 0.272 0.233 -0.065 0.002 0.046 -0.061 1.000
PANEL B: Correlation Matrix of Total Equity Issues Normalized by GDP
Canada France Germany Italy Japan United
Kingdom United States Africa Australia and
New Zealand Central Am &
Caribbean E. Europe Middle East Other Asia Other
Europe South
America
France 0.225 1.000
Germany 0.179 0.577 1.000
Italy 0.141 0.589 0.405 1.000
Japan 0.016 0.107 0.141 0.264 1.000
United Kingdom 0.057 0.306 0.123 0.164 0.147 1.000
United States 0.596 0.464 0.449 0.500 0.244 0.173 1.000
Africa 0.024 0.465 0.275 0.169 0.216 0.370 0.240 1.000 Australia and New Zealand 0.048 0.425 0.302 0.810 0.278 0.151 0.485 0.236 1.000
Central Am & Caribbean -0.039 -0.011 0.030 -0.068 -0.164 -0.220 0.065 -0.052 0.048 1.000
E. Europe -0.069 0.296 0.273 0.457 0.324 0.255 0.286 0.550 0.537 -0.081 1.000
Middle East 0.096 0.326 0.357 0.414 0.199 0.421 0.497 0.431 0.375 -0.071 0.536 1.000
Other Asia 0.281 0.606 0.371 0.550 0.411 0.252 0.478 0.281 0.397 -0.010 0.381 0.462 1.000
Other Europe 0.095 0.650 0.697 0.619 0.425 0.392 0.524 0.378 0.524 -0.102 0.487 0.443 0.566 1.000
South America 0.111 0.096 -0.066 0.008 0.153 0.133 0.129 0.463 0.126 0.055 0.248 0.165 0.284 0.051 1.000
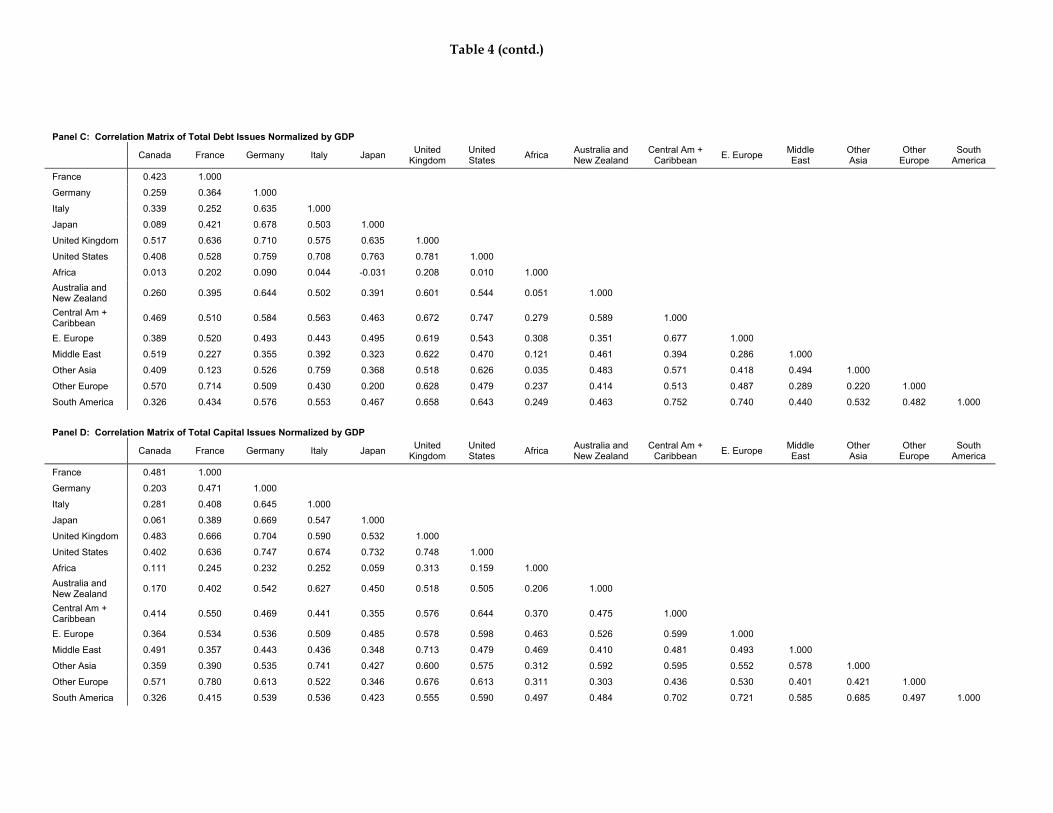
Panel C: Correlation Matrix of Total Debt Issues Normalized by GDP
Canada France Germany Italy Japan United
Kingdom United States Africa Australia and
New Zealand Central Am +
Caribbean E. Europe Middle East
Other Asia
Other Europe
South America
France 0.423 1.000
Germany 0.259 0.364 1.000
Italy 0.339 0.252 0.635 1.000
Japan 0.089 0.421 0.678 0.503 1.000
United Kingdom 0.517 0.636 0.710 0.575 0.635 1.000
United States 0.408 0.528 0.759 0.708 0.763 0.781 1.000
Africa 0.013 0.202 0.090 0.044 -0.031 0.208 0.010 1.000 Australia and New Zealand 0.260 0.395 0.644 0.502 0.391 0.601 0.544 0.051 1.000
Central Am + Caribbean 0.469 0.510 0.584 0.563 0.463 0.672 0.747 0.279 0.589 1.000
E. Europe 0.389 0.520 0.493 0.443 0.495 0.619 0.543 0.308 0.351 0.677 1.000
Middle East 0.519 0.227 0.355 0.392 0.323 0.622 0.470 0.121 0.461 0.394 0.286 1.000
Other Asia 0.409 0.123 0.526 0.759 0.368 0.518 0.626 0.035 0.483 0.571 0.418 0.494 1.000
Other Europe 0.570 0.714 0.509 0.430 0.200 0.628 0.479 0.237 0.414 0.513 0.487 0.289 0.220 1.000
South America 0.326 0.434 0.576 0.553 0.467 0.658 0.643 0.249 0.463 0.752 0.740 0.440 0.532 0.482 1.000
Panel D: Correlation Matrix of Total Capital Issues Normalized by GDP
Canada France Germany Italy Japan United
Kingdom United States Africa Australia and
New Zealand Central Am +
Caribbean E. Europe Middle East
Other Asia
Other Europe
South America
France 0.481 1.000
Germany 0.203 0.471 1.000
Italy 0.281 0.408 0.645 1.000
Japan 0.061 0.389 0.669 0.547 1.000
United Kingdom 0.483 0.666 0.704 0.590 0.532 1.000
United States 0.402 0.636 0.747 0.674 0.732 0.748 1.000
Africa 0.111 0.245 0.232 0.252 0.059 0.313 0.159 1.000 Australia and New Zealand 0.170 0.402 0.542 0.627 0.450 0.518 0.505 0.206 1.000
Central Am + Caribbean 0.414 0.550 0.469 0.441 0.355 0.576 0.644 0.370 0.475 1.000
E. Europe 0.364 0.534 0.536 0.509 0.485 0.578 0.598 0.463 0.526 0.599 1.000
Middle East 0.491 0.357 0.443 0.436 0.348 0.713 0.479 0.469 0.410 0.481 0.493 1.000
Other Asia 0.359 0.390 0.535 0.741 0.427 0.600 0.575 0.312 0.592 0.595 0.552 0.578 1.000
Other Europe 0.571 0.780 0.613 0.522 0.346 0.676 0.613 0.311 0.303 0.436 0.530 0.401 0.421 1.000
South America 0.326 0.415 0.539 0.536 0.423 0.555 0.590 0.497 0.484 0.702 0.721 0.585 0.685 0.497 1.000
Table 4 (contd.)

Panel A: Domestic Equity Market Timing We estimate the following regressions using monthly observations of new issues for each of the G7 countries and geographicregions in our sample.
(2) ,12
(1) ,12
,1,,,
,
,1,,
,
titititi
ti
tititi
ti
bRaDE
E
bRaGDP
E
ε
ε
++=+
++=
−
−
The dependent variable in (1) is the level of domestic equity issues in each of the countries and is calculated as the amount (inUS$) of equity issues by firms in their domestic market divided by the GDP of the domestic country. The explanatoryvariables are the lagged 12-month returns for the domestic equity markets. The return time series are value-weighted indicesfrom Datastream. The dependent variable in (2) is the equity share of new issues, defined as the equity proportion of newissues (equity and debt) proceeds for issues by firms in their domestic marketplace. We use Hansen and Hodrick (1980)estimators to adjust for the serial correlation induced by overlapping observations.
Table 5 Domestic Equity Market Timing
Specification (1) Specification (2) a b a b
0.0163 0.0198 0.2230 0.1212 Canada (4.58) (1.48) (0.96) (1.36) 0.0066 0.0170 0.1750 0.2458 France (15.10) (2.34) (0.92) (1.74) 0.0061 0.0122 0.1595 -0.0984 Germany (15.44) (1.43) (0.42) (0.92) 0.0089 0.0229 0.2817 0.1395 Italy (37.90) (3.95) (2.59) (1.74) 0.0047 0.0043 0.1557 0.1013 Japan (12.70) (1.60) (1.26) (1.33) 0.0145 0.0057 0.2783 -0.1106 UK (5.85) (1.01) (0.98) (1.03) 0.0107 0.0121 0.0974 0.1579 US (36.05) (2.37) (2.10) (2.12) 0.0157 0.0232 0.2263 0.2664 Australia, New Zealand (7.65) (1.80) (4.47) (1.64) 0.0150 0.0061 0.6074 -0.1187 Eastern Europe (38.42) (8.07) (3.35) (0.43) 0.0220 0.0022 0.2677 0.0818 Latin American and
Caribbean (27.41) (3.96) (2.22) (1.34) 0.0162 -0.0051 0.6026 0.1201 Other Asia (17.06) (1.06) (1.75) (1.17) 0.0076 0.0189 0.0985 0.1494 Other Europe (3.85) (1.23) (1.21) (1.38) 0.0053 0.0168 0.3150 0.0632 South America (0.02) (1.48) (1.66) (1.29) 0.0111 0.0124 0.1814 0.1768 Fama-MacBeth Statistics (12.57) (2.81) (3.72) (1.55) 0.0096 0.0117 0.2507 0.0817 Pooled, Fixed Effects (25.30) (3.85) (5.88) (1.76)

Table 5 (contd.)
Panel B: Domestic Equity Market Timing We estimate the following regression specifications using monthly observations of equity issues for each of the G7 countriesand other geographic regions in our sample.
(4) .
(3) , ,,
e DE
EbaFR
eGDP
EbaFR
i,ti,ti,t
i,ti,t
i,ti,t
titi
+
++=
+
+=
The independent variable in the first equation is calculated using total proceeds from domestic equity issues by firms for eachcountry, normalized by that country’s nominal GDP. The independent variable in the second equation represents the equityportion of capital raised domestically each month. The dependent variables are the future 12-month home market returns. Forthe regions, the home market returns are market capitalization weighted averages of the domestic returns. The Hansen andHodrick (1980) approach is used to adjust the covariance matrix for the serial correlation induced by overlapping observations.
Specification (3) Specification (4) a b a b
0.1292 -1.2166 0.1445 -0.1556 Canada (5.45) (1.58) (5.66) (1.88) 0.1393 -3.1883 0.1462 -0.1691 France (7.09) (2.34) (6.52) (2.17) 0.0936 -2.5196 0.0801 -0.0328 Germany (5.45) (2.17) (4.45) (0.50) 0.0710 -0.3171 0.0785 -0.0129 Italy (2.66) (1.31) (2.54) (1.19) 0.0078 0.2157 0.0326 -0.1200 Japan (0.24) (0.07) (0.89) (0.95) 0.1393 -1.1657 0.1123 -0.1244 UK (7.91) (1.98) (5.22) (1.23) 0.2596 -9.2805 0.1151 -0.1575 US (8.15) (4.12) (4.23) (2.28) 0.1261 -1.3253 0.1553 -0.1677 Australia, New Zealand (7.09) (2.70) (5.88) (2.48) 0.0526 -2.4135 0.0978 -0.0813 Eastern Europe (2.26) (0.74) (2.56) (1.76) 0.0213 -1.2131 -0.0184 0.1657 Latin American and
Caribbean (0.60) (1.15) (0.46) (1.53) 0.0834 1.0430 0.0943 0.0018 Other Asia (2.94) (1.03) (1.21) (1.07) 0.1389 -3.6532 0.1349 -0.2917 Other Europe (7.62) (3.40) (6.14) (2.18) 0.0016 0.7582 0.0789 -0.3129 South America (1.63) (0.76) (1.50) (2.31) 0.1050 -1.6340 0.0950 -0.1206 Fama-MacBeth Statistics (4.69) (3.02) (3.68) (1.97) 0.1001 -1.6037 0.0927 -0.0879 Pooled, Fixed Effects (13.97) (4.29) (6.05) (1.85) 0.1523 -7.3134 0.1385 -0.3617 Global Regression (5.92) (3.18) (3.24) (1.88)

Table 6 International Equity Market Timing
Panel A: Foreign Equity Issues In US Equity Markets We estimate the following two regression specifications using monthly observations of foreign equity issues in the US Equity markets. The dependent variable in specification (5) is the future 12-month equity return of the US Equity Market. The dependent variable in specification (6) is the difference in the future 12-month equity return in the US and the average return in the rest of the world where the weights assigned to the “weighted average future foreign return” are the amount of equity a particular country issues in the US. The dependent variable is calculated as the gross proceeds from foreign equity issues in the US markets normalized by US GDP. Additionally, we estimate both specifications (5) and (6) using only IPO issues.
(6) ,)1212(
(5) ,12
,1
1,,
,1
1,
tit
it
i
twti
tit
it
i
ti
eGDPFEb a FRFR
eGDPFEb a FR
++=−
++=
−
−
−
−
Panel B: Foreign Equity Issues In UK Equity Markets We estimate the following two regression specifications using monthly observations of foreign equity issues in the UK Equity markets using the same approach as in Panel A.
(6) ,)1212(
(5) ,12
,1
1,,
,1
1,
tit
it
i
twti
tit
it
i
ti
eGDPFEb a FRFR
eGDPFEb a FR
++=−
++=
−
−
−
−
Panel A: Foreign Equity Issues In US Equity Markets All Equity Issues IPO Issues Only a b a b
Coefficient 0.1256 -8.0385 0.1180 -22.4870 Independent Variable: Future 12-month US Equity Returns t-stat (5.81) (2.29) (6.42) (2.25)
Coefficient 0.0795 -21.8892 0.0500 -42.6088 Independent Variable: Future 12-month (US - World) Equity Returns t-stat (2.89) (2.75) (2.10) (1.82)
Panel B: Foreign Equity Issues In UK Equity Markets All Equity Issues IPO Issues Only a b a b
Coefficient 0.1390 -7.8795 0.1283 -15.8029 Independent Variable: Future 12-month UK Equity Returns t-stat (8.79) (2.04) (9.34) (1.85)
Coefficient 0.1234 -11.8217 0.1020 -13.9345 Independent Variable: Future 12-month (UK - World) Equity Returns t-stat (8.14) (3.19) (7.57) (1.78)
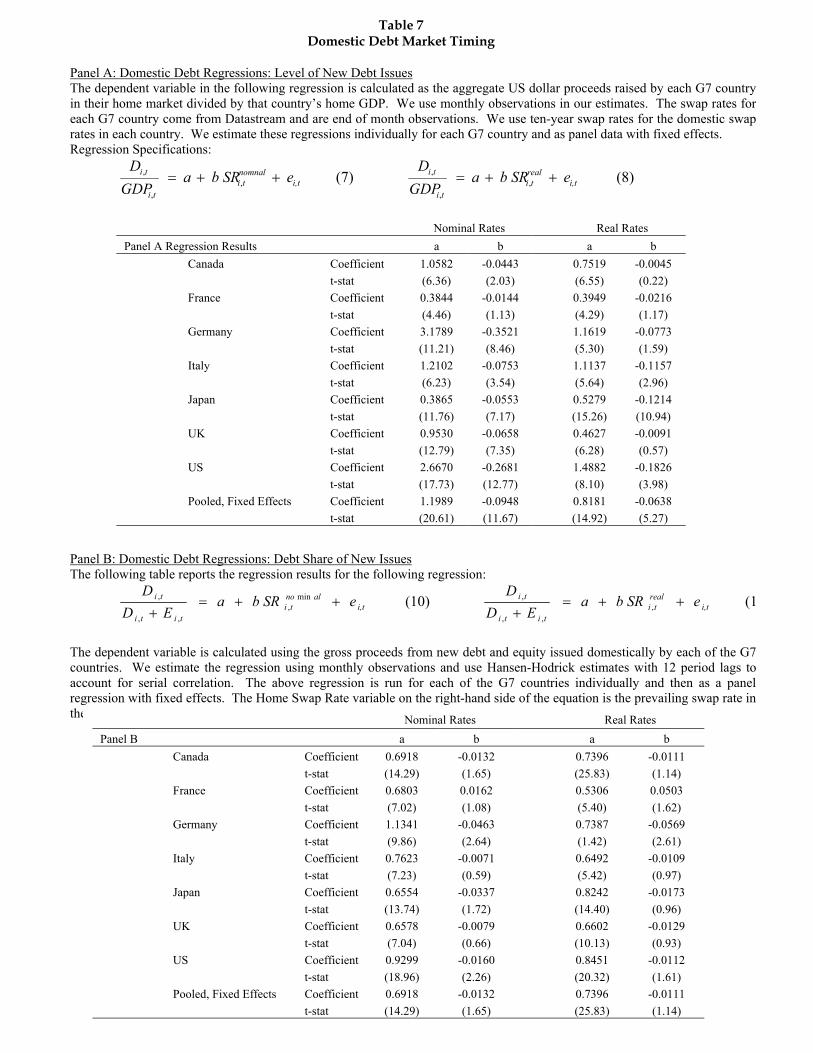
Table 7 Domestic Debt Market Timing
Panel A: Domestic Debt Regressions: Level of New Debt Issues The dependent variable in the following regression is calculated as the aggregate US dollar proceeds raised by each G7 countryin their home market divided by that country’s home GDP. We use monthly observations in our estimates. The swap rates foreach G7 country come from Datastream and are end of month observations. We use ten-year swap rates for the domestic swaprates in each country. We estimate these regressions individually for each G7 country and as panel data with fixed effects. Regression Specifications:
(8) (7) ,,
,,
,
,i,t
realti
ti
tii,t
nomnalti
ti
ti e b SR a GDP
D e b SR a
GDPD
++=++=
Panel B: Domestic Debt Regressions: Debt Share of New Issues The following table reports the regression results for the following regression:
(1 (10) ,,,
,min,
,,
,i,t
realti
titi
tii,t
alnoti
titi
ti e b SR a ED
D e b SR a
EDD
++=+
++=+
The dependent variable is calculated using the gross proceeds from new debt and equity issued domestically by each of the G7countries. We estimate the regression using monthly observations and use Hansen-Hodrick estimates with 12 period lags toaccount for serial correlation. The above regression is run for each of the G7 countries individually and then as a panelregression with fixed effects. The Home Swap Rate variable on the right-hand side of the equation is the prevailing swap rate inthe G7 country in the middle of the observation month. Nominal Rates Real Rates
Panel B a b a b Canada Coefficient 0.6918 -0.0132 0.7396 -0.0111 t-stat (14.29) (1.65) (25.83) (1.14) France Coefficient 0.6803 0.0162 0.5306 0.0503 t-stat (7.02) (1.08) (5.40) (1.62) Germany Coefficient 1.1341 -0.0463 0.7387 -0.0569 t-stat (9.86) (2.64) (1.42) (2.61) Italy Coefficient 0.7623 -0.0071 0.6492 -0.0109 t-stat (7.23) (0.59) (5.42) (0.97) Japan Coefficient 0.6554 -0.0337 0.8242 -0.0173 t-stat (13.74) (1.72) (14.40) (0.96) UK Coefficient 0.6578 -0.0079 0.6602 -0.0129 t-stat (7.04) (0.66) (10.13) (0.93) US Coefficient 0.9299 -0.0160 0.8451 -0.0112 t-stat (18.96) (2.26) (20.32) (1.61) Pooled, Fixed Effects Coefficient 0.6918 -0.0132 0.7396 -0.0111 t-stat (14.29) (1.65) (25.83) (1.14)
Nominal Rates Real Rates Panel A Regression Results a b a b Canada Coefficient 1.0582 -0.0443 0.7519 -0.0045 t-stat (6.36) (2.03) (6.55) (0.22) France Coefficient 0.3844 -0.0144 0.3949 -0.0216 t-stat (4.46) (1.13) (4.29) (1.17) Germany Coefficient 3.1789 -0.3521 1.1619 -0.0773 t-stat (11.21) (8.46) (5.30) (1.59) Italy Coefficient 1.2102 -0.0753 1.1137 -0.1157 t-stat (6.23) (3.54) (5.64) (2.96) Japan Coefficient 0.3865 -0.0553 0.5279 -0.1214 t-stat (11.76) (7.17) (15.26) (10.94) UK Coefficient 0.9530 -0.0658 0.4627 -0.0091 t-stat (12.79) (7.35) (6.28) (0.57) US Coefficient 2.6670 -0.2681 1.4882 -0.1826 t-stat (17.73) (12.77) (8.10) (3.98) Pooled, Fixed Effects Coefficient 1.1989 -0.0948 0.8181 -0.0638 t-stat (20.61) (11.67) (14.92) (5.27)
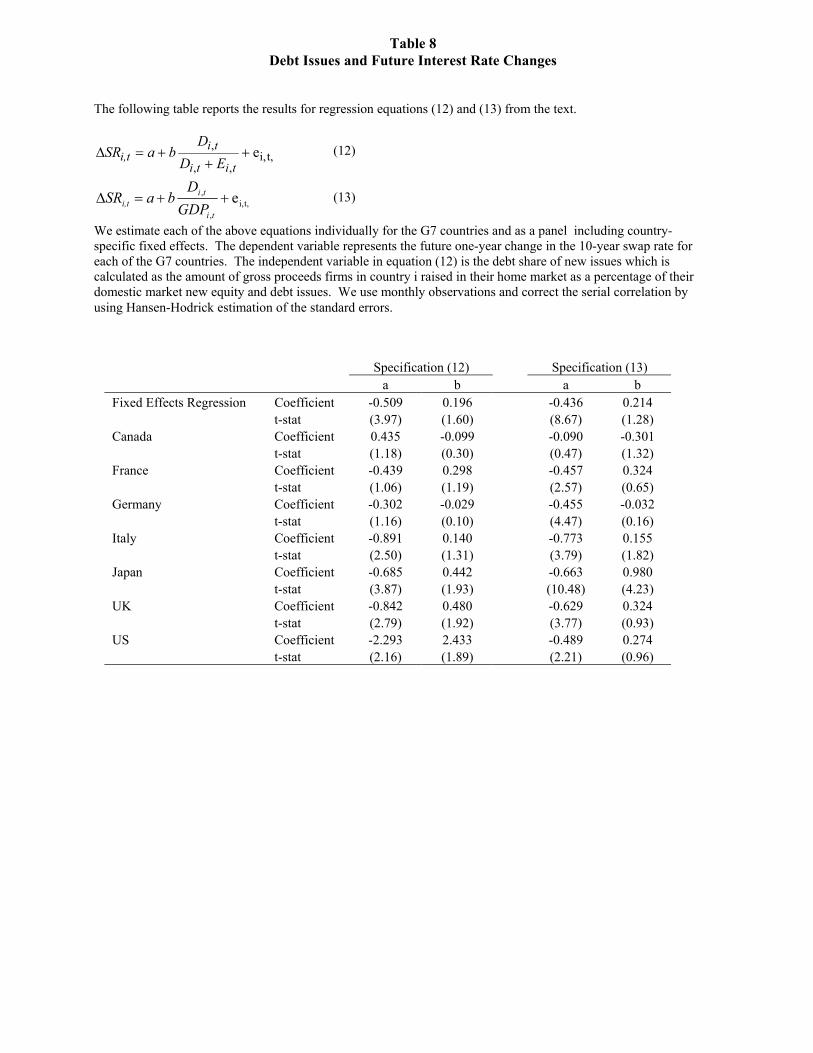
Table 8 Debt Issues and Future Interest Rate Changes
The following table reports the results for regression equations (12) and (13) from the text.
t,i,,,
, e ++
+=∆titi
tii,t ED
DbaSR (12)
t,i,,
, e ++=∆ti
tii,t GDP
DbaSR (13)
We estimate each of the above equations individually for the G7 countries and as a panel including country-specific fixed effects. The dependent variable represents the future one-year change in the 10-year swap rate for each of the G7 countries. The independent variable in equation (12) is the debt share of new issues which is calculated as the amount of gross proceeds firms in country i raised in their home market as a percentage of their domestic market new equity and debt issues. We use monthly observations and correct the serial correlation by using Hansen-Hodrick estimation of the standard errors.
Specification (12) Specification (13) a b a b Fixed Effects Regression Coefficient -0.509 0.196 -0.436 0.214 t-stat (3.97) (1.60) (8.67) (1.28) Canada Coefficient 0.435 -0.099 -0.090 -0.301 t-stat (1.18) (0.30) (0.47) (1.32) France Coefficient -0.439 0.298 -0.457 0.324 t-stat (1.06) (1.19) (2.57) (0.65) Germany Coefficient -0.302 -0.029 -0.455 -0.032 t-stat (1.16) (0.10) (4.47) (0.16) Italy Coefficient -0.891 0.140 -0.773 0.155 t-stat (2.50) (1.31) (3.79) (1.82) Japan Coefficient -0.685 0.442 -0.663 0.980 t-stat (3.87) (1.93) (10.48) (4.23) UK Coefficient -0.842 0.480 -0.629 0.324 t-stat (2.79) (1.92) (3.77) (0.93) US Coefficient -2.293 2.433 -0.489 0.274 t-stat (2.16) (1.89) (2.21) (0.96)

Table 9 International Debt Issues
The dependent variable in the following regression specification is calculated as the aggregate US dollar proceeds raised byeach G7 country in the US market divided by that country’s home GDP. We use monthly observations in our estimates. TheUS swap rate ( j
tSR ) and home swap rate ( jtiSR , ) for each G7 country come from Datastream and are end of month
observations. We estimate each specification for short-term debt (original maturity of 1 through 5 years), long-term debt(greater than 5-year original maturity), and all debt. For the estimation using short-term debt, we use two-year swap rates andfor the long-term debt and total debt estimation we use ten-year swap rates. We estimate these regressions as panel data withcountry-specific fixed effects and adjust the standard errors for serial correlation caused by the overlapping observations ofthe independent variables. We estimate the following equation for foreign issues in both the U.S. and the U.K. and report theresults for both countries in the table below.
[ ] ,,,
i,tjti
jt
jt
ti
ji,t e-SRSR c SR b a
GDPFD
+⋅+⋅+= (14)
United States: Nominal Rates Real Rates Short Term Debt a b c a b c Coefficient 0.0035 -0.0003 -0.0006 0.0015 0.0002 -0.0005 t-stat (3.46) (1.88) (5.19) (2.07) (0.76) (2.75) Long Term Debt Coefficient 0.0151 -0.0016 -0.0012 0.0147 -0.0023 -0.0027 t-stat (4.93) (3.20) (2.91) (5.97) (3.85) (4.19) Total Debt Coefficient 0.0186 -0.0018 -0.0008 0.0162 -0.0023 -0.0023 t-stat (5.97) (3.69) (3.02) (6.44) (3.68) (3.56) United Kingdom: Nominal Rates Real Rates Short Term Debt a b c a b c Coefficient 0.0053 -0.0005 0.0000 0.0041 -0.0006 -0.0002 t-stat (9.45) (5.69) (0.03) (6.50) (3.67) (1.52) Long Term Debt Coefficient 0.0050 -0.0003 -0.0004 0.0031 -0.0003 0.0001 t-stat (8.33) (3.93) (2.68) (5.49) (2.11) (0.71) Total Debt Coefficient 0.0105 -0.0008 -0.0006 0.0070 -0.0008 0.0003 t-stat (13.24) (7.50) (3.06) (9.24) (4.73) (1.80)

Appendix I Dollar Volume (in MillionsUS$) of New Issues
Panel 1. The following table presents the aggregated proceeds (in millions US$) over the sample period of 1990 through 2001 of equity proceeds by firms throughout the world accordingthe Security Data Corporation’s (SDC) New Issues Databases. We classify each sale of common stock according to the home country of the issuer and the country where the proceeds areraised. We consider each of the G7 countries individually and classify all other countries into geographic regions. See Appendix II for a complete list of individual countries comprisingeach geographical region. All Equity Issues (Public and Privately Placed Equity) in Millions US$ Marketplace of Equity Issue (Aggregated 1990-2001)
Canada France Germany Italy Japan United Kingdom
United States Africa Australia &
New Zealand Central Am + Caribbean
Eastern Europe
Middle East Other Asia Other
Europe South
America Total
Canada 130,462.6
-
54.4
-
128.6
7.9
19,833.8
-
70.1
-
-
-
1.4
-
-
150,558.8
France 34.5
133,409.3
466.1
-
-
869.2
8,754.5
5.8
2.3
-
-
-
11.5
258.5
-
143,811.7
Germany 66.2
-
163,949.9
-
-
17.4
6,294.4
-
-
-
-
-
-
1,378.6
-
171,706.5
Italy 5.4
110.3
-
130,506.8
-
-
1,396.2
-
-
-
-
-
-
-
-
132,018.7
Japan 2.5
-
373.4
-
289,956.4
34.7
7,128.8
-
89.5
-
-
-
9.1
-
-
297,594.4
United Kingdom
115.0
76.0
-
-
-
278,261.7
13,717.0
-
683.7
-
2.0
-
-
385.9
-
293,241.3
United States
4,215.9
375.2
549.0
-
86.4
930.0
1,209,244.0
-
522.2
-
14.0
45.8
116.0
798.4
15.2
1,216,912.1
Africa 17.2
9.3
263.9
-
-
2,283.5
888.0
7,110.9
2.2
-
-
-
4.6
81.7
-
10,661.3
Australia & New Zealand
31.4
-
-
-
-
34.7
5,376.2
-
82,505.3
-
-
-
43.9
985.2
-
88,976.7
Central Am + Caribbean
39.7
-
-
-
254.1
1,012.7
28,556.6
-
38.5
29,752.8
-
-
163.5
464.1
15.3
60,297.3
Eastern Europe
38.6
-
120.4
-
-
971.4
2,830.5
-
-
-
12,956.0
-
7.6
111.2
-
17,035.7
Middle East
6.6
16.2
221.5
-
-
477.5
6,387.1
-
-
-
-
6,770.8
-
588.1
-
14,467.8
Other Asia 170.9
-
-
44.0
364.0
3,020.8
13,573.8
-
1,511.1
-
-
1.4
338,427.3
2,650.0
-
359,763.3
Other Europe
196.7
8,272.4
4,518.0
298.9
-
10,305.3
36,165.8
-
-
-
218.6
-
-
323,752.6
-
383,728.3
Loca
tion
of Is
suin
g Fi
rm
South America
68.7
-
-
-
-
50.0
2,419.6
-
-
391.8
-
-
511.9
275.1
63,619.5
67,336.6
Total
135,471.9
142,268.7
170,516.6
130,849.7
290,789.5
298,276.8
1,362,566.3
7,116.7
85,424.9
30,144.6
13,190.6
6,818.0
339,296.8
331,729.4
63,650.0
3,408,110.5

Appendix I Dollar Volume (in MillionsUS$) of New Issues
Panel 2. The following table presents the aggregated proceeds (in millions US$) over the sample period of 1990 through 2001 of non-convertible debt proceeds by firms throughout theworld according the Security Data Corporation’s (SDC) New Issues Databases. We classify each sale of non-convertible debt according to the home country of the issuer and thecountry where the proceeds are raised. We consider each of the G7 countries individually and classify all other countries into geographic regions. See Appendix II for a complete list ofindividual countries comprising each geographical region.
All Debt Issues (Public and Privately Placed Debt) in Millions US$ Marketplace of Debt Issue (Aggregated 1990-2001)
Canada France Germany Italy Japan United Kingdom
United States Africa
Australia & New
Zealand
Central Am + Caribbean
Eastern Europe
Middle East
Other Asia
Other Europe
South America Total
Canada 506,264.4
4,171.2
7,904.5
-
1,051.1
42,527.0
185,263.8
-
339.7
-
-
-
3,153.9
67,953.1
-
818,628.7
France -
450,945.1
24,077.9
229.3
201.3
12,754.2
14,871.8
-
-
-
-
-
876.6
290,205.1
-
794,161.3
Germany 12.2
8,769.6
2,101,925.8
-
1,118.9
70,091.1
71,733.4
-
1,354.4
-
-
-
1,921.0
243,498.1
-
2,500,424.5
Italy -
588.7
5,632.3
721,465.1
507.6
14,796.5
34,519.4
-
-
-
-
-
1,597.0
185,025.1
-
964,131.7
Japan -
1,625.2
20,185.0
-
1,426,906.7
112,234.2
15,258.9
-
-
-
-
-
1,937.1
101,606.6
-
1,679,753.7
United Kingdom
499.0
12,312.5
20,596.9
346.1
2,491.8
667,952.4
111,946.5
-
330.9
-
-
-
6,042.6
108,046.3
-
930,565.0
United States
2,295.6
14,936.9
42,739.7
2,323.7
6,207.2
99,270.1
7,719,959.0
-
754.7
-
-
-
14,367.9
540,011.6
-
8,442,866.4
Africa -
88.1
2,211.6
-
2,241.6
1,314.4
5,442.4
119.1
-
-
-
-
-
8,520.6
-
19,937.8
Australia & New Zealand
-
-
2,854.5
-
2,904.9
61,547.8
27,667.6
-
60,365.8
-
-
-
1,658.7
62,409.4
-
219,408.7
Central Am + Caribbean
-
4,497.8
13,530.9
-
1,541.8
69,229.7
82,436.6
-
-
39,919.4
-
-
1,481.3
163,363.7
63.7
376,064.9
Eastern Europe
-
-
26,211.3
-
9,001.0
898.3
9,626.0
-
-
-
12,912.3
-
-
42,588.3
-
101,237.2
Middle East -
41.1
150.6
-
-
2,150.1
13,812.8
-
-
-
-
-
-
14,850.0
-
31,004.6
Other Asia 147.8
308.1
5,263.0
-
11,218.7
12,883.2
67,669.5
-
69.7
-
-
-
287,975.0
54,380.7
-
439,915.7
Other Europe
637.2
29,212.0
221,729.0
1,266.1
20,745.8
260,529.0
129,688.4
-
330.4
-
36.3
-
7,309.1
2,503,627.4
-
3,175,110.7
Loca
tion
of Is
suin
g Fi
rm
South America
-
730.0
27,622.3
833.8
1,312.8
5,878.9
66,640.2
-
-
357.8
-
-
349.1
115,689.6
99,687.9
319,102.4
Total
509,856.2
528,226.3
2,522,635.3
726,464.1
1,487,451.2
1,434,056.9
8,556,536.3
119.1
63,545.6
40,277.2
12,948.6
-
328,669.3
4,501,775.6
99,751.6
20,812,313.3

Appendix I Dollar Volume (in MillionsUS$) of New Issues
Panel 3. The following table presents the aggregated proceeds (in millions US$) over the sample period of 1990 through 2001 of non-convertible preferred stock proceeds by firms throughout the world.
All Preferred Issues (Public and Privately Placed Equity) in Millions US$ Marketplace of Preferred Issue (Aggregated 1990-2001)
Canada France Germany Italy Japan United Kingdom United States Africa Australia &
New Zealand Central Am + Caribbean
Eastern Europe
Middle East
Other Asia
Other Europe
South America Total
Canada 16,652.2
-
-
-
-
-
3,035.8
-
-
-
-
-
-
-
-
19,688.0
France -
89.6
-
-
-
-
300.8
-
-
-
-
-
-
318.4
-
708.8
Germany 85.1
-
4,186.2
-
-
-
1,243.8
-
-
-
-
-
-
204.9
-
5,720.0
Italy -
-
-
207.4
-
-
542.0
-
-
-
-
-
-
383.7
-
1,133.1
Japan -
-
-
-
-
-
-
-
-
-
-
-
-
-
-
-
United Kingdom
-
-
-
-
-
5,079.9
10,075.0
-
-
-
-
-
-
5,004.2
-
20,159.1
United States 103.9
-
-
-
-
-
234,252.3
-
-
-
-
-
-
1,286.6
-
235,642.8
Africa -
-
-
-
-
-
-
-
-
-
-
-
-
-
-
-
Australia & New Zealand
-
-
-
-
-
-
1,361.9
-
138.4
-
-
-
-
-
-
1,500.3
Central Am + Caribbean
10.0
-
290.2
-
-
1,665.9
9,389.9
-
-
445.5
-
-
-
4,297.4
-
16,098.9
Eastern Europe -
-
-
-
-
-
-
-
-
-
5.5
-
-
-
-
5.5
Middle East -
-
-
-
-
-
53.3
-
-
-
-
-
-
-
-
53.3
Other Asia -
-
-
-
-
266.5
3,116.1
-
17.4
-
-
-
3,659.3
1,156.1
-
8,215.4
Other Europe -
-
162.4
-
-
500.6
7,118.4
-
-
-
-
-
-
7,880.3
-
15,661.7
Loca
tion
of Is
suin
g Fi
rm
South America 27.6
-
175.0
-
-
-
1,783.1
-
-
-
-
-
-
-
13,939.2
15,924.9
Total
16,878.8
89.6
4,813.8
207.4
-
7,512.9
272,272.4
-
155.8
445.5
5.5
-
3,659.3
20,531.6
13,939.2
340,511.8

Appendix I Dollar Volume (in MillionsUS$) of New Issues
Panel 4. The following table presents the aggregated proceeds (in millions US$) over the sample period of 1990 through 2001 of convertible debt and convertible preferred stockproceeds by firms throughout the world according the Security Data Corporation’s (SDC) New Issues Databases. We classify each sale of convertible securities according to the homecountry of the issuer and the country where the proceeds are raised. We consider each of the G7 countries individually and classify all other countries into geographic regions. SeeAppendix II for a complete list of individual countries comprising each geographical region.
Convertibles (Bonds and Preferred Stock) Public and Privately Sold Marketplace of Equity Issue (Aggregated 1990-2001)
Canada France Germany Italy Japan United Kingdom
United States Africa
Australia & New
Zealand
Central Am + Caribbean
Eastern Europe
Middle East Other Asia Other
Europe South
America Total
Canada 10,171.0
-
-
-
-
-
5,860.6
-
-
-
-
-
-
18.3
-
16,049.9
France -
26,967.1
73.4
60.3
-
280.2
504.9
-
-
-
-
-
-
12,958.0
-
40,843.9
Germany -
-
6,669.5
-
-
40.0
161.9
-
-
-
-
-
-
4,656.1
-
11,527.5
Italy -
-
-
3,254.2
-
519.9
1,070.0
-
-
-
-
-
-
5,199.6
-
10,043.7
Japan -
-
240.1
-
130,786.1
-
413.7
-
-
-
-
-
547.5
11,104.5
-
143,091.9
United Kingdom
5.2
-
890.3
-
141.6
25,058.4
1,461.1
-
-
-
-
-
40.0
5,854.1
-
33,450.7
United States
67.2
0.1
1,455.5
-
-
90.7
215,668.1
-
-
-
-
-
-
14,139.7
-
231,421.3
Africa -
-
-
-
-
564.5
20.3
18.9
-
-
-
-
-
498.0
-
1,101.7
Australia & New Zealand
-
-
-
-
-
-
943.0
-
14,153.4
-
-
-
37.8
340.0
-
15,474.2
Central Am + Caribbean
-
-
-
-
-
4,056.3
10,088.5
-
-
424.8
-
-
492.6
13,277.1
-
28,339.3
Eastern Europe
-
-
-
-
-
280.0
156.5
-
-
-
1,876.6
-
-
174.2
-
2,487.3
Middle East
-
-
-
-
-
-
522.0
-
-
-
-
183.4
-
205.0
-
910.4
Other Asia -
-
12.3
-
-
5,363.6
3,252.4
-
-
-
-
-
17,955.2
30,337.1
-
56,920.6
Other Europe
-
1,287.0
6,916.8
-
963.3
4,023.7
3,240.5
-
-
-
-
-
40.7
44,990.6
-
61,462.6
Loca
tion
of Is
suin
g Fi
rm
South America
-
-
-
-
-
-
2,194.0
-
-
114.1
-
-
-
355.9
6,610.3
9,274.3
Total
10,243.4
28,254.2
16,257.9
3,314.5
131,891.0
40,277.3
245,557.5
18.9
14,153.4
538.9
1,876.6
183.4
19,113.8
144,108.2
6,610.3
662,399.3

Appendix II
Countries Included In Geographic Regions
Africa Central America & Caribbean Eastern Europe Middle East Other Asia Other Europe South America
Algeria Aruba Bulgaria Afghanistan Bangladesh Austria Argentina C. African Rep Bahamas Croatia Bahrain China Belgium Bolivia Gabon Barbados Czech Republic Cyprus Hong Kong Denmark Brazil Ghana Belize Estonia Egypt India Finland Chile Ivory Coast Bermuda Georgia Israel Indonesia Gibraltar Colombia Kenya British Virgin Hungary Jordan Macau Greece Ecuador Liberia Cayman Islands Kazakhstan Kuwait Malaysia Guernsey Neth. Antilles Malawi Costa Rica Latvia Lebanon Micronesia Iceland Peru Mauritius Cuba Lithuania Oman Mongolia Ireland Uruguay Morocco Dominican Rep Moldova Pakistan Myanmar(Burma) Isle of Man Venezuela Nigeria El Salvador Poland Qatar Papua New Guinea Jersey Senegal Guatemala Romania UAE Philippines Liechtenstein South Africa Honduras Russian Fed Singapore Luxembourg Tanzania Jamaica Slovak Rep South Korea Malta Trinidad & Tobago Mexico Slovenia Sri Lanka Monaco Tunisia Panama Turkey Taiwan Netherlands Zambia Puerto Rico Ukraine Thailand Norway Zimbabwe St Lucia Vietnam Portugal Spain Sweden Switzerland

This appendix explains a method to infer the approximate portion of the total debt issues that is
accounted for by new issues. Let K be the total amount of currently outstanding debt that had t-
years to maturity at the time of issue. Let X be the rate of growth of debt due to new issues. We
assume that when a debt issue matures, a new debt issue used to rollover the old debt also has t-
years to maturity. Therefore, K/t of the new t-year debt is used to rollover maturing debt.1 We do
not have data on the amount of outstanding debt K. However, under our assumptions, we can
back out the amount of new debt issues from the amount of total debt issues. Specifically,
.11
Issuedebt maturity year - Total
.Issuedebt maturity year Total
/XttXK
tKXKt
+=⇒
+=−
We can use this expression to compute the amount of new debt issues depending on our
assumptions about the growth rate X.
Appendix III
Debt Adjustment Factors

Appendix IV
Computation of Standard Errors
The regression specifications in this paper involve overlapping observations since the sampling
frequency is monthly while the forecasting period is annual. This overlap will induce serial correlation
and although it will not cause bias to ordinary least squares estimates, the covariance matrix will need
appropriate modification. To avoid losing observations from non-overlapping intervals, we follow the
procedures outlined in Hansen and Hodrick (1980) to adjust the covariance matrix for the induced serial
correlation. Consider the following time series regression:
ttt e issuesequity b a R12 +⋅+=
The dependent variable in the above equation is the return on the equity index over the next 12 months.
Since we sample the exogenous variable equity issues each month, the observations of the dependent
variable clearly overlap each other by 11 months. Following Hansen and Hodrick (1980), we estimate
the above equation using OLS and N monthly observations to obtain the vector of coefficient estimates
and the vector or residuals. We then use the vector of residuals to construct an NxN symmetric matrix Ω
whose elements are entries.other allfor 0 and ;0,...,12j-i allfor ˆˆ11
, ∑+−=
−− ==N
jitjittji ee
Nω
After constructing Ω, we obtain the finite sample covariance matrix as:
11 )()( −− ′Ω′′ NNNNNNN XXXXXXN