world precious minerals fund global resources fund (pspfx)world precious minerals fund 7900...
TRANSCRIPT

World Precious Minerals Fund
7900 Callaghan Road San Antonio, TX 78229-2327 1-800-US-FUNDS (1-800-873-8637) www.usfunds.com [email protected]
UG-FACT-PSPFX
Global Resources Fund (PSPFX)
Symbol: PSPFX CUSIP: 911476-20-8 Inception Date: 08/03/1983
Institutional Class Symbol: PIPFX CUSIP: 911476-81-0 Inception Date: 03/01/2010
Lipper Category: Global Natural Resources
About the FundThe Global Resources Fund takes a broad approach to the natural resources sector by investing in energy and basic materials. The fund invests in companies involved in the exploration, production and processing of petroleum, natural gas, coal, alternative energies, chemicals, mining, iron and steel, and paper and forest products, and can invest in any part of the world.
Fund ObjectiveThe Global Resources Fund seeks long-term growth of capital while providing protection against inflation and monetary instability.
Fund StrategyUnder normal market conditions, the Global Resources Fund invests at least 80 percent of its net assets in the common stock, preferred stock, convertible securities, rights and warrants, and depository receipts of companies involved in the natural resources industries. The fund may invest without limitation in any of the various natural resources industries.
Portfolio TeamFrank Holmes, Chief Investment Officer Years of Experience: 30+Brian K. Hicks, CFA Years of Experience: 23
Expense ratios as stated in the most recent prospectus. For the Institutional Class shares, the expense ratio after waivers is a voluntary arrangement pursuant to which U.S. Global Investors, Inc. has agreed to waive all class-specific expenses. Each expense waiver is exclusive of performance fees, acquired fund fees and expenses, extraordinary expenses, taxes, brokerage commissions and interest. U.S. Global Investors, Inc. can modify or terminate the voluntary limits at any time, which may lower a fund’s yield or return. Performance data quoted above is historical. Past performance is no guarantee of future results. Results reflect the reinvestment of dividends and other earnings. For a portion of periods, the fund had expense limitations, without which returns would have been lower. Current performance may be higher or lower than the performance data quoted. The principal value and investment return of an investment will fluctuate so that your shares, when redeemed, may be worth more or less than their original cost. Performance does not include the effect of any direct fees described in the fund’s prospectus (e.g., short-term trading fees of 0.05%) which, if applicable, would lower your total returns. Performance quoted for periods of one year or less is cumulative and not annualized. Obtain performance data current to the most recent month-end at www.usfunds.com or 1-800-US-FUNDS. Since Inception *(08/03/1983), **(03/01/2010).
Because Morgan Stanley discontinued its Morgan Stanley Commodity Related Index (CRX) on July 4, 2014, the fund’s benchmark is now a blend of the CRX and the S&P Global Natural Resources Index (Net Total Return), using the performance of the CRX through June 30, 2014, and the performance of the S&P Global Natural Resources Index (Net Total Return) after June 30, 2014. As each month passes, a month of the CRX performance will roll off and a month of the S&P Global Natural Resources Index (Net Total Return) will be added until the fund’s performance eventually will be compared exclusively to the S&P Global Natural Resources Index (Net Total Return) for determining the fund’s monthly performance fee adjustment.
The chart illustrates the performance of a hypothetical $10,000 investment made in the fund during the depicted time frame, compared to its benchmark index. Figures include reinvestment of capital gains and dividends, but the performance does not include the effect of any direct fees described in the fund’s prospectus (e.g., short-term trading fees) which, if applicable, would lower your total returns.
Growth of $10,000 from 06/30/2004 to 06/30/2014
$10,000
$15,000
$20,000
$25,000
$30,000
$35,000
$40,000
Jun-14 Jun-12 Jun-10 Jun-08 Jun-06 Jun-04
$27,878
$34,081
Global Resources Fund (PSPFX) Morgan Stanley Commodity Related Index
Potential Risk/Reward
Low High
Risk Measures & Statistics (3-Year)Sharpe Ratio -0.03
Alpha vs. Benchmark -0.06
Beta vs. Benchmark 0.96
R-squared vs. Benchmark 92.88
Standard Deviation 20.35%
Benchmark Standard Deviation 18.86%
July 2014 Fund Fact Sheet
ReturnsAverage Annual Expense Ratio
1 MonthYear to
Date 1-year 3-year 5-year 10-yearSince
Inception GrossAfter
Waivers
Global Resources Fund (as of 06/30/2014) 5.93% 10.68% 19.80% -0.89% 12.06% 11.01% 5.67% 1.59% n/a
Global Resources Fund Inst. Class (as of 06/30/2014) 5.95% 11.08% 20.56% -0.30% n/a n/a 7.17% 1.25% 1.06%
Morgan Stanley Commodity Related Equity Index (as of 06/30/2014)
6.33% 15.15% 32.36% 3.53% 13.94% 13.05% n/a n/a n/a
Global Resources Fund (as of 07/31/2014) -4.25% 5.98% 11.96% -2.51% 9.06% 10.48% 5.51% 1.59% n/a
Global Resources Fund Inst. Class (as of 07/31/2014) -4.26% 6.34% 12.54% -1.96% N/A N/A 5.97% 1.25% 1.06%
S&P Global Natural Resources/Morgan Stanley Commodity Related Blended Index (as of 07/31/2014)
-1.18% 13.68% 25.67% 3.53% 11.67% 12.83% n/a n/a n/a
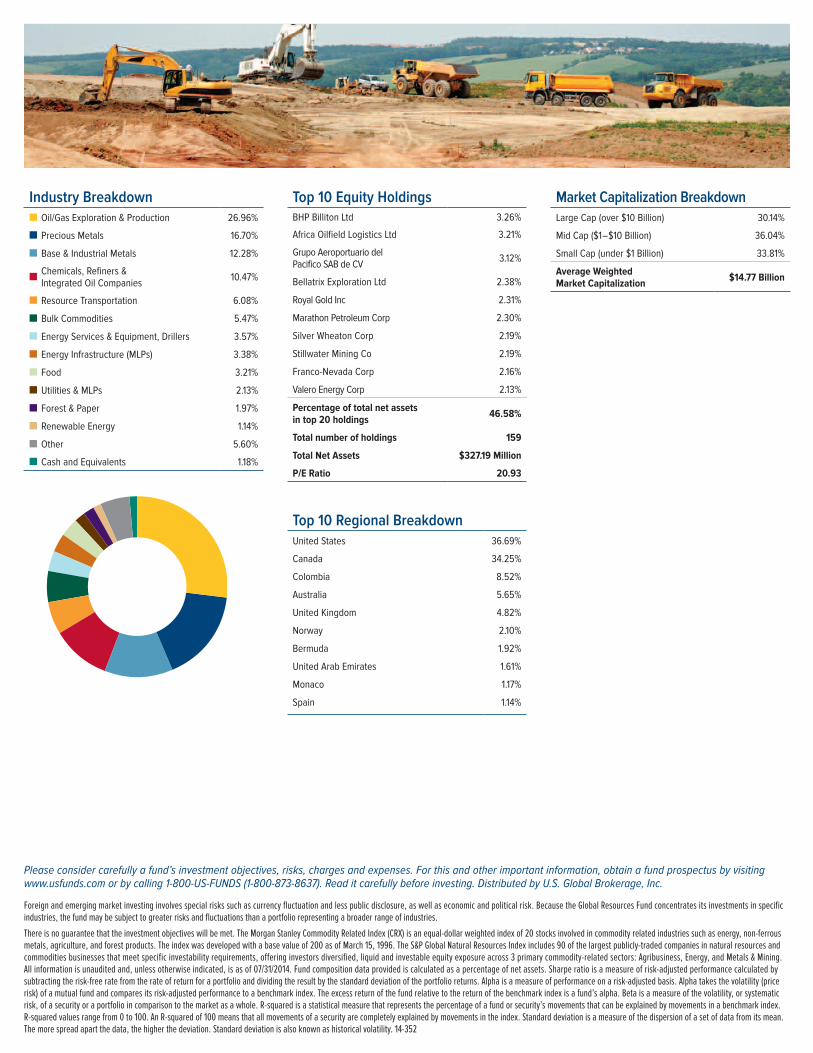
Top 10 Equity Holdings BHP Billiton Ltd 3.26%
Africa Oilfield Logistics Ltd 3.21%
Grupo Aeroportuario del Pacifico SAB de CV 3.12%
Bellatrix Exploration Ltd 2.38%
Royal Gold Inc 2.31%
Marathon Petroleum Corp 2.30%
Silver Wheaton Corp 2.19%
Stillwater Mining Co 2.19%
Franco-Nevada Corp 2.16%
Valero Energy Corp 2.13%
Percentage of total net assets in top 20 holdings 46.58%
Total number of holdings 159
Total Net Assets $327.19 Million
P/E Ratio 20.93
Industry Breakdown■ Oil/Gas Exploration & Production 26.96%
■ Precious Metals 16.70%
■ Base & Industrial Metals 12.28%
■Chemicals, Refiners & Integrated Oil Companies 10.47%
■ Resource Transportation 6.08%
■ Bulk Commodities 5.47%
■ Energy Services & Equipment, Drillers 3.57%
■ Energy Infrastructure (MLPs) 3.38%
■ Food 3.21%
■ Utilities & MLPs 2.13%
■ Forest & Paper 1.97%
■ Renewable Energy 1.14%
■ Other 5.60%
■ Cash and Equivalents 1.18%
Top 10 Regional BreakdownUnited States 36.69%
Canada 34.25%
Colombia 8.52%
Australia 5.65%
United Kingdom 4.82%
Norway 2.10%
Bermuda 1.92%
United Arab Emirates 1.61%
Monaco 1.17%
Spain 1.14%
Please consider carefully a fund’s investment objectives, risks, charges and expenses. For this and other important information, obtain a fund prospectus by visiting www.usfunds.com or by calling 1-800-US-FUNDS (1-800-873-8637). Read it carefully before investing. Distributed by U.S. Global Brokerage, Inc.
Foreign and emerging market investing involves special risks such as currency fluctuation and less public disclosure, as well as economic and political risk. Because the Global Resources Fund concentrates its investments in specific industries, the fund may be subject to greater risks and fluctuations than a portfolio representing a broader range of industries.
There is no guarantee that the investment objectives will be met. The Morgan Stanley Commodity Related Index (CRX) is an equal-dollar weighted index of 20 stocks involved in commodity related industries such as energy, non-ferrous metals, agriculture, and forest products. The index was developed with a base value of 200 as of March 15, 1996. The S&P Global Natural Resources Index includes 90 of the largest publicly-traded companies in natural resources and commodities businesses that meet specific investability requirements, offering investors diversified, liquid and investable equity exposure across 3 primary commodity-related sectors: Agribusiness, Energy, and Metals & Mining. All information is unaudited and, unless otherwise indicated, is as of 07/31/2014. Fund composition data provided is calculated as a percentage of net assets. Sharpe ratio is a measure of risk-adjusted performance calculated by subtracting the risk-free rate from the rate of return for a portfolio and dividing the result by the standard deviation of the portfolio returns. Alpha is a measure of performance on a risk-adjusted basis. Alpha takes the volatility (price risk) of a mutual fund and compares its risk-adjusted performance to a benchmark index. The excess return of the fund relative to the return of the benchmark index is a fund’s alpha. Beta is a measure of the volatility, or systematic risk, of a security or a portfolio in comparison to the market as a whole. R-squared is a statistical measure that represents the percentage of a fund or security’s movements that can be explained by movements in a benchmark index. R-squared values range from 0 to 100. An R-squared of 100 means that all movements of a security are completely explained by movements in the index. Standard deviation is a measure of the dispersion of a set of data from its mean. The more spread apart the data, the higher the deviation. Standard deviation is also known as historical volatility. 14-352
Market Capitalization BreakdownLarge Cap (over $10 Billion) 30.14%
Mid Cap ($1 – $10 Billion) 36.04%
Small Cap (under $1 Billion) 33.81%
Average Weighted Market Capitalization $14.77 Billion