world trade developments in 2001 and prospects for … trade developments in 2001 and prospects for...
TRANSCRIPT
Wor
ld Tr
ade
Deve
lopm
ents
in 2
001
and
Pros
pect
s fo
r 200
2
1
1. Main Features
The year 2001 witnessed an unexpectedly sharp downturn inthe expansion of global output and a decline in world trade.World GDP, which in the preceding year recorded its highestannual growth rate in more than a decade, edged up by about1.5%. World trade decreased by 1.5% after expanding 11% inthe preceding year. For the first time since 1982 world tradegrowth was negative. The slump in global output growth can beattributed to a decline in the major industrial country marketsand the East Asian economies with a high share of IT industriesin their total output.
Setting the recent slowdown into an historic perspective, itcan be shown that the three previous downturns in globaleconomic activity since 1970 have been more pronounced thanin 2001, as in each case global population growth exceededglobal output growth, a development that was not observed in2001.1
Governments and central banks in the major economiessucceeded in attenuating the repercussions of slack investmentand consumption and to cushion the impact of the shock ofSeptember 11 on the business and consumer confidence. Theweakness in global economic activity was not triggered by atightening of monetary policy (as in 1981) nor by restrictive fiscalpolicies in industrial countries.2
Between 2000 and 2001, the general government fiscalbalances of industrial countries recorded either a decliningsurplus (e.g. US and UK), a shift from surplus to deficit (e.g. Euroarea) or the maintenance of a large deficit (e.g. Japan).3
Although the rate of expansion of private consumption in theindustrial countries weakened under the impact of lower incomegrowth and marginally higher personal savings rates, at 2.2% itremained stronger than overall demand growth.
There was a marked contrast between the moderateslowdown in the expansion of private and public consumption inthe industrial countries and the contraction of investment in2001. Fixed investment, which was a motor of economic growthin the second half of the 1990’s, contributed significantly toweakness in global economic activities. There was a noteworthydifference in the investment decline among the industrialregions. In North America the decrease was focussed on non-residential investment while residential investment continued togrow. In the EU and Japan, however, the marked decline ofresidential investment contrasted with the stagnation of non-residential investment.
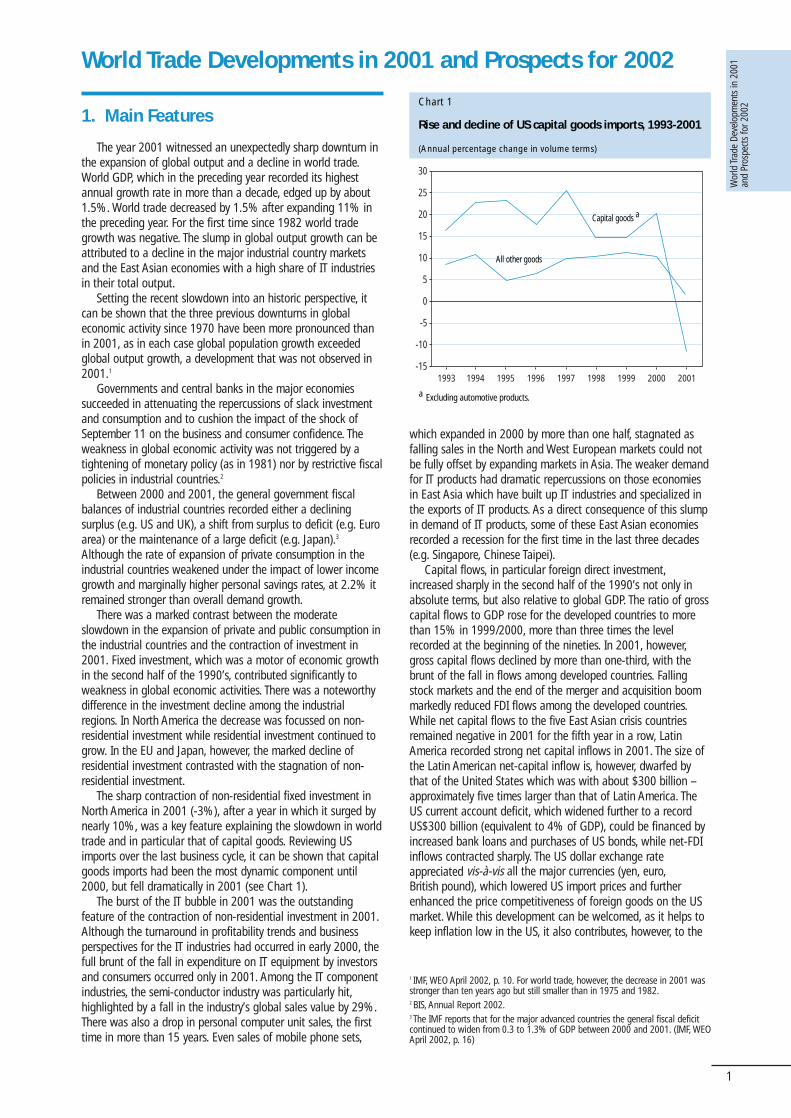
The sharp contraction of non-residential fixed investment inNorth America in 2001 (-3%), after a year in which it surged bynearly 10%, was a key feature explaining the slowdown in worldtrade and in particular that of capital goods. Reviewing USimports over the last business cycle, it can be shown that capitalgoods imports had been the most dynamic component until2000, but fell dramatically in 2001 (see Chart 1).
The burst of the IT bubble in 2001 was the outstandingfeature of the contraction of non-residential investment in 2001.Although the turnaround in profitability trends and businessperspectives for the IT industries had occurred in early 2000, thefull brunt of the fall in expenditure on IT equipment by investorsand consumers occurred only in 2001. Among the IT componentindustries, the semi-conductor industry was particularly hit,highlighted by a fall in the industry’s global sales value by 29%.There was also a drop in personal computer unit sales, the firsttime in more than 15 years. Even sales of mobile phone sets,
which expanded in 2000 by more than one half, stagnated asfalling sales in the North and West European markets could notbe fully offset by expanding markets in Asia. The weaker demandfor IT products had dramatic repercussions on those economiesin East Asia which have built up IT industries and specialized inthe exports of IT products. As a direct consequence of this slumpin demand of IT products, some of these East Asian economiesrecorded a recession for the first time in the last three decades(e.g. Singapore, Chinese Taipei).
Capital flows, in particular foreign direct investment,increased sharply in the second half of the 1990’s not only inabsolute terms, but also relative to global GDP. The ratio of grosscapital flows to GDP rose for the developed countries to morethan 15% in 1999/2000, more than three times the levelrecorded at the beginning of the nineties. In 2001, however,gross capital flows declined by more than one-third, with thebrunt of the fall in flows among developed countries. Fallingstock markets and the end of the merger and acquisition boommarkedly reduced FDI flows among the developed countries.While net capital flows to the five East Asian crisis countriesremained negative in 2001 for the fifth year in a row, LatinAmerica recorded strong net capital inflows in 2001. The size ofthe Latin American net-capital inflow is, however, dwarfed bythat of the United States which was with about $300 billion –approximately five times larger than that of Latin America. TheUS current account deficit, which widened further to a recordUS$300 billion (equivalent to 4% of GDP), could be financed byincreased bank loans and purchases of US bonds, while net-FDIinflows contracted sharply. The US dollar exchange rateappreciated vis-à-vis all the major currencies (yen, euro,British pound), which lowered US import prices and furtherenhanced the price competitiveness of foreign goods on the USmarket. While this development can be welcomed, as it helps tokeep inflation low in the US, it also contributes, however, to the
World Trade Developments in 2001 and Prospects for 2002
Chart 1
Rise and decline of US capital goods imports, 1993-2001
(Annual percentage change in volume terms)
a Excluding automotive products.
200120001999199819971996199519941993
Capital goods a
-15
-10
-5
0
5
10
15
20
25
30
All other goods
1 IMF, WEO April 2002, p. 10. For world trade, however, the decrease in 2001 wasstronger than ten years ago but still smaller than in 1975 and 1982.2 BIS, Annual Report 2002.3 The IMF reports that for the major advanced countries the general fiscal deficitcontinued to widen from 0.3 to 1.3% of GDP between 2000 and 2001. (IMF, WEOApril 2002, p. 16)
Wor
ld Tr
ade
Deve
lopm
ents
in 2
001
and
Pros
pect
s fo
r 200
2
2
rising US current account deficit. The large and increasing UScurrent account deficit is only sustainable as long as the very lowUS savings rate is balanced by the willingness of foreigninvestors to continue to buy assets in the US in the form ofbonds and stocks, and accumulate the dollar holdings in theirforeign exchange reserves. In this situation there are two majorrisks. First, a rapid rise in US savings rates to levels prevailingthroughout the 1980’s would steeply cut imports and exert acontractionary force on world trade. After all US merchandiseimports account for one-fifth of world trade and for more thanone quarter of developing countries’ exports. Another riskassociated with the present rise of the US current account deficitwould be a change in investors’ attitudes vis-à-vis holding dollarassets. If central banks no longer increase their dollar foreignexchange holdings as much as in recent years and privateinvestors and banks reduce their net purchases of US stocks andbonds, the US dollar exchange rate would be adversely affectedand an abrupt change could contribute to an increased instabilityof exchange rates.
Global price inflation decreased further in 2001. Lower oilprices and a further decrease of non-fuel commodity pricescontributed to this development. Prices for internationally tradedmanufactured goods decreased as much as non-fuel commodityprices partly due to sluggish demand in North America, WesternEurope and East Asia (excluding China).
The immediate economic repercussions of the tragic events ofSeptember 11 in the US on the global economy could beobserved in the shock wave sent to the global stock markets, asbusiness and consumer confidence took a severe blow. Businessactivity in and with the United States was affected by thedisruptions to transportation of passengers and merchandise,above all at the US border. The direct costs of the economicdamages for the insurance sector have been estimated between30 and 58 billion dollars.4 The medium and longer termrepercussions of the terrorist attacks on international trade flowsare uncertain in their magnitude but differ significantly by sectorand by region. The insurance industry, air transportation andaeronautics, and tourism, are among the sectors most affected.Trade flows to and from the countries and regions perceived tobe linked closely to the events of September 11 are expected tobe more affected than trade flows among regions more distantfrom the events. The longer-term consequences of additionalsecurity investments at airports and harbours and higherinsurance premiums are bound to increase transaction costs ininternational trade. In the weeks after the terrorist attacks, someobservers estimated “that the tighter border inspections couldadd some one to three percentage points” to transaction coststhrough the cost of time delays, paperwork, and compliancerelated to border crossing for North American trade flows.5 Theactual development of insurance premiums and transportationcosts since September 2001 has shown that these initialestimates were too pessimistic, even for North American trade.For world trade the repercussions are in general even smallerthan for trade flows to and from the United States. However,there is no doubt that some products and sectors and certainorigins could be severely affected by an increase in transactioncosts. Products with high transportation costs (e.g. airtransported fresh fruits or cut flowers), tourism depending onlong haul air transport, especially in regions associated with theconflict, and products originating from regions with a perceivedsecurity problem are most likely to experience increased costsand suffer from reduced demand growth. If, contrary to currentexpectations, international transaction costs increase in asignificant way one would also see an overall structural changetowards a lower income elasticity of international trade – inother words, a slowdown in the globalization process.6
2. Global merchandise output andtrade volume developments by sector
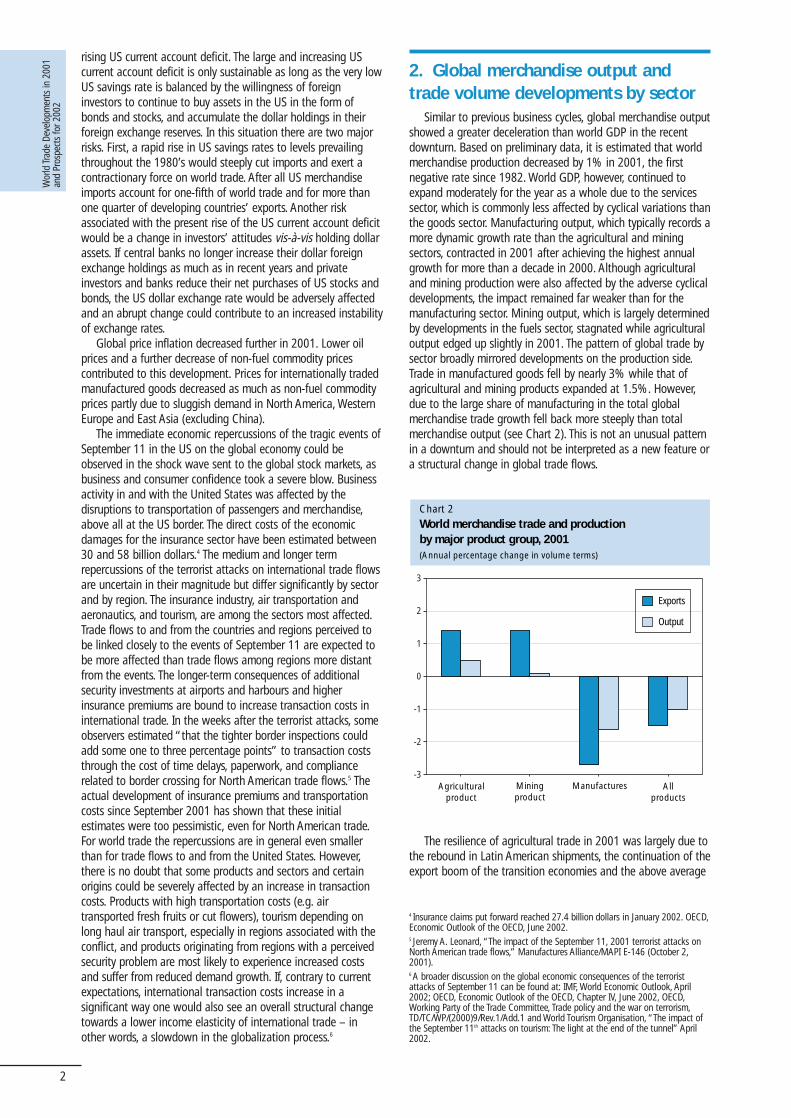
Similar to previous business cycles, global merchandise outputshowed a greater deceleration than world GDP in the recentdownturn. Based on preliminary data, it is estimated that worldmerchandise production decreased by 1% in 2001, the firstnegative rate since 1982. World GDP, however, continued toexpand moderately for the year as a whole due to the servicessector, which is commonly less affected by cyclical variations thanthe goods sector. Manufacturing output, which typically records amore dynamic growth rate than the agricultural and miningsectors, contracted in 2001 after achieving the highest annualgrowth for more than a decade in 2000. Although agriculturaland mining production were also affected by the adverse cyclicaldevelopments, the impact remained far weaker than for themanufacturing sector. Mining output, which is largely determinedby developments in the fuels sector, stagnated while agriculturaloutput edged up slightly in 2001. The pattern of global trade bysector broadly mirrored developments on the production side.Trade in manufactured goods fell by nearly 3% while that ofagricultural and mining products expanded at 1.5%. However,due to the large share of manufacturing in the total globalmerchandise trade growth fell back more steeply than totalmerchandise output (see Chart 2). This is not an unusual patternin a downturn and should not be interpreted as a new feature ora structural change in global trade flows.
ManufacturesAgriculturalproduct
Miningproduct
Allproducts
Chart 2World merchandise trade and productionby major product group, 2001(Annual percentage change in volume terms)
-3
-2
-1
0
1
2
3
Exports
Output
4 Insurance claims put forward reached 27.4 billion dollars in January 2002. OECD,Economic Outlook of the OECD, June 2002.5 Jeremy A. Leonard, “The impact of the September 11, 2001 terrorist attacks onNorth American trade flows,” Manufactures Alliance/MAPI E-146 (October 2,2001).6 A broader discussion on the global economic consequences of the terroristattacks of September 11 can be found at: IMF, World Economic Outlook, April2002; OECD, Economic Outlook of the OECD, Chapter IV, June 2002, OECD,Working Party of the Trade Committee, Trade policy and the war on terrorism,TD/TC/WP/(2000)9/Rev.1/Add.1 and World Tourism Organisation, “The impact ofthe September 11th attacks on tourism: The light at the end of the tunnel” April2002.
The resilience of agricultural trade in 2001 was largely due tothe rebound in Latin American shipments, the continuation of theexport boom of the transition economies and the above average
Wor
ld Tr
ade
Deve
lopm
ents
in 2
001
and
Pros
pect
s fo
r 200
2
3
growth in Asian exports. North America’s exports decreasedslightly and West European exports were reduced by nearly 2%under the impact of various animal diseases, which loweredWest European livestock production and caused widespreadconsumer concerns about food safety, eventually leading to a fallin meat consumption.
The transition economies remained the most dynamicexporter of mining products for the second year in a row. Thetwo leading net exporters in this product category, theMiddle East and Africa, expanded their shipments somewhatfaster than the global average. The three net importing regionsreported moderate export growth (Western Europe), stagnation(Asia) and contraction (North America) of their exports of miningproducts in volume terms.
The contraction of world exports of manufactures in 2001was quite uneven among the four leading exporting regions.While the manufactured goods exports of Asia andNorth America contracted by more than 5%, those ofWestern Europe and Latin America stagnated or decreasedmarginally. An outstanding feature in manufacturing trade wasthe double digit increase of manufactures exports from thetransition economies in a year when global trade inmanufactured goods contracted.
3. Trade value developments byproduct and region
The severity of the downturn in world trade values was evenmore pronounced than in volume terms, as dollar prices ofinternationally traded goods decreased in 2001. Merchandiseexports recorded a decrease of 4.5 percent, the steepest declinein more than a decade, contrasting sharply with the 6.5 percentaverage expansion recorded in the 1990s. Commercial servicesexports, which expanded at the same rate as merchandise tradebetween 1990 and 2000, declined marginally in 2001. This wasthe first decrease in world exports of commercial services since1983 (see Table 1).
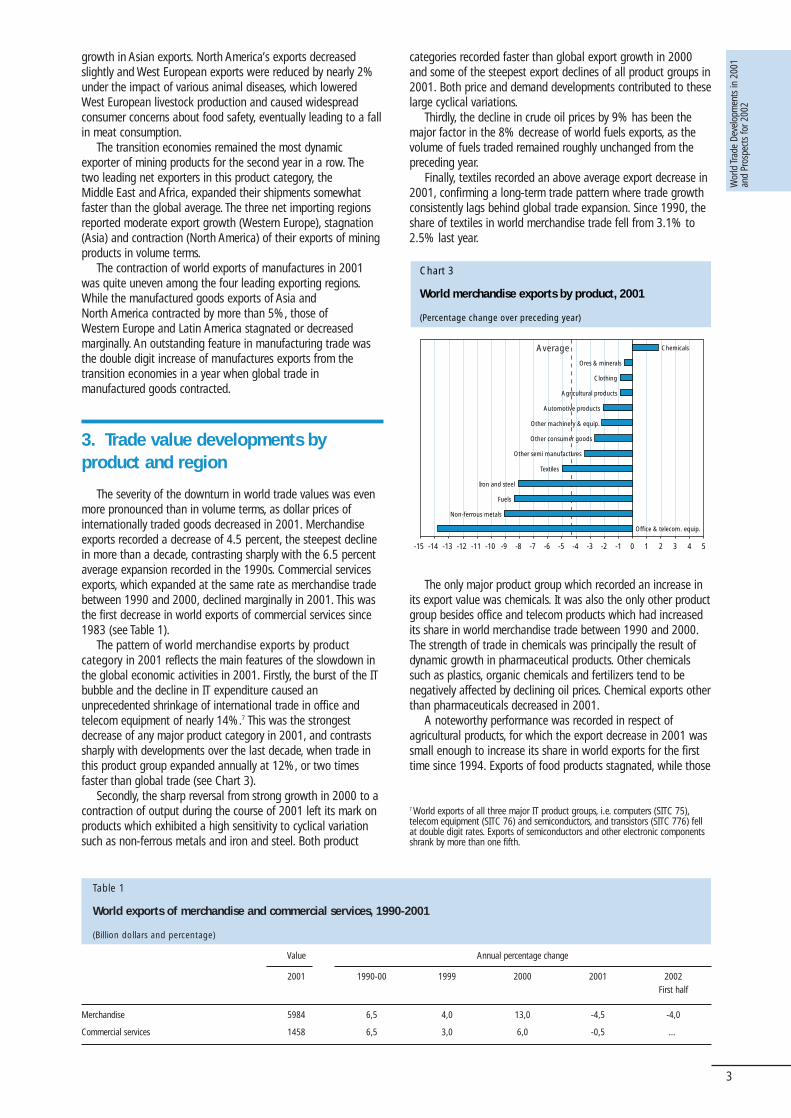
The pattern of world merchandise exports by productcategory in 2001 reflects the main features of the slowdown inthe global economic activities in 2001. Firstly, the burst of the ITbubble and the decline in IT expenditure caused anunprecedented shrinkage of international trade in office andtelecom equipment of nearly 14%.7 This was the strongestdecrease of any major product category in 2001, and contrastssharply with developments over the last decade, when trade inthis product group expanded annually at 12%, or two timesfaster than global trade (see Chart 3).
Secondly, the sharp reversal from strong growth in 2000 to acontraction of output during the course of 2001 left its mark onproducts which exhibited a high sensitivity to cyclical variationsuch as non-ferrous metals and iron and steel. Both product
categories recorded faster than global export growth in 2000and some of the steepest export declines of all product groups in2001. Both price and demand developments contributed to theselarge cyclical variations.
Thirdly, the decline in crude oil prices by 9% has been themajor factor in the 8% decrease of world fuels exports, as thevolume of fuels traded remained roughly unchanged from thepreceding year.
Finally, textiles recorded an above average export decrease in2001, confirming a long-term trade pattern where trade growthconsistently lags behind global trade expansion. Since 1990, theshare of textiles in world merchandise trade fell from 3.1% to2.5% last year.
Table 1
World exports of merchandise and commercial services, 1990-2001
(Billion dollars and percentage)
Merchandise 5984 6,5 4,0 13,0 -4,5 -4,0
Commercial services 1458 6,5 3,0 6,0 -0,5 …
Value Annual percentage change
2001 1990-00 1999 2000 2001 2002First half
Chart 3
World merchandise exports by product, 2001
(Percentage change over preceding year)
-15 -14 -13 -12 -11 -10 -9 -8 -7 -6 -5 -4 -3 -2 -1 0 1 2 3 4 5
Non-ferrous metals
Fuels
Iron and steel
Textiles
Other semi manufactures
Other consumer goods
Automotive products
Agricultural products
Clothing
Ores & minerals
Chemicals
Other machinery & equip.
Office & telecom. equip.
Average
The only major product group which recorded an increase inits export value was chemicals. It was also the only other productgroup besides office and telecom products which had increasedits share in world merchandise trade between 1990 and 2000.The strength of trade in chemicals was principally the result ofdynamic growth in pharmaceutical products. Other chemicalssuch as plastics, organic chemicals and fertilizers tend to benegatively affected by declining oil prices. Chemical exports otherthan pharmaceuticals decreased in 2001.
A noteworthy performance was recorded in respect ofagricultural products, for which the export decrease in 2001 wassmall enough to increase its share in world exports for the firsttime since 1994. Exports of food products stagnated, while those
7 World exports of all three major IT product groups, i.e. computers (SITC 75),telecom equipment (SITC 76) and semiconductors, and transistors (SITC 776) fellat double digit rates. Exports of semiconductors and other electronic componentsshrank by more than one fifth.
Wor
ld Tr
ade
Deve
lopm
ents
in 2
001
and
Pros
pect
s fo
r 200
2
4
of agricultural raw materials decreased by 8% under the impactof weak prices.
As regards the three major categories of commercial servicestrade, annual variations remained in a narrow range and allcategories were similarly affected by the contraction of commercialservices trade in the course of 2001. The September 11 events lefta clearly distinguishable but still moderate impact, in particular onglobal receipts from air transportation, travel and other commercialservices (see Table IV.2).
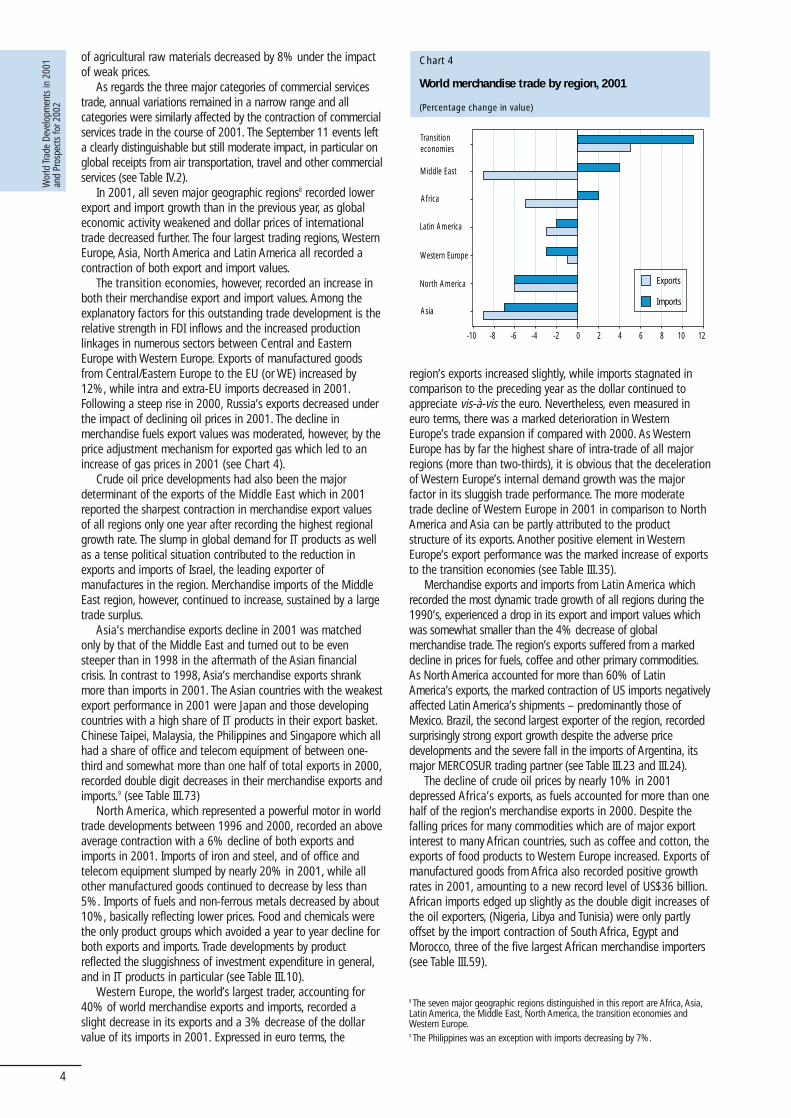
In 2001, all seven major geographic regions8 recorded lowerexport and import growth than in the previous year, as globaleconomic activity weakened and dollar prices of internationaltrade decreased further. The four largest trading regions, WesternEurope, Asia, North America and Latin America all recorded acontraction of both export and import values.
The transition economies, however, recorded an increase inboth their merchandise export and import values. Among theexplanatory factors for this outstanding trade development is therelative strength in FDI inflows and the increased productionlinkages in numerous sectors between Central and EasternEurope with Western Europe. Exports of manufactured goodsfrom Central/Eastern Europe to the EU (or WE) increased by12%, while intra and extra-EU imports decreased in 2001.Following a steep rise in 2000, Russia’s exports decreased underthe impact of declining oil prices in 2001. The decline inmerchandise fuels export values was moderated, however, by theprice adjustment mechanism for exported gas which led to anincrease of gas prices in 2001 (see Chart 4).
Crude oil price developments had also been the majordeterminant of the exports of the Middle East which in 2001reported the sharpest contraction in merchandise export valuesof all regions only one year after recording the highest regionalgrowth rate. The slump in global demand for IT products as wellas a tense political situation contributed to the reduction inexports and imports of Israel, the leading exporter ofmanufactures in the region. Merchandise imports of the MiddleEast region, however, continued to increase, sustained by a largetrade surplus.
Asia’s merchandise exports decline in 2001 was matchedonly by that of the Middle East and turned out to be evensteeper than in 1998 in the aftermath of the Asian financialcrisis. In contrast to 1998, Asia’s merchandise exports shrankmore than imports in 2001. The Asian countries with the weakestexport performance in 2001 were Japan and those developingcountries with a high share of IT products in their export basket.Chinese Taipei, Malaysia, the Philippines and Singapore which allhad a share of office and telecom equipment of between one-third and somewhat more than one half of total exports in 2000,recorded double digit decreases in their merchandise exports andimports.9 (see Table III.73)
North America, which represented a powerful motor in worldtrade developments between 1996 and 2000, recorded an aboveaverage contraction with a 6% decline of both exports andimports in 2001. Imports of iron and steel, and of office andtelecom equipment slumped by nearly 20% in 2001, while allother manufactured goods continued to decrease by less than5%. Imports of fuels and non-ferrous metals decreased by about10%, basically reflecting lower prices. Food and chemicals werethe only product groups which avoided a year to year decline forboth exports and imports. Trade developments by productreflected the sluggishness of investment expenditure in general,and in IT products in particular (see Table III.10).
Western Europe, the world’s largest trader, accounting for40% of world merchandise exports and imports, recorded aslight decrease in its exports and a 3% decrease of the dollarvalue of its imports in 2001. Expressed in euro terms, the
region’s exports increased slightly, while imports stagnated incomparison to the preceding year as the dollar continued toappreciate vis-à-vis the euro. Nevertheless, even measured ineuro terms, there was a marked deterioration in WesternEurope’s trade expansion if compared with 2000. As WesternEurope has by far the highest share of intra-trade of all majorregions (more than two-thirds), it is obvious that the decelerationof Western Europe’s internal demand growth was the majorfactor in its sluggish trade performance. The more moderatetrade decline of Western Europe in 2001 in comparison to NorthAmerica and Asia can be partly attributed to the productstructure of its exports. Another positive element in WesternEurope’s export performance was the marked increase of exportsto the transition economies (see Table III.35).
Merchandise exports and imports from Latin America whichrecorded the most dynamic trade growth of all regions during the1990’s, experienced a drop in its export and import values whichwas somewhat smaller than the 4% decrease of globalmerchandise trade. The region’s exports suffered from a markeddecline in prices for fuels, coffee and other primary commodities.As North America accounted for more than 60% of LatinAmerica’s exports, the marked contraction of US imports negativelyaffected Latin America’s shipments – predominantly those ofMexico. Brazil, the second largest exporter of the region, recordedsurprisingly strong export growth despite the adverse pricedevelopments and the severe fall in the imports of Argentina, itsmajor MERCOSUR trading partner (see Table III.23 and III.24).
The decline of crude oil prices by nearly 10% in 2001depressed Africa’s exports, as fuels accounted for more than onehalf of the region’s merchandise exports in 2000. Despite thefalling prices for many commodities which are of major exportinterest to many African countries, such as coffee and cotton, theexports of food products to Western Europe increased. Exports ofmanufactured goods from Africa also recorded positive growthrates in 2001, amounting to a new record level of US$36 billion.African imports edged up slightly as the double digit increases ofthe oil exporters, (Nigeria, Libya and Tunisia) were only partlyoffset by the import contraction of South Africa, Egypt andMorocco, three of the five largest African merchandise importers(see Table III.59).
Chart 4
World merchandise trade by region, 2001
(Percentage change in value)
Transitioneconomies
Middle East
Africa
Latin America
Western Europe
North America
Asia
-10 -8 -6 -4 -2 0 2 4 6 8 10 12
Exports
Imports
8 The seven major geographic regions distinguished in this report are Africa, Asia,Latin America, the Middle East, North America, the transition economies andWestern Europe.9 The Philippines was an exception with imports decreasing by 7%.
Wor
ld Tr
ade
Deve
lopm
ents
in 2
001
and
Pros
pect
s fo
r 200
2
5
World commercial services trade stagnated in 2001 afterrecording an expansion of 6% in 2000. The sharp deceleration inworld services trade must be attributed largely to tradedevelopments in Asia and North America, although Latin Americaand the Middle East also experienced a stagnation or decline intheir trade. The origin of this notable reversal in commercialservices trade can be found in the developments in the UnitedStates’s commercial services imports, which decreased by 7% in2001 after an expansion of 16% in the preceding year. Allservices categories were affected, but travel expendituresdecreased most (-8%). North America’s total services exportsdecreased far less than its imports in 2001, although thecontraction of the region’s transport and travel receipts wassomewhat larger than the corresponding expenditure. Thedivergent developments in respect of total commercial servicestrade is to be attributed to trade in the “other commercialservices category” which recorded higher receipts but lowerexpenditure. This larger decrease of other commercial servicescan be explained to a large extent by the insurance paymentsassociated with the economic losses caused by the events ofSeptember 11 (see Table III.4 and III.5).
Insurance claims for damages on foreign insurers are bookedas reductions in insurance expenditure (premium payments).Excluding the US$7.9 billion drop in US imports of insuranceservices would leave the overall decrease of North Americanservices imports in 2001 at 3%, the same rate as for its servicesexports.10
Asia’s contraction of commercial services imports was due toa fall in imports of transport and travel services (in the order of5%), which was only partly offset by a moderate increase inimports of other commercial services. Asia’s exports ofcommercial services by category differed markedly from those ofimports, as travel receipts continued to increase and otherservices exports stagnated. There was a considerable variationsin individual Asian countries’ services trade developments,although all major services traders recorded a deterioration intheir trade performance.
Differences in export performance were particularly largebetween the two largest commercial services traders in Asia,namely Japan and China. While the former experienced a 7%decline in both its exports and imports, China reported anincrease of 9% for both exports and imports.
Latin America’s commercial services exports expandedmuch faster than global trade in 2000, but decreased in 2001.Although the region’s transportation and travel receiptsdecreased slightly, the sharpest contraction was in exports of“other commercial services”. The decline of Mexican exports of“other commercial services” by one quarter in 2001 (or morethan one billion dollars) accounted for a 1.5% decrease of the
region’s exports. As regards Latin America’s services imports,travel expenditure decreased, transportation services stagnatedand imports of other commercial services continued to expand,though at a much lower rate than in preceding years.
Western Europe, the world’s largest services trader, recordeda marginal increase of its exports and imports in 2001. Travelreceipts decreased for the second year in a row whiletransportation and other commercial services recorded with asmall increase on a year-to-year basis. Differences in countryperformances continue to be quite large in the region. Denmark,Ireland and Norway reported a rather strong export and importgrowth in commercial services, while the United Kingdom theregion’s largest exporter reported a marked decrease in bothexports and imports (see Table III.40).
The transition economies’ commercial services traderecorded an outstanding performance, as both exports andimports continued to expand at double digit rates – almost amirror image of their exceptional merchandise tradeperformance. There was little variation among the threeservices categories, which all expanded at rates ranging from 9 to 15%.
4. Trade of developing and least-developed countries
In 2001, trade developments in developing countries wereshaped above all by lower demand in the industrial countriesand that of developing countries in Asia and Latin America. Thefall in crude oil prices as well as the contraction of trade in ITproducts had a large impact, as fuels and office and telecomequipment accounted for more than 40% of their merchandiseexports.
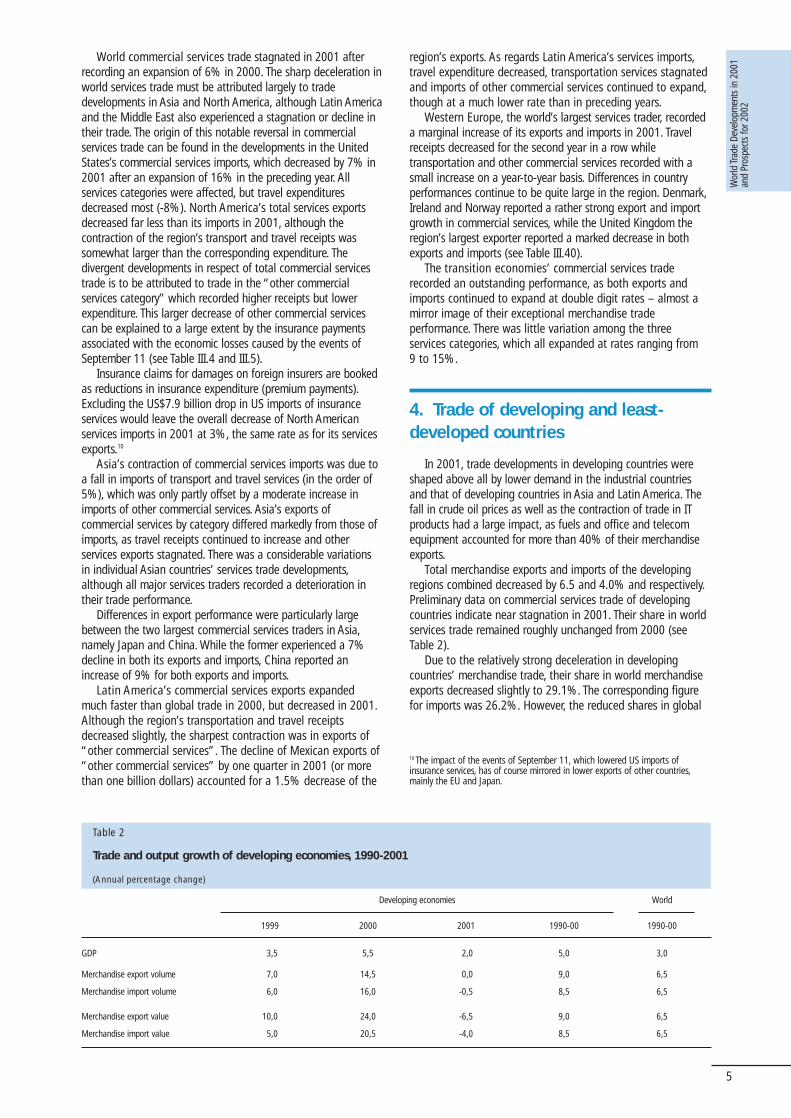
Total merchandise exports and imports of the developingregions combined decreased by 6.5 and 4.0% and respectively.Preliminary data on commercial services trade of developingcountries indicate near stagnation in 2001. Their share in worldservices trade remained roughly unchanged from 2000 (seeTable 2).
Due to the relatively strong deceleration in developingcountries’ merchandise trade, their share in world merchandiseexports decreased slightly to 29.1%. The corresponding figurefor imports was 26.2%. However, the reduced shares in global
Table 2
Trade and output growth of developing economies, 1990-2001
(Annual percentage change)
GDP 3,5 5,5 -2,0 5,0 3,0
Merchandise export volume 7,0 14,5 -0,0 9,0 6,5
Merchandise import volume 6,0 16,0 -0,5 8,5 6,5
Merchandise export value 10,0 24,0 -6,5 9,0 6,5
Merchandise import value 5,0 20,5 -4,0 8,5 6,5
Developing economies World
1999 2000 2001 1990-00 1990-00
10 The impact of the events of September 11, which lowered US imports ofinsurance services, has of course mirrored in lower exports of other countries,mainly the EU and Japan.
Wor
ld Tr
ade
Deve
lopm
ents
in 2
001
and
Pros
pect
s fo
r 200
2
6
merchandise exports and imports in 2001 were still six and five percentage points larger than those reported in 1990 (seeChart 5).
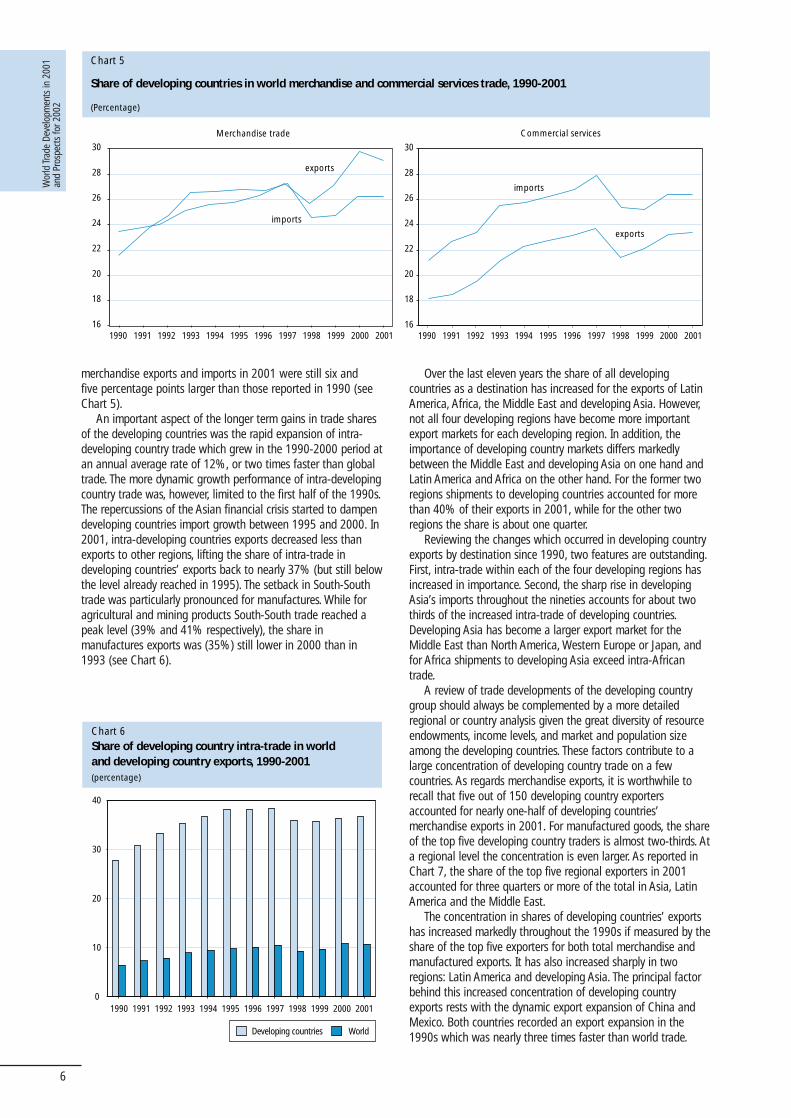
An important aspect of the longer term gains in trade sharesof the developing countries was the rapid expansion of intra-developing country trade which grew in the 1990-2000 period atan annual average rate of 12%, or two times faster than globaltrade. The more dynamic growth performance of intra-developingcountry trade was, however, limited to the first half of the 1990s.The repercussions of the Asian financial crisis started to dampendeveloping countries import growth between 1995 and 2000. In2001, intra-developing countries exports decreased less thanexports to other regions, lifting the share of intra-trade indeveloping countries’ exports back to nearly 37% (but still belowthe level already reached in 1995). The setback in South-Southtrade was particularly pronounced for manufactures. While foragricultural and mining products South-South trade reached apeak level (39% and 41% respectively), the share inmanufactures exports was (35%) still lower in 2000 than in1993 (see Chart 6).
Chart 5
Share of developing countries in world merchandise and commercial services trade, 1990-2001
(Percentage)
Merchandise trade Commercial services
16
18
20
22
24
26
28
30
imports
16
18
20
22
24
26
28
30
1990 1991 1992 1993 1994 1995 1996 1997 1998 1999 2000 2001
imports
exports
exports
1990 1991 1992 1993 1994 1995 1996 1997 1998 1999 2000 2001
Over the last eleven years the share of all developingcountries as a destination has increased for the exports of LatinAmerica, Africa, the Middle East and developing Asia. However,not all four developing regions have become more importantexport markets for each developing region. In addition, theimportance of developing country markets differs markedlybetween the Middle East and developing Asia on one hand andLatin America and Africa on the other hand. For the former tworegions shipments to developing countries accounted for morethan 40% of their exports in 2001, while for the other tworegions the share is about one quarter.
Reviewing the changes which occurred in developing countryexports by destination since 1990, two features are outstanding.First, intra-trade within each of the four developing regions hasincreased in importance. Second, the sharp rise in developingAsia’s imports throughout the nineties accounts for about twothirds of the increased intra-trade of developing countries.Developing Asia has become a larger export market for theMiddle East than North America, Western Europe or Japan, andfor Africa shipments to developing Asia exceed intra-Africantrade.
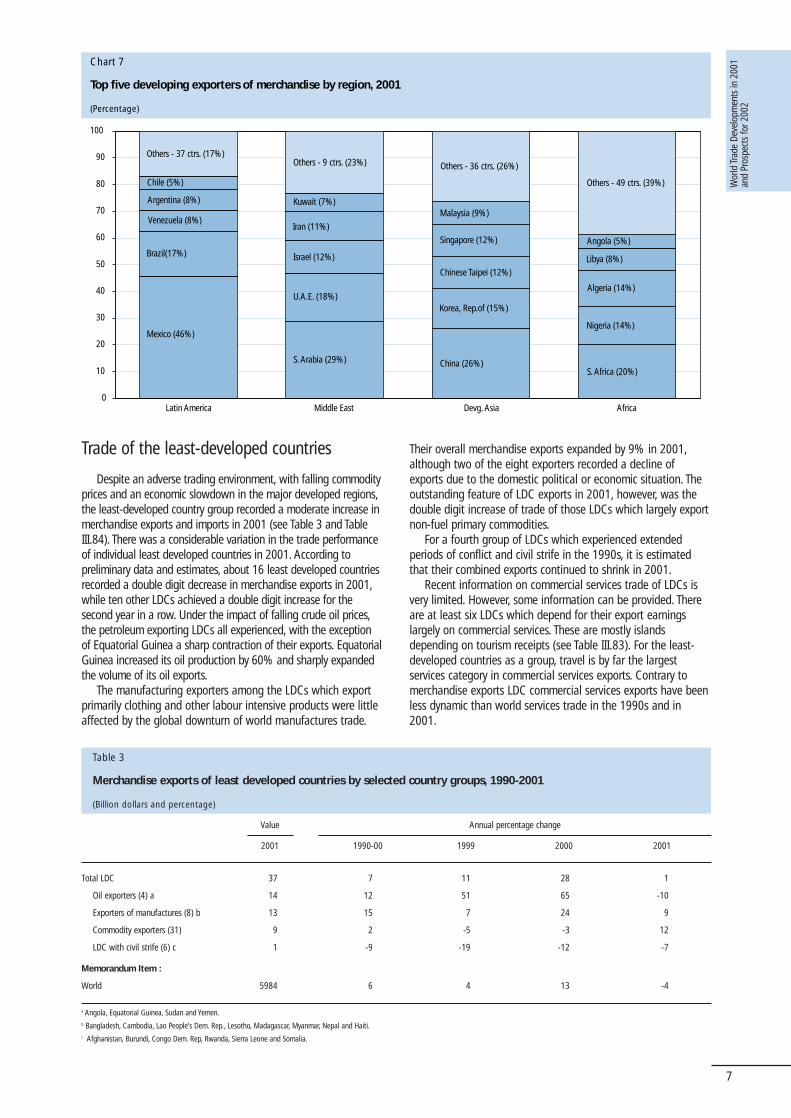
A review of trade developments of the developing countrygroup should always be complemented by a more detailedregional or country analysis given the great diversity of resourceendowments, income levels, and market and population sizeamong the developing countries. These factors contribute to alarge concentration of developing country trade on a fewcountries. As regards merchandise exports, it is worthwhile torecall that five out of 150 developing country exportersaccounted for nearly one-half of developing countries’merchandise exports in 2001. For manufactured goods, the shareof the top five developing country traders is almost two-thirds. Ata regional level the concentration is even larger. As reported inChart 7, the share of the top five regional exporters in 2001accounted for three quarters or more of the total in Asia, LatinAmerica and the Middle East.
The concentration in shares of developing countries’ exportshas increased markedly throughout the 1990s if measured by theshare of the top five exporters for both total merchandise andmanufactured exports. It has also increased sharply in tworegions: Latin America and developing Asia. The principal factorbehind this increased concentration of developing countryexports rests with the dynamic export expansion of China andMexico. Both countries recorded an export expansion in the1990s which was nearly three times faster than world trade.
Chart 6Share of developing country intra-trade in worldand developing country exports, 1990-2001(percentage)
0
10
20
30
40
1990 1991 1992 1993 1994 1995 1996 1997 1998 1999 2000 2001
Developing countries World
Wor
ld Tr
ade
Deve
lopm
ents
in 2
001
and
Pros
pect
s fo
r 200
2
7
Trade of the least-developed countries
Despite an adverse trading environment, with falling commodityprices and an economic slowdown in the major developed regions,the least-developed country group recorded a moderate increase inmerchandise exports and imports in 2001 (see Table 3 and TableIII.84). There was a considerable variation in the trade performanceof individual least developed countries in 2001. According topreliminary data and estimates, about 16 least developed countriesrecorded a double digit decrease in merchandise exports in 2001,while ten other LDCs achieved a double digit increase for thesecond year in a row. Under the impact of falling crude oil prices,the petroleum exporting LDCs all experienced, with the exceptionof Equatorial Guinea a sharp contraction of their exports. EquatorialGuinea increased its oil production by 60% and sharply expandedthe volume of its oil exports.
The manufacturing exporters among the LDCs which exportprimarily clothing and other labour intensive products were littleaffected by the global downturn of world manufactures trade.
Their overall merchandise exports expanded by 9% in 2001,although two of the eight exporters recorded a decline ofexports due to the domestic political or economic situation. Theoutstanding feature of LDC exports in 2001, however, was thedouble digit increase of trade of those LDCs which largely exportnon-fuel primary commodities.
For a fourth group of LDCs which experienced extendedperiods of conflict and civil strife in the 1990s, it is estimatedthat their combined exports continued to shrink in 2001.
Recent information on commercial services trade of LDCs isvery limited. However, some information can be provided. Thereare at least six LDCs which depend for their export earningslargely on commercial services. These are mostly islandsdepending on tourism receipts (see Table III.83). For the least-developed countries as a group, travel is by far the largestservices category in commercial services exports. Contrary tomerchandise exports LDC commercial services exports have beenless dynamic than world services trade in the 1990s and in2001.
Chart 7
Top five developing exporters of merchandise by region, 2001
(Percentage)
0
10
20
30
40
50
60
70
80
90
100
Latin America Middle East Devg. Asia Africa
Mexico (46%)
Brazil(17%)
Venezuela (8%)
Argentina (8%)
Chile (5%)
Others - 37 ctrs. (17%)
S. Africa (20%)
Nigeria (14%)
Algeria (14%)
Angola (5%)
Others - 49 ctrs. (39%)
Libya (8%)
S. Arabia (29%)
U.A.E. (18%)
Israel (12%)
Iran (11%)
Kuwait (7%)
Others - 9 ctrs. (23%)
China (26%)
Singapore (12%)
Korea, Rep.of (15%)
Chinese Taipei (12%)
Malaysia (9%)
Others - 36 ctrs. (26%)
Table 3
Merchandise exports of least developed countries by selected country groups, 1990-2001
(Billion dollars and percentage)
Total LDC 37 7 11 28 1
Oil exporters (4) a 14 12 51 65 -10
Exporters of manufactures (8) b 13 15 7 24 9
Commodity exporters (31) 9 2 -5 -3 12
LDC with civil strife (6) c 1 -9 -19 -12 -7
Memorandum Item :
World 5984 6 4 13 -4
Value Annual percentage change
2001 1990-00 1999 2000 2001
a Angola, Equatorial Guinea, Sudan and Yemen.b Bangladesh, Cambodia, Lao People’s Dem. Rep., Lesotho, Madagascar, Myanmar, Nepal and Haiti.c Afghanistan, Burundi, Congo Dem. Rep, Rwanda, Sierra Leone and Somalia.
Wor
ld Tr
ade
Deve
lopm
ents
in 2
001
and
Pros
pect
s fo
r 200
2
8
5. Merchandise trade development inmajor regional trade agreements
Regional trade agreements (RTAs) have become morenumerous in recent years. Their number has increased sharply inthe 1990s and by the end of 2001, 159 RTAs had been notifiedby WTO Members.11 It has been estimated that trade amongmembers of regional trade agreements represents 43% of worldmerchandise trade. In this estimate all types of regional tradeagreements are included: bilateral, plurilateral and preferentialnon reciprocal ones.
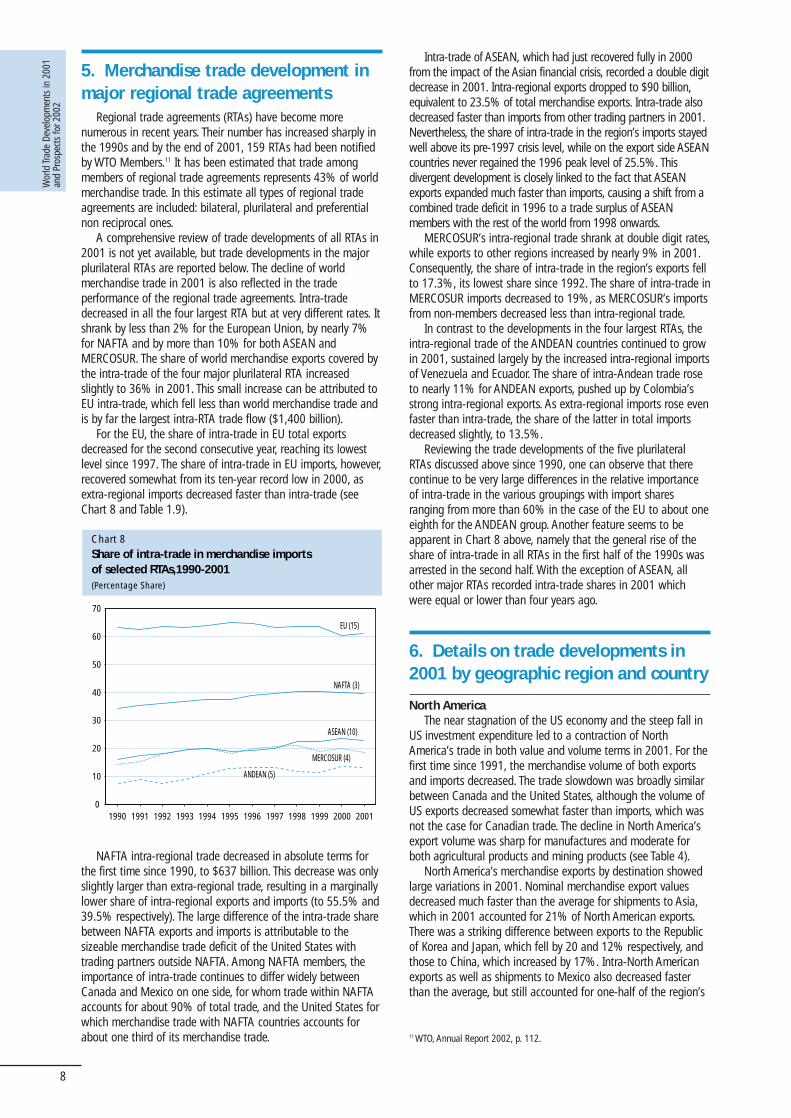
A comprehensive review of trade developments of all RTAs in2001 is not yet available, but trade developments in the majorplurilateral RTAs are reported below. The decline of worldmerchandise trade in 2001 is also reflected in the tradeperformance of the regional trade agreements. Intra-tradedecreased in all the four largest RTA but at very different rates. Itshrank by less than 2% for the European Union, by nearly 7%for NAFTA and by more than 10% for both ASEAN andMERCOSUR. The share of world merchandise exports covered bythe intra-trade of the four major plurilateral RTA increasedslightly to 36% in 2001. This small increase can be attributed toEU intra-trade, which fell less than world merchandise trade andis by far the largest intra-RTA trade flow ($1,400 billion).
For the EU, the share of intra-trade in EU total exportsdecreased for the second consecutive year, reaching its lowestlevel since 1997. The share of intra-trade in EU imports, however,recovered somewhat from its ten-year record low in 2000, asextra-regional imports decreased faster than intra-trade (seeChart 8 and Table 1.9).
Intra-trade of ASEAN, which had just recovered fully in 2000from the impact of the Asian financial crisis, recorded a double digitdecrease in 2001. Intra-regional exports dropped to $90 billion,equivalent to 23.5% of total merchandise exports. Intra-trade alsodecreased faster than imports from other trading partners in 2001.Nevertheless, the share of intra-trade in the region’s imports stayedwell above its pre-1997 crisis level, while on the export side ASEANcountries never regained the 1996 peak level of 25.5%. Thisdivergent development is closely linked to the fact that ASEANexports expanded much faster than imports, causing a shift from acombined trade deficit in 1996 to a trade surplus of ASEANmembers with the rest of the world from 1998 onwards.
MERCOSUR’s intra-regional trade shrank at double digit rates,while exports to other regions increased by nearly 9% in 2001.Consequently, the share of intra-trade in the region’s exports fellto 17.3%, its lowest share since 1992. The share of intra-trade inMERCOSUR imports decreased to 19%, as MERCOSUR’s importsfrom non-members decreased less than intra-regional trade.
In contrast to the developments in the four largest RTAs, theintra-regional trade of the ANDEAN countries continued to growin 2001, sustained largely by the increased intra-regional importsof Venezuela and Ecuador. The share of intra-Andean trade roseto nearly 11% for ANDEAN exports, pushed up by Colombia’sstrong intra-regional exports. As extra-regional imports rose evenfaster than intra-trade, the share of the latter in total importsdecreased slightly, to 13.5%.
Reviewing the trade developments of the five plurilateralRTAs discussed above since 1990, one can observe that therecontinue to be very large differences in the relative importanceof intra-trade in the various groupings with import sharesranging from more than 60% in the case of the EU to about oneeighth for the ANDEAN group. Another feature seems to beapparent in Chart 8 above, namely that the general rise of theshare of intra-trade in all RTAs in the first half of the 1990s wasarrested in the second half. With the exception of ASEAN, allother major RTAs recorded intra-trade shares in 2001 whichwere equal or lower than four years ago.
6. Details on trade developments in2001 by geographic region and country
North AmericaThe near stagnation of the US economy and the steep fall in
US investment expenditure led to a contraction of NorthAmerica’s trade in both value and volume terms in 2001. For thefirst time since 1991, the merchandise volume of both exportsand imports decreased. The trade slowdown was broadly similarbetween Canada and the United States, although the volume ofUS exports decreased somewhat faster than imports, which wasnot the case for Canadian trade. The decline in North America’sexport volume was sharp for manufactures and moderate forboth agricultural products and mining products (see Table 4).
North America’s merchandise exports by destination showedlarge variations in 2001. Nominal merchandise export valuesdecreased much faster than the average for shipments to Asia,which in 2001 accounted for 21% of North American exports.There was a striking difference between exports to the Republicof Korea and Japan, which fell by 20 and 12% respectively, andthose to China, which increased by 17%. Intra-North Americanexports as well as shipments to Mexico also decreased fasterthan the average, but still accounted for one-half of the region’s
Chart 8Share of intra-trade in merchandise importsof selected RTAs,1990-2001(Percentage Share)
0
10
20
30
40
50
60
70
1990 1991 1992 1993 1994 1995 1996 1997 1998 1999 2000 2001
EU (15)
NAFTA (3)
ASEAN (10)
MERCOSUR (4)
ANDEAN (5)
NAFTA intra-regional trade decreased in absolute terms forthe first time since 1990, to $637 billion. This decrease was onlyslightly larger than extra-regional trade, resulting in a marginallylower share of intra-regional exports and imports (to 55.5% and39.5% respectively). The large difference of the intra-trade sharebetween NAFTA exports and imports is attributable to thesizeable merchandise trade deficit of the United States withtrading partners outside NAFTA. Among NAFTA members, theimportance of intra-trade continues to differ widely betweenCanada and Mexico on one side, for whom trade within NAFTAaccounts for about 90% of total trade, and the United States forwhich merchandise trade with NAFTA countries accounts forabout one third of its merchandise trade. 11 WTO, Annual Report 2002, p. 112.
Wor
ld Tr
ade
Deve
lopm
ents
in 2
001
and
Pros
pect
s fo
r 200
2
9
merchandise exports. North American shipments to Latin Americaexcluding Mexico stagnated as did those to the Middle East. Adouble digit increase is reported for shipments to Africa and thetransition economies, which together account for just 2% ofNorth American exports. Exports to Western Europe, which aresomewhat smaller than those to Asia, decreased by 4% andtherefore less than average. The 2001 developments represent aminor reversal of the developments between 1990 and 2000, aperiod in which intra-North American exports and shipments toLatin America expanded almost two times faster than to all otherregions including Asia (see Table III.12).
North American merchandise imports from Asia accounted forone-third of North American imports. Imports from Chinacontinued to rise, while those of all other major suppliersrecorded a severe contraction. North American imports fromWestern Europe stagnated as the decreases in fuels and iron andsteel were offset by increases in imports of chemicals,automotive products and aircraft. Imports from Latin Americancountries were lower due to falling oil prices and a decrease insupplies from Mexico, which were not offset by an increase ofimports from Brazil. The reduction of North American importsfrom the Middle East and Africa can be largely attributed to thefall in prices of fuels (see Table III.13). US imports of
manufactured goods from Africa rose by 12%, largely due tohigher imports of clothing (see Table A10).
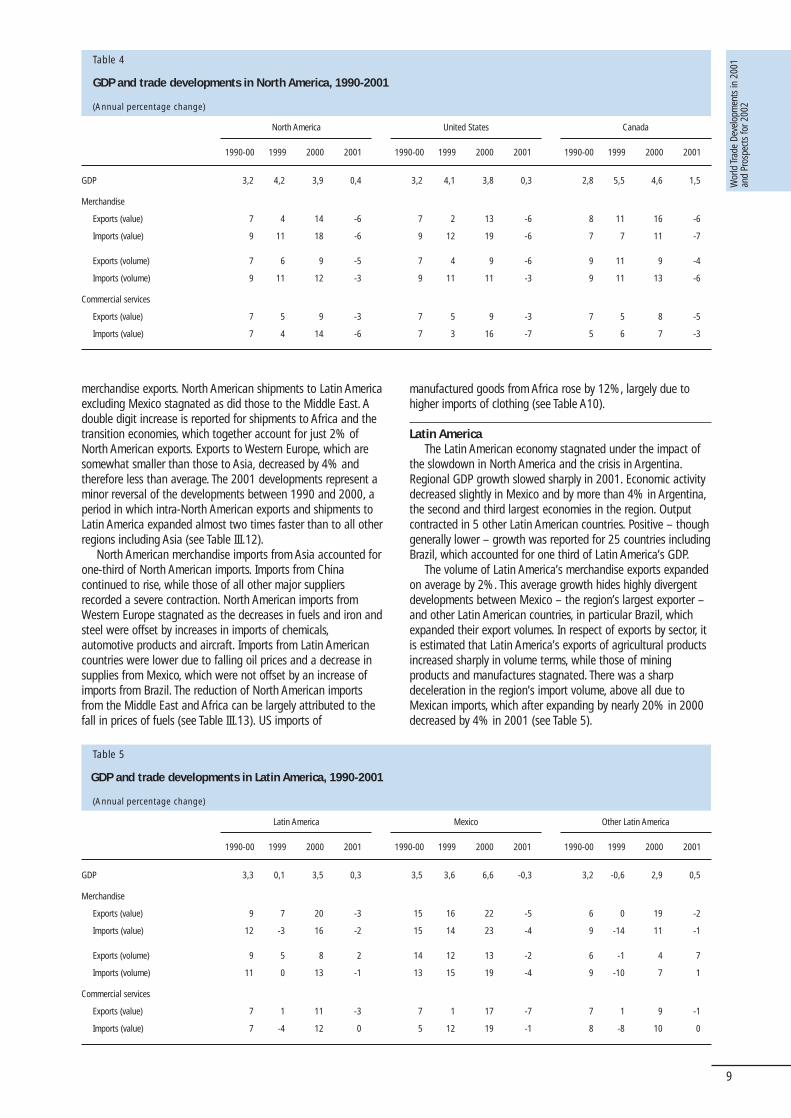
Latin AmericaThe Latin American economy stagnated under the impact of
the slowdown in North America and the crisis in Argentina.Regional GDP growth slowed sharply in 2001. Economic activitydecreased slightly in Mexico and by more than 4% in Argentina,the second and third largest economies in the region. Outputcontracted in 5 other Latin American countries. Positive – thoughgenerally lower – growth was reported for 25 countries includingBrazil, which accounted for one third of Latin America’s GDP.
The volume of Latin America’s merchandise exports expandedon average by 2%. This average growth hides highly divergentdevelopments between Mexico – the region’s largest exporter –and other Latin American countries, in particular Brazil, whichexpanded their export volumes. In respect of exports by sector, itis estimated that Latin America’s exports of agricultural productsincreased sharply in volume terms, while those of miningproducts and manufactures stagnated. There was a sharpdeceleration in the region’s import volume, above all due toMexican imports, which after expanding by nearly 20% in 2000decreased by 4% in 2001 (see Table 5).
Table 4
GDP and trade developments in North America, 1990-2001
(Annual percentage change)
GDP 3,2 4,2 3,9 0,4 3,2 4,1 3,8 0,3 2,8 5,5 4,6 1,5
Merchandise
Exports (value) 7 4 14 -6 7 2 13 -6 8 11 16 -6
Imports (value) 9 11 18 -6 9 12 19 -6 7 7 11 -7
Exports (volume) 7 6 9 -5 7 4 9 -6 9 11 9 -4
Imports (volume) 9 11 12 -3 9 11 11 -3 9 11 13 -6
Commercial services
Exports (value) 7 5 9 -3 7 5 9 -3 7 5 8 -5
Imports (value) 7 4 14 -6 7 3 16 -7 5 6 7 -3
North America United States Canada
1990-00 1999 2000 2001 1990-00 1999 2000 2001 1990-00 1999 2000 2001
Table 5
GDP and trade developments in Latin America, 1990-2001
(Annual percentage change)
GDP 3,3 0,1 3,5 0,3 3,5 3,6 6,6 -0,3 3,2 -0,6 2,9 0,5
Merchandise
Exports (value) 9 7 20 -3 15 16 22 -5 6 0 19 -2
Imports (value) 12 -3 16 -2 15 14 23 -4 9 -14 11 -1
Exports (volume) 9 5 8 2 14 12 13 -2 6 -1 4 7
Imports (volume) 11 0 13 -1 13 15 19 -4 9 -10 7 1
Commercial services
Exports (value) 7 1 11 -3 7 1 17 -7 7 1 9 -1
Imports (value) 7 -4 12 0 5 12 19 -1 8 -8 10 0
Latin America Mexico Other Latin America
1990-00 1999 2000 2001 1990-00 1999 2000 2001 1990-00 1999 2000 2001
Wor
ld Tr
ade
Deve
lopm
ents
in 2
001
and
Pros
pect
s fo
r 200
2
10
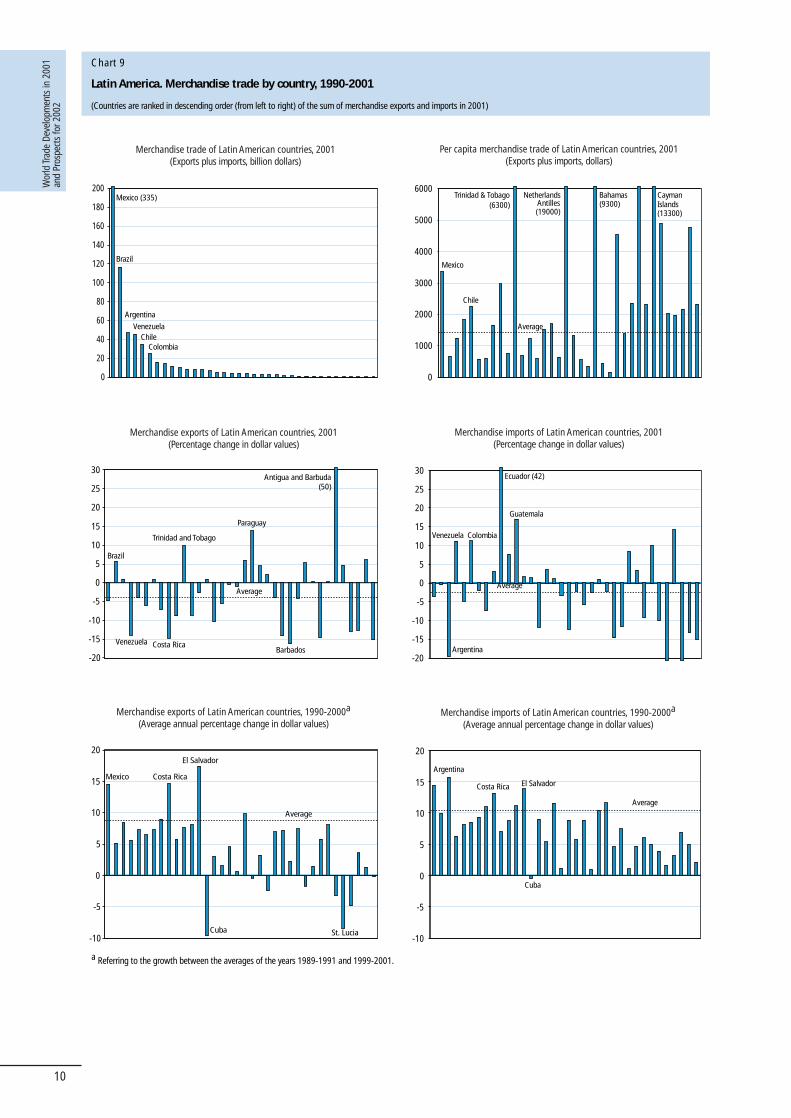
Chart 9
Latin America. Merchandise trade by country, 1990-2001
(Countries are ranked in descending order (from left to right) of the sum of merchandise exports and imports in 2001)
Merchandise trade of Latin American countries, 2001(Exports plus imports, billion dollars)
Merchandise exports of Latin American countries, 2001(Percentage change in dollar values)
Merchandise imports of Latin American countries, 2001(Percentage change in dollar values)
Merchandise exports of Latin American countries, 1990-2000a
(Average annual percentage change in dollar values)Merchandise imports of Latin American countries, 1990-2000a
(Average annual percentage change in dollar values)
0
20
40
60
80
100
120
140
160
180
200Mexico (335)
Brazil
Argentina
VenezuelaChile
Colombia
Per capita merchandise trade of Latin American countries, 2001(Exports plus imports, dollars)
0
1000
2000
3000
4000
5000
6000Trinidad & Tobago
(6300)Netherlands
Antilles(19000)
Bahamas(9300)
Chile
Average
Mexico
CaymanIslands (13300)
-20
-15
-10
-5
0
5
10
15
20
25
30Antigua and Barbuda
(50)
BarbadosCosta Rica
Paraguay
Brazil
Average
Trinidad and Tobago
Venezuela
-10
-5
0
5
10
15
20
Mexico
El Salvador
Costa Rica
Cuba St. Lucia
Average
-20
-15
-10
-5
0
5
10
15
20
25
30
Argentina
Ecuador (42)
Venezuela Colombia
Guatemala
Average
-10
-5
0
5
10
15
20
Cuba
Argentina
El SalvadorCosta Rica
Average
a Referring to the growth between the averages of the years 1989-1991 and 1999-2001.
Wor
ld Tr
ade
Deve
lopm
ents
in 2
001
and
Pros
pect
s fo
r 200
2
11
Export prices for Latin American goods decreased by 5%, muchfaster than import prices, which was a reversed situation comparedto 2000. The rise of oil prices in 2000 and their decline in 2001were the major explanatory factor in these developments. Exportprices of some non-fuel commodities also recorded very sharpprice declines, in particular coffee, which is a major export categoryin a number of Central American countries.12
The dollar value of Latin American merchandise exports andimports contracted by 3% and 2%, respectively, in 2001, adramatic shift from the double digit growth in 2000. Thedeceleration in the region’s services trade in 2001 was onlyslightly less pronounced than for merchandise, and again it wasMexico’s trade developments which had contributed most to thisdisappointing outcome.
Chart 9 provides information on Latin American merchandisetrade by country, which supplements the information on theregion’s overall trade performance.13 The countries are ranked indescending order from the left to the right in terms of the sum ofmerchandise exports and imports in 2001. On the right side of theupper row, per capita trade is reported which reveals that the 12smallest traders in Latin America recorded an above average percapita trade level. The middle row reports on annual value changesof exports and imports by country. Out of the 36 countries shown,21 reported a decrease and 15 an increase, for both exports andimports. The annual variations in 2001 are more pronounced forimports than exports. Imports of the oil exporting countries(Venezuela, Colombia and Ecuador) continued to rise, while thecrisis stricken Argentina sharply reduced its imports. The dotted lineindicates the regional average.
The bottom row of Chart 9 sheds some light on medium-termdevelopments by presenting trade growth rates by countrybetween the average of the years 1989-91 and that of the years1999-2001. For that period, Mexico, Costa Rica, El Salvador andPanama had been the most dynamic traders in Latin America,while Cuba and St. Lucia recorded a steep decline. Linked to thedisruptions of its traditional trade ties with today’s transitioneconomies, Cuba is the only Latin American country for whichboth imports and exports did not expand in that period. The top13 traders in Latin America in 2001 had much stronger exportand import growth in the medium-term than the smaller tradersin the region.
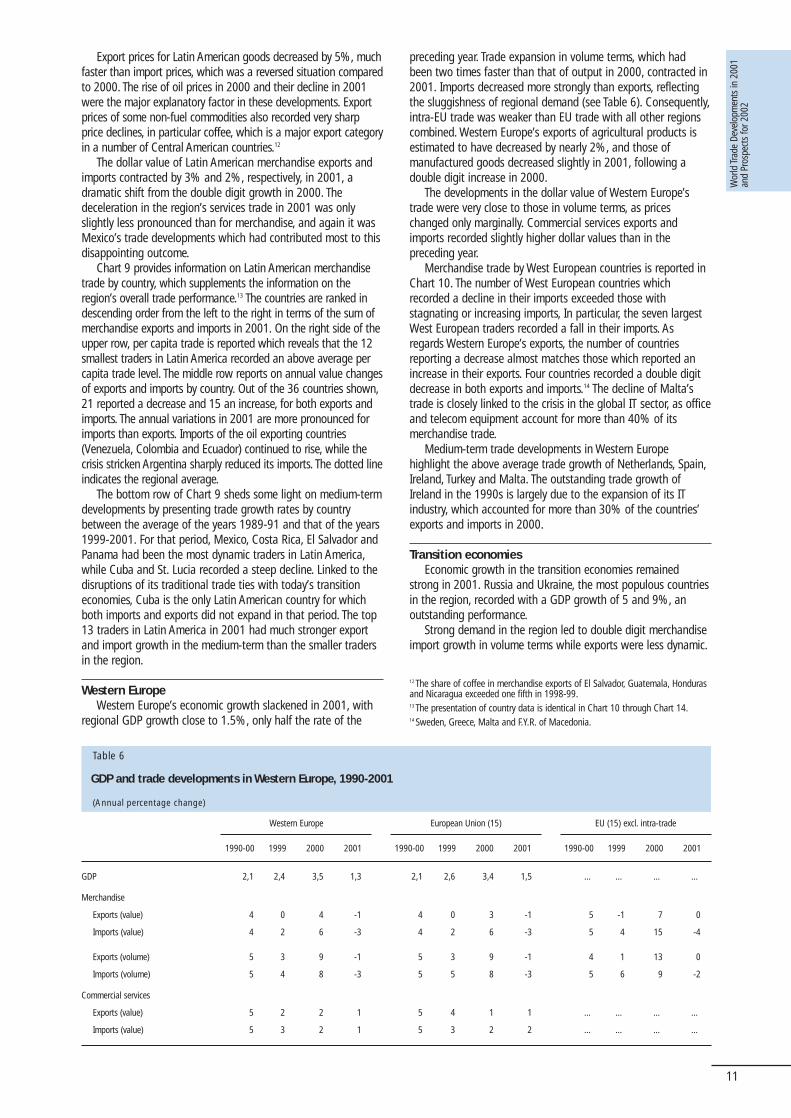
Western EuropeWestern Europe’s economic growth slackened in 2001, with
regional GDP growth close to 1.5%, only half the rate of the
preceding year. Trade expansion in volume terms, which hadbeen two times faster than that of output in 2000, contracted in2001. Imports decreased more strongly than exports, reflectingthe sluggishness of regional demand (see Table 6). Consequently,intra-EU trade was weaker than EU trade with all other regionscombined. Western Europe’s exports of agricultural products isestimated to have decreased by nearly 2%, and those ofmanufactured goods decreased slightly in 2001, following adouble digit increase in 2000.
The developments in the dollar value of Western Europe’strade were very close to those in volume terms, as priceschanged only marginally. Commercial services exports andimports recorded slightly higher dollar values than in thepreceding year.
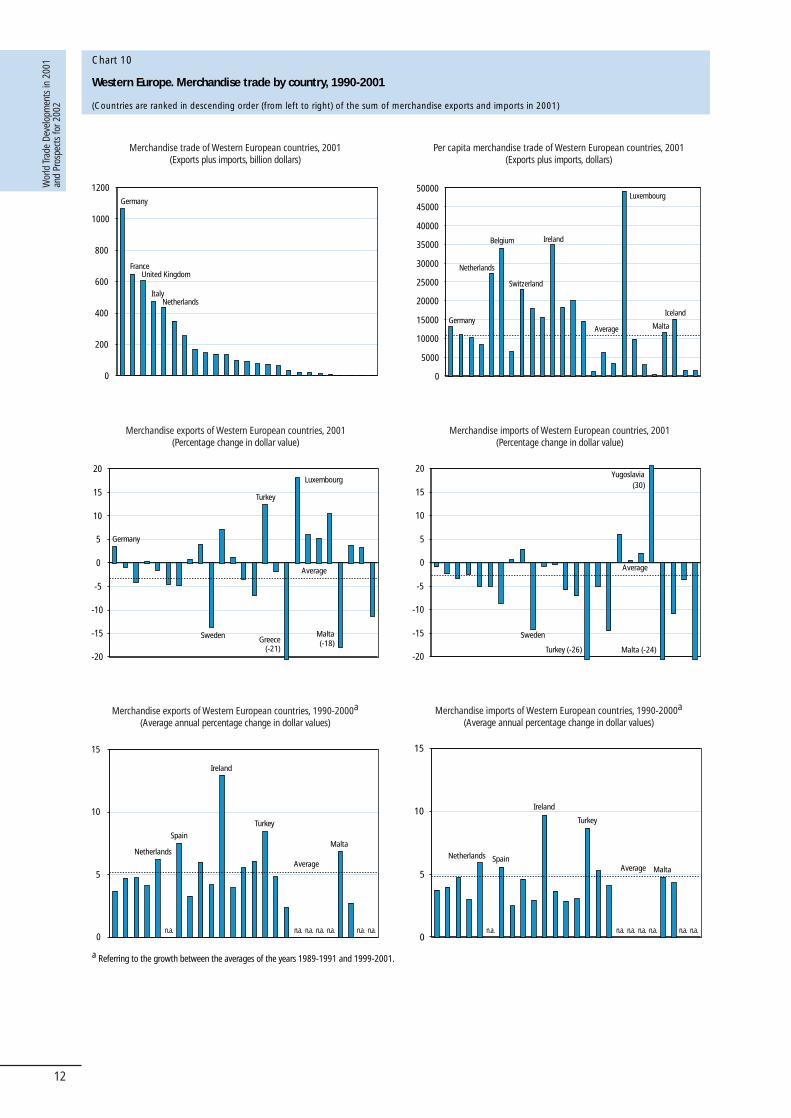
Merchandise trade by West European countries is reported inChart 10. The number of West European countries whichrecorded a decline in their imports exceeded those withstagnating or increasing imports, In particular, the seven largestWest European traders recorded a fall in their imports. Asregards Western Europe’s exports, the number of countriesreporting a decrease almost matches those which reported anincrease in their exports. Four countries recorded a double digitdecrease in both exports and imports.14 The decline of Malta’strade is closely linked to the crisis in the global IT sector, as officeand telecom equipment account for more than 40% of itsmerchandise trade.
Medium-term trade developments in Western Europehighlight the above average trade growth of Netherlands, Spain,Ireland, Turkey and Malta. The outstanding trade growth ofIreland in the 1990s is largely due to the expansion of its ITindustry, which accounted for more than 30% of the countries’exports and imports in 2000.
Transition economiesEconomic growth in the transition economies remained
strong in 2001. Russia and Ukraine, the most populous countriesin the region, recorded with a GDP growth of 5 and 9%, anoutstanding performance.
Strong demand in the region led to double digit merchandiseimport growth in volume terms while exports were less dynamic.
12 The share of coffee in merchandise exports of El Salvador, Guatemala, Hondurasand Nicaragua exceeded one fifth in 1998-99.13 The presentation of country data is identical in Chart 10 through Chart 14.14 Sweden, Greece, Malta and F.Y.R. of Macedonia.
Table 6
GDP and trade developments in Western Europe, 1990-2001
(Annual percentage change)
GDP 2,1 2,4 3,5 1,3 2,1 2,6 3,4 1,5 … … … …
Merchandise
Exports (value) 4 0 4 -1 4 0 3 -1 5 -1 7 0
Imports (value) 4 2 6 -3 4 2 6 -3 5 4 15 -4
Exports (volume) 5 3 9 -1 5 3 9 -1 4 1 13 0
Imports (volume) 5 4 8 -3 5 5 8 -3 5 6 9 -2
Commercial services
Exports (value) 5 2 2 1 5 4 1 1 … … … …
Imports (value) 5 3 2 1 5 3 2 2 … … … …
Western Europe European Union (15) EU (15) excl. intra-trade
1990-00 1999 2000 2001 1990-00 1999 2000 2001 1990-00 1999 2000 2001
Wor
ld Tr
ade
Deve
lopm
ents
in 2
001
and
Pros
pect
s fo
r 200
2
12
0
200
400
600
800
1000
1200Germany
FranceUnited Kingdom
ItalyNetherlands
0
5000
10000
15000
20000
25000
30000
35000
40000
45000
50000
Average
Luxembourg
IrelandBelgium
Germany
Netherlands
Switzerland
Malta
Iceland
-20
-15
-10
-5
0
5
10
15
20
0
5
10
15
0
5
10
15
Chart 10
Western Europe. Merchandise trade by country, 1990-2001
(Countries are ranked in descending order (from left to right) of the sum of merchandise exports and imports in 2001)
Merchandise trade of Western European countries, 2001(Exports plus imports, billion dollars)
Merchandise imports of Western European countries, 2001(Percentage change in dollar value)
Per capita merchandise trade of Western European countries, 2001(Exports plus imports, dollars)
Merchandise exports of Western European countries, 2001(Percentage change in dollar value)
Merchandise imports of Western European countries, 1990-2000a
(Average annual percentage change in dollar values)Merchandise exports of Western European countries, 1990-2000a
(Average annual percentage change in dollar values)
Average
Luxembourg
Turkey
Greece(-21)
Malta(-18)
Germany
Sweden
-20
-15
-10
-5
0
5
10
15
20
Average
Yugoslavia (30)
Malta (-24)Turkey (-26)
Sweden
Average
Ireland
Spain
Turkey
n.a. n.a. n.a. n.a. n.a. n.a. n.a.
NetherlandsMalta
n.a. n.a. n.a. n.a. n.a. n.a. n.a.
Average
Ireland
Turkey
SpainNetherlands
Malta
a Referring to the growth between the averages of the years 1989-1991 and 1999-2001.
Wor
ld Tr
ade
Deve
lopm
ents
in 2
001
and
Pros
pect
s fo
r 200
2
13
Merchandise trade of transition economies, 2001(Exports plus imports, billion dollars)
Merchandise exports of transition economies, 1995-2001(Average annual percentage change in dollar values)
Per capita merchandise trade of transition economies, 2001(Exports plus imports, dollars)
Merchandise exports of transition economies, 2001(Percentage change in dollar values)
Merchandise imports of transition economies, 1995-2001(Average annual percentage change in dollar values)
Merchandise imports of transition economies, 2001(Percentage change in dollar values)
Chart 11
Transition economies. Merchandise trade by country, 1995-2001
(Countries are ranked in descending order (from left to right) of the sum of merchandise exports and imports in 2001)
0
20
40
60
80
100
120
140
160Russian Fed.
Poland
Czech Rep.
Hungary
Ukraine
0
1000
2000
3000
4000
5000
6000
7000
RussianFed.
Poland
Czech Rep.Hungary
Estonia
Average
-15
-10
-5
0
5
10
15
20
25
30
35
-15
-10
-5
0
5
10
15
20
25
30
35
Russian Fed.
Czech Rep.
Kazakhstan
Uzbekistan
Average
Kyrgz Rep. (-16)
-5
0
5
10
15
20
25
30
35
40
-5
0
5
10
15
20
25
30
35
40
Russian Fed.
Belarus
Kazakhstan
Average
Ukraine
Russian Fed.
Poland Czech Rep.Hungary
Azerbaijan
Average
Tajikistan (-17)
Russian Fed.
Belarus
Kazakhstan
Azerbaijan
Average
Bulgaria
Wor
ld Tr
ade
Deve
lopm
ents
in 2
001
and
Pros
pect
s fo
r 200
2
14
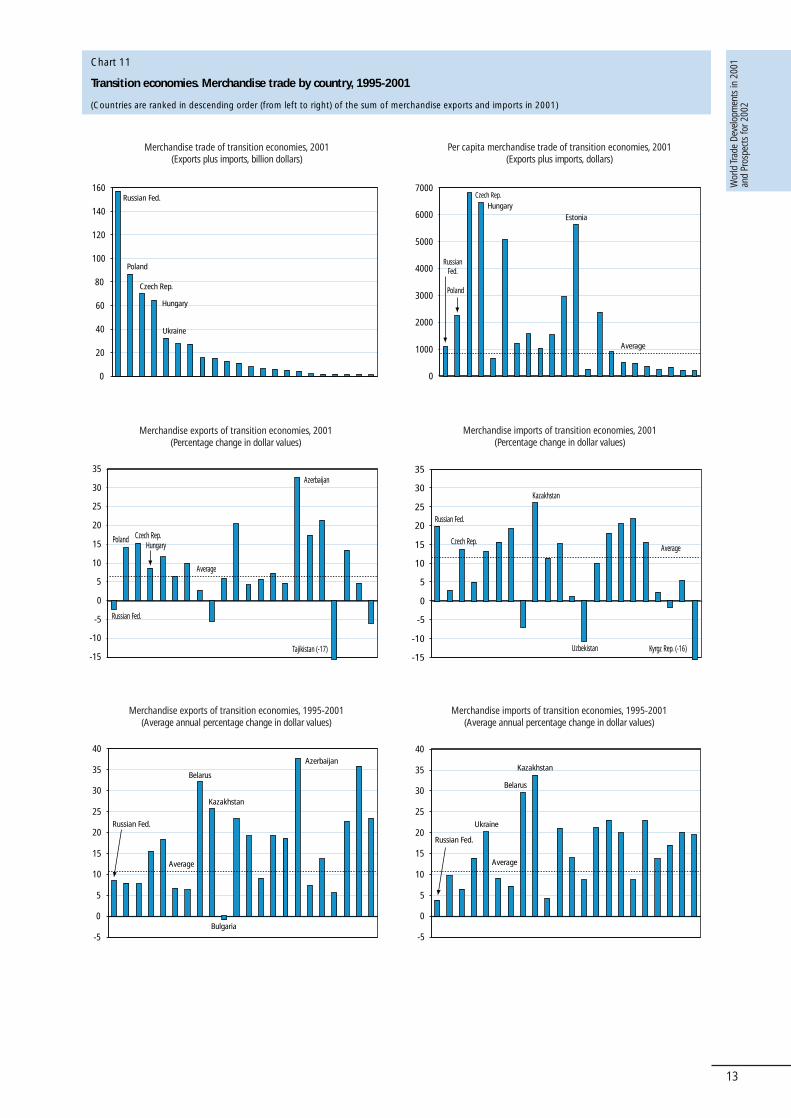
The excess of import growth over export growth in the regioncan be largely attributed to Russia and to a lesser extent toUkraine, the Slovak Republic and Romania
The dollar value of the region’s merchandise exports rose by5%, to $286 billion in 2001. Central and Eastern Europe’sexports rose at double digit rates, while those of Russiadecreased under the impact of falling prices for fuels. Excludingfuels and non-ferrous metals, the expansion of the region’smerchandise exports remained very strong in 2001. While therecovery of intra-regional trade was sustained, the mostencouraging development is the expansion of trade withWestern Europe. Despite sluggish domestic demand growth inthe EU, the Central and East European countries increased theirexports by more than 10% to this region.
Particularly strong export growth to the EU could be observedfor automotive products, office and telecom equipment andclothing. Developments in 2001 also confirmed the trend observedin a recent OECD study15, which found that intra-industry trade inPoland, Czech Republic and Hungary was large and had risenstrongly throughout the 1990s. Russian imports recovered atdouble digit rates for the second year in a row, but remained onaverage down by one quarter of their pre-crisis peak of 1997.
As can be seen from Chart 11, the per capita merchandisetrade of the Central and East European countries and those ofthe Baltic States was well above the average of the transitioneconomies. However, the other transition economies recorded ahigher export growth between 1995 and 2001, from thedepressed trade levels at the beginning of the period.
The expansion of merchandise imports of the transitioneconomies was sustained by the majority of the countries in theregion, above all by Russia. Russian imports recovered at doubledigit rates for the second year in a row, but still remained stilldown in 2001 by one-quarter compared to the pre-crisis peaklevel of 1997. Commercial services exports and imports of theregion continued to expand rapidly. Russia’s commercial servicesimports were again up sharply in all categories, while on theexport side an increase in transportation services contrasted with acontraction of receipts for travel and other commercial services. Forthe transition economies as a group, however, the three servicescategories contributed equally to an overall growth rate of 11%.
AfricaGDP growth in Africa exceeded population growth for the
second year in a row, yet hardly by enough to make a dent in the
widespread under-employment and poverty in the region. Therewas a marked deceleration of economic activity in the region’slargest economies, South Africa, Nigeria and Egypt, while manysmaller economies fared better in 2001 than in the precedingyear. According to IMF estimates16, thirteen African economiesrecorded economic growth in excess of 5% while for five Africaneconomies output was shrinking (Democratic Republic of Congo,Côte d’Ivoire, Malawi, Seychelles and Zimbabwe).
Africa’s merchandise exports in volume terms is estimated tohave increased by about 3 to 4% in 2001, which was roughlyhalf the rate of the preceding year. The volume of agriculturalexports expanded much faster than that of mining andmanufactured products. The value of African merchandise exportsdecreased as the volume increase in African merchandise exportswas not strong enough to offset the decline in prices of fuels,metals and other primary commodities. Primary productsaccounted for three quarters of African merchandise exports in2001. Estimates point to a decrease in the value of Africanexports of fuels and agricultural raw materials of 9% and 6%respectively. The value of food exports, however, increaseddespite falling prices. Among manufactured goods, the strongestincrease was recorded for clothing, while that of iron and steeldecreased sharply. Exports of all manufactured goods wereestimated to have increased by about 2% (see Table 8).
African exports to North America and Asia decreased muchfaster than the average, largely due to the predominance of fuelsexports. Shipments to Western Europe which accounted for morethan one-half of Africa’s total exports, decreased less than theaverage. Intra-regional trade in Africa is estimated to havedecreased at about the average rate, keeping the share of intra-African trade in total trade at 8%. Available data point to astagnation or small decrease in the share of intra-trade since themid-1990s.
Africa’s merchandise imports rose by 2%, reaching a newpeak level of $136 billion. Despite their decline, Africanmerchandise exports exceeded African merchandise imports forthe second year in a row. The regional trade surplus reflects asubstantial trade surplus of the oil exporting African countries.
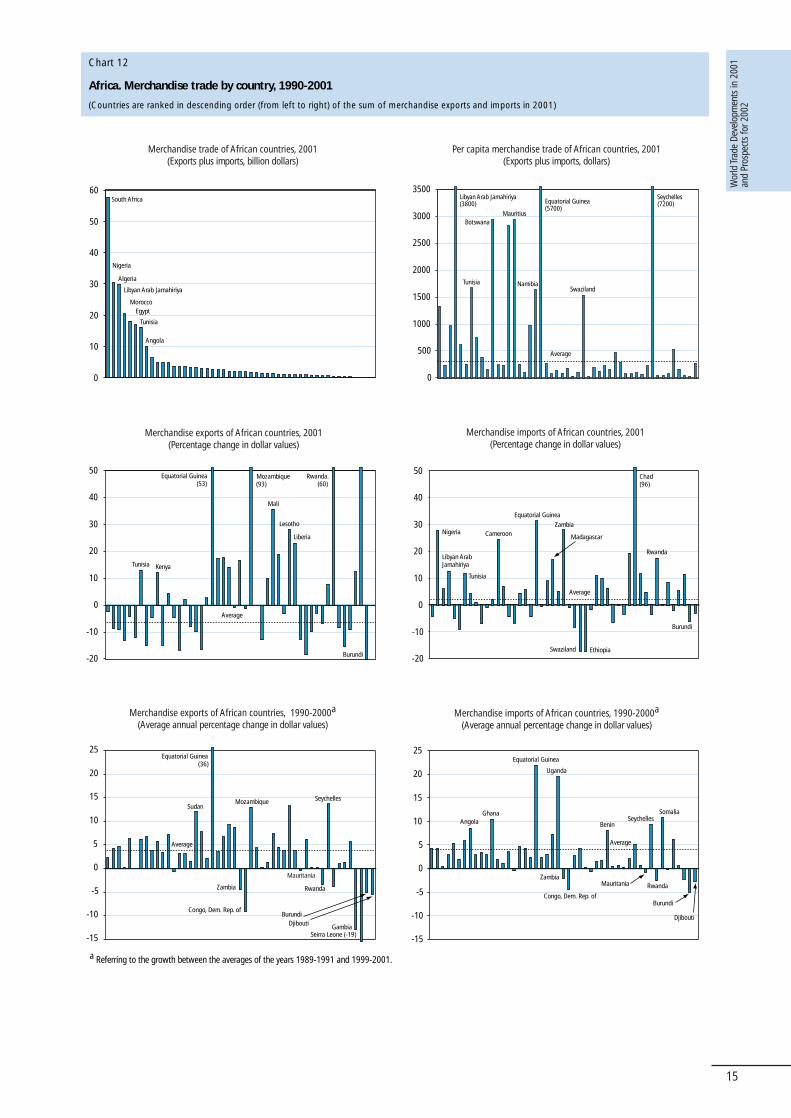
Data in Chart 12 provide information on the concentration ofAfrican trade on major countries and highlights the marked
Table 7
GDP and trade developments in transition economies, 1995-2001
(Annual percentage change)
GDP 2,2 3,7 6,5 4,4 3,1 2,4 3,7 2,8 1,3 5,4 9,0 5,0
Merchandise
Exports (value) 8 0 26 5 8 1 14 12 … 1 39 -2
Imports (value) 6 -12 14 11 9 -1 12 9 … -33 13 20
Exports (volume) 7 -2 17 8 … … … … … … … …
Imports (volume) 8 -9 16 14 … … … … … … … …
Commercial services
Exports (value) 2 -14 11 11 1 -12 14 13 -1 -27 10 9
Imports (value) 3 -8 19 13 4 1 11 7 -3 -19 32 20
Transition economies C./E. Europe Russian Federation
1995-00 1999 2000 2001 1995-00 1999 2000 2001 1995-00 1999 2000 2001
15 OECD, Economic Outlook, June 2002, Chapter VI.16 IMF, World Economic Outlook, September 2002.
Wor
ld Tr
ade
Deve
lopm
ents
in 2
001
and
Pros
pect
s fo
r 200
2
15
0
10
20
30
40
50
60South Africa
Nigeria
Algeria
Libyan Arab Jamahiriya
Morocco
Tunisia
Angola
Egypt
-15
-10
-5
0
5
10
15
20
25
0
500
1000
1500
2000
2500
3000
3500
-20
-10
0
10
20
30
40
50
Equatorial Guinea
Chad(96)
Ethiopia
Average
Nigeria
Burundi
Libyan Arab Jamahiriya
Tunisia
Cameroon Madagascar
Zambia
Swaziland
Rwanda
-15
-10
-5
0
5
10
15
20
25
Ghana
Congo, Dem. Rep. of
Average
Uganda
Burundi
Equatorial Guinea
Angola
Zambia
BeninSeychelles
Somalia
RwandaMauritania
Djibouti
-20
-10
0
10
20
30
40
50
a Referring to the growth between the averages of the years 1989-1991 and 1999-2001.
Chart 12
Africa. Merchandise trade by country, 1990-2001
(Countries are ranked in descending order (from left to right) of the sum of merchandise exports and imports in 2001)
Merchandise trade of African countries, 2001(Exports plus imports, billion dollars)
Merchandise exports of African countries, 1990-2000a
(Average annual percentage change in dollar values)
Per capita merchandise trade of African countries, 2001(Exports plus imports, dollars)
Merchandise exports of African countries, 2001(Percentage change in dollar values)
Merchandise imports of African countries, 1990-2000a
(Average annual percentage change in dollar values)
Merchandise imports of African countries, 2001(Percentage change in dollar values)
Equatorial Guinea (5700)
Seychelles(7200)
Botswana
Libyan Arab Jamahiriya (3800)
Average
Tunisia
Mauritius
NamibiaSwaziland
Equatorial Guinea(53)
Rwanda.(60)
Mozambique (93)
Average
Burundi
Mali
Lesotho
Liberia
Tunisia Kenya
Equatorial Guinea(36)
Seychelles
Congo, Dem. Rep. of
Average
Sudan
Gambia
Mozambique
Zambia
Mauritania
Rwanda
Seirra Leone (-19)
BurundiDjibouti
Wor
ld Tr
ade
Deve
lopm
ents
in 2
001
and
Pros
pect
s fo
r 200
2
16
differences in per capita trade of African countries. While nineAfrican countries report a per capita trade in excess of $1,500,for the majority of African countries trade per capita is less than$300 (exports plus imports).
As regards African exports by country in 2001, the largerexporters accounted for most of the steep declines, while thesmaller exporters comprised 14 countries with export growth inexcess of 10%. Equatorial Guinea’s exports benefitted from theincreased output of its oil fields, while Mozambique sharplyincreased its aluminium exports, thanks to the start of theoperation of a new smelter.
African merchandise import developments by country in 2001provide a mixed picture. The number of countries with risingimports (29) exceeded that of countries with declining imports(20). Most of the countries with high import growth were eitheroil exporters (Nigeria, Libya, Cameroon and Equatorial Guinea)or recovering from previously depressed levels (Tunisia, Zambia).However, imports of Madagascar continued to expand due to thedevelopment of export processing zones, which requiredimported inputs. In the case of Chad, the markedly higher importvalue is linked to the delivery of equipment and materials neededfor the construction of the Chad-Cameroon pipeline.
The main features of trade developments in the period from1989-91 to 1999-2001 included a stagnation of exports in sixcountries and a decrease for eight other countries. Among theseeight countries, seven also recorded a decrease in their imports.For most of them the disappointing trade performance waslinked to extended periods of civil conflict (Burundi, DemocraticRepublic of Congo, Rwanda and Sierra Leone).
With commercial services exports of Africa stagnating for thesecond year in a row and imports shrinking, the deficit in the
region’s commercial services balances was reduced to about$7 billion. Egypt and South Africa, the region’s largest exportersof commercial services, both recorded a decline, whichcontrasted with the significant gains reported by both Moroccoand Tunisia, the region’s third and fourth largest exporters.African imports of commercial services shrank mainly due to thecontraction of imports of South Africa and Egypt.
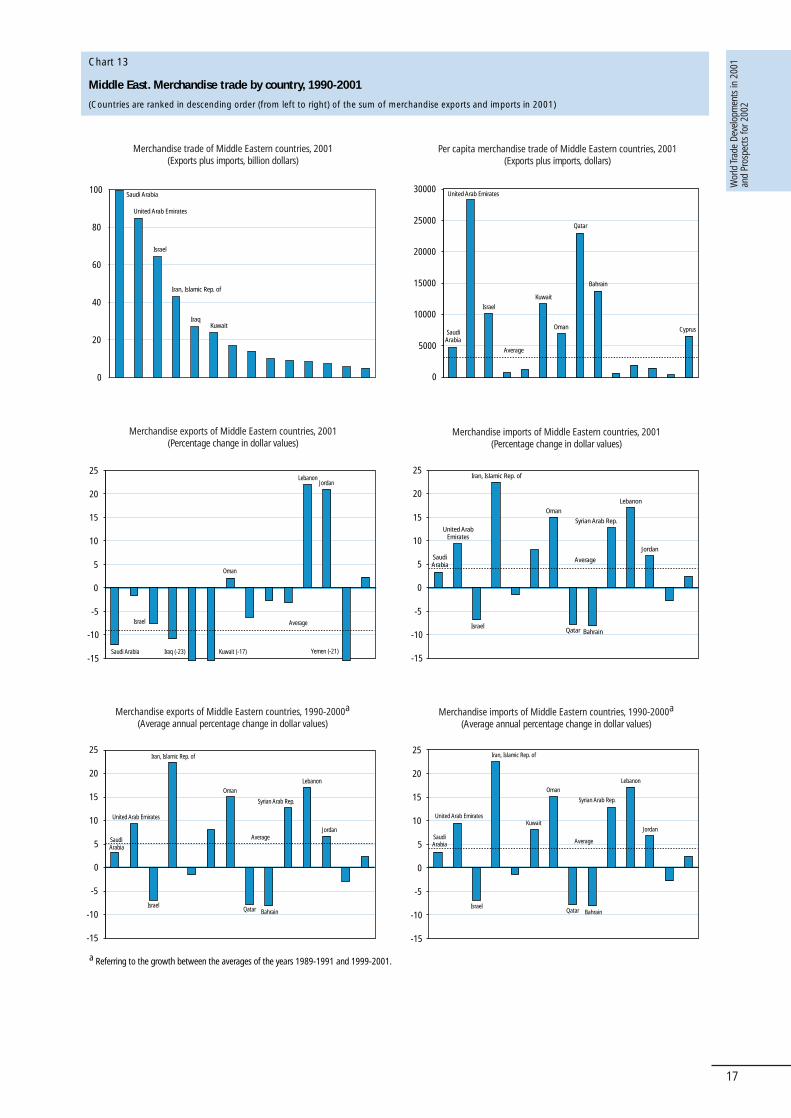
Middle EastTrade developments in the Middle East are largely determined
by the fortunes of the global energy markets. The recovery ofpetroleum prices in 1999 and 2000, and their fall in 2001 arestrongly reflected in the region’s merchandise exports. As thevolume of petroleum exports was roughly maintained at thepreceeding year’s level, the overall decrease in the dollar value ofMiddle East exports is close to the fall in petroleum prices.Exports of non-fuel commodities stagnated mainly due to thedecline in Israel’s exports, the region’s principal exporter ofmanufactured goods (see table 9).
Exports of chemicals – mainly petrochemicals – increased to$14 billion and again became the largest product group in theregion’s exports of manufactured goods. As regards thedestination of Middle East exports, developments in 2001 point to a continuation of trends observed in the 1990s: first,an increasing predominance of Asia as an export market,which alone accounted for nearly 60 per cent of the region’s fuel exports; second, a strong decrease in the share ofWestern Europe, and third, a steady increase in the share ofNorth America, which has surpassed Western Europe as thesecond largest market for both total merchandise trade and forfuels.
Table 8
GDP and trade developments in Africa, 1990-2001
(Annual percentage change)
GDP 2,3 2,6 3,3 3,1 1,7 2,1 3,4 2,2 2,5 2,8 3,3 3,4
Merchandise
Exports (value) 4 11 27 -5 2 1 12 -2 4 12 32 -6
Imports (value) 3 -3 4 2 5 -9 11 -4 2 -2 2 4
Commercial services
Exports (value) 5 10 0 0 4 -4 -3 -4 5 13 1 1
Imports (value) 4 -2 7 -3 4 2 0 -8 4 -3 8 -2
Africa South Africa Other Africa
1990-00 1999 2000 2001 1990-00 1999 2000 2001 1990-00 1999 2000 2001
Table 9
Trade developments in the Middle East, 1990-2001
(Annual percentage change)
Merchandise
Exports (value) 2 12 6 -22 30 42 -9
Imports (value) 5 5 5 0 3 13 4
Commercial services
Exports (value) 8 9 8 5 9 16 -7
Imports (value) 3 5 4 -11 1 8 -7
1990-95 1995-00 1990-00 1998 1999 2000 2001
Wor
ld Tr
ade
Deve
lopm
ents
in 2
001
and
Pros
pect
s fo
r 200
2
17
Chart 13
Middle East. Merchandise trade by country, 1990-2001
(Countries are ranked in descending order (from left to right) of the sum of merchandise exports and imports in 2001)
Merchandise trade of Middle Eastern countries, 2001(Exports plus imports, billion dollars)
Merchandise exports of Middle Eastern countries, 1990-2000a
(Average annual percentage change in dollar values)
Per capita merchandise trade of Middle Eastern countries, 2001(Exports plus imports, dollars)
Merchandise exports of Middle Eastern countries, 2001(Percentage change in dollar values)
Merchandise imports of Middle Eastern countries, 1990-2000a
(Average annual percentage change in dollar values)
Merchandise imports of Middle Eastern countries, 2001(Percentage change in dollar values)
a Referring to the growth between the averages of the years 1989-1991 and 1999-2001.
0
20
40
60
80
100Saudi Arabia
United Arab Emirates
Israel
Iran, Islamic Rep. of
IraqKuwait
0
5000
10000
15000
20000
25000
30000
-15
-10
-5
0
5
10
15
20
25
-15
-10
-5
0
5
10
15
20
25
-15
-10
-5
0
5
10
15
20
25
United Arab Emirates
Qatar
Bahrain
Cyprus
Average
Saudi Arabia
Israel
Kuwait
Oman
-15
-10
-5
0
5
10
15
20
25
Iraq (-23)
Lebanon
Yemen (-21)Kuwait (-17)
Average
Jordan
Saudi Arabia
Israel
Oman
Israel
Lebanon
Bahrain
Iran, Islamic Rep. of
Average
JordanSaudi Arabia
Qatar
Oman
United Arab Emirates
Syrian Arab Rep.
Israel
Lebanon
Bahrain
Iran, Islamic Rep. of
AverageJordan
Saudi Arabia
United Arab Emirates
Oman
Syrian Arab Rep.
Qatar Israel
Lebanon
Bahrain
Iran, Islamic Rep. of
Average
JordanSaudi Arabia
United Arab EmiratesKuwait
Qatar
Syrian Arab Rep.
Oman
Wor
ld Tr
ade
Deve
lopm
ents
in 2
001
and
Pros
pect
s fo
r 200
2
18
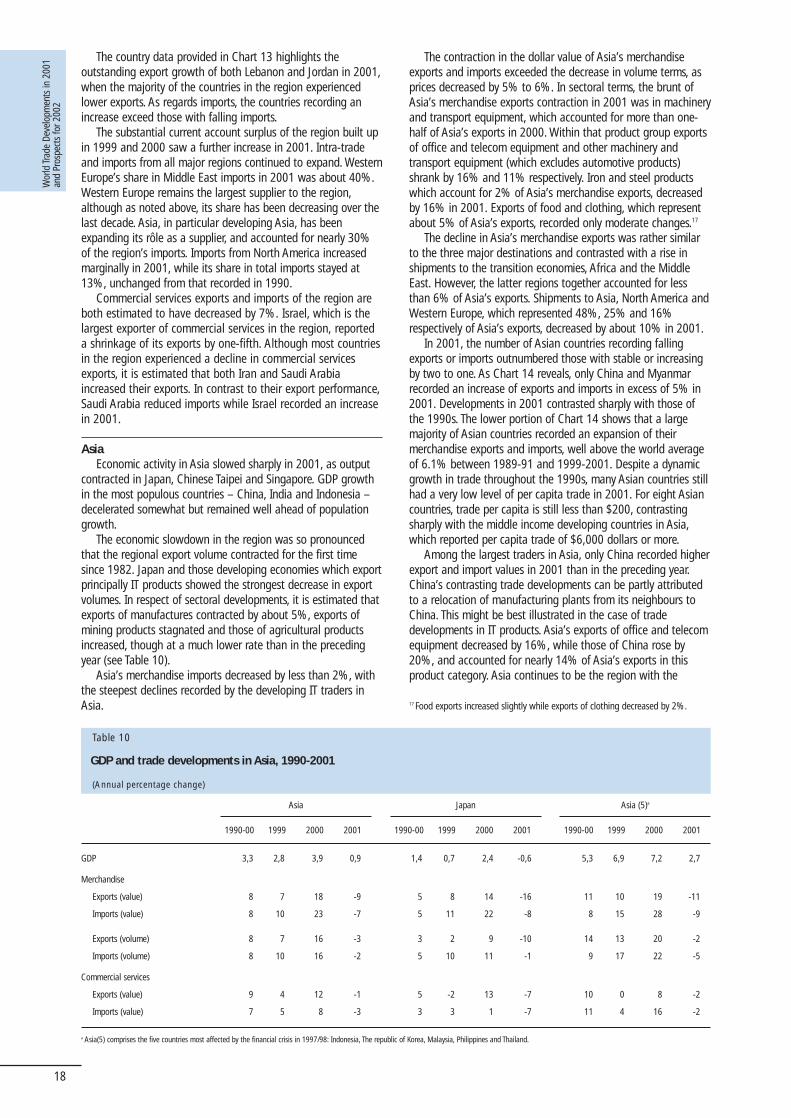
Table 10
GDP and trade developments in Asia, 1990-2001
(Annual percentage change)
GDP 3,3 2,8 3,9 0,9 1,4 0,7 2,4 -0,6 5,3 6,9 7,2 2,7
Merchandise
Exports (value) 8 7 18 -9 5 8 14 -16 11 10 19 -11
Imports (value) 8 10 23 -7 5 11 22 -8 8 15 28 -9
Exports (volume) 8 7 16 -3 3 2 9 -10 14 13 20 -2
Imports (volume) 8 10 16 -2 5 10 11 -1 9 17 22 -5
Commercial services
Exports (value) 9 4 12 -1 5 -2 13 -7 10 0 8 -2
Imports (value) 7 5 8 -3 3 3 1 -7 11 4 16 -2
Asia Japan Asia (5)a
1990-00 1999 2000 2001 1990-00 1999 2000 2001 1990-00 1999 2000 2001
The country data provided in Chart 13 highlights theoutstanding export growth of both Lebanon and Jordan in 2001,when the majority of the countries in the region experiencedlower exports. As regards imports, the countries recording anincrease exceed those with falling imports.
The substantial current account surplus of the region built upin 1999 and 2000 saw a further increase in 2001. Intra-tradeand imports from all major regions continued to expand. WesternEurope’s share in Middle East imports in 2001 was about 40%.Western Europe remains the largest supplier to the region,although as noted above, its share has been decreasing over thelast decade. Asia, in particular developing Asia, has beenexpanding its rôle as a supplier, and accounted for nearly 30%of the region’s imports. Imports from North America increasedmarginally in 2001, while its share in total imports stayed at13%, unchanged from that recorded in 1990.
Commercial services exports and imports of the region areboth estimated to have decreased by 7%. Israel, which is thelargest exporter of commercial services in the region, reporteda shrinkage of its exports by one-fifth. Although most countriesin the region experienced a decline in commercial servicesexports, it is estimated that both Iran and Saudi Arabiaincreased their exports. In contrast to their export performance,Saudi Arabia reduced imports while Israel recorded an increasein 2001.
AsiaEconomic activity in Asia slowed sharply in 2001, as output
contracted in Japan, Chinese Taipei and Singapore. GDP growthin the most populous countries – China, India and Indonesia –decelerated somewhat but remained well ahead of populationgrowth.
The economic slowdown in the region was so pronouncedthat the regional export volume contracted for the first timesince 1982. Japan and those developing economies which exportprincipally IT products showed the strongest decrease in exportvolumes. In respect of sectoral developments, it is estimated thatexports of manufactures contracted by about 5%, exports ofmining products stagnated and those of agricultural productsincreased, though at a much lower rate than in the precedingyear (see Table 10).
Asia’s merchandise imports decreased by less than 2%, withthe steepest declines recorded by the developing IT traders inAsia.
The contraction in the dollar value of Asia’s merchandiseexports and imports exceeded the decrease in volume terms, asprices decreased by 5% to 6%. In sectoral terms, the brunt ofAsia’s merchandise exports contraction in 2001 was in machineryand transport equipment, which accounted for more than one-half of Asia’s exports in 2000. Within that product group exportsof office and telecom equipment and other machinery andtransport equipment (which excludes automotive products)shrank by 16% and 11% respectively. Iron and steel productswhich account for 2% of Asia’s merchandise exports, decreasedby 16% in 2001. Exports of food and clothing, which representabout 5% of Asia’s exports, recorded only moderate changes.17
The decline in Asia’s merchandise exports was rather similarto the three major destinations and contrasted with a rise inshipments to the transition economies, Africa and the MiddleEast. However, the latter regions together accounted for lessthan 6% of Asia’s exports. Shipments to Asia, North America andWestern Europe, which represented 48%, 25% and 16%respectively of Asia’s exports, decreased by about 10% in 2001.
In 2001, the number of Asian countries recording fallingexports or imports outnumbered those with stable or increasingby two to one. As Chart 14 reveals, only China and Myanmarrecorded an increase of exports and imports in excess of 5% in2001. Developments in 2001 contrasted sharply with those ofthe 1990s. The lower portion of Chart 14 shows that a largemajority of Asian countries recorded an expansion of theirmerchandise exports and imports, well above the world averageof 6.1% between 1989-91 and 1999-2001. Despite a dynamicgrowth in trade throughout the 1990s, many Asian countries stillhad a very low level of per capita trade in 2001. For eight Asiancountries, trade per capita is still less than $200, contrastingsharply with the middle income developing countries in Asia,which reported per capita trade of $6,000 dollars or more.
Among the largest traders in Asia, only China recorded higherexport and import values in 2001 than in the preceding year.China’s contrasting trade developments can be partly attributedto a relocation of manufacturing plants from its neighbours toChina. This might be best illustrated in the case of tradedevelopments in IT products. Asia’s exports of office and telecomequipment decreased by 16%, while those of China rose by20%, and accounted for nearly 14% of Asia’s exports in thisproduct category. Asia continues to be the region with the
17 Food exports increased slightly while exports of clothing decreased by 2%.
a Asia(5) comprises the five countries most affected by the financial crisis in 1997/98: Indonesia, The republic of Korea, Malaysia, Philippines and Thailand.
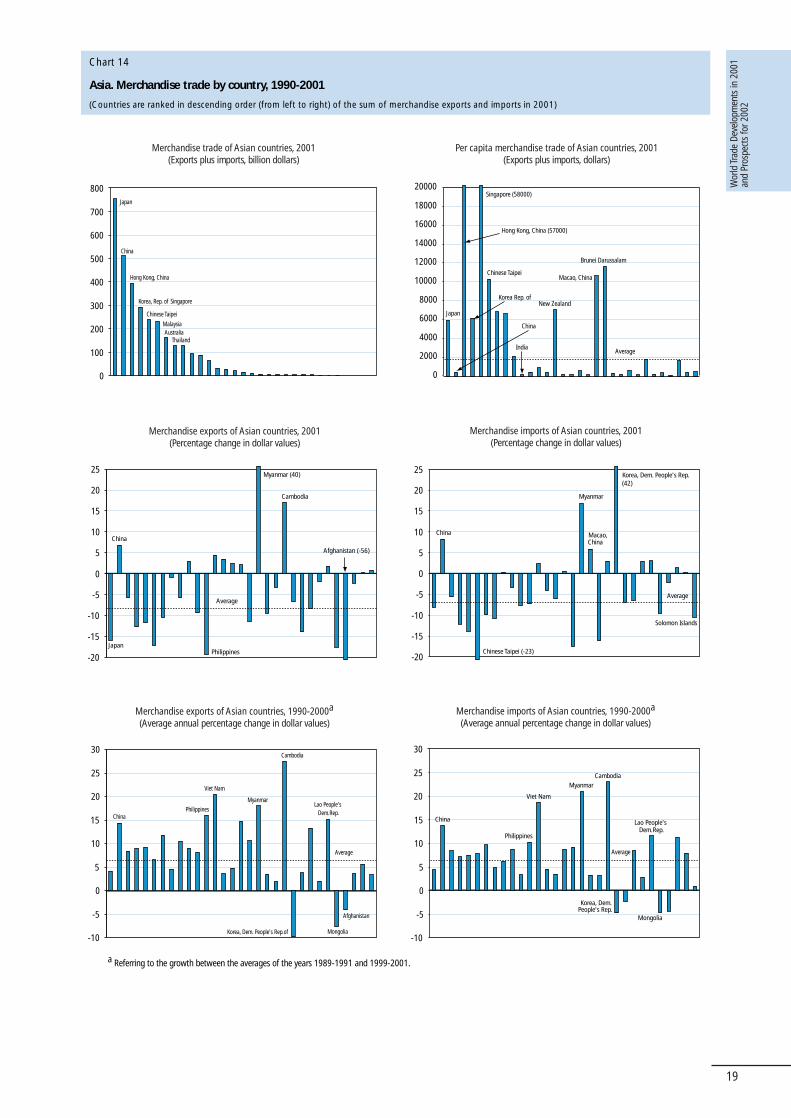
Wor
ld Tr
ade
Deve
lopm
ents
in 2
001
and
Pros
pect
s fo
r 200
2
19
a Referring to the growth between the averages of the years 1989-1991 and 1999-2001.
Chart 14
Asia. Merchandise trade by country, 1990-2001
(Countries are ranked in descending order (from left to right) of the sum of merchandise exports and imports in 2001)
Merchandise trade of Asian countries, 2001(Exports plus imports, billion dollars)
Merchandise exports of Asian countries, 1990-2000a
(Average annual percentage change in dollar values)
Per capita merchandise trade of Asian countries, 2001(Exports plus imports, dollars)
Merchandise exports of Asian countries, 2001(Percentage change in dollar values)
Merchandise imports of Asian countries, 1990-2000a
(Average annual percentage change in dollar values)
Merchandise imports of Asian countries, 2001(Percentage change in dollar values)
0
100
200
300
400
500
600
700
800Japan
China
Hong Kong, China
Korea, Rep. of Singapore
Chinese Taipei
MalaysiaAustralia
Thailand
-10
-5
0
5
10
15
20
25
30
China
Mongolia
Viet Nam
Cambodia
Average
Korea, Dem. People's Rep.of
Philippines
MyanmarLao People's
Dem.Rep.
Afghanistan
-10
-5
0
5
10
15
20
25
30
Korea, Dem. People's Rep.
Viet Nam
Cambodia
Average
China
Philippines
Myanmar
Lao People's Dem.Rep.
Mongolia
0
2000
4000
6000
8000
10000
12000
14000
16000
18000
20000
Average
Japan
Hong Kong, China (57000)
Singapore (58000)
Chinese Taipei
Brunei Darussalam
China
Korea Rep. of
India
Macao, China
New Zealand
-20
-15
-10
-5
0
5
10
15
20
25
Japan
Myanmar (40)
Average
Afghanistan (-56)
Cambodia
China
Philippines-20
-15
-10
-5
0
5
10
15
20
25
Myanmar
China
Korea, Dem. People's Rep.(42)
Macao, China
Average
Solomon Islands
Chinese Taipei (-23)
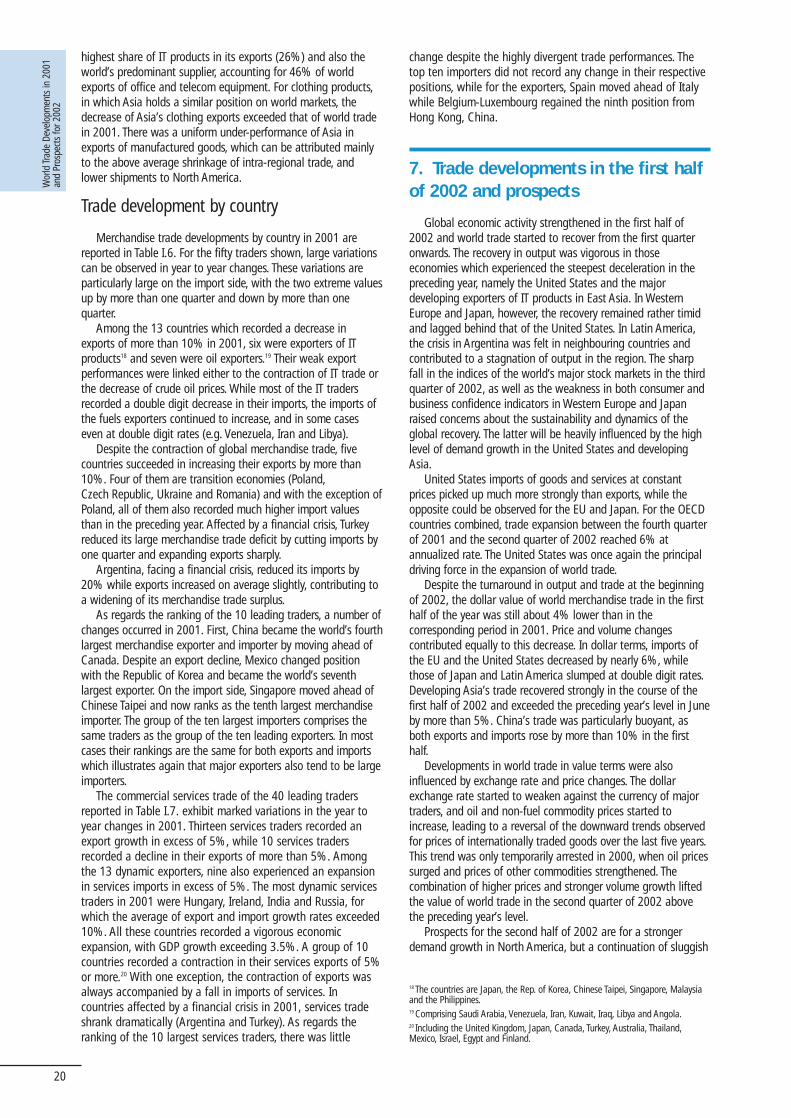
Wor
ld Tr
ade
Deve
lopm
ents
in 2
001
and
Pros
pect
s fo
r 200
2
20
highest share of IT products in its exports (26%) and also theworld’s predominant supplier, accounting for 46% of worldexports of office and telecom equipment. For clothing products,in which Asia holds a similar position on world markets, thedecrease of Asia’s clothing exports exceeded that of world tradein 2001. There was a uniform under-performance of Asia inexports of manufactured goods, which can be attributed mainlyto the above average shrinkage of intra-regional trade, andlower shipments to North America.
Trade development by country
Merchandise trade developments by country in 2001 arereported in Table I.6. For the fifty traders shown, large variationscan be observed in year to year changes. These variations areparticularly large on the import side, with the two extreme valuesup by more than one quarter and down by more than onequarter.
Among the 13 countries which recorded a decrease inexports of more than 10% in 2001, six were exporters of ITproducts18 and seven were oil exporters.19 Their weak exportperformances were linked either to the contraction of IT trade orthe decrease of crude oil prices. While most of the IT tradersrecorded a double digit decrease in their imports, the imports ofthe fuels exporters continued to increase, and in some caseseven at double digit rates (e.g. Venezuela, Iran and Libya).
Despite the contraction of global merchandise trade, fivecountries succeeded in increasing their exports by more than10%. Four of them are transition economies (Poland,Czech Republic, Ukraine and Romania) and with the exception ofPoland, all of them also recorded much higher import valuesthan in the preceding year. Affected by a financial crisis, Turkeyreduced its large merchandise trade deficit by cutting imports byone quarter and expanding exports sharply.
Argentina, facing a financial crisis, reduced its imports by20% while exports increased on average slightly, contributing toa widening of its merchandise trade surplus.
As regards the ranking of the 10 leading traders, a number ofchanges occurred in 2001. First, China became the world’s fourthlargest merchandise exporter and importer by moving ahead ofCanada. Despite an export decline, Mexico changed positionwith the Republic of Korea and became the world’s seventhlargest exporter. On the import side, Singapore moved ahead ofChinese Taipei and now ranks as the tenth largest merchandiseimporter. The group of the ten largest importers comprises thesame traders as the group of the ten leading exporters. In mostcases their rankings are the same for both exports and importswhich illustrates again that major exporters also tend to be largeimporters.
The commercial services trade of the 40 leading tradersreported in Table I.7. exhibit marked variations in the year toyear changes in 2001. Thirteen services traders recorded anexport growth in excess of 5%, while 10 services tradersrecorded a decline in their exports of more than 5%. Amongthe 13 dynamic exporters, nine also experienced an expansionin services imports in excess of 5%. The most dynamic servicestraders in 2001 were Hungary, Ireland, India and Russia, forwhich the average of export and import growth rates exceeded10%. All these countries recorded a vigorous economicexpansion, with GDP growth exceeding 3.5%. A group of 10countries recorded a contraction in their services exports of 5%or more.20 With one exception, the contraction of exports wasalways accompanied by a fall in imports of services. Incountries affected by a financial crisis in 2001, services tradeshrank dramatically (Argentina and Turkey). As regards theranking of the 10 largest services traders, there was little
change despite the highly divergent trade performances. Thetop ten importers did not record any change in their respectivepositions, while for the exporters, Spain moved ahead of Italywhile Belgium-Luxembourg regained the ninth position fromHong Kong, China.
7. Trade developments in the first halfof 2002 and prospects
Global economic activity strengthened in the first half of2002 and world trade started to recover from the first quarteronwards. The recovery in output was vigorous in thoseeconomies which experienced the steepest deceleration in thepreceding year, namely the United States and the majordeveloping exporters of IT products in East Asia. In WesternEurope and Japan, however, the recovery remained rather timidand lagged behind that of the United States. In Latin America,the crisis in Argentina was felt in neighbouring countries andcontributed to a stagnation of output in the region. The sharpfall in the indices of the world’s major stock markets in the thirdquarter of 2002, as well as the weakness in both consumer andbusiness confidence indicators in Western Europe and Japanraised concerns about the sustainability and dynamics of theglobal recovery. The latter will be heavily influenced by the highlevel of demand growth in the United States and developingAsia.
United States imports of goods and services at constantprices picked up much more strongly than exports, while theopposite could be observed for the EU and Japan. For the OECDcountries combined, trade expansion between the fourth quarterof 2001 and the second quarter of 2002 reached 6% atannualized rate. The United States was once again the principaldriving force in the expansion of world trade.
Despite the turnaround in output and trade at the beginningof 2002, the dollar value of world merchandise trade in the firsthalf of the year was still about 4% lower than in thecorresponding period in 2001. Price and volume changescontributed equally to this decrease. In dollar terms, imports ofthe EU and the United States decreased by nearly 6%, whilethose of Japan and Latin America slumped at double digit rates.Developing Asia’s trade recovered strongly in the course of thefirst half of 2002 and exceeded the preceding year’s level in Juneby more than 5%. China’s trade was particularly buoyant, asboth exports and imports rose by more than 10% in the firsthalf.
Developments in world trade in value terms were alsoinfluenced by exchange rate and price changes. The dollarexchange rate started to weaken against the currency of majortraders, and oil and non-fuel commodity prices started toincrease, leading to a reversal of the downward trends observedfor prices of internationally traded goods over the last five years.This trend was only temporarily arrested in 2000, when oil pricessurged and prices of other commodities strengthened. Thecombination of higher prices and stronger volume growth liftedthe value of world trade in the second quarter of 2002 abovethe preceding year’s level.
Prospects for the second half of 2002 are for a strongerdemand growth in North America, but a continuation of sluggish
18 The countries are Japan, the Rep. of Korea, Chinese Taipei, Singapore, Malaysiaand the Philippines.19 Comprising Saudi Arabia, Venezuela, Iran, Kuwait, Iraq, Libya and Angola.20 Including the United Kingdom, Japan, Canada, Turkey, Australia, Thailand,Mexico, Israel, Egypt and Finland.
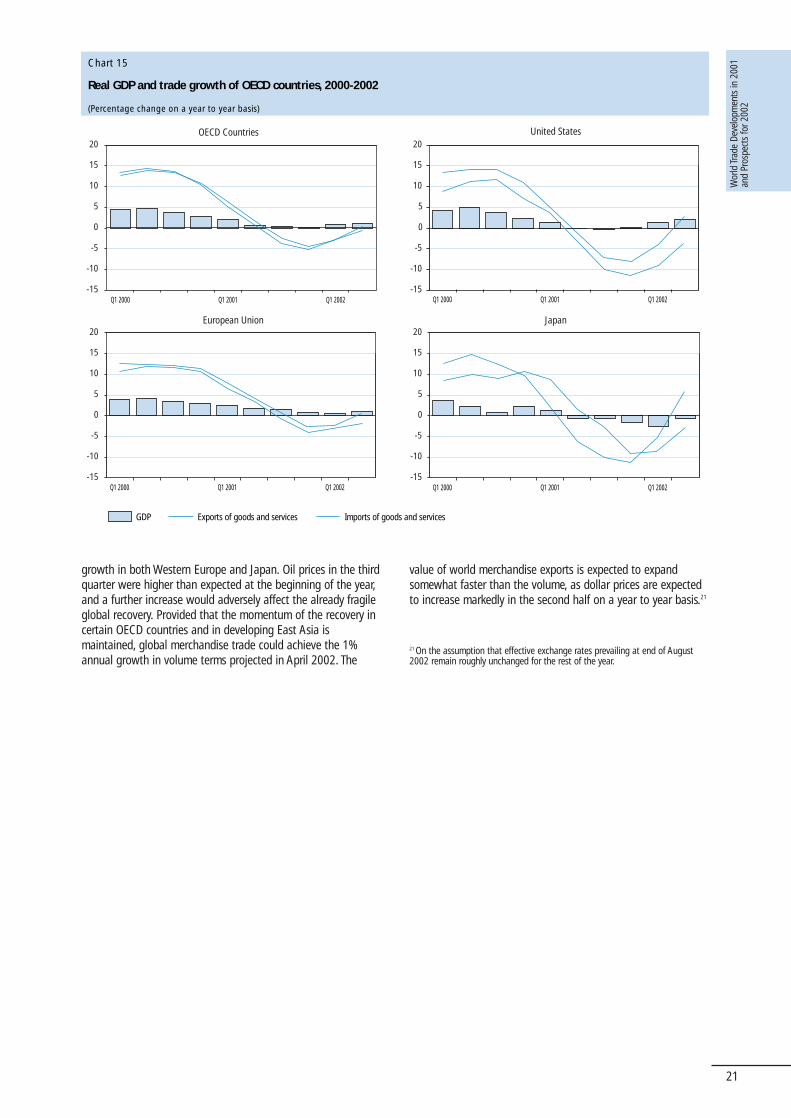
Wor
ld Tr
ade
Deve
lopm
ents
in 2
001
and
Pros
pect
s fo
r 200
2
21
growth in both Western Europe and Japan. Oil prices in the thirdquarter were higher than expected at the beginning of the year,and a further increase would adversely affect the already fragileglobal recovery. Provided that the momentum of the recovery incertain OECD countries and in developing East Asia ismaintained, global merchandise trade could achieve the 1%annual growth in volume terms projected in April 2002. The
value of world merchandise exports is expected to expandsomewhat faster than the volume, as dollar prices are expectedto increase markedly in the second half on a year to year basis.21
21 On the assumption that effective exchange rates prevailing at end of August2002 remain roughly unchanged for the rest of the year.
Chart 15
Real GDP and trade growth of OECD countries, 2000-2002
(Percentage change on a year to year basis)
OECD Countries United States
European Union Japan
-15
-10
-5
0
5
10
15
20
-15
-10
-5
0
5
10
15
20
-15
-10
-5
0
5
10
15
20
-15
-10
-5
0
5
10
15
20
Q1 2000 Q1 2001 Q1 2002
Q1 2000 Q1 2001 Q1 2002
Q1 2000 Q1 2001 Q1 2002
Q1 2000 Q1 2001 Q1 2002
Exports of goods and services GDP Imports of goods and services