world, us, saudi arabia, russia & uk oil production ... · 1 jean laherrere 3 august 2016...
TRANSCRIPT
1
Jean Laherrere 3 August 2016
World, US, Saudi Arabia, Russia & UK oil production & reserves -Comments on Rystad 2016 world reserves
After my two papers (http://aspofrance.org/files/JL_2016USoilultimate.pdf and http://aspofrance.org/files/JL_2016_California.pdf) on US & California oil production, I continue to study the oil reserves data on mature oil basins. -Reliability of oil reserves Publishing data is a political act depending upon the image the operator wants to give. Within the large uncertainty on measures or estimates, the operator chooses one value using a louse definition and the unit (volume, weight or energy) to appear either poor in front of the taxes or rich in front of the bankers or shareholders. In my 2008 paper «Why are remaining oil & gas reserves from political/financial sources and technical sources so different? » International Geological Congress Oslo 11 August 2008 http://aspofrance.viabloga.com/files/JL-IGC2008-part1.pdf http://aspofrance.viabloga.com/files/JL-IGC2008-part2.pdf http://aspofrance.viabloga.com/files/JL-IGC2008-part3.pdf I wrote There is no consensus on oil reserves definitions with 4 systems in use: • US: all energy companies listed in the US stock market are obliged by the SEC (1978 rules) to report only proved reserves (1P), assumed to be the minimum; these reserves are audited. SEC is presently changing the rules allowing the report of probable in 2009 • OPEC: because quotas depend upon reserves, OPEC members report proved reserves (1P), which corresponds to their wishes since they are not audited. • FSU classification: ABC1 (Khalimov 1979) reports maximum theoretical recovery, being about equal to proven plus probable plus possible (3P). Khalimov in 1993 stated that Russian reserves were grossly exaggerated. • Rest of the world: SPE/WPC (1997) classification, definition and guidelines (I was a member of the task force, which introduced probability) reports reserves as proven plus probable (2P), close to the expected value used to compute the net present value of the development, when decided. In front of uncertainty, probabilistic approach should be the rule, but the deterministic approach is used by many because reluctance and poor knowledge of probability and SEC rules. But in deterministic approach, it is wrong to add up the field proved reserves to get the country proved reserves, and to add up the proved country reserves to get the world proved reserves, because proved is assumed to be close to the minimum and it is unlikely that all items would be at the minimum. The addition underestimates the global proved value. Only mean field (country) values can be added to obtain the mean country (world) values. In 2010 SEC rules were changed in order to allow reporting proved undeveloped reserves (PUDs); moving from a conservative estimate (only proved reserves within the spacing units of producing wells) to an optimist estimate (allowing a confidential project to be drilled within five years). SEC changed also the rules from using the oil price at end-year to the year average. In contrary SPE/WPC (now PRMS) 2P are estimated forecasting investments, production and revenues with oil price during the entire life of the field. 1P reserves depend upon annual change in oil price when 2P do not. SEC rules since 1977 to 2010 were clear (Laherrère J.H. 2004 «Shell’s reserves decline and the SEC’s obsolete rule book » Energy Politics issue II summer p23-45, draft

2
http://www.hubbertpeak.com/laherrere/ShellDecline2004.pdf, Laherrère J.H. 1998 "The evolution of the world's hydrocarbons reserves" translation of SPE June 17, http://dieoff.com/page178.htm): "proved reserves" were quantities that geological and engineering information indicated with reasonable certainty could be commercially recovered from known reservoirs. First definition of proved by API in 1961 was "beyond reasonable doubt" There is no definition on “reasonable certainty” but the DFA (Drug and Food Administration) allows the sale of product only if “reasonable certainty” of no harm. It seems for the consumer that reasonable should correspond to a high probability. In fact for SPE (Society of Petroleum Engineers) rules, proved corresponds with a probability of 90%. In 1996 a reserves expert Capen stated: "An industry that prides itself on its use of science, technology and frontier risk assessment finds itself in the 1990s with a reserve definition more reminiscent of the 1890s" "illegal addition of proved reserves" Aggregation of field proved reserves to get the proved reserves of a basin, a State or a country (as usually done by most official agencies) is scientifically wrong as stated by Capen. In my 2007 paper (Laherrère J.H. 2007 «Uncertainty of data and forecasts for fossil fuels» Universidad de Castilla-La Mancha, Ciudad Real, 24 April www.hubbertpeak.com/laherrere/Castilla200704.pdf ) I wrote: The addition of minimum field reserves is not the minimum of the country reserves because it is unlikely that all field values will be at minimum. It is as giving the same probability of getting 1 with one die (1 out of 6) and 6 with six dice (1 out of 36). Only the addition of mean (expected value) field give the mean value of the country. Only the product of mode values (most likely) is the mean of the product. It is incorrect to aggregate independent proved reserves (as they are in aggregation of countries) and SPE 2006 draft reserve definition shows that it could underestimate the real proved by about 100% Figure 3: Comparison of arithmetic aggregation and probabilistic aggregation from SPE 2006
SEC rules should be changed and should allow, in addition to proved data, to provide proven plus probable or expected value. Incorrect aggregation should be emphasized. Current proved values are no use to be extrapolated form forecasting future production, when backdated mean values allow to plot creaming curves or logistic cumulative plot to assess ultimates. Estimating oil reserves of a field is easy in theory, less in practice. Field oil reserves are simply the volume of oil in the field multiply by the recovery factor. The volume of oil is the area of the trap, multiplied by the net pay thickness and the porosity. Area is

3
measured on seismic map calibrated by wells, net pay is measured on log, porosity on cores and logs. Recovery is taken from past experience on mature similar fields. Estimations of conventional oil reserves (+ cumulative production at the end of the field) were checked in thousand of almost exhausted fields and improved with time. For long time estimations were deterministic, but because the uncertainty of the estimate was large, probabilistic methods were developed and the definitions of 1P & 2P reserves were better defined. However oil recovery factors from the estimate of reserves and oil in place of 17 200 fields (world outside North America non frontier) shows that there is a huge cloud where average cannot be estimated. Round figures (or fraction) are often used because uncertainty and guess.
The median value of these 17 200 fields can be either 41 % is computed on reserves or 25 % if computed on number of fields, when the average is 26%. Each field is different and speaking about world average is useless.
0!
10!
20!
30!
40!
50!
60!
70!
80!
90!
0! 0! 0! 1! 10! 100! 1 000! 10 000! 100 000! 1 000 000!
reco
very
fact
or %!
field oil reserves Mb log scale!
world (outside US+Canada non frontier) 17 200 oilfields recovery factor!
Jean Laherrere Oct 2010!0,1$0,01$0,001$
0!
1720!
3440!
5160!
6880!
8600!
10320!
12040!
13760!
15480!
17200!
0!
200!
400!
600!
800!
1000!
1200!
1400!
1600!
1800!
2000!
0! 10! 20! 30! 40! 50! 60! 70! 80! 90! 100!
cum
ulat
ive
num
ber o
f oilfi
elds!
cum
ulat
ive
oil r
eser
ves G
b!
oil recovery factor %!
World (outside NAm non frontier) cumulative reserves and cumulative number of fields versus oilfield recovery factor!
cum reserves Gb!cum number fields!
Jean Laherrere Oct 2010 !
median value !-for reserves = 41%!-for number of field = 25%!average 17 200 fields = 26 %!
! !! !!
4
Reserve estimate can be a few multiplication or a Monte Carlo simulation involving all the geological, geophysical and production data from wells, logs, cores, fluids production & pressures data needing huge computers and long time when the number of cells of the field can be up to 100 millions as for Ghawar. Initial reserves at a certain date are past cumulative production at this date plus future production from this date until exhaustion. It means that only operators (and partners) with all the confidential data can really estimate reserves. But there are many assumptions on future investments and revenues (oil price) and uncertainties, leading to a large range of estimates within a company (between geologists, reservoir engineers and producers). There are also large discrepancies within partners having the same data, because using different techniques and mainly different assumptions. Outsiders without the confidential data can only rely on scout companies or on published production data (if any). Extrapolation of past production is not reliable but can give some indication. The example of coal reserves on mature coal mines (France & UK) shows that extrapolation of past production could be better than the estimate of reserves where reserves are confused with resources. If conventional reserves estimates are reliable and the recovery factor fairly well estimated, it is because the techniques have been checked and improved on thousands mature fields close to exhaustion, and the conventional oil & gas reserves ultimate of a basin represents a very small percentage (about 1%) of the hydrocarbons generated by the source-rocks, leaving a large amount in the ground as resources. In contrary LTO fields are new (after 2008); they are called “continuous type accumulations” by USGS, without any water contact and far from exhaustion, there are not enough historical data to check the methodology and in particular the recovery factor. No one can claim to be right in estimating LTO reserves (being the cumulative production when exhausted), because there are no yet any abandoned LTO fields. Unconventional oil reserve cannot be estimated using oil in place and recovery factor as it is done for conventional fields is wrong. Only a small part of the so called shale play area is economical and most production is located in “sweet spots”. Most of the sweet spots are been heavily drilled and fractured. The increase in LTO production using longer horizontal wells and more fracking is real, but most forecasts are based on the number of wells drilled in the future without any geological study of where they can be drilled. There is not enough LTO historical production to verify the way LTO reserves are estimated. Most LTO reserves estimate are carried out by estimating the amount of oil and gas generated by the source-rocks and by using a recovery factor The first LTO Bakken large field was Elm Coulee in Montana (in North Dakota Bakken Antelope field found in 1953 is small ≈12 Mb), which started to produce in 2000 and peaked in 2006 with a first decline about 15%/a, a new peak in 2014 (the growth of the number of wells did increase in 2010) and then a decline about 12%/a, leading towards an ultimate of 235 Mb

5
The oil decline of the short period 2014-2015 trends towards 235 Mb, when ultimate reserves were estimated by Walker AAPG 2006 at 270 Mb and by Harris (http://oaktrust.library.tamu.edu/bitstream/handle/1969.1/151644/HARRIS-THESIS-2013.pdf?sequence=1) between 160 and 190 Mb
it is hard to estimate ultimate for LTO fields. Montana displays a monthly crude oil production curve which correlates with the number of rigs after a shift of 15 months. There is no rigs in Montana since December 2015. The number of rigs is not a good indicator because the length of the horizontal drilling increases as the number of fracks.
0!
100!
200!
300!
400!
500!
600!
700!
800!
900!
1000!
0!
2!
4!
6!
8!
10!
12!
14!
16!
18!
20!
2000! 2005! 2010! 2015! 2020! 2025! 2030!
num
ber
of w
ells!
annu
al p
rodu
ctio
n M
b/a!
year!
Elm Coulee Montana Bakken oil production!
decline 12%/a!decline 15%/a!Bakken!other reservoirs!wells!
Jean Laherrere July 2016!
http://www.bogc.dnrc.mt.gov/WebApps/DataMiner/Production/ProdAnnualField.aspx!
The State of Montana has no drilling rig since December 2015!!
0!
100!
200!
300!
400!
500!
600!
700!
800!
900!
1000!
0!
2!
4!
6!
8!
10!
12!
14!
16!
18!
20!
0! 50! 100! 150! 200! 250! 300!
num
ber
of w
ells!
annu
al p
rodu
ctio
n M
b/a!
cumulative production Mb!
Elm Coulee Montana oil decline 2000-2015!
2000-2007!
2014-2015!
Jean Laherrere July 2016!
EIA end 2013 top 100 oil fields!Eagleville ! = 1!Spraeberry trend = 2!Prudhoe Bay ! = 3!Elm Coulee ! = 34!!
The State of Montana has no drilling rig since December 2015!!
ultimate 270 Mb Walker AAPG 2006!ultimate 160-190 Mb Harris 2013!

6
Montana annual crude oil production displays sharp peaks: 1926, 1968, 2006 & 2014
Toreador (American oil promoter bought later by Hess) took some leases in the Paris Basin (France) on the similarity with the Bakken play. In a presentation in 2009 Toreador http://www.toreador.net/images/presentations/TRGL_Presentation_01October09.pdf displays logs in Paris Basin and Williston Basin with source rock and tight reservoir. A main reason for shale oil being called light tight oil is that the reservoir is more a tight reservoir than a shale
0!
5!
10!
15!
20!
25!
30!
0,0!
0,5!
1,0!
1,5!
2,0!
2,5!
3,0!
3,5!
1980! 1985! 1990! 1995! 2000! 2005! 2010! 2015! 2020!
num
ber o
f rig
s!
mon
thly
pro
duct
ion
Mb!
year!
Montana crude oil monthly production & number of rigs!
EIAmonthly Mb!dnrc.mt.gov!rigs!rigs shift 15 months !
Jean Laherrere July 2016!
0!
5!
10!
15!
20!
25!
30!
35!
40!
45!
50!
1910! 1920! 1930! 1940! 1950! 1960! 1970! 1980! 1990! 2000! 2010! 2020!
annu
al p
rodu
ctio
n M
b, n
umbe
r of
rig
s!
year!
Montana annual oil production from Montana state & EIA!
Montana EIA-DGMN !
all Bakken Mb!
nb rigs!
Jean Laherrere July 2016! http://www.bogc.dnrc.mt.gov!

7
Toreador claims from a serious geochemical study that the oil volume generated by the source rock was 95 Gb in the Paris Basin and 30 Gb under Toreador acreage
A later geochemical study in 2012 by stated that in the study area (9500 km2) 80 Gboe have been generated, but only 16 Gb remain in the source-rocks. Toreador did not talk about reserves but potential, leaving readers to confuse reserves and resources. Unfortunately the wells that Toreador (bought later by Hess) planned to drill to prove such potential were not drilled because France did ban any shale oil drilling. In June 2013 EIA published a report “Technically recoverable shale oil and shale gas resources: an assessment of 137 shale formations in 41 countries outside the US” written by ARI (Advanced Resources International) where the crude oil TRR (technically recoverable resources) were in Gb Russia 75.8
8
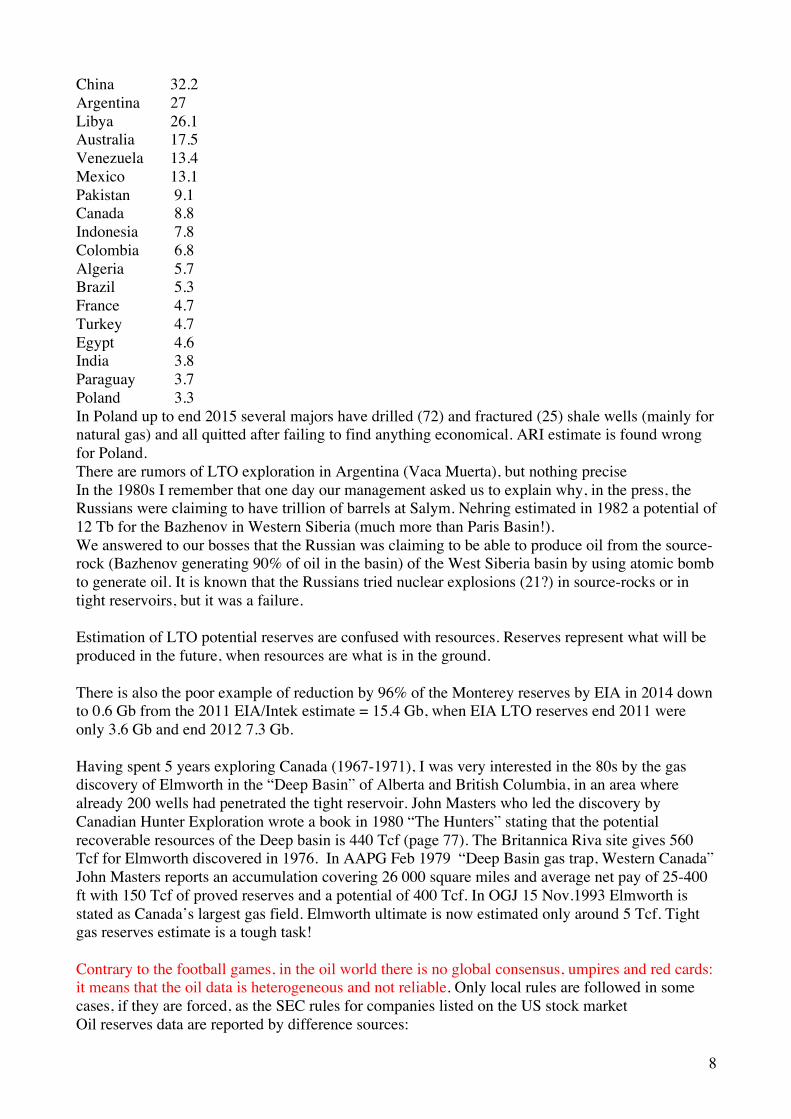
China 32.2 Argentina 27 Libya 26.1 Australia 17.5 Venezuela 13.4 Mexico 13.1 Pakistan 9.1 Canada 8.8 Indonesia 7.8 Colombia 6.8 Algeria 5.7 Brazil 5.3 France 4.7 Turkey 4.7 Egypt 4.6 India 3.8 Paraguay 3.7 Poland 3.3 In Poland up to end 2015 several majors have drilled (72) and fractured (25) shale wells (mainly for natural gas) and all quitted after failing to find anything economical. ARI estimate is found wrong for Poland. There are rumors of LTO exploration in Argentina (Vaca Muerta), but nothing precise In the 1980s I remember that one day our management asked us to explain why, in the press, the Russians were claiming to have trillion of barrels at Salym. Nehring estimated in 1982 a potential of 12 Tb for the Bazhenov in Western Siberia (much more than Paris Basin!). We answered to our bosses that the Russian was claiming to be able to produce oil from the source-rock (Bazhenov generating 90% of oil in the basin) of the West Siberia basin by using atomic bomb to generate oil. It is known that the Russians tried nuclear explosions (21?) in source-rocks or in tight reservoirs, but it was a failure. Estimation of LTO potential reserves are confused with resources. Reserves represent what will be produced in the future, when resources are what is in the ground. There is also the poor example of reduction by 96% of the Monterey reserves by EIA in 2014 down to 0.6 Gb from the 2011 EIA/Intek estimate = 15.4 Gb, when EIA LTO reserves end 2011 were only 3.6 Gb and end 2012 7.3 Gb. Having spent 5 years exploring Canada (1967-1971), I was very interested in the 80s by the gas discovery of Elmworth in the “Deep Basin” of Alberta and British Columbia, in an area where already 200 wells had penetrated the tight reservoir. John Masters who led the discovery by Canadian Hunter Exploration wrote a book in 1980 “The Hunters” stating that the potential recoverable resources of the Deep basin is 440 Tcf (page 77). The Britannica Riva site gives 560 Tcf for Elmworth discovered in 1976. In AAPG Feb 1979 “Deep Basin gas trap, Western Canada” John Masters reports an accumulation covering 26 000 square miles and average net pay of 25-400 ft with 150 Tcf of proved reserves and a potential of 400 Tcf. In OGJ 15 Nov.1993 Elmworth is stated as Canada’s largest gas field. Elmworth ultimate is now estimated only around 5 Tcf. Tight gas reserves estimate is a tough task! Contrary to the football games, in the oil world there is no global consensus, umpires and red cards: it means that the oil data is heterogeneous and not reliable. Only local rules are followed in some cases, if they are forced, as the SEC rules for companies listed on the US stock market Oil reserves data are reported by difference sources:

9
-oil operators constrained locally by financial rules (SEC with audit for companies listed on the US stock market) or political rules (quotas and no audit for the OPEC members). Oil operators have several estimates of oil reserves: technical estimates using the SPE rules (used in the net present value to decide on the development of a field, most of the times coming from a field simulation needing very large computers), financial estimates to comply with the SEC rules (used for the annual report). NOCs publish what their government wants. Only operators have all the confidential data (well data and seismic) to estimate properly reserves: they rarely report field reserves as field production. Their annual report publishes 1P reserves by country (wrong arithmetic aggregation leading as described above to a large underestimation and to reserve growth because this poor practice), but not 2P reserves (which can add field 2P).
-energy agencies (as IEA = club of consumers or OPEC = club of producers) do not have the data, the expertise, the software and the hardware to estimate field reserves. They collect the data from their members (countries) without being able to check the quality. OPEC monthly report publishes two sets of production data: the first from direct communication and the second (judged more reliable) from secondary sources. Arguing national data from a government could be taken as an attack against sovereignty!
-government agencies as EIA, or State department of resources (CA DOGGR, TX RRC), or BOEM for US federal, or NEB in Canada, or DECC (now DBEIS) in UK or NPD in Norway have to report oil production & reserves data, but it is done globally and seldom by field (except UK, Norway, CA). Because of confidentiality of some discoveries Texas allows a delay of two years before reporting the right data. But EIA does not report production measures, but estimates (sample with few producers in only 15 states and Federal GOM: see EIA-914 and EIA-914 expansion) and in the past production was based on tax information. EIA is continuously correcting the data, which is only stabilized after more than 2 years!
-petroleum associations as CAPP= Canadian Association of Petroleum Producers, which has the huge advantage to get homogeneous data being the source and having the same definition
-oil scout companies (as IHS, Rystad, Enerdata) collect data and sell the result to operators who want to know what the competition is doing. In North America most oil companies have their own scouts who belong to oil scout association (http://www.oilscouts.com/what-is-a-scout/). With a very large number of oil companies in the US (over 20 000) the competition is severe because oil belongs to the owners of the land, so deals must be done by petroleum landmen with millions of landowners and it is important to keep confidential any data which gives some advantage to the producer. In the rest of the world where oil belongs to governments selling their rights thru bid, any additional confidential data will help in bidding and scouting is very active. But scouts are good in getting data, but are not competent in estimating reserves. The collected data is heterogeneous with unknown definition (reserves could be 1P developed or 1P developed & undeveloped or 2P or ABC1). It is wrong to aggregate heterogeneous data that you do not fully understand. -Rystad 2016 reserves estimate Rystad published in 4th July 2016 an article claiming: “United States now holds more oil reserves than Saudi Arabia http://www.rystadenergy.com/NewsEvents/PressReleases/united-states-now-holds-more-oil-reserves-than-saudi-arabia. Rystad reports a world oil (crude oil +condensate) remaining reserves without stating at which date (end of 2014 or 2015?), with a range from 1P = 381 Gb for existing fields, 2P = 655 Gb (274 Gb probable) for existing fields, 2PC = 1152 Gb (497 Gb in discoveries) = most likely estimate for existing fields and discoveries and 2PCX = 2092 Gb (600 Gb unconventional & 940 Gb in yet to find) = most likely estimate for existing fields, discoveries and yet undiscovered fields
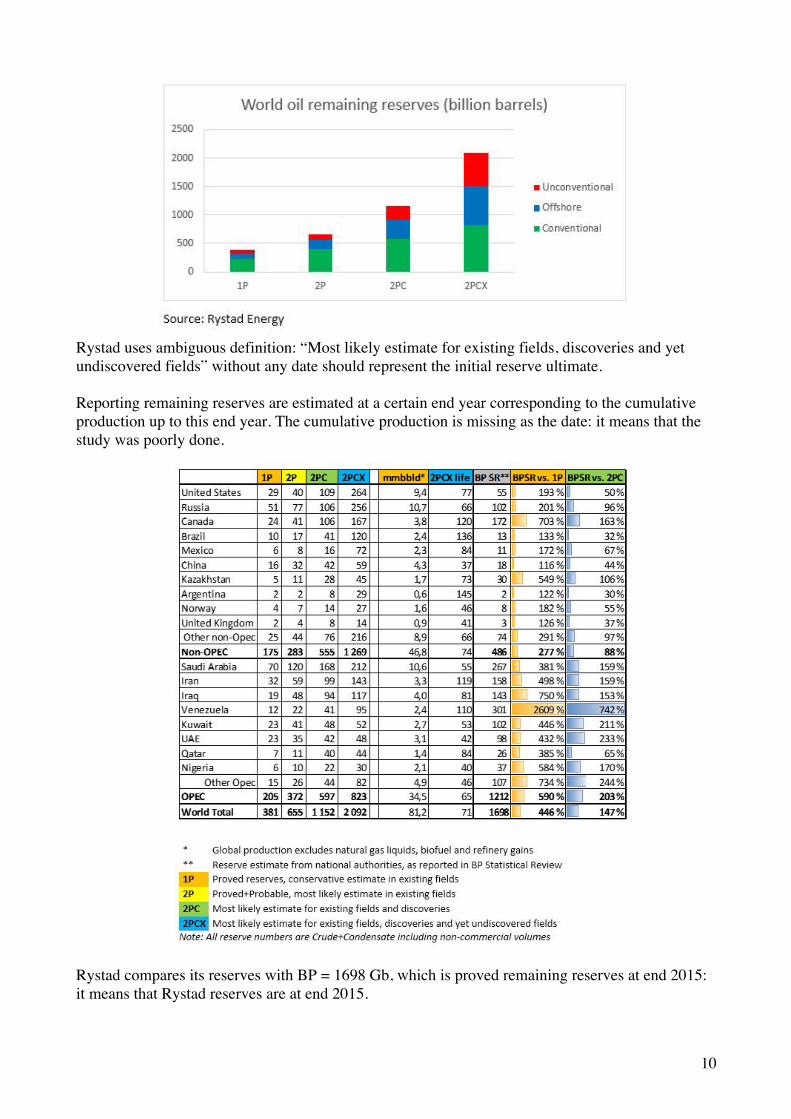
10
Rystad uses ambiguous definition: “Most likely estimate for existing fields, discoveries and yet undiscovered fields” without any date should represent the initial reserve ultimate. Reporting remaining reserves are estimated at a certain end year corresponding to the cumulative production up to this end year. The cumulative production is missing as the date: it means that the study was poorly done.
Rystad compares its reserves with BP = 1698 Gb, which is proved remaining reserves at end 2015: it means that Rystad reserves are at end 2015.

11
Rystad writes that more than half of the US remaining oil reserves are unconventional shale oil. Shale oil is now called “light tight oil” (LTO) in the US for two reasons: first reason is that production from the Bakken, Permian Basin is not from a shale source rock but from tight reservoirs close to the source rock and Eagle Ford source rock is more a carbonate than a shale; second reason is to avoid confusion with “oil shale”, which is an immature source rock needing pyrolysis to become oil. Rystad should use the right term and the right definition. But now it is known that most of the generated oil generated by the source rock in the oil kitchen stays in the ground or is lost at surface. Our study of the main Petroleum Systems (Laherrère J.H., A.Perrodon, G.Demaison 1994 “Undiscovered Petroleum Potential” Petroconsultants report, 383p) have found that only about 1% of the generated hydrocarbons will be produced from conventional fields. Rystad confuses reserves and resources. -world There is a huge difference between the world oil remaining reserves as reported in official proved reserves (IEA, EIA, OPEC, BP, OGJ) (brown curve) and the confidential backdated 2P reserves (green curve). The world conventional 2P remaining reserves at end 2014 is about 800 Gb from IHS data, which is lower than Rystad 900 Gb (2PC less unconventional)
Rystad is showing in their graph of conventional discoveries and production 2000-2015 that for this period conventional oil and gas discoveries are about half of the conventional production: it means that remaining 2P reserves are decreasing sharply, in contrary of the political/financial 1P on the rise since 1950
0!
200!
400!
600!
800!
1000!
1200!
1400!
1600!
1800!
1920! 1930! 1940! 1950! 1960! 1970! 1980! 1990! 2000! 2010! 2020!
rem
aini
ng r
eser
ves G
b!
year!
World remaining oil reserves !from political/financial and technical sources!
technical = backdated 2P excl XH!technical 2P SciAm 1998! current 1P reserves EIA/OGJ!
Jean Laherrere July 2016! Sources: IHS, USDOE, CAPP, API, OGJ !
-omission of probable!-incorrect aggregation!
Ghawar!
including tarsands!+200 Gb Venezuela!+175 Gb Canada!
OPEC fight for quotas!+300 Gb = speculative resources al-Husseini!
excluding 215 Gb Orinoco from 1936 to 1939!
first production Orinoco 1979!Athabasca 1967!!
WEO 2015 t3.4 remaining!conventional recoverable resources 2228 Gb?!proved 1706 Gb!
OGJ proved at end 2015 on 7 Dec 2015 issue! 1656 Gb!
1700 fields missing compared to 2011!
12
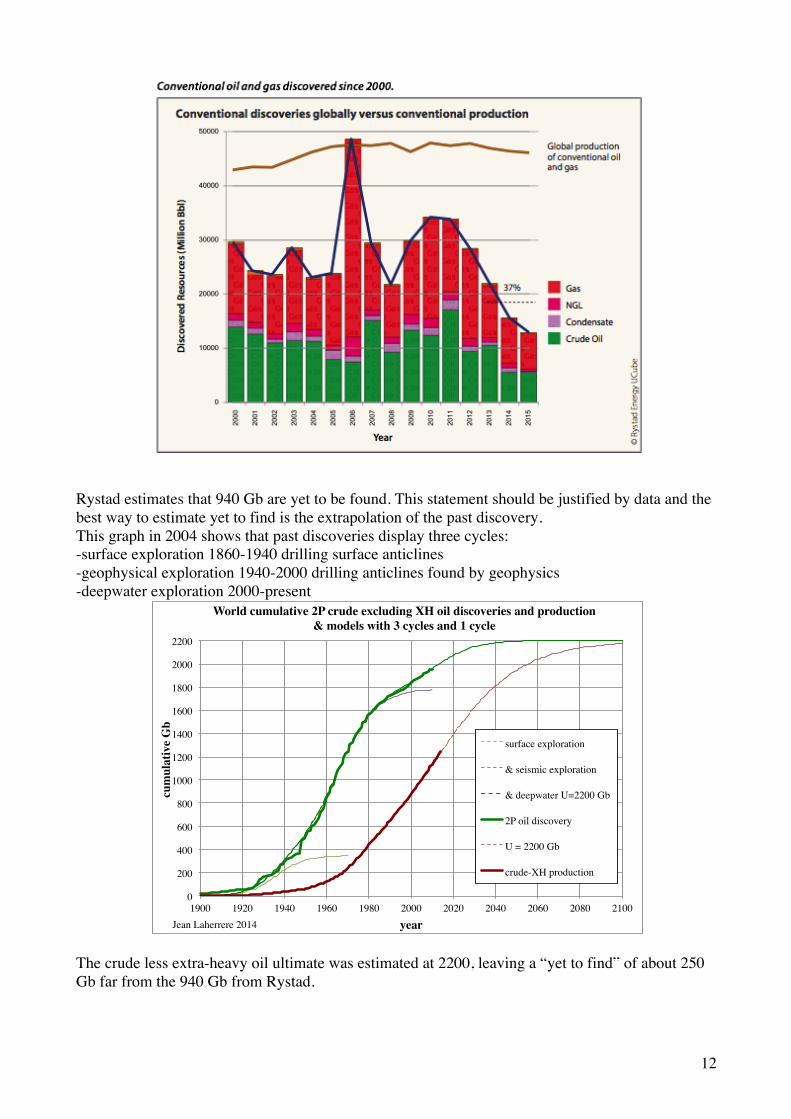
Rystad estimates that 940 Gb are yet to be found. This statement should be justified by data and the best way to estimate yet to find is the extrapolation of the past discovery. This graph in 2004 shows that past discoveries display three cycles: -surface exploration 1860-1940 drilling surface anticlines -geophysical exploration 1940-2000 drilling anticlines found by geophysics -deepwater exploration 2000-present
The crude less extra-heavy oil ultimate was estimated at 2200, leaving a “yet to find” of about 250 Gb far from the 940 Gb from Rystad.
0!
200!
400!
600!
800!
1000!
1200!
1400!
1600!
1800!
2000!
2200!
1900! 1920! 1940! 1960! 1980! 2000! 2020! 2040! 2060! 2080! 2100!
cum
ulat
ive
Gb!
year!
World cumulative 2P crude excluding XH oil discoveries and production & models with 3 cycles and 1 cycle!
surface exploration !
& seismic exploration !
& deepwater U=2200 Gb !
2P oil discovery!
U = 2200 Gb!
crude-XH production!
Jean Laherrere 2014!

13
BP includes in these 1698 Gb 388Gb of extra-heavy oil (Athabasca tarsands = 166 Gb and Orinoco belt= 222 Gb), but Rystad reports only 95 Gb for Venezuela 2PCX when BP reports 301 Gb for 1P: it means that there is a huge difference between Rystad and BP reserves estimates. For me, extra heavy oil reserves are as large in Venezuela as in Canada and much easier (Sincor (Total) was producing without any heat but progressive cavity pump 1000 b/d per well (drilled in one week) and cheaper to produce (Oronoco flows easily) than Athabasca which does not flow and needs to be mined or produced with steam: it was only the nationalization by Chavez of the IOCs producing Orinoco XH oil which stopped the Orinoco production progress, which was in 2008 almost as high as Athabasca about 1 Mb/d. I disagree with Rystad reserves for Venezuela compared to Canada (COP 22 or COP 23 could be for Athabasca what was Chavez for Orinoco) EIA reports now (MER) the world crude oil and condensate (monthly & annual) in the table 11-1b (limited to few countries).
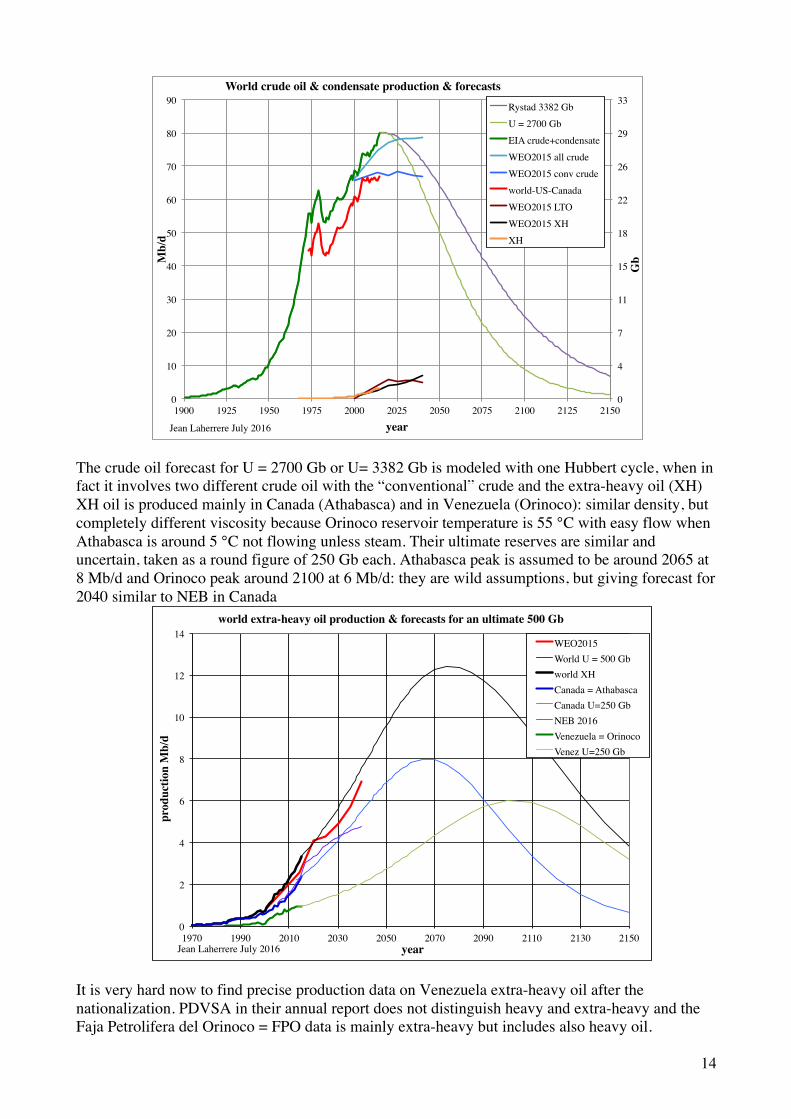
Annual crude oil & condensate production for 2015 is 80 Mb/d with a cumulative production of 1290 Gb. The world less US & Canada is flat since 2004. IEA/WEO2015 forecasts a bumpy plateau 2000-2040 for conventional crude oil production. Rystad reports 81,2 Mb/d, being 1.2 Mb/d higher than EIA: the problem should be like the discrepancy EIA-IEA about the definition of condensate, because IEA and Rystad follows the Norwegian NPD which defines condensate either crude oil if sold with crude oil or NGL if sold with NGL) World crude oil production is plotted since 1900 and forecasted with ultimate 2700 Gb and 3582 Gb (Rystad 2PCX +CP) The assumption is that 2016 will be the peak and it is amazing that both ultimates despite their difference give large decline: in 2040 world crude oil production will be below 70 Mb/d, when IEA/WEO and EIA/IEO still see no peak ahead in their recent forecasts.
0!
10!
20!
30!
40!
50!
60!
70!
80!
90!
1970! 1975! 1980! 1985! 1990! 1995! 2000! 2005! 2010! 2015! 2020!
Mb/
d!
year!
EIA: crude oil & condensate production from some countries!World!world-US-Canada!Total Non-OPEC!Persian Gulf Nations!Russia!Saudi Arabia!United States!Canada!
Jean Laherrere July 2016! EIA/MER June2016!
14
The crude oil forecast for U = 2700 Gb or U= 3382 Gb is modeled with one Hubbert cycle, when in fact it involves two different crude oil with the “conventional” crude and the extra-heavy oil (XH) XH oil is produced mainly in Canada (Athabasca) and in Venezuela (Orinoco): similar density, but completely different viscosity because Orinoco reservoir temperature is 55 °C with easy flow when Athabasca is around 5 °C not flowing unless steam. Their ultimate reserves are similar and uncertain, taken as a round figure of 250 Gb each. Athabasca peak is assumed to be around 2065 at 8 Mb/d and Orinoco peak around 2100 at 6 Mb/d: they are wild assumptions, but giving forecast for 2040 similar to NEB in Canada
It is very hard now to find precise production data on Venezuela extra-heavy oil after the nationalization. PDVSA in their annual report does not distinguish heavy and extra-heavy and the Faja Petrolifera del Orinoco = FPO data is mainly extra-heavy but includes also heavy oil.
0!
4!
7!
11!
15!
18!
22!
26!
29!
33!
0!
10!
20!
30!
40!
50!
60!
70!
80!
90!
1900! 1925! 1950! 1975! 2000! 2025! 2050! 2075! 2100! 2125! 2150!
Gb!M
b/d!
year!
World crude oil & condensate production & forecasts!Rystad 3382 Gb!U = 2700 Gb!EIA crude+condensate!WEO2015 all crude!WEO2015 conv crude!world-US-Canada!WEO2015 LTO!WEO2015 XH!XH!
Jean Laherrere July 2016!
0!
2!
4!
6!
8!
10!
12!
14!
1970! 1990! 2010! 2030! 2050! 2070! 2090! 2110! 2130! 2150!
prod
uctio
n M
b/d!
year!
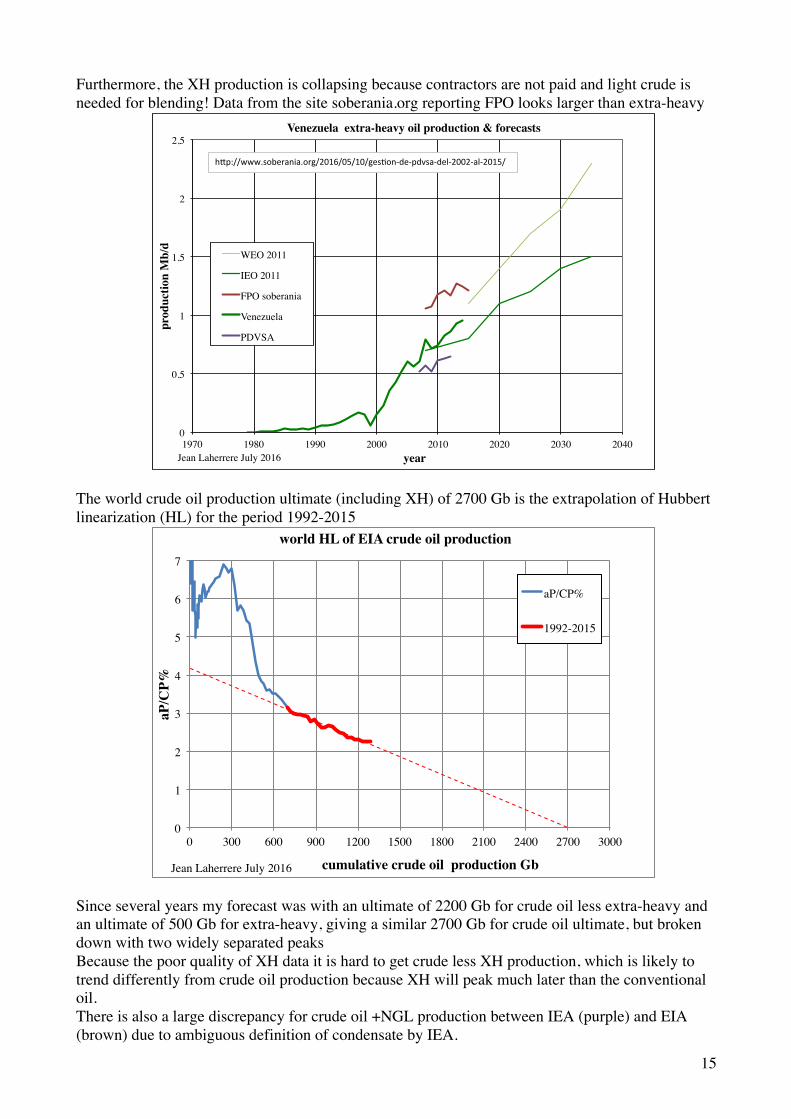
world extra-heavy oil production & forecasts for an ultimate 500 Gb!
WEO2015!World U = 500 Gb!world XH!Canada = Athabasca!Canada U=250 Gb!NEB 2016!Venezuela = Orinoco!Venez U=250 Gb!
Jean Laherrere July 2016!
15
Furthermore, the XH production is collapsing because contractors are not paid and light crude is needed for blending! Data from the site soberania.org reporting FPO looks larger than extra-heavy
The world crude oil production ultimate (including XH) of 2700 Gb is the extrapolation of Hubbert linearization (HL) for the period 1992-2015
Since several years my forecast was with an ultimate of 2200 Gb for crude oil less extra-heavy and an ultimate of 500 Gb for extra-heavy, giving a similar 2700 Gb for crude oil ultimate, but broken down with two widely separated peaks Because the poor quality of XH data it is hard to get crude less XH production, which is likely to trend differently from crude oil production because XH will peak much later than the conventional oil. There is also a large discrepancy for crude oil +NGL production between IEA (purple) and EIA (brown) due to ambiguous definition of condensate by IEA.
0!
0,5!
1!
1,5!
2!
2,5!
1970! 1980! 1990! 2000! 2010! 2020! 2030! 2040!
prod
uctio
n M
b/d!
year!
Venezuela extra-heavy oil production & forecasts !
WEO 2011 !
IEO 2011 !
FPO soberania!
Venezuela !
PDVSA!
Jean Laherrere July 2016!
h"p://www.soberania.org/2016/05/10/ges6on7de7pdvsa7del720027al72015/;
0!
1!
2!
3!
4!
5!
6!
7!
0! 300! 600! 900! 1200! 1500! 1800! 2100! 2400! 2700! 3000!
aP/C
P%!
cumulative crude oil production Gb!
world HL of EIA crude oil production !
aP/CP%!
1992-2015!
Jean Laherrere July 2016!
16
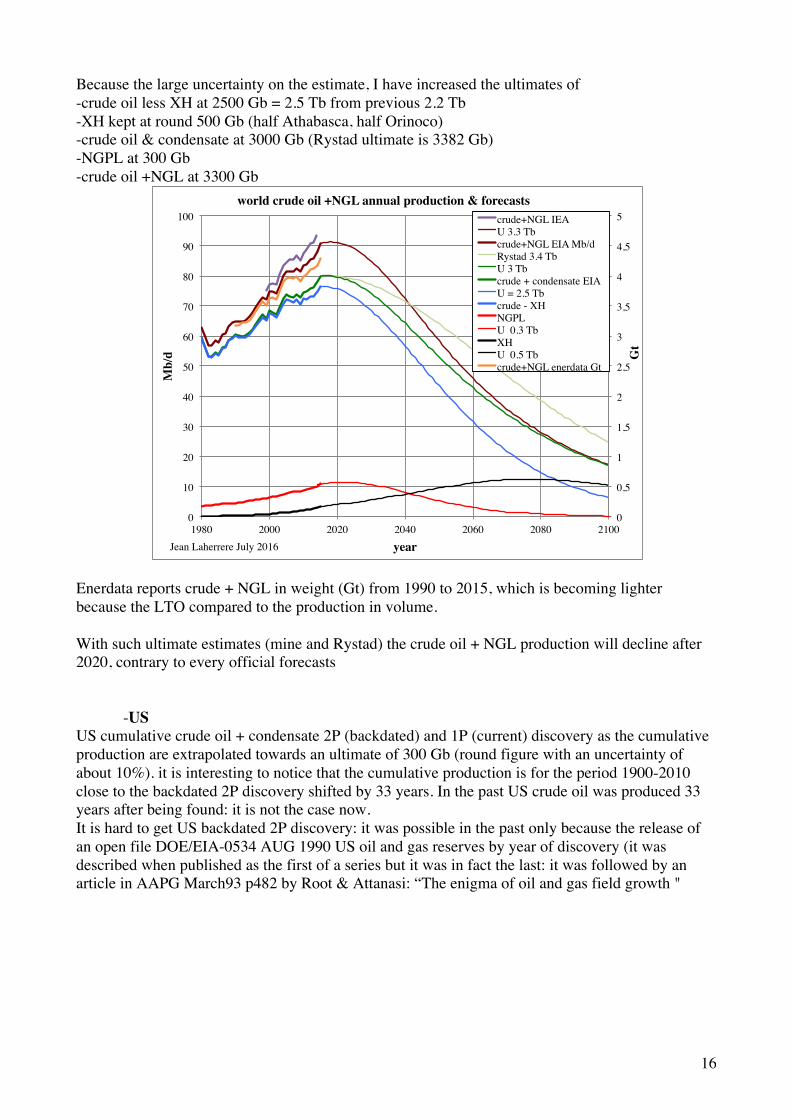
Because the large uncertainty on the estimate, I have increased the ultimates of -crude oil less XH at 2500 Gb = 2.5 Tb from previous 2.2 Tb -XH kept at round 500 Gb (half Athabasca, half Orinoco) -crude oil & condensate at 3000 Gb (Rystad ultimate is 3382 Gb) -NGPL at 300 Gb -crude oil +NGL at 3300 Gb
Enerdata reports crude + NGL in weight (Gt) from 1990 to 2015, which is becoming lighter because the LTO compared to the production in volume. With such ultimate estimates (mine and Rystad) the crude oil + NGL production will decline after 2020, contrary to every official forecasts -US US cumulative crude oil + condensate 2P (backdated) and 1P (current) discovery as the cumulative production are extrapolated towards an ultimate of 300 Gb (round figure with an uncertainty of about 10%). it is interesting to notice that the cumulative production is for the period 1900-2010 close to the backdated 2P discovery shifted by 33 years. In the past US crude oil was produced 33 years after being found: it is not the case now. It is hard to get US backdated 2P discovery: it was possible in the past only because the release of an open file DOE/EIA-0534 AUG 1990 US oil and gas reserves by year of discovery (it was described when published as the first of a series but it was in fact the last: it was followed by an article in AAPG March93 p482 by Root & Attanasi: “The enigma of oil and gas field growth "
0!
0,5!
1!
1,5!
2!
2,5!
3!
3,5!
4!
4,5!
5!
0!
10!
20!
30!
40!
50!
60!
70!
80!
90!
100!
1980! 2000! 2020! 2040! 2060! 2080! 2100!
Gt!
Mb/
d!
year!
world crude oil +NGL annual production & forecasts!crude+NGL IEA!U 3.3 Tb!crude+NGL EIA Mb/d!Rystad 3.4 Tb!U 3 Tb!crude + condensate EIA!U = 2.5 Tb!crude - XH!NGPL!U 0.3 Tb!XH!U 0.5 Tb!crude+NGL enerdata Gt !
Jean Laherrere July 2016!
17
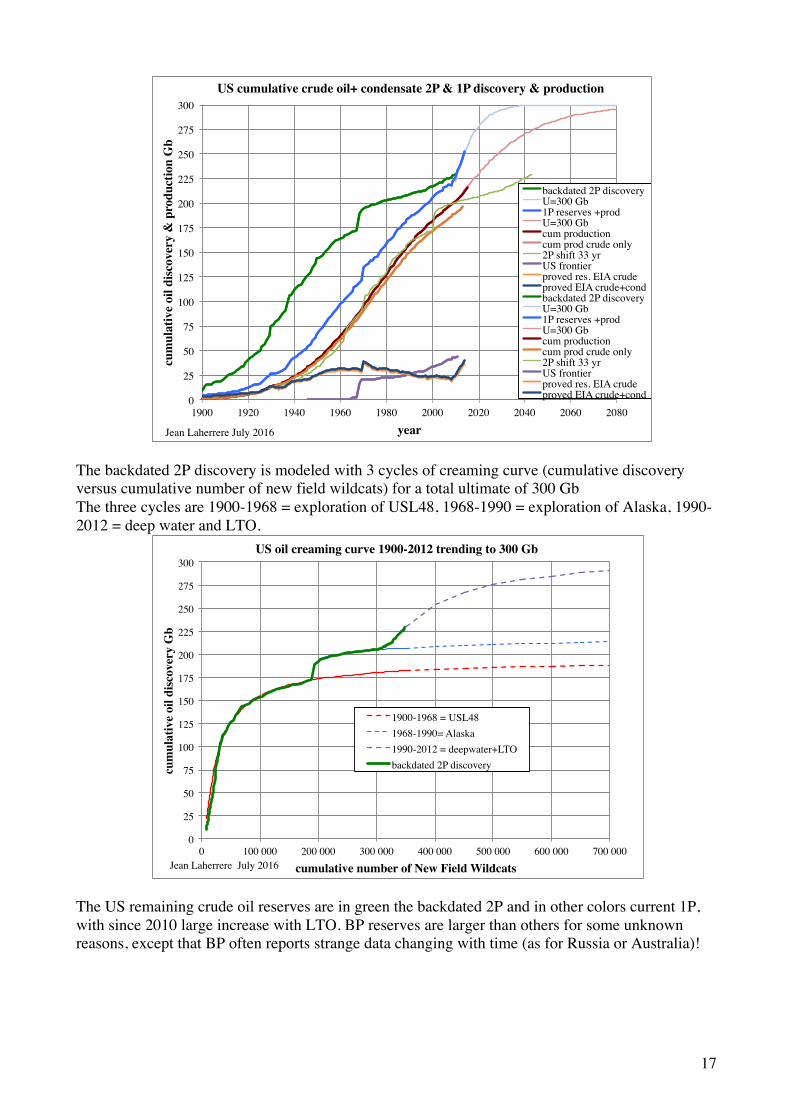
The backdated 2P discovery is modeled with 3 cycles of creaming curve (cumulative discovery versus cumulative number of new field wildcats) for a total ultimate of 300 Gb The three cycles are 1900-1968 = exploration of USL48, 1968-1990 = exploration of Alaska, 1990-2012 = deep water and LTO.
The US remaining crude oil reserves are in green the backdated 2P and in other colors current 1P, with since 2010 large increase with LTO. BP reserves are larger than others for some unknown reasons, except that BP often reports strange data changing with time (as for Russia or Australia)!
0!
25!
50!
75!
100!
125!
150!
175!
200!
225!
250!
275!
300!
1900! 1920! 1940! 1960! 1980! 2000! 2020! 2040! 2060! 2080!
cum
ulat
ive
oil d
iscov
ery
& p
rodu
ctio
n G
b!
year!
US cumulative crude oil+ condensate 2P & 1P discovery & production!
backdated 2P discovery!U=300 Gb!1P reserves +prod!U=300 Gb!cum production!cum prod crude only!2P shift 33 yr!US frontier !proved res. EIA crude!proved EIA crude+cond!backdated 2P discovery!U=300 Gb!1P reserves +prod!U=300 Gb!cum production!cum prod crude only!2P shift 33 yr!US frontier !proved res. EIA crude!proved EIA crude+cond!
Jean Laherrere July 2016!!!!!!!!!!!
0!
25!
50!
75!
100!
125!
150!
175!
200!
225!
250!
275!
300!
0! 100 000! 200 000! 300 000! 400 000! 500 000! 600 000! 700 000!
cum
ulat
ive
oil d
iscov
ery
Gb!
cumulative number of New Field Wildcats!
US oil creaming curve 1900-2012 trending to 300 Gb!
1900-1968 = USL48!1968-1990= Alaska!1990-2012 = deepwater+LTO!backdated 2P discovery!
Jean Laherrere July 2016!
18
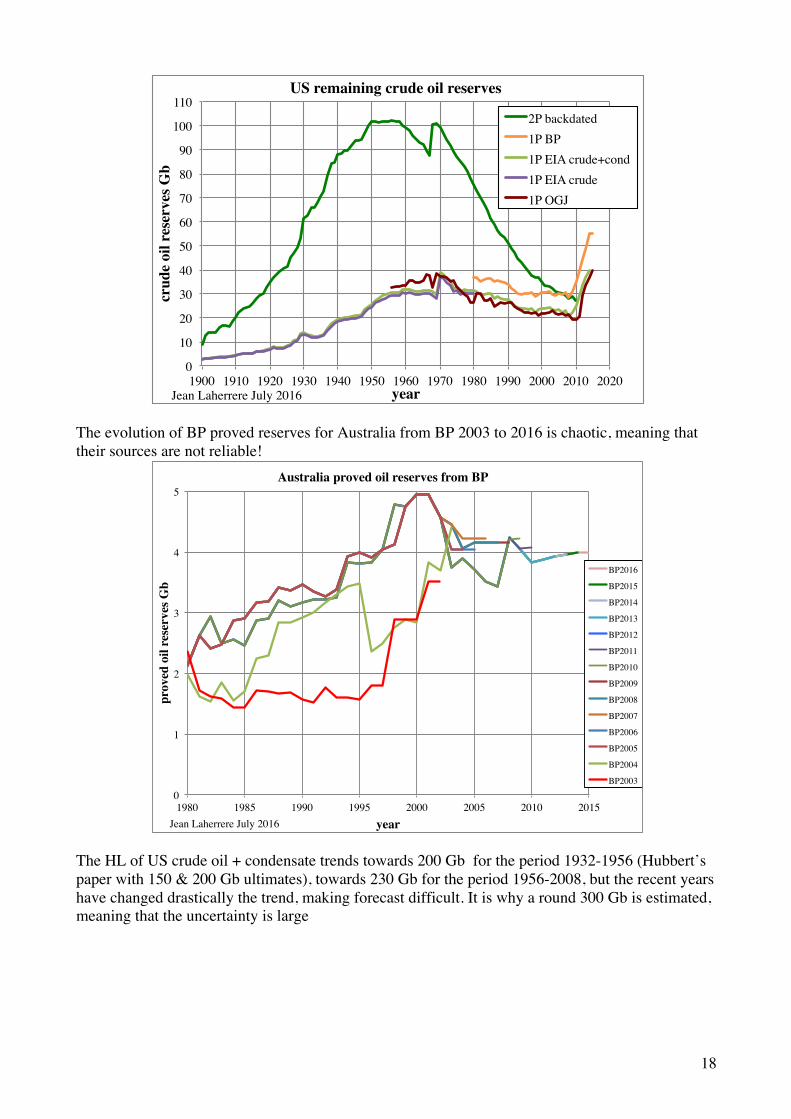
The evolution of BP proved reserves for Australia from BP 2003 to 2016 is chaotic, meaning that their sources are not reliable!
The HL of US crude oil + condensate trends towards 200 Gb for the period 1932-1956 (Hubbert’s paper with 150 & 200 Gb ultimates), towards 230 Gb for the period 1956-2008, but the recent years have changed drastically the trend, making forecast difficult. It is why a round 300 Gb is estimated, meaning that the uncertainty is large
0!
10!
20!
30!
40!
50!
60!
70!
80!
90!
100!
110!
1900! 1910! 1920! 1930! 1940! 1950! 1960! 1970! 1980! 1990! 2000! 2010! 2020!
crud
e oi
l res
erve
s Gb!
year!
US remaining crude oil reserves!
2P backdated!1P BP!1P EIA crude+cond!1P EIA crude!1P OGJ!
Jean Laherrere July 2016!
0!
1!
2!
3!
4!
5!
1980! 1985! 1990! 1995! 2000! 2005! 2010! 2015!
prov
ed o
il re
serv
es G
b!
year!
Australia proved oil reserves from BP!
BP2016!
BP2015!
BP2014!
BP2013!
BP2012!
BP2011!
BP2010!
BP2009!
BP2008!
BP2007!
BP2006!
BP2005!
BP2004!
BP2003!
Jean Laherrere July 2016!
19
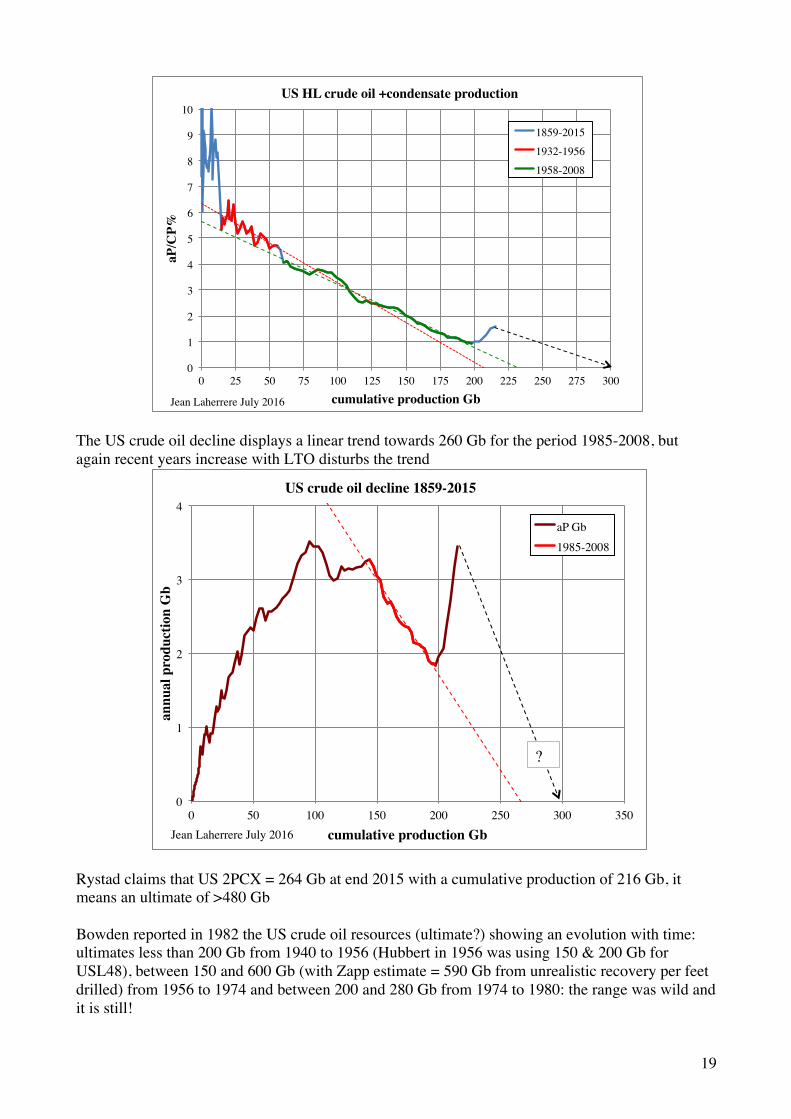
The US crude oil decline displays a linear trend towards 260 Gb for the period 1985-2008, but again recent years increase with LTO disturbs the trend
Rystad claims that US 2PCX = 264 Gb at end 2015 with a cumulative production of 216 Gb, it means an ultimate of >480 Gb Bowden reported in 1982 the US crude oil resources (ultimate?) showing an evolution with time: ultimates less than 200 Gb from 1940 to 1956 (Hubbert in 1956 was using 150 & 200 Gb for USL48), between 150 and 600 Gb (with Zapp estimate = 590 Gb from unrealistic recovery per feet drilled) from 1956 to 1974 and between 200 and 280 Gb from 1974 to 1980: the range was wild and it is still!
0!
1!
2!
3!
4!
5!
6!
7!
8!
9!
10!
0! 25! 50! 75! 100! 125! 150! 175! 200! 225! 250! 275! 300!
aP/C
P%!
cumulative production Gb!
US HL crude oil +condensate production !
1859-2015!1932-1956!1958-2008!
Jean Laherrere July 2016!
0!
1!
2!
3!
4!
0! 50! 100! 150! 200! 250! 300! 350!
annu
al p
rodu
ctio
n G
b!
cumulative production Gb!
US crude oil decline 1859-2015!
aP Gb!1985-2008!
Jean Laherrere July 2016!
?!

20
The future US crude oil (+condensate) production is modeled with the likely ultimate of 300 Gb and the unlikely Rystad 480 Gb and the EIA/AEO forecasts from 2013 to 2016. It appears that Rystad ultimate of 480 Gb is related to AEO 2016 forecast of more than 11 Mb/d in 2040. There is a wild change in LTO forecasts between AEO 2015 and AEO 2016
0,0!
1,4!
2,7!
4,1!
5,5!
6,8!
8,2!
9,6!
11,0!
12,3!
0,0!
0,5!
1,0!
1,5!
2,0!
2,5!
3,0!
3,5!
4,0!
4,5!
1860! 1880! 1900! 1920! 1940! 1960! 1980! 2000! 2020! 2040! 2060! 2080! 2100!
Mb/
d!
annu
al p
rodu
ctio
n G
b!
year!
US crude oil & condensate production!
U = 480 Gb!U = 300 Gb!prod !AEO2016!AEO2015 !AEO2014 !AEO2013!AEO2016 LTO!AEO2015 LTO!
Jean Laherrere July 2016!
21
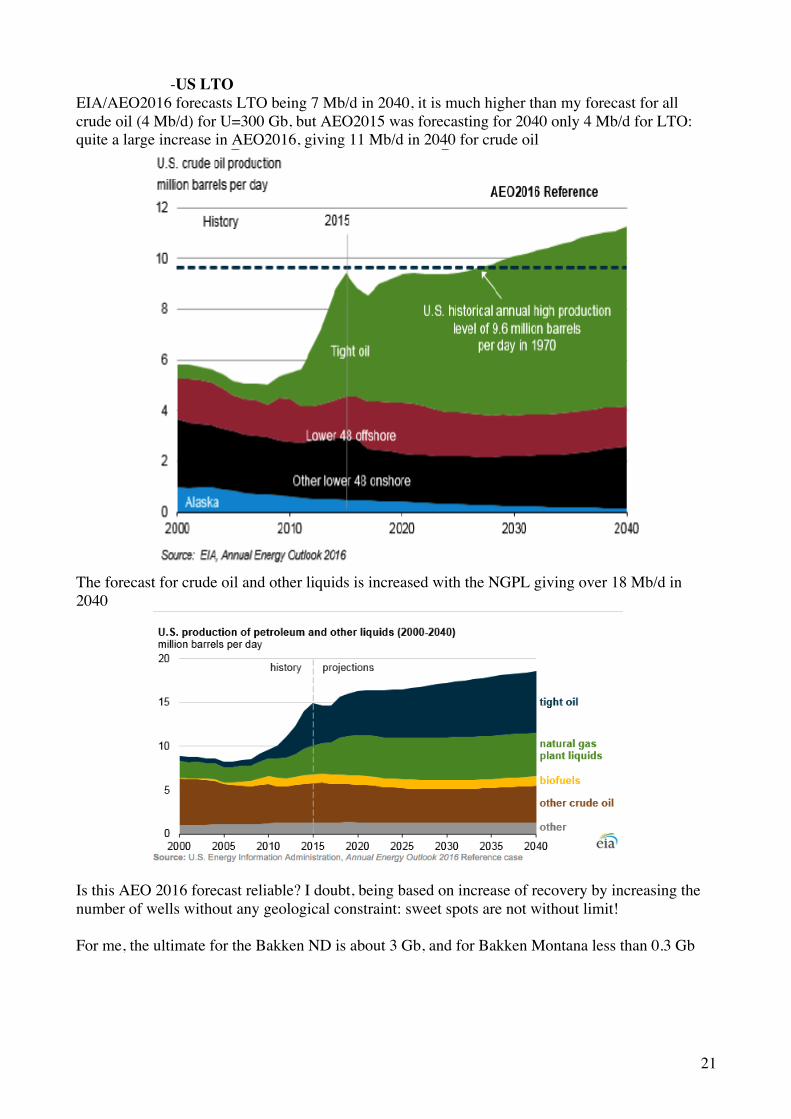
-US LTO EIA/AEO2016 forecasts LTO being 7 Mb/d in 2040, it is much higher than my forecast for all crude oil (4 Mb/d) for U=300 Gb, but AEO2015 was forecasting for 2040 only 4 Mb/d for LTO: quite a large increase in AEO2016, giving 11 Mb/d in 2040 for crude oil
The forecast for crude oil and other liquids is increased with the NGPL giving over 18 Mb/d in 2040
Is this AEO 2016 forecast reliable? I doubt, being based on increase of recovery by increasing the number of wells without any geological constraint: sweet spots are not without limit! For me, the ultimate for the Bakken ND is about 3 Gb, and for Bakken Montana less than 0.3 Gb
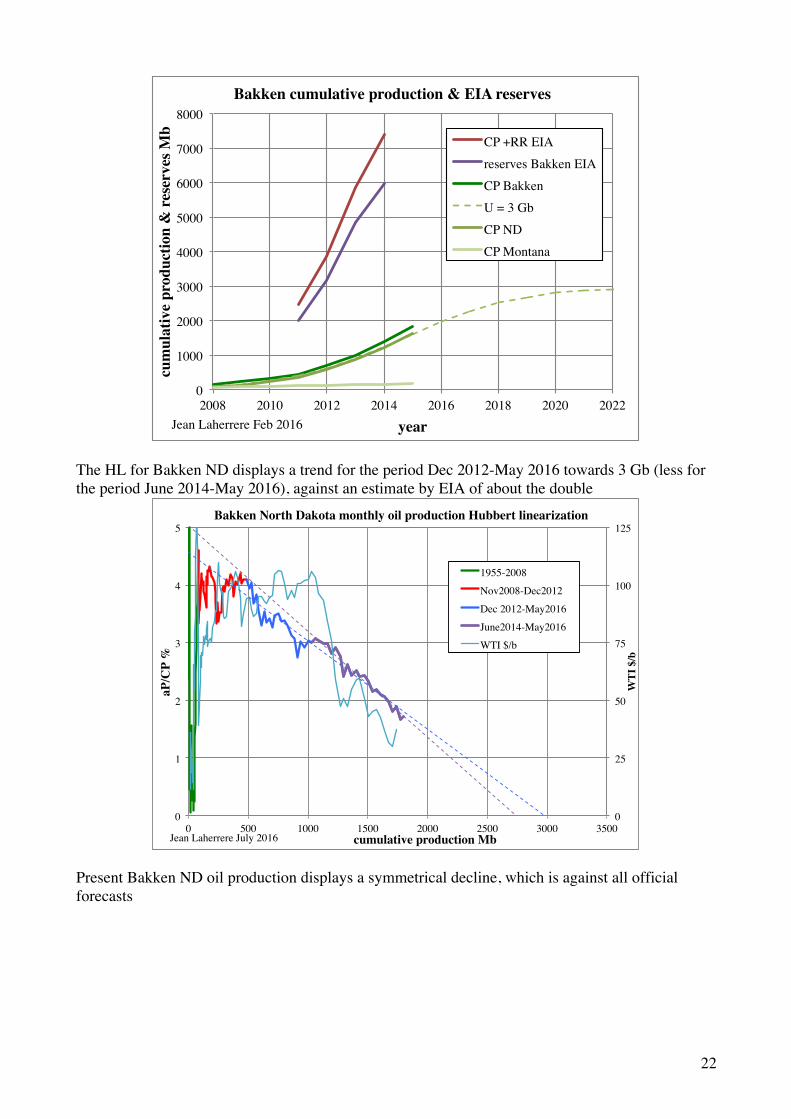
22
The HL for Bakken ND displays a trend for the period Dec 2012-May 2016 towards 3 Gb (less for the period June 2014-May 2016), against an estimate by EIA of about the double
Present Bakken ND oil production displays a symmetrical decline, which is against all official forecasts
0!
1000!
2000!
3000!
4000!
5000!
6000!
7000!
8000!
2008! 2010! 2012! 2014! 2016! 2018! 2020! 2022!
cum
ulat
ive
prod
uctio
n &
res
erve
s Mb!
year!
Bakken cumulative production & EIA reserves!
CP +RR EIA!reserves Bakken EIA!CP Bakken!U = 3 Gb!CP ND!CP Montana!
Jean Laherrere Feb 2016!
0!
25!
50!
75!
100!
125!
0!
1!
2!
3!
4!
5!
0! 500! 1000! 1500! 2000! 2500! 3000! 3500!
WTI
$/b!
aP/C
P %!
cumulative production Mb!
Bakken North Dakota monthly oil production Hubbert linearization!
1955-2008!
Nov2008-Dec2012!
Dec 2012-May2016!
June2014-May2016!
WTI $/b!
Jean Laherrere July 2016!

23
The Bakken ND oil decline peaked n 2015 at a cumulative production of 1500 Mb, being the mid-point of an ultimate of 3000 Mb.
David Hughes in 2015 “Tight oil reality check” forecasts Bakken (North Dakota & Montana) production with a peak in 2005 but a slow decline based on a number of 31 500 wells in 2030 (10 600 wells for Bakken ND in May 2016)
0!100!200!300!400!500!600!700!800!900!
1000!1100!1200!1300!
2004!2006!2008!2010!2012!2014!2016!2018!2020!2022!2024!2026!2028!2030!
oil p
rodu
ctio
n kb
/d!
year!
North Dakota: Bakken oil monthly production!
U = 3 Gb!
kb/d!
Jean Laherrere July 2016!
0!100!200!300!400!500!600!700!800!900!
1000!1100!1200!
0! 500! 1000! 1500! 2000! 2500! 3000! 3500!
oil p
rodu
ctio
n kb
/d!
cumulative production Mb!
North Dakota: Bakken oil decline!
kb/d!
July2015-May2016!
Jean Laherrere July 2016!

24
I doubt that it is possible to drill on Bakken basin three times more economical wells than now. EIA (http://www.eia.gov/todayinenergy/detail.cfm?id=3750 ) have shown the location of Bakken wells in Montana & North Dakota from 1985 to 2010 Bakken discovery started really with the discovery of Elm Coulee in Montana In 2010 Bakken discoveries were mainly in North Dakota

25
David Hughes 2013 “Drill, baby, drill” displayed this map of wells on ND Parshall sweet spots where it is difficult to find room to drill twice or three times more horizontal wells.
Hughes’s map of al Bakken wells in 2013 in North Dakota & Montana displayed the sweet spots: black spots are the top 20% in terms of initial productivity
26
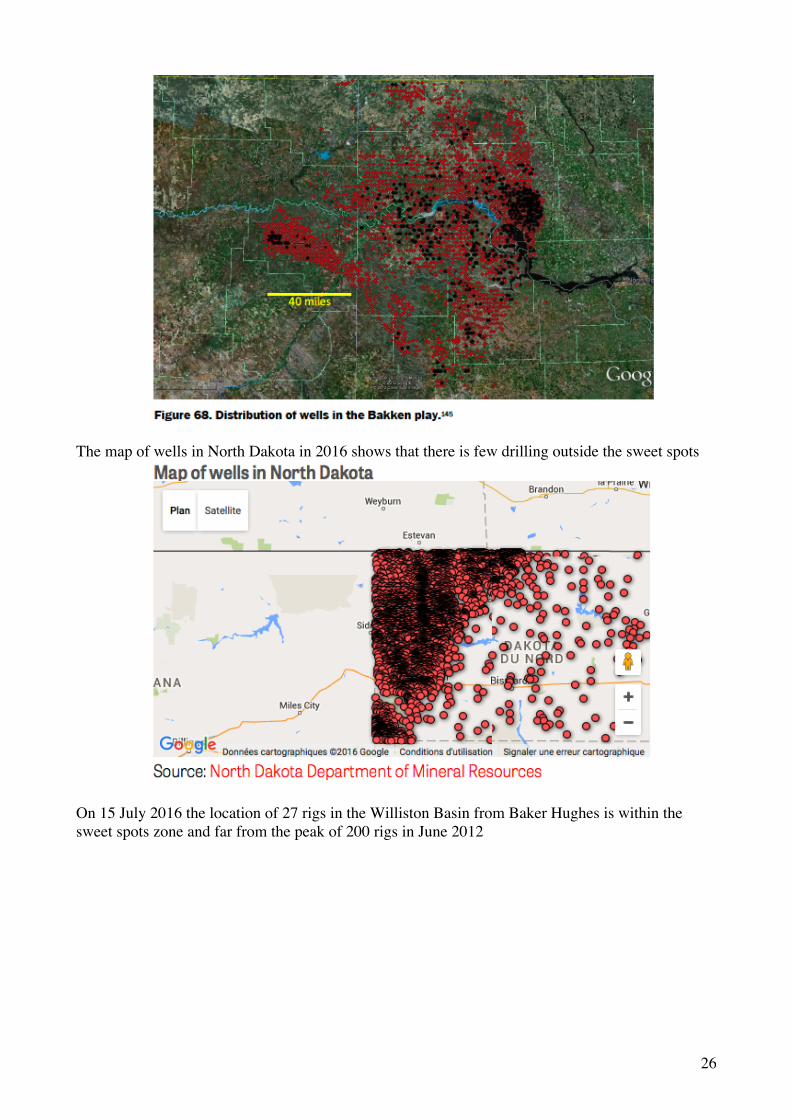
The map of wells in North Dakota in 2016 shows that there is few drilling outside the sweet spots
On 15 July 2016 the location of 27 rigs in the Williston Basin from Baker Hughes is within the sweet spots zone and far from the peak of 200 rigs in June 2012

27
Visualizing US shale oil production in North Dakota 2006-2015 by Enno Peters http://shaleprofile.com/index.php/2016/07/15/north-dakota-update-until-2016-05/ displays the cumulative production for the period 2006-May2016: the best spots are in the Mountrail county.
28
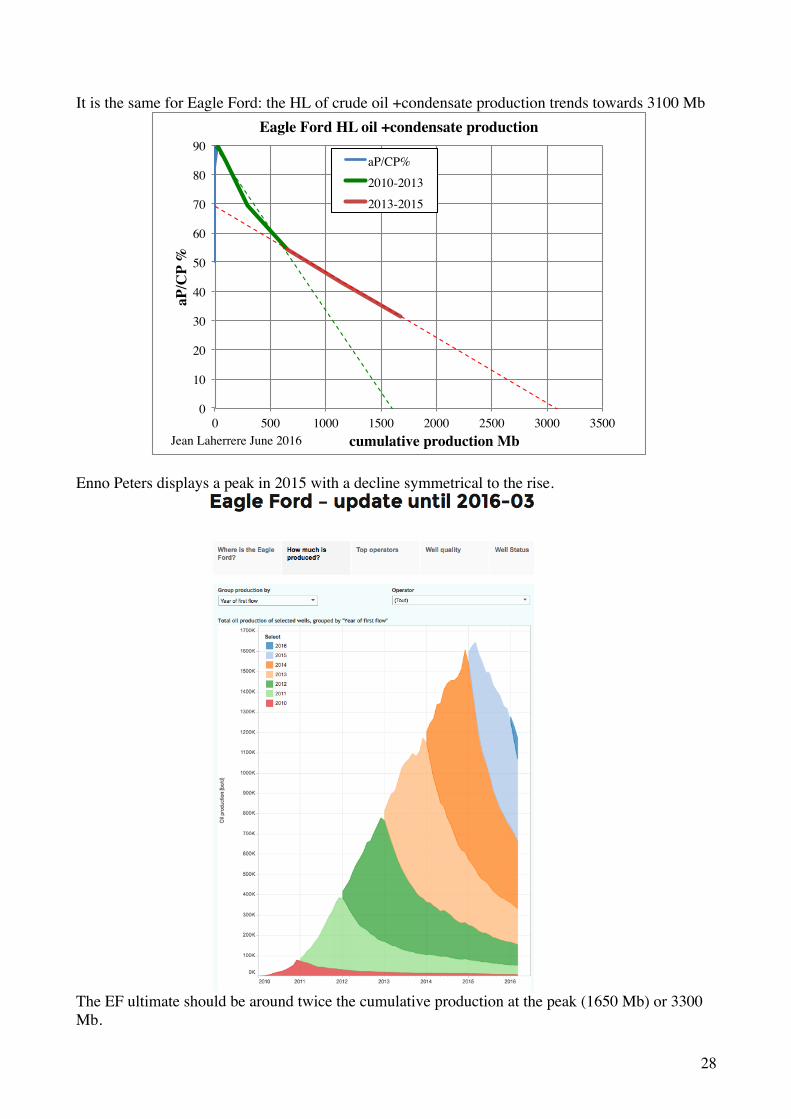
It is the same for Eagle Ford: the HL of crude oil +condensate production trends towards 3100 Mb
Enno Peters displays a peak in 2015 with a decline symmetrical to the rise.
The EF ultimate should be around twice the cumulative production at the peak (1650 Mb) or 3300 Mb.
0!
10!
20!
30!
40!
50!
60!
70!
80!
90!
0! 500! 1000! 1500! 2000! 2500! 3000! 3500!
aP/C
P %!
cumulative production Mb!
Eagle Ford HL oil +condensate production !
aP/CP%!2010-2013!2013-2015!
Jean Laherrere June 2016!

29
EIA ultimates (cumulative production plus reserves) have been rising from 2011 to 2014 far over the ultimate from past production estimated at 3.3 Gb.
EIA reports LTO production in their DPR = drilling productivity report and also in their AEO and their US oil reserves, but the values vary: for 2014 LTO production is 2.9 Mb/d for US reserves, 4.3 Mb/d for AEO and 4.7 Mb/d for DPR: which one is right? EIA should verify their data between several departments!
0!
500!
1000!
1500!
2000!
2500!
3000!
3500!
4000!
4500!
5000!
5500!
6000!
6500!
2000! 2005! 2010! 2015! 2020! 2025! 2030!
cum
ulat
ive
prod
uctio
n M
b!
year!
Eagle Ford oil & condensate cumulative production & ultimates !
EIA ultimates!HL ultimates!cum prod!U = 3.3 Gb!
Jean Laherrere July 2016!
0!
10!
20!
30!
40!
50!
60!
70!
80!
0!
1!
2!
3!
4!
5!
6!
7!
8!
2005! 2010! 2015! 2020! 2025! 2030! 2035! 2040!
cum
ulat
ive
prod
uctio
n 20
05-2
040
Gb!
Mb/
d!
year!
US LTO production from different sources of EIA!DPR!AEO2015 LTO!AEO2016 LTO!US reserves T2!CP 2005-2040 AEO2015!CP 2005-2040 AEO2016!
Jean Laherrere July 2016!

30
The cumulative production for the period 2005-2040 from AEO data is 60 Gb for AEO 2016 and 50 Gb for AEO 2015. This forecasted cumulative production 60 Gb is only up to the peak production in 2040 and should be doubled to estimate the ultimate of the AEO 2016 LTO forecast EIA DPR monthly LTO oil production since 2007 shows that peak was reached for Bakken on December 2014, Eagle Ford on March 2015, Niobrara on April 2015 and Permian Basin on March 2016. For all LTO peak was reached on March 2015 at 5.5 Mb/d. The LTO production for the 7 months of 2016 reported by DPR is an average of 5 Mb/d
EIA displays LTO production by play for 2002 to 2016, but with a flat production 2002 to 2005 at 0.3 Mb/d
0!
200!
400!
600!
800!
1000!
1200!
1400!
1600!
1800!
2000!
2200!
2007! 2008! 2009! 2010! 2011! 2012! 2013! 2014! 2015! 2016! 2017!
kb/d!
year!
US LTO monthly production from EIA/DPR!
Permian Basin!Eagle Ford!Bakken!Niobrara!Utica!Haynesville!Marcellus!
Jean Laherrere July 2016!

31
The big discrepancy between US LTO production from different sources before 2008 is that EIA reports as LTO production in the Permian Basin, which comes from conventional fields. Permian basin is a poor example of LTO because confusion between horizontal drilling in conventional fields (the cumulative production of PB at end 2015 is 36 Gb) and horizontal drilling in so called shale plays, as hydraulic fracturing (which started in 1949 when fracturing with explosive started in 1865: exploding torpedoes) In the 1990s Shell used many horizontal wells to produce oil quicker because an end of concession in Gabon at oil giant Rabi-Kounga: the peak was high but the decline sharp.
Shell did also drill horizontal wells in the Oman Yibal oil giant field to produce oil quicker but the decline was sharp and the ultimates reserves went from 2095 Mb in 1995 to 2370 Mb in 2006 and down to 2100 Gb in 2010! IEA (OMR June 2016) estimates US LTO production for 2010 at 0.4 Mb/d against >1 Mb/d for EIA (most Permian production is not LTO, only horizontal wells)
32
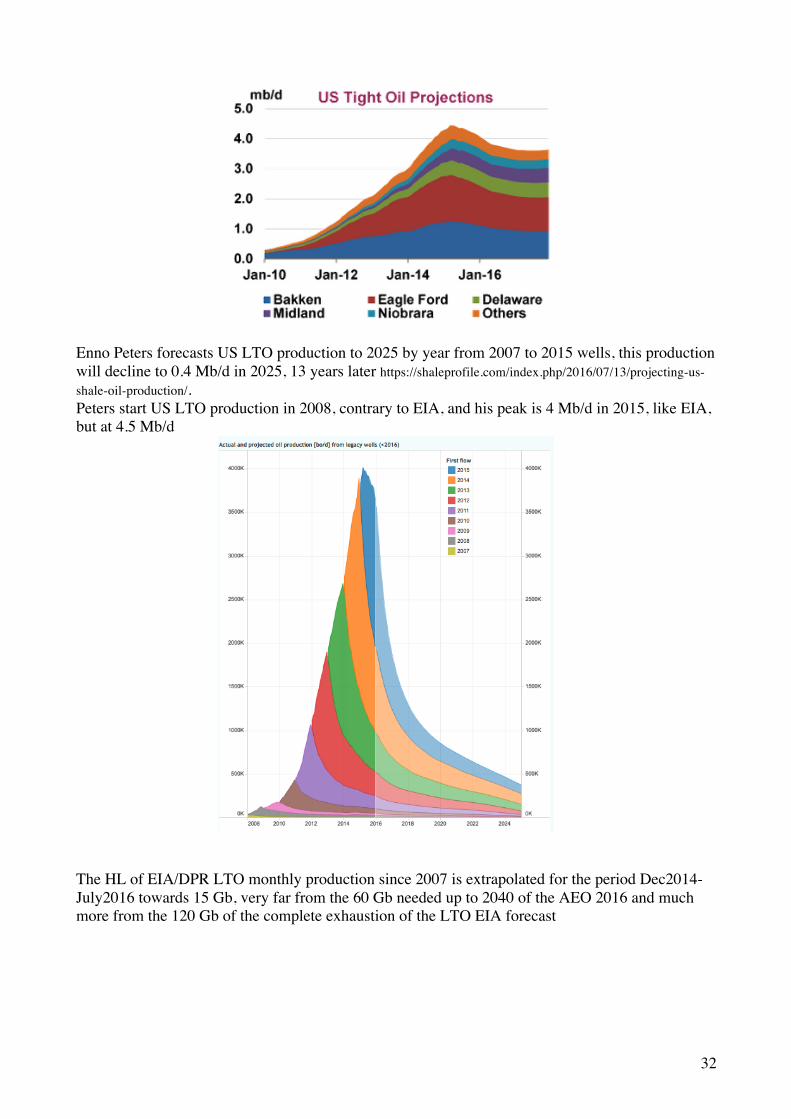
Enno Peters forecasts US LTO production to 2025 by year from 2007 to 2015 wells, this production will decline to 0.4 Mb/d in 2025, 13 years later https://shaleprofile.com/index.php/2016/07/13/projecting-us-shale-oil-production/. Peters start US LTO production in 2008, contrary to EIA, and his peak is 4 Mb/d in 2015, like EIA, but at 4.5 Mb/d
The HL of EIA/DPR LTO monthly production since 2007 is extrapolated for the period Dec2014-July2016 towards 15 Gb, very far from the 60 Gb needed up to 2040 of the AEO 2016 and much more from the 120 Gb of the complete exhaustion of the LTO EIA forecast

33
The EIA/DPR LTO production is forecasted using the HL ultimate of 15 Gb with a peak in 2015. In 2025 LTO will be exhausted using such ultimate.
LTO drilling is done in two separated steps: first horizontal drilling for a certain length and casing of the well, then the rig leaves the location and later comes the fracking team which perforates the casing and proceeds to the hydraulic fracturation with at least 40 injection trucks and many trucks bringing the water and the sand to complete the well. Many wells are left DUC = drilled but uncompleted wells, because the cost of completion could be as large as the drilling. With the sharp decline of oil price many wells were left uncompleted waiting for a better oil price. Some leases need to be drilled to be kept, others to be produced. The number of DUCs has peaked for Eagle Ford, but not yet for Bakken and Permian Basin
0!
1!
2!
3!
0! 2! 4! 6! 8! 10! 12! 14! 16! 18! 20!
aP/C
P%!
cumulative production since 2007 Gb!
US HL of DPR LTO oil monthly production 2007-July 2016!
aP/CP%!Dec2014-July2016!
Jean Laherrere July 2016!
0,0!
0,5!
1,1!
1,6!
2,2!
2,7!
3,3!
3,8!
4,4!
4,9!
5,5!
0!
200!
400!
600!
800!
1000!
1200!
1400!
1600!
1800!
2000!
2005! 2010! 2015! 2020! 2025! 2030!
Mb/
d!
annu
al p
rodu
ctio
n M
b!
year!
US LTO production from EIA/DPR & forecast U=15 Gb!
LTO DPR!U= 15 Gb!
Jean Laherrere July 2016!
?!
34
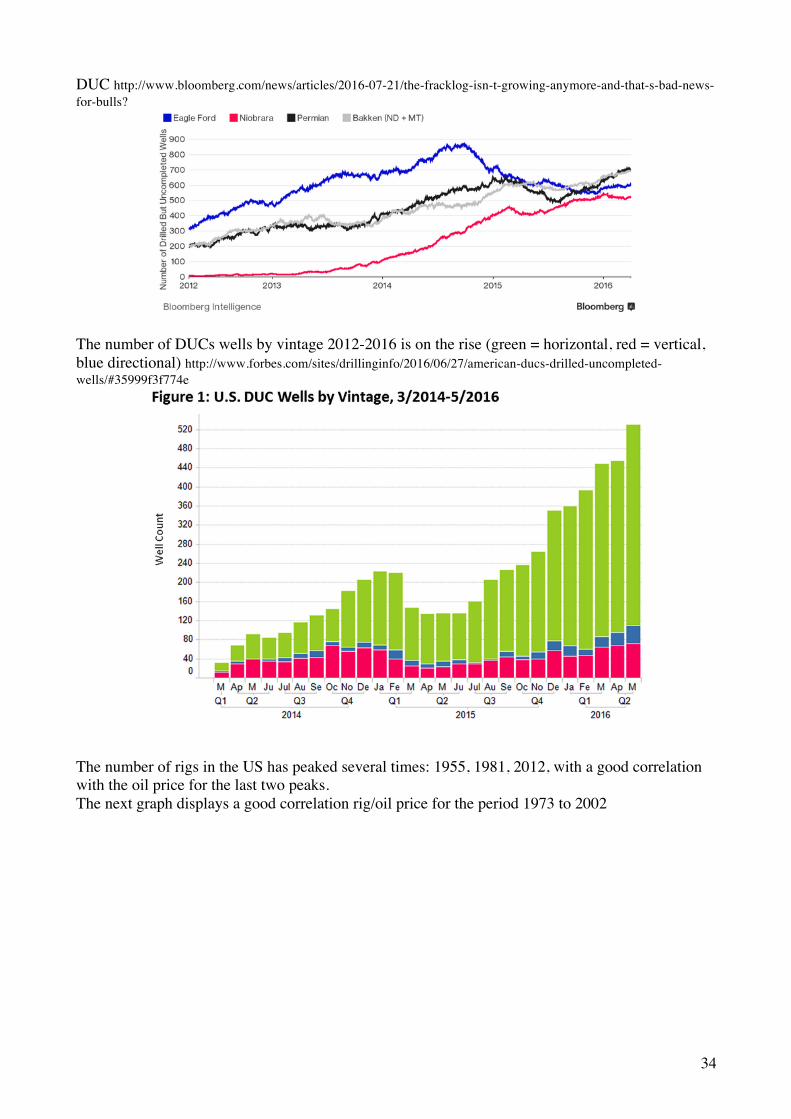
DUC http://www.bloomberg.com/news/articles/2016-07-21/the-fracklog-isn-t-growing-anymore-and-that-s-bad-news-for-bulls?
The number of DUCs wells by vintage 2012-2016 is on the rise (green = horizontal, red = vertical, blue directional) http://www.forbes.com/sites/drillinginfo/2016/06/27/american-ducs-drilled-uncompleted-wells/#35999f3f774e
The number of rigs in the US has peaked several times: 1955, 1981, 2012, with a good correlation with the oil price for the last two peaks. The next graph displays a good correlation rig/oil price for the period 1973 to 2002

35
The next graph a good correlation rig/oil price for the period 1986 to 2015
The number of oilrigs have drastically increased since 2009 to 2014 followed by a sharp decline, when the number of gas rigs has drastically up since 1999 to 2008 and drastically down from 2008 to 2016.
0!
10!
20!
30!
40!
50!
60!
70!
80!
90!
100!
110!
120!
0!
500!
1000!
1500!
2000!
2500!
3000!
3500!
4000!
1940! 1950! 1960! 1970! 1980! 1990! 2000! 2010! 2020!
oil p
rice
$20
15/b!
num
ber
of r
igs!
year!
US oil & gas rigs & oil price!
US O&G rigs!BP oil price $2015/b!
Jean Laherrere July 2016!
-20!
0!
20!
40!
60!
80!
100!
120!
140!
160!
180!
200!
220!
240!
0!
500!
1000!
1500!
2000!
2500!
3000!
3500!
4000!
1940! 1950! 1960! 1970! 1980! 1990! 2000! 2010! 2020!
oil p
rice
$20
15/b!
num
ber
of r
igs!
year!
US oil & gas rigs & oil price!
US O&G rigs!BP oil price $2015/b!
Jean Laherrere July 2016!

36
The number of horizontal wells (in red) was about 10 % for the period 1991-2005 and has sharply increased to 80% in 2016
In the Permian Basin the number of horizontal wells has increased sharply since 2010 to 2015 http://www.energyeconomist.com/a6257783p/exploration/detail/permian/graph/oilvdh.gif
0!
500!
1000!
1500!
2000!
2500!
3000!
3500!
4000!
1940! 1950! 1960! 1970! 1980! 1990! 2000! 2010! 2020!
num
ber
of r
igs!
year!
US oil & gas rigs!
US O&G rigs!oil rig!gas rig!
Jean Laherrere July 2016!
0%!
10%!
20%!
30%!
40%!
50%!
60%!
70%!
80%!
90%!
100%!
0!
200!
400!
600!
800!
1000!
1200!
1400!
1600!
1800!
2000!
2200!
1990! 1995! 2000! 2005! 2010! 2015! 2020!
% ty
pe!
num
ber
of r
igs!
year!
US drilling type!
number of rigs!% horizontal.!% vertical!% directional!
Jean Laherrere July 2016! source: Baker Hughes!

37
The oil price is a key factor in the drilling of new wells. Most medias explain the recent oil price decline with the decline of China growth, the refusal of Saudi Arabia to reduce their cheap production (it is up to the expensive oils (LTO) to reduce production) or the recent increase of LTO. In fact the next graph shows a good correlation since 2003 between the WTI oil price in green and the negative dollar value (major currencies). When the dollar value increases, the oil price decreases. The correlation stays during 2014 which is the decline of the WTI from 110 $/b to 50 $/b, and again in 2015 with the low of oil price at 30 $/b At end of July 2016 oil price is on decline at 42 $/b because the dollar is up at about 92

38
Many explain also that the WTI oil price depends upon the US stocks of crude oil. In fact since September 2014 the US stocks of crude oil follows very well the WTI oil price of 3 months before (12 weeks). It is obvious that, when WTI is low, operators stock oil with the goal to sell it after when price increases. The peak of US stocks of last week April 2016 at 542 Mb is the result of the low of WTI at 30 $/b in January 2016. The low of US stocks of first week August 2015 at 453 Mb is the result of the peak of WTI at 60 $/b in May 2015.
-98!-97!-96!-95!-94!-93!-92!-91!-90!-89!-88!-87!-86!-85!-84!-83!-82!-81!-80!-79!-78!-77!-76!-75!
20!
30!
40!
50!
60!
70!
80!
90!
100!
110!
1-jan-2014! 1-jan-2015! 1-jan-2016! 1-jan-2017!
nom
inal
maj
or c
urre
ncie
s dol
lar
inde
x *-
1 !
WTI
oil
pric
e $/
b!
date!
US WTI crude oil daily price and dollar value * -1!
WTI $/b!
Dollar Index (major currencies)*-1!
Jean Laherrere 31 July 2016!
http://www.federalreserve.gov/releases/h10/summary/indexn96_b.htm!https://research.stlouisfed.org/fred2/series/DCOILWTICO/downloaddata!
-125!
-115!
-105!
-95!
-85!
-75!
-65!
-55!
-45!
-35!
-25!
300!
350!
400!
450!
500!
550!
2013! 2014! 2015! 2016! 2017!
WTI
oil
pric
e $/
b*-1!
Mb!
year!
US weekly ending stocks of crude oil & WTI oil price from EIA!
crude oil private!
WTI $/b*-1!
WTI $/b*-1 12 weeks before!
Jean Laherrere 31 July 2016!
http://www.eia.gov/dnav/pet/pet_stoc_wstk_dcu_nus_m.htm!http://www.eia.gov/pet/hist/LeafHandler.ashx?n=pet&s=rwtc&f=w!

39
Hydraulic fracturation (and water waste injection) is accused more and more to be the source of earthquakes in Central US http://www.smu.edu/~/media/Site/News/NewsSources/EarthquakeStudy/earthquake-study-17may2016.ashx?la=en as shown in that graph for Texas where some earthquakes are almost certainly induced and the majority possibly or probably induced.
In the 1960s, waste fluids in a deep well (Rocky Mountain Arsenal) has triggered earthquakes near Denver, with a good correlation between the pressure of injection and earthquakes
40
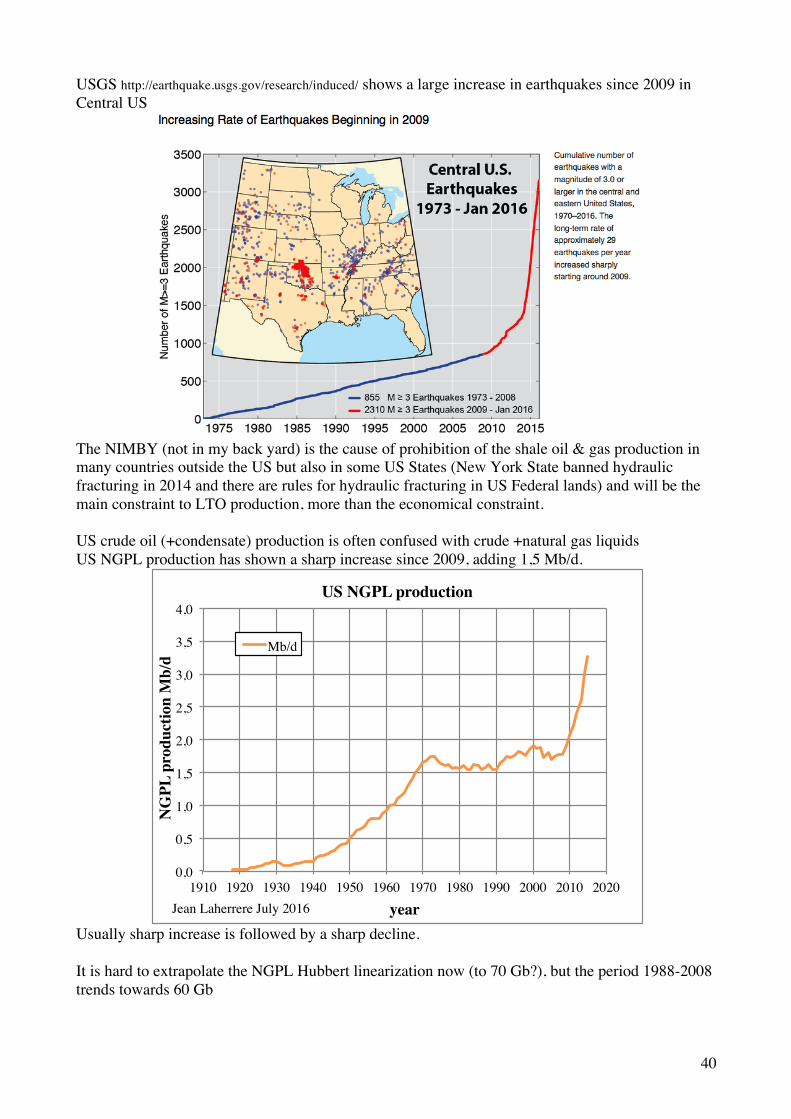
USGS http://earthquake.usgs.gov/research/induced/ shows a large increase in earthquakes since 2009 in Central US
The NIMBY (not in my back yard) is the cause of prohibition of the shale oil & gas production in many countries outside the US but also in some US States (New York State banned hydraulic fracturing in 2014 and there are rules for hydraulic fracturing in US Federal lands) and will be the main constraint to LTO production, more than the economical constraint. US crude oil (+condensate) production is often confused with crude +natural gas liquids US NGPL production has shown a sharp increase since 2009, adding 1,5 Mb/d.
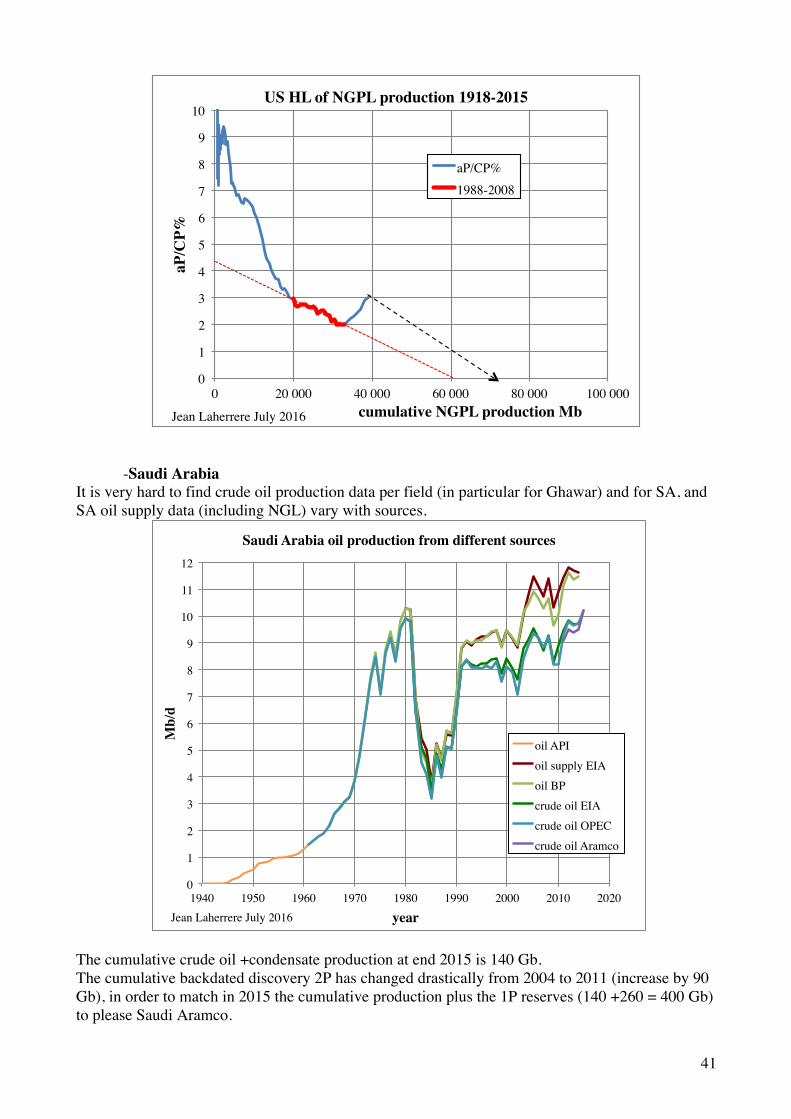
Usually sharp increase is followed by a sharp decline. It is hard to extrapolate the NGPL Hubbert linearization now (to 70 Gb?), but the period 1988-2008 trends towards 60 Gb
0,0!
0,5!
1,0!
1,5!
2,0!
2,5!
3,0!
3,5!
4,0!
1910! 1920! 1930! 1940! 1950! 1960! 1970! 1980! 1990! 2000! 2010! 2020!
NG
PL p
rodu
ctio
n M
b/d!
year!
US NGPL production!
Mb/d!
Jean Laherrere July 2016!
41
-Saudi Arabia It is very hard to find crude oil production data per field (in particular for Ghawar) and for SA, and SA oil supply data (including NGL) vary with sources.
The cumulative crude oil +condensate production at end 2015 is 140 Gb. The cumulative backdated discovery 2P has changed drastically from 2004 to 2011 (increase by 90 Gb), in order to match in 2015 the cumulative production plus the 1P reserves (140 +260 = 400 Gb) to please Saudi Aramco.
0!
1!
2!
3!
4!
5!
6!
7!
8!
9!
10!
0! 20 000! 40 000! 60 000! 80 000! 100 000!
aP/C
P%!
cumulative NGPL production Mb!
US HL of NGPL production 1918-2015 !
aP/CP%!1988-2008!
Jean Laherrere July 2016!
0!
1!
2!
3!
4!
5!
6!
7!
8!
9!
10!
11!
12!
1940! 1950! 1960! 1970! 1980! 1990! 2000! 2010! 2020!
Mb/
d!
year!
Saudi Arabia oil production from different sources!
oil API!oil supply EIA!oil BP!crude oil EIA!crude oil OPEC!crude oil Aramco!
Jean Laherrere July 2016!

42
Saudi Arabia remaining oil reserves show large discrepancies between backdated 2P 2004 and 2011, between backdated 2P and current 1P and a jump of about 90 Gb in 1P in 1989 after the OPEC quota fight from 1985 to 1989 after the oil counter shock (total increase for OPEC was 300 Gb qualified in 2007 by the former ARAMCO VP Sadad al-Husseini as “speculative resources”). One good proof of this political jump is that the 1P reserves (OGJ) of the Neutral Zone (owned 50/50 Saudi Arabia and Kuwait) did not move (5 Gb since 1990 to 2013 and no data after), because Kuwait had increased their reserves in 1986 by 39, when SA increases their reserves by 49% in 1989. It means that these increases were political and not technical! It is fascinating to find that the OPEC/ABS oil reserves from 1969 to 2015, vary by jump, staying around 170 Gb from 1974 to 1987 and around 260 Gb from 1988 to 2015: it is hard to justify that SA oil reserves stay around 260 Gb for 25 years, when cumulative crude oil production was reported 58 Gb at end 1988 and 140 Gb at end 2015: it means that from 1988 to 2015 82 Gb were produced and supposed to have been replaced by new discoveries: it is unrealistic Rystad claims that Saudi Arabia 1P is 70 Gb (at end 2015?), when OPEC/ABS reports at end 2015 proved reserves as 266 Gb: there is no way to explain such huge difference, except that both these two figures are wrong. Rystad reports Saudi Arabia 2P reserves at 168 Gb, when it is 270 Gb for IHS 2011. Rystad reports 212 Gb for 2PCX, giving an ultimate of 352 Gb with a cumulative production end 2015 of 140 Gb.
0!
50!
100!
150!
200!
250!
300!
350!
400!
450!
1930! 1940! 1950! 1960! 1970! 1980! 1990! 2000! 2010! 2020!
Gb!
year!
Saudi Arabia (excl NZ) cumulative oil discovery & production!
cum disc 2P 2011!
cum prod +1P OGJ!
cum disc 2P 2004!
cum prod crude +cond SA!
HL!
Jean Laherrere July 2016!
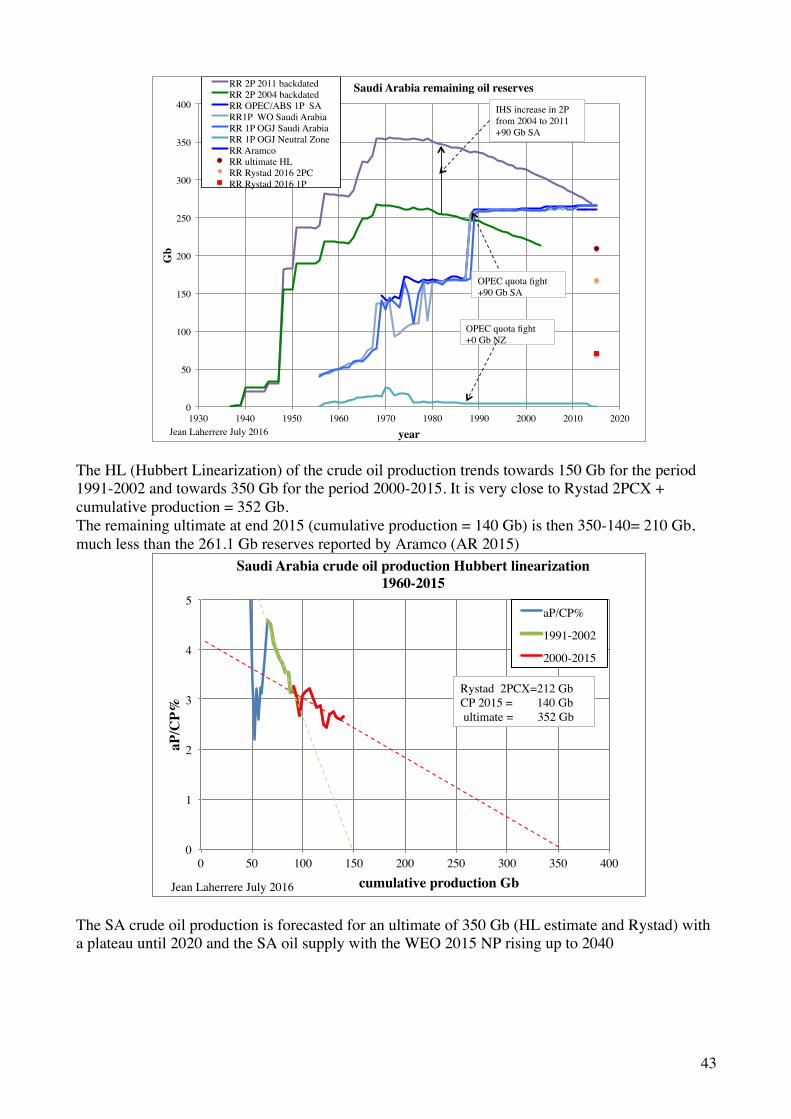
43
The HL (Hubbert Linearization) of the crude oil production trends towards 150 Gb for the period 1991-2002 and towards 350 Gb for the period 2000-2015. It is very close to Rystad 2PCX + cumulative production = 352 Gb. The remaining ultimate at end 2015 (cumulative production = 140 Gb) is then 350-140= 210 Gb, much less than the 261.1 Gb reserves reported by Aramco (AR 2015)
The SA crude oil production is forecasted for an ultimate of 350 Gb (HL estimate and Rystad) with a plateau until 2020 and the SA oil supply with the WEO 2015 NP rising up to 2040
0!
50!
100!
150!
200!
250!
300!
350!
400!
1930! 1940! 1950! 1960! 1970! 1980! 1990! 2000! 2010! 2020!
Gb!
year!
Saudi Arabia remaining oil reserves !RR 2P 2011 backdated!RR 2P 2004 backdated!RR OPEC/ABS 1P SA!RR1P WO Saudi Arabia!RR 1P OGJ Saudi Arabia!RR 1P OGJ Neutral Zone!RR Aramco!RR ultimate HL!RR Rystad 2016 2PC!RR Rystad 2016 1P!
Jean Laherrere July 2016!
OPEC quota fight +90 Gb SA!
OPEC quota fight!+0 Gb NZ!
IHS increase in 2P !from 2004 to 2011!+90 Gb SA!
0!
1!
2!
3!
4!
5!
0! 50! 100! 150! 200! 250! 300! 350! 400!
aP/C
P%!
cumulative production Gb!
Saudi Arabia crude oil production Hubbert linearization 1960-2015!
aP/CP%!
1991-2002!
2000-2015!
Jean Laherrere July 2016!
Rystad 2PCX=212 Gb!CP 2015 = 140 Gb! ultimate = 352 Gb!

44
-Russia Rystad reports at end 2015 annual production = 10.7 Mb/d, 1P = 51 Gb, 2P= 77 Gb, 2PC = 106 Gb, 2PCX= 256 Gb CP 2015 = 169 Gb CP+2PCX = 425 Gb BP 1P = 102 Gb OGJ 1P = 80 Gb (same since 2012, but it was 60 Gb from 2002 to 2011 and 49 Gb from 1992 to 2001) 2P end 2011 = 60 Gb Russia remaining oil reserves vary widely between sources, in particular from BP (2015 data changes at end 2000 from 60 Gb (2008 data) to 112 Gb!)
Russia reserves are Russian classification = ABC1 (close to 3P), but Gazprom is one of the few companies reporting both audited ABC1 and 2P reserves, it shows that 2P is about 70 % of ABC1.
0!
10!
20!
30!
40!
50!
60!
70!
80!
90!
100!
110!
120!
130!
140!
0!
1!
2!
3!
4!
5!
6!
7!
8!
9!
10!
11!
12!
13!
14!
1940! 1960! 1980! 2000! 2020! 2040! 2060! 2080! 2100!
oil p
rice
$20
15/b!
Mb/
d!
year!
Saudi Arabia crude oil production with forecasts U = 350 Gb & IEA!& oil price!
WEO 2015 NP!WEO 2014 NP!WEO 2013!oil supply EIA!crude oil +cond!U=350 Gb!crude oil prod!oil price BP $2015!
Jean Laherrere July 2016!
Rystad 2PCX=212 Gb!CP 2015 = 140 Gb! ultimate = 352 Gb!
0!
10!
20!
30!
40!
50!
60!
70!
80!
90!
100!
110!
120!
1930! 1940! 1950! 1960! 1970! 1980! 1990! 2000! 2010! 2020!
rem
aini
ng re
serv
es G
b!
year!
Russia remaining oil reserves from different sources!
RR 2P!1P EIA/OGJ!1P WO!1P BP2016!1P BP2015!1P BP2014!1P BP2013!1P BP2012!1P BP2010!1P BP2008!
Jean Laherrere June 2016!
Romashkino!
Fedorovo!
Samotlor!

45
Russia oil & gas creaming curve is plotted for 2P = 0,7 ABC1 and extrapolated towards 240 Gb
The HL of crude oil production is hard to extrapolate, but an ultimate of 240 Gb is possible.
0,0!
0,1!
0,2!
0,3!
0,4!
0,5!
0,6!
0,7!
0,8!
0,9!
1,0!
2000! 2002! 2004! 2006! 2008! 2010! 2012! 2014! 2016!
2P/A
BC1!
year!
Gazprom reserves ratio: 2P/ ABC1 !
crude oil 2P/ABC1!
gas 2P/ABC1!
condensate 2P/ABC1!
Jean Laherrere July 2016!
0!
50!
100!
150!
200!
250!
300!
350!
400!
0! 500! 1000! 1500! 2000! 2500! 3000! 3500! 4000! 4500! 5000! 5500! 6000!
cum
ulai
tve
disc
over
y G
boe!
cumulative number of fields!
Russia oil & gas creaming curve 1864-2012!
G ABC1 Tcf/6 !U = 1800 Tcf!2P gas = 0,7*ABC1!O+C ABC1 Gb !U = 240 Gb!2P = 0,75*ABC1!
Jean Laherrere 2016!
46
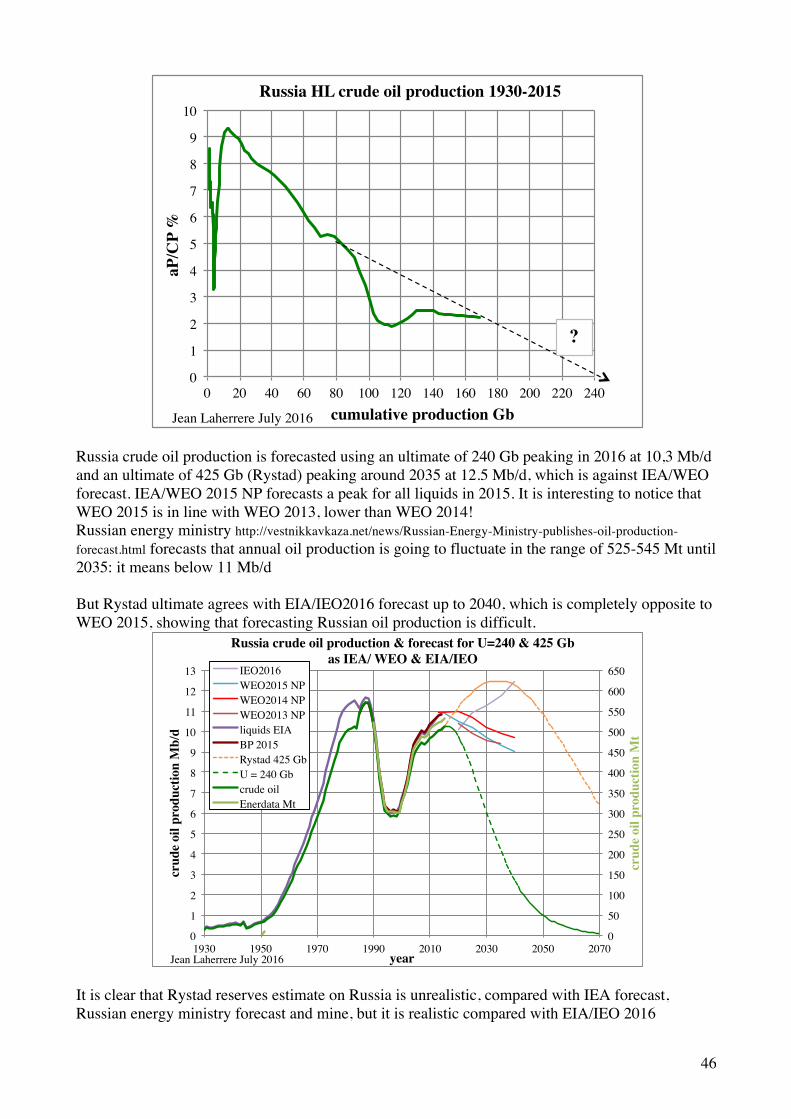
Russia crude oil production is forecasted using an ultimate of 240 Gb peaking in 2016 at 10,3 Mb/d and an ultimate of 425 Gb (Rystad) peaking around 2035 at 12.5 Mb/d, which is against IEA/WEO forecast. IEA/WEO 2015 NP forecasts a peak for all liquids in 2015. It is interesting to notice that WEO 2015 is in line with WEO 2013, lower than WEO 2014! Russian energy ministry http://vestnikkavkaza.net/news/Russian-Energy-Ministry-publishes-oil-production-forecast.html forecasts that annual oil production is going to fluctuate in the range of 525-545 Mt until 2035: it means below 11 Mb/d But Rystad ultimate agrees with EIA/IEO2016 forecast up to 2040, which is completely opposite to WEO 2015, showing that forecasting Russian oil production is difficult.
It is clear that Rystad reserves estimate on Russia is unrealistic, compared with IEA forecast, Russian energy ministry forecast and mine, but it is realistic compared with EIA/IEO 2016
0!
1!
2!
3!
4!
5!
6!
7!
8!
9!
10!
0! 20! 40! 60! 80! 100! 120! 140! 160! 180! 200! 220! 240!
aP/C
P %!
cumulative production Gb!
Russia HL crude oil production 1930-2015 !
Jean Laherrere July 2016!
?!
0!
50!
100!
150!
200!
250!
300!
350!
400!
450!
500!
550!
600!
650!
0!
1!
2!
3!
4!
5!
6!
7!
8!
9!
10!
11!
12!
13!
1930! 1950! 1970! 1990! 2010! 2030! 2050! 2070!
crud
e oi
l pro
duct
ion
Mt!
crud
e oi
l pro
duct
ion
Mb/
d!
year!
Russia crude oil production & forecast for U=240 & 425 Gb!as IEA/ WEO & EIA/IEO!
IEO2016!WEO2015 NP !WEO2014 NP !WEO2013 NP !liquids EIA!BP 2015!Rystad 425 Gb!U = 240 Gb!crude oil !Enerdata Mt!
Jean Laherrere July 2016!

47
Russian ruble depends drastically upon the oil price
-UK UK DECC reports in Gb 1P and 2P remaining reserves but they are current estimates, different from the backdated 2P and the current 1P from other sources before 1995. The big difference between 2P DECC and backdated 2P IHS is the DECC includes only producing fields when IHS includes all discoveries. OGJ 1P were over 1P DECC before 1987. WO 1P were close to 1P DECC except in 1992-1993. The fact that UK reported with the Brown Book reserves estimates by field did not improve the reporting of reserves by OGJ or WO before 1995!
DECC reports the crude oil +NGL in tonnes (more representative of the heat content than the report in volume because NGL is much lighter than crude oil) from 1920 to 2015. The forecast is displayed for an ultimate of 4100 Mt
-90!
-80!
-70!
-60!
-50!
-40!
-30!
0!
10!
20!
30!
40!
50!
60!
70!
80!
90!
100!
110!
1 January 2014! 1 January 2015! 1 January 2016!
RU
B/U
SD*-
1!
WTI
$/b!
date!
daily WTI & value ruble/dollar!
WTI!RUB/USD*-1!
Jean Laherrere 31 July2016!
0!
5!
10!
15!
20!
25!
30!
1950!1955!1960!1965!1970!1975!1980!1985!1990!1995!2000!2005!2010!2015!
rese
rves
Gb!
year!
UK remaining oil reserves from different sources!
backdated 2P disc!DECC 2P!WO 1P first!WO 1P revised!OGJ 1P!BP 2016 1P!DECC 1P!
Jean Laherrere June 2016!
48
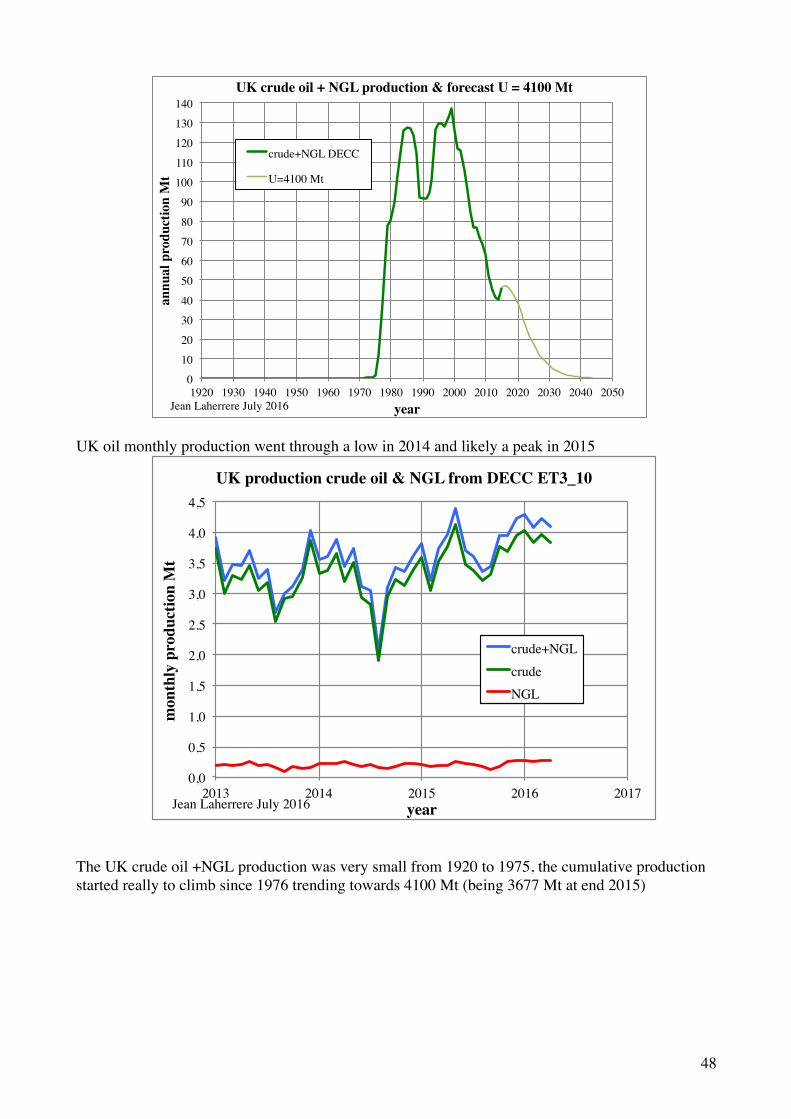
UK oil monthly production went through a low in 2014 and likely a peak in 2015
The UK crude oil +NGL production was very small from 1920 to 1975, the cumulative production started really to climb since 1976 trending towards 4100 Mt (being 3677 Mt at end 2015)
0!
10!
20!
30!
40!
50!
60!
70!
80!
90!
100!
110!
120!
130!
140!
1920! 1930! 1940! 1950! 1960! 1970! 1980! 1990! 2000! 2010! 2020! 2030! 2040! 2050!
annu
al p
rodu
ctio
n M
t!
year!
UK crude oil + NGL production & forecast U = 4100 Mt!
crude+NGL DECC!
U=4100 Mt!
Jean Laherrere July 2016!
0,0!
0,5!
1,0!
1,5!
2,0!
2,5!
3,0!
3,5!
4,0!
4,5!
2013! 2014! 2015! 2016! 2017!
mon
thly
pro
duct
ion
Mt!
year!
UK production crude oil & NGL from DECC ET3_10!
crude+NGL!crude!NGL!
Jean Laherrere July 2016!

49
As of end 2014 the cumulative production + 2P reserves is about 4400 Mt, but the HL extrapolation is about 4000 Mt
The extrapolation of the decline is about 4200 Mt
0!
500!
1000!
1500!
2000!
2500!
3000!
3500!
4000!
4500!
1920! 1930! 1940! 1950! 1960! 1970! 1980! 1990! 2000! 2010! 2020! 2030! 2040! 2050!
cum
ulat
ive
prod
uctio
n, r
eser
ves M
t!
year!
UK crude oil +NGL cumulative production & reserves from DECC!
ultimate decline!ultimate HL!CP+2P!CP+1P!U = 4100 Mt!CP oil Gt!2P!probable!proven!
Jean Laherrere July 2016!
0!
1!
2!
3!
4!
5!
6!
7!
8!
9!
10!
0! 500! 1000! 1500! 2000! 2500! 3000! 3500! 4000! 4500!
aP/C
P%!
cumulative oil production Mt!
UK HL of crude oil +NGL production !
1920-1993!1994-2015!
Jean Laherrere July 2016!
50
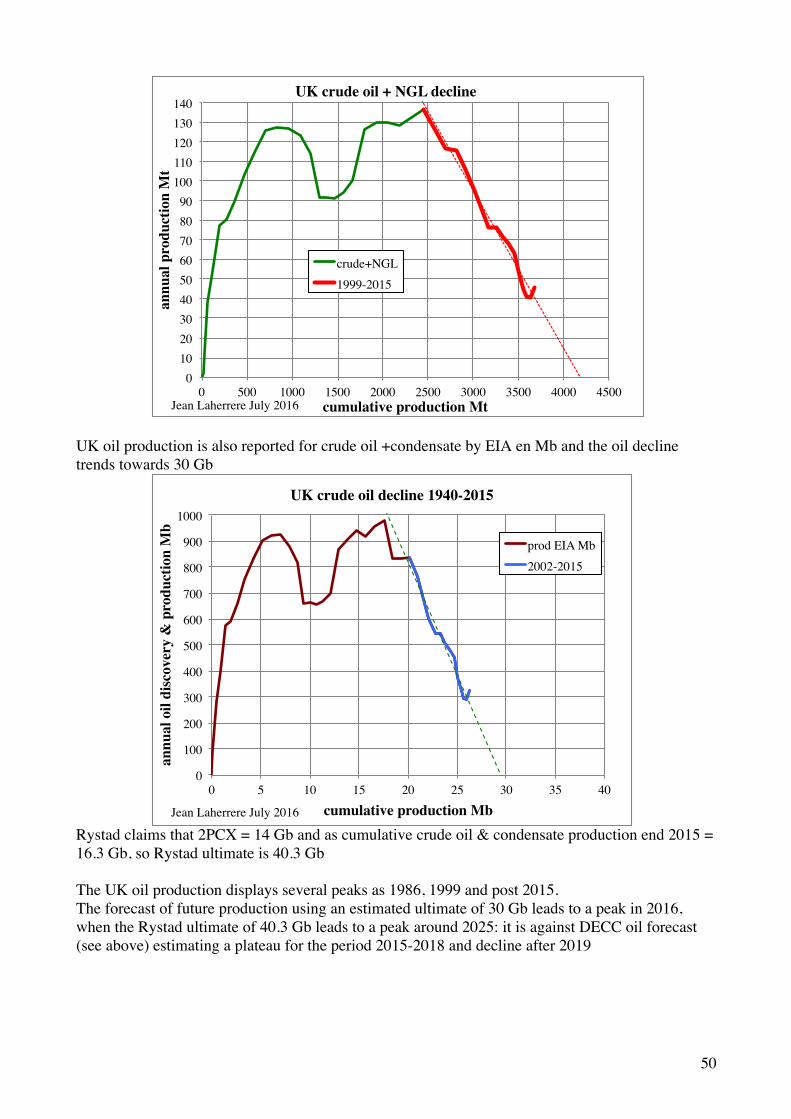
UK oil production is also reported for crude oil +condensate by EIA en Mb and the oil decline trends towards 30 Gb
Rystad claims that 2PCX = 14 Gb and as cumulative crude oil & condensate production end 2015 = 16.3 Gb, so Rystad ultimate is 40.3 Gb The UK oil production displays several peaks as 1986, 1999 and post 2015. The forecast of future production using an estimated ultimate of 30 Gb leads to a peak in 2016, when the Rystad ultimate of 40.3 Gb leads to a peak around 2025: it is against DECC oil forecast (see above) estimating a plateau for the period 2015-2018 and decline after 2019
0!10!20!30!40!50!60!70!80!90!
100!110!120!130!140!
0! 500! 1000! 1500! 2000! 2500! 3000! 3500! 4000! 4500!
annu
al p
rodu
ctio
n M
t!
cumulative production Mt!
UK crude oil + NGL decline!
crude+NGL!1999-2015!
Jean Laherrere July 2016!
0!
100!
200!
300!
400!
500!
600!
700!
800!
900!
1000!
0! 5! 10! 15! 20! 25! 30! 35! 40!
annu
al o
il di
scov
ery
& p
rodu
ctio
n M
b!
cumulative production Mb!
UK crude oil decline 1940-2015!
prod EIA Mb!2002-2015!
Jean Laherrere July 2016!
51
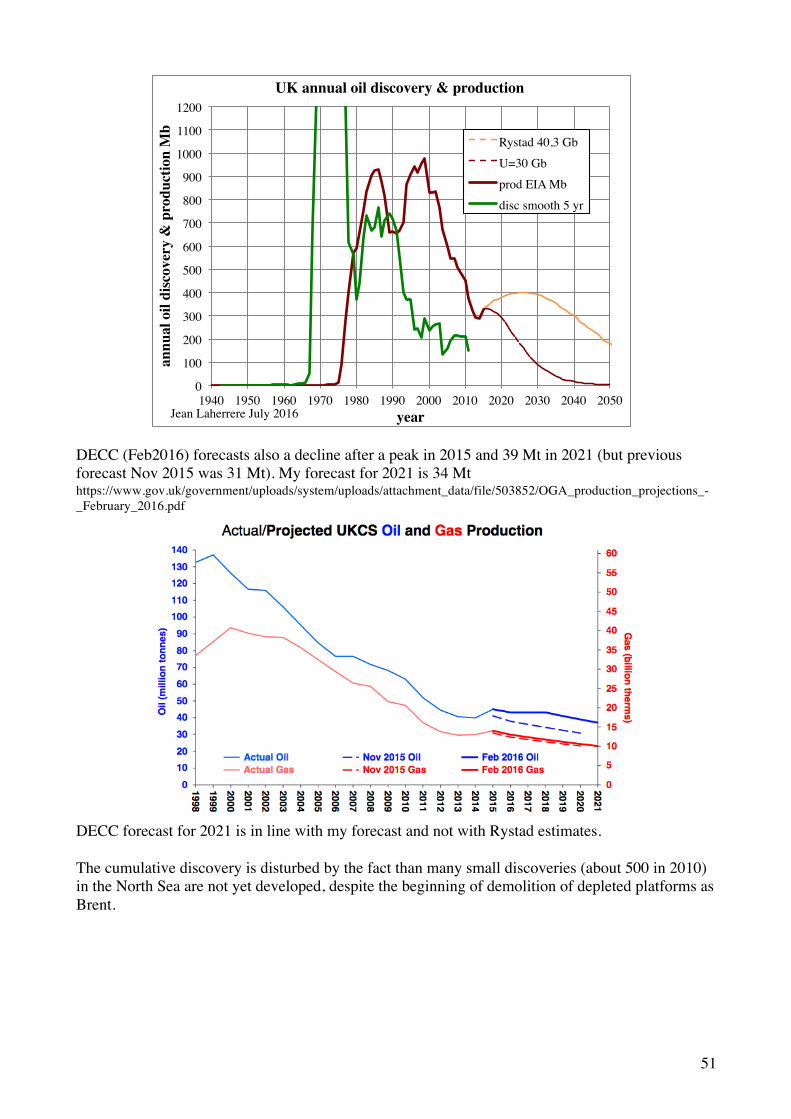
DECC (Feb2016) forecasts also a decline after a peak in 2015 and 39 Mt in 2021 (but previous forecast Nov 2015 was 31 Mt). My forecast for 2021 is 34 Mt https://www.gov.uk/government/uploads/system/uploads/attachment_data/file/503852/OGA_production_projections_-_February_2016.pdf
DECC forecast for 2021 is in line with my forecast and not with Rystad estimates. The cumulative discovery is disturbed by the fact than many small discoveries (about 500 in 2010) in the North Sea are not yet developed, despite the beginning of demolition of depleted platforms as Brent.
0!
100!
200!
300!
400!
500!
600!
700!
800!
900!
1000!
1100!
1200!
1940! 1950! 1960! 1970! 1980! 1990! 2000! 2010! 2020! 2030! 2040! 2050!
annu
al o
il di
scov
ery
& p
rodu
ctio
n M
b!
year!
UK annual oil discovery & production!
Rystad 40,3 Gb!U=30 Gb!prod EIA Mb!disc smooth 5 yr!
Jean Laherrere July 2016!
52
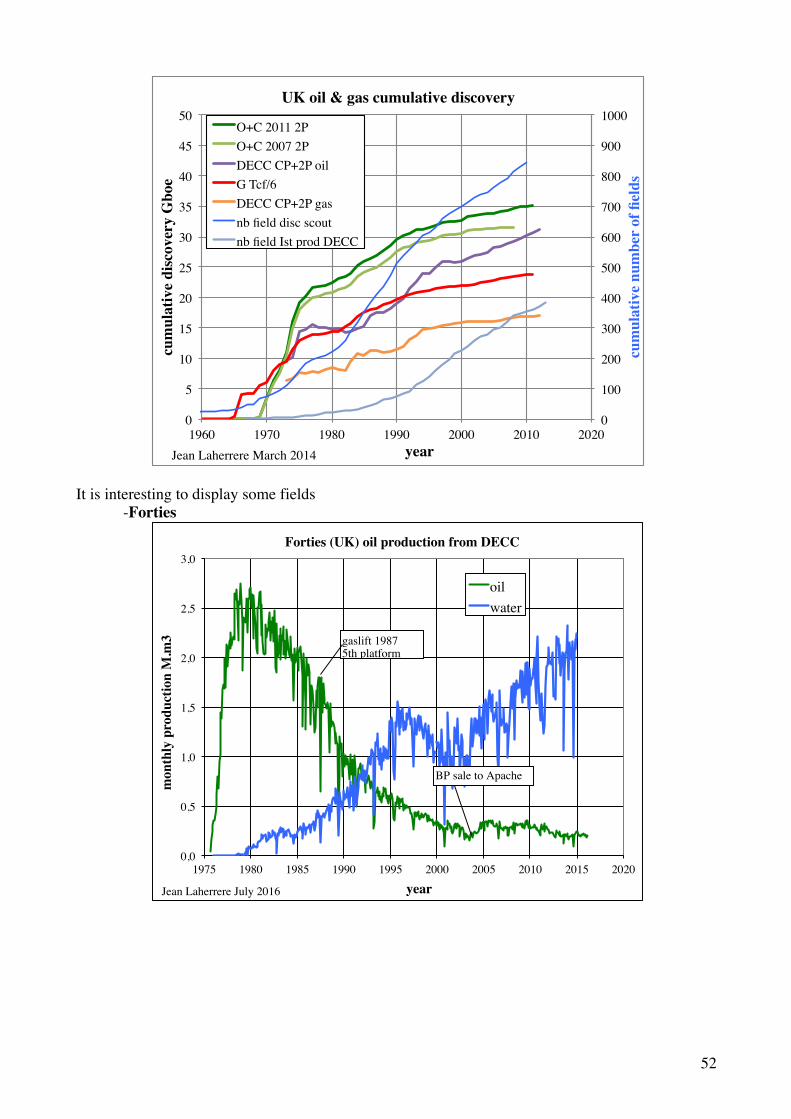
It is interesting to display some fields -Forties
0!
100!
200!
300!
400!
500!
600!
700!
800!
900!
1000!
0!
5!
10!
15!
20!
25!
30!
35!
40!
45!
50!
1960! 1970! 1980! 1990! 2000! 2010! 2020!
cum
ulat
ive
num
ber o
f fiel
ds!
cum
ulat
ive
disc
over
y G
boe!
year!
UK oil & gas cumulative discovery!
O+C 2011 2P!O+C 2007 2P!DECC CP+2P oil!G Tcf/6!DECC CP+2P gas!nb field disc scout!nb field Ist prod DECC!
Jean Laherrere March 2014!
0,0!
0,5!
1,0!
1,5!
2,0!
2,5!
3,0!
1975! 1980! 1985! 1990! 1995! 2000! 2005! 2010! 2015! 2020!
mon
thly
pro
duct
ion
M.m
3!
year!
Forties (UK) oil production from DECC!
oil!water!
Jean Laherrere July 2016!
gaslift 1987!5th platform!
BP sale to Apache!

53
0!
16!
32!
48!
64!
80!
96!
0,0!
0,5!
1,0!
1,5!
2,0!
2,5!
3,0!
0! 50! 100! 150! 200! 250! 300! 350! 400! 450! 500!
wat
ercu
t %!
mon
thly
pro
duct
ion
M.m
3!
cumulative production M.m3!
Forties (UK) oil decline 1975-March 2016!
1975-1983!
1984-2003!
1987-1988, 2004-2009!
Jul 2009-March 2016!
U IHS!
U DTI!
U decline before Apache!
Jean Laherrere July 2016!
gaslift 1987!5th platform!
BP sale to Apache 2004!
0,0!
0,5!
1,0!
1,5!
2,0!
2,5!
3,0!
3,5!
4,0!
0! 50! 100! 150! 200! 250! 300! 350! 400! 450! 500!
aP/C
P%!
cumulative oil production M.m3!
Forties Hubbert linearization annual oil production 1976-2016!
aP/CP%!1979-1981!1981-1986!1986-2003!2005-2016!
Jean Laherrere July 2016!
54
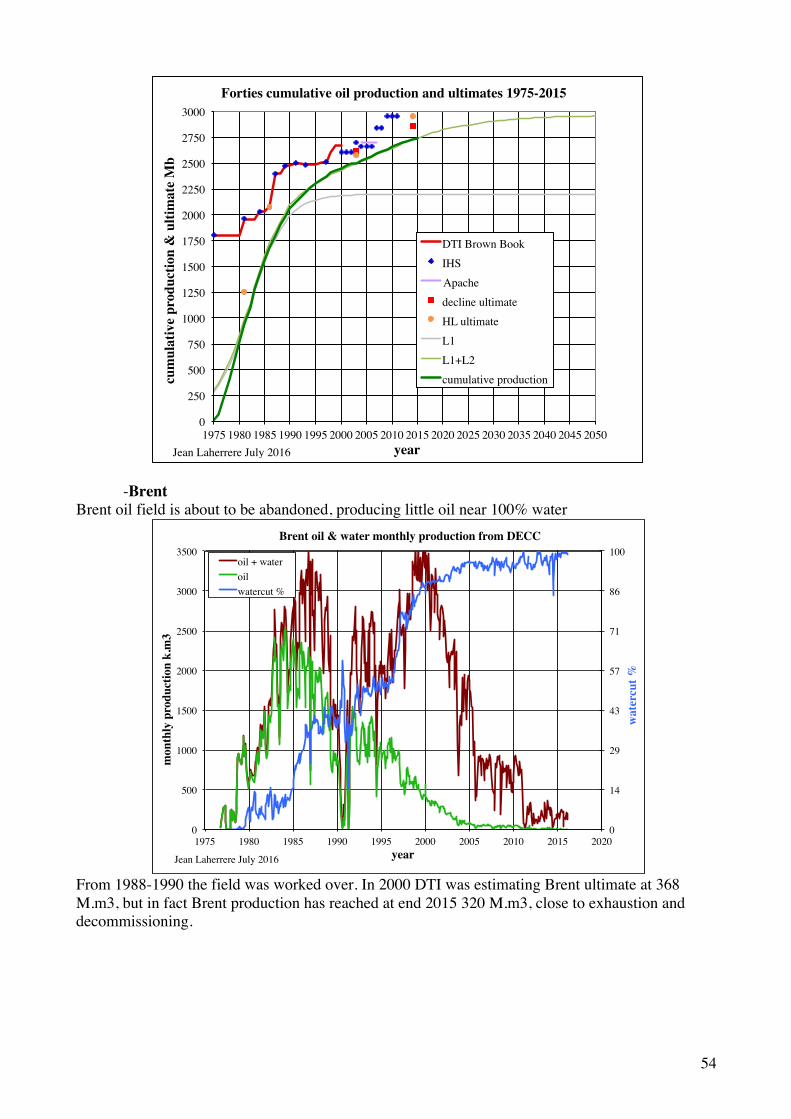
-Brent Brent oil field is about to be abandoned, producing little oil near 100% water
From 1988-1990 the field was worked over. In 2000 DTI was estimating Brent ultimate at 368 M.m3, but in fact Brent production has reached at end 2015 320 M.m3, close to exhaustion and decommissioning.
0!
250!
500!
750!
1000!
1250!
1500!
1750!
2000!
2250!
2500!
2750!
3000!
1975!1980!1985!1990!1995!2000!2005!2010!2015!2020!2025!2030!2035!2040!2045!2050!
cum
ulat
ive
prod
uctio
n &
ulti
mat
e M
b!
year!
Forties cumulative oil production and ultimates 1975-2015 !
DTI Brown Book!IHS!Apache!decline ultimate!HL ultimate!L1!L1+L2!cumulative production!
Jean Laherrere July 2016!
0!
14!
29!
43!
57!
71!
86!
100!
0!
500!
1000!
1500!
2000!
2500!
3000!
3500!
1975! 1980! 1985! 1990! 1995! 2000! 2005! 2010! 2015! 2020!
wat
ercu
t %!
mon
thly
pro
duct
ion
k.m
3!
year!
Brent oil & water monthly production from DECC!
oil + water!oil!watercut %!
Jean Laherrere July 2016!

55
Brent oil decline can be extrapolated on four different periods; leading to a wild range of values, but the last one being 1996-2014
Brent HL of oil production also displays chaotic trends, showing the limitation of such estimate
0!
20!
40!
60!
80!
100!
0!
500!
1000!
1500!
2000!
2500!
0! 50! 100! 150! 200! 250! 300! 350!
wat
ercu
t %!
mon
thly
pro
duct
ion
k.m
3!
cumulative oil production M.m3 !
Brent oil decline!
oil!
watercut %!
Jean Laherrere July 2016!
ultimate DTI 2000!oil 368 M.m3 ?!
work over !1988-1990!
0!
5!
10!
15!
20!
25!
30!
35!
0! 50! 100! 150! 200! 250! 300! 350! 400! 450! 500! 550! 600!
oil a
nnua
l pro
duct
ion
M.m
3!
cumulative oil production M.m3!
Brent field: oil decline 1976-2014!
oil M.m3!
1984-1988!
1988-1990!
1992-1996!
1996-2014!
Jean Laherrere 2016!

56
Brent oil cumulative production and ultimates from the Brown Book, decline or HL displays the wild range of uncertainty.
My 2008 Oslo paper figure 35 displayed the same graph stating that Brent field is a good example of negative reserve growth -Thistle Thistle monthly oil production displays a long decline (close to 1.5% per month), with a small surge after 2010
0!
2!
4!
6!
8!
10!
12!
14!
16!
18!
20!
0! 50! 100! 150! 200! 250! 300! 350! 400!
aP/C
P%!
cumulative oil production M.m3!
Brent field: Hubbert linearization oil production!
aP/CP%!1985-1988!1988-1990!1992-1996!1996-2015!
Jean Laherrere 2016!
0!
100!
200!
300!
400!
500!
600!
1975! 1980! 1985! 1990! 1995! 2000! 2005! 2010! 2015! 2020!
oil M
.m3!
year!
Brent oil ultimates estimate and cumulative production!
U oil Brown Book!HL ultimate!decline ultimate!cumul prod!
Jean Laherrere 2016!

57
Thistle oil decline trends towards 70 M.m3
Thistle cumulative oil production and BB initial reserves (in red) is another example of negative reserve growth. In fact reserves estimate are not reliable before production and start to be only ten years after production start.
0!
10!
20!
30!
40!
50!
60!
70!
80!
90!
100!
0!50!
100!150!200!250!300!350!400!450!500!550!600!650!700!
1978! 1983! 1988! 1993! 1998! 2003! 2008! 2013! 2018!
wat
ercu
t %!
mon
thly
oil
prod
uctio
n k.
m3!
year!
Thistle monthly oil production!
aP k.m3!1,5%/m decline!watercut %!
Jean Laherrere July 2016!
0!
100!
200!
300!
400!
500!
600!
700!
0! 10! 20! 30! 40! 50! 60! 70!
mon
thly
pro
duct
ion
k.m
3!
cumulative production M.m3!
Thistle oil decline 1978-2016!
1978-1982!
1982-July 2013!
Aug 2013-March 2016!
Jean Laherrere July 2016!

58
-comparison US, Russia & Saudi Arabia The comparison of the annual & cumulative crude oil + condensate production for US, Russia and SA between Rystad and my ultimates is, given in the next two graphs
The cumulative crude oil production & forecasts shows that Rystad estimates for US and Russia are quite different from mine
0!
10!
20!
30!
40!
50!
60!
70!
80!
90!
100!
1975! 1980! 1985! 1990! 1995! 2000! 2005! 2010! 2015! 2020!
M.m
3 &
wat
ercu
t %!
year!
Thistle inital reserves (brown Book) & cumulative production with watercut!
initial reserves!decline ultimate!cum prod!watercut %!
Jean Laherrere July 2016!
0!
1!
2!
3!
4!
5!
6!
7!
8!
9!
10!
11!
12!
13!
1900! 1925! 1950! 1975! 2000! 2025! 2050! 2075! 2100!
Mb/
d!
year!
US, Russia & Saudi Arabia crude oil annual production!
Rystad 425 Gb!U = 240 Gb!Russia aP !U=350 Gb!SA aP!Rystad 480 Gb!U = 300 Gb!US aP!
Jean Laherrere July 2016!

59
The forecasted cumulative crude oil production after 2015 shows that US and Russia are similar in my interpretation around 75 Gb, but also in Rystad for about 250 Gb For SA my interpretation and Rystad are around 200 Gb
Rystad claims “United States now holds more oil reserves than Saudi Arabia” assuming that US future oil production from 2015 to 2100 will be about 240 Gb compared with 190 Gb for Saudi Arabia, but this 240 Gb seems unrealistic and more likely will be one third, about 80 Gb. Rystad claims that Russia future oil production 2015-2100 could be 250 Gb; again it seems unrealistic and more likely to be 70 Gb. Only Rystad claim of 190 Gb for Saudi Arabia 2015-2100 could be possible, but SA data is so unreliable that uncertainty should be added.
0!
50!
100!
150!
200!
250!
300!
350!
400!
450!
500!
1900! 1925! 1950! 1975! 2000! 2025! 2050! 2075! 2100!
cum
ulat
ive
crud
e oi
l +co
nden
sate
pro
duct
ion
Gb!
Titre!
US, Russia & Saudi Arabia cumulative crude oil production!
Rystad 480 Gb!
U = 300 Gb!
US!
Rystad 425 Gb!
U = 240 Gb!
Russia !
U=350 Gb!
SA!
Jean Laherrere July 2016!
0!
25!
50!
75!
100!
125!
150!
175!
200!
225!
250!
275!
2010! 2020! 2030! 2040! 2050! 2060! 2070! 2080! 2090! 2100!
cum
ulat
ive
crud
e oi
l pro
duct
ion
Gb!
year!
US, Russia & Saudi Arabia forecasted cumulative crude oil production after 2015!
Russia Rystad 425 Gb!US Rystad 480 Gb!SA U = 350 Gb!US U = 300 Gb!Russia U = 240 Gb!
Jean Laherrere July 2016!

60
-Conclusion Only operators (and partners) having every complete data on a conventional field are able to estimate correctly oil reserves. When other competitors with limited data could only rely on scout information or unreliable extrapolation of past production. If conventional reserves estimates are reliable and the recovery factor fairly well estimated, it is because the techniques have been checked and improved on thousands mature fields close to exhaustion, and the conventional oil & gas reserves ultimate of a basin represents a very small percentage (about 1%) of the hydrocarbons generated by the source-rocks, leaving a large amount in the ground as resources. In contrary LTO fields are new (mainly after 2008); they are called “continuous type accumulations” by USGS, without any water contact and far from exhaustion, there are not enough historical data to check the methodology and in particular the recovery factor. Noon can claim to be right in estimating LTO reserves (being the cumulative production when exhausted), because there are no yet any abandoned LTO fields. Scout companies are usually only collecting data from people who knows or from reports, without having the competence to estimate reserves. The collected data by scout companies is heterogeneous in definition, units, techniques and the compilation is poor. All published 1P reserves forget to mention that it is incorrect to aggregate reserves arithmetically, widely underestimating the sum, leading to so called reserve growth (in fact poor practice) Rystad July 2016 claim that the United States now holds more oil reserves than Saudi Arabia is wrong, despite that Saudi Arabia reserves are badly known, the value claimed by SA is also wrong, as it was stated by Sadad al-Husseini (former VP ARAMCO) in 2007 in London that the 300 Gb of increase of OPEC members during the fight on quotas after the 1986 oil counter shock were only speculative resources. US LTO production varies with sources, because LTO wells are confused with horizontal wells (Permian Basin) In the past horizontal drilling was used to speed production (in the 90s Shell Yibal, Rabi-Kounga), increasing the level of the peak but also the decline, even against the final recovery!