worldwide governance indicators and key findings...
TRANSCRIPT

1
Worldwide Governance Indicators and key Findings: Implications for Credit, Investment
and Policies in Emerging Markets
Daniel KaufmannThe World Bank Institute
www.worldbank.org/wbi/governanceor, www. govindicators.org
Presentation at Conference on ‘Political Risk Revisited’, at Chatham House,
London, February 5th, 2007

2
Evidence-based Approach, through empirics
1. Data Matters--on Governance & Institutions: data can be gathered, analyzed, and used judiciously
2. Institutions, Governance and Corruption Matters 3. On average stagnation on Governance – yet high
variance --some countries improve in short term4. Behavior of the Firm and Investor also Matters5. Global collective responsibility6. Governance matters for a country’s: growth,
competitiveness, investments & financial markets7. Implications for Political Risk Analysis & Sectoral Policy

3
The ‘Power of Data’: progress in measurement
1. The ‘Macro’/Aggregate Level of Measurement:
Worldwide Aggregate Governance Indicators: 200
countries, 6 components, periodic.
2. ‘Mezzo’: Cross-Country Surveys of Enterprises
3. ‘Micro’: Specialized, in-depth, in-country Governance
and Institutional Capacity Diagnostics: Includes surveys
of: i) user of public services (citizens); ii) firms, and, iii)
public officialsOn ‘Aggregate/Macro’ Level first…

4
Six Dimensions of Governance Measured
• The process by which those in authority are selected and replaced [Political Governance]: 1. VOICE AND ACCOUNTABILITY 2. POLITICAL STABILITY & ABSENCE OF
VIOLENCE/TERRORISM• The capacity of government to formulate & implement
policies, and deliver services [Economic Governance]:3. GOVERNMENT EFFECTIVENESS4. REGULATORY QUALITY
• Respect of citizens and state for institutions that govern interactions among them [Institutional Governance]: 5. RULE OF LAW 6. CONTROL OF CORRUPTION
Governance as the set of traditions and institutions by which authority in a country is exercised -- specifically:
5
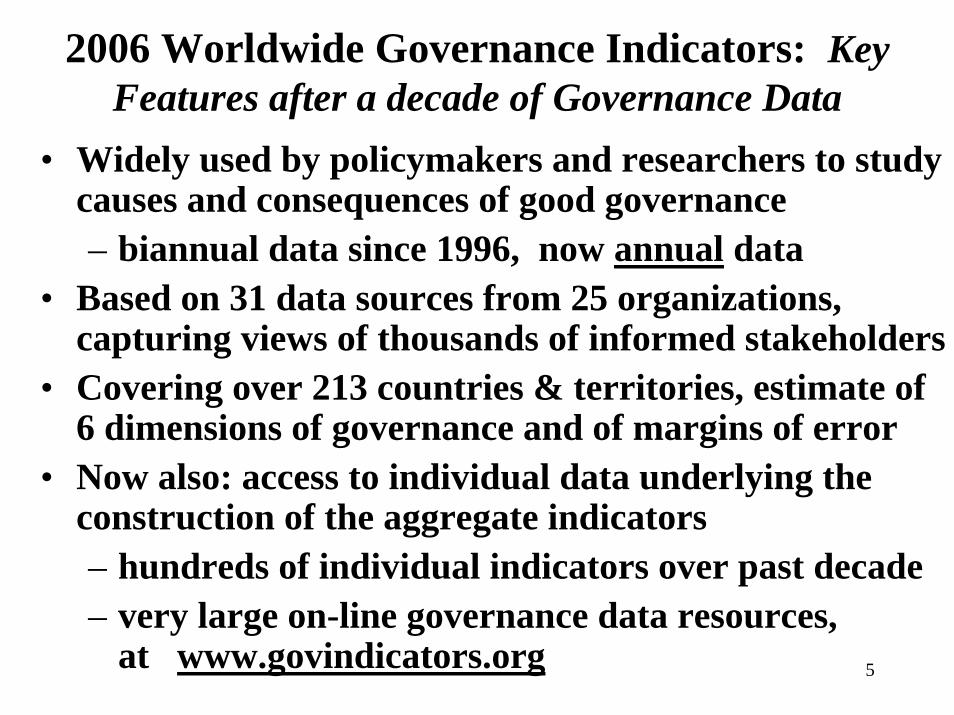
2006 Worldwide Governance Indicators: Key Features after a decade of Governance Data
• Widely used by policymakers and researchers to study causes and consequences of good governance– biannual data since 1996, now annual data
• Based on 31 data sources from 25 organizations, capturing views of thousands of informed stakeholders
• Covering over 213 countries & territories, estimate of 6 dimensions of governance and of margins of error
• Now also: access to individual data underlying the construction of the aggregate indicators– hundreds of individual indicators over past decade– very large on-line governance data resources,
at www.govindicators.org
6
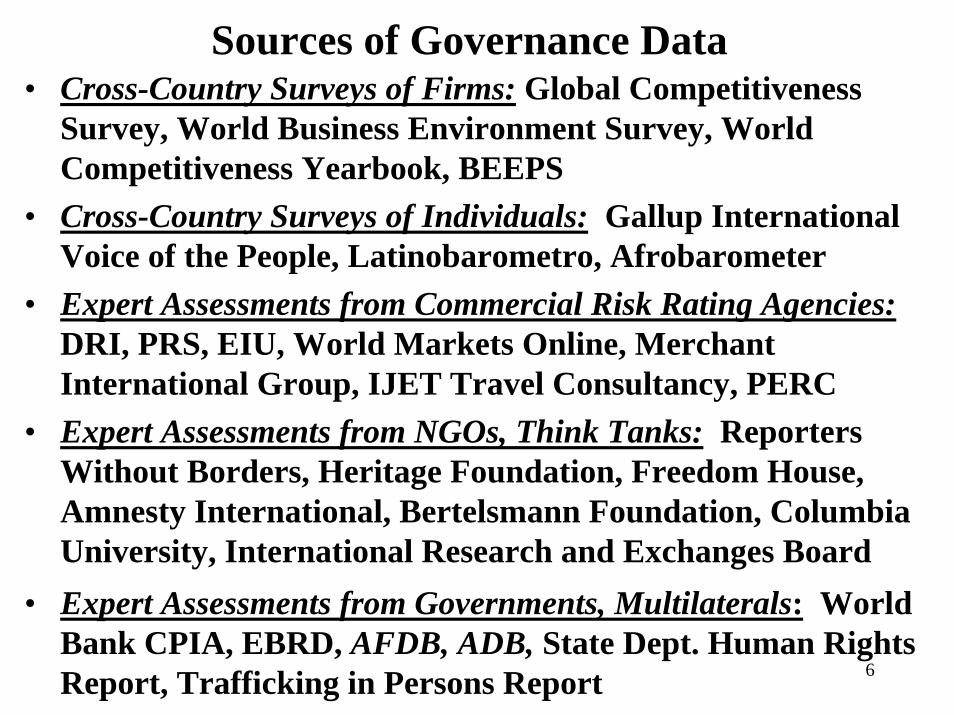
Sources of Governance Data• Cross-Country Surveys of Firms: Global Competitiveness
Survey, World Business Environment Survey, World Competitiveness Yearbook, BEEPS
• Cross-Country Surveys of Individuals: Gallup International Voice of the People, Latinobarometro, Afrobarometer
• Expert Assessments from Commercial Risk Rating Agencies:DRI, PRS, EIU, World Markets Online, Merchant International Group, IJET Travel Consultancy, PERC
• Expert Assessments from NGOs, Think Tanks: Reporters Without Borders, Heritage Foundation, Freedom House, Amnesty International, Bertelsmann Foundation, Columbia University, International Research and Exchanges Board
• Expert Assessments from Governments, Multilaterals: World Bank CPIA, EBRD, AFDB, ADB, State Dept. Human Rights Report, Trafficking in Persons Report

7
Building Aggregate Governance Indicators• Benefits from Aggregation• Use Unobserved Components Model (UCM)
to construct composite governance indicators, and margins of error for each country
• Estimate of governance: weighted average of individual scores for each country, re-scaled
• Weights are proportional to precision of underlying data sources, and precision based on extent of ‘consensus’ among sources
• Margins of error reflect (a) number of sourcesin which a country appears, and (b) the precision of those sources
8
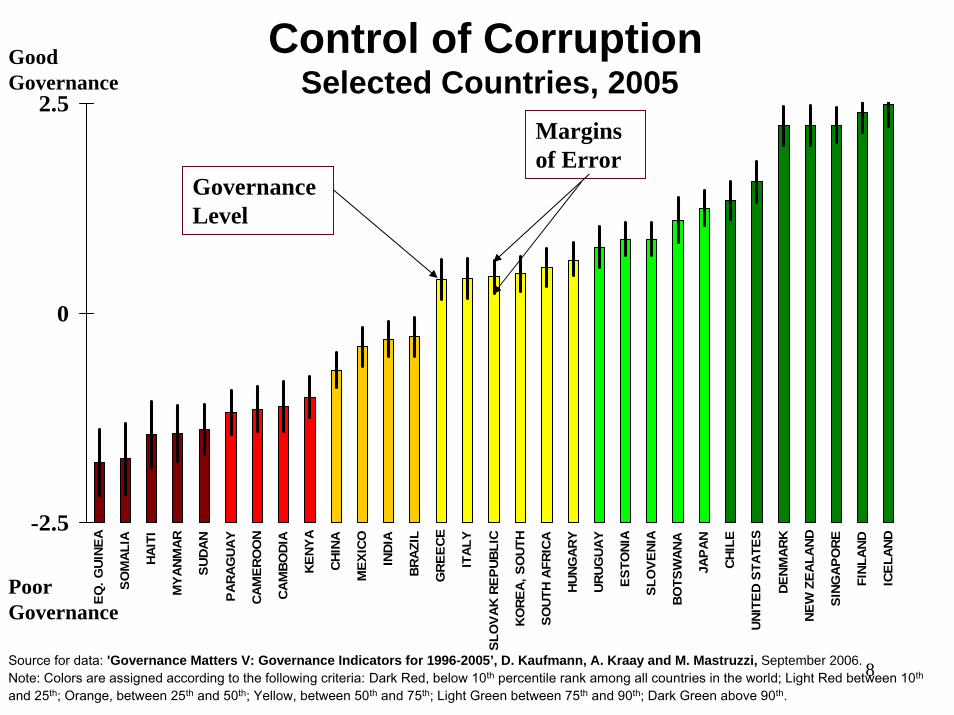
Control of CorruptionSelected Countries, 2005
-2.5
0
2.5E
Q. G
UINE
A
SO
MA
LIA
HAI
TI
MY
AN
MA
R
SU
DAN
PA
RAG
UAY
CAM
ER
OO
N
CA
MBO
DIA
KE
NYA
CHIN
A
MEX
ICO
IND
IA
BR
AZIL
GR
EE
CE
ITAL
Y
SLO
VA
K RE
PUB
LIC
KO
REA
, SO
UTH
SO
UTH
AFR
ICA
HUN
GAR
Y
URU
GUA
Y
ES
TON
IA
SLO
VEN
IA
BO
TSW
ANA
JAPA
N
CHIL
E
UNI
TED
STA
TES
DEN
MAR
K
NEW
ZEA
LAN
D
SING
AP
OR
E
FIN
LAN
D
ICE
LAN
D
Poor Governance
Governance Level
Margins of Error
Good Governance
Source for data: 'Governance Matters V: Governance Indicators for 1996-2005’, D. Kaufmann, A. Kraay and M. Mastruzzi, September 2006.Note: Colors are assigned according to the following criteria: Dark Red, below 10th percentile rank among all countries in the world; Light Red between 10th
and 25th; Orange, between 25th and 50th; Yellow, between 50th and 75th; Light Green between 75th and 90th; Dark Green above 90th.

9
Are Countries Stagnating in Governance?
• The world on average has not improved on governance, though it has on the macro-economic policies, infrastructure, etc: there is a ‘governance gap’
• But large or small variation across countries?
• New method: for each country, we can identify whether there are significant changes over time
• It is found that changes can take place in the short-term: in 6-to-8 years, some deteriorations as well as some significant improvements as well

10
0
1.5
3
1984-1988 1989-1993 1994-1998 1999-2001
TRANSITION
EMERGING
OECD+NIC
Source: ‘Rethinking Governance’, based on calculations from WDI. Y-axis measures the log value of the average inflation for each region across each period
Significant Decline in Inflation Rates WorldwideHighInflation
Low
(avg. inlogs)

11
Quality of Infrastructure also improved…
1.5
4
6.5
1997 1998 1999 2000 2001 2002 2003
High
Low
East AsiaIndustrialized
OECD
Transition
Emerging
Source: EOS 1997-2003 (Quasi-balanced panel). Question 6.01: General infrastructure in your country is among the best in the world?
12
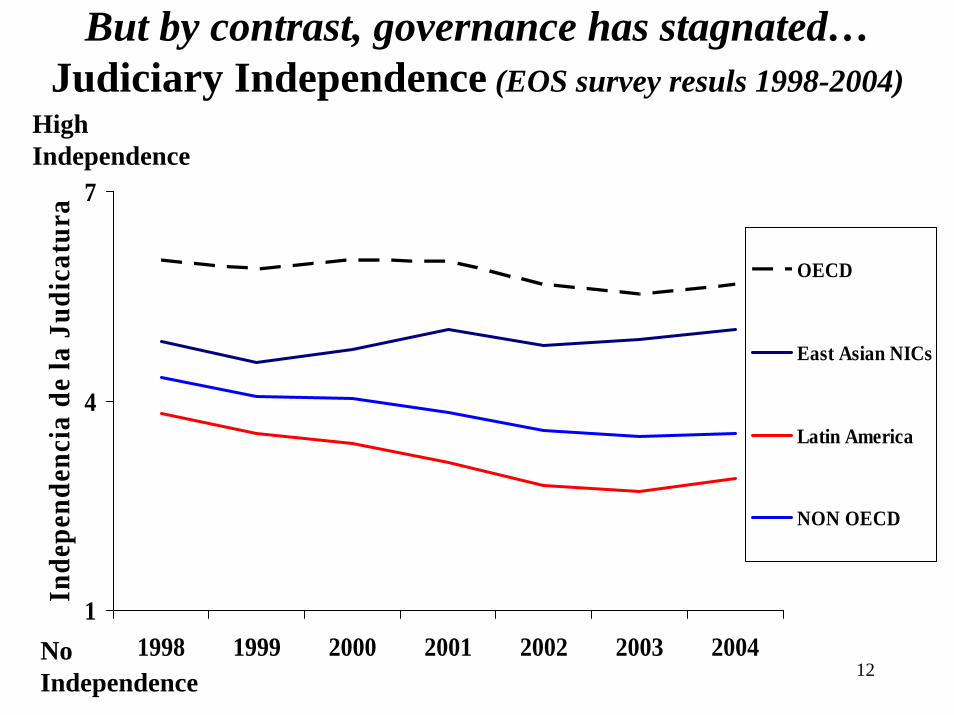
But by contrast, governance has stagnated…Judiciary Independence (EOS survey resuls 1998-2004)
1
4
7
1998 1999 2000 2001 2002 2003 2004
Inde
pend
enci
a de
la J
udic
atur
a
OECD
East Asian NICs
Latin America
NON OECD
HighIndependence
No Independence

13
No Significant Trend in Control of Corruption Worldwide Averages
0.2
0.5
0.8
1996 1998 2000 2002 2004
EIU
PRS
QLM
Poor
Good
PRS country coverage in 1996: 129, all other periods 140; QLM and EIU country coverage: 115 for all periods.

14
Press Freedom in the World, 1995 vs. 2004: Stagnant?
32
34
34
Not Free
Part Free
Free
% countries in 1995
Source: Freedom House. Y axis measures percentage of countries in the region with free press (rating of 30 or below), partly free (ratings between 30 and 60) and not free (rating above 60).
36
26
38
Not Free
Part Free
Free
% countries in 2004

15
-2
0
2IV
OR
Y CO
AST
ZIM
BABW
E
ISRA
EL
NAM
IBIA
EG
YPT
CAM
BOD
IA
LAO
S
RO
MAN
IA
CAM
ERO
ON
PAK
ISTA
N
RUSS
IA
GHA
NA
BO
LIV
IA
BOTS
WAN
A
SPA
IN
BULG
ARIA
ESTO
NIA
LATV
IA
Major Deterioration
(selected countries)
Major Improvement
(selected countries)
Insignificant Change (selected countries)
Changes in Control of Corruption, 1996-05
Changes were calculated on the basis of the differences in country estimates from 1996 and 2005. Classification for major deteriorations and improvements were based on 75% confidence interval. Source for data: 'Governance Matters V: Governance Indicators for 1996-2005’, by D. Kaufmann, A.Kraay and M. Mastruzzi, September 2006 - www.govindicators.org

16
Development Dividend From Good Governance
Low Governance Medium Governance High Governance
Control of Corruption
$300
$3,000
$30,000
Data Source for calculations: KK 2004. Y-axis measures predicted GDP per capita on the basis of Instrumental Variable (IV) results for each of the 3 categories. Estimations based on various authors’ studies, including Kaufmann and Kraay.

17
Good Governance associated Country’s Competitiveness
ZWE
VNMVEN
URY
USA
GBRARE
UKR
UGA
TUR
TUN
TTO
THA
TZA
TJK
TWNCHE
SWE
LKA
ESP
ZAF
SVN
SVK
SGP
YUG
RUS
ROM
QATPRT
POL
PHLPER
PRY
PAN
PAK
NOR
NGA
NIC
NZLNLD
NAM
MOZ
MAR
MNGMDA
MEXMUS
MLT
MLI
MYS
MWI MDG
MKD
LUX
LTULVA
KGZ
KWT
KOR
KEN
KAZ
JOR
JPN
JAM
ITA
ISR IRL
IDN
IND
ISL
HUN
HKG
HND
GUY
GTM
GRC
GHA
DEU
GEOGMB
FRA
FIN
ETH
SLVEGY
ECU TMPDOM
DNK
CZECYP
HRV CRICOL
CHN
CHL
TCD
CAN
CMRKHM
BGR
BRA
BWA
BIHBOL
BEN
BEL
BGD
BHR
AZE
AUT
AUS
ARGDZA
ALB
2
4
6
-1.5 -1.0 -0.5 0.0 0.5 1.0 1.5 2.0 2.5 3.0WGI Control of Corruption
Gro
wth
Com
petit
iven
ess
Inde
x (E
OS)
LowLow High
High
r = 0.90
Sources: GCI drawn from EOS firm survey, WEF 2005 – 117 countries; Control of Corruption from Kaufmann, Kraay and Mastruzzi, ‘Governance Matters IV: Governance Indicators for 1996-2004’.
18
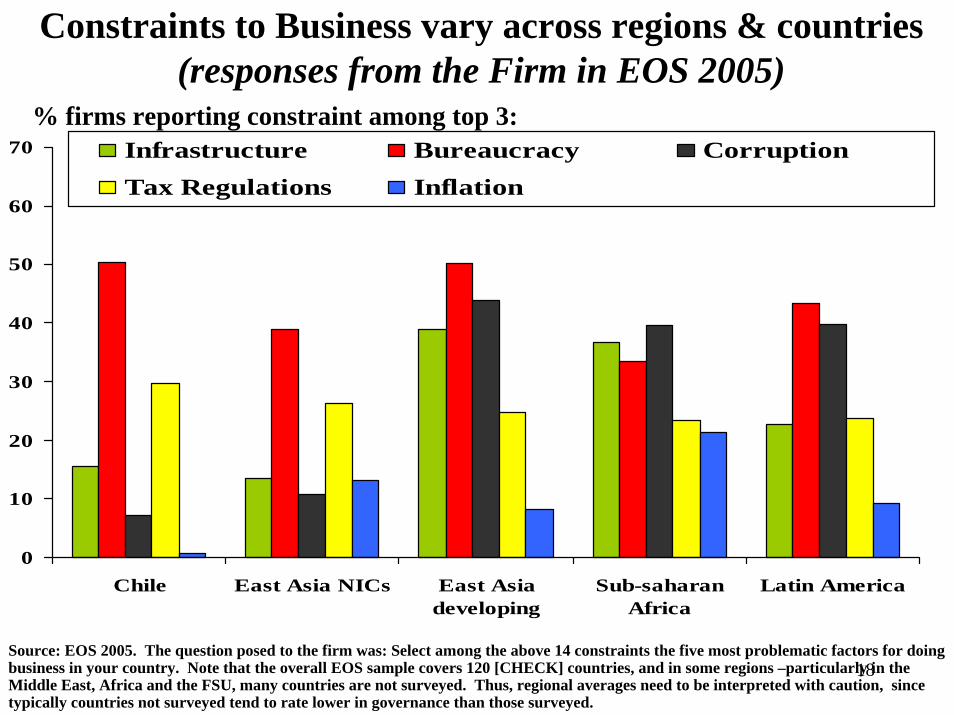
Constraints to Business vary across regions & countries (responses from the Firm in EOS 2005)
0
10
20
30
40
50
60
70
Chile East Asia NICs East Asiadeveloping
Sub-saharanAfrica
Latin America
Infrastructure Bureaucracy CorruptionTax Regulations Inflation
% firms reporting constraint among top 3:
Source: EOS 2005. The question posed to the firm was: Select among the above 14 constraints the five most problematic factors for doing business in your country. Note that the overall EOS sample covers 120 [CHECK] countries, and in some regions –particularly in the Middle East, Africa and the FSU, many countries are not surveyed. Thus, regional averages need to be interpreted with caution, since typically countries not surveyed tend to rate lower in governance than those surveyed.
19
0
20
40
60
80
100
OECD East Asia(NIC)
East Asiadev.
South Asia Sub-saharanAfrica
FormerSovietUnion
EasternEurope
LatinAmerica
Freq
uenc
y of
Bri
bery
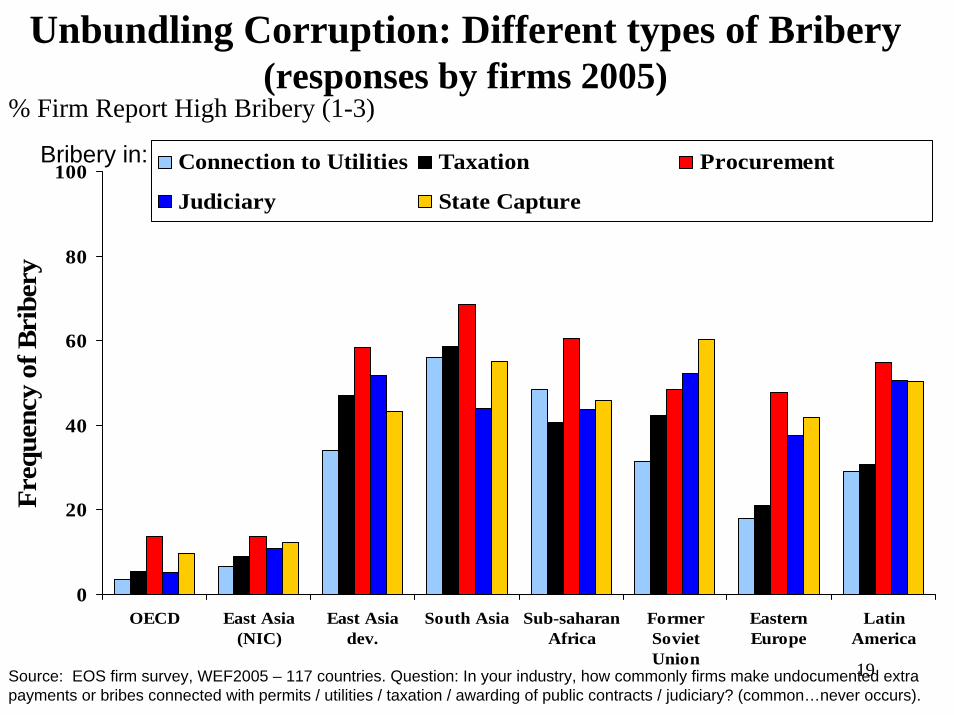
Connection to Utilities Taxation Procurement
Judiciary State Capture
Unbundling Corruption: Different types of Bribery(responses by firms 2005)
% Firm Report High Bribery (1-3)
Source: EOS firm survey, WEF2005 – 117 countries. Question: In your industry, how commonly firms make undocumented extra payments or bribes connected with permits / utilities / taxation / awarding of public contracts / judiciary? (common…never occurs).
Bribery in:

20
Multinationals Bribe Abroad?% Firms Reporting Frequent Procurement Bribery, EOS 2005
0
20
40
60
80
100
Procurement Bribery is prevalent (% Firms Report)% F
irm
s Rep
ortin
g Pr
ocur
emen
t Bri
bery
is P
reva
len Domestic Firm in OECD Country
OECD Multinational in another OECD country
OECD Multinational in Non-OECD country
Domestic Firm in Non-OECD Country
Source: EOS, preliminary. Question: In your industry, how commonly would you estimate that firms make undocumented extra payments or bribes connected with the following: permits, public utilities, tax payments, loan applications, awarding of public contracts, influencing of laws, policies, regulations and decrees to favor selected business interest, and judicial decisions. Any firms reporting answers 1 through 3 were considered to be reporting at least high frequency of bribery, while answers 4 through 7 were not.

21
Governance Matters for Assessing Emerging Financial Markets Prospects
Indicators Matter, and Some Empirical Lessons

22
Stock Market Volatility vs. Control of Corruption
ARG
BRA
CHL
CHN
COLCZE
EGYFRA
GRC
HKG
HUN
IND
IDN
ISRITA JPN
JOR
KORMYS
MEX
MAR
NGA
PERPHL
POL
PRT
RUS
SAU
SVKZAF
ESP
LKA
TWN
THA
TUR
USA
VEN
ZWE
0
10
20
30
-1.5 -1.0 -0.5 0.0 0.5 1.0 1.5 2.0Control of Corruption
Stoc
k M
arke
t Vol
atili
ty
LowLow High
High
r = -0.56
Sources: KK 1998 and Morgan Stanley Capital International Dataset and Emerging Markets Database (1998). Stock volatility defined as the standard deviation of monthly returns over December 1984 to December 1998, multiplied by 100.
23
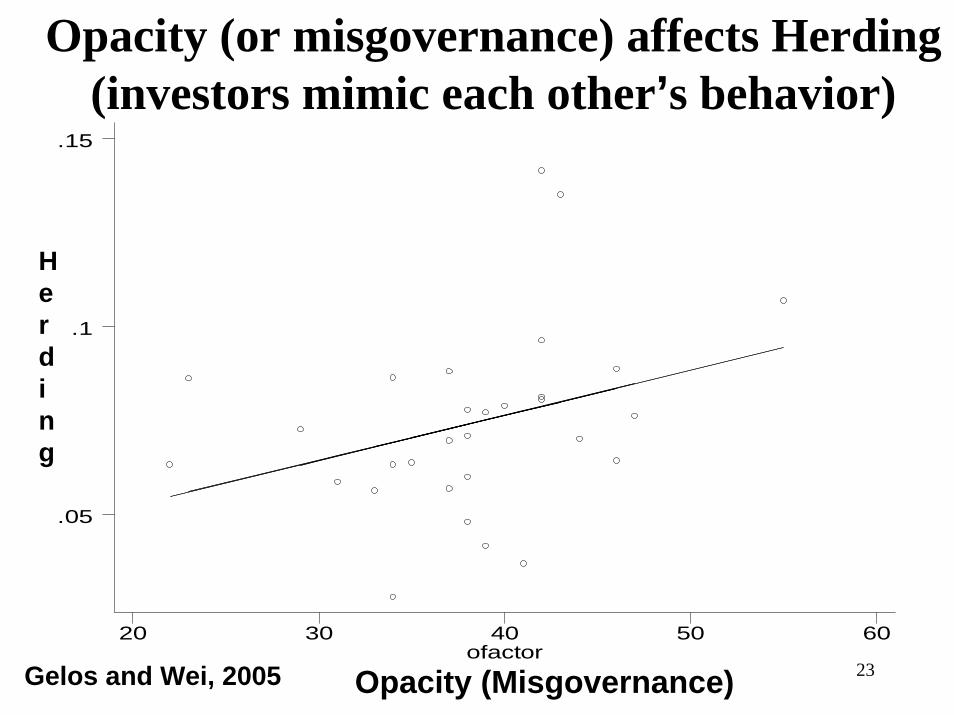
Opacity (or misgovernance) affects Herding (investors mimic each other’s behavior)
ofactor20 30 40 50 60
.05
.1
.15
Herding
Opacity (Misgovernance)Gelos and Wei, 2005
24
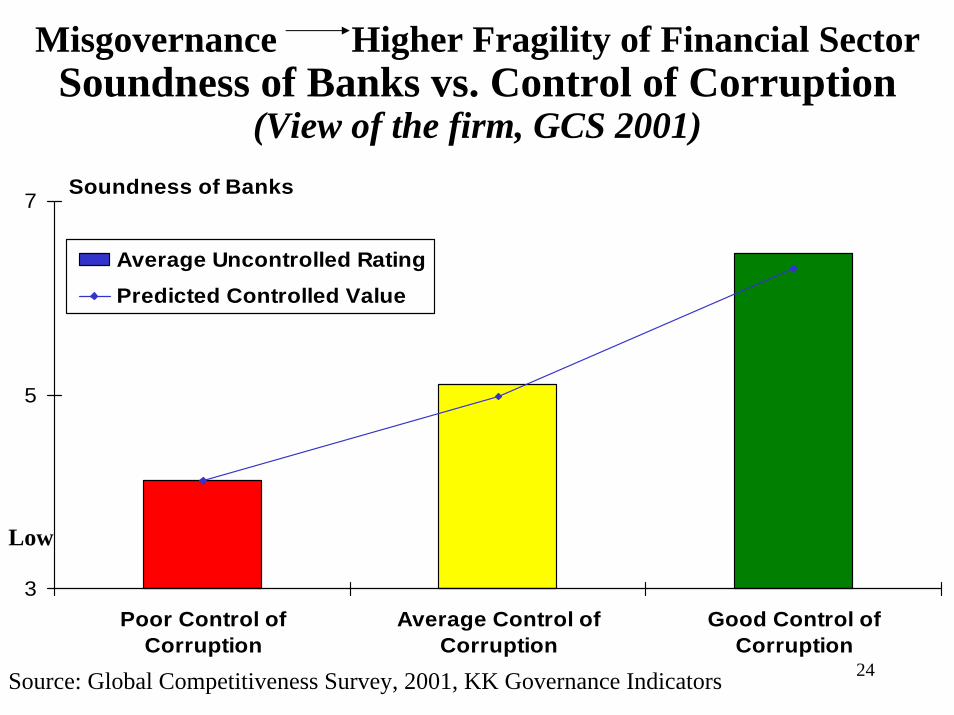
Misgovernance Higher Fragility of Financial Sector Soundness of Banks vs. Control of Corruption
(View of the firm, GCS 2001)
3
5
7
Poor Control ofCorruption
Average Control ofCorruption
Good Control ofCorruption
Average Uncontrolled Rating
Predicted Controlled Value
Soundness of Banks
Low
Source: Global Competitiveness Survey, 2001, KK Governance Indicators

25
2006 Bond Spreads vs. Corruption Control
Venezuela
UruguayTunisia
Thailand
Korea, sout h
Sout h Af r ica
Russia
PolandPhil ippines
Peru
Pakist an
Niger ia
Morocco
Mexico
Malaysia
Lebanon
Hungary
El Salvador
Egypt
Ecuador
Dominican Republic
Ivory Coast
Colombia
ChinaChile
Braz il
Argent ina
-2 -1 0 1 2Control of Corruption (KK05)
Bon
d Sp
read
s (lo
g - B
FS06
)
40
400
4,000
125
1,250
Low Control High Control
Sources: Bloomberg Financial Services & WBI. Bond spreads are drawn from the Global Emerging Market Bond Index (EMBIG) produced by JP Morgan on 33 emerging economies.
r = - 0.57
26
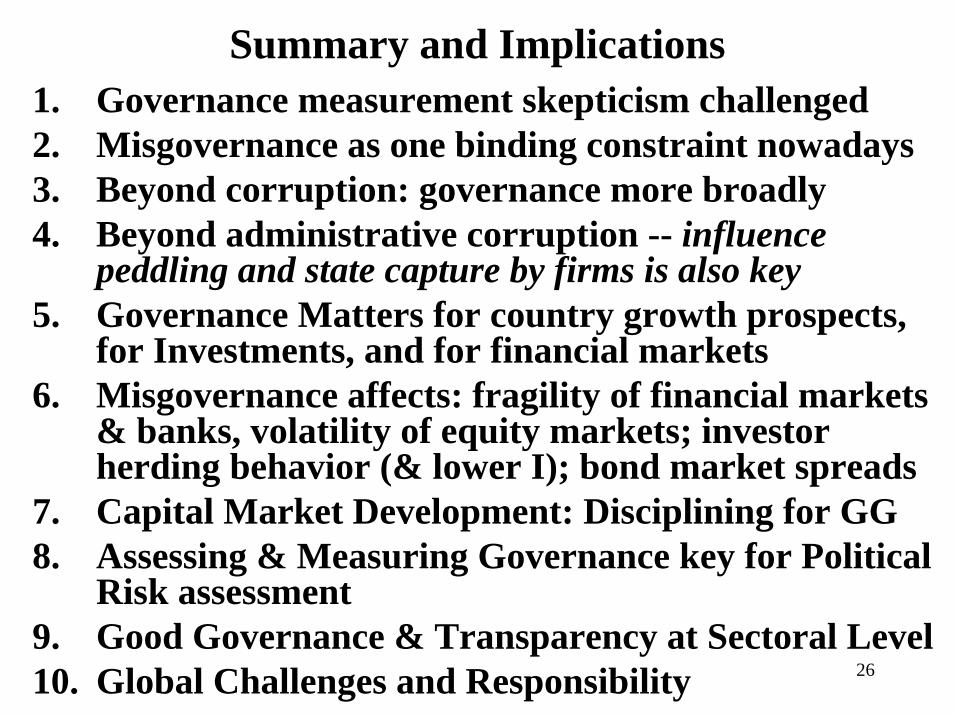
Summary and Implications1. Governance measurement skepticism challenged2. Misgovernance as one binding constraint nowadays3. Beyond corruption: governance more broadly4. Beyond administrative corruption -- influence
peddling and state capture by firms is also key5. Governance Matters for country growth prospects,
for Investments, and for financial markets6. Misgovernance affects: fragility of financial markets
& banks, volatility of equity markets; investor herding behavior (& lower I); bond market spreads
7. Capital Market Development: Disciplining for GG8. Assessing & Measuring Governance key for Political
Risk assessment9. Good Governance & Transparency at Sectoral Level10. Global Challenges and Responsibility

27
Governance Has Improved in Some Groups:e.g. “Pull Effect” of EU Accession
-1.5
-1
-0.5
0
0.5
1
1996 1998 2000 2002 2004
Rul
e of
Law
EUAccessed
ex-SovietUnion (noaccess)
Source for data: http://www.worldbank.org/wbi/governance/govdata/. EU EE Accessed Countries: Czech Republic, Estonia, Hungary, Latvia, Lithuania, Poland, Slovak Republic, and Slovenia.
High
Low
28
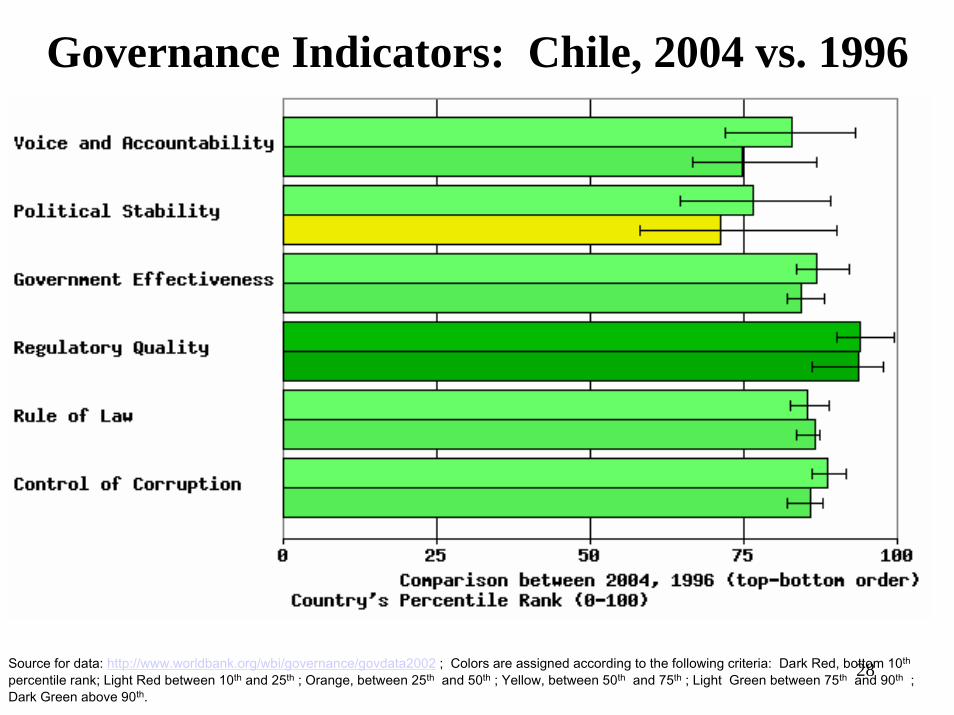
Governance Indicators: Chile, 2004 vs. 1996
Source for data: http://www.worldbank.org/wbi/governance/govdata2002 ; Colors are assigned according to the following criteria: Dark Red, bottom 10th
percentile rank; Light Red between 10th and 25th ; Orange, between 25th and 50th ; Yellow, between 50th and 75th ; Light Green between 75th and 90th ; Dark Green above 90th.