worldwide variations in the prevalence of asthma symptoms ... · group were studied in each centre....
TRANSCRIPT

Eur Respir J 1998; 12: 315–335DOI: 10.1183/09031936.98.12020315Printed in UK - all rights reserved
Copyright ©ERS Journals Ltd 1998European Respiratory Journal
ISSN 0903 - 1936
Worldwide variations in the prevalence of asthma symptoms: the International Study of Asthma and Allergies in Childhood (ISAAC)
The International Study of Asthma and Allergies in Childhood (ISAAC) Steering Committee*
There is considerable concern that the prevalence ofasthma and allergic diseases is increasing in Western anddeveloping countries. However, the aetiology of theseconditions remains poorly understood, despite a large vol-ume of clinical and epidemiological research within popu-lations that has been directed at explaining why someindividuals and not others develop asthma and allergies.Investigation of the reasons for variations in prevalencebetween populations may be a more fertile source of newaetiological clues, but little is known about worldwidevariations in the prevalence of asthma and allergic dis-eases. Phase One of the International Study of Asthmaand Allergies in Childhood (ISAAC) developed simplemethods for measuring the prevalence of childhoodasthma, allergic rhinitis and atopic eczema for interna-tional comparisons, suitable for different geographicallocations and languages [1, 2]. ISAAC is a unique projectwhich has attracted worldwide interest and large scale par-ticipation.
The aims of ISAAC Phase One were: 1) to describe theprevalence and severity of asthma, rhinitis and eczema inchildren living in different centres and to make compari-sons within and between countries; 2) to obtain baselinemeasures for assessment of future trends in the prevalenceand severity of these diseases; and 3) to provide a frame-work for further aetiological research into lifestyle, envi-
ronmental, genetic and medical care factors affectingthese diseases.
This publication describes the results of the worldwideISAAC study of the prevalence of symptoms of asthma.The prevalence of symptoms of allergic rhinoconjunctivi-tis and atopic eczema, and an overview of all three condi-tions are described in other publications [3, 4].
Materials and methods
ISAAC Phase One uses core questionnaires designed toassess the prevalence and severity of asthma and allergicdisease in defined populations. The methods are describedin the ISAAC manual and a previous paper concerningrationale and methods [2]. Each centre obtained the neces-sary approval from an ethics committee before the start ofthe study.
Collaborating centres and registration
ISAAC was open to any collaborator who agreed toadhere to the protocol. Countries in which there was littleexisting information about asthma and allergies were parti-cularly encouraged to participate. Each collaborating centrewas responsible for completing a registration document
Worldwide variations in the prevalence of asthma symptoms: the International Study ofAsthma and Allergies in Childhood (ISAAC). ISAAC Steering Committee.ABSTRACT: The International Study of Asthma and Allergies in Childhood(ISAAC) was designed to allow comparisons between populations in different coun-tries.
ISAAC Phase One, reported here, used standardized simple surveys which wereconducted among representative samples of school children from centres in mostregions of the world.
Two age groups (13–14 and 6–7 yrs) with approximately 3,000 children in eachgroup were studied in each centre. The 13–14 yr olds (n=463,801) were studied in 155centres (56 countries) and the 6–7 yr olds (n=257,800) were studied in 91 centres (38countries).
There were marked variations in the prevalence of asthma symptoms with up to15-fold differences between countries. The prevalence of wheeze in the last 12 monthsranged from 2.1–32.2% in the older age group and 4.1–32.1% in the younger agegroup and was particularly high in English speaking countries and Latin America. Avideo questionnaire completed in the older age group in 99 centres (42 countries)showed a similar pattern.
The major differences between populations found in the International Study ofAsthma and Allergies in Childhood Phase One are likely to be due to environmentalfactors. The results provide a framework for studies between populations in contrast-ing environments which are likely to yield new clues about the aetiology of asthma.Eur Respir J 1998; 12: 315–335.
*Members of the Writing Group andSteering Committee listed at end ofpaper
Correspondence: M.I. AsherDept of PaediatricsFaculty of Medicine and Health SciencesUniversity of AucklandPrivate Bag 92019AucklandNew ZealandFax: 64 9 3737486
Keywords: AllergiesasthmachildhoodISAACvideowheezing
Received: September 1 1997Accepted after revision March 25 1998

316 ISAAC STEERING COMMITTEE
and obtaining its own funding. Included in this first world-wide analysis are a total of 155 centres for the 13–14 yrold age group and 91 centres for the 6–7 yr old age group.For each centre included, the data were received and veri-fied by the ISAAC International Data Centre by June 30,1996. The data-checking processes and a detailed reporton study design and methods were completed by Novem-ber 24, 1997. The first centre began its survey in 1991, butmost centres undertook the data collection in 1994 and1995. A small number of other centres, where the ISAACquestionnaire was used, are not included in this world-wide analysis. Reasons included that the data checkingand report were not completed or because of low numberof participating children (<1,000), low response rate ofchildren within schools, or other important departuresfrom the protocol.
Sampling frame
The sampling frame was schoolchildren of two agegroups (13–14 and 6–7 yrs old) within a specified geo-graphical area (ISAAC centre), for which a detailed mapwas provided. The ISAAC centre was most commonly anurban area (a city) and therefore may not be representativeof the country. Within centres there was no attempt toselect affluent versus poor districts. A minority of ISAACcentres were regions within a country (e.g. in the UK), ora whole country (e.g. Costa Rica, Malta and Republic ofIreland). In a small number of the 246 centre/age groupsthere was further definition of the sampling frame byschool type (17%), ethnic group (1%) and language (3%).In 31% of centres some schools were excluded from thesampling frame before selection or excluded after selec-tion for a variety of reasons, including recent participationin a similar study, children with disabilities unable tocomplete the questionnaires and very small numbers ofchildren. The school selection within the sampling framewas representative of the geographical area, without sel-ection by urban or rural residence or variations in socio-economic status, and it included either all schools withchildren within the age group (26% of centres) or a ran-dom sample of such schools (74% of centres). A minority(19%) used stratification of the sample before randomselection. Among the 90 centres studying both age groupsthe strategies used for the sampling frame and selection ofsample were similar for both age groups.
Selection of subjects
Subjects aged 13–14 yrs were selected because theywere able to self-complete the written and video question-naires. The younger age group, 6–7 yrs, was chosen as thisis the youngest age when children are usually at school.The majority of centres (74%) chose the school gradewith children mostly of the desired age group, choosingone (26%), two (71%) or three or more grades (3%). Aminority of centres (24%) chose children by their actualage, regardless of the grade within the school. The age ofchildren was checked against the age calculated from thedate of birth, but where there were inconsistencies ormissing data the given age was used.
The participation rates of schools were calculated as thenumber of participating schools divided by the number ofschools approached for participation. The response rate of
children was calculated as the number of children forwhom there was a completed written questionnaire in theparticipating schools divided by the number of childrenapproached. A high response rate was sought and themajority of centres achieved >80%.
Sample size
The recommended sample size was 3,000 to ensuregood prevalence estimates for severe asthma. For a samplesize of 3,000 the 95% confidence interval (CI) around anestimate of 1% would be 0.64–1.33 and around an esti-mate of 30% would be 28.4–31.6 [5]. Centres with limitedresources or small populations were included in the preva-lence comparisons, providing that the sample size was atleast 1,000 per age group.
Phase One core questionnaire modules
The ISAAC core questionnaires have been publishedpreviously [2], and used in a pilot study [1]. Most of thequestions used for asthma symptoms are based on ques-tions used in previous respiratory epidemiological studiesand include both sensitive and specific indicators of as-thma [6]. Questions about the date of completion of thequestionnaire, child's date of birth, age and sex were alsoincluded. Some centres added questions on ethnicity andother questions (e.g. on environment) after the core ques-tions, but analyses of these are not included in this paper.
Written questionnaire. Use of written questionnaires onwheezing, allergic rhinitis and atopic eczema for the 13–14 yr old group was a requirement for participation inISAAC Phase One. Written questionnaires to parents forthe 6–7 yr old group were strongly recommended and usedin 59% of centres. The questionnaires were completed bythe children in the older age group and by the parents inthe younger age group. The severity of asthma symptomswas assessed by three questions that asked about the fol-lowing symptoms in the last 12 months: number of attacksof wheezing; sleep disturbed due to wheezing; and wheez-ing severe enough to limit speech to only one or twowords at a time between breaths.
Translation. In 81% of centres the written questionnairewas translated from English into one (88%) or more(12%) local languages. The method of translation wasstandardized according to guidelines developed in Ger-many [7] and adapted for ISAAC (ISAAC Document 41).These guidelines included the use of translators familiarwith asthma terminology (98% of centres that used trans-lations), consultation with the local community (60%) andback-translation into English by an independent translator(99%). The written questionnaires were used in 41 differ-ent languages. English was used most commonly (32% ofcentres), followed by Spanish (15%), Italian (9%), Hindi(7%), Chinese (6%), Portuguese (6%), Marathi (5%) andMalay (4%) and other languages made up the remainder.
Video questionnaire. A video using the audiovisual pres-entation of young people with clinical symptoms and signsof asthma was completed, where possible, by the 13–14 yrold group [8, 9]. After completing the written question-naire, the children themselves were shown the video and

ISAAC WORLDWIDE ASTHMA SYMPTOMS 317
answered questions at the time. The video elicited infor-mation without using written language terms to describeasthma symptoms. It was used in 99 centres with the orig-inal "European" English-language version in 33 centresand the revised "International" version in 66 centres. Bothversions show five sequences of young persons with dif-ferent manifestations of asthma. Two scenes were thesame in both versions: the first scene, of a young personwheezing while at rest, and the fourth scene, of a youngperson waking at night with coughing. The European ver-sion showed only European children and the questionswere written in English, with local verbal translation ofinstructions where appropriate. The International versionshowed scenes with children of different ethnic groups,there was no written language and the questions wereasked verbally in the local language. This version has beenvalidated in children in a Hong Kong population [10].
Data management and analysis
Information on the questionnaires was entered, by eachcollaborating centre or a national centre, on to the computerexactly as recorded by the child or parent (except for sixcentres where data was recoded to eliminate inconsistentresponses). The entry of data was checked by using dou-ble entry (68% centres) or other acceptable data-checkingmethods (24%), but 8% of centres used only single dataentry. Data were transferred to the ISAAC InternationalData Centre (Auckland) using the protocol described inthe ISAAC Coding and Data Transfer Manual.
The two age groups were analysed separately. Symp-tom prevalences in each centre were calculated by divid-ing the number of positive responses to each question bythe number of completed questionnaires for the writtenand video questionnaires separately. Thus, apparent incon-sistencies between responses to the stem and branch ques-tions were accepted and not recoded. Basic descriptivesummaries of the data were compiled by centre and coun-try, in both age groups, along with correlations betweenvariables. In centres where a random sample of schoolswas taken, the effect of cluster sampling by schools wasexamined in the correlations [11]. The effects of clustersampling were small and hence ignored, allowing the useof the more robust Spearman correlations.
The within-country and between-country varianceswere estimated using a generalized linear mixed model inwhich country, and centre within country, are randomeffects. With this model, the ratio of the 95% CI of preva-lences (between country to within country) were calcu-lated. The ratio of the proportions responding "yes" formales and females in each centre was assessed, using thesame generalized linear mixed model with the addition ofsex as a fixed effect and a sex by country term to investi-gate any interaction [12].
Quality-control measures
The Steering Committee required documentation of theprocedures for the study from each centre as a prerequisitefor inclusion in publications of ISAAC worldwide results.Centres completed a Registration Document before start-ing the study and followed the protocol described in thepublished ISAAC Manual and ISAAC Coding and Data
Transfer Manual. All data submitted to the ISAAC Inter-national Data Centre were checked. Coding errors, omis-sions and inconsistencies in the demographic informationwere corrected with the assistance of the collaborator. Afinal report on all aspects of methodology actually usedwas completed for each centre and agreed between theISAAC International Data Centre and the collaborators.This report included information about the sampling frame,sampling methods, participation rate of schools and ofchildren within schools, the data entry method and detailsof translation. Some centres departed from the protocol(see footnotes to tables) but were included in the analysisif the methodology was otherwise sound.
Results
Participants
The requirements for analysis were met by 156 colla-borating centres in 56 countries, with a total of 721,601participating children. The principal investigators of theISAAC collaborating centres are listed in the appendix. Inthe 13–14 yr age group, 155 centres from 56 countriesparticipated, with a total of 463,801 participating children.The video questionnaire was completed in 99 collabo-rating centres in 42 countries, with a total of 304,796children. For the 6–7 yr olds there were 91 collaboratingcentres in 38 countries, with a total of 257,800 participat-ing children.
Information on the study sample is published elsewhere[3, 4]. More than 85% of centres had a high rate of bothparticipation by schools and response rate by pupils; in<10% of centres there was a high rate of nonparticipa-tion by schools, but there was a good response by pupilswithin schools. Participation rates of schools in the olderage group averaged 94% (range 37–100%), and in theyounger age group averaged 97% (range 57–100%). Res-ponse rates of children within participating schools in theolder age group averaged 92% (range 67–100%) and inthe younger age group averaged 89% (range 61–100%).
The age range of children within each age group variedbecause of variations in methods of selection withinschools. In the older age group 85% of centres had morethan 70% of children aged 13 and 14 yrs. In the youngerage group 93% of centres had more than 70% of childrenaged 6 and 7 yrs. In neither age group did the variations inage affect the general pattern of results.
Written questionnaires
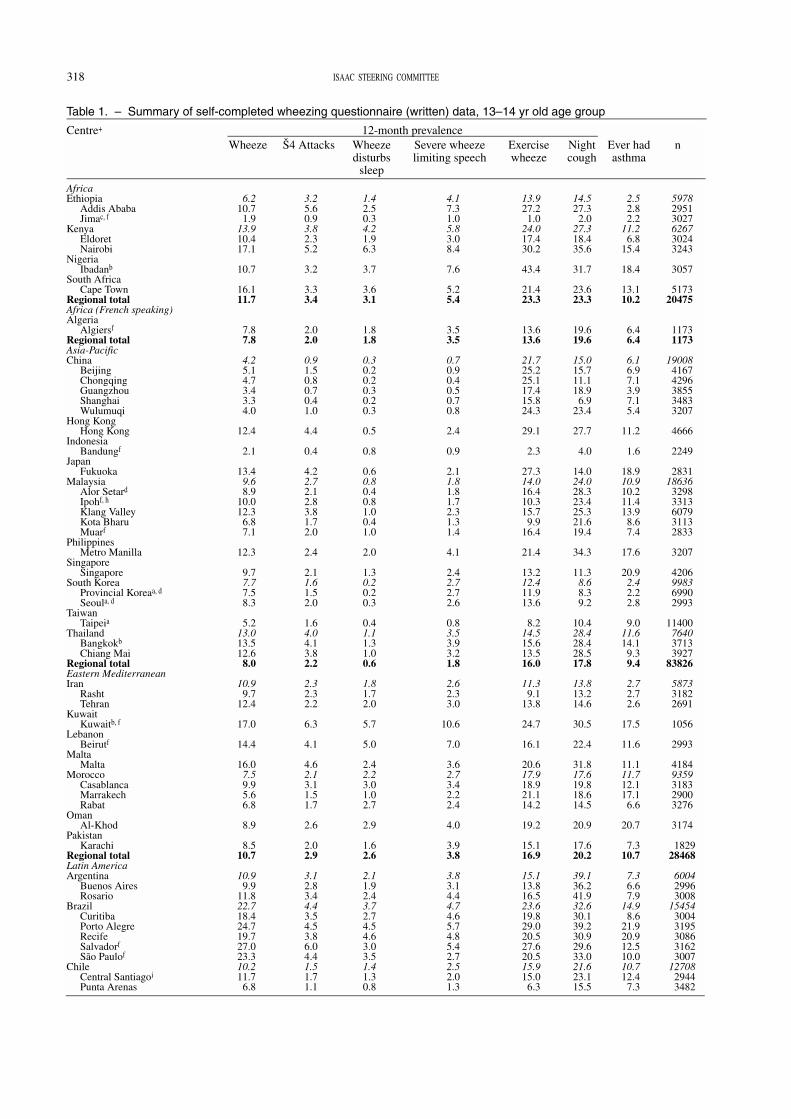
13–14 yr old group. The prevalence rates for symptoms ofasthma are presented by centre and country in table 1.Thirty countries were represented by more than one cen-tre. The geographic distribution of prevalence is illus-trated, by centre on a world map (fig. 1), for positiveanswers to the question "Have you had wheezing or whis-tling in the chest in the last 12 months?". For this questionthere was a very wide range of prevalences, up to 15-folddifferences, between countries, ranging from 2.1–4.4% inAlbania, China, Greece, Georgia, Indonesia, Romania andRussia, to 29.1–32.2% in Australia, New Zealand, Rep-ublic of Ireland and the UK. These countries also tendedto be at the extremes for the other questions. The two cent-res at the extremes, Akola ( 1.6%) and Scotland (36.7%),had
318 ISAAC STEERING COMMITTEE
Table 1. – Summary of self-completed wheezing questionnaire (written) data, 13–14 yr old age group
Centre+ 12-month prevalenceWheeze Š4 Attacks Wheeze
disturbssleep
Severe wheezelimiting speech
Exercisewheeze
Nightcough
Ever hadasthma
n
AfricaEthiopia
Addis AbabaJimac, f
KenyaEldoretNairobi
NigeriaIbadanb
South AfricaCape Town
Regional totalAfrica (French speaking)Algeria
Algiersf
Regional totalAsia-PacificChina
BeijingChongqingGuangzhouShanghaiWulumuqi
Hong KongHong Kong
IndonesiaBandungf
JapanFukuoka
MalaysiaAlor Setard
Ipohf, h
Klang ValleyKota BharuMuarf
PhilippinesMetro Manilla
SingaporeSingapore
South KoreaProvincial Koreaa, d
Seoula, d
TaiwanTaipeia
ThailandBangkokb
Chiang MaiRegional totalEastern MediterraneanIran
RashtTehran
KuwaitKuwaitb, f
LebanonBeirutf
MaltaMalta
MoroccoCasablancaMarrakechRabat
OmanAl-Khod
PakistanKarachi
Regional totalLatin AmericaArgentina
Buenos AiresRosario
BrazilCuritibaPorto AlegreRecifeSalvadorf
São Paulof
ChileCentral Santiagoi
Punta Arenas
6.210.7
1.913.910.417.1
10.7
16.111.7
7.87.8
4.25.14.73.43.34.0
12.4
2.1
13.49.68.9
10.012.3
6.87.1
12.3
9.77.77.58.3
5.213.013.512.6
8.0
10.99.7
12.4
17.0
14.4
16.07.59.95.66.8
8.9
8.510.7
10.99.9
11.822.718.424.719.727.023.310.211.7
6.8
3.25.60.93.82.35.2
3.2
3.33.4
2.02.0
0.91.50.80.70.41.0
4.4
0.4
4.22.72.12.83.81.72.0
2.4
2.11.61.52.0
1.64.04.13.82.2
2.32.32.2
6.3
4.1
4.62.13.11.51.7
2.6
2.02.9
3.12.83.44.43.54.53.86.04.41.51.71.1
1.42.50.34.21.96.3
3.7
3.63.1
1.81.8
0.30.20.20.30.20.3
0.5
0.8
0.60.80.40.81.00.41.0
2.0
1.30.20.20.3
0.41.11.31.00.6
1.81.72.0
5.7
5.0
2.42.23.01.02.7
2.9
1.62.6
2.11.92.43.72.74.54.63.03.51.41.30.8
4.17.31.05.83.08.4
7.6
5.25.4
3.53.5
0.70.90.40.50.70.8
2.4
0.9
2.11.81.81.72.31.31.4
4.1
2.42.72.72.6
0.83.53.93.21.8
2.62.33.0
10.6
7.0
3.62.73.42.22.4
4.0
3.93.8
3.83.14.44.74.65.74.85.42.72.52.01.3
13.927.21.0
24.017.430.2
43.4
21.423.3
13.613.6
21.725.225.117.415.824.3
29.1
2.3
27.314.016.410.315.79.9
16.4
21.4
13.212.411.913.6
8.214.515.613.516.0
11.39.1
13.8
24.7
16.1
20.617.918.921.114.2
19.2
15.116.9
15.113.816.523.619.829.020.527.620.515.915.06.3
14.527.3
2.027.318.435.6
31.7
23.623.3
19.619.6
15.015.711.118.9
6.923.4
27.7
4.0
14.024.028.323.425.321.619.4
34.3
11.38.68.39.2
10.428.428.428.517.8
13.813.214.6
30.5
22.4
31.817.619.818.614.5
20.9
17.620.2
39.136.241.932.630.139.230.929.633.021.623.115.5
2.52.82.2
11.26.8
15.4
18.4
13.110.2
6.46.4
6.16.97.13.97.15.4
11.2
1.6
18.910.910.211.413.9
8.67.4
17.6
20.92.42.22.8
9.011.614.1
9.39.4
2.72.72.6
17.5
11.6
11.111.712.117.1
6.6
20.7
7.310.7
7.36.67.9
14.98.6
21.920.912.510.010.712.4
7.3
597829513027626730243243
3057
517320475
11731173
1900841674296385534833207
4666
2249
283118636
32983313607931132833
3207
4206998369902993
11400764037133927
83826
587331822691
1056
2993
41849359318329003276
3174
182928468
600429963008
1545430043195308631623007
1270829443482

ISAAC WORLDWIDE ASTHMA SYMPTOMS 319
Table 1. – continued.
Centre+ 12-month prevalenceWheeze Š4 Attacks Wheeze
disturbssleep
Severe wheezelimiting speech
Exercisewheeze
Nightcough
Ever hadasthma
n
South SantiagoValdivia
Costa RicaCosta Rica
MexicoCuernavacaj
PanamaDavid-Panamáf
ParaguayAsunción
PeruLima
UruguayMontevideof
Regional totalNorth AmericaCanada
Hamiltonb
Saskatoonb
USAChicago (3)a, g, h
Chicago (4)g
Seattlea, h
Regional totalNorthern and Eastern EuropeAlbania
TiranëEstonia
NarvaTallinn
FinlandHelsinkiKuopio CountyLapland AreaTurku and Pori County
GeorgiaKutaisiTbilisi
LatviaRigaRural Latvia
PolandKrakow (1993)Krakow (1995)Poznan
RomaniaCluj
RussiaMoscow
SwedenLinköpingStockholm/Uppsalae
UzbekistanSamarkandf
Tashkentf
Regional totalOceaniaAustralia
AdelaideMelbournePerthh
SydneyNew Zealand
AucklandBay of PlentyChristchurchHawke's BayNelsonWellington
Regional totalSouth-east AsiaIndia
AkolaBombay (16)Bombay (17)h
Bombay (18)BorivaliChandigarhJodhpurKottayam
11.111.5
23.7
6.6
17.6
19.4
26.0
19.016.9
28.130.624.021.724.619.822.924.2
2.610.816.7
8.516.019.813.116.115.0
3.63.63.78.48.38.68.18.87.57.9
3.0
4.412.911.214.8
9.214.4
6.09.2
29.433.527.331.424.730.226.529.529.632.430.931.629.9
6.01.61.9
10.63.63.44.2
10.717.8
1.22.1
5.3
1.5
3.4
3.4
4.8
5.43.4
9.110.07.76.58.85.66.77.6
0.31.72.01.53.55.12.83.32.90.70.70.81.21.11.41.92.11.91.7
0.7
0.73.93.54.50.71.10.51.9
10.012.89.99.67.59.98.09.09.7
11.010.211.1
9.9
1.60.51.21.81.00.61.53.51.7
2.21.2
3.5
1.6
2.0
3.0
3.3
2.62.6
2.12.22.04.23.05.92.43.4
0.31.12.20.70.50.80.60.20.50.70.50.80.90.71.20.90.70.91.0
0.4
0.10.80.70.90.20.30.10.6
3.03.33.32.33.13.22.73.32.94.62.63.03.1
1.10.50.81.30.80.40.71.71.8
4.92.2
10.1
2.4
6.7
5.2
6.9
5.14.5
8.18.96.7
10.05.5
13.37.49.2
0.82.14.01.33.15.12.02.72.70.80.71.01.61.41.81.71.91.81.5
0.7
0.82.01.72.32.13.81.11.8
8.38.78.28.77.38.08.17.17.58.68.28.38.1
3.01.01.03.21.41.62.74.8
13.5
25.318.0
24.2
4.0
14.6
15.3
35.9
18.419.1
34.336.530.828.727.429.528.230.9
4.512.621.2
9.120.625.117.620.619.2
6.48.24.7
10.78.6
12.89.39.79.98.3
6.9
6.619.317.421.411.115.1
8.712.3
37.041.435.738.931.040.336.139.440.342.443.341.139.0
9.52.72.6
11.17.45.38.0
15.917.9
32.816.2
31.1
13.6
21.7
31.3
33.6
28.128.6
36.337.534.431.929.435.527.633.7
5.715.618.614.416.519.514.515.616.37.89.06.6
14.812.317.314.815.916.112.6
4.4
5.612.010.214.09.7
15.86.1
12.2
28.327.827.728.629.030.029.731.327.433.226.330.329.3
14.13.86.5
22.414.910.2
8.018.432.2
11.511.9
18.5
5.5
16.9
12.2
28.0
15.313.4
16.519.212.216.517.816.116.416.5
1.63.02.53.36.67.44.66.67.83.13.82.44.33.94.62.42.92.32.0
3.7
2.410.410.010.8
1.72.31.44.4
28.230.426.630.224.824.422.922.325.925.720.226.325.9
4.52.63.66.55.25.93.36.4
12.4
30513231
3200
3102
2885
2966
3158
307252549
4952305119017508142237562330
12460
2957498414243560
118952855287830773085674632973449614930043145
10167375027863631
3396
3411645233773075466217582904
60819
122783030275936502839
19023320628133191355018394424
31301
3717121384225222631783878313910942047

320 ISAAC STEERING COMMITTEE
Table 1. – continued.
Centre+ 12-month prevalence
Wheeze Š4 Attacks Wheezedisturbs
sleep
Severe wheezelimiting speech
Exercisewheeze
Nightcough
Ever hadasthma
n
Madras (2)Madras (3)h
New Delhi NeyveliOrissaPune
Regional totalWestern EuropeAustria
SalzburgUrfahr-Umgebung
BelgiumAntwerp
FranceMarseillesMontpellierPessaca,b
StrasbourgWest Marne
GermanyGreifswaldMünster
GreeceAthens
ItalyAscoli PicenoCosenzaCremonaEmilia-RomagnaEmpoliFirenzeFrosinoneh
MilanoRomaSienaTorinoTrentod
VeronaPortugal
FunchalLisbonPortimaoh
PortoRepublic of Ireland
Republic of IrelandSpain
BarcelonaBilbaoCartagenaCastellónCádizPamplonaValenciaValladolidf
UKAnglia and Oxfordh
GuernseyIsle of ManJerseyNorth East and YorkshireNorth Thamesh
North WestScotlandSouth Thamesh
South and Westh
SunderlandSurrey/SussexTrenth
Walesh
West Midlandsh
Regional totalGlobal total
8.46.0
13.06.03.81.86.0
11.611.511.7
12.013.514.918.212.810.213.313.813.314.1
3.78.92.77.19.2
10.413.510.5
7.410.6
9.813.0
8.65.97.59.5
10.611.1
8.17.4
29.110.314.311.910.5
7.115.4
5.511.0
6.132.234.335.033.435.234.130.530.036.731.335.319.926.833.633.630.016.713.8
1.93.33.01.90.80.81.6
2.52.33.0
3.54.14.06.63.92.64.23.43.03.7
0.72.00.71.41.72.62.32.61.72.32.03.02.31.32.02.42.72.82.01.7
8.12.73.44.23.41.83.21.72.61.59.3
10.29.69.1
10.79.37.49.0
11.69.7
10.96.28.68.89.08.04.63.7
1.52.01.91.00.80.71.1
0.80.80.9
1.51.11.21.91.00.61.41.21.11.3
0.70.60.40.00.70.60.80.90.60.70.41.20.60.30.41.41.81.31.41.0
2.61.11.41.51.80.51.90.51.10.53.52.94.03.42.74.33.33.54.73.43.12.42.33.63.73.71.71.7
2.93.64.82.52.11.33.0
3.63.05.0
2.62.82.84.21.82.42.95.75.16.1
0.72.00.82.31.62.02.52.62.32.52.63.02.91.31.32.22.72.41.91.6
6.02.42.73.02.91.14.21.12.81.48.59.08.68.58.58.77.77.9
10.08.89.65.06.98.29.08.54.23.8
7.77.4
18.423.26.84.09.5
18.017.519.0
13.120.822.825.419.317.920.122.023.021.2
3.614.55.5
14.813.217.117.615.715.718.014.420.818.8
9.412.013.916.614.114.810.5
25.216.118.319.814.912.820.212.217.213.129.130.331.730.730.728.725.926.131.426.830.924.238.627.829.725.120.018.8
14.611.525.816.913.5
9.414.1
13.313.313.3
21.226.526.929.824.326.225.420.821.520.2
6.721.2
9.822.419.721.528.621.319.027.323.026.423.317.615.917.019.817.518.113.1
33.922.420.525.620.422.328.017.621.222.942.343.344.941.545.147.147.146.142.345.543.121.026.645.643.646.827.122.3
2.81.85.32.42.84.94.5
6.06.35.3
8.112.614.414.215.010.110.7
5.74.27.0
4.59.97.78.18.1
10.212.0
9.611.310.711.311.0
9.47.5
11.812.113.112.310.311.3
15.210.511.116.310.5
7.811.2
8.712.1
6.320.722.821.418.818.820.318.219.821.420.520.822.219.022.321.820.713.011.3
190330863026328112482702
37171
488633711515
151518544
34943384330254032961717231694003
256126477
1130106812013961104611711147337333231181124244262208
107513532303010583131
31472502130313212301730943270304031793178
35485232411701467113537092220302944442297270720922114220723512219
135559463801
All data are presented as percentages of the study children. a: data recoded to eliminate inconsistent responses; b: response rate <80%;c: no age or date of birth on questionnaire; d: no age on questionnaire; e: no date of interview or date of birth on questionnaire; f: singledata entry; g: no eczema questionnaire; h: <10 schools if Š10 schools in sampling frame; i: no sex information provided; j: 90% children11–12 yrs old. +: numbers in parenthesis indicate International Study of Asthma and Allergies in Childhood (ISAAC) registrationnumber for that centre, as given by the national coordinator.

ISAAC WORLDWIDE ASTHMA SYMPTOMS 321
over 20-fold differences. Other countries that had a preva-lence of 12 month wheeze under 10% were found mainlyin Asia, Northern Africa, Eastern Europe and the EasternMediterranean regions and those over 20% were foundmainly in North America, Latin America and Oceania.
The between-country variation (56 countries) was great-er than the within-country variation (30 countries withmore than one centre) for all questions: 12 month wheezewas 1.7 times larger; four or more attacks of wheezing inthe last 12 months 2.8; waking on one or more nights aweek 2.8; wheezing severe enough to limit speech to onlyone or two words at a time between breaths 1.9; wheezewith exercise 1.3; dry cough at night 1.5; and reportedasthma ever 3.7 times larger.
The ranking of countries for sleep disturbance due towheezing on Š1 night week-1 in the last 12 months is illus-trated in figure 2. The seven countries with the highestprevalence of positive answers to this question were Bra-zil, Kenya, Kuwait, Lebanon, Nigeria, South Africa andthe USA, which were not the countries ranking highest forthe prevalence of 12 month wheeze. The seven countrieswith the lowest prevalence of positive answers to thisquestion were Albania, China, Romania, Russia, SouthKorea, Taiwan and Uzbekistan, which were similar to thecentres ranking lowest for the prevalence of 12 monthwheeze. A similar ranking of highest centres was foundfor wheezing severe enough to limit speech to only one ortwo words at a time between breaths, but for Š4 attacks ofwheezing the ranking of highest centres was similar to 12month wheeze.
Correlations between prevalence and severity were alsoexamined. However, because the severity questions are
not independent of the 12 month wheeze question the cor-relations were assessed between the proportion of thepopulation wheezing in the last 12 months and the propor-tion of the population of wheezers in that centre answer-ing positively to questions on severity in the last 12 months.The correlations examining relative severity were: four ormore attacks of wheezing (r=0.25, p=0.0016); sleep dis-turbance due to wheezing on one or more nights per week(r= -0.097, p=0.23); and wheezing severe enough to limitspeech to only one or two words at a time between breaths(r=0.012, p=0.89), indicating that the proportion of wheez-ers with severe symptoms changed little with increasingprevalence of wheeze.
Every country had some children who reported having"asthma" at some time in their lives, but the range in prev-alence was very large, ranging from 1.6–3.0% in Albania,Estonia, Ethiopia, Indonesia, Iran, Poland, Russia, SouthKorea and Uzbekistan to 20.7–28.2% in Australia, NewZealand, Oman, Peru, Singapore and the UK. The correla-tion between the proportion of the population wheezing inthe last 12 months and the proportion of the populationreporting "asthma ever" was r=0.76 (p<0.0001). In somecountries the reporting of 12 month wheeze was muchhigher than the reporting of "asthma ever" (e.g. Ethiopia6.2%, 2.5%; Iran 10.9%, 2.7%; Brazil 22.7%, 14.9%;Canada 28.1%, 16.5%; Germany 13.8%, 5.7%; "wheeze","asthma", respectively), whereas in other countries therewas much more "asthma" than "wheeze" (e.g. China 4.2%,6.1%; Nigeria 10.7%, 18.4%; Japan 13.4%, 18.9%; Singa-pore 9.7%, 20.9%; "wheeze", "asthma", respectively).
Exercise wheeze in the last 12 months was reportedmore frequently than wheeze in the last 12 months in all
Fig. 1. – World map for the 13–14 yr old age group, showing the percentage of children who answered "yes" to the written question"Have you had wheezing or whistling in the chest in the last 12 months?". Each point represents the prevalence for one collaboratingcentre, with distinct colour symbols used for different prevalence ranges.

322 ISAAC STEERING COMMITTEE
countries except for Greece, Mexico, Panama, Paraguay,Republic of Ireland, the UK and Uruguay, with a correla-tion of r=0.83 (p<0.0001) between these variables. Theproportion of children reporting wheezing with exercise inthe last 12 months ranged from 2.3% in Indonesia to43.4% in Nigeria.
Dry night cough in the last 12 months was reportedmore frequently than 12 month wheeze in all countriesexcept for Australia, New Zealand and Sweden, with acorrelation of r=0.81 (p<0.0001) between these variables.The proportion of children reporting dry night cough inthe last 12 months ranged from 4.0% in Indonesia to42.3% in the UK.
The proportion of females and males studied variedamong the centres, from 34.1 to 69.9% males. The pattern
of responses to questions between sexes was not consist-ent. On average females showed a higher prevalence thanmales for all questions except for reported "asthma ever",where males were higher than females. However, therewas a significant interaction with country (p<0.0001),with many countries having a greater proportion of posi-tive responses in males than in females.
6–7 yr old group. The prevalence rates for asthma symp-toms are presented by centre and country in table 2. Eight-een countries were represented by more than one centre.The geographic distribution of prevalence is illustrated,by centre on a world map (fig. 3), for positive answers tothe question "Has your child had wheezing or whistlingin the chest in the last 12 months?". There was more than
◆◆
KuwaitLebanon
USAKenyaBrazil
NigeriaSouth Africa
UKCosta Rica
PeruNew Zealand
ParaguayAustralia
OmanUruguay
Rep. of IrelandMalta
MoroccoArgentina
CanadaPanamá
PhilippinesIran
AlgeriaMexico
PakistanBelgiumEthiopiaPortugal
ChileSingaporeGermany
FranceEstonia
SpainThailand
IndiaLatvia
PolandSwedenAustria
MalaysiaIndonesia
GreeceGeorgia
JapanItaly
FinlandHong Kong
RomaniaTaiwanAlbania
ChinaSouth Korea
UzbekistanRussia
Cou
ntry
a)
0
◆
◆
◆◆◆
◆◆◆
◆
◆◆
◆
◆
◆ ◆◆
◆◆
◆◆
◆◆◆
◆ ◆
◆◆◆◆◆◆◆◆◆◆
◆◆
◆ ◆ ◆ ◆
◆
◆
◆
◆◆◆◆
◆◆
◆
◆◆ ◆◆
◆◆◆◆
◆
◆
◆
◆
◆
◆◆
◆
◆
◆◆
◆ ◆
◆ ◆ ◆
◆
◆
◆
◆
◆ ◆◆
◆
◆◆◆◆◆
◆
◆
◆
◆◆◆◆◆◆◆◆ ◆◆◆◆◆
◆
◆
◆◆◆◆◆
◆
◆ ◆
◆
◆
◆
◆
Brazil
UK
Costa Rica
Chile
Oman
New Zealand
Argentina
Portugal
Panamá
Uruguay
Australia
Canada
Singapore
Germany
Mexico
Poland
Malta
Philippines
Belgium
Albania
Japan
India
Greece
Austria
Georgia
Latvia
Iran
Sweden
Taiwan
Thailand
Spain
Estonia
Indonesia
France
Italy
Malaysia
South Korea
Hong Kong
Cou
ntry
b)
1 2 3 4 5 6 7 8 9 10Wheeze disturbs sleep %
◆
◆◆
◆◆
◆
◆
◆
◆
◆◆
◆
◆
1 2 3 4 5 6 7 8 9 10Wheeze disturbs sleep %
◆
0
◆
◆◆◆◆
◆
◆
◆◆◆◆◆
◆
◆
◆◆◆◆◆
◆◆
◆
◆
◆
◆
◆
◆ ◆
◆
◆
◆
◆
◆◆◆◆◆◆◆◆
◆
◆
◆
◆
◆
◆◆
◆ ◆
◆
◆ ◆
◆
◆ ◆ ◆ ◆
◆
◆◆
◆ ◆
◆
◆◆ ◆◆◆
◆
◆◆ ◆ ◆
◆
◆
◆◆ ◆
◆ ◆
Fig. 2. – Ranking of participating countries for the percentage who answered positively to the question "In the last 12 months, how often, on average,has your (child's) sleep been disturbed due to wheezing?: one or more nights per week" for: a) the 13–14 yr olds; and b) the 6–7 yr olds.

ISAAC WORLDWIDE ASTHMA SYMPTOMS 323
Table 2. – Summary of parent-completed wheezing questionnaire (written) data, 6–7 yr-old age group
Centre+ 12-month prevalence
Wheeze Š4 Attacks Wheezedisturbs
sleep
Severe wheezelimiting speech
Exercisewheeze
Nightcough
Ever hadasthma
n
Asia-PacificHong Kong
Hong KongIndonesia
Bandunge, g
JapanFukuoka
MalaysiaAlor SetarIpohe
Klang ValleyKota BharuMuare
PhilippinesMetro Manilla
SingaporeSingapore
South KoreaProvincial Koreaa
Seoula
TaiwanTaipeia
ThailandBangkokChiang Mai
Regional totalEastern MediterraneanIran
RashtTehran
MaltaMalta
OmanAl-Khod
Regional totalLatin AmericaArgentina
Buenos AiresRosario
BrazilPorto AlegreRecifef
São Pauloe
ChileCentral SantiagoPunta ArenasSouth SantiagoValdivia
Costa RicaCosta Rica
MexicoCuernavaca
PanamaDavid-Panamáe
UruguayMontevideob, e
Regional totalNorth AmericaCanada
HamiltonSaskatoon
Regional totalNorthern and Eastern EuropeAlbania
TiranëEstonia
TallinnGeorgia
KutaisiTbilisi
LatviaRiga
PolandKrakow (1995)Poznan
9.1
4.1
17.36.16.26.37.85.64.5
11.3
15.713.312.415.1
9.68.2
11.05.59.6
5.45.35.5
8.8
7.16.8
16.415.417.323.323.527.221.317.916.517.116.920.5
32.1
8.6
23.5
18.019.6
17.620.114.117.6
7.6
9.37.69.35.9
7.310.914.3
8.1
2.3
0.8
5.41.41.61.22.11.11.2
1.4
3.51.71.91.5
2.92.43.41.52.2
1.01.01.0
1.7
2.51.7
3.83.24.45.35.08.34.12.91.62.12.64.5
7.3
1.3
4.1
4.64.0
5.56.24.55.5
1.0
1.51.52.01.0
1.33.03.82.3
0.3
0.7
1.20.50.80.30.60.40.4
1.4
1.80.50.50.5
0.80.80.90.70.7
0.91.00.8
1.5
3.51.8
3.42.93.85.85.8
10.03.83.52.42.53.84.7
4.9
1.6
3.3
3.03.8
2.22.51.72.2
1.3
0.71.01.30.7
1.01.52.21.0
1.1
0.8
1.81.11.41.01.41.00.8
2.4
1.92.02.02.0
1.21.31.70.91.5
0.91.10.8
1.2
3.21.7
4.33.25.44.44.09.62.33.01.92.63.63.3
11.3
2.8
6.2
3.34.5
3.03.32.63.0
2.4
0.71.31.51.1
0.92.12.41.7
6.9
3.1
5.34.34.74.64.94.03.6
6.7
8.24.44.54.1
6.03.95.12.85.0
1.81.81.7
4.1
6.94.0
6.24.97.57.56.9
13.05.5
11.08.0
10.19.3
15.2
16.1
4.0
12.3
7.09.1
9.610.78.19.6
4.8
1.63.34.52.1
2.23.84.92.9
21.7
9.1
9.516.215.812.617.921.011.7
30.6
15.017.417.417.3
17.018.422.814.217.6
5.95.76.0
19.1
19.613.6
39.537.541.534.233.834.834.225.723.729.524.024.7
38.3
19.9
29.3
26.430.6
25.127.721.525.1
9.3
11.77.08.75.4
7.818.525.113.0
7.7
6.6
18.210.413.410.311.110.46.4
16.4
18.58.58.39.0
12.76.79.34.2
10.7
3.04.11.7
7.5
10.56.5
5.34.16.5
13.116.820.46.1
12.19.7
10.410.516.5
26.9
5.1
19.3
12.012.4
14.717.211.214.7
3.1
1.43.14.51.8
1.62.54.11.3
3618
1390
290015285
29782506310938192873
3558
2353810955272582
4806745736293828
49476
546930132456
3493
389112853
6012300530077261284614103005
108381458306031823138
2942
3097
3043
307136264
5755333724185755
2981
3070677033563414
3003497422642710

324 ISAAC STEERING COMMITTEE
Table 2. – continued.
Centre+ 12-month prevalence
Wheeze Š4 Attacks Wheezedisturbs
sleep
Severe wheezelimiting speech
Exercisewheeze
Nightcough
Ever hadasthma
n
SwedenStockholm/Uppsala
Regional totalOceaniaAustralia
AdelaideMelbournePerthSydney
New ZealandAucklandBay of PlentyChristchurchHawke's BayNelsonWellington
Regional totalSouth-east AsiaIndia
AkolaBombay (16)Bombay (17)c
Bombay (18)BorivaliChandigarhJodhpurKottayamMadras (2)Madras (3)New Delhi NeyveliOrissaPune
Regional totalWestern EuropeAustria
SalzburgUrfahr-Umgebung
BelgiumAntwerp
FrancePessaca
GermanyGreifswaldMünster
GreeceAthens
ItalyCremonaEmilia-RomagnaEmpoliFirenzeMilanoRomaTorinoVeronaViterbod
PortugalFunchalLisbonPortimao
SpainBilbaoCartagenab
CastellónPamplonaValencia
UKSunderland
Regional totalGlobal total
10.48.8
24.626.227.222.022.324.522.524.027.227.018.725.124.6
5.60.83.85.41.85.25.43.5
24.67.28.56.91.54.12.35.6
8.99.77.7
7.3
8.18.57.29.6
7.67.35.77.48.79.97.07.26.47.46.7
13.214.713.111.0
6.28.08.44.73.56.2
18.48.1
11.8
3.32.0
8.79.29.19.07.59.07.98.2
10.29.97.19.88.9
1.50.61.31.00.72.01.91.34.72.12.41.40.11.41.01.5
1.61.81.2
2.0
2.61.91.42.2
1.41.40.81.40.81.91.51.51.21.71.53.85.23.52.11.42.11.60.90.71.5
6.81.93.1
0.91.1
2.83.62.53.02.13.53.73.63.93.72.23.33.2
1.20.31.01.00.61.41.81.03.90.91.40.70.31.10.81.2
1.01.20.6
1.3
0.71.71.22.1
1.10.60.70.70.51.10.60.50.50.40.23.45.02.91.80.81.01.40.80.30.4
5.61.21.8
1.51.5
3.94.44.24.42.65.15.34.85.05.64.64.74.6
1.90.61.61.30.71.72.81.47.51.42.51.60.32.21.31.9
2.02.51.1
1.2
0.72.01.82.1
0.71.10.61.10.81.31.31.11.41.11.04.57.23.13.11.01.31.50.80.41.0
3.41.52.4
6.23.6
14.815.515.815.312.516.514.815.919.217.713.216.915.9
3.61.03.04.31.83.13.82.9
13.32.53.84.11.43.82.53.6
5.35.74.6
3.6
3.35.13.86.0
2.41.81.01.51.02.52.21.81.43.21.57.9
11.46.74.62.94.73.12.11.52.9
13.53.76.2
14.611.4
29.830.432.229.726.729.227.528.932.230.721.131.129.4
12.33.3
12.616.1
8.312.310.713.627.016.415.414.6
8.18.79.5
12.3
14.216.410.4
14.8
16.411.1
8.013.5
12.817.912.916.119.219.822.618.217.716.116.028.334.926.322.012.215.916.0
8.59.7
11.5
28.116.119.1
8.03.2
27.127.528.628.424.426.523.825.728.428.317.630.826.8
3.71.33.82.92.33.42.84.1
14.41.42.23.71.03.84.23.7
3.94.23.3
4.2
9.33.62.94.1
5.48.64.66.97.88.89.1
10.37.6
11.78.4
11.017.58.36.26.2
10.16.24.34.36.2
22.97.2
10.2
302923827
108993063284021922804
18569352626813318333818683838
29468
3169720303967114835681672289111042156146624912938149815203248
31697
578736582129
6533
3202659228533739
1654208151392447214341138361640271429207612315129179721431189
1688430193335359429963940
186468460
257800
All data are presented as percentages of the study children. a: data re-coded to eliminate inconsistent responses; b: response rate <70%; c: <10schools if Š10 schools in sampling frame; d: 13–14 yr age group not included in this paper; e: single data entry; f: no date of interview or dateof birth on questionnaire; g: no eczema questionnaire. +: numbers in brackets indicate International Study of Asthma and Allergies in Child-hood (ISAAC) registration number for that centre, as given by the national coordinator.

ISAAC WORLDWIDE ASTHMA SYMPTOMS 325
a fivefold difference in prevalence between countries(4.1–32.1%), with lowest rates in India, Indonesia, Iranand Malaysia and highest rates in Australia, Brazil, CostaRica, New Zealand and Panama. Some centres in coun-tries with extreme values in the older age group did notprovide data for the younger age group.
The between-country variation (38 countries) was great-er than the within-country variation (18 countries with >1centre) for all questions: 12 month wheeze was 1.1 timeslarger; four or more attacks of wheezing in the last 12months 1.8; waking one or more nights a week 2.0;wheezing severe enough to limit speech to only one ortwo words at a time between breaths l.5; wheeze withexercise 1.7; dry cough at night 1.6, and reported asthmaever 2.0 times larger.
Both age groups were studied in 90 centres and the cor-relations between the two age groups for the differentsymptoms ranged from r=0.61 to r=0.89. The question ab-out wheezing in the last 12 months is illustrated in figure 4(r=0.71, p<0.0001), with 57 centres having a lower preva-lence in the younger age group and 33 centres having ahigher prevalence in the younger age group. The 6–7 yrage group also had lower prevalences than the 13–14 yrage group for all the other symptoms except for any sleepdisturbance due to wheezing.
The ranking of countries for sleep disturbance due towheezing on one or more nights per week is illustrated infigure 2. The countries with the highest prevalence of pos-itive answers to this question were Brazil, Costa Rica andthe UK, and the lowest were Hong Kong, Malaysia andSouth Korea. A similar pattern was found for wheezingsevere enough to limit speech to only one or two words at
a time between breaths, but for Š4 attacks of wheezing thepattern was similar to 12 month wheeze.
Correlations done between these variables, examiningrelative severity (as described above for the 13–14 yr agegroup), were similar to the older age group: four or moreattacks of wheezing (r=0.12, p=0.25); sleep disturbancedue to wheezing on one or more nights per week (r= -0.04,p=0.74); and wheezing severe enough to limit speech toonly one or two words at a time between breaths (r= -0.13,p=0.21), indicating that the proportion of wheezy children
Fig. 3. – World map for the 6–7 yr old age group, showing the percentage of parents who answered "yes" to the written question"Has your child had wheezing or whistling in the chest in the last 12 months?". Each point represents the prevalence for one collabo-rating centre, with distinct colour symbols used for different prevalence ranges.
●
35
30
25
20
15
10
5
00
Whe
ezin
g, 6
–7 y
r old
s %
5 201510 25 30 35Wheezing, 13–14 yr olds %
●●
●
●
●●
●
●●●
●
●●
●●●
●●●
●
●●
●
●●●●
●
●●●
● ●●●
●
●
●
●●●●●
●●●●
●●
●●
●●●●●●
●●●●●● ●●●
●
●
●●●
●●●
●●
●
●
●●
●●●
●
●
●●
Fig. 4. – Scatter plots for centres for the percentage of children who havehad "wheezing or whistling in the chest in the last 12 months". The x-axisshows self-reported wheezing in 13–14 yr olds and the y-axis wheezingreported by parents in 6–7 yr olds. The line of identity is shown.

326 ISAAC STEERING COMMITTEE
with severe asthma symptoms changed little with increas-ing prevalence of wheeze.
Some parents from all countries reported "asthma ever"in their children, but the range in prevalence was verylarge, ranging from 1.4–4.2% in Albania, Austria, Bel-gium, Estonia, Germany, India, Iran, Latvia, Poland andGeorgia to 26.5–27.1% in Australia, Costa Rica and NewZealand. The correlation between the proportion of thepopulation wheezing in the last 12 months and the propor-tion of the population reporting "asthma ever" was r=0.73(p<0.0001). In some countries the reporting of 12 monthwheeze was much higher than the reporting of "asthmaever" (e.g. Brazil 23.3%, 13.1%; Estonia 9.3%, 1.4%; Iran5.4%, 3.0%; "wheeze", "asthma", respectively), whereasin other countries there was more "asthma ever" than 12month wheeze (e.g. Philippines 11.3%, 16.4%; Oman7.1%, 10.5%; "wheeze", "asthma", respectively).
Exercise wheeze in the last 12 months was reported lessfrequently than 12 month wheeze in all countries, with acorrelation of r=0.84 (p<0.0001) between these variables.The proportion of reported wheezing with exercise in thelast 12 months ranged from 1.6% in Estonia to 16.5% inNew Zealand. In contrast to the lower rates of exercisewheeze in this age group, dry night cough in the last 12months was reported more frequently than 12 month
wheeze in all countries except for Japan, Singapore andGeorgia, with a correlation of r=0.82 (p<0.0001) betweenthese variables. The proportion of parents of childrenreporting dry night cough in the last 12 months rangedfrom 5.9% in Iran to 39.5% in Argentina.
The proportion of females and males studied variedamong the centres, from 40.0 to 58.6% males, and a clearpattern emerged. Males showed a significantly higherprevalence than females in this age group (p<0.001) for 12month wheezing (1:0.81), four or more attacks of wheez-ing per week (1:0.76), waking on one or more nights aweek (1:0.92), wheezing severe enough to limit speech toonly one or two words at a time between breaths (1:0.78),wheeze with exercise (1:0.79) and dry cough at night (1:0.92). There was no significant interaction with country.
Video questionnaire
Ninety-nine centres in 42 countries undertook the videoquestionnaire. The prevalence rates for video symptoms ofasthma are presented by centre and country in table 3. Thegeographic distribution is illustrated, by centre on a worldmap (fig. 5), for positive answers to the scene of wheezing
Table 3. – Summary of self-completed wheezing questionnaire (video) data, 13–14 yr-old age group
Centre Video Prevalence in the last year nWheeze Exercise
wheezeNight
wheezeNightcough
Severewheeze
AfricaKenya
EldoretNairobi
South AfricaCape Town
Regional totalAsia-PacificChina
BeijingChongqingGuangzhouShanghaiWulumuqi
Hong KongHong Kong
IndonesiaBandung
JapanFukuoka
MalaysiaAlor SetarIpohKlang ValleyKota Bharu
PhilippinesMetro Manilla
SingaporeSingapore
South KoreaProvincial Korea*Seoul*
TaiwanTaipei*
ThailandBangkokChiang Mai
Regional totalEastern MediterraneanIran
RashtKuwait
KuwaitLebanon
Beirut
II
I
IIIII
I
I
I
IIII
I
I
II
I
II
I
E
I
11.43.5
18.7
6.59.2
2.03.31.32.01.61.8
10.1
1.3
10.25.95.36.56.93.9
9.6
9.93.73.15.2
4.66.98.06.05.3
3.1
13.3
4.9
15.05.0
24.3
11.513.4
5.14.75.26.93.55.4
15.3
2.8
16.59.28.6
10.89.77.0
12.6
8.16.76.08.2
6.010.112.77.78.3
6.1
14.6
8.4
6.71.4
11.7
3.95.4
0.60.60.40.70.90.4
3.8
0.6
3.72.52.13.22.71.8
3.9
3.20.50.50.7
1.82.12.71.71.8
1.1
9.4
3.6
16.20.0
31.2
11.614.1
4.96.83.35.41.87.4
24.6
1.8
7.28.48.69.99.05.2
14.6
9.04.03.35.8
3.412.314.410.28.1
6.0
9.7
7.4
7.51.4
13.1
5.06.3
1.21.40.81.11.11.6
6.9
0.8
5.33.62.75.83.72.2
4.9
5.01.91.62.6
2.83.84.63.13.1
2.1
9.1
3.2
625730163241
516411421
1898541654289385434703207
4665
2246
2820155713295327159663039
3207
4189993269722960
4211762937053924
73455
3175
1033
2985

ISAAC WORLDWIDE ASTHMA SYMPTOMS 327
Table 3. – continued.
Centre Video Prevalence in the last year nWheeze Exercise
wheezeNight
wheezeNightcough
Severewheeze
MaltaMalta
MoroccoCasablancaMarrakechRabat
PakistanKarachi
Regional totalLatin AmericaArgentina
Buenos AiresRosario
ChilePunta ArenasSouth Santiago
ParaguayAsunción
PeruLima
UruguayMontevideo
Regional totalNorth AmericaCanada
HamiltonSaskatoon
USASeattle*
Regional totalNorthern and Eastern EuropeAlbania
TiranëEstonia
TallinnFinland
HelsinkiKuopio CountyLapland AreaTurku and Pori County
LatviaRigaRural Latvia
PolandPoznan
RussiaMoscow
SwedenLinköpingStockholm/Uppsala
UzbekistanSamarkandTashkent
Regional totalOceaniaAustralia
AdelaideMelbournePerthSydney
New ZealandAucklandBay of PlentyChristchurchHawke's BayNelsonWellington
Regional totalSouth-east AsiaIndia
Bombay (16)Bombay (18)BorivaliChandigarhJodhpurMadras (2)Madras (3)New Delhi NeyveliOrissa
I
EEI
I
II
II
I
I
I
EI
I
I
I
IIII
II
I
E
EE
EE
EEEE
EEEEEE
IIIIIIIIII
8.87.5
10.65.66.2
7.97.1
8.37.88.8
11.29.5
13.0
10.1
18.5
15.012.0
12.013.49.9
13.012.3
1.0
2.15.15.83.85.45.21.31.31.3
3.9
1.35.25.15.31.31.81.03.2
17.619.615.516.818.418.416.318.617.419.619.019.518.1
2.90.81.42.62.85.84.32.67.14.32.3
11.19.5
13.07.77.6
6.39.1
9.49.69.1
14.211.716.9
14.5
21.4
17.614.7
28.131.023.5
22.526.4
1.3
5.48.69.37.57.69.92.63.21.9
8.6
1.912.010.413.81.42.30.96.2
27.229.525.828.025.130.328.428.432.229.932.331.029.1
5.52.24.15.35.88.45.76.79.1
10.33.3
4.03.85.52.53.4
3.13.6
4.74.25.23.52.74.4
5.3
6.4
5.94.9
6.57.25.4
4.65.9
0.4
1.21.21.50.91.21.21.10.71.4
1.5
0.81.61.02.30.60.70.61.1
11.011.710.59.9
12.211.711.311.411.312.710.512.211.4
2.30.90.81.32.64.02.91.67.53.31.0
17.811.714.510.69.9
6.110.9
12.811.014.515.414.716.2
12.7
16.8
19.315.1
20.121.218.2
13.518.1
1.6
6.112.514.711.111.612.52.13.31.1
8.5
1.18.27.39.21.32.10.86.7
18.720.516.918.219.222.820.725.222.422.523.323.121.2
3.70.93.43.33.05.45.74.77.84.82.6
5.55.68.33.84.6
4.44.8
5.55.85.14.54.44.5
6.1
8.3
11.06.5
8.58.68.3
10.69.1
0.6
0.92.82.62.63.42.60.60.60.6
2.3
0.32.92.53.40.50.40.61.7
11.312.510.810.611.612.411.412.813.29.8
11.714.912.0
2.50.72.32.01.94.43.72.06.23.32.2
41739350318228993269
182922545
508924982591630332533050
2966
3151
306920578
494730471900
21407087
2362
345411888
2853287730743084595728473110
3238
3411641833633055466217582904
41390
121932990272636412836
18957320128103172353618274411
31150
300434178312838693087106317643044281832731240

328 ISAAC STEERING COMMITTEE
Table 3. – continued.
Centre Video Prevalence in the last year nWheeze Exercise
wheezeNight
wheezeNightcough
Severewheeze
PuneRegional totalWestern EuropeAustria
SalzburgUrfahr-Umgebung
FranceMarseillesStrasbourg
GermanyGreifswaldMünster
ItalyAscoli PicenoCremonaEmilia-RomagnaEmpoliFirenzeMilanoRomaTorinoVerona
PortugalFunchal
SpainBarcelonaBilbaoCartagenaCastellónCádizPamplonaValenciaValladolid
Regional totalGlobal total
I
EE
EE
EE
IIIIIIIII
E
IEEEEEEE
0.72.9
5.55.06.58.39.17.95.34.85.65.36.04.15.85.03.95.54.85.35.8
6.27.87.49.87.75.88.96.99.66.36.77.3
1.45.5
15.014.715.622.823.122.516.717.216.416.919.813.117.517.717.819.115.915.714.4
14.425.721.927.622.918.924.524.635.429.020.613.7
0.62.3
3.33.13.74.45.13.93.63.53.82.11.71.41.91.51.51.91.61.54.8
3.34.84.76.14.13.96.43.85.13.93.73.7
0.93.7
8.89.18.2
14.915.214.810.29.7
10.613.29.6
12.012.417.014.016.811.814.710.6
10.216.516.316.712.818.716.415.817.917.113.911.2
0.92.5
3.13.22.94.65.54.13.63.04.12.82.32.33.03.22.33.72.82.32.1
5.03.94.15.33.72.64.33.44.33.23.74.5
257930043
487633701506880234095393701930203999
18181108911913778103811673357314712392175
34072484229843167301330893238304031403171
67127304796
Data are presented as percentages. E: European version of video; I: International version of video. *: data recoded to eliminate inconsistentresponses.
Fig. 5. – World map for the 13–14 yr old age group, for the video scene showing a person wheezing while at rest. The percentage ofchildren who answered "yes" to the question "Has your breathing ever been like this... in the last year?" is shown for each centre,with distinct colour symbols used for different prevalence ranges.

ISAAC WORLDWIDE ASTHMA SYMPTOMS 329
at rest in the last year, common to both video versions;33% of these centres used the European version while67% used the International version. There was a widerange of prevalence rates between countries (1.0–18.5%),showing more than 15-fold differences. The lowest preva-lences (<3%) were found in Albania, China, Estonia,India, Indonesia, Latvia, Russia and Uzbekistan and thehighest prevalences (>15%) in Australia, New Zealandand Peru. The between-country variation was greater thanthe within-country variation for all questions in the last 12months (1.8–2.5 times larger), except for night cough(1.0).
Wheezing with exercise in the last year was more com-mon than wheezing in the last year in all countries exceptfor Pakistan and Singapore. Night cough in the last yearwas more common than wheezing in the last year in allcountries except for Japan, Kuwait, Pakistan, Peru, Rus-sia, Singapore and Taiwan.
The overall pattern of international differences shownby the 13–14 yr olds who took part in both the video andwritten questionnaires was similar (figs. 1 and 5), with acorrelation of r=0.76 (p<0.0001) (fig. 6). Video preva-lence estimates were generally lower than written esti-mates for comparable questions in centres in the majority(Š75%) of countries, except that "severe asthma" on thevideo questionnaire usually exceeded "severe wheezinglimiting speech" on the written questionnaire. Some of thegreatest differences (>fivefold) between the video andwritten questionnaires for wheezing in the last year werefound in Latvia and Uzbekistan. Large absolute differ-ences (>13%) were found in centres in Australia, Canadaand Finland.
Discussion
The ISAAC study has demonstrated, by means of sim-ple standardized questionnaires, that there are large varia-tions in the prevalence of asthma symptoms throughoutthe world. The self-reported 12 month prevalence ofwheezing among 13–14 yr olds between countries ranged
from 2.1% in Indonesia to 32.2% in the UK. Parentalreported 12 month prevalence of wheezing in 6–7 yr oldsranged from 4.1% in Indonesia to 32.1% in Costa Rica.The highest values for 12 month prevalence of wheezewere found in developed English-speaking countries, andsome Latin American non-English-speaking countries (e.g.Peru and Costa Rica). There were considerable variationswithin regions, e.g. the 12 month prevalence in the 13–14yr old age group varied within Europe from <5% in cen-tres in Albania, Georgia, Greece, Italy, Romania and Rus-sia to >30% in the UK, and within Latin America from<10% in centres in Argentina, Chile and Mexico to >25%in centres in Brazil and Peru.
The analysis shows that there is consistently more vari-ation between countries than within countries. Threecountries with a very large number of centres were repre-sented across the range of prevalences, India with 14 cen-tres representing the low prevalence group, Italy with 14centres representing the middle prevalence group and theUK with 15 centres representing the high prevalencegroup. However, it must be remembered that the coun-tries, and centres within countries were self selected, andit is possible that countries with larger within-country var-iation did not participate.
Although previous international comparisons [1, 13–17] have drawn attention to variations in the prevalence ofchildhood asthma, the ISAAC project comprises by far themost extensive international survey of asthma symptomsever performed. Adherence to the protocol ensured that,within centres, there was standardization of the question-naires and methods of administration and that schoolswere selected without bias from the defined geographicalarea. These centres, however, may not represent the preva-lence of asthma symptoms throughout the whole countryand no comparison could be made between rural andurban areas. Moreover, there may have been importantvariation within some centres, for example between afflu-ent and poor areas, which the ISAAC Phase One study didnot examine. Targets for the sample size ensured therewas sufficient precision in the prevalence estimates ob-tained. By recommending that at least half of the surveybe conducted before the main pollen season it was hopedthat variation due to seasonal factors would be reduced; inthe event, studies in New Zealand [18], the UK and Ger-many have found that the 12 month period prevalence ofthe various wheezing symptoms is not significantly aff-ected by the season of the survey.
The only other comparable international survey ofasthma is the European Community Respiratory HealthSurvey (ECHRS) [19, 20], which studied males and fe-males aged 20–44 yrs, mainly from European centres.Among the 13 centres in 10 countries that were reportedin both studies, the ranking of prevalence of wheeze in thelast 12 months was similar, with the English-speakingcountries (Australia, New Zealand, Republic of Irelandand the UK) having the highest and Italy and Greece thelowest rates.
There is, as yet, no accepted definition of asthma andthe identification of asthma by questionnaire remains acontentious issue. The ISAAC collaboration agreed thatthe cardinal symptom of asthma would be that whichreflects variable narrowing of the airways and that this isbest described (in English) as "wheezing or whistling inthe chest". The questionnaire incorporated questions taken
35
30
25
20
15
10
5
00
Whe
ezin
g, v
ideo
%
5 201510 25 30 35Wheezing, written %
●
●●●
●
●●●●●●
●●●●●
●●●
●●●●●
●●●●
● ●●●●
●
●
●●●
●
●●
●●
●
●●● ●●●●●●●●●
●●●●●
●●●●●●
●●●
●●●
●●●●
●●●●
●
●
●
●
●●●
● ●
●
● ●●● ●●
Fig. 6. – Scatter plots for the percentage of the 13–14 yr old age groupresponding "yes" for wheezing in the last year (video questionnaire)against "wheezing or whistling in the chest in the last 12 months". The x-axis shows wheezing for the written questionnaire and the y-axis wheez-ing for the video questionnaire. The line of identity is shown.

330 ISAAC STEERING COMMITTEE
from pre-existing questionnaires with sensitive (althoughnot necessarily specific) questions for asthma and morespecific questions which related to the severity of asthma.In recent years a number of studies have compared res-ponses to the ISAAC core wheezing questions with otherindicators of asthma, including physician diagnosis [21],other questionnaires [22] and physiological measures [9,10, 22, 23]. These indicate a level of sensitivity and spe-cificity which is acceptable for the purposes of multicen-tre international comparisons.
While the significance of very mild wheezing may bequestioned, the occurrence of frequent, sleep-disturbing orspeech-limiting attacks is accepted widely as clinicallyimportant. There were large international variations in theprevalence of these three more specific symptoms and,broadly, the worldwide pattern of prevalence of moresevere symptoms followed that of any 12 month wheez-ing. However, the order of countries ranking highest forthe prevalence of "sleep disturbance due to wheezing oneor more nights per week in the last 12 months" and"wheeze severe enough to limit speech to only one or twowords at a time between breaths" was different from 12month wheeze, while four or more attacks in the last 12months was similar to 12 month wheeze. The explana-tions for the variation between prevalence and severitywould be of particular interest and may include differ-ences in the management of asthma between countries,although information on asthma management was not col-lected in ISAAC Phase One.
The proportion of wheezy children with severe asthmasymptoms varied little with the increasing prevalence ofwheezy children in the population. This means the highprevalences found in some centres are not explained byexcessive inclusion of children with mild wheeze. Thesefindings suggest that factors affecting the prevalence ofasthma also affect the severity of asthma, and the factorswhich especially affect the prevalence of severe asthmashould be examined.
The validity of the questionnaire is likely to have variedacross cultures and languages. Some languages do nothave an equivalent of "wheezing" as understood by Eng-lish speakers. The high prevalence in English-speakingcountries, especially in those most accustomed to using"wheezing" as a term in surveys, suggests there may besome language bias associated with the written question-naire, as suggested by the findings of the ECHRS [20], orthat the population has a higher awareness of asthma.However, high prevalences were also observed in Span-ish- and Portuguese-speaking countries in South America,suggesting that other factors are also likely to be impor-tant in determining the prevalence of asthma symptoms.There were also large variations in prevalence withinSpanish, Portuguese and Chinese languages. The overallpattern of international differences observed with the writ-ten questionnaire was maintained among those centresthat employed the video questionnaire. Positive responsesto the video were generally lower than for similar ques-tions with the written questionnaire. A possible reason isthat signs that are obvious enough to be visible or audibleon a video are likely to represent more severe symptomsthan the full spectrum from mild to severe asthma coveredby the written questionnaire. It would be helpful to obtainfurther validation studies in centres of low prevalence.
There was also considerable variation in the prevalenceof a positive response to the question concerning whetherthe child had ever had "asthma". This question probablyindicates the level of perceived or diagnosed asthma in thevarious centres but is a less reliable measure for epidemio-logical purposes [24]. Even in those countries with thelowest prevalences (Albania, Estonia, Indonesia, Latviaand Uzbekistan 1.4–1.7%) asthma is clearly an importantmedical diagnosis. Over 20% of children in the countriesof highest prevalence (Australia, Costa Rica, New Zea-land, Oman, Peru, Singapore and the UK) reported "as-thma".
The prevalence of exercise-related wheeze in the last 12months differed from 12 month wheeze in both agegroups, being consistently higher in older children andlower in younger children. This may be real or representunder-reporting by parents and over-reporting by adoles-cents, or different interpretation of wheezing questions.These differences indicate the need for further examina-tion of the validity of these questions. Higher rates ofreporting of symptoms by adolescents compared withtheir parents has been noted in other studies ([25], Stra-chan personal communication), and rates of symptoms inadolescents are generally similar to those in young adults,suggesting that parental reporting may underestimate truesymptoms. In contrast, the prevalence of night cough wasconsistent in both age groups, and showed a higher preva-lence than any other question. Although there was a verystrong correlation with wheezing in the last 12 months,the higher prevalence of night cough suggests that thisquestion, in addition to estimating asthma, may be meas-uring other respiratory conditions. Parents may have ahigher awareness of night cough because it disturbs theirsleep.
The prevalence of asthma symptoms was greater inmales in the younger age group. There was a mixed pic-ture in the older age group, with considerable variationbetween countries but, on average, females had slightlyhigher prevalence than males. It is possible that the emer-gence of a female predominance of asthma in older ado-lescents and adults may depend on physical maturation,which is likely to occur at different ages in the range ofcountries studied. This pattern of sex differences has beenreported in other studies in Western countries [26], includ-ing one large study which used ISAAC questions system-atically across the age range 5–17 yrs [27]. It thereforeappears unlikely that the present findings with respect tosex differences can be attributed entirely to bias arisingfrom the different methods of questionnaire administra-tion in the younger and older age groups.
A striking feature of these data is the high rates ofasthma symptoms in countries whose predominant lan-guage is English and further study of possible aetiologicalfactors common to these countries is a high priority. Incontrast, while high rates of asthma symptoms were alsofound in some non-English-speaking countries, rates werenot uniformly high among countries sharing the same lan-guage. For example, Peru and Costa Rica had a muchhigher prevalence than Spain, Brazil had a higher preva-lence than Portugal and Hong Kong had a higher pre-valence than China. The variations are unlikely to beexplained entirely by interpretation of language, given thesimilar trends found between written and video question-naires, and provide important opportunities for furtherstudy.

ISAAC WORLDWIDE ASTHMA SYMPTOMS 331
This large international collaboration, examining theprevalence of reported asthma symptoms in children, hasset the framework from which to study a variety of factorscontributing to asthma and provides a baseline fromwhich to measure future trends. The most important out-come of ISAAC will be to advance the understanding ofthe causes of asthma, by studying factors acting at a popu-lation level. Although genetic factors are important riskfactors for individuals within populations, migrant studiesindicate they are unlikely to be responsible for the largevariations in asthma which exist between populations andcannot be responsible for the recent upward trends withinpopulations [28]. Environmental factors are likely to bemore important and offer the greatest opportunities forprevention. An attractive current theory, supported by ex-perimental evidence, is that increased hygiene and health-care in Western countries has altered the pattern of expo-sure to infection in early life in such a way as topredispose the immune system towards the atopicresponse [29, 30]. There are also a number of theoriesconcerning the provocation of asthma by various agentsincluding aeroallerg-ens, diet, indoor and outdoor pollu-tion. The ISAAC group is now using the prevalence data
reported here to conduct ecological studies between popu-lations to test these and other hypotheses.
ISAAC Phase Two studies are now planned or under-way in a number of countries and regions. Measures ofbronchial hyperresponsiveness are being used to determinewhether these support the questionnaire results. Measuresof atopy (using allergen skin tests and immunoglobulin Emeasurements) are being used to determine the extent towhich variations in wheezing illness are reflected in varia-tions in atopy. Phase Two studies will also systematicallyobtain environmental data such as indoor exposure toallergens and pollutants to contribute to the ecologicalanalyses.
This worldwide study of asthma symptoms is a majorstep forward in using population differences in prevalenceto gain new insights into the causes of asthma. The sim-plicity of the questionnaire method enabled a wide rangeof countries to participate but was necessarily accompan-ied by some uncertainty as to international comparability.However, the large variations found are most unlikely tobe explained by methodological factors alone. The existenceof such wide variation provides an epidemiological opp-ortunity for new investigations into the causes of asthma.
AlbaniaTiranë A. Priftanji, Allergy Clinic,
University HospitalAlgeria
Algiers A. Bezzaoucha, Chu Bab el Oued, Service d'Epidemiologie
ArgentinaBuenos Aires, Rosario N. Salmun*, Fundación para el
Estudio del Asma y otrasEnfermedades Alérgicas
AustraliaAdelaide D. Kennedy, Respiratory Medic-
ine, Adelaide Children's HospitalMelbourne C. Robertson*, Dept of
Thoracic Medicine, RoyalChildren's Hospital
Perth L. Landau, Faculty of Medicineand Dentistry, University of
Western AustraliaSydney (6–7 yr) J. Peat, Dept of Medicine,
University of SydneySydney (13–14 yr) A. Bauman, School of
Community Medicine, University of New South Wales
AustriaSalzburg J. Riedler*, KinderspitalUrfahr-Umgebung G. Haidinger, Dept of Epidemiology, Institute of
Tumorbiology/Cancer Research, University of Vienna
BelgiumAntwerp P.A. Vermeire, Dept of
Respiratory Medicine, University of Antwerp
BrazilCuritiba N.A. Rosário, Dept of Pediatrics
Federal University of ParanaPorto Alegre R. Stein, Respiratory Sciences
Center, College of Medicine
Recife P.G.dM. Bezerra, Instituto Mat-terno Infantil de Pernambuco
Salvador L.S.dF. Souza, Faculty of Medi-cine, Federal University of Bahia
São Paulo D. Solé*, Division of Allergy,Universidade Federal de
São PauloCanada
Hamilton M. Sears*, Firestone RegionalChest & Allergy Unit, St.Joseph's Hospital, McMasterUniversity
Saskatoon B. Taylor, IWK - Grace Emergency
ChileCentral Santiago I. Sanchez, Departamento de Pediatria, Universidad
Catolica de ChilePunta Arenas L. Amarales, Children's
Respiratory Service, Regional Hospital "Lautaro Navarro"South Santiago E. Cortez, Dept of Paediatric
Respiratory Medicine,Hospital El Pino, University of Santiago de Chile
Valdivia M. Calvo-Gil, Instituto de Pediatria, Facultad de Medicina,
Universidad Austral de ChileChina
Beijing Y. Chen*, Capital Institute ofPediatrics
Chongqing K-H. Chen, Children's HospitalGuangzhou N-S. Zhong, Director, Guangzhou
Institute of Respiratory DiseaseShanghai M. Bao-Shan, Central Hospital
of Zhabei District of ShanghaiWulumuqi M-L. Xiao, Dept of Paediatrics
First Affiliated Hospital, Xinjiang Medical College
Appendix: Centres and principal investigators

332 ISAAC STEERING COMMITTEE
Costa RicaCosta Rica M.E. Soto-Quirós, Unidad de
Enseñanza, Hospital Nacional de Niños, San José
EstoniaNarva, Tallinn M-A. Riikjärv*, Tallinn
Children's HospitalEthiopia
Addis Ababa K. Melaku*, Dept of Internal Medicine, Addis Ababa University
Jima B. Seyoum, Dept of Internal Medicine, Addis Ababa University
FinlandHelsinki M. Kajosaari, Helsinki
University Central HospitalKuopio County J. Pekkanen*, Dept of
Environmental Epidemiology, National Public Health Institute
Lapland Area L. Soininen, Provincial Administrative Board of Lapland
Turku and Pori County T.A. Koivikko, Turku University Central Hospital
FranceMarseille D. Charpin*, Service de
Pneumologie-Allergologie, Hôpital Nord
Montpellier P. Godard, Clinic desMaladies Respiratoires, Hôpital Arnaud de Villeneuve
Pessac A. Taytard, Centre HospitalierUniversitaire de Bordeaux, Service des MaladiesRespiratoires
Strasbourg G. Pauli, Service de Pneumologie, Hôpital Civil
West Marne I. Annesi, INSERM, U. 169:Recherches en Epidémiologie,Villejuif Cedex
GeorgiaKutaisi N. Khetsuriani, USA Center
for Disease Control and Prevention Project in Georgia
Tbilisi A. Gamkrelidze*, Department of Allergology, Tbilisi Medical University
GermanyGreifswald A. Kramer, Institut für
Hygiene und UmweltmedizinMünster U. Keil*, Institut für Epidemio-
logie und Sozialmedizin, West-fälische Wilhelms Universität
GreeceAthens C. Gratziou, Pulmonary and
Critical Care Dept, Evgenidio Hospital
Hong KongHong Kong (6–7 yr) Y.L. Lau, Dept of Paediatrics,
University of Hong KongHong Kong (13–14 yr) C. Lai*, Dept of Medicine, Chi-
nese University of Hong KongIndia
Akola R. Maheshwari, Bhartia Municipal Hospital
Bombay (16) M.K. Joshi, K.B. Bhabha Hospital
Bombay (17) U.A. Pai, PediatricianBombay (18) K. Raghavan, L.T.M. Medical
CollegeBorivali V.A. Khatav, Dr Khatav's
Mother and Child HospitalChandigarh L. Kumar, Postgraduate
Institute of Medical Education and Research
Jodhpur K.C. Jain, Pioneer MedicalCentre
Kottayam T.U. Sukumaran, Institute ofChild Health Medical College
Madras (2) S. Rajajee, Childs Trust Hospital
Madras (3) N. Somu, Institute of Child Health
New Delhi K. Chopra, Maulana AzadMedical College
Neyveli G. Jayaraj, Occupational Health, Neyveli Lignite Corporation Hospital
Orissa P.K. Kar, Ispat HospitalPune N.M. Hanumante, Consulting
Pediatrician, "Happy Clinic"Indonesia
Bandung B. Karnen*, Dept of Medicine, Medical Faculty, University of Indonesia
IranRasht, Tehran M-R Masjedi*, National
Research Institute of Tuberculosis and Lung Disease,Shaheed Beheshti University of Medical Sciences and Health Services
ItalyAscoli Piceno S. Bonini, Consultorio
Familiare USL 24Cosenza E. Bonci, Università degli
Studi di Roma "La Sapienza",Istituto di Clinica Pediatrica
Cremona F. Rusconi, Isituto di Clinica diPerfezionamento, AziendaOspedaliera, Clinica Pediatrica"G. e D. De Marchi"
Emilia-Romagna M. Biocca, CDS Aziende USL,Città di Bologna e Ravenna
Empoli L. Chetoni, Centro StudiPrevenzione Oncologica(CSPO), U.O. EpidemiologiaUSL 10/E
Firenze E. Chellini, Centro Studi Prev-enzione Oncologica (CSPO),U.O. Epidemiologia USL 10/E
Frosinone R. Ronchetti, Università degliStudi di Roma "La Sapienza",Istituto di Clinica Pediatrica,
Policlinico Umberto 1°Milano L. Bisanti, Regione Lombardia
Servizio di EpidemiologiaRoma F. Forastiere*, Osservatorio
EpidemiologicoSiena E. Renzoni, Istituto Malattie
Respiratorie, Università diSiena, Ospedale Le Scotte

ISAAC WORLDWIDE ASTHMA SYMPTOMS 333
Torino G. Ciccone, Servizio Universiario, Epidemiologiadei Tumori, AziendaOspedaliera S.G. Battista
Trento S. Piffer, Azienda ProvincialeSanitaria, OsservatorioEpidemiologico
Verona A. Boner, Clinica Pediatrica,Università di Verona
Viterbo G. Corbo, Servizio di Fisio-patologia Respiratoria, Univer-sità Cattolica del Sacro Cuore
JapanFukuoka S. Nishima, National Minami
Fukuoka Chest HospitalKenya
Eldoret F.O. Esamai, Dept of Child Health and Paediatrics, Moi University
Nairobi J.A. Odhiambo*, Respiratory Diseases Research Unit, KenyaMedical Research Institute
Kuwait Kuwait J.A. Al-Momen, Al-Amiri
HospitalLatvia
Riga, Rural Latvia M. Leja*, Latvia Medical Aca-emy, Human Ecology Institute
LebanonBeirut F.M. Ramadan, Dept of
Medicine, American University of Beirut
MalaysiaAlor Setar K.H. Teh, Dept of Paediatrics,
Hospital Alor SetarIpoh W.Y. Lim, Dept of Paediatrics,
Ipoh HospitalKlang Valley J. de Bruyne*, Dept of Paedia-
trics, University HospitalKota Bharu B.S. Quah, School of Medical Sciences, University Sains
MalaysiaMuar K.W. Chum, Johor Child Spe-
cialist Clinic, Hospital MuarMalta
Malta S. Montefort, Dept of Medicine, University of Malta
Medical SchoolMexico
Cuernavaca I. Romieu, CentroPanamericano de Ecologia Humana y Salud
MoroccoCasablanca, Marrakech Z. Bouayad*, Service de Pneumologie, Centre Hospi-
talier Ibnou RochdRabat A. Bennis, Résidence du
MinaretNew Zealand
Auckland M.I. Asher*, Dept of Paediat-rics, University of Auckland
Bay of Plenty C. Moyes, Dept of Child Health, Whakatane Hospital
Christchurch P. Pattemore, Dept of Paediatrics, Christchurch School of MedicineHawke's Bay D. Barry, Dept of Paediatrics, Memorial Hospital
Nelson R. Mackay, Dept of Paediatrics,Nelson Hospital
Wellington J. Crane, Dept of Medicine, Wellington School of Medicine
NigeriaIbadan B.O. Onadeko, Dept of Medic- ine, University College Hospital
OmanAl-Khod B.M.S. Al Riyami, Dept of
Medicine, Sultan Qaboos University
PakistanKarachi Z.A. Bhutta, Faculty of Health Sciences, The Aga Khan
UniversityPanama
David-Panamá G. Cukier, Neumologo-PediatriaParaguay
Asunción J.A. Guggiari-Chase, Sociedad Paraguaya de Alergia e Immunologia
PeruLima P. Chiarella, Departamento de
Pediatria, Universidad Peruana Cayetano Heredia
PhilippinesMetro Manilla F. Cua-Lim, St Lukes Medical
CenterPoland
Krakow G. Lis*, 1st Dept of Pediatrics, Polish-American Children's Hospital
Poznan A. Breborowicz, Dept of Pedi-atric Pulmonology, Universityof Medical Sciences
PortugalFunchal F. Drummond Borges, Serviço
de Medicina, Centro Hosp-italar do Funchal
Lisbon J. Rosado Pinto*, Serviço de Immunoalergologia, Hospital de Dona Estefânia
Portimão C. Nunes, Administração Regional de Saúde do Algarve
(ARS)Porto J. Lopes dos Santos, Serviço
de Pediatria, Hospital de Matosinhos
Rep. of IrelandRepublic of Ireland L. Clancy; Respiratory Research
Centre, St James's HospitalRomania
Cluj D. Dumitrascu, Allergy Dept, University Medicine and Pharmacology
RussiaMoscow R. Khaitov, Institute of
Immunology, National Research Center
SingaporeSingapore B-W. Lee, Children's Medical
Center, National University Hospital
South AfricaCape Town H. Nelson, Dept of
Community Health Medical School, Observatory 7925

334 ISAAC STEERING COMMITTEE
Writing Group: M.I. Asher, University of Auckland,Auckland, New Zealand; H.R. Anderson, St George'sHospital Medical School, London, UK; A.W. Stewart,Univeristy of Auckland, Auckland, New Zealand; J.Crane, Wellington School of Medicine, Wellington,New Zealand.
ISAAC Steering Committee: N. Aït-Khaled(Regional Coordinator), IUATLD, Paris, France; G.Anabwani (Regional Coordinator), Princess MarinaHospital, Gaborone, Botswana; H.R. Anderson, StGeorge's Hospital Medical School, London, UK; M.I.Asher (Chairperson of the ISAAC Steering Committeeand ISAAC Executive, Director of the ISAAC Inter-national Data Centre, Regional Coordinator), Univer-sity of Auckland, Auckland, New Zealand; R. Beasley(ISAAC Executive, Coordinator Phase One), Welling-ton School of Medicine, Wellington, New Zealand; B.Björkstén (ISAAC Executive, Regional Coordinator),University Hospital, Linköping, Sweden; M.L. Burr,University of Wales, College of Medicine, Cardiff, UK;T.O. Clayton (ISAAC International Data Centre), Uni-versity of Auckland, Auckland, New Zealand; J. Crane,Wellington School of Medicine, Wellington, New Zea-land; P. Ellwood (ISAAC International Data Cen-
tre), University of Auckland, Auckland, New Zealand;U. Keil (Regional Coordinator), Universität Münster,Münster, Germany; C.K.W. Lai (Regional Coordina-tor), The Chinese University of Hong Kong, HongKong, China; J. Mallol (Regional Coordinator), Uni-versity of Santiago, Santiago, Chile; F.D. Martinez(Regional Coordinator), University of Arizona, Tucson,USA; E.A. Mitchell (ISAAC International Data Cen-tre), University of Auckland, Auckland, New Zealand;S. Montefort (Regional Coordinator), University ofMalta Medical School, G'Mangia, Malta; N. Pearce,Wellington School of Medicine, Wellington, New Zea-land; C.F. Robertson, Royal Children's Hospital, Park-ville, Australia; J.R. Shah (Regional Coordinator),Jaslok Hospital and Research Centre, Mumbai, India; B.Sibbald, University of Manchester, Manchester, UK;A.W. Stewart (ISAAC International Data Centre), Uni-versity of Auckland, Auckland, New Zealand; D.P.Strachan (ISAAC Executive), St George's HospitalMedical School, London, UK; E. von Mutius, Kinderk-linik der Universität München, München, Germany;S.K. Weiland (ISAAC Executive, Coordinator PhaseTwo, Regional Coordinator), Universität Münster, Mün-ster, Germany; H.C. Williams, University Hospital,Nottingham, UK.
South KoreaProvincial Korea, Seoul S-I. Lee*, Samsung Medical
Center, Dept of PediatricsSpain
Barcelona R.M. Busquets, Servicio de Pediatría, Hospital del Mar, Universidad Autónoma de Barcelona
Bilbao A.D. Rubio, Dept of PediatricsBasque Country University
Cádiz A.R. Asensio, Sevicio Andaluz de Salud, Districto Bahia-Vejer
Cartagena L. García-Marcos*, Universidad de Murcia, Dirección de Salud Area II
Castellón A. Arnedo-Pena, Sección de Epidemiologia, Dirección Territorial Sanidad
Pamplona F. Guillén Grima, Universidad Pública de Navarra, Dept de Ciencias de la Salud
Valencia M.M.M. Suárez-Varela, Dept de Medicina Preventiva i Salut Pública, Bromatologia, Toxicologia i Medicina Legal
Valladolid A. Blanco Quirós, DeptPediatria, Facultad de Medicina
SwedenLinköping N-I. Kjellman, Dept of
Pediatrics, University HospitalStockholm/Uppsala T. Foucard, Dept of
Paediatrics, Uppsala University Children's Hospital
TaiwanTaipei K-H. Hsieh*, Director, Chang
Gung Children's HospitalThailand
Bangkok P. Vichyanond*, Dept of Pediatrics, Faculty ofMedicine, Mahidol University
Chiang Mai M. Trakultivakorn, Dept of Pediatrics, Chiang Mai University Hospital
United KingdomAnglia and Oxford, North East and Yorkshire, NorthThames, North West, South and West, South Thames,Scotland, Trent, Wales, West Midlands
H.R. Anderson*, Dept of Public Health Sciences, St George's Hospital Medical School
Guernsey D. Jeff, Director of Public Health, Guernsey
Isle of Man P.V. Powell, Acting Director of Public Health, DHSS
Jersey C.R. Grainger, Medical Officer of Health, Public Health Services
Sunderland M.H. Shamssain, School of Health Sciences, University of Sunderland
Surrey/Sussex D. Strachan, Dept of Public Health Sciences, St Georges Hospital Medical School
Uruguay Montevideo D. Holgado de Cuesta,
Pulmonology - Allergology, Hospital Pereira Rossell
USAChicago V. Persky, Epidemiology &
Biostatistics, School of Public Health, University of Chicago at Illinois
Seattle G. Redding, Division of Pediatric Pulmonary Medicine, Children's Hospital & Medical Center
UzbekistanSamarkand, Tashkent T. Aripova*, Institute of
Immunology, Uzbek Ministry of Public Health
*National Coordinator

ISAAC WORLDWIDE ASTHMA SYMPTOMS 335
Acknowledgements: The authors are indebted to thecollaborators in the participating centres and all parents,children, teachers and other school staff who partici-pated in the surveys. There are many field workers andfunding agencies who supported data collection andnational, regional and international meetings, includingthe meetings of the ISAAC Steering Committee. Unfor-tunately, these are too numerous to mention (they willbe acknowledged elsewhere) but the authors particu-larly wish to thank the funders who supported theISAAC International Data Centre including the HealthResearch Council of New Zealand, the Asthma andRespiratory Foundation of New Zealand, the NationalChild Health Research Foundation, the Hawke's BayMedical Research Foundation, the Waikato MedicalResearch Foundation, Glaxo Wellcome New Zealandand Astra New Zealand, as well as Glaxo WellcomeInternational Medical Affairs for finding the regionalco-ordinating centres.
References
1. Pearce N, Weiland SK, Keil U, et al. Self-reported pre-valence of asthma symptoms in children in Australia,England, Germany and New Zealand: an internationalcomparison using the ISAAC protocol. Eur Respir J1993; 6: 1455–1461.
2. Asher MI, Keil U, Anderson HR, et al. Internationalstudy of asthma and allergies in childhood (ISAAC):rationale and methods. Eur Respir J 1995; 8: 483–491.
3. Strachan D, Sibbald B, Weiland SK, et al. Worldwidevariations in prevalence of symptoms of allergic rhino-conjunctivitis in children: the International Study ofAsthma and Allergies in Childhood (ISAAC). PediatrAllergy Immunol 1997; 8: 161–176.
4. The International Study of Asthma and Allergies inChildhood (ISAAC) Steering Committee. Worldwide var-iation in the prevalence of symptoms of asthma, allergicrhinoconjunctivitis and atopic eczema: ISAAC. Lancet1998; 351: 1225–1232.
5. Diem K, Lenter C, eds. Documenta Geigy ScientificTables, 7th Edn. Basle, JR Geigy, 1970.
6. Burney PGJ, Laitinen LA, Perdrizet S, et al. Validity andrepeatability of the IUATLD (1984) Bronchial SymptomsQuestionnaire: an international comparison. Eur Respir J1989; 2: 940–945.
7. Weiland SK, Kugler J, von Mutius E, et al. The languageof pediatric asthma patients: verbal descriptors of symp-toms in Germany. Monatsschr Kinderheilkd 1993; 141:878–882 (in German).
8. Shaw RA, Crane J, Pearce N, et al. Comparison of avideo questionnaire with the IUATLD written question-naire for measuring asthma prevalence. Clin Exp Allergy1992; 22: 561–568.
9. Shaw RA, Woodman K, Ayson M, et al. Measuring theprevalence of bronchial hyperresponsiveness in children.Int J Epidemiol 1995; 24: 597–602.
10. Lai CKW, Chan JKW, Wong G, et al. Comparison of theISAAC video questionnaire (AVQ3.0) with the ISAACwritten questionnaire for estimating asthma associatedwith bronchial hyperreactivity. Clin Exp Allergy 1997;27: 540–545.
11. Rao JNK, Scott AJ. A simple method for the analysis ofclustered binary data. Biometrics 1992; 48: 577–585.
12. Wolfinger R, O'Connell M. Generalized linear mixedmodels: a pseudo-likelihood approach. J Statist ComputSimul 1993; 48: 233–243.
13. Asher MI, Pattemore PK, Harrison AC, et al. Interna-tional comparison of the prevalence of asthma symptomsand bronchial hyperresponsiveness. Am Rev Respir Dis1988; 138: 524–529.
14. Robertson CF, Bishop J, Sennhauser FH, Mallol J. Inter-national comparison of asthma prevalence in children:Australia, Switzerland, Chile. Pediatr Pulmonol 1993;16: 219–226.
15. Burr ML, Limb ES, Andrae S, Barry DM, Nagel F. Child-hood asthma in four countries: a comparative survey. Int JEpidemiol 1994; 23: 341–347.
16. Leung R, Ho P. Asthma, allergy, and atopy in three south-east Asian populations. Thorax 1994; 49: 1205–1210.
17. Bråbäck L, Breborowicz A, Dreborg S, Knutsoson A,Pieklik H, Björkstén B. Atopic sensitisation and respira-tory symptoms among Polish and Swedish school chil-dren. Clin Exp Allergy 1994; 24: 826–835.
18. Stewart AW, Asher MI, Clayton TO, et al. The effect ofseason-of-response to ISAAC questions about asthma,rhinitis and eczema in children. Int J Epidemiol 1997; 26:126–136.
19. Burney PGJ, Luczynska C, Chinn S, Jarvis D. The Euro-pean Community Respiratory Health Survey. Eur RespirJ 1994; 7: 954–960.
20. European Community Respiratory Health Survey (EC-RHS). Variations in the prevalence of respiratory symp-toms, self-reported asthma attacks, and use of asthmamedication in the European Community Respirato-ry Health Survey (ECRHS). Eur Respir J 1996; 9: 687–695.
21. Jenkins MA, Clarke JR, Carlin JB, et al. Validation ofquestionnaire and bronchial hyperresponsiveness againstrespiratory physician assessment in the diagnosis ofasthma. Int J Epidemiol 1996; 25: 609–616.
22. Ehrlich RI, Toit DD, Jordaan E, Volmink JA, WeinbergEG, Zwarenstein M. Prevalence and reliability of asthmasymptoms in primary school children in Cape Town. Int JEpidemiol 1995; 24: 1138–1146.
23. Reidler J, Reade T, Dalton M, Holst D, Robertson C.Hypertonic saline challenge in an epidemiological surveyof asthma in children. Am Rev Respir Crit Care Med1994; 150: 1632–1639.
24. Strachan DP. Epidemiology. In: Silverman M, ed. Child-hood Asthma and Other Wheezing Disorders. London,Chapman & Hall, 1995; pp. 7–31.
25. Bishop J, Robertson CF, Caust J, et al. Concordancebetween adolescent and parent response to an asthmamorbidity questionnaire. Am Rev Respir Dis 1993; 147:A373.
26. Weiss ST, Gold DR. Gender differences in asthma. Pedi-atr Pulmonol 1995; 19: 153–155.
27. Strachan DP, Limb ES, O'Neill AO, Wells N. A nationalsurvey of asthma prevalence, severity and treatment inGreat Britain. Arch Dis Child 1994; 70: 174–178.
28. Peat JK, van den Berg RH, Green WF, Mellis CM,Leeder SR, Woolcock AJ. Changing prevalence ofasthma in Australian children. BMJ 1994; 308: 1591–1596.
29. Martinez F. Role of viral infections in the inception ofasthma and allergies during childhood: could they be pro-tective? Thorax 1994; 49: 1189–1191.
30. Holt PG. Environmental factors and primary T-cell sensi-tisation to inhalant allergens in infancy: reappraisal of therole of infections and air pollution. Pediatr Allergy Immu-nol 1995; 6: 1–10.