worst call center practices quality monitoring...
TRANSCRIPT
1
Eliminating the Worst Call Center Practice: Quality Monitoring Calibration mit Diandrea http://www.linkedin.com/in/carmitdiandrea
2
What’s in this eBook? 1. Identification of Inter‐rater Reliability (IRR) and the
differences between IRR and Call Calibration. 2. A Call Center Case Study Findings and Results using IRR. 3. Instructions on how to leverage this study to expedite
change and the development of new practices with traditional call calibration.
3
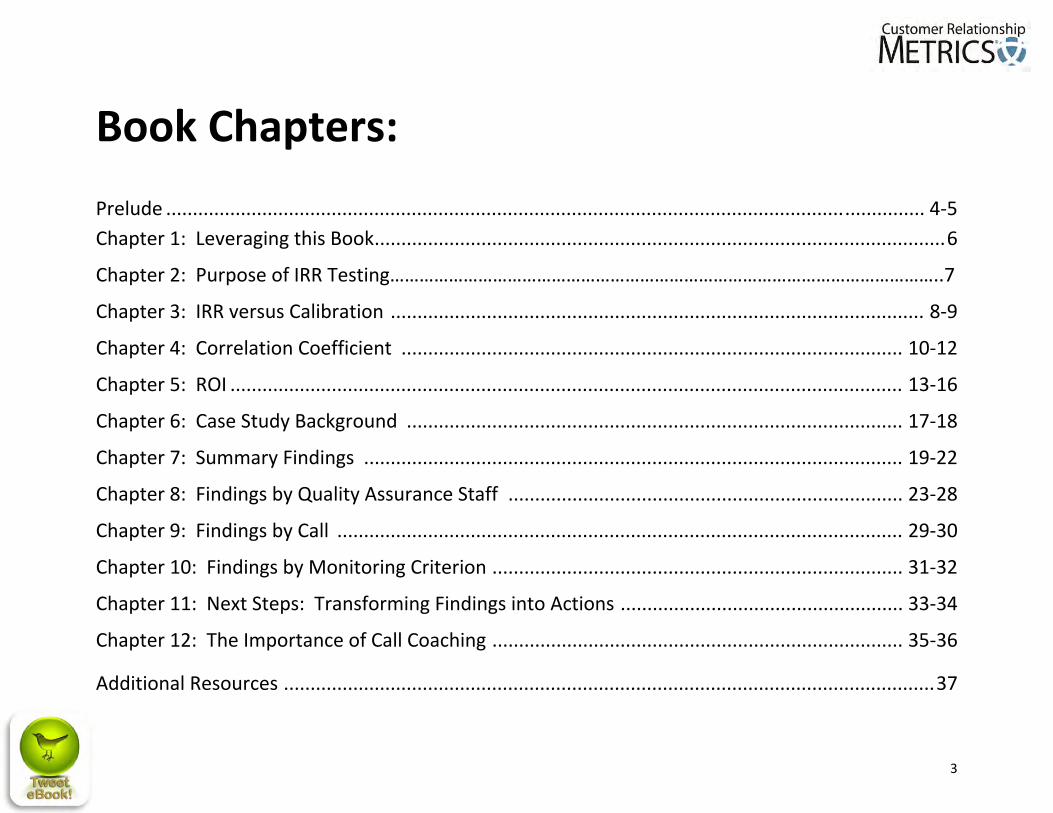
Book Chapters: Prelude .............................................................................................................................................. 4‐5Chapter 1: Leveraging this Book ........................................................................................................... 6
Chapter 2: Purpose of IRR Testing…………………………………………………………………………………………………..7
Chapter 3: IRR versus Calibration .................................................................................................... 8‐9
Chapter 4: Correlation Coefficient .............................................................................................. 10‐12
Chapter 5: ROI .............................................................................................................................. 13‐16
Chapter 6: Case Study Background ............................................................................................. 17‐18
Chapter 7: Summary Findings ..................................................................................................... 19‐22
Chapter 8: Findings by Quality Assurance Staff .......................................................................... 23‐28
Chapter 9: Findings by Call .......................................................................................................... 29‐30
Chapter 10: Findings by Monitoring Criterion ............................................................................. 31‐32
Chapter 11: Next Steps: Transforming Findings into Actions ..................................................... 33‐34
Chapter 12: The Importance of Call Coaching ............................................................................. 35‐36
Additional Resources .......................................................................................................................... 37
4
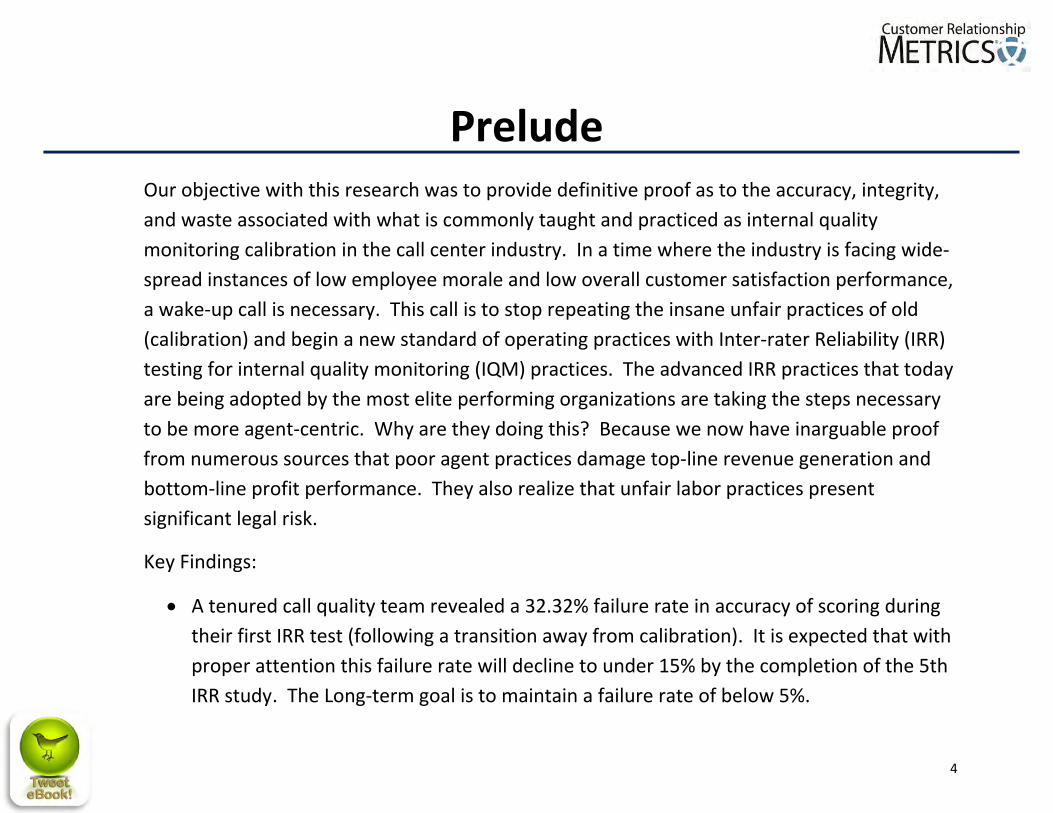
Prelude Our objective with this research was to provide definitive proof as to the accuracy, integrity, and waste associated with what is commonly taught and practiced as internal quality monitoring calibration in the call center industry. In a time where the industry is facing wide‐spread instances of low employee morale and low overall customer satisfaction performance, a wake‐up call is necessary. This call is to stop repeating the insane unfair practices of old (calibration) and begin a new standard of operating practices with Inter‐rater Reliability (IRR) testing for internal quality monitoring (IQM) practices. The advanced IRR practices that today are being adopted by the most elite performing organizations are taking the steps necessary to be more agent‐centric. Why are they doing this? Because we now have inarguable proof from numerous sources that poor agent practices damage top‐line revenue generation and bottom‐line profit performance. They also realize that unfair labor practices present significant legal risk.
Key Findings:
A tenured call quality team revealed a 32.32% failure rate in accuracy of scoring during their first IRR test (following a transition away from calibration). It is expected that with proper attention this failure rate will decline to under 15% by the completion of the 5th IRR study. The Long‐term goal is to maintain a failure rate of below 5%.
5
This quality team was consistent in their scoring decisions only 56.5% of the time during their first IRR test.
The quality team had a failure rate well above average on a set of behaviors collectively referred to as “soft skills” which are keys to a customer‐centric approach as well as one of the behaviors critical to attaining a high level of customer satisfaction (conveying ownership for resolution). This indicates that in the areas most critical to the customer experience (and therefore revenue generation opportunities and future growth) there is little agreement about current performance levels and expectations among the team charged with improving driving long‐term improvement.
The initial level of accuracy, consistency, and alignment with the customer experience is highly alarming when viewed holistically. The focus on cost savings with less of an investment in training and a general frustration with the IQM process and applications have yielded a declining level of employee satisfaction. A decrease in employee satisfaction certainly will have an impact on customer and agent attrition. Collectively, the industry must consider this trend to be one that must be reversed.
6
Chapter 1: Leveraging this Book The findings from this study can be a powerful tool for initiating and executing a change to poor long‐held practices. This report, when completely reviewed, is the foundation for a call to action. A call to discard old practices using this factual information and implement a new method that leads to long‐term consistent savings and improved human capital and organizational performance.
The study results can:
1. Expedite change and the development of new practices focusing leadership's attention on underlying issues and problems with traditional internal quality monitoring call calibration.
2. Be a powerful tool for change by generating credible, comprehensive, in‐depth information that authoritatively identifies weaknesses within IQM practice.
3. Be a catalyst to move your organization from an ongoing debate about what should we do to a discussion of this is how we “must” do it.
7
Chapter 2: Purpose of IRR Testing Quality control is a systematic method of examining a system to ensure that the system is producing an end‐product that meets set standards. In call centers, the end‐product of the system is an interaction between an agent and a customer. Unfortunately for those of us working within the call center industry, we must conduct quality control in hindsight. Our system simply does not allow us to dispose of a miscommunication, misunderstanding or verbal escalation between an agent and a customer. It is for this reason that we must have a methodical, quantitative and ongoing process by which we can accurately assess the type of experience the call center is creating for customers. For over two decades call center practitioners have been using various methods, collectively called calibration, to simulate a methodical, quantitative approach to call scoring. However, traditional calibration falls significantly short on both of these criteria. The word calibration has been used to describe everything from a “groupthink” discussion of recorded calls to focus groups about call scoring criteria to a more analytical comparison of individuals’ call scores. Even when executed precisely, calibration does not provide a complete picture of call scoring accuracy. Instead, what is needed is a more rigorous process known as Inter‐rater Reliability (IRR) testing.
8
Chapter 3: IRR versus Calibration IRR studies are more than mere conversations. They demand a rigorous approach to quantitative measurement. They require that an adequate number of calls be monitored, given the size of the Quality Assurance team, variability in scoring, the complexity of calls, complexity of the monitoring form, etc. IRR testing also requires that call scoring be completed individually (in seclusion if possible). While discussion is key in reducing scoring variability within any Quality Assurance team, scoring and discussion of scoring variations must become separate activities which are conducted at different points in time.
IRR testing aims to answer two key questions: ”How consistent are we in scoring calls?” and “Are we evaluating calls in the right way?” In other words, certainly the goal of IRR is to ensure that each member of the Quality Assurance staff is grading calls consistently with his / her peers. However, a high degree of consistency between the members of the Quality Assurance Staff does not necessarily ensure that calls are being scored correctly, in view of organizational goals and objectives. A further step is needed to ensure that call scoring is conducted with reverence to brand image, organizational goals, corporate objectives, etc. This step requires that a member of the management team take part in each IRR study, acting as the standard of proper scoring for each call.
9
Efforts to attain high degrees of IRR are necessary to ensure fairness to your agents whose calls are being evaluated. Your agents deserve to know, with a high level of confidence, that their monitored calls will be scored consistently, no matter which member of the Quality Assurance team scores them. And they need to know that they are scored well. Without valid and reliable methods of evaluating agent performance, you risk making bad decisions because they are based on faulty data; you risk lowering the morale of your agents through your very efforts to improve it; you open yourself to possible lawsuits for wrongful termination or discriminatory promotion and reward practices. You, too, need to know that your quality monitoring scores give reliable insight about the performance of your call center and about the performance of your agents on any individual call.
10
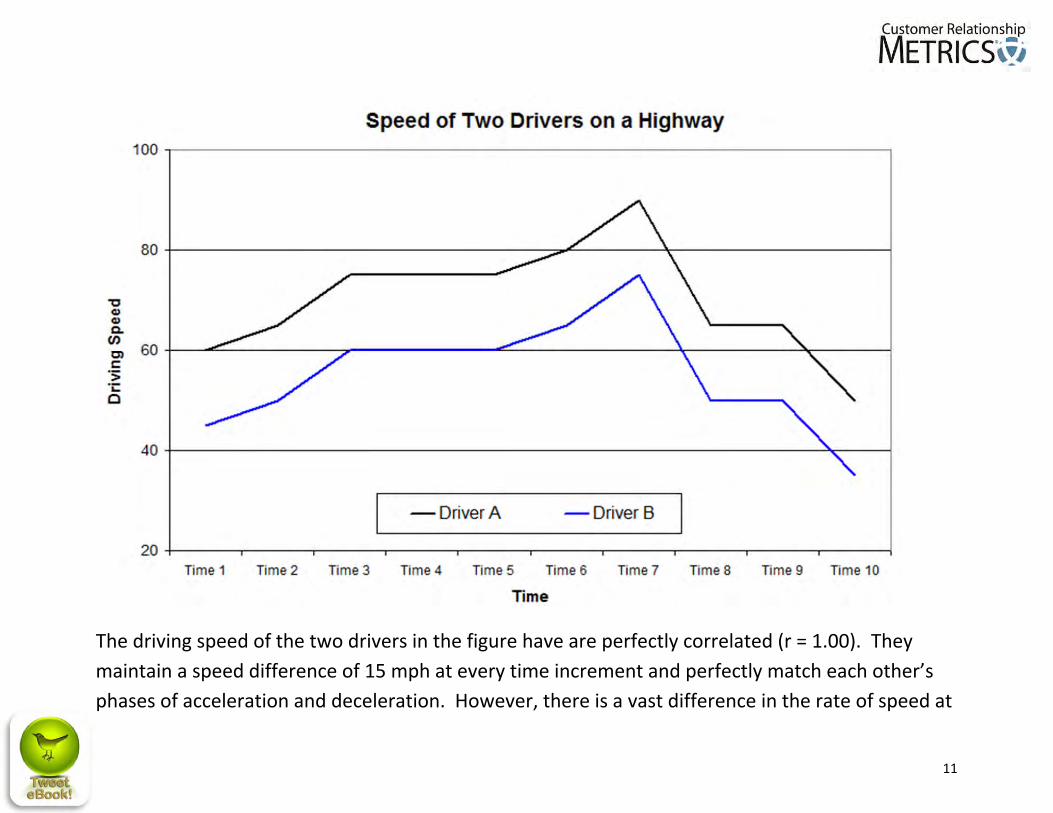
Chapter 4: Correlation Coefficient A (Pearson’s) correlation coefficient is the primary way in which consistency in scoring is measured. Pearson’s coefficient of correlation (r) is a measure of the degree of (linear) strength between two variables. The figure on the following page demonstrates this concept. In our case, we’re examining scoring assigned by the Standard and a member of the Quality Assurance team. Pearson’s correlation coefficient can take on any value between ‐1 and +1. Polarity towards the extreme points of the range indicates stronger degrees of correlation between two variables. A correlation value close to zero (or between ‐0.15 and 0.15) indicate a weak relationship between the two variables. Pearson’s correlation value indicates the strength of the relationship between two variables but does not indicate causality.
In practice, the grading of each member of the Quality Assurance team is compared to the grading completed by the Standard. The purpose of the Standard is to define the correct way of scoring a call.
11
The driving speed of the two drivers in the figure have are perfectly correlated (r = 1.00). They maintain a speed difference of 15 mph at every time increment and perfectly match each other’s phases of acceleration and deceleration. However, there is a vast difference in the rate of speed at
10
12
which both of the drivers are travelling. Researchers do not seek to achieve perfect correlations between two variables as seen in this example. Pearson’s correlation coefficients should not exceed ‐.85 or .85 (some would say ‐.80 or .80).
For this reason, Customer Relationship Metrics (CRM) supplements correlation findings with a view of defects – a count of scoring differences between members of the Quality Assurance staff and the Standard. The combination of correlation and defects provides insight into QA scoring propensities over a set of calls (vs. the Standard) while defects pinpoint scoring nuances on a call‐by‐call basis.
For the business partner presented in the case study, initial performance goals were set at a correlation coefficient of 0.60 and a defect rate no greater than 15%. Goal set by executive management was to bring defect rate to below 5%.
13
Chapter 5: ROI IRR testing delivers value back to the company by enhancing the accuracy & efficiency of the feedback process and enabling long‐term performance improvement. The following scenario plays out weekly, if not daily, in nearly every call center. Agent Jack receives feedback about his calls that were monitored the previous week. He is praised for his positive demeanor, “can do attitude”, and creative problem solving skills which allowed him to solve customer problems without placing them on hold or transferring them to other departments. Jack is pleased but perplexed. The prior week’s assessment of his performance was hardly glowing although he felt his performance was reasonably similar. He did not use the correct call opening, his calls were longer than those of his peers and he failed to capture email addresses on three of the five calls monitored. Jack decides to raise this issue of inconsistency with his supervisor as well as the company’s Human Resources department, launching a rather lengthy and time consuming process of research, gap analysis and documentation. Imagine if you had a process that aligned what is most important to customers and organizational
14
profitability to what your Quality Assurance team listened for so that everyone on the Quality Assurance team reflected the same organizational priorities in their monitoring feedback. Imagine if your Quality Assurance team was so consistent in their feedback that hours were saved each week because agents no longer perceived inconsistency in the performance feedback they were receiving. Imagine if instead of researching and documenting gaps in performance assessments your Quality Assurance and Coaching teams could actually focus on improving performance. All of these benefits are real outcomes of inter‐rater reliability testing.
When implemented correctly and continued on an ongoing basis, IRR testing delivers staggering value to companies. The example below is based on a call center that supports a customer base of 350,000. The average lifetime value of each of these customers is $4,000 with an average revenue per sale of $85.00. Given the financial impact of every customer, a 5% improvement in 3 key areas – customer defection, recommendation rate and repurchase rate ‐ generated an additional $4.8 million in revenue for the company.
A 5% improvement (decrease) in the number of customers who defect from the company would allow the company to retain an additional 1,102 of their own customers, generating over $4 million based on the lifetime value of a customer.
15
A 5% improvement (increase) in recommendations of the company’s products would yield an additional $53,253 in sales assuming only 5% of the customers who indicated they would recommend the company actually do so.
A 5% improvement (increase) in future (re)purchases of the company’s products would yield an additional $369,123 in sales assuming only 35% of the customers who indicated they would make another purchase from the company actually do so.
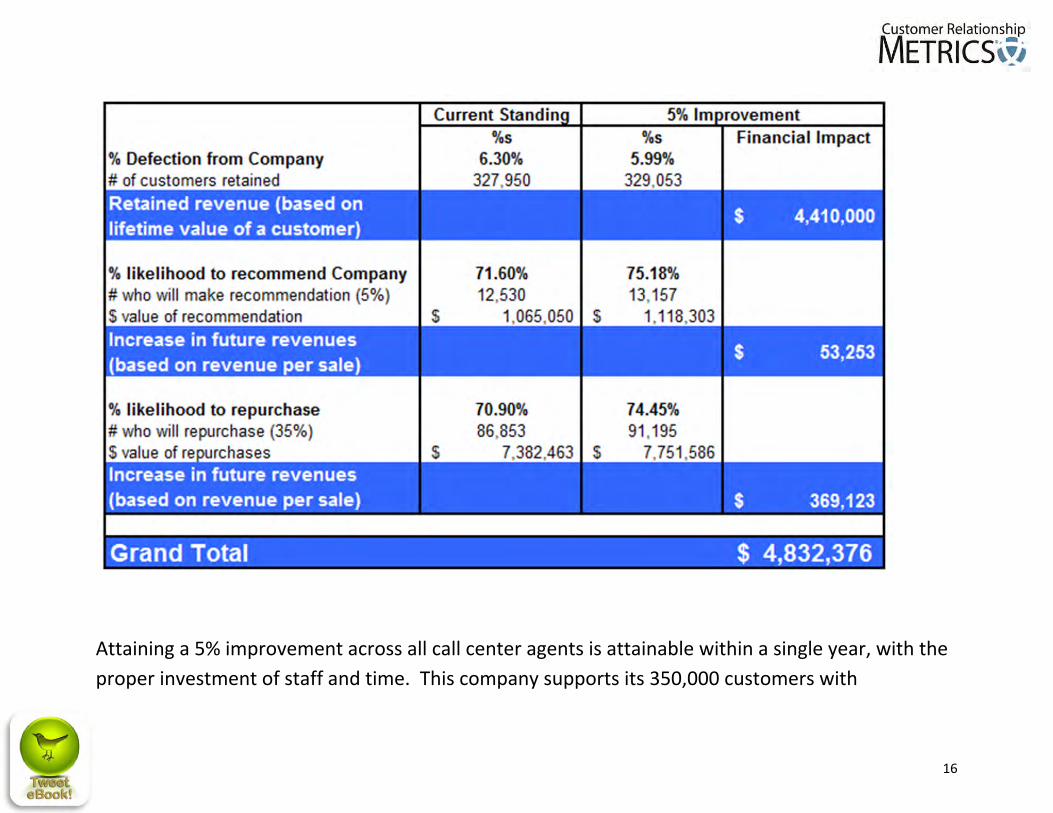
16
Attaining a 5% improvement across all call center agents is attainable within a single year, with the proper investment of staff and time. This company supports its 350,000 customers with
17
approximately 300 full time call center agents. These agents are supported by five full time quality assurance analysts and two performance coaches (at an annual cost of $250,000) as well as a team of call center supervisors. Whether achieving a 5% improvement in call center performance requires one or two years (the timeframe required by a majority of CRM’s business partners), the ROI exceeds 800%. However, it is important to note that once the improvement is achieved, ongoing investment in staff (QAs and coaches) is needed to maintain performance and/or continue driving performance improvements.

This is our CIA (Customer Insights to Action) newsletter registration. Here is what you need to know…
1). As a member, you’ll get access to special briefings on the latest findings on customer experience research, free training resources, and insiders’ insights into the myths and mysteries in contact center technology, operations, and it’s role on the entire customer experience.2.) Frequency only 3‐4 times per month. (We won’t bother you with dirt that won’t grow anything. This will be the good stuff that creates big blooms).3.) We guard your secrets better than the real CIA. No double agents or lost laptops here; your info is never sold to anyone. Only an act of Congress will open our vault.4.) You can unsubscribe anytime. Use the link at the bottom of your emails to go back to being lonely citizen.
Ready to get the inside stuff? Go…
18
Chapter 6: Case Study Background The case study presented in this paper details the first call monitoring quality control exercise completed by one of CRM’s long‐term business partners. It is important to note that this case study involved a highly‐tenured Quality Assurance team. Perhaps it is the high degree of tenure held by the Quality Assurance team that makes the results of this case study so compelling, but the general findings are hardly unusual.
Only weeks prior to this first IRR study, CRM completed a Quality Monitoring Alignment analysis. The purpose of the analysis was to leverage intelligence gathered through customer experience research to design a monitoring form which reflected the components of agent‐customer interaction which were most valued by customers, according to customers. The Quality Alignment analysis resulted in the unveiling and training of a brand new quality monitoring form and scoring compendium (which details the nuances between an excellent aspect of an agent‐customer interaction and one which can only be considered average).
The quality monitoring alignment analysis was based on data collected with nearly 10,000 customer evaluations (surveys) at the “moment of truth” (real‐time) and then combined with a
19
Survey Calibration process. Conducting an evaluation or survey in real‐time, immediately following a customer’s service experience eliminates the bias, error, and random noise associated with delayed methods of data collection and allows for a seamless connection between a recorded call and the customer’s evaluation of service. The resulting quality monitoring form includes a combination of binary, scaled, and auto‐fail criteria. The point allocation associated with each criterion reflects its relative importance to customers.
20
Chapter 7: Summary Findings This case study is based on 15 calls, scored by The Standard and four members of the Quality Assurance team.
An initial correlation goal of 0.60 was set for all Inter‐rater Reliability (IRR) studies. A (Pearson’s) correlation coefficient of 0.6 represents a strong linear relationship between two variables or data sets. Since quality monitoring data is being used to drive important decisions about agent coaching, promotion, compensation and the like, it is imperative that this data be accurate, necessitating the ambitious goal of a 0.6 degree of correlation. The results of the first IRR study revealed that only 56.5% of all criteria scored met this correlation goal of 0.6.
The overall defect rate for this IRR study was 32.32% (vs. an initial goal of goal 15%).
21
Strengths:
Relatively high degree of correlation on the three auto‐fail questions. Since auto‐fail questions are viewed as so critical to the customer experience that non‐compliance results in a monitoring score of 0.00% for the call, it is reassuring to see such a high degree of consistency in QA scoring in these areas.
High degree of agreement between QA team and the standard on which criteria did/did not apply to certain calls.
Opportunities:
A majority of the criteria with the lowest levels of correlation between the Standard and the Quality Assurance team fell within the “soft‐skills” area, an area very important to customers.
The monitoring criterion ‘conveys ownership for resolving customer's reason for call / problem / question’ also showed a relatively low level of scoring correlation back to The Standard. Since this criterion is a key driver of customer satisfaction (resolution‐related) and has a high number of points associated with it (15 out of 120 possible points), additional focus should be placed on better aligning expectations in this area.
22
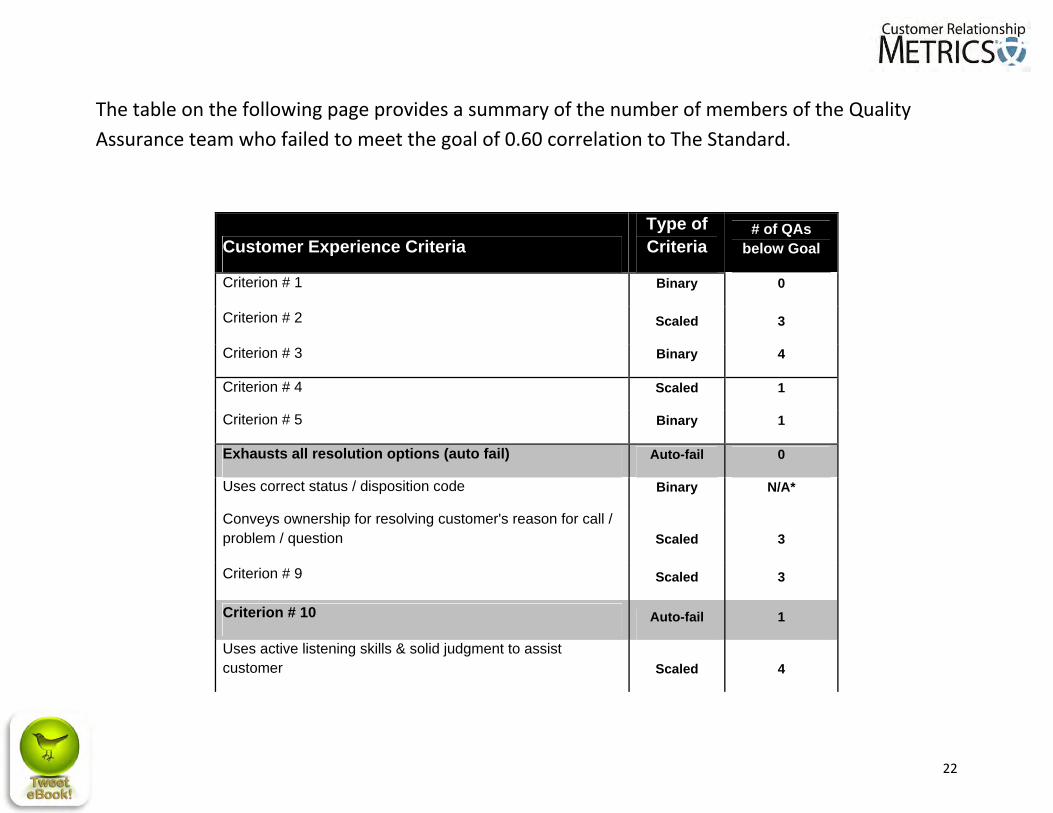
The table on the following page provides a summary of the number of members of the Quality Assurance team who failed to meet the goal of 0.60 correlation to The Standard.
Customer Experience Criteria Type of Criteria
# of QAs below Goal
Criterion # 1 Binary 0
Criterion # 2 Scaled 3
Criterion # 3 Binary 4
Criterion # 4 Scaled 1
Criterion # 5 Binary 1
Exhausts all resolution options (auto fail) Auto-fail 0
Uses correct status / disposition code Binary N/A*
Conveys ownership for resolving customer's reason for call / problem / question Scaled 3
Criterion # 9 Scaled 3
Criterion # 10 Auto-fail 1
Uses active listening skills & solid judgment to assist customer Scaled 4
23
Criterion # 12 Scaled 1
Criterion # 13 Binary 0
Criterion # 14 Scaled 0
Accurately discloses pricing associated with sale / upsell Binary N/A*
Criterion # 16 Binary 2
Criterion # 17 Scaled 4
Criterion # 18 Scaled 3
Criterion # 19 Scaled 3
Criterion # 20 Scaled 3
Criterion # 21 Scaled 4
Criterion # 22 Binary 0
Follows survey transfer guidelines (auto fail) Auto-fail 0
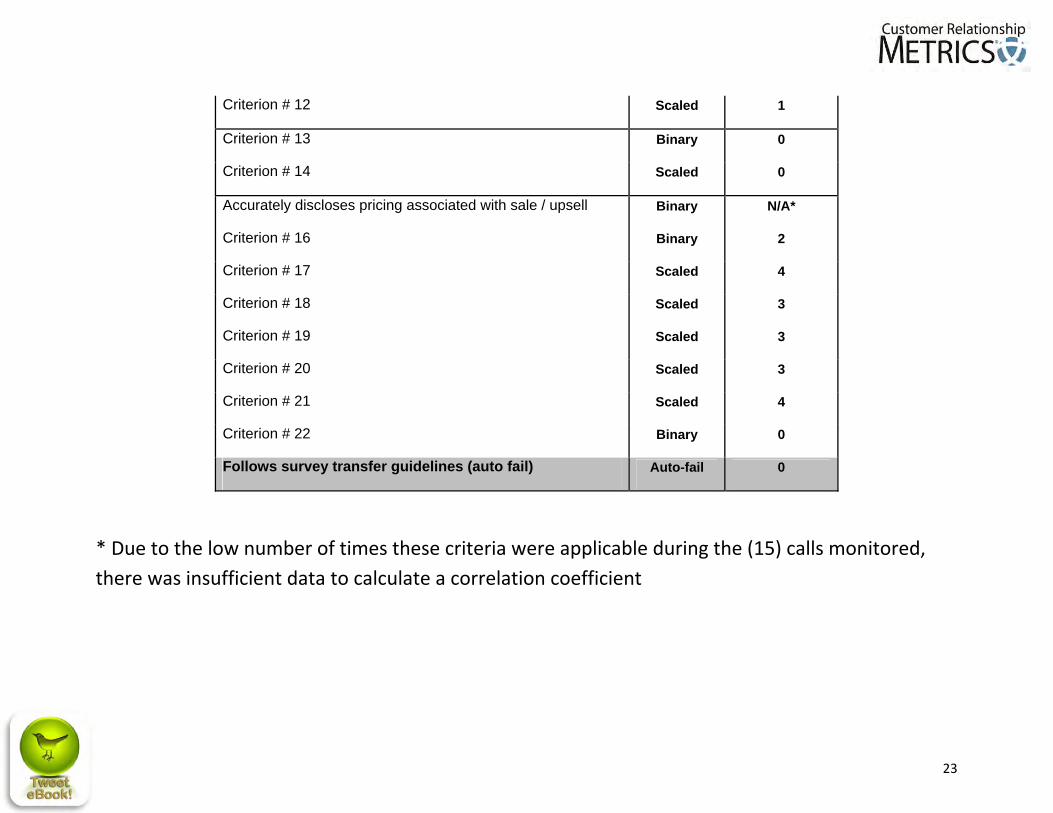
* Due to the low number of times these criteria were applicable during the (15) calls monitored, there was insufficient data to calculate a correlation coefficient
24
Chapter 8: Findings by Quality Assurance Staff
Ensuring consistency in grading across all members of the Quality Assurance team is the primary objective of Inter‐rater Reliability studies. In order to provide the greatest amount of insight into individual (QA) performance, an analysis of the correlation to The Standard and the scoring defects from The Standard were presented.
Recall that the correlation coefficient examines the relationship or consistency of the movement between the variables. Specifically call by call, the way each criterion is scored by a member of the QA team vs. The Standard. When examining the degree of correlation between a member of the QA team and The Standard, each criterion represents a single opportunity to meet the correlation goal of 0.60.
In contrast, when examining defects, each criterion on each individual call represents an opportunity to match The Standard’s grading. The defect percentage goal for Inter‐Rater Reliability studies is 15%.
25
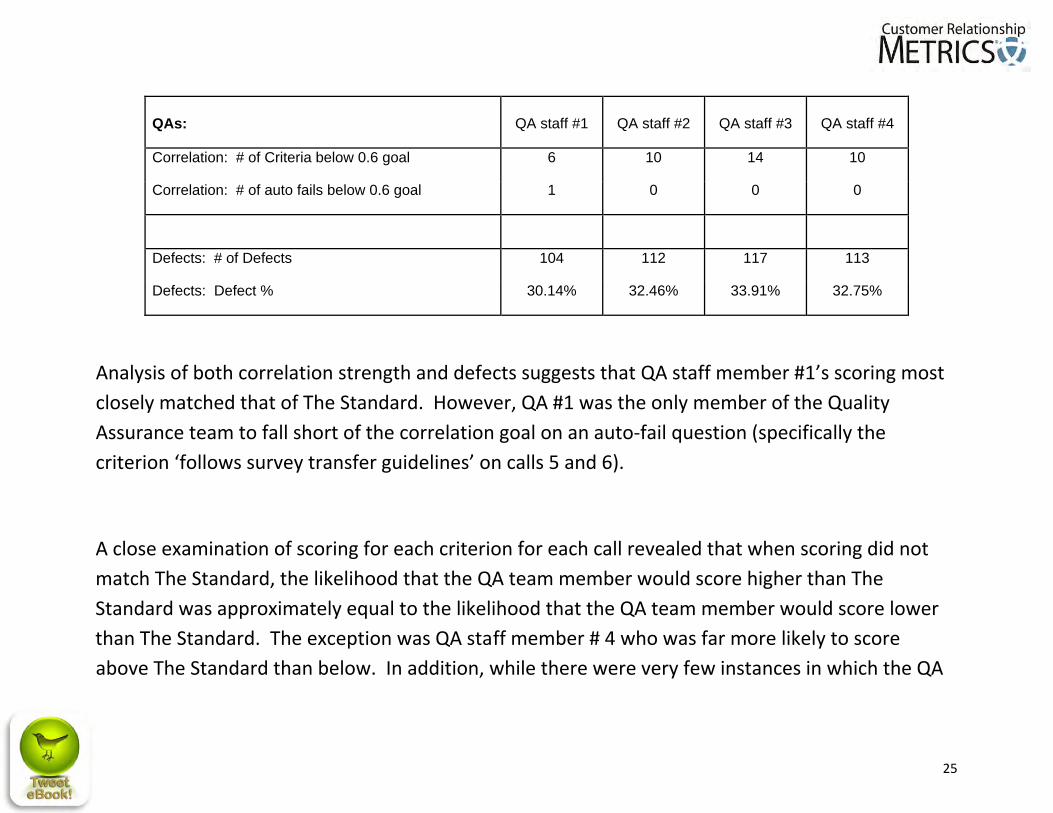
QAs: QA staff #1 QA staff #2 QA staff #3 QA staff #4
Correlation: # of Criteria below 0.6 goal 6 10 14 10
Correlation: # of auto fails below 0.6 goal 1 0 0 0
Defects: # of Defects 104 112 117 113
Defects: Defect % 30.14% 32.46% 33.91% 32.75%
Analysis of both correlation strength and defects suggests that QA staff member #1’s scoring most closely matched that of The Standard. However, QA #1 was the only member of the Quality Assurance team to fall short of the correlation goal on an auto‐fail question (specifically the criterion ‘follows survey transfer guidelines’ on calls 5 and 6).
A close examination of scoring for each criterion for each call revealed that when scoring did not match The Standard, the likelihood that the QA team member would score higher than The Standard was approximately equal to the likelihood that the QA team member would score lower than The Standard. The exception was QA staff member # 4 who was far more likely to score above The Standard than below. In addition, while there were very few instances in which the QA
26
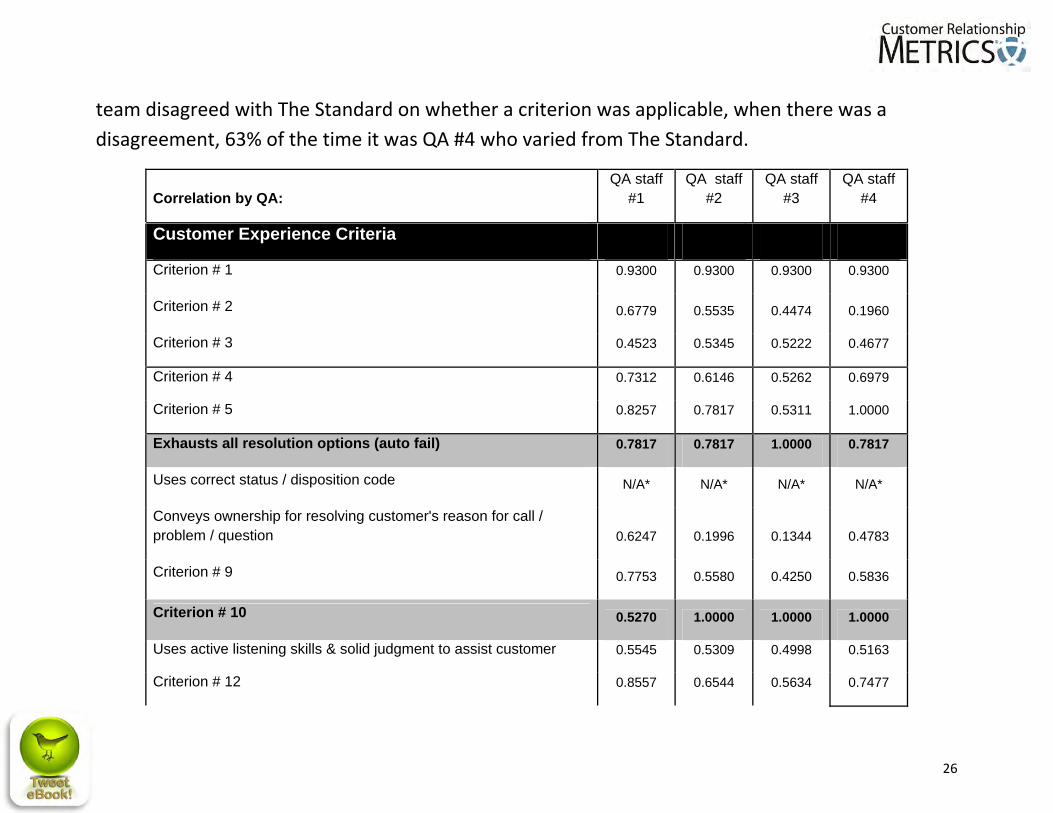
team disagreed with The Standard on whether a criterion was applicable, when there was a disagreement, 63% of the time it was QA #4 who varied from The Standard.
Correlation by QA: QA staff
#1 QA staff
#2 QA staff
#3 QA staff
#4
Customer Experience Criteria
Criterion # 1 0.9300 0.9300 0.9300 0.9300
Criterion # 2 0.6779 0.5535 0.4474 0.1960
Criterion # 3 0.4523 0.5345 0.5222 0.4677
Criterion # 4 0.7312 0.6146 0.5262 0.6979
Criterion # 5 0.8257 0.7817 0.5311 1.0000
Exhausts all resolution options (auto fail) 0.7817 0.7817 1.0000 0.7817
Uses correct status / disposition code N/A* N/A* N/A* N/A*
Conveys ownership for resolving customer's reason for call / problem / question 0.6247 0.1996 0.1344 0.4783
Criterion # 9 0.7753 0.5580 0.4250 0.5836
Criterion # 10 0.5270 1.0000 1.0000 1.0000
Uses active listening skills & solid judgment to assist customer 0.5545 0.5309 0.4998 0.5163
Criterion # 12 0.8557 0.6544 0.5634 0.7477
27
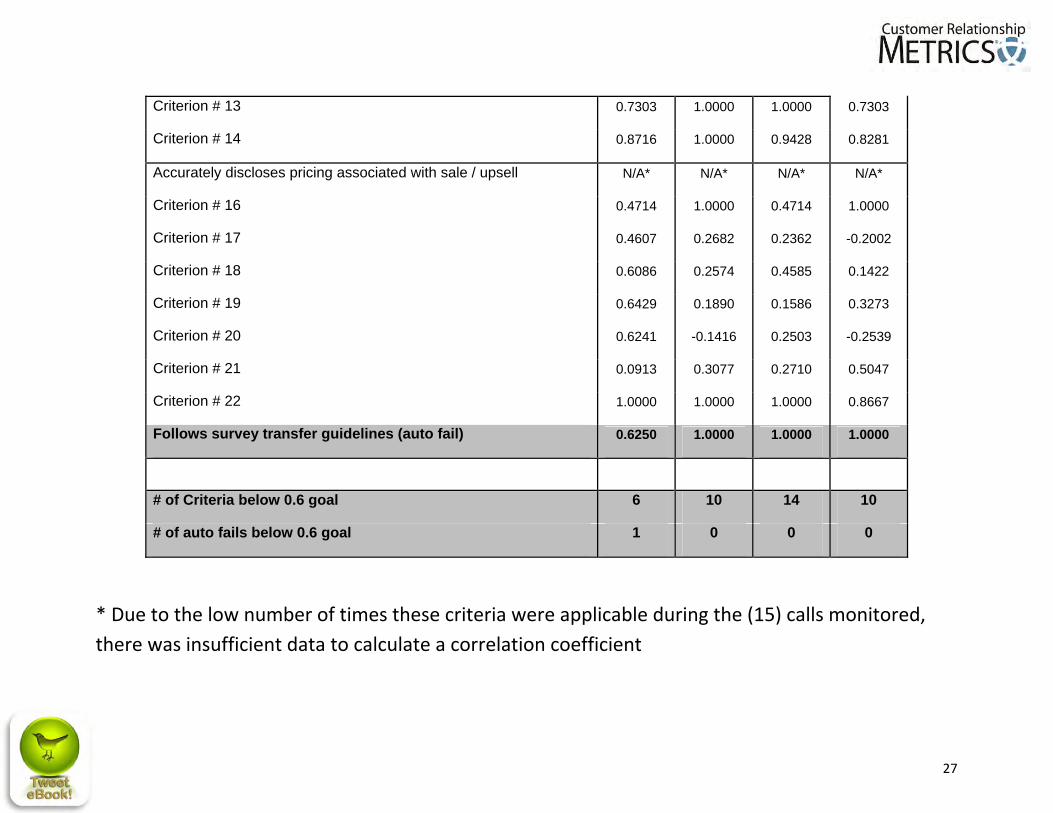
Criterion # 13 0.7303 1.0000 1.0000 0.7303
Criterion # 14 0.8716 1.0000 0.9428 0.8281
Accurately discloses pricing associated with sale / upsell N/A* N/A* N/A* N/A*
Criterion # 16 0.4714 1.0000 0.4714 1.0000
Criterion # 17 0.4607 0.2682 0.2362 -0.2002
Criterion # 18 0.6086 0.2574 0.4585 0.1422
Criterion # 19 0.6429 0.1890 0.1586 0.3273
Criterion # 20 0.6241 -0.1416 0.2503 -0.2539
Criterion # 21 0.0913 0.3077 0.2710 0.5047
Criterion # 22 1.0000 1.0000 1.0000 0.8667
Follows survey transfer guidelines (auto fail) 0.6250 1.0000 1.0000 1.0000
# of Criteria below 0.6 goal 6 10 14 10
# of auto fails below 0.6 goal 1 0 0 0
* Due to the low number of times these criteria were applicable during the (15) calls monitored, there was insufficient data to calculate a correlation coefficient
28
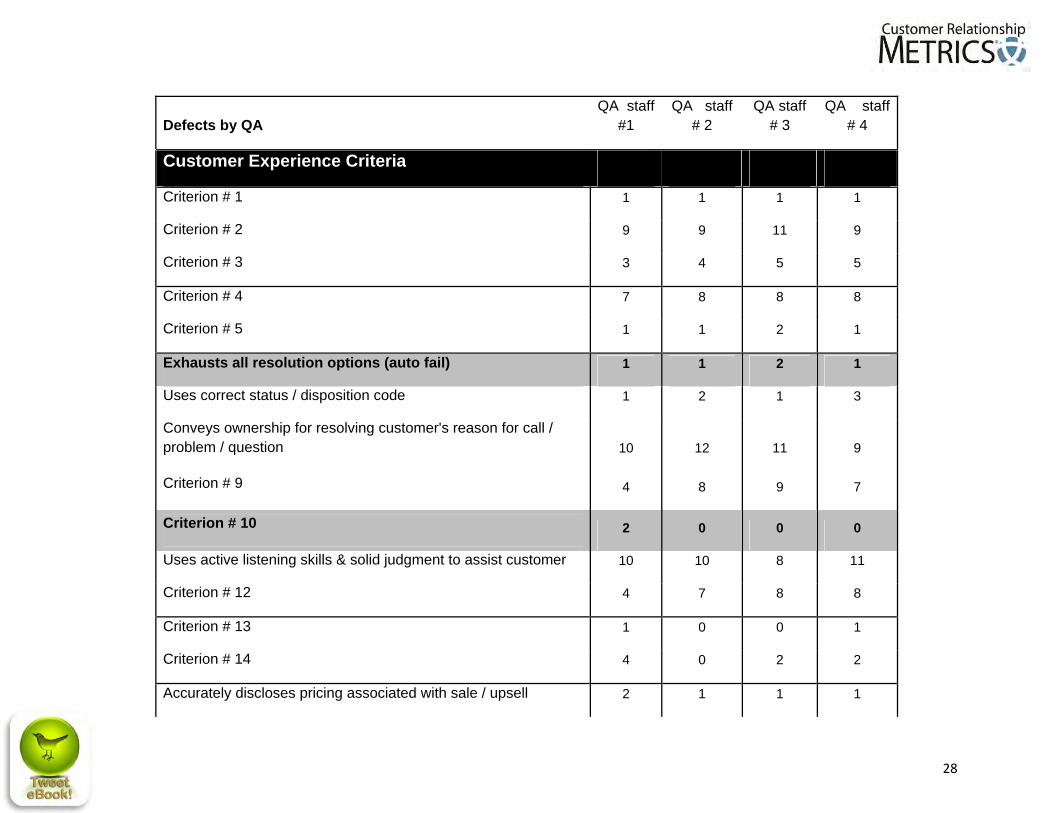
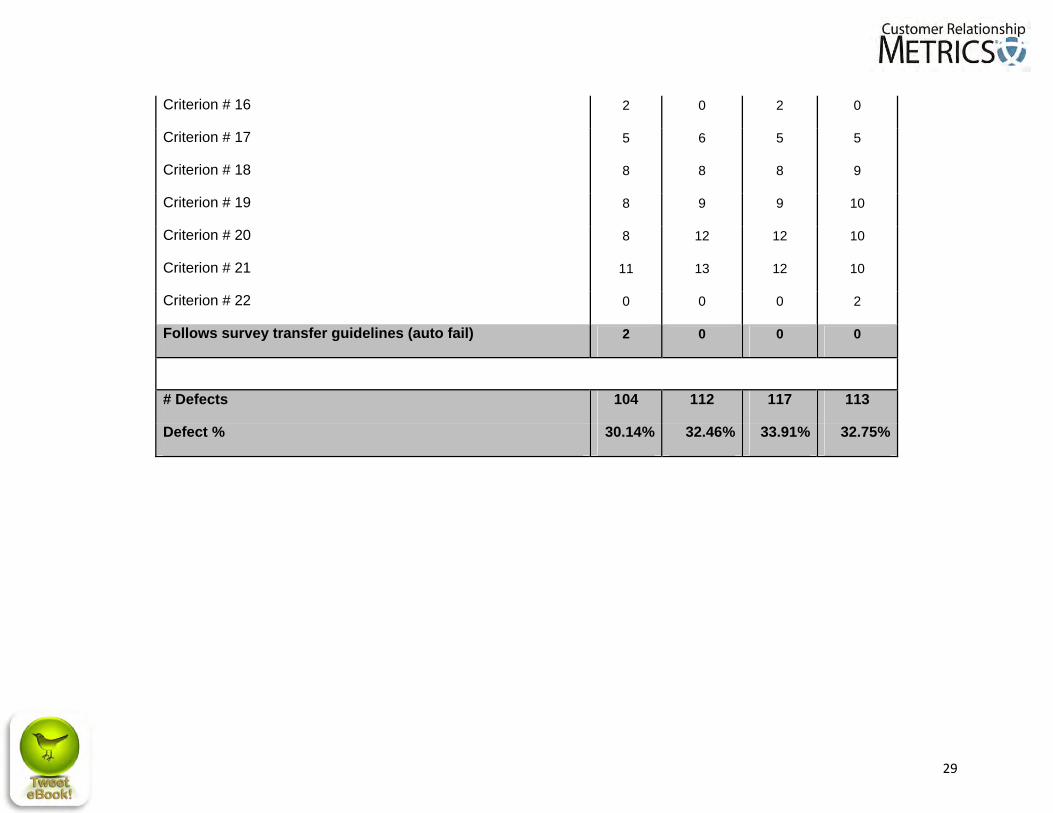
Defects by QA QA staff
#1 QA staff
# 2 QA staff
# 3 QA staff
# 4
Customer Experience Criteria
Criterion # 1 1 1 1 1
Criterion # 2 9 9 11 9
Criterion # 3 3 4 5 5
Criterion # 4 7 8 8 8
Criterion # 5 1 1 2 1
Exhausts all resolution options (auto fail) 1 1 2 1
Uses correct status / disposition code 1 2 1 3
Conveys ownership for resolving customer's reason for call / problem / question 10 12 11 9
Criterion # 9 4 8 9 7
Criterion # 10 2 0 0 0
Uses active listening skills & solid judgment to assist customer 10 10 8 11
Criterion # 12 4 7 8 8
Criterion # 13 1 0 0 1
Criterion # 14 4 0 2 2
Accurately discloses pricing associated with sale / upsell 2 1 1 1
29
Criterion # 16 2 0 2 0
Criterion # 17 5 6 5 5
Criterion # 18 8 8 8 9
Criterion # 19 8 9 9 10
Criterion # 20 8 12 12 10
Criterion # 21 11 13 12 10
Criterion # 22 0 0 0 2
Follows survey transfer guidelines (auto fail) 2 0 0 0
# Defects 104 112 117 113
Defect % 30.14% 32.46% 33.91% 32.75%
30
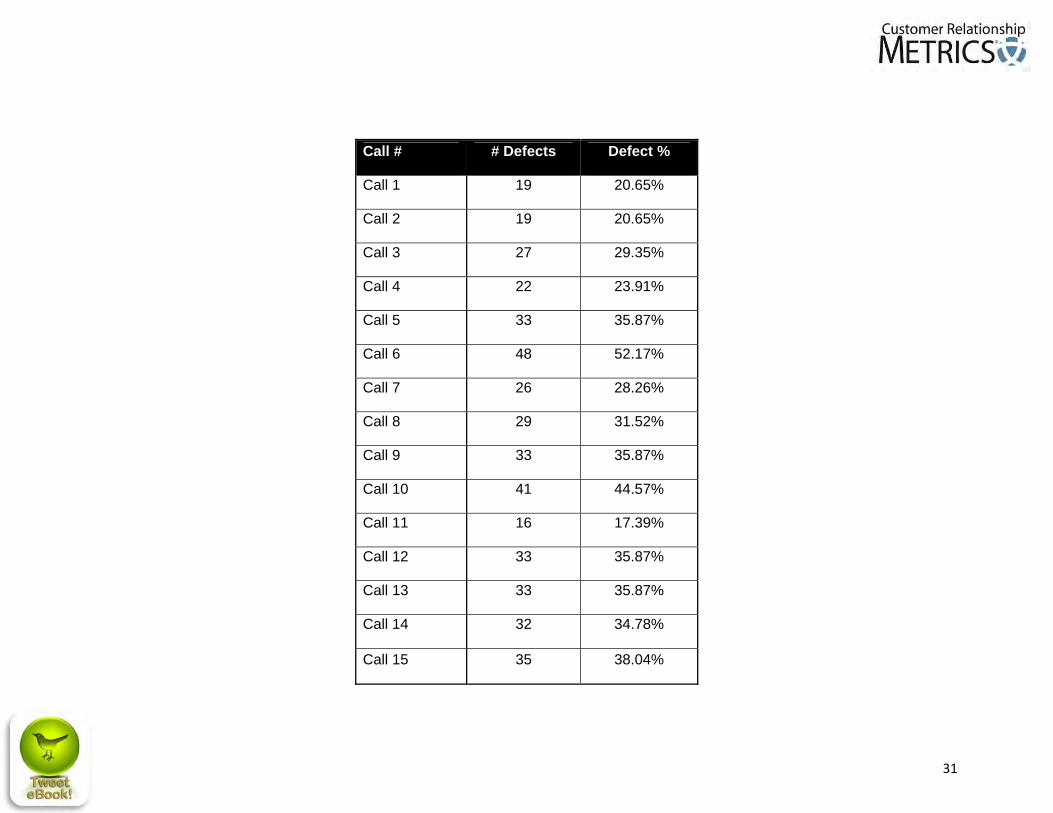
Chapter 9: Findings by Call In the summary findings it was noted that the average defect percentage across all calls was 32.32%. The table below provides details about the degree of agreement with The Standard by call. Recall that the correlation coefficient examines the relationship or consistency of movement between the variables. Specifically, the way each criterion is scored by a member of the QA team vs. The Standard across all (15) calls. As such, it is not possible to calculate a correlation coefficient by call.
Based on the table below, it may be beneficial to summarize the discussion that occurred regarding calls 6 and 10 so that everyone understands how similar calls should be scored in the future. If a recording of these calls is available, it would be beneficial to include one / both of these calls in a future Inter‐Rate Reliability study to ensure that any variation in scoring has been remedied.
Empowerment in this study is more than a buzzword. Call Center “A” in this study has an organizational culture which permitted call center agents to participate in the change management process. If this is not present in your organization, the call center agent accountabilities and First Call Resolution (FCR) performance will in fact create a boomerang effect and cause significant damage to customer relationships, call center agent morale and contribute to call center turnover and increased operational costs.
31
Call # # Defects Defect %
Call 1 19 20.65%
Call 2 19 20.65%
Call 3 27 29.35%
Call 4 22 23.91%
Call 5 33 35.87%
Call 6 48 52.17%
Call 7 26 28.26%
Call 8 29 31.52%
Call 9 33 35.87%
Call 10 41 44.57%
Call 11 16 17.39%
Call 12 33 35.87%
Call 13 33 35.87%
Call 14 32 34.78%
Call 15 35 38.04%
32
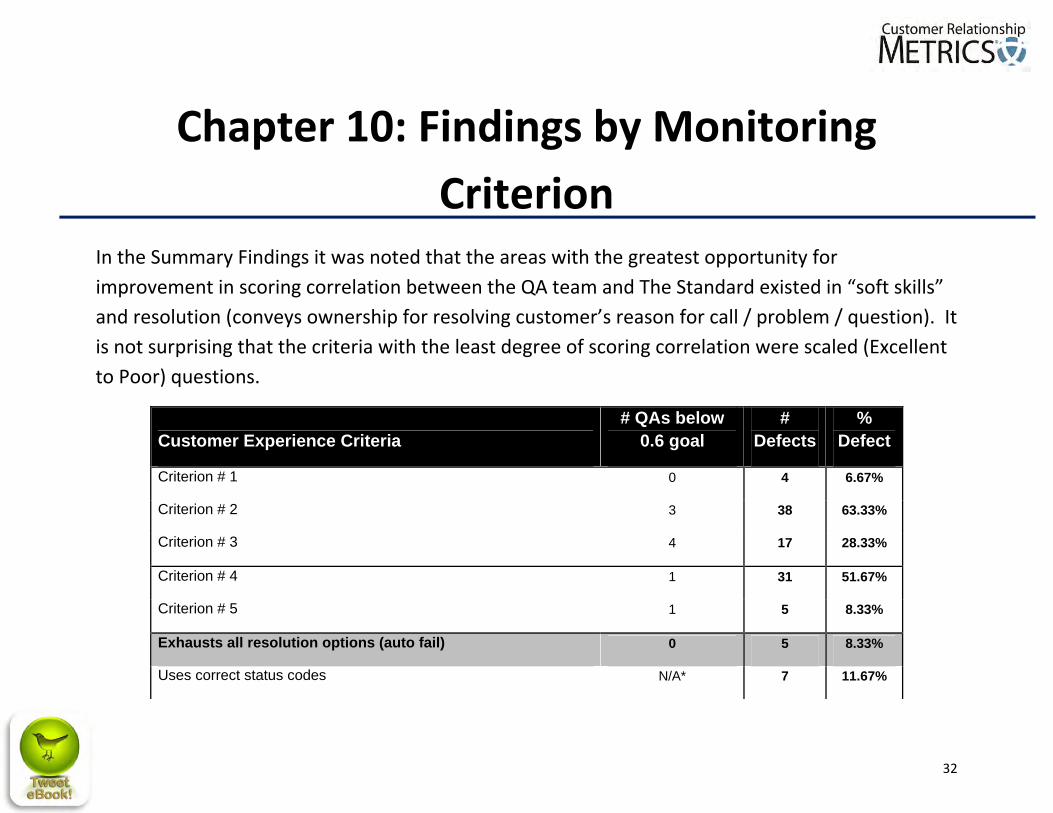
Chapter 10: Findings by Monitoring Criterion
In the Summary Findings it was noted that the areas with the greatest opportunity for improvement in scoring correlation between the QA team and The Standard existed in “soft skills” and resolution (conveys ownership for resolving customer’s reason for call / problem / question). It is not surprising that the criteria with the least degree of scoring correlation were scaled (Excellent to Poor) questions.
Customer Experience Criteria # QAs below
0.6 goal #
Defects%
Defect
Criterion # 1 0 4 6.67%
Criterion # 2 3 38 63.33%
Criterion # 3 4 17 28.33%
Criterion # 4 1 31 51.67%
Criterion # 5 1 5 8.33%
Exhausts all resolution options (auto fail) 0 5 8.33%
Uses correct status codes N/A* 7 11.67%
33
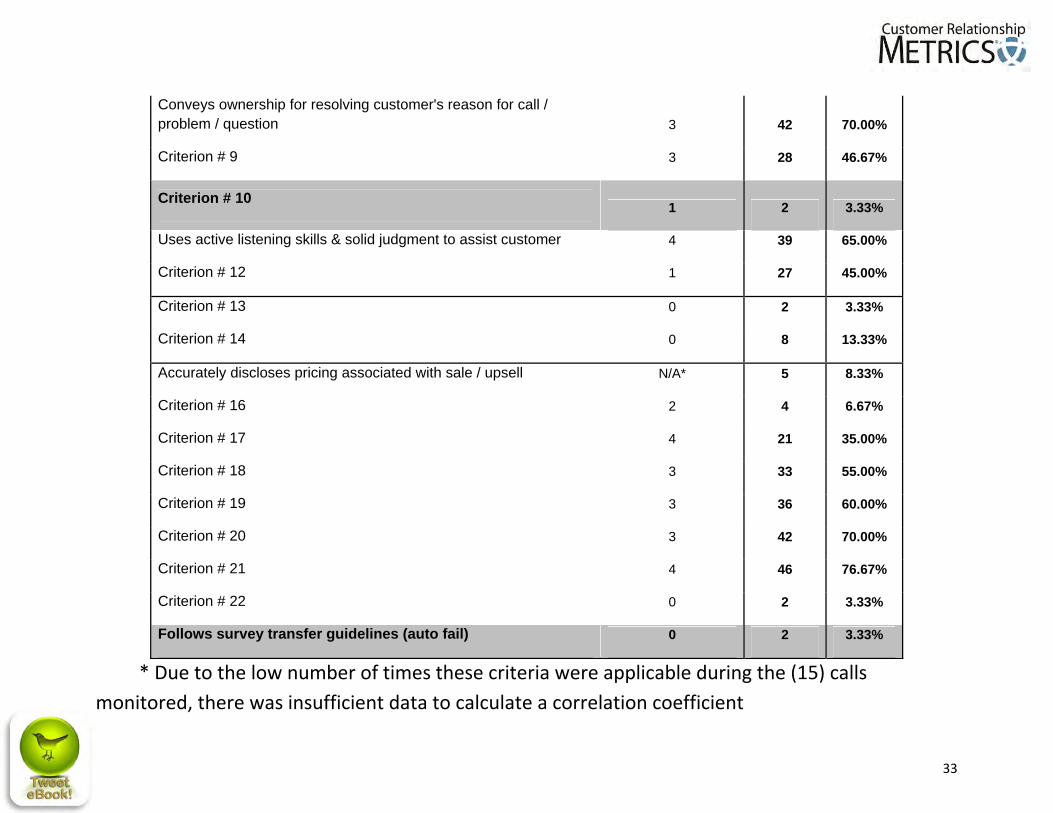
Conveys ownership for resolving customer's reason for call / problem / question 3 42 70.00%
Criterion # 9 3 28 46.67%
Criterion # 10 1 2 3.33%
Uses active listening skills & solid judgment to assist customer 4 39 65.00%
Criterion # 12 1 27 45.00%
Criterion # 13 0 2 3.33%
Criterion # 14 0 8 13.33%
Accurately discloses pricing associated with sale / upsell N/A* 5 8.33%
Criterion # 16 2 4 6.67%
Criterion # 17 4 21 35.00%
Criterion # 18 3 33 55.00%
Criterion # 19 3 36 60.00%
Criterion # 20 3 42 70.00%
Criterion # 21 4 46 76.67%
Criterion # 22 0 2 3.33%
Follows survey transfer guidelines (auto fail) 0 2 3.33%
* Due to the low number of times these criteria were applicable during the (15) calls monitored, there was insufficient data to calculate a correlation coefficient
34
Chapter 11: Next Steps: Transforming Findings into Actions
Design, analysis and evaluation of the results of Inter‐rater Reliability testing is a rigorous and time‐consuming process that is necessary in order to ensure that your call center agents receive consistent feedback about their performance. Failure to do so negatively impacts employee morale and increases risk of legal action. Inter‐rater Reliability testing must be an ongoing process that begins with the scoring of a set of calls and perpetuates with an understanding of priorities and focus areas for the next Inter‐Rater Reliability study.
Following analysis of the results of the first Inter‐rater Reliability, the following recommendations were made regarding the Inter‐rater Reliability study to follow (in decreasing order of importance):
Focus on bringing correlation to goal on all Yes / No criteria. As attaining correlation on Yes / No criteria will be easier than achieving the same on Excellent to Poor questions. It is recommended that the Quality Assurance team aim for this “easy win” to generate momentum, enthusiasm for the process and unity in purpose. Ensuring that the goal is met on three auto‐fail questions should be at the top of this list.
35
Once the correlation goal has been attained on Yes / No criteria, focus on reaching the correlation goal on the remaining (Excellent to Poor) questions. Priority should be given to those criteria associated with a high number of points:
o Conveys ownership for resolving the customer’s reason for call / problem / question, o Soft‐skills criteria (criteria 15 – 19), o Uses active listening skills and solid judgment to assist customer, and, o Effectively explains path to / options for resolution.
On an individual level, all members of the QA team should work to better understand the logic behind the scoring decisions made by the Standard in order to improve scoring consistency. Recommended techniques include:
o Replaying the recordings of calls with above average defect rates followed by an explanation by the Standard about the rational in scoring.
o Creating a single document / database which details scoring decisions and rational for scoring criteria with below average correlation to the Standard / above average defect rates. This document / database will act as an effective point of reference for the Quality Assurance Team and will also aid in training new additions to the Quality Assurance team.
36
Chapter 12: The Importance of Call Coaching
This case‐study of Inter‐rater Reliability Testing has detailed a method by which performance assessment accuracy can be increased and variability among those assessing performance can be mitigated. Just as important as the actual assessment of performance is the manner in which feedback is communicated. In the absence of feedback to the front‐line staff, all the effort placed on ensuring accurate and consistent assessment of performance is wasted. Call monitoring offers two distinct opportunities to provide agents with performance feedback.
1. Near‐Time Call Coaching – These feedback sessions focus on a singular interaction between an agent and a customer. Shortly after an agent’s call is monitored, while the call is still “fresh” in memory, the agent and the QA review the agent’s performance on that one call. The discussion may cover: • Behavior(s) that the agent could benefit from replicating during future calls, • Lost opportunities / challenges during the call and how to best handle similar situations in
the future,
37
• Review of information the agent was unsure of during the call and/or where this information may be accessed in the future, and,
• Review of company business rules / policies that were applicable during the call.
These feedback sessions should be fairly regular, short (5‐10 minutes) discussions of recent calls in which specific examples of “what to do” and “what not to do” can are reviewed.
2. Regular / Ongoing Performance Reviews – These feedback sessions are longer (30‐45 minutes) and focus on an agent’s cumulative performance over a specified period of time (weeks or months). The discussion should focus on trends in the agent’s call monitoring results and comparisons between the agent’s performance and his / her team’s performance. These sessions are best conducted by the agent’s supervisor, team lead or manager (an individual who has visibility to the agent’s complete performance “picture” on and off the call center floor).
39
Additional Resources
1. Customer Intelligence Services and Insights Blog ‐ http://metrics.net/blog/ 2. IRR Blog Series ‐ http://metrics.net/blog/category/inter‐rater‐reliability‐irr‐series/ 3. Survey Pain Relief ‐ http://surveypainrelief.com
4. Follow us on Twitter ‐ http://twitter.com/crmetrics 5. Customer Relationship Metrics website ‐ http://metrics.net/
About Customer Relationship Metrics
Customer Relationship Metrics (CRM) is a customer experience managed services firm founded in 1993 at Purdue University. CRM specializes in Service, Sales, and Metrics Optimization with deep domain expertise in contact centers. Instead of build and buy you rent our tools and expertise.
Risk‐free 2‐10 Guarantee Our work is guaranteed to deliver results.
We can guarantee value that software can’t and won’t.
SEE IT NOW