wp 401 - laxmi rajkumari 401 - laxmi rajkumari - final.pdf · dr. k balaraman, ms. b p vani, dr....
TRANSCRIPT
Performance of PowerSector in Karnatakain the Context ofPower Sector Reforms
Laxmi RajkumariK Gayithri

ISBN 978-81-7791-257-9
© 2017, Copyright Reserved
The Institute for Social and Economic Change,Bangalore
Institute for Social and Economic Change (ISEC) is engaged in interdisciplinary researchin analytical and applied areas of the social sciences, encompassing diverse aspects ofdevelopment. ISEC works with central, state and local governments as well as internationalagencies by undertaking systematic studies of resource potential, identifying factorsinfluencing growth and examining measures for reducing poverty. The thrust areas ofresearch include state and local economic policies, issues relating to sociological anddemographic transition, environmental issues and fiscal, administrative and politicaldecentralization and governance. It pursues fruitful contacts with other institutions andscholars devoted to social science research through collaborative research programmes,seminars, etc.
The Working Paper Series provides an opportunity for ISEC faculty, visiting fellows andPhD scholars to discuss their ideas and research work before publication and to getfeedback from their peer group. Papers selected for publication in the series presentempirical analyses and generally deal with wider issues of public policy at a sectoral,regional or national level. These working papers undergo review but typically do notpresent final research results, and constitute works in progress.
Working Paper Series Editor: Marchang Reimeingam
PERFORMANCE OF POWER SECTOR IN KARNATAKA IN THE
CONTEXT OF POWER SECTOR REFORMS
Laxmi Rajkumari1 and K Gayithri2
Abstract This is an attempt to assess the performance of Karnataka power sector, using select technical and financial performance indicators. A Power Sector Performance Index (PPI) is computed using the methodology used for Human Development Index. Some technical indicators, like energy deficit, installed capacity, per capita electricity consumption, have improved in the post-reform period; nonetheless, the state lagged behind other major Indian states. Total installed capacity and total electricity generation showed significant trend break in 1999; however, the capacity utilisation rate remained quite low. The T&D loss fell tremendously over time. Average revenue realisation rate rose after reform, although the rate differs greatly across consumer categories. Collection efficiency was highest in HESCOM, while the AT&C loss was lowest in MESCOM in 2013-14. Overall, the PPI value increased from 1998-99 to 2012-13 indicating better performance after reform, and, the ranking improved from the 8th to 3rd position, showing improved performance vis-a-vis other states. Key Words: Power sector reform, Karnataka Power Sector, Performance, Power Sector
Performance Index
Introduction
In any sector, reforms ensue mainly because of persisting problems in the sector which fail to improve
over time. Power sector is a very crucial sector for economic growth. The share of power sector in the
total plan outlay is about 10% in the 12th Five-year Plan (Planning Commission, 2013-14). In 2014, the
Government of India launched the 24*7 “Power for All Initiative” with State governments to provide
24*7 power access to all by 2019. However, the sector is marred with numerous problems. There is still
lack of power access in many households. Power shortages, inefficient operational performance and
grave financial situation of the State Electricity Boards (SEBs) were taking a toll on the overall growth of
the economy, as electricity is one of the most important infrastructural inputs in all sectors of the
economy. These problems prompted a series of policy and regulatory changes in the sector. Power
sector is in the Concurrent List, and hence, both the Centre and State have the jurisdiction to make
policy changes. The first major change in the sector at all-India level was opening up of electricity
generation to private sector in 1991, mainly to augment the inadequate resources from public sector,
and enable more capacity building. After that, the wave of World Bank-led power sector reforms swept
across different states in India, which led to unbundling and corporatisation of SEBs, along with setting
up of independent Regulatory Commissions. Further, Electricity Act 2003, considered the major power
1 Research Scholar at CESP, Institute for Social and Economic Change (ISEC), Bangalore, India. E-mail:
[email protected] / [email protected] 2 Professor at CESP, Institute for Social and Economic Change (ISEC), Bangalore, India. Email: [email protected]
This paper is part of Laxmi Rajkumari’s ongoing PhD thesis at ISEC. We sincerely thank Prof. Meenakshi Rajeev, Dr. K Balaraman, Ms. B P Vani, Dr. Elumalai Kannan, Dr. Barun Deb Pal and Prof. D Rajasekhar for all the valuable comments. We would also like to thank the paper referees who have provided many useful comments to improve upon the paper.
Usual disclaimers apply.

2
sector reform in India, unified all existing laws and aimed to introduce competition in the sector. The
reforms were considered essential due to a multitude of problems faced by power sector during that
time.
Karnataka is the 7th largest Indian state by area (5.8% of the total geographic area), with
1,33,57,027 households (Census of India, 2011). However, its electricity industry still faces many
technical and financial problems. The peak deficit and energy deficit in the state are 6.8% and 4.4%
respectively in 2015-16 (Central Electricity Authority, 2016). This poses a serious concern for future
growth and development of the state, as electricity is a key input in the economic activities. Karnataka
undertook power sector reforms in 1999, with the Karnataka Electricity Reforms Act (KERA).
Subsequently, many other reforms and policies were formulated to improve the power sector
performance in Karnataka. The major reforms are listed in Table 1:
Table 1: Major Power Sector Reforms in India and Karnataka
Reform/ Policy Year Feature/ Detail
The Electricity Law (Amendment) Act, 1991
1991 October
Amendment to the Electricity Supply Act 1910 and 1948. Private companies can build, own, and operate power stations subject to certain terms and conditions
Karnataka Electricity Reform Act (KERA)
1999 August
Provisions for establishment of KERC within 90 days, with its functions and powers Restructuring of electricity industry-unbundling of KEB and corporatisation to form KPTCL and VVNL Karnataka Electricity Regulatory Commission (KERC) constituted in Oct 1999 - To regulate the purchase, distribution, supply and utilisation of electricity, and tariff and charges payable as well.
4 Electricity Supply Companies (ESCOMs) were established after unbundling distribution from KPTCL
2002 June
Bangalore Electricity Supply Company (BESCOM) Gulbarga Electricity Supply Company (GESCOM) Hubli Electricity Supply Company (HESCOM) Mangalore Electricity Supply Company (MESCOM)
Electricity Act 2003
Central government initiative “to consolidate the laws relating to generation, transmission, distribution, trading and use of electricity and generally for taking measures conducive to development of electricity industry, promoting competition therein, protecting interest of consumers and supply of electricity to all areas, rationalization of electricity tariff, ensuring transparent policies regarding subsidies, promotion of efficient and environmentally benign policies, constitution of Central Electricity Authority, Regulatory Commissions and establishment of Appellate Tribunal.”
1 more ESCOM formed 2004 Chamundeshwari Electricity Supply Company (CESCOM) Source: Economics Survey of Karnataka, various years; pib.nic.in
3
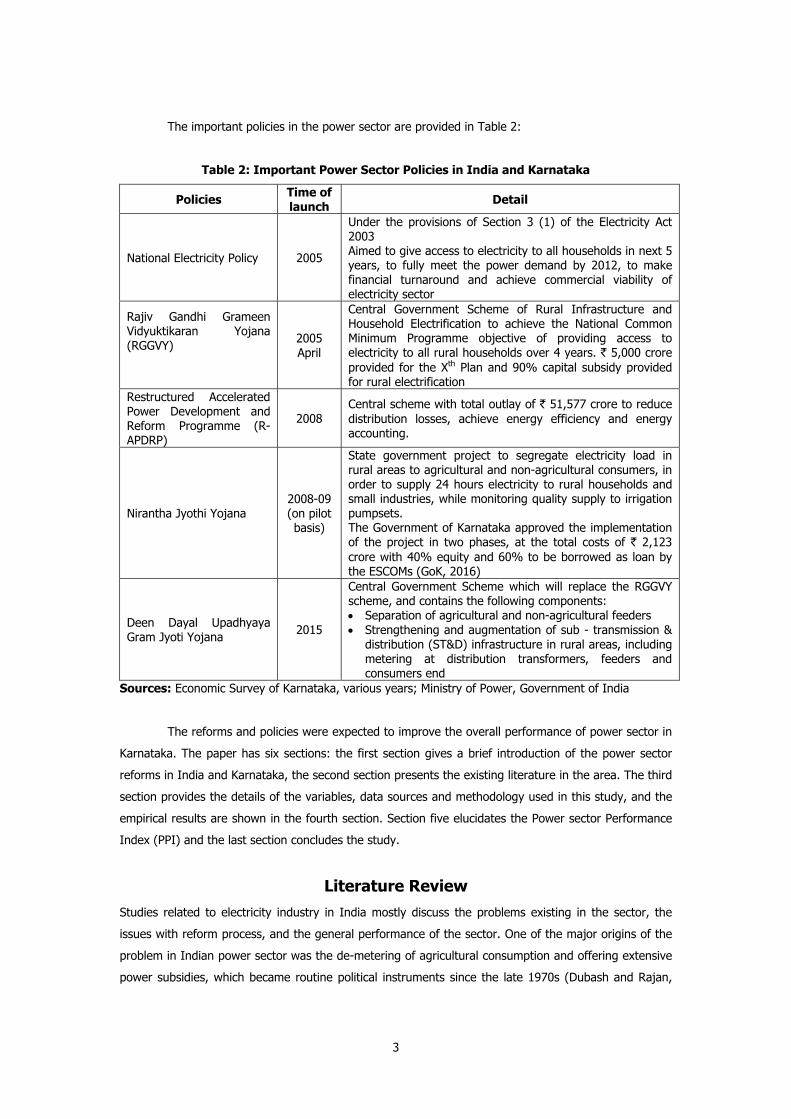
The important policies in the power sector are provided in Table 2:
Table 2: Important Power Sector Policies in India and Karnataka
Policies Time of launch Detail
National Electricity Policy 2005
Under the provisions of Section 3 (1) of the Electricity Act 2003 Aimed to give access to electricity to all households in next 5 years, to fully meet the power demand by 2012, to make financial turnaround and achieve commercial viability of electricity sector
Rajiv Gandhi Grameen Vidyuktikaran Yojana (RGGVY)
2005 April
Central Government Scheme of Rural Infrastructure and Household Electrification to achieve the National Common Minimum Programme objective of providing access to electricity to all rural households over 4 years. ` 5,000 crore provided for the Xth Plan and 90% capital subsidy provided for rural electrification
Restructured Accelerated Power Development and Reform Programme (R-APDRP)
2008 Central scheme with total outlay of ` 51,577 crore to reduce distribution losses, achieve energy efficiency and energy accounting.
Nirantha Jyothi Yojana 2008-09 (on pilot basis)
State government project to segregate electricity load in rural areas to agricultural and non-agricultural consumers, in order to supply 24 hours electricity to rural households and small industries, while monitoring quality supply to irrigation pumpsets. The Government of Karnataka approved the implementation of the project in two phases, at the total costs of ` 2,123 crore with 40% equity and 60% to be borrowed as loan by the ESCOMs (GoK, 2016)
Deen Dayal Upadhyaya Gram Jyoti Yojana 2015
Central Government Scheme which will replace the RGGVY scheme, and contains the following components: • Separation of agricultural and non-agricultural feeders • Strengthening and augmentation of sub - transmission &
distribution (ST&D) infrastructure in rural areas, including metering at distribution transformers, feeders and consumers end
Sources: Economic Survey of Karnataka, various years; Ministry of Power, Government of India
The reforms and policies were expected to improve the overall performance of power sector in
Karnataka. The paper has six sections: the first section gives a brief introduction of the power sector
reforms in India and Karnataka, the second section presents the existing literature in the area. The third
section provides the details of the variables, data sources and methodology used in this study, and the
empirical results are shown in the fourth section. Section five elucidates the Power sector Performance
Index (PPI) and the last section concludes the study.
Literature Review Studies related to electricity industry in India mostly discuss the problems existing in the sector, the
issues with reform process, and the general performance of the sector. One of the major origins of the
problem in Indian power sector was the de-metering of agricultural consumption and offering extensive
power subsidies, which became routine political instruments since the late 1970s (Dubash and Rajan,
4
2001). The State Electricity Boards (SEBs) already had cash flow problems and state governments failed
to compensate them for the subsidies. Hence, cross subsidies from industry started. With industries
turning to captive generation plants, the additional revenues were not able to counter the losses from
agriculture. This added to the commercial losses of the SEBs.
One of the key motivations for power sector reform in developing countries, including India,
was to improve financial state and attract private capital to the power sector, to reduce the burden on
the public sector budget (Jamasb, Newberry and Pollitt, 2005; Singh, 2006). Private sector was allowed
in generation in 1991 to augment the inadequate resources. However, during the 1990s, the
Independent Power Producers (IPPs) and the State Electricity Boards (SEBs) faced numerous problems
in executing the required goals in due time. The private sector had not contributed significantly in the
early 1990s, due to the problems faced by the Independent Power Producers (IPPs) in
litigation/renegotiation of Power Purchase Agreements (PPAs), in financing, in risk sharing (eg.
construction risk, market risk, fuel supply risk), in obtaining clearances (like cost estimate clearance,
techno-economic clearance, water-availability clearance, pollution clearance, forest and environment
clearance, etc), and in obtaining fuel linkage agreements (like licences for importing fuel). Public sector
still remained a major player in the sector. Also, the proposed tariffs at private plants appear to be
higher than those by state undertakings (D’Sa, Murthy and Reddy, 1999; Kannan and Pillai, 2002;
Ninan, 2012).
Further, vertically integrated SEBs were unbundled into generation, transmission and
distribution entities, and independent regulatory commissions were formed. Further, the Electricity Act
2003 also introduced numerous policy changes, like licence-free thermal generation, non-discriminatory
access to transmission system, multiple licensees, which aimed to introduce competition in the power
market. The distribution segment requires to be improved tremendously to achieve long term sustained
growth of the power sector (Singh, 2006).
Jamasb et al (2005) presented empirical studies focusing on the determinants and key steps of
reforms, as well as the impact of the reforms measures on the performance indicators. Few important
works mentioned in their paper were: Steiner (2001) that found positive and significant correlation
between utilisation rate and private ownership as well as unbundling of generation and transmission,
from panel data analysis of 19 OECD countries for the period 1987-1996; Zhang, Parker and Kirkpatrick
(2002) who showed privatisation will lead to increased capacity and higher output, provided it is
accompanied by competition and independent regulation; Plane (1999), Hattori (1999), Delmas et al
(2003) so on who studied the impact of different parts of reforms on the efficiency of production. The
paper concluded that electricity sector reform has remained a work-in-progress, and there is
considerable scope of learning from lessons around the world; however, there is a need for a more up-
to-date analysis. Basically, the review of the reform pointed out that there is a great need for
comprehensive, high quality data which would help in clearly defining and measuring the indicators to
assess, monitor and compare reforms.
The performance of Indian power sector during 1991-2001 was studied by Sharma, Nair and
Balasubramanian (2005) using select technical and economic indicators. They found that the
restructuring that initiated in 1991 had not improved the technical efficiency, financial position and
5
customer satisfaction. The social objectives of providing access to all also could not be fulfilled
effectively. Bhattacharya and Patel (2007) also analysed the efficacy of power sector reform in India,
through the change in commercial orientation of the utilities. They calculated an Index of Revenue
Orientation (IRO) for 2001-02 and 2004-05, and observed that the sector is still not financially viable,
and the AT&C losses are still high. Some states improved more significantly than other states. The
variability across states and even between utilities within states is highly significant.
A World Bank study also assessed the financial performance of India's power sector through a
state performance index created using the analytical hierarchy process (AHP) method with 11 variables
during a five-year period - 2005-06 to 2009-10 (Khurana and Banerjee, 2015). They showed that
Gujarat, West Bengal and Himachal Pradesh occupied the top positions in the 5-year period. Karnataka's
financial performance was poor; however, it improved immensely in the last two years to occupy the
4th rank in 2009-10. Uttar Pradesh, Bihar and Madhya Pradesh continued to be the worst performers
over the 5-year period. The study concluded that power purchase costs played a key role in the
worsening finances of the utilities, the High Tension/Low Tension ratio played a significant role in T&D
losses and consequently in power purchase costs, and regular tariff revisions helped in recovering the
rising costs.
A comprehensive study focusing on the power sector performance in Karnataka alone covering
recent years seems to be lacking in literature. Sakri, Nagabhushan and Khaparde (2006) discussed the
Karnataka power sector reforms and policy changes, including private sector participation since 1991,
Electricity Regulatory Commissions Act 1998, Electricity Act 2003, Accelerated Power Development and
Reform Programme (APDRP), so on. However, this study was mostly a discussion and did not critically
analyse the performance of the sector in the pre- and post-reform periods. Hence, this paper would
endeavour to provide a macro study of the overall performance of Karnataka power sector in the
context of the reforms.
Variables, Data Sources and Methodology
Variables: The power sector performance in Karnataka would be evaluated through different variables related to
the technical and financial aspects of the sector. Sharma et al (2005) analysed the performance of
Indian power sector by grouping variables under two important types of indicators - Technical
Indicators and Economic Indicators. This study would use a similar approach, although with
modifications in the variables and the years, in order to observe the pre- and post-reform period. Firstly,
we take the reform year in Karnataka as 1999, as Karnataka Electricity Reform Act, 1999, was the major
reform which unbundled and corporatized KEB to form KPTCL and VVNL, along with KERC as an
independent regulator.
The study categorises the indicators into 1] Technical indicators, and 2] Economic/ Financial
indicators, the details of which are listed in Table 3. Some of these indicators are studied by Sharma et
al (2005) through descriptive analysis.

6
Table 3: Select Performance Indicators of Power Sector
Variables Detail/ definition Explanation
TECHNICAL INDICATORS
Energy deficit (%) Energy requirement - availability Gap between electricity demand and supply
Peak power deficit (percentage) Gap in the peak demand and peak met Indicates the gap between the peak
demand and peak met
Addition of Installed capacity - By different modes: • Total (MW) • Hydro (MW) • Thermal (MW) • RES (MW)
Installed capacity (IC) is the maximum electric output a generator can produce under specific conditions
IC can be by modes of • hydro-electric generation • different types of thermal electricity
generation • renewable Energy Sources (RES)
Addition of IC indicates addition of investment in power generation Different modes of generation have different positive and negative aspects.
Addition of Installed capacity - By Ownership • By public sector (MW) • By Private sector (MW)
IC by public sector and private sector Growth of IC by public and private sector reflects the reform impact
Growth of Electricity generation (%)
Generation is the actual electricity generated from the IC in a specific amount of time
How much of the IC is actually generated, which reflects the inefficiency in generation process
Capacity Utilisation (kWh/kW) %
Actual generation (kWh) / Installed capacity (kW)
Actual electricity generation / Maximum electrical output that can be generated from the IC at 100% capacity in a given year
The ratio of actual generation to maximum electricity output from the IC in a year, which signifies the percentage utilisation of capacity
Transmission and Distribution (T&D) loss (%)
Loss in energy during the transmission and distribution of electricity from point of generation to end-users
Shows the condition of the technology and efficiency of transmission system
Per capita consumption of electricity (kWh)
Total gross energy available (utilities+non-utilities) / Population
Indicator of the level of electricity access to end users, which signifies the level of power sector development
Rural Electrification (%)
Percentage of villages electrified Rural households electrified
Reflects the progress of many policies aimed to provide electricity access to all
ECONOMIC INDICATORS
Average tariff of electricity (Paise/ kWh)
Average price of per unit of electricity provided to end users
Lower tariffs are favourable for consumers; however, utilities need to cover the supply cost.
Unit cost of power supply (paise/ kWh) Cost of supplying one unit of power Cost of power supply should ideally
decline with better performance Average revenue recovery as % of Cost (%) Average tariff*100/ Unit cost of supply Important factor for sound financial
health of the utilities
Collection efficiency (%) = (Revenue realised* 100)/ Revenue billed
Important indicator of commercial orientation of the utility, as it shows the percentage of revenue realised vis-a-vis revenue billed
Aggregate Technical & Commercial (AT&C) loss (%)
= [Units input - Units realised]*100/ Units input
Where, Units realised = Units billed * collection efficiency
Indicates both the technical and commercial losses in energy
Source: Compiled by the authors
7
Data Sources The data for above variables are taken from different sources, as shown below:
• General Review (All-India Electricity Statistics), Central Electricity Authority, Ministry of Power
Government of India,
• Annual Report on the working of State Power Utilities and Electricity Departments, Planning
Commission, Government of India,
• TERI Energy Data Directory and Year Books (TEDDY), Tata Energy Research Institute, New Delhi.
Methodology for Trend Break Analysis To check if there was a significant break in the trend in/after the reform year (1999), trend break
analysis using dummy variable is considered a better method, as it allows to check for breaks in
different years, in contrast to Chow test for structural stability, which has to assume a specific year. In
addition, the trend break analysis gives the significance for intercept and slope, which Chow test does
not give. Trend break analysis using dummy variables is, thus, conducted for many important
indicators; however, the results are shown only for those variables which show significant breaks,
namely, Total Installed capacity, Public Installed capacity, Total Electricity Generation, Public Electricity
Generation, Per capita electricity consumption, and Transmission & Distribution loss (T&D loss).
The periods of study are 1980-81 to 2014-15 for installed capacity; 1980-81 to 2011-12 for
electricity generation; 1991-92 to 2014-15 for Public Installed capacity, Public generation, and Per
capita electricity consumption; and 1991-92 to 2012-13 for T&D loss. The units of Installed capacity,
Electricity Generation, Per capita electricity consumption, and T&D loss are megaWatt (MW), GigaWatt
hour (GWh) or million units (MU), kiloWatt hour (kWh), and percentage (%) of availability, respectively.
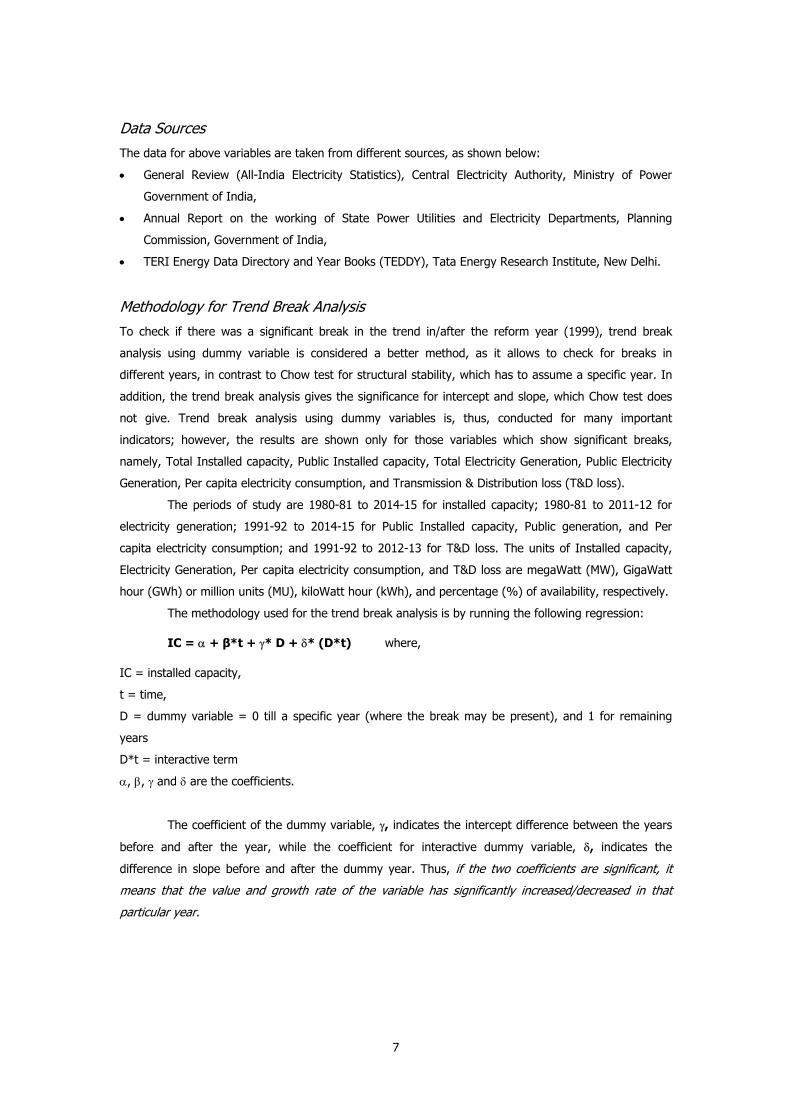
The methodology used for the trend break analysis is by running the following regression:
IC = α + β*t + γ* D + δ* (D*t) where,
IC = installed capacity,
t = time,
D = dummy variable = 0 till a specific year (where the break may be present), and 1 for remaining
years
D*t = interactive term
α, β, γ and δ are the coefficients.
The coefficient of the dummy variable, γ, indicates the intercept difference between the years
before and after the year, while the coefficient for interactive dummy variable, δ, indicates the
difference in slope before and after the dummy year. Thus, if the two coefficients are significant, it
means that the value and growth rate of the variable has significantly increased/decreased in that
particular year.
8
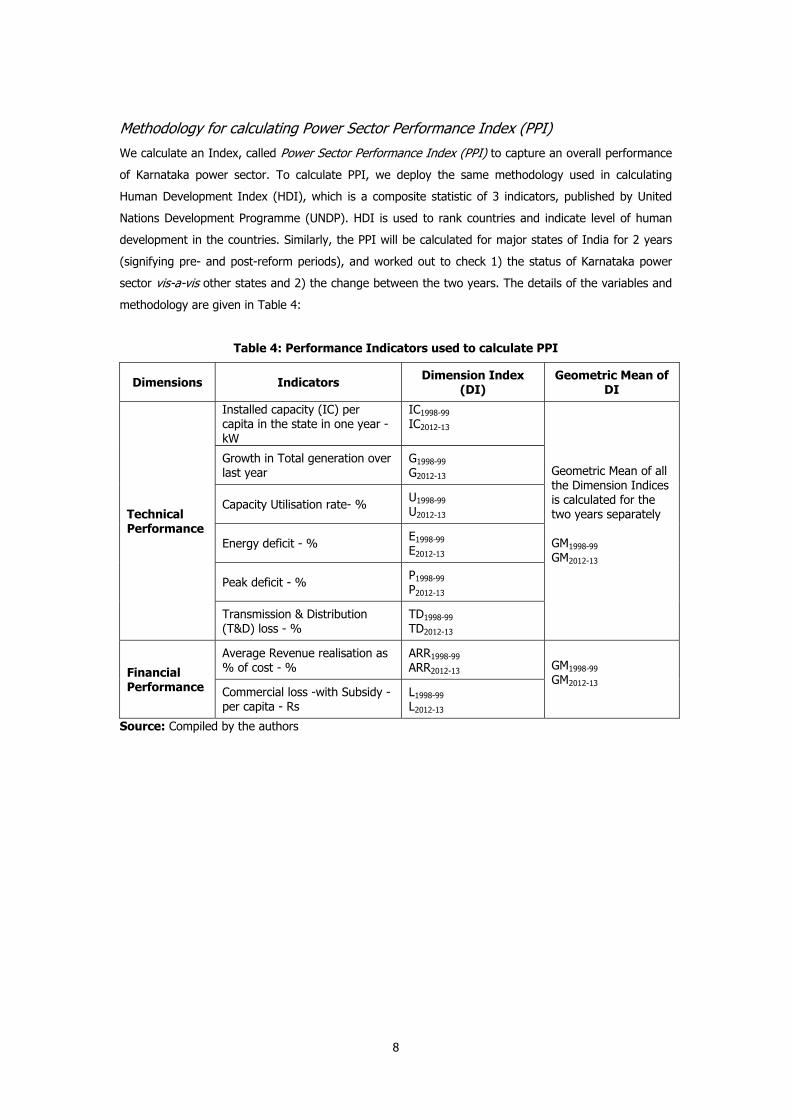
Methodology for calculating Power Sector Performance Index (PPI) We calculate an Index, called Power Sector Performance Index (PPI) to capture an overall performance
of Karnataka power sector. To calculate PPI, we deploy the same methodology used in calculating
Human Development Index (HDI), which is a composite statistic of 3 indicators, published by United
Nations Development Programme (UNDP). HDI is used to rank countries and indicate level of human
development in the countries. Similarly, the PPI will be calculated for major states of India for 2 years
(signifying pre- and post-reform periods), and worked out to check 1) the status of Karnataka power
sector vis-a-vis other states and 2) the change between the two years. The details of the variables and
methodology are given in Table 4:
Table 4: Performance Indicators used to calculate PPI
Dimensions Indicators Dimension Index (DI)
Geometric Mean of DI
Technical Performance
Installed capacity (IC) per capita in the state in one year - kW
IC1998-99
IC2012-13
Geometric Mean of all the Dimension Indices is calculated for the two years separately GM1998-99
GM2012-13
Growth in Total generation over last year
G1998-99
G2012-13
Capacity Utilisation rate- % U1998-99
U2012-13
Energy deficit - % E1998-99
E2012-13
Peak deficit - % P1998-99
P2012-13
Transmission & Distribution (T&D) loss - %
TD1998-99
TD2012-13
Financial Performance
Average Revenue realisation as % of cost - %
ARR1998-99
ARR2012-13 GM1998-99
GM2012-13
Commercial loss -with Subsidy - per capita - Rs
L1998-99
L2012-13
Source: Compiled by the authors

9
The details of time period and states are shown in Table 5:
Table 5: Details of Time Period, States and Methodology used to Calculate PPI
Features Detail Explanation
Years
1998-99 2012-13
Before power sector reform in Karnataka in 1999 (KERA) Signifying After-reform period Start of 12th Five-year plan Most recent period for which the data for all variables are available for all states
States 17
Data for all the variables are available for the 2 years only in 17 states [The details of missing data in states are shown in Appendix]
Formula used to calculate Dimension Index (DI) of indicators
Where, Minimum value = Global Minimum of the values in 2 years Maximum value = Global Maximum Geometric mean of DI of all indicators under the 2 Dimensions are taken for each year - GM1 and GM2
The formula is the same as used in HDI calculation and can be used to derive at an Index to rank the states according to the power sector performance. The HDI calculation methodology has been critiqued to have some limitations. A few important limitations are that it is overly simplistic with little conceptual/ theoretical basis, and there are issues with functional form of HDI, mainly relating substitutability assumptions with additive form, normalization of indicators, and choice of equal weight (Klugman, et.al.,2011). However, it could be used to get a broad picture of the performance, as it has used geometric mean, and the indicators are equally important to be assigned different weights.
Formula to derive PPI PPI = Geometric mean of GM1 and GM2
The PPI of the 2 years is used to rank the states and check the change in ranking as well.
Source: Compiled by the authors
The modifications and adjustments to the original methodology made for the negative
indicators are as follows:
• For the negative indicators, like energy deficit, the Dimension Index is adjusted as: Adjusted DI =
1 - DI, which makes it consistent with positive indicators for index calculation.
• For positive indicators, the Global Minimum is reduced by 10%, while for the negative indicators,
the Global Maximum is increased by 10% before using in the formula. This is for convenience in
calculations and does not harm the consistency and comparability of the Index across time.
10
Empirical Results
Technical Indicators
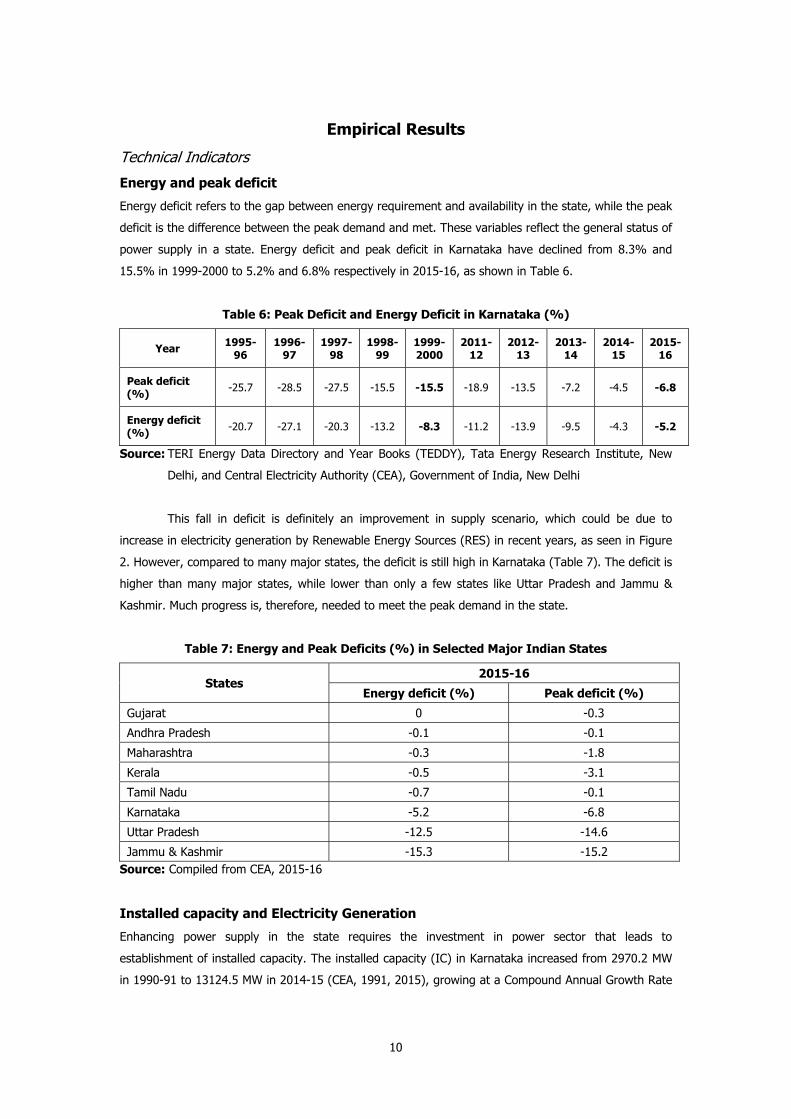
Energy and peak deficit
Energy deficit refers to the gap between energy requirement and availability in the state, while the peak
deficit is the difference between the peak demand and met. These variables reflect the general status of
power supply in a state. Energy deficit and peak deficit in Karnataka have declined from 8.3% and
15.5% in 1999-2000 to 5.2% and 6.8% respectively in 2015-16, as shown in Table 6.
Table 6: Peak Deficit and Energy Deficit in Karnataka (%)
Year 1995-96
1996-97
1997-98
1998-99
1999-2000
2011-12
2012-13
2013-14
2014-15
2015-16
Peak deficit (%) -25.7 -28.5 -27.5 -15.5 -15.5 -18.9 -13.5 -7.2 -4.5 -6.8
Energy deficit (%) -20.7 -27.1 -20.3 -13.2 -8.3 -11.2 -13.9 -9.5 -4.3 -5.2
Source: TERI Energy Data Directory and Year Books (TEDDY), Tata Energy Research Institute, New
Delhi, and Central Electricity Authority (CEA), Government of India, New Delhi
This fall in deficit is definitely an improvement in supply scenario, which could be due to
increase in electricity generation by Renewable Energy Sources (RES) in recent years, as seen in Figure
2. However, compared to many major states, the deficit is still high in Karnataka (Table 7). The deficit is
higher than many major states, while lower than only a few states like Uttar Pradesh and Jammu &
Kashmir. Much progress is, therefore, needed to meet the peak demand in the state.
Table 7: Energy and Peak Deficits (%) in Selected Major Indian States
States 2015-16
Energy deficit (%) Peak deficit (%)
Gujarat 0 -0.3
Andhra Pradesh -0.1 -0.1
Maharashtra -0.3 -1.8
Kerala -0.5 -3.1
Tamil Nadu -0.7 -0.1
Karnataka -5.2 -6.8
Uttar Pradesh -12.5 -14.6
Jammu & Kashmir -15.3 -15.2 Source: Compiled from CEA, 2015-16
Installed capacity and Electricity Generation
Enhancing power supply in the state requires the investment in power sector that leads to
establishment of installed capacity. The installed capacity (IC) in Karnataka increased from 2970.2 MW
in 1990-91 to 13124.5 MW in 2014-15 (CEA, 1991, 2015), growing at a Compound Annual Growth Rate

11
(CAGR) of about 6.4%. The trend of growth in total IC, IC by public sector and private sector are shown
in Figure 1.
Figure 1: Installed Capacity (by ownership) in Karnataka - MW
Source: Compiled from General Review, CEA, various years
The growth of IC by public sector is slowing down while that of private sector is rising. In
2014-15, the Public IC declined by about 894 MW from previous year, while Private IC increased by
1419 MW. The private sector capacity seems to have continuously risen since the mid-2000s. The
installed capacity by different modes, namely, Thermal, Hydro and Renewable Energy Sources (RES),
are shown in Figure 2.
Figure 2: Installed Capacity (by modes) in Karnataka - MW
Source: Compiled from General Review, CEA, various years
In terms of modes of production, the thermal mode has overtaken the hydro mode around
2010-11, and is contributing the most to total IC in recent years, while the hydro IC has slowly declined
over the years. The RES mode has increased tremendously since 2003-04, probably due to huge
0
2000
4000
6000
8000
10000
12000
14000
1990
‐91
1991
‐92
1992
‐93
1993
‐94
1994
‐95
1995
‐96
1996
‐97
1997
‐98
1998
‐99
1999
‐00
2000
‐01
2001
‐02
2002
‐03
2003
‐04
2004
‐05
2005
‐06
2006
‐07
2007
‐08
2008
‐09
2009
‐10
2010
‐11
2011
‐12
2012
‐13
2013
‐14
2014
‐15
Inst
alle
d ca
paci
ty (
MW
)
Total IC Public sector IC Private sector IC
0
1000
2000
3000
4000
5000
6000
1990
‐91
1991
‐92
1992
‐93
1993
‐94
1994
‐95
1995
‐96
1996
‐97
1997
‐98
1998
‐99
1999
‐2000
2000
‐01
2001
‐02
2002
‐03
2003
‐04
2004
‐05
2005
‐06
2006
‐07
2007
‐08
2008
‐09
2009
‐10
2010
‐11
2011
‐12
2012
‐13
2013
‐14
2014
‐15
Inst
alle
d ca
paci
ty b
y fi
ffer
ent
mod
es -
MW
Hydro Thermal Res

12
encouragement to set up more IC through RES, as it utilizes the naturally available resources, has lesser
environmental effects, and helps utilities shift from inadequate resources like coal. About 67% of the
private IC is under RES, and remaining 33% in thermal mode.
IC is the maximum electric output that can be generated; however, the actual generation is
usually lesser than the maximum output, depending on the production efficiency of the plants. Hence, it
is important to check the growth in actual electricity generation vis-a-vis growth in IC. Table 8 gives the
Average Annual growth rates (AAGR) of IC and generation in the pre- and post-reform periods. The
private sector IC is growing at the highest rate at 29.7% in the post-reform period. The pre-reform
period AAGR of Private IC is abnormally high because there was a sudden increase in IC in 1998-99
from a very small base. If we observe the post-reform period, the growth rate in total IC (8.4%) is
more than that in electricity generation (7.7%), which indicates that the actual generation might be
lagging behind despite addition of IC, due to inefficient production or technological constraints.
Table 8: Average Annual Growth Rates, AAGR (%) of IC and Total Generation in Karnataka
Period Total IC Public IC Private IC Total Generation
Pre-reform 1991-92 to 1998-99 3.8 3.2 68.2 5.1
Post-reform 1999-2000 to 2012-13 8.4 4.9 29.7 7.7
Source: Computed by the authors
Trend Break Analysis
It is imperative to check whether the observed increase in Total Installed capacity and Total Generation
is statistically significant, and if there is significant break in the trend after the reform in 1999.
Total Installed Capacity
For total installed capacity, the regression is run in log model for 35 years from 1980-81 to 2014-15, to
capture the trend in growth rate of total installed capacity:
lnIC = α + β*time + γ* D99 + δ*(D99*time)
where, lnIC = log (Installed capacity)
D99 = 0 for years till 1998-99, = 1 for years from 1999-2000 onwards.
There is autocorrelation in the regression; hence, the regression is run after correcting for
autocorrelation.
13
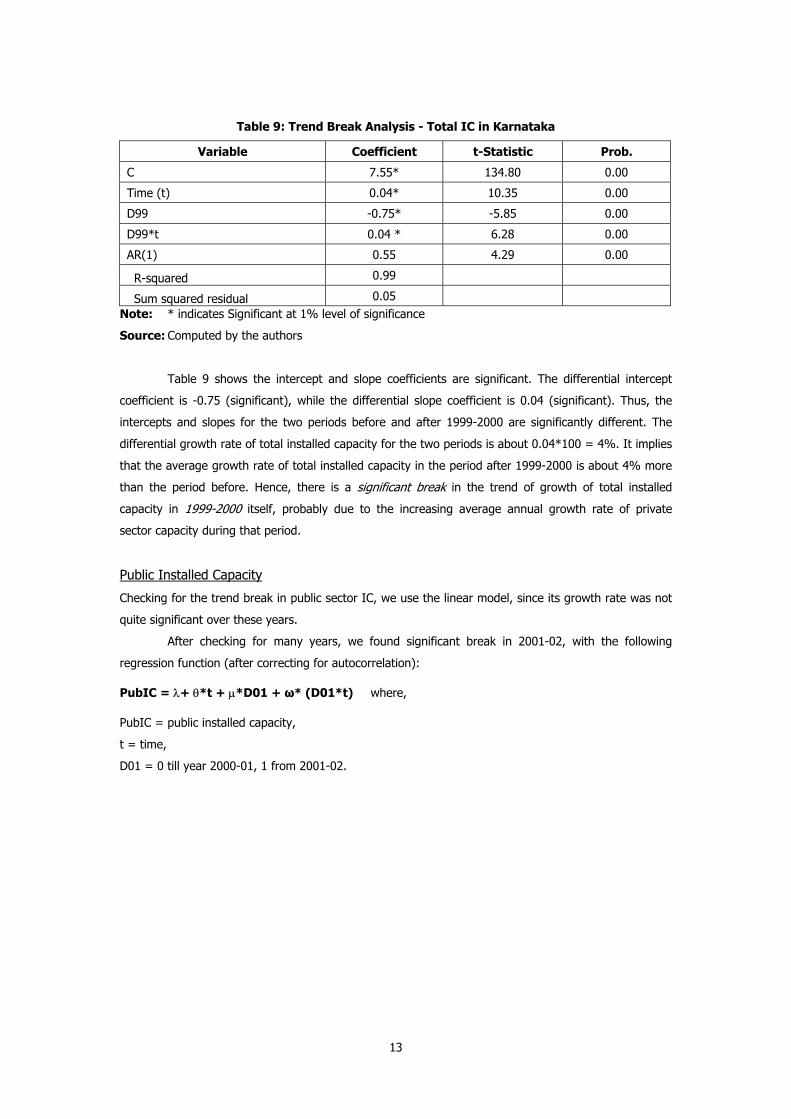
Table 9: Trend Break Analysis - Total IC in Karnataka
Variable Coefficient t-Statistic Prob.
C 7.55* 134.80 0.00
Time (t) 0.04* 10.35 0.00
D99 -0.75* -5.85 0.00
D99*t 0.04 * 6.28 0.00
AR(1) 0.55 4.29 0.00
R-squared
0.99
Sum squared residual
0.05 Note: * indicates Significant at 1% level of significance
Source: Computed by the authors
Table 9 shows the intercept and slope coefficients are significant. The differential intercept
coefficient is -0.75 (significant), while the differential slope coefficient is 0.04 (significant). Thus, the
intercepts and slopes for the two periods before and after 1999-2000 are significantly different. The
differential growth rate of total installed capacity for the two periods is about 0.04*100 = 4%. It implies
that the average growth rate of total installed capacity in the period after 1999-2000 is about 4% more
than the period before. Hence, there is a significant break in the trend of growth of total installed
capacity in 1999-2000 itself, probably due to the increasing average annual growth rate of private
sector capacity during that period.
Public Installed Capacity
Checking for the trend break in public sector IC, we use the linear model, since its growth rate was not
quite significant over these years.
After checking for many years, we found significant break in 2001-02, with the following
regression function (after correcting for autocorrelation):
PubIC = λ+ θ*t + µ*D01 + ω* (D01*t) where,
PubIC = public installed capacity,
t = time,
D01 = 0 till year 2000-01, 1 from 2001-02.

14
The results of the regression are shown in Table 10:
Table 10: Trend Break Analysis Result - Public IC in Karnataka
Variable Coefficient t-Statistic Prob. c 1623.00* 13.81 0.00 T 112.45* 12.74 0.00 D01 -3384.56* -8.05 0.00 D01*t 156.84* 9.25 0.00 AR (1) 0.28 1.58 0.12 R-square 0.99 Sum squared residual 780469.00
Notes: * indicates Significant at 1% level of significance
Source: Computed by the authors
Both the intercept and slope coefficients are significant, indicating the presence of significant
break in the trend of public installed capacity in 2001-02. The total IC growth shows significant break in
1999-2000, while the public IC indicates break in 2001-02, reflecting that the trend break in total IC in
1999-2000 is potentially due to the increasing growth in private sector installed capacity. The private
sector entered the market around 1992-93 and increased suddenly in 1998-99, after which the capacity
addition continuously rose. The growth rates of the private installed capacity are quite fluctuating,
especially during the mid- to late 1990s. Hence, using regression or average annual growth rates give
misleading results.
Total Generation
For total generation also, we found break in 1999-2000 as well, running the following regression:
Gen = θ + λ*T + ω*D99 + T*(T*D99)
where, Gen = Total generation,
T= time,
D99 = dummy variable = 0 before 1999-2000, 1 for period after
θ, λ, ω, τ - intercept and co-efficient
Table 11: Trend Break Analysis Result - Total Generation in Karnataka
Variable Coefficient t-Statistic Prob. C 5068.23** 2.15 0.04 T 582.49* 3.16 0.00 D99 -25205.4* -3.38 0.00 D99*T 1333.78* 3.77 0.00 AR (1) 0.52 2.47 0.02 R-squared 0.97
Notes: **indicates Significant at 5% level of significance,
* indicates Significant at 1% level of significance
Source: Computed by the authors
15
Table 11 shows that the increase in the value after 1999-2000 is statistically significant, which
might be due to the policies implemented since 1990, which encouraged private sector participation in
generation, and not an immediate result of the 1999 reform. Further, we investigated if there was
significant break in the trend of public and private sector generation separately. Public sector generation
did not have any significant break in any year from mid-1990s to mid-2000s, even though public IC
exhibited break in 2001-02.
Private Sector Generation
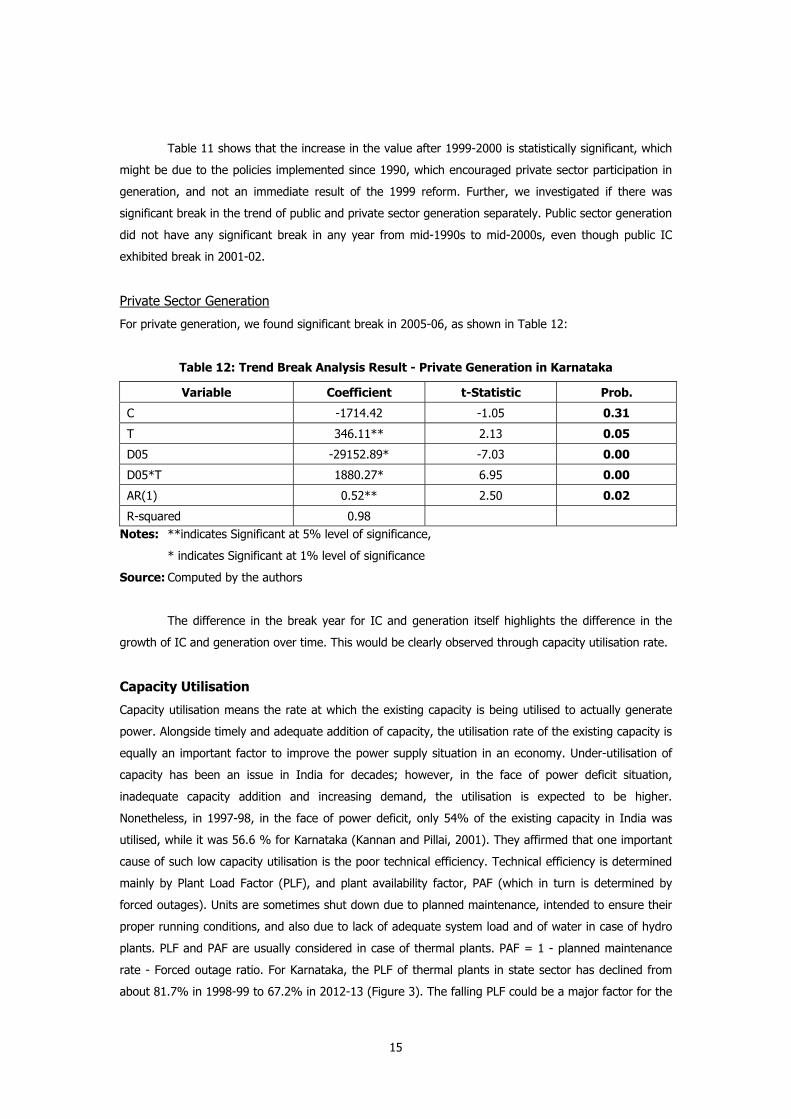
For private generation, we found significant break in 2005-06, as shown in Table 12:
Table 12: Trend Break Analysis Result - Private Generation in Karnataka
Variable Coefficient t-Statistic Prob.
C -1714.42 -1.05 0.31
T 346.11** 2.13 0.05
D05 -29152.89* -7.03 0.00
D05*T 1880.27* 6.95 0.00
AR(1) 0.52** 2.50 0.02
R-squared 0.98 Notes: **indicates Significant at 5% level of significance,
* indicates Significant at 1% level of significance
Source: Computed by the authors
The difference in the break year for IC and generation itself highlights the difference in the
growth of IC and generation over time. This would be clearly observed through capacity utilisation rate.
Capacity Utilisation
Capacity utilisation means the rate at which the existing capacity is being utilised to actually generate
power. Alongside timely and adequate addition of capacity, the utilisation rate of the existing capacity is
equally an important factor to improve the power supply situation in an economy. Under-utilisation of
capacity has been an issue in India for decades; however, in the face of power deficit situation,
inadequate capacity addition and increasing demand, the utilisation is expected to be higher.
Nonetheless, in 1997-98, in the face of power deficit, only 54% of the existing capacity in India was
utilised, while it was 56.6 % for Karnataka (Kannan and Pillai, 2001). They affirmed that one important
cause of such low capacity utilisation is the poor technical efficiency. Technical efficiency is determined
mainly by Plant Load Factor (PLF), and plant availability factor, PAF (which in turn is determined by
forced outages). Units are sometimes shut down due to planned maintenance, intended to ensure their
proper running conditions, and also due to lack of adequate system load and of water in case of hydro
plants. PLF and PAF are usually considered in case of thermal plants. PAF = 1 - planned maintenance
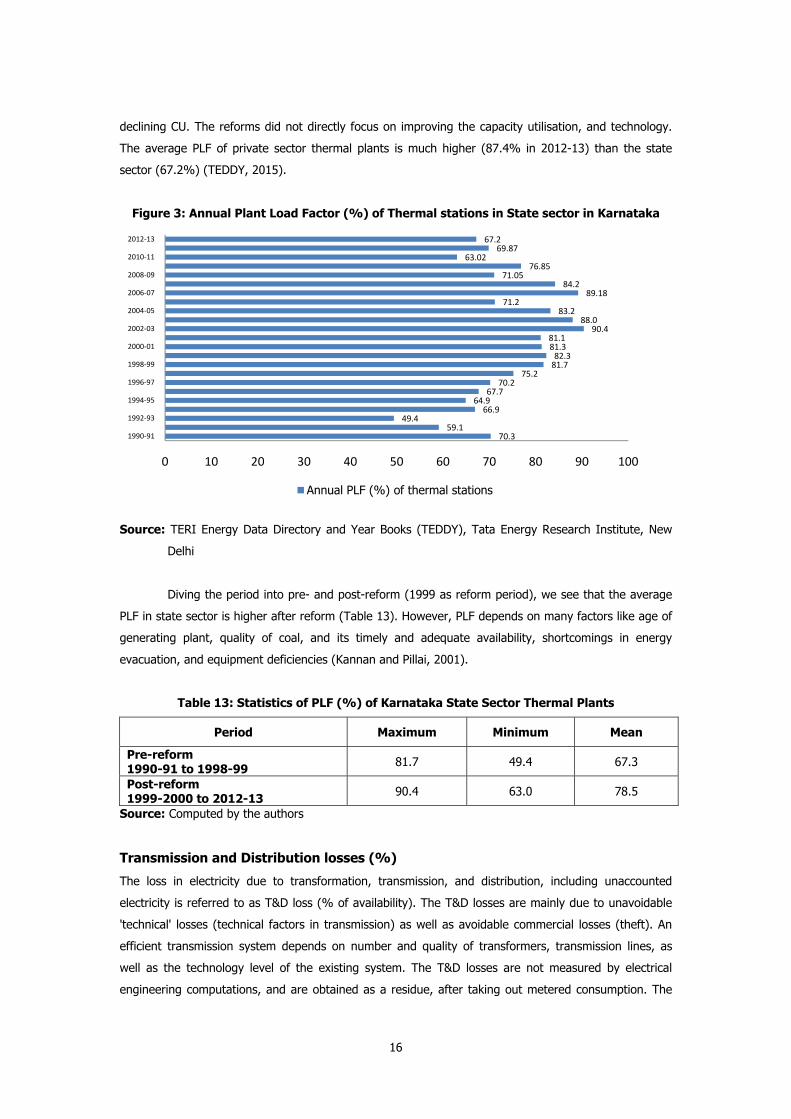
rate - Forced outage ratio. For Karnataka, the PLF of thermal plants in state sector has declined from
about 81.7% in 1998-99 to 67.2% in 2012-13 (Figure 3). The falling PLF could be a major factor for the
16
declining CU. The reforms did not directly focus on improving the capacity utilisation, and technology.
The average PLF of private sector thermal plants is much higher (87.4% in 2012-13) than the state
sector (67.2%) (TEDDY, 2015).
Figure 3: Annual Plant Load Factor (%) of Thermal stations in State sector in Karnataka
Source: TERI Energy Data Directory and Year Books (TEDDY), Tata Energy Research Institute, New
Delhi
Diving the period into pre- and post-reform (1999 as reform period), we see that the average
PLF in state sector is higher after reform (Table 13). However, PLF depends on many factors like age of
generating plant, quality of coal, and its timely and adequate availability, shortcomings in energy
evacuation, and equipment deficiencies (Kannan and Pillai, 2001).
Table 13: Statistics of PLF (%) of Karnataka State Sector Thermal Plants
Period Maximum Minimum Mean
Pre-reform 1990-91 to 1998-99 81.7 49.4 67.3
Post-reform 1999-2000 to 2012-13 90.4 63.0 78.5
Source: Computed by the authors
Transmission and Distribution losses (%)
The loss in electricity due to transformation, transmission, and distribution, including unaccounted
electricity is referred to as T&D loss (% of availability). The T&D losses are mainly due to unavoidable
'technical' losses (technical factors in transmission) as well as avoidable commercial losses (theft). An
efficient transmission system depends on number and quality of transformers, transmission lines, as
well as the technology level of the existing system. The T&D losses are not measured by electrical
engineering computations, and are obtained as a residue, after taking out metered consumption. The
70.359.1
49.466.9
64.967.7
70.275.2
81.782.381.381.1
90.488.0
83.271.2
89.1884.2
71.0576.85
63.0269.87
67.2
0 10 20 30 40 50 60 70 80 90 100
1990‐91
1992‐93
1994‐95
1996‐97
1998‐99
2000‐01
2002‐03
2004‐05
2006‐07
2008‐09
2010‐11
2012‐13
Annual PLF (%) of thermal stations

17
0510152025303540
T&D loss (% of availability)
KEB's assignment of T&D losses was suspect, as the reported T&D losses from 1984 to 1994 was
decreasing, even though the load of LT load was increasing (as, without major system improvements,
T&D losses should increase with increase in share of LT loads) (Reddy et al, 1997). Figure 4 shows that
T&D loss in Karnataka has come down tremendously from about 37.3% in 1999-2000 to 11.1% in
2012-13, indicating improvement in transmission mechanism. However, due to lack of proper
calculations or measurements, it is difficult to definitely point to a real decline in the energy loss.
Figure 4: Transmission and Distribution Losses (% of availability) in Karnataka
Source: CEA and TERI Energy Data Directory and Year Books (TEDDY), Tata Energy Research
Institute, New Delhi
Trend Break Analysis
The trend break analysis also showed that the T&D loss exhibited significant break in 1999-2000, as
shown in Table 14:
Table 14: Trend break analysis result- T&D loss (%) in Karnataka
Variable Coefficient t-Statistic Prob.
C 16.20* 6.39 0.00
T 0.88** 1.76 0.09
D99 35.77* 8.34 0.00
D99*T -2.71* -4.95 0.00
R-squared 0.82 Notes: **indicates Significant at 10% level of significance,
* indicates Significant at 1% level of significance
Source: Computed by the authors

18
Table 15: T&D Loss (% of availability) in Selected Major Indian States
States T&D loss as % of availability
2013-14 2014-15
Karnataka 10.2 11.5
Tamil Nadu 10.8 11.1
Gujarat 18.1 19.28
Kerala 14.9 15.4
Andhra Pradesh 20.1 17.9
Maharashtra 21.8 20.4
Bihar 47.3 46.3
Jammu & Kashmir 54.7 53.1 Source: CEA, 2014
Table 15 highlights that T&D loss in Karnataka slightly rose from 10.2% to 11.5% in 2014-15;
nonetheless, it is still lower than other major states (CEA, 2016), reflecting better transmission and
distribution system in the state.
Per capita electricity consumption
This is another important indicator of power sector performance, as it reflects the per capita
consumption level by consumers, and indirectly the accessibility of electricity to all population. As shown
in Figure 5, the annual per capita consumption of electricity (utilities and non-utilities) in Karnataka has
slowly increased over the years. The AAGR in the pre-reform period is 2.7%, while that in the post-
reform period is 9.2%, which is a tremendous sign.
Figure 5: Per Capita Electricity Consumption (kWh) in Karnataka
Source: CEA and TERI Energy Data Directory and Year Books (TEDDY), Tata Energy Research Institute,
New Delhi
Post-reform AAGR = 9.2 % Pre-reform AAGR = 2.7%
296 296 303 328 364 363 340387
349387 412 428
611 642 660720
806844 854 873
925
10811129.1
0
200
400
600
800
1000
1200
Per capita electricity con
sumption
(kWh)

19
Trend Break Analysis
The Per capita electricity consumption (pcec) trend shows a significant break in 1998-99, as shown in
Table 16:
Table 16: Trend Break Analysis Result - Per Capita Electricity Consumption (pcec) in
Karnataka
Variable Coefficient t-Statistic Prob. C 285.57* 9.48 0.00 T 13.64** 2.03 0.06 D98 -395.45* -9.38 0.00 D98*T 41.43* 5.95 0.00 R-squared 0.99
Notes: **indicates Significant at 10% level of significance,
* indicates Significant at 1% level of significance
Source: Computed by the authors
Electricity consumption is highly associated with economic growth. Many studies have revealed
causality relations between these two variables in either way, or both ways. Whether electricity
consumption precedes economic growth, or, vice versa, has been a topic of great interest for many
researchers, who studied the direction of causality between the two, for different countries, different
years, and with different methodologies, thereby drawing corresponding policy implications (Ghosh,
2002; Altinay and Karagol, 2005; Narayan and Smyth, 2005; Wolde-Rufael, 2006; Ho and Siu, 2007;
Abosedra et al, 2009; Gupta and Sahu, 2009; Acaravci and Ozturk, 2010; Adom, 2011; Masuduzzaman,
2012; Abbas and Choudhury, 2013; Pempetzoglou, 2014).
Table 17: Per Capita Electricity Consumption in Selected Major Indian States in 2014-15
States Per capita Electricity consumption - kWh Gujarat 2105 Punjab 1858 Tamil Nadu 1616 Orissa 1419 Maharashtra 1257 Karnataka 1211 Rajasthan 1123 Andhra Pradesh 1040 Kerala 672 Uttar Pradesh 502
Source: CEA, 2016
Table 17 highlights that per capita electricity consumption in Karnataka in 2014-15 (1211 kWh)
is higher than a few states like Rajasthan (1123 kWh), Uttar Pradesh (502 kWh), Kerala (672 kWh),
however, much lower than many major states, like Punjab (1858 kWh), Gujarat (2105 kWh), Tamil
Nadu (1616 kWh), so on. There is much scope for improvement.
20
Rural Electrification
Rural electrification is a key ingredient of the policy objective of providing electricity access to all.
Karnataka has started to carve out the roadmap for the 24*7 Power for All Initiative to meet the
objectives by 2018-19. As for the progress in rural electrification, the percentage of villages electrified in
Karnataka as on 31-03-2015 is 99.9% (CEA, 2016). However, the definition of village electrification is
that 'A village would be declared electrified if - electricity is provided to public places like Schools,
Panchayat Offices, Health centres, Dispensaries, Community Centres etc. and the number of households
electrified are at least 10% of the total number of households in the village.' Hence, not all the
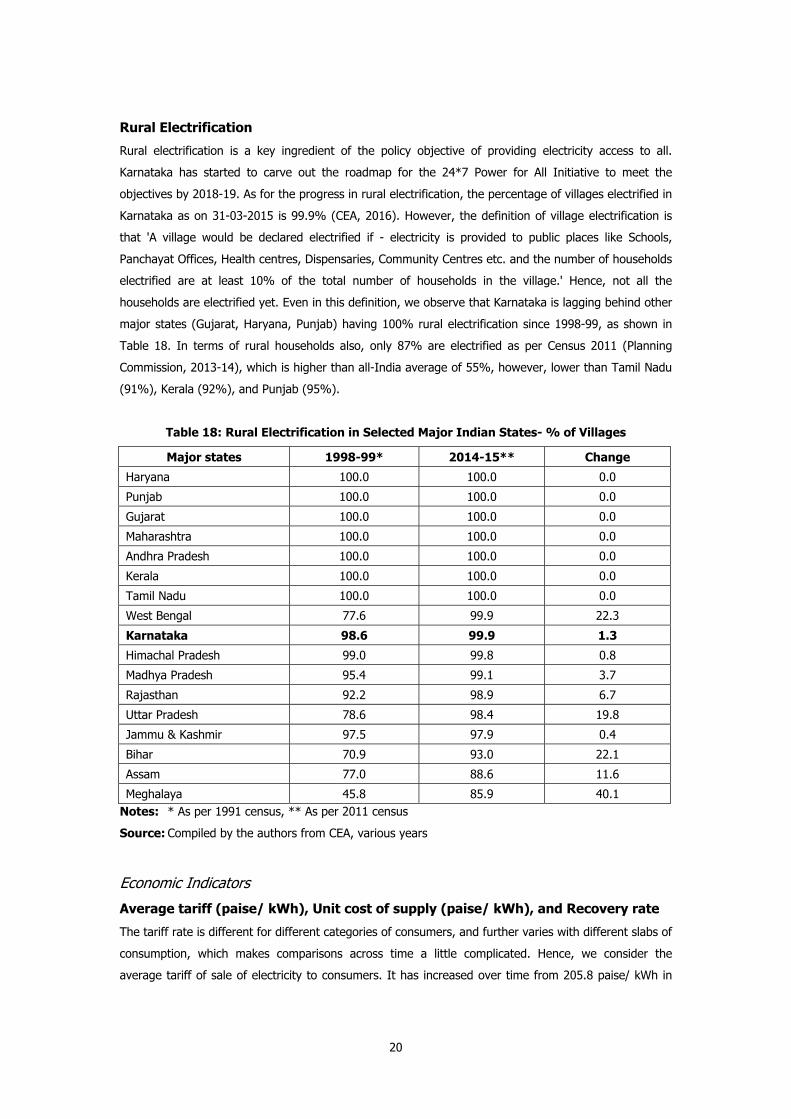
households are electrified yet. Even in this definition, we observe that Karnataka is lagging behind other
major states (Gujarat, Haryana, Punjab) having 100% rural electrification since 1998-99, as shown in
Table 18. In terms of rural households also, only 87% are electrified as per Census 2011 (Planning
Commission, 2013-14), which is higher than all-India average of 55%, however, lower than Tamil Nadu
(91%), Kerala (92%), and Punjab (95%).
Table 18: Rural Electrification in Selected Major Indian States- % of Villages
Major states 1998-99* 2014-15** Change
Haryana 100.0 100.0 0.0
Punjab 100.0 100.0 0.0
Gujarat 100.0 100.0 0.0
Maharashtra 100.0 100.0 0.0
Andhra Pradesh 100.0 100.0 0.0
Kerala 100.0 100.0 0.0
Tamil Nadu 100.0 100.0 0.0
West Bengal 77.6 99.9 22.3
Karnataka 98.6 99.9 1.3
Himachal Pradesh 99.0 99.8 0.8
Madhya Pradesh 95.4 99.1 3.7
Rajasthan 92.2 98.9 6.7
Uttar Pradesh 78.6 98.4 19.8
Jammu & Kashmir 97.5 97.9 0.4
Bihar 70.9 93.0 22.1
Assam 77.0 88.6 11.6
Meghalaya 45.8 85.9 40.1 Notes: * As per 1991 census, ** As per 2011 census
Source: Compiled by the authors from CEA, various years
Economic Indicators
Average tariff (paise/ kWh), Unit cost of supply (paise/ kWh), and Recovery rate
The tariff rate is different for different categories of consumers, and further varies with different slabs of
consumption, which makes comparisons across time a little complicated. Hence, we consider the
average tariff of sale of electricity to consumers. It has increased over time from 205.8 paise/ kWh in
21
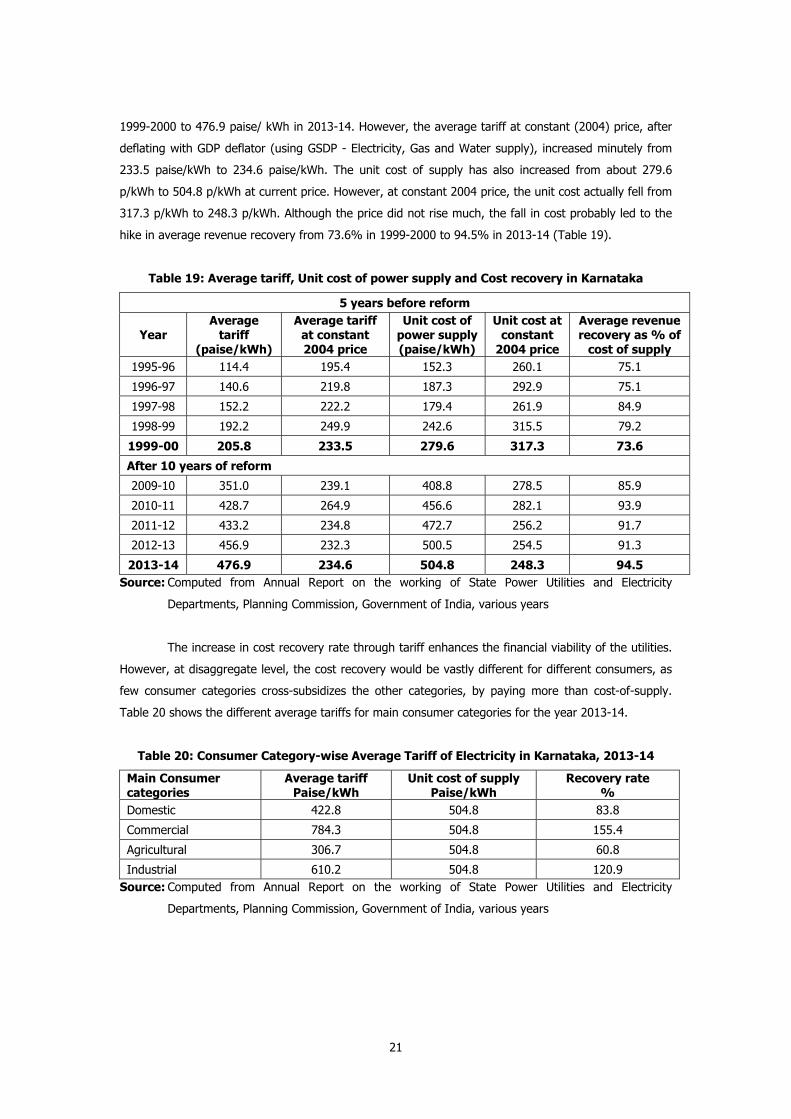
1999-2000 to 476.9 paise/ kWh in 2013-14. However, the average tariff at constant (2004) price, after
deflating with GDP deflator (using GSDP - Electricity, Gas and Water supply), increased minutely from
233.5 paise/kWh to 234.6 paise/kWh. The unit cost of supply has also increased from about 279.6
p/kWh to 504.8 p/kWh at current price. However, at constant 2004 price, the unit cost actually fell from
317.3 p/kWh to 248.3 p/kWh. Although the price did not rise much, the fall in cost probably led to the
hike in average revenue recovery from 73.6% in 1999-2000 to 94.5% in 2013-14 (Table 19).
Table 19: Average tariff, Unit cost of power supply and Cost recovery in Karnataka
5 years before reform
Year Average
tariff (paise/kWh)
Average tariff at constant 2004 price
Unit cost of power supply (paise/kWh)
Unit cost at constant
2004 price
Average revenue recovery as % of
cost of supply 1995-96 114.4 195.4 152.3 260.1 75.1
1996-97 140.6 219.8 187.3 292.9 75.1
1997-98 152.2 222.2 179.4 261.9 84.9
1998-99 192.2 249.9 242.6 315.5 79.2
1999-00 205.8 233.5 279.6 317.3 73.6
After 10 years of reform
2009-10 351.0 239.1 408.8 278.5 85.9
2010-11 428.7 264.9 456.6 282.1 93.9
2011-12 433.2 234.8 472.7 256.2 91.7
2012-13 456.9 232.3 500.5 254.5 91.3
2013-14 476.9 234.6 504.8 248.3 94.5 Source: Computed from Annual Report on the working of State Power Utilities and Electricity
Departments, Planning Commission, Government of India, various years
The increase in cost recovery rate through tariff enhances the financial viability of the utilities.
However, at disaggregate level, the cost recovery would be vastly different for different consumers, as
few consumer categories cross-subsidizes the other categories, by paying more than cost-of-supply.
Table 20 shows the different average tariffs for main consumer categories for the year 2013-14.
Table 20: Consumer Category-wise Average Tariff of Electricity in Karnataka, 2013-14
Main Consumer categories
Average tariff Paise/kWh
Unit cost of supply Paise/kWh
Recovery rate %
Domestic 422.8 504.8 83.8
Commercial 784.3 504.8 155.4
Agricultural 306.7 504.8 60.8
Industrial 610.2 504.8 120.9 Source: Computed from Annual Report on the working of State Power Utilities and Electricity
Departments, Planning Commission, Government of India, various years
22
The cost recovery rate for 'Commercial' and 'Industrial' consumers are much higher than
100%, which implies that they pay more than the cost of supplying power to them, thereby cross-
subsidizing the 'Domestic' and 'Agricultural' consumers, whose tariffs are unable to recover full cost of
supply. The cross-subsidization policy was proven to be sub-optimal in a study using data from a
distribution company in Uttar Pradesh, and it was suggested to reduce the industrial tariffs in India
(Chattopadhyay, 2004). Industries start resorting to their own captive power generation, which lead to
reduction in Industrial consumers, thereby lowering the revenue realisation of the utilities.
On the other hand, the cost of power supply comprises many components (Table 21):
Table 21: Cost Structure of Power Supply in Karnataka in 2013-14
Major Components
Power Purchase
Operation & Maintenance
(O&M)
Estt/ Administrative Depreciation Interest Misc
Cost (paise/kW) 418.3 2.9 44.9 10.4 22.6 5.5
Percentage (%) 82.9 0.6 8.9 2.1 4.5 1.1
Source: Computed from Annual Report on the working of State Power Utilities and Electricity
Departments, Planning Commission, Government of India, various years
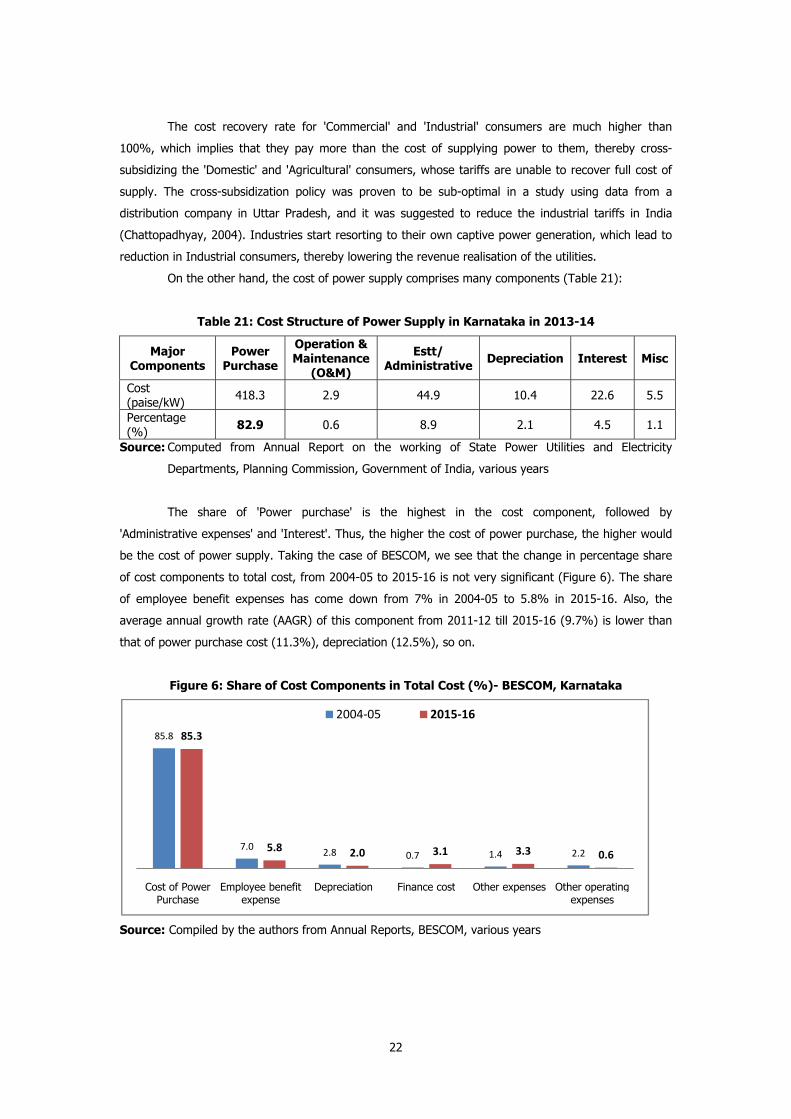
The share of 'Power purchase' is the highest in the cost component, followed by
'Administrative expenses' and 'Interest'. Thus, the higher the cost of power purchase, the higher would
be the cost of power supply. Taking the case of BESCOM, we see that the change in percentage share
of cost components to total cost, from 2004-05 to 2015-16 is not very significant (Figure 6). The share
of employee benefit expenses has come down from 7% in 2004-05 to 5.8% in 2015-16. Also, the
average annual growth rate (AAGR) of this component from 2011-12 till 2015-16 (9.7%) is lower than
that of power purchase cost (11.3%), depreciation (12.5%), so on.
Figure 6: Share of Cost Components in Total Cost (%)- BESCOM, Karnataka
Source: Compiled by the authors from Annual Reports, BESCOM, various years
85.8
7.0 2.8 0.7 1.4 2.2
85.3
5.8 2.0 3.1 3.3 0.6
Cost of Power Purchase
Employee benefit expense
Depreciation Finance cost Other expenses Other operating expenses
2004‐05 2015‐16

23
Collection efficiency and AT&C losses (%)
The five distribution companies in Karnataka have different ratios of different consumer categories in
their respective areas of distribution, and hence, have different revenue generating capacity. However,
their collection efficiency, which reflects the ability to collect revenue from the billed units, could be
compared. Also, the Aggregate Technical and Commercial (AT&C) loss indicates the loss in energy due
to technical as well as the collection inefficiencies. These variables highlight the commercial orientation
and financial viability of the utilities. It is observed that HESCOM has the highest collection efficiency
(CE) (97.1%) and MESCOM has the lowest AT&C loss (14.8%) in 2013-14, followed by BESCOM, while
CESCOM has the lowest CE and highest AT&C loss (Table 22).
The difference in the collection efficiency might be due to the shares of different consumer
categories in the districts each ESCOM is responsible for. However, in general, the CE is increasing over
time for most of the ESCOMs, while the AT&C loss is declining, which indicates that the ESCOMs seem
to be improving in their performance over time after the reform.
Table 22: Collection Efficiency (CE) and AT&C Losses (%) of 5 ESCOMs in Karnataka
Year
BESCOM
GESCOM
HESCOM
MESCOM
CESCOM
CE (%)
AT&C loss (%)
CE (%)
AT&C loss (%)
CE (%)
AT&C loss (%)
CE (%)
AT&C loss (%)
CE (%)
AT&C loss (%)
2004-05 92.9 30.0 90.6 43.0 80.3 41.8 93.0 27.0
2005-06 87.6 35.8 77.6 52.7 83.0 40.4 93.7 20.8 76.6 46.0
2006-07 95.9 26.9 82.2 47.0 86.7 37.4 103.8 12.1 84.5 40.6
2007-08 91.7 26.6 79.4 41.3 79.1 40.7 90.8 21.7 80.6 37.7
2008-09 97.0 19.2 82.7 38.8 88.1 33.9 98.8 14.0 91.7 25.3
2009-10 92.9 21.1 83.2 38.1 90.3 28.5 93.4 18.4 85.9 28.2
2010-11 90.3 22.8 95.2 25.8 92.9 26.2 97.9 13.8 84.3 28.7
2011-12 90.5 22.6 97.1 24.0 95.5 23.6 93.6 17.9 84.7 29.0
2012-13 92.7 20.5 100.9 18.3 99.3 20.4 97.0 14.6 82.0 30.4
2013-14 94.2 18.9 84.6 30.5 97.1 20.4 96.7 14.8 77.5 33.9
Source: Compiled by the authors from TERI Energy Data Directory and Year Books (TEDDY), Tata
Energy Research Institute, New Delhi, various years
Power Sector Performance Index (PPI) Power Sector Performance Index (PPI) is computed by unifying select indicators of power sector
performance, following the methodology used in calculating HDI, with slight adjustments and
modifications. The justifications for taking 17 states and the indicators are given in the Appendix.
The select indicators used in the Index and their preferred directions are given in Table 23:
24
Table 23: Indicators Used to Calculate PPI and the Preferred Direction
Sl. No. Indicators Direction
1 Installed capacity per capita(IC) - kW Higher the better
2 Growth in Total generation - % Higher the better
3 Capacity utilisation rate - % Higher the better
4 Energy deficit - % Lower the better
5 Peak deficit - % Lower the better
6 T&D loss - % Lower the better
7 Average revenue recovery as % of cost Higher the better
8 Commercial loss - with subsidy - Per capita- Rs Lower the better Source: Computed by the authors
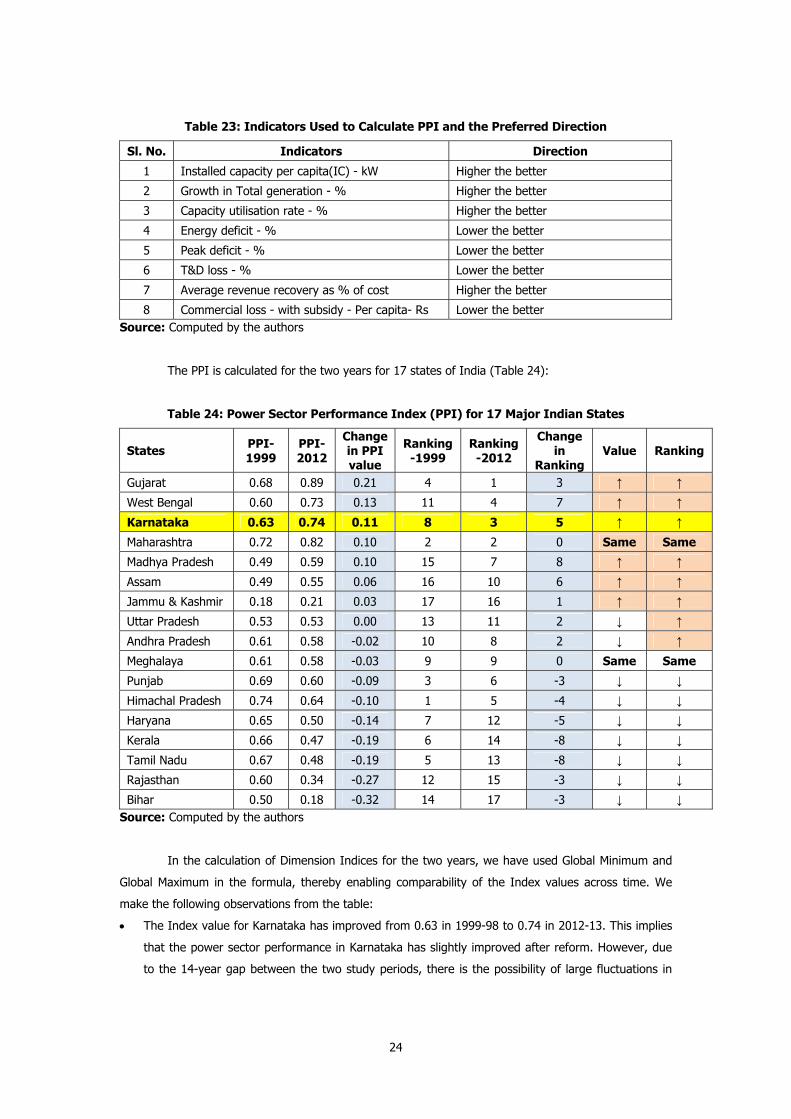
The PPI is calculated for the two years for 17 states of India (Table 24):
Table 24: Power Sector Performance Index (PPI) for 17 Major Indian States
States PPI-1999
PPI-2012
Change in PPI value
Ranking -1999
Ranking-2012
Change in
Ranking Value Ranking
Gujarat 0.68 0.89 0.21 4 1 3 ↑ ↑
West Bengal 0.60 0.73 0.13 11 4 7 ↑ ↑
Karnataka 0.63 0.74 0.11 8 3 5 ↑ ↑
Maharashtra 0.72 0.82 0.10 2 2 0 Same Same
Madhya Pradesh 0.49 0.59 0.10 15 7 8 ↑ ↑
Assam 0.49 0.55 0.06 16 10 6 ↑ ↑
Jammu & Kashmir 0.18 0.21 0.03 17 16 1 ↑ ↑
Uttar Pradesh 0.53 0.53 0.00 13 11 2 ↓ ↑
Andhra Pradesh 0.61 0.58 -0.02 10 8 2 ↓ ↑
Meghalaya 0.61 0.58 -0.03 9 9 0 Same Same
Punjab 0.69 0.60 -0.09 3 6 -3 ↓ ↓
Himachal Pradesh 0.74 0.64 -0.10 1 5 -4 ↓ ↓
Haryana 0.65 0.50 -0.14 7 12 -5 ↓ ↓
Kerala 0.66 0.47 -0.19 6 14 -8 ↓ ↓
Tamil Nadu 0.67 0.48 -0.19 5 13 -8 ↓ ↓
Rajasthan 0.60 0.34 -0.27 12 15 -3 ↓ ↓
Bihar 0.50 0.18 -0.32 14 17 -3 ↓ ↓ Source: Computed by the authors
In the calculation of Dimension Indices for the two years, we have used Global Minimum and
Global Maximum in the formula, thereby enabling comparability of the Index values across time. We
make the following observations from the table:
• The Index value for Karnataka has improved from 0.63 in 1999-98 to 0.74 in 2012-13. This implies
that the power sector performance in Karnataka has slightly improved after reform. However, due
to the 14-year gap between the two study periods, there is the possibility of large fluctuations in

25
the variables over the interval; we refrain from interpreting it strongly. Nonetheless, the PPI value
for Karnataka increased in 2012-13 compared to 1998-99.
• Karnataka's ranking vis-a-vis other states has risen from 8th rank in 1998-99 to 3rd in 2012-13. In
a World Bank study by Khurana and Banerjee (2015), Karnataka secured 4th rank in 2010, using
the Analytical Hierarchy Process (AHP) methodology with 11 indicators. In both the studies, Gujarat
occupied the 1st rank in 2009-2010 as well as in 2012-13. From this paper, we find that Karnataka
has improved its performance compared to other states in the second period, as well as compared
to its own status in 1998-99.
• Some states have improved tremendously both in terms of PPI value and rank (eg., Gujarat, West
Bengal, Karnataka) in the post-reform period, while both the PPI value and rank declined for some
states (eg., Kerala, Tamil Nadu, Bihar). The probable reason for such drastic changes could be seen
from the percentage share of each indicator to total Dimension Index for each state (Table 25).
Table 25: Percentage Share of Each Indicator to Total Dimension Index for 17 Major Indian
States
States Years
Installed Capacity
per capita
Growth in Generation
Capacity utilisation Gen/IC -
Energy deficit
Peak deficit
T&D loss
Average revenue recovery as % of
cost
Commercial loss with
subsidy-per capita
Haryana
1998-99 4.2 12.5 16.4 14.7 13.0 10.7 11.4 17.2
2012-13 13.3 10.8 15.0 13.8 14.6 11.9 11.8 8.9
Himachal Pradesh
1998-99 2.3 12.6 17.6 15.8 18.5 16.5 16.9 17.4
2012-13 23.1 17.0 14.9 17.2 5.4 19.5 17.8 12.3
Jammu & Kashmir
1998-99 1.7 4.9 5.4 12.4 6.4 5.7 0.5 9.8
2012-13 4.8 11.9 16.5 1.7 2.2 2.6 9.3 2.7
Punjab
1998-99 8.1 13.2 19.0 14.6 18.5 16.9 11.3 12.8
2012-13 11.9 10.1 20.4 15.4 3.0 18.9 13.7 20.5
Rajasthan
1998-99 1.8 11.9 19.2 14.4 15.7 12.1 10.5 16.4
2012-13 8.1 13.4 16.2 17.0 18.4 16.9 8.6 2.1
Uttar Pradesh
1998-99 1.7 10.9 14.2 10.2 5.3 13.5 11.6 16.5
2012-13 2.4 19.4 18.3 7.6 11.4 16.0 12.6 17.4
Gujarat
1998-99 6.9 12.6 17.5 12.3 7.6 15.8 11.8 18.2
2012-13 21.3 17.1 15.6 19.0 22.0 19.8 21.2 23.0
Madhya Pradesh
1998-99 3.3 11.0 17.9 12.5 1.7 11.4 10.3 14.1
2012-13 4.8 13.7 15.0 12.5 17.4 13.9 14.2 16.8
Maharashtra
1998-99 6.0 10.8 17.3 13.6 6.0 11.9 18.5 19.2
2012-13 12.2 13.8 14.8 16.9 17.1 18.3 23.1 23.9
Andhra Pradesh
1998-99 3.9 11.0 17.6 10.9 12.3 11.4 9.2 18.8
2012-13 9.3 9.5 16.9 6.9 6.0 19.4 16.4 19.0
Karnataka
1998-99 3.6 10.0 15.1 8.3 8.2 12.1 14.4 19.1
2012-13 11.3 12.4 15.7 9.5 11.4 23.1 20.7 23.2
Kerala
1998-99 2.7 19.2 14.5 10.3 10.8 15.3 12.9 18.3
2012-13 4.4 4.2 8.0 16.3 15.2 20.1 14.0 11.3

26
Tamil Nadu
1998-99 4.7 9.5 13.3 9.1 10.0 17.0 16.2 17.7
2012-13 12.3 10.9 11.5 7.0 11.7 21.6 12.9 8.3
Bihar
1998-99 1.0 13.6 6.3 11.2 8.2 14.7 9.4 18.2
2012-13 0.0 1.1 0.3 8.4 4.4 5.8 9.6 22.5
West Bengal
1998-99 2.4 11.4 13.2 14.6 14.6 13.8 10.1 17.5
2012-13 4.6 11.6 20.0 18.6 14.2 17.2 21.2 23.0
Assam
1998-99 1.0 10.6 4.7 14.3 16.4 9.1 9.4 17.7
2012-13 0.7 11.3 15.1 14.3 19.0 14.2 16.0 21.3
Meghalaya
1998-99 4.0 8.6 9.6 19.2 19.2 15.6 9.0 16.6
2012-13 5.8 21.2 8.0 10.7 21.3 17.5 12.4 16.5
Source: Computed by the authors
The percentage share of indicators to total dimension index shows the contribution of each
indicator to total index value in the two time periods. For the better performing states, the percentage
share has increased for almost all indicators. For instance, the shares for all variables increased in case
of Karnataka, Gujarat (except capacity utilisation), and West Bengal (except peak demand). For the
states whose performance went down, the percentage share of each indicator mostly declined (eg.
Tamil Nadu, Kerala). However, for Kerala, almost all variables increased in share, except for sharp fall in
generation and capacity utilisation, which probably pulled down the overall index. One limitation of
using capacity utilisation (with this definition) as an indicator is that the PLFs of plants are vastly
different for different sources. For example, renewable energy sources like wind and solar, have very
low PLFs, due to its nature of source, and hence, the overall capacity utilisation calculated in the paper
may be low due to this reason. However, due to lack of a uniform measure of capacity utilisation for the
states, we have used this definition in the paper. In the study by Khurana and Banerjee (2015), Kerala
had been one of the top performing states in their analysis of financial performance of power sector till
2010. The AHP methodology they used is vastly different from the methodology used in this paper, and
hence, the results cannot be compared.
Conclusions After more than a decade of power sector reforms, Karnataka still faces power shortage. The energy
and peak deficits in the state declined after reform; however, they are still very high compared to other
major states of India, like Gujarat, Tamil Nadu, Kerala. The installed capacity (IC) has increased over
time, with private sector growing much more than public sector, and thermal and RES installed capacity
increasing faster than hydro. Total generation is, however, growing lesser than the installed capacity.
The trend break analysis revealed that there is significant increase in Total IC and Total generation in
1999-2000 itself, probably due to the rising private sector participation. However, the private sector
generation exhibited trend break only in 2005-06, while there was no break for public generation. This
conforms to the low PLF for public sector thermal plants, as compared to the higher PLF for private
sector plants in the post-reform period. The T&D losses have come down tremendously to about 11.5%
in 2014-15, which are lower compared to most of the states as well. Per capita consumption has also
increased at a higher AAGR after reform compared to pre-reform period and showed trend break in
27
1998-99; however, it is still lower than some major states. In terms of rural electrification, although
99.9% villages are electrified in Karnataka, only 87% rural households are electrified.
The average revenue recovery as percentage of unit cost of supply showed tremendous
increase in the post-reform period; however, it is still not 100%, which should be the ideal case.
Further, there is wide difference in the recovery rates across different consumer categories. Industrial
and Commercial consumers pay more than cost-of-supply, while the recovery rates for agricultural and
domestic consumers was way lower than 100%. Among the five ESCOMs, HESCOM has the highest
collection efficiency and MESCOM has the lowest AT&C loss, while CESCOM turns out to be worst
performing in this context. These parameters mostly depend on the share of the consumer categories in
their area of supply and the strictness of collection.
The Power sector Performance Index (PPI) value for Karnataka increased in 2012-13, implying
better performance in the post-reform period, although this conclusion is premature due to very long
time gap between the two periods under study. After calculating the Index, the 17 states are ranked for
the two time periods. Karnataka's rank vis-a-vis other states climbed up from 8th rank in 1998-99 to 3rd
rank in 2012-13, reflecting better performance relative to other states. The share of all indicators to
total dimension index also increased in the post-reform period. The policy implications that could be
drawn with the present study are mostly suggestive from the observations so far. The weaker areas,
like low capacity utilisation of existing plants should be investigated and proper measure should be
undertaken, whether in terms of technical upgradation of plants, or increasing the demand from utilities
by improving their financial condition. The rural electrification of households are still lagging behind,
added with low quality supply and load shedding, hence, this area requires effective implementation of
the existing electrification schemes. This would also help in improving per capita electricity
consumption. The financial loss and cost recovery of the utilities also needs to improve tremendously,
for which there are many issues besides economic considerations to deal with, especially the free/ low
tariffs to agricultural consumers due to political reasons.
There are limitations to the study in terms of getting continuous time series data for many
important variables before and after reform, especially for KEB which was unbundled in 1999. However,
the analysis with existing data highlights few important trends over the years. The power sector reform
in 1999 seems to have brought improvement in certain indicators, and overall performance.
Nonetheless, there are still some loopholes hindering the fast development of Karnataka power sector,
like lack of quality power access to all households, the differential pricing across consumers, affecting
the utilities' finances with spill-over effect on demand for power from generation plants, which
ultimately leads to low PLF. Therefore, there is huge scope for further improvement in Karnataka power
sector, especially compared to other major states of India, to meet the demand-supply gap in
electricity.
28
Reference Abbas, F, N Choudhury (2013). Electricity Consumption-Economic Growth Nexus: An Aggregated and
Disaggregated Causality Analysis in India and Pakistan. Journal of Policy Modelling, 35: 538-53.
Abosedra, S, A Dah, S Ghosh (2009). Electricity Consumption and Economic Growth: The Case of
Lebanon. Applied Energy, 86: 429-32.
Acaravci, A, I Ozturk (2010). Electricity Consumption-Growth Nexus: Evidence from Panel Data for
Transition Countries. Energy Economics, 32: 604-8.
Adom, P K (2011). Electricity Consumption-Economic Growth Nexus: The Ghanian Case. International
Journal of Energy Economics and Policy, 1: 18-31.
Altinay, G, E Karagol (2005). Electricity Consumption and Economic Growth: Evidence from Turkey.
Energy Economics, 27: 849-56.
Bhattacharya, S and U R Patel (2008). The Power Sector in India: An Enquiry into the Efficacy of the
Reform Process. In Suman Bery, Barry Bosworth and Arvind Panagariya (eds), India Policy
Forum, 2007-08. Washington DC: SAGE publication. Pp 211-82.
Chattopadhyay, P (2004). Cross-Subsidy in Electricity Tariffs: Evidence from India. Energy Policy, 32
(5): 673-84.
Dubash, Navroj K and Sudhir Chella Ranjan (2001). Power Politics: Process of Power Sector Reform in
India. Economic and Political Weekly, 36 (35): 3367-90.
D’Sa, Antonette, K V Narasimha Murthy and Amulya K N Reddy (1999). India’s Power Sector
Liberalisation: An Overview. Economic and Political Weekly, 34 (23): 1427-34.
Ghosh, S (2002). Electricity Consumption and Economic Growth in India. Energy Policy, 30: 125-29.
Government of India (various years). Annual Report on the Working of State Power Utilities and
Electricity Departments. New Delhi: Planning Commission.
————— (2014). 2013-14 Annual Report. New Delhi: Ministry of Power.
————— (various years). Census of India. Office of the Registrar & Census Commissioner. New Delhi:
Ministry of Home Affairs.
————— (various years). General Review (All-India Electricity Statistics), Central Electricity Authority.
New Delhi: Ministry of Power.
Government of Karnataka (various years). Annual Reports, Bangalore Electricity Supply Company
(BESCOM). Bangalore: BESCOM.
————— (various years). Economic Survey of Karnataka. Karnataka: Planning, Program Monitoring
and Statistics Department.
Gupta, G, N S Sahu (2009). Causality between Electricity Consumption and Economic Growth: Empirical
Evidence from India. Munich Personal RePEc Archive, Paper no. 22942.
Ho, CY, KW Siu (2007). A Dynamic Equilibrium of Electricity Consumption and GDP in Hong Kong: An
Empirical Investigation. Energy Policy, 35: 2507-13.
Jamasb, T, D Newberry and M Pollitt (2005). Core Indicators for Determinants and Performance of the
Electricity Sector in Developing Countries. World Bank Policy Research Working Paper 3599.
Kannan, K P and N Vijayamohan Pillai (2001). Plight of the Power Sector in India - Inefficiency, Reform
and Political Economy. Thiruvananthapuram, Kerala: Centre for Development Studies.
29
Karnataka Power Transmission Corporation Limited (2014). 2013-14 Annual Report.
Khurana, M and S G Banerjee (2015). Beyond Crisis: The Financial Performance of India's Power Sector.
Washington DC: International Bank for Reconstruction and Development/ The World Bank.
Klugman, J et al (2011). The HDI 2010: New Controversies, Old Critiques. United Nations Development
Programme Human Development Reports Research Paper.
Masuduzzaman, M (2012). Electricity Consumption and Economic Growth in Bangladesh: Co-integration
and Causality Analysis. Global Journal of Management and Business Research, 12 (11): 31-48.
Narayan, P K and R Smyth (2005). Electricity Consumption, Employment, and Real Income in Australia:
Evidence from Multivariate Granger Causality Tests. Energy Policy, 33: 1109-16.
National Electricity Authority (n.d.). Ministry of Power, Government of India website,
http://powermin.nic.in/en/content/national-electricity-policy.
Ninan, K N (2012). Electricity Pricing Reforms in Karnataka, India: An Appraisal. The Journal of Institute
of Public Enterprises, 35.
Pempetzoglou (2014). Electricity Consumption and Economic Growth: A Linear and Nonlinear Causality
Investigation for Turkey. International Journal of Energy Economics and Policy, 4 (2): 263-73.
Reddy, A K N and G D Sumithra (1997). Karnataka’s Power Sector – Some Revelations. Economic and
Political Weekly, 32: 585-600.
Reforms in Power Sector (n.d.). Press Information Bureau, Government of India website.
http://pib.nic.in/feature/feyr2000/fapr2000/f060420001.html.
Sakri, S G, Nagabhushan and S A Khaparde (2006). Power Sector Reforms in Karnataka. IEEE.
Sharma, D Parameswara, P S Chandramohanan Nair and R Balasubramanian (2005). Performance of
Indian Power Sector during a Decade under Restructuring: A Critique. Energy Policy, 33: 563-
76.
Singh, A (2006). Power Sector Reform in India: Current Issues and Prospects. Energy Policy, 34: 2480-
90.
Tata Energy Research Institute (various years). TERI Energy Data Directory and Year Books (TEDDY).
New Delhi: Tata Energy Research Institute.
United Nations Development Programme (2015). Technical Notes. Human Development Report.
Wolde-Rufael, Y (2006). Electricity Consumption and Economic Growth: A Time Series Experience for 17
African Countries. Energy Policy, 34: 1106-14.
Yoo, S (2005). Electricity Consumption and Economic Growth: Evidence from Korea. Energy Policy, 33:
1627-32.
Yuan, J, C Zhao, S Yu, Z Hu (2007). Electricity Consumption and Economic Growth in China:
Cointegration and Co-Feature Analysis. Energy Economics, 29: 1179-91.
339 Participation of Scheduled CasteHouseholds in MGNREGS: Evidence fromKarnatakaR Manjula and D Rajasekhar
340 Relationship Between Services Trade,Economic Growth and ExternalStabilisation in India: An EmpiricalInvestigationMini Thomas P
341 Locating the Historical Past of the WomenTea Workers of North BengalPriyanka Dutta
342 Korean Media Consumption in Manipur: ACatalyst of Acculturation to KoreanCultureMarchang Reimeingam
343 Socio-Economic Determinants of EducatedUnemployment in IndiaIndrajit Bairagya
344 Tax Contribution of Service Sector: AnEmpirical Study of Service Taxation inIndiaMini Thomas P
345 Effect of Rural Infrastructure onAgricultural Development: District-LevelAnalysis in KarnatakaSoumya Manjunath and Elumalai Kannan
346 Moreh-Namphalong Border TradeMarchang Reimeingam
347 Emerging Trends and Patterns of India’sAgricultural Workforce: Evidence from theCensusS Subramanian
348 Estimation of the Key EconomicDeterminants of Services Trade: Evidencefrom IndiaMini Thomas P
349 Employment-Export Elasticities for theIndian Textile IndustryTarun Arora
350 Caste and Care: Is Indian HealthcareDelivery System Favourable for Dalits?Sobin George
351 Food Security in Karnataka: Paradoxes ofPerformanceStacey May Comber, Marc-Andre Gauthier,Malini L Tantri, Zahabia Jivaji and Miral Kalyani
352 Land and Water Use Interactions:Emerging Trends and Impact on Land-useChanges in the Tungabhadra and TagusRiver BasinsPer Stalnacke, Begueria Santiago, Manasi S, K VRaju, Nagothu Udaya Sekhar, Maria ManuelaPortela, António Betaâmio de Almeida, MartaMachado, Lana-Renault, Noemí, Vicente-Serranoand Sergio
353 Ecotaxes: A Comparative Study of Indiaand ChinaRajat Verma
354 Own House and Dalit: Selected Villages inKarnataka StateI Maruthi and Pesala Busenna
Recent Working Papers355 Alternative Medicine Approaches as
Healthcare Intervention: A Case Study ofAYUSH Programme in Peri Urban LocalesManasi S, K V Raju, B R Hemalatha,S Poornima, K P Rashmi
356 Analysis of Export Competitiveness ofIndian Agricultural Products with ASEANCountriesSubhash Jagdambe
357 Geographical Access and Quality ofPrimary Schools - A Case Study of South24 Parganas District of West BengalJhuma Halder
358 The Changing Rates of Return to Educationin India: Evidence from NSS DataSmrutirekha Singhari and S Madheswaran
359 Climate Change and Sea-Level Rise: AReview of Studies on Low-Lying and IslandCountriesNidhi Rawat, M S Umesh Babu andSunil Nautiyal
360 Educational Outcome: Identifying SocialFactors in South 24 Parganas District ofWest BengalJhuma Halder
361 Social Exclusion and Caste Discriminationin Public and Private Sectors in India: ADecomposition AnalysisSmrutirekha Singhari and S Madheswaran
362 Value of Statistical Life: A Meta-Analysiswith Mixed Effects Regression ModelAgamoni Majumder and S Madheswaran
363 Informal Employment in India: An Analysisof Forms and DeterminantsRosa Abraham
364 Ecological History of An Ecosystem UnderPressure: A Case of Bhitarkanika in OdishaSubhashree Banerjee
365 Work-Life Balance among WorkingWomen – A Cross-cultural ReviewGayatri Pradhan
366 Sensitivity of India’s Agri-Food Exportsto the European Union: An InstitutionalPerspectiveC Nalin Kumar
367 Relationship Between Fiscal DeficitComposition and Economic Growth inIndia: A Time Series EconometricAnalysisAnantha Ramu M R and K Gayithri
368 Conceptualising Work-life BalanceGayatri Pradhan
369 Land Use under Homestead in Kerala:The Status of Homestead Cultivationfrom a Village StudySr. Sheeba Andrews and Elumalai Kannan
370 A Sociological Review of Marital Qualityamong Working Couples in BangaloreCityShiju Joseph and Anand Inbanathan
371 Migration from North-Eastern Region toBangalore: Level and Trend AnalysisMarchang Reimeingam

372 Analysis of Revealed ComparativeAdvantage in Export of India’s AgriculturalProductsSubhash Jagdambe
373 Marital Disharmony among WorkingCouples in Urban India – A SociologicalInquityShiju Joseph and Anand Inbanathan
374 MGNREGA Job Sustainability and Povertyin SikkimMarchang Reimeingam
375 Quantifying the Effect of Non-TariffMeasures and Food Safety Standards onIndia’s Fish and Fishery Products’ ExportsVeena Renjini K K
376 PPP Infrastructure Finance: An EmpiricalEvidence from IndiaNagesha G and K Gayithri
377 Contributory Pension Schemes for thePoor: Issues and Ways ForwardD Rajasekhar, Santosh Kesavan and R Manjula
378 Federalism and the Formation of States inIndiaSusant Kumar Naik and V Anil Kumar
379 Ill-Health Experience of Women: A GenderPerspectiveAnnapuranam Karuppannan
380 The Political Historiography of ModernGujaratTannen Neil Lincoln
381 Growth Effects of Economic Globalization:A Cross-Country AnalysisSovna Mohanty
382 Trade Potential of the Fishery Sector:Evidence from IndiaVeena Renjini K K
383 Toilet Access among the Urban Poor –Challenges and Concerns in BengaluruCity SlumsS Manasi and N Latha
384 Usage of Land and Labour under ShiftingCultivation in ManipurMarchang Reimeingam
385 State Intervention: A Gift or Threat toIndia’s Sugarcane Sector?Abnave Vikas B and M Devendra Babu
386 Structural Change and Labour ProductivityGrowth in India: Role of Informal WorkersRosa Abraham
387 Electricity Consumption and EconomicGrowth in KarnatakaLaxmi Rajkumari and K Gayithri
388 Augmenting Small Farmers’ Incomethrough Rural Non-farm Sector: Role ofInformation and InstitutionsMeenakshi Rajeev and Manojit Bhattacharjee
389 Livelihoods, Conservation and ForestRights Act in a National Park: AnOxymoron?Subhashree Banerjee and Syed Ajmal Pasha
390 Womanhood Beyond Motherhood:Exploring Experiences of VoluntaryChildless WomenChandni Bhambhani and Anand Inbanathan
391 Economic Globalization and IncomeInequality: Cross-country EmpiricalEvidenceSovna Mohanty
392 Cultural Dimension of Women’s Healthacross Social Groups in ChennaiAnnapuranam K and Anand Inbanathan
393 Earnings and Investment Differentialsbetween Migrants and Natives: A Study ofStreet Vendors in Bengaluru CityChannamma Kambara and Indrajit Bairagya
394 ‘Caste’ Among Muslims: EthnographicAccount from a Karnataka Village
Sobin George and Shrinidhi Adiga395 Is Decentralisation Promoting or
Hindering the Effective Implementationof MGNREGS? The Evidence fromKarnatakaD Rajasekhar, Salim Lakha and R Manjula
396 Efficiency of Indian Fertilizer Firms: AStochastic Frontier ApproachSoumita Khan
397 Politics in the State of Telangana:Identity, Representation andDemocracyAnil Kumar Vaddiraju
Price: ` 30.00 ISBN 978-81-7791-257-9
INSTITUTE FOR SOCIAL AND ECONOMIC CHANGE
Dr V K R V Rao Road, Nagarabhavi P.O., Bangalore - 560 072, IndiaPhone: 0091-80-23215468, 23215519, 23215592; Fax: 0091-80-23217008
E-mail: [email protected]; Web: www.isec.ac.in