wp hrm final - university of economics, ho chi minh...
TRANSCRIPT

pÅÜççä=çÑ=bÅçåçãáÅë=
råáîÉêëáíó=çÑ=bÅçåçãáÅë=eç=`Üá=jáåÜ=`áíó=
^ÇÇêÉëëW=N^=eç~åÖ=aáÉìI=mÜì=kÜì~åI=eç=`Üá=jáåÜ=`áíóI=sáÉíå~ã=
mÜçåÉW=HUQJUJPUQQJUOOO=
bã~áäW=ââí]ìÉÜKÉÇìKîå=
tÉÄëáíÉW=ïïïKëÉKìÉÜKÉÇìKîå=
WORKING PAPER SERIES
pÅÜççä=çÑ=bÅçåçãáÅë=råáîÉêëáíó=çÑ=bÅçåçãáÅë=eç=`Üá=jáåÜ=`áíó==
=
=
=
=
erj^k=obplro`b=j^k^dbjbkq=mo^`qf`bp=^ka=cfoj=lrq`ljbpW=bsfabk`b=colj=sfbqk^j=
=
=
qÜ~åÖ=a~åÖ=
qÜ~á=qêá=aìåÖ=
sì=qÜá=mÜìçåÖ=
qê~å=aáåÜ=sáåÜ=
=
=
^Äëíê~Åí==
rëáåÖ=~=é~åÉä=ë~ãéäÉ=çÑ=ã~åìÑ~ÅíìêáåÖ=Ñáêãë=Ñêçã=ëã~ääJ=~åÇ=ãÉÇáìãJëáòÉÇ=ÉåíÉêéêáëÉ=
ëìêîÉóë=ÄÉíïÉÉå=OMMV=~åÇ=OMNPI=ïÉ=Éëíáã~íÉ=íÜÉ=Å~ìë~ä=ÉÑÑÉÅíë=çå=Ñáêã=çìíÅçãÉë=çÑ=Üìã~å=
êÉëçìêÅÉ=ã~å~ÖÉãÉåí=éê~ÅíáÅÉë=~í= íÜÉ=Ñáêã=äÉîÉä= áå=sáÉíå~ãK=bãéäçóáåÖ=~= ÑáñÉÇJÉÑÑÉÅíë=
Ñê~ãÉïçêâ=Ñçê=íÜÉ=Éëíáã~íáçåI=ïÉ=ÑáåÇ=íÜ~í=çå=~îÉê~ÖÉ=~=Ñáêã=íÜ~í=éêçîáÇÉë=íÜÉ=íê~áåáåÖ=
Ñçê=åÉï=ïçêâÉêë=Ö~áåë=êçìÖÜäó=NPKTBI=NMB=~åÇ=NQKVB=ÜáÖÜÉê=áå=çìíéìí=î~äìÉ=éÉê=ïçêâÉêI=
î~äìÉ=~ÇÇÉÇ=éÉê=ïçêâÉê=~åÇ=Öêçëë=éêçÑáí=éÉê=ïçêâÉê=êÉëéÉÅíáîÉäó=íÜ~å=íÜÉ=ÅçìåíÉêé~êíK=
jçêÉçîÉêI=~å=~ÇÇáíáçå~ä=íÉåJÇ~ó=íê~áåáåÖ=Çìê~íáçå=Ñçê=åÉï=ÉãéäçóÉÉë=çå=~îÉê~ÖÉ=äÉ~Çë=íç=
QKNB=áåÅêÉ~ëÉ=áå=çìíéìí=î~äìÉ=éÉê=ïçêâÉêI=PKMB=êáëÉ=áå=î~äìÉ=~ÇÇÉÇ=éÉê=ïçêâÉê=~åÇ=PKMB=
ÖêçïíÜ= áå= Öêçëë= éêçÑáí= éÉê= ïçêâÉêK= tÉ= ~äëç= ìåÅçîÉê= íÜ~í= ~= ã~êÖáå~ä= NMB= çÑ= eoj=
ëéÉåÇáåÖ=êÉëìäíë=áå=~Äçìí=OB=~åÇ=NKSB=êáëÉë=áå=çìíéìí=î~äìÉ=éÉê=ïçêâÉê=~åÇ=î~äìÉ=~ÇÇÉÇ=
éÉê= ïçêâÉêI= êÉëéÉÅíáîÉäóK= kÉîÉêíÜÉäÉëëI= ïÉ= ÑáåÇ= åç= ëí~íáëíáÅ~ääó= ëáÖåáÑáÅ~åí= áãé~Åíë= çÑ=
áåÅÉåíáîÉ=ãÉ~ëìêÉ=çå=Ñáêã=çìíÅçãÉëK=qÜÉ=Éëíáã~íÉÇ=êÉëìäíë=~êÉ=ëíêçåÖäó=êçÄìëí=íç=î~êáçìë=
ëéÉÅáÑáÅ~íáçåëK=
=
=
=
=
=
tçêâáåÖ=m~éÉê=pÉêáÉë=
rbepbtm=@MNMLOMNS=
=
=
=
=

1
!"#$% &'()"*+' ,$%$-'#'%. /*$+.0+'( $%1 20*# 3".+)#'(: 4501'%+' 6*)# 70'.%$# Thang Dang, Thai Tri Dung, Vu Thi Phuong, and Tran Dinh Vinh*
September 2016
Abstract. Using a panel sample of manufacturing firms from small- and medium-sized enterprise surveys between 2009 and 2013, we estimate the causal effects on firm outcomes of human resource management practices at the firm level in Vietnam. Employing a fixed-effects framework for the estimation, we find that on average a firm that provides the training for new workers gains roughly 13.7%, 10% and 14.9% higher in output value per worker, value added per worker and gross profit per worker respectively than the counterpart. Moreover, an additional ten-day training duration for new employees on average leads to 4.1% increase in output value per worker, 3.0% rise in value added per worker and 3.0% growth in gross profit per worker. We also uncover that a marginal 10% of HRM spending results in about 2% and 1.6% rises in output value per worker and value added per worker, respectively. Nevertheless, we find no statistically significant impacts of incentive measure on firm outcomes. The estimated results are strongly robust to various specifications. JEL Classifications: M5 Keywords: Human resource management; firm outcomes; Vietnam *Authors: All authors are lecturers at Department of Human Resource Management, School of Economics, University of Economics Ho Chi Minh City (UEH). Address: 1A Hoang Dieu Street, Phu Nhuan District, Ho Chi Minh City, Vietnam. The supports from UEH under the Scopus project are greatly acknowledged. We also would like to thank Professor Nguyen Trong Hoai and Dr. Nguyen Hoang Bao for their kindly encouragements. Correspondence contact: [email protected] [Thang Dang].

2
1 8%.*)1"+.0)% Management-related functions inside firm significantly determine firm’s growth (Bloom & van Reenen, 2007; Milgrom & Roberts, 1990). Moreover, the theory arguably treats “management as technology” and apparently indicates the positive impact of management on firm performance (Bloom et al., 2016). Among management-related functions, human resource management (HRM) is probably the most fundamental part because it fosters the efficient use of human resources (Bloom & van Reenen, 2011). Feasibly, examining the impacts on firm outcomes of HRM practices is similar to that of the adoption of or the diffusion of a new technology. Thus, that whether a firm carries out HRM practices compared to the counterpart is likely an understandable explanation for dispersion in business results across firms.1 The study of HRM is traditionally the realms of industrial sociology and psychology which emphasize the functions of institutions and culture as the primary determinants of the organizational structure inside firm. Whereas conventional labor economics only focuses on the study of labor markets such as labor demand, supply, unemployment, and investments in education and this subfield of economics roughly ignores HRM-related practices2 inside organization and leave them as “black-boxes.” Recent decades have witnessed the development of economic analysis of HRM within organization and the introduction of personnel economics (Bloom & van Reenen, 2011). Personnel economics examines two main problems facing any organization including how to recruit appropriate candidates for available vacancies, and how to organize work and motivate employees (Lazear & Shaw, 2007; Lazear & Oyer, 2013). This study focuses on the second issue and quantitatively explores the causal impacts of HRM practices on firm outcomes using Vietnamese small and medium-size enterprises (SMEs) data. Many analogous studies are almost in developed countries such the United States and European countries using econometric analysis. However, there is a lack of studies from developing countries including Vietnam. This study provides firm-level 1 While HRM practices commonly consist of incentive/performance pay, profit-related pay, self-managed teams, performance feedback, job rotation, regular meetings and training, productivity is a common proxy for firm outcomes in economics (Bloom & van Reenen, 2011). 2 HRM-related practices probably consist of payingstructure, work organization and incentive mechanism.

3
evidence on the empirical literature of HRM practice impacts in Vietnam and developing nations as well. Vietnam is a transition economy where there are the transformations from many economic activities including business functions inside organization toward modern international standards. Firms’ applications and adoptions of contemporary people management measures especially from the West become a discernible trend in the context of growing globalization of Vietnam’s economy (King-Kauanui et al., 2006; Truong & van der Heijden, 2009). Small- and medium-sized enterprises are dominant and essential subjects within the Vietnamese economy. SMEs amount to about 90% in 2000–2008, even 97% in 2008 of the total enterprises in Vietnam (Vu et al., 2016). Moreover, SMEs play considerable roles for the economy (Hung, 2007; Trung et al., 2009; Kokko & Sjöholm, 2005). For instance, SMEs account for approximately 40% of GDP and 32% of the total investment in 2006 (Hung, 2007). In addition, SMEs generate about 2.5 million of new jobs in 2005 (Trung et al., 2009) and it was also the main driver for poverty reduction in rural Vietnam (Kokko & Sjöholm, 2005). Given SMEs’ contributions, understanding management-related practices including HRM actions of SMEs therefore provides more efficiently evidence-based policies for the pro-growth and the pro-poor strategies in Vietnam. Research on the effect of HRM practices on firm outcomes for SMEs is important for several reasons. First, evidence on the HRM role in SMEs is a literature gap from the developing countries because almost existing studies focus for the large-sized organizations in developed countries (Ogunyomi & Bruning, 2016). Second, SMEs account for a large share of total business and become main drivers for economic growth especially in developing nations (Cardon & Stevens, 2004). In addition, SMEs account for the remarkable population of companies and become the significant force for economic growth in the developing countries. Furthermore, using various HRM practices likely produces various impacts on firm outcomes (Bloom & van Reenen, 2011). In this study, we test whether there are differences in the effects of some HRM practices that include training (measured by binary and training days), incentive measure and per capita HRM spending.

4
Existing research on HRM is almost qualitative studies in Vietnam. However, such studies are arduous to sufficiently reveal the importance of HRM practices. Hence, quantifying the causal effect of HRM practices on firm outcomes is more momentous for evidently discerning the role of HRM practices. Providing quantitative evidence is this study’s main motivation. The paper is organized as follows. The next section provides a brief literature review of the effects of HRM practices on firm results. Section 3 presents identification strategy in which we specifically discuss econometric specification for the estimations. Section 4 describes data source and the sample used in this study. Section 5 reports the main estimation results while section 6 provides further robustness checks for the main estimates. Finally, section 7 makes some conclusions. 2 90.'*$."*' &'50': The existing literature detects that HRM practices have significant effects on firm outcomes such as productivity, performance or innovation. Cooke (1994) provides evidence for the positive effects of HRM practices on firm outcomes in Michigan, the United States. In particular, the application of employee participation and group incentives rise value added. Lazear (2000) finds that there is an increase of 22% in productivity stemming from a change in the payment method from flat hourly wage to per windshield piece rate pay for American firms. Black & Lynch (2001) find that the labor productivity for American non-manager employees is remarkably and positively associated with the profit sharing strategy – an incentive measure, and the correlation is even stronger for those from union enterprises. Bartel et al. (2007) reveal that HRM practices including team-working, incentive pay and training result in increases in new IT technology applications into the manufacturing activities in the United States. Lavy (2009) discovers a strong and positive association between teacher performance and bonus award based on pupils’ examination pass rates and scores. Bloom et al. (2012) show that the people management score (including multiple strategies such as over careful hiring, performance pay, merit-based promotion, fixing/firing) as a proxy

5
for the HRM measure accounts for higher IT productivity in Europe. Messersmith & Guthrie (2010) show that the use of high performance work system is positively related to sales growth, product and innovation for infant high-tech companies in the United States. However, the result of positive or negative impacts of HRM practices admittedly depends on the proxy choices for firm outcomes and even the data used. For instance, Freeman & Kleiner (2005) discover that the termination of piece rates reduces productivity but engenders a positive impact on firm profit. In addition, while studies using cross-sectional data robustly are suggestive of positive impacts on firm productivity of HRM practices, studies using time-series data likely yield opposite findings (Ichniowski et al., 1997). For research on the HRM role for SMEs from developing countries, Ogunyomi & Bruning (2016) find that on average a firm using HRM practices respectively have 12% and 16% of financial and non-financial performances larger than those from the counterpart in Nigeria. King-Kauanui et al. (2006) is the first study on the effects of HRM practices on firm performance in Vietnam and find that training, performance appraisal systems and incentive pay are positively linked to firm performance. Notably, incentive pay generates the highest impact. Although this study focuses on SMEs, it only has a small sample of firms in Ha Noi at one year. In contrast, we use a large sample of firms in ten provinces of Vietnam in many years. Given a sample allows us to investigate the impacts of HRM practices on firm outcomes more comprehensive. 3 81'%.060+$.0)% ;.*$.'-< In estimating the causal effects of a HRM practice on firm outcome, researchers face a potential problem that the possible existence of some determinants which simultaneously affect both HRM practices and firm outcomes. In other words, there potentially exists an endogeneity problem that highly produces bias estimates using ordinary least squares (OLS) estimation procedure. For instance, a firm that has good businesses is also more likely to spend sufficient resources for its HRM practices.

6
Therefore, it is important to control for unobservable or omitted factors such as latent firm-level characteristics that might jointly determine both HRM practices and firm consequences. In a standard manner, researchers commonly use an instrumental variable (IV) approach to address this challenge. Notwithstanding, identifying a satisfactory IV that fulfils requirements including (i) having an exclusion restriction, (iii) being uncorrelated with other omitted variables, and (iii) having an ample strength is probably a challenging task. Given this difficulty, we arguably employ a fixed-effects framework to control for latent factors and estimate the causal impacts of HRM practices on firm outcomes. Moreover, using a panel sample of manufacturing firms from Vietnamese SMEs between 2009–2013 enables us to apply fixed-effects model for the estimation. Also, we can regard 2009–2013 as a short time so that we possibly treat undiscovered characteristics at firm-level as time-invariant factors. It is therefore another rationale for our usage of fixed-effects model as an identification strategy in this study. In the full econometric model, we specifically add dummy variables for province and year and province-year interactive terms to restrain determinants that probably change at these various levels over years between 2009–2013. The regression equation is as follows:
!"#$ = % + &'()"#$ + *" + +# + ,$ + -#$ + ./"#$ + 0"#$ (1) where !"#$ is a measure of an outcome for a firm ", in a province # and a year $. There are three key proxies for !"#$ employed in this study including (i) output value per worker, (ii) value added per worker, and (iii) gross profit per worker.3 The components *", +# , ,$ and -#$ respectively correspond to firm, province, year and province by year fixed effects indications; and 0"#$ is an idiosyncratic error term. /"#$ is a vector of control variables for firm and province characteristics from the main specification. In particular, control variables for firm characteristics include firm size, ownership structure, whether firm has informal status, whether the firm is exporting 3Note that to handle some variables with negative or zero values, we implement log transformation using the Stata commands.

7
firm, and whether firm is inspected; and a control for province characteristics is the competitive provincial index (PCI)4. In the section of robustness checks, we add more control variables for manager characteristics including education, whether manager’s main income source is only from the firm, whether manager is a veteran, and whether manager is a party member. Importantly, we add control variables in the model to resolve a potential threat to our identification, namely other factors that are correlated with HRM practices supposedly associated with firm outcomes. Next, '()"#$ denotes a HRM practice that is employed by a firm ", in a province # and at a year $. HRM practice variables include a wide range of HRM activities that were implemented by a firm over the last year. In particular, the HRM practices are (i) whether the firm provided the training for its new employees, (ii) the days of training, (iii) whether the firm employs incentive measure consisting of additional payments and fringe benefits as a main method for managing employees, and (iv) per capita HRM spending. The parameter of interest is the coefficient &, which presents the reliable causal effect of a HRM practice on an outcome of the firm under the assumption of strict exogeneity conditioned on the fixed effects estimation. Standard errors are clustered at the province level to conduct the statistical inference robust to heteroskedasticity and serial correlation within provinces over time. 4 =$.$ $%1 .>' ;$#?@' The data source of this study is from SMEs surveys. SMEs surveys are jointly carried out for every two years by University of Copenhagen, General Statistics Office (GSO) of Vietnam, Vietnamese Institute of Labor Science and Social Affairs (ILSSA), and Central Institute for Economic Management (CIEM) of Vietnamese Ministry of Investment and Planning. The first wave of SMEs survey is in 2002. The aim of SMEs surveys is to elicit various information of a firm including its general information, history, household characteristics of the respondent that is the manager or the owner 4 PCI is constructed based aggregate information at the provincial level regarding different dimensions which include the market entrance, land access, transparency, time cost, informal cost, dynamic environment, business assistance, labor training, and legal institution (VNCI, 2008, 2010, 2012).

8
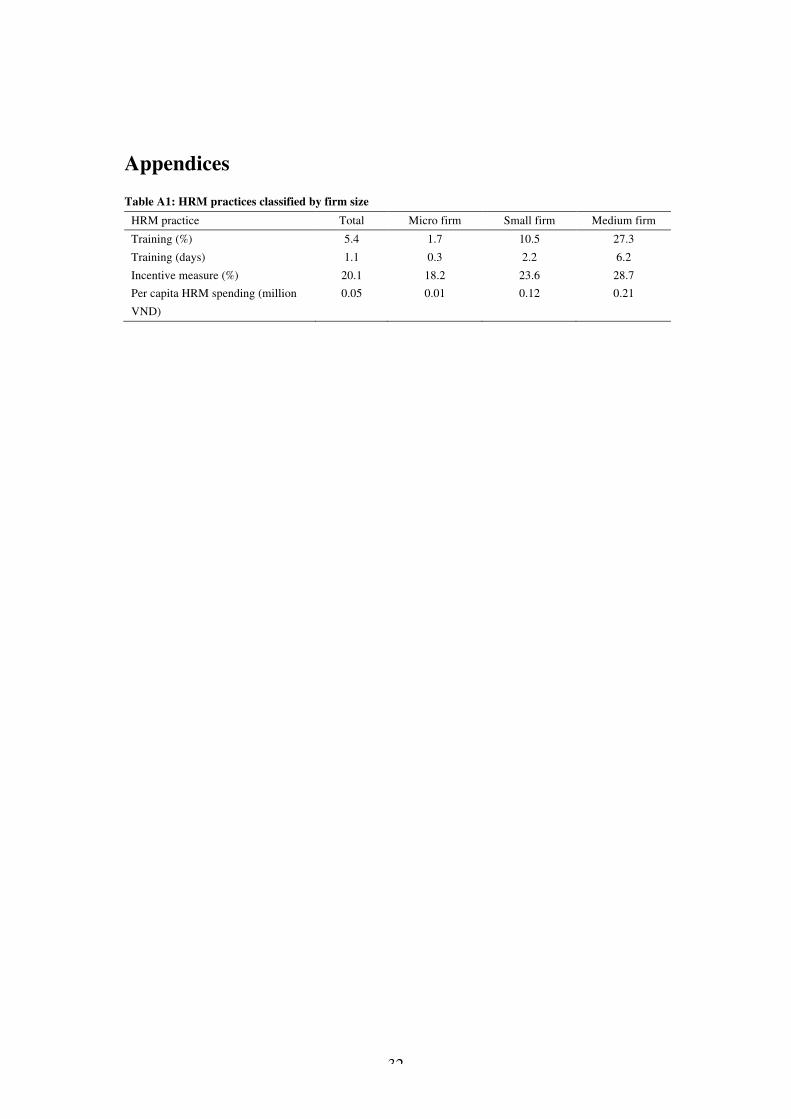
of the firm, the characteristics of production activities and technology used by the firm, the structure of sales, indirect costs, raw materials and services, aspects related to investments, assets, liabilities and credit, fees, taxes and informal costs, employment, and environment. The sample for each wave of survey includes about 2600 non-state-owned manufacturing firms located in 10 Vietnamese provinces including Ha Noi, Phu Tho, Ha Tay5, Hai Phong, Nghe An, Quang Nam, Khanh Hoa, Lam Dong, Ho Chi Minh City and Long An. For instances, the 2009 survey consists of 2659 firms while the commensurate figures for the 2011 and 2013 surveys are 2552 and 2575 firms, respectively. Although the data is generally structured as a cross-sectional structure for each year, a subgroup of SME firms is repeatedly interviewed from year to year. This advantage enables us to construct a panel sample of manufacturing firms between 2009–2013 for this study. After cleaning the data sets and making the checks for the consistent time-invariant characteristics among available variables, we obtain a balanced panel sample of 4803 firms during 2009–2013. We equivalently have 1601 firms for each year and a firm on average has nearly 6 fulltime workers. The summary statistics of the sample is specifically presented in Table 1. Overall, the proportion of firms apply HRM practices as main functional activities are modest. For training activities, only about 5.4% of firms from the whole sample provides the training for its newly recruited laborers. For another measure of training, the average number of training days that firms give its workers for each training duration is only 1.13 days. Regarding the incentive measures, approximately 20.1% of firms delivers additional payments and fringe benefits to their workers as primary people management strategies. Finally, the mean spending for HRM activities per worker is roughly 1.03 million VND. Admittedly, SMEs do not widely employ HRM practices as main functions. This is probably due to most of firms among Vietnamese SMEs is very-small-sized firms. In particular, micro firms accounts for 70.3% of the sample while the percentages of 5 Although Ha Tay province has been amalgamated into Ha Noi since 2008, SMEs surveys carried out after 2008 have classified firms in Ha Tay and Ha Noi in two different provinces.

9
small and medium firms are 23.7% and 6% respectively. The lack of resources for HRM practices from micro and small firms highly likely leads to insufficient investments in HRM activities. For instance, while only 1.7% of micro firms provides training, the commensurate figures for small and medium firms are 10.5% and 27.3% respectively. The mean training days are 0.3, 2.2 and 6.2 for micro, small and medium firms respectively. Table A1 in Appendices provides specific information on HRM practices among firms. Regarding firm results, average output value, value added and gross profit generated by a worker are respectively nearly 151, 46 and 27 million VND for the whole panel sample. Notably, for PCI variable we collect data from the Provincial Competitiveness Index (PCI) Project, Vietnam Chamber of Commerce and Industry (VCCI). PCI is a proxy for the quality of business environment of Vietnamese provinces. Other statistics on firm, manager and province characteristics are in Table 1.

10
!"#$% 1: &'((")* +,",-+,-.+ /0 ,1% +"(2$% Variables Definition Total 2009 2011 2013 Mean SD Mean SD Mean SD Mean SD Dependent variables Output value per worker The real output value per worker (the log of million VND, the original year is 2010) 5.015 0.867 4.905 0.904 5.109 0.849 5.030 0.834
Value added per worker The real value of valued added per worker (the log of million VND, the original year is 2010) 3.819 0.757 3.658 0.784 3.925 0.751 3.874 0.710 Gross profit per worker The real gross profit per worker (the log of million VND, the original year is 2010) 3.303 0.839 3.174 0.821 3.414 0.857 3.321 0.821
Independent variables HRM practices Training Whether the company provided regular training activities for at least 50% of new recruited workers (1 = Yes, 0 = No) 0.054 0.225 0.056 0.229 0.072 0.258 0.033 0.179
Training days The mean number of training days for each training activity (days) 1.131 7.019 1.575 9.271 1.412 7.031 0.405 3.419 Incentive system Whether the firm provided incentive practices to manage workers including commensurate additional payment systems and fringe benefits (1 = Yes, 0 = No)
0.201 0.401 0.000 0.000 0.321 0.467 0.282 0.450
HRM cost per worker The average spending per worker for HRM activities (the log of million VND) 0.027 0.144 0.032 0.196 0.033 0.104 0.014 0.114 Firm characteristics Firm size The number of fulltime workers (the log) 1.792 1.128 1.904 1.104 1.777 1.151 1.694 1.118 Household enterprise Whether the firm’s ownership is household (1 = Yes, 0 = No) 0.677 0.468 0.693 0.461 0.676 0.468 0.662 0.473
Private/sole proprietorship Whether the firm’s ownership private or sole proprietorship (1 = Yes, 0 = No). 0.079 0.270 0.074 0.262 0.082 0.275 0.080 0.271

11
Partnership/collective/cooperative Whether the firm’s ownership is partnership or collective or cooperative (1 = Yes, 0 = No) 0.027 0.161 0.027 0.162 0.026 0.158 0.027 0.164 Limited liability company Whether the firm’s ownership is limited liability company (1 = Yes, 0 = No). 0.180 0.384 0.172 0.377 0.178 0.383 0.191 0.393 Joint stock company Whether the firm’s ownership is joint stock company (1 = Yes, 0 = No) 0.037 0.189 0.034 0.181 0.038 0.192 0.039 0.194 Informal Whether the firm did not register the business, or an informal firm (1 = Yes, 0 = No) 0.336 0.472 0.360 0.480 0.334 0.472 0.314 0.464 Export Whether the firm is an exporting enterprise (1 = Yes, 0 = No) 0.062 0.242 0.056 0.229 0.063 0.243 0.069 0.253 Inspection Whether the firm was inspected last year for policy, technical or other compliances (1 = Yes, 0 = No) 0.214 0.410 0.568 0.496 0.066 0.248 0.009 0.093
Manager characteristics Main income from firm Whether income earned from the firm is the main income source of the manager (1 = Yes, 0 = No) 0.869 0.338 0.895 0.307 0.851 0.356 0.859 0.348 Veteran Whether the manager is a veteran (1 = Yes, 0 = No) 0.071 0.256 0.071 0.257 0.083 0.276 0.058 0.234 Party member Whether the manager is a member of Communism Party of Vietnam (1 = Yes, 0 = No) 0.093 0.291 0.071 0.257 0.104 0.305 0.106 0.307
Province characteristics Provincial competitiveness index (PCI) The proxy for the quality of business environment for the province where is the firm’s location (score) 55.317 4.598 53.152 5.986 56.300 3.109 56.498 3.300 Observations The number of firms 4803 1601 1601 1601

12
5 !"#$%$&'( )*+,(-+ The effects of various HRM practices on firm outcomes are reported in Tables 2–5. For each firm outcome as a dependent variable, we present estimates from three different specifications. Firstly, we estimate a parsimonious specification that only consists of HRM practice variable and control variables (firm size, household enterprise, private/sole proprietorship, limited liability company, joint stock company, informal, export, inspection, and PCI) (model 1). Secondly, we estimate an extended specification by adding year fixed effects (model 2). Thirdly, we estimate a full specification that include HRM practice variable, control variables, province fixed effects, year fixed effects, and province by year fixed effects (model 3). Using three various specifications is one way that enables us to test the robustness of the estimation results for each firm outcome. In each model, we focus on the parameter of interest the coefficient of HRM practice variable (!) that indicate the true causal effect of a HRM practice on firm outcomes under the fixed effects framework. We use the estimation results from model 3 as the baseline estimates for each dependent variable. The coefficients in column 3 for output value per worker, column 6 for value added per worker and column 9 for gross profit per worker from Tables 2–5 are the baseline estimates. The following subsections present empirical results of the cause effects of training, incentive measure and HRM spending on firm outcomes. 5.1 .%'$/$/0 '/1 2$%" 3,-&3"*+ This study uses two measures for training including (i) training dummy for whether a firm provides training for its new workers in last year, and (ii) the number of training days. Tables 2–3 present the estimation results for the causal impacts of training on firm outcomes corresponding with a specific measure for training activities among firms. For the impact of whether a firm makes a training for its new worker, the estimates from Table 2 overall indicates that firms with training tend to have better outcomes compared to ones without training. For output value per worker, the baseline

13
coefficient is statistically significant at 5% as shown in column 3. In economic sense, the baseline estimate indicates that on average a firm with training leads to a nearly 13.7% increase of output value per worker compared to a firm without training. Columns 1 and 2 show statistically significant effects of training on output value per worker at 1% and 5% when using the first and second econometric models respectively. The corresponding magnitudes of the effects are approximately 19.0% and 16.4%. It is obvious that when province, year and province by year fixed effects (model 1) are included in the model, the effect magnitude is smaller that the commensurate figures for the model without any mentioned fixed effects (model 1) and the model with only year fixed effects (model 2). Meanwhile, column 6 indicates a positive impact of training on value added per worker at a 10% level of statistical significance. This baseline estimate indicates that providing the training for new workers improves a firm’s value added per worker by about 10% in comparison with the counterpart. Using other econometric specifications, we also find statistically significant impacts of training on value added per worker at 5% for model 1 in column 4 and 10% for model 2 in column 5. The degrees of effects are 12.5% and 10.8% for model 1 and model 2 respectively. Notably, the baseline estimate for gross profit per worker loses its statistical significance at conventional levels as presented in column 9 of Table 2. The only estimate using model 1 in column 7 is statistically significant at 10% for gross profit per worker. This estimate suggests that on average giving training to new workers make a firm more profitability by a 14.9% rise of gross profit per worker relative to a firm that does not have any training activities for its new employees. Apparently, the estimates from Table 2 as discussed above generally demonstrate that training has positive and significant impacts on a firm’s output value per worker, value added per worker and gross profit per worker. Among three firm outcomes, training generates the largest effect for output value per worker with a 13.7–19% increase. Next, a firm’s gross profit per worker gains a 14.9% rise by adopting training. Finally, training improves a firm’s value added per worker by an additional amount of 10–12.5%.

14
!"#$% 2: !&"'('() (*%+/(,) "(- .'&/ ,012,/%+ Independent variables Dependent variables: Firm outcomes Output value per worker Value added per worker Gross profit per worker Model 1 Model 2 Model 3 Model 1 Model 2 Model 3 Model 1 Model 2 Model 3 (1) (2) (3) (4) (5) (6) (7) (8) (9) Training 0.174*** (0.049) 0.152** (0.052) 0.128** (0.053) 0.118** (0.049) 0.103* (0.047) 0.095* (0.048) 0.139* (0.073) 0.112 (0.064) 0.081 (0.061) Firm size -0.375*** (0.034) -0.374*** (0.026) -0.380*** (0.028) -0.287*** (0.025) -0.274*** (0.019) -0.278*** (0.021) -0.478*** (0.034) -0.482*** (0.027) -0.485*** (0.030) Household enterprise -0.074 (0.224) -0.082 (0.224) -0.057 (0.221) -0.238* (0.119) -0.222* (0.119) -0.231* (0.116) -0.131 (0.125) -0.147 (0.132) -0.189 (0.143) Private/sole proprietorship 0.105 (0.204) 0.102 (0.205) 0.117 (0.200) -0.012 (0.111) 0.004 (0.115) 0.006 (0.110) 0.058 (0.142) 0.048 (0.143) 0.054 (0.147) Limited liability company 0.149 (0.196) 0.167 (0.195) 0.187 (0.188) -0.045 (0.112) -0.026 (0.111) -0.022 (0.099) -0.001 (0.121) 0.019 (0.113) 0.007 (0.100) Joint stock company 0.118 (0.244) 0.120 (0.241) 0.170 (0.223) -0.018 (0.136) -0.022 (0.148) 0.001 (0.148) -0.180 (0.206) -0.176 (0.219) -0.159 (0.210) Informal -0.035 (0.033) -0.035 (0.039) -0.049 (0.049) -0.004 (0.033) 0.004 (0.033) -0.007 (0.029) -0.004 (0.031) -0.006 (0.036) -0.019 (0.032) Export 0.432*** (0.101) 0.435*** (0.110) 0.473*** (0.121) 0.334* (0.162) 0.324* (0.168) 0.349* (0.179) 0.407*** (0.116) 0.414*** (0.122) 0.443*** (0.116) Inspection 0.075** (0.024) 0.139** (0.059) 0.082* (0.039) 0.013 (0.029) 0.129*** (0.033) 0.103*** (0.029) 0.120** (0.038) 0.173*** (0.045) 0.134*** (0.038) PCI 0.028*** (0.008) 0.020* (0.010) 0.035*** (0.001) 0.039*** (0.005) 0.025*** (0.006) 0.040*** (0.001) 0.041*** (0.010) 0.034*** (0.010) 0.050*** (0.001) Constant 4.121*** (0.499) 4.533*** (0.604) 3.601*** (0.192) 2.310*** (0.291) 3.040*** (0.342) 2.376*** (0.093) 1.920*** (0.531) 2.267*** (0.555) 1.751*** (0.105) R2 0.100 0.112 0.134 0.125 0.144 0.159 0.124 0.136 0.159 Observations 4803 4803 4803 4803 4803 4803 4803 4803 4803

15
Province fixed effects No No Yes No No Yes No No Yes Year fixed effects No Yes Yes No Yes Yes No Yes Yes Province by year fixed effects No No Yes No No Yes No No Yes Notes: * Significant at a 10% level, **Significant at a 5% level, ***Significant at a 1% level. Robust standard errors clustered on the provincial level are in parentheses. Partnership/collective/cooperative is omitted among firm’s ownership structure dummies.

16
The causal effects of training on firm consequences are more apparent for the measure of training days in Table 3. Accordingly, the estimates are strongly statistically significant at 1% for all three specifications and all three outcomes. Columns 1, 2, and 3 of Table 3 show that one additional day for training new employees gives increases in output value per worker. The estimates from three specifications almost suggests the same magnitudes of the effects. In particular, a more ten-day training leads to rises in output value per worker by 4.1–5.1%. For the baseline result from column 3, a firm’s spending one more ten-day training for new workers results in an 4.1% increase in its output value per worker. In the same pattern, the estimates in columns 4, 5 and 6 of Table 3 demonstrate that on average an additional ten-day time for training new employees improves a firm’s value added per worker by 3.0–4.1%, in which the marginal effect from the baseline model is 3.0%. Finally, the estimates for gross profit per worker in column 7, 8 and 9 also show the marginal effects of additional gross profit per worker stemming from an increased ten-day training duration span between 3.0% and 5.1% in which the baseline effect is a 3.0% increase in gross profit per worker. There are obviously no considerable differences in the magnitudes among these three firm consequences. Moreover, these findings show the strong robustness of positive impacts of training day on firm outcomes.

17
!"#$% 3: !&"'('() *"+, "(* -'&. /012/.%, Independent variables Dependent variables: Firm outcomes Output value per worker Value added per worker Gross profit per worker Model 1 Model 2 Model 3 Model 1 Model 2 Model 3 Model 1 Model 2 Model 3 (1) (2) (3) (4) (5) (6) (7) (8) (9) Training days 0.005*** (0.001) 0.005*** (0.001) 0.004*** (0.001) 0.004*** (0.0005) 0.004*** (0.0005) 0.003*** (0.001) 0.005*** (0.001) 0.005*** (0.001) 0.003*** (0.001) Firm size -0.371*** (0.036) -0.371*** (0.028) -0.378*** (0.030) -0.285*** (0.026) -0.273*** (0.020) -0.276*** (0.021) -0.476*** (0.035) -0.480*** (0.028) -0.484*** (0.030) Household enterprise -0.079 (0.226) -0.085 (0.226) -0.060 (0.224) -0.242* (0.120) -0.225* (0.122) -0.233* (0.119) -0.136 (0.127) -0.150 (0.135) -0.190 (0.145) Private/sole proprietorship 0.106 (0.203) 0.103 (0.205) 0.119 (0.200) -0.011 (0.111) 0.005 (0.115) 0.008 (0.110) 0.059 (0.142) 0.050 (0.143) 0.055 (0.147) Limited liability company 0.156 (0.194) 0.174 (0.193) 0.193 (0.186) -0.040 (0.110) -0.021 (0.109) -0.018 (0.097) 0.005 (0.121) 0.024 (0.112) 0.011 (0.099) Joint stock company 0.134 (0.237) 0.134 (0.234) 0.181 (0.217) -0.007 (0.128) -0.012 (0.140) 0.009 (0.140) -0.167 (0.194) -0.166 (0.209) -0.152 (0.203) Informal -0.034 (0.033) -0.034 (0.039) -0.049 (0.049) -0.004 (0.033) 0.004 (0.033) -0.006 (0.029) -0.003 (0.031) -0.006 (0.036) -0.019 (0.032) Export 0.427*** (0.097) 0.430*** (0.106) 0.468*** (0.119) 0.329* (0.160) 0.319* (0.165) 0.344* (0.177) 0.401*** (0.113) 0.408*** (0.120) 0.439*** (0.114) Inspection 0.072** (0.025) 0.138** (0.059) 0.081** (0.039) 0.010 (0.028) 0.128*** (0.033) 0.102*** (0.029) 0.116** (0.038) 0.171*** (0.046) 0.133*** (0.038) PCI 0.028*** (0.008) 0.020* (0.010) 0.034*** (0.001) 0.039*** (0.005) 0.025*** (0.006) 0.040*** (0.001) 0.041*** (0.010) 0.034*** (0.010) 0.050*** (0.001) Constant 4.106*** (0.500) 4.532*** (0.609) 3.603*** (0.189) 2.303*** (0.282) 3.045*** (0.333) 2.381*** (0.090) 1.913*** (0.521) 2.274*** (0.544) 1.759*** (0.097) R2 0.100 0.112 0.134 0.125 0.144 0.160 0.125 0.136 0.160

18
Observations 4803 4803 4803 4803 4803 4803 4803 4803 4803 Province fixed effects No No Yes No No Yes No No Yes Year fixed effects No Yes Yes No Yes Yes No Yes Yes Province by year fixed effects No No Yes No No Yes No No Yes Notes: * Significant at a 10% level, **Significant at a 5% level, ***Significant at a 1% level. Robust standard errors clustered on the provincial level are in parentheses. Partnership/collective/cooperative is omitted among firm’s ownership structure dummies.

19
5.2 !"#$"%&'$ ($)*+,$ )"- .&,( /+%#/($* Table 4 presents the estimation results for the impact of incentive measure on firm outcomes. Somewhat surprisingly, we find no statistically significant evidence on the effects of incentive measure on firm outcomes using all econometric specifications. Although the estimates using all specifications for all firm outcomes loses the statistical significance at traditional levels, they also indicate positive and considerable impacts of adopting incentive measure as primary practices for managing people within a firm on output value per worker, value added per worker and gross profit per worker. Specifically, adopting incentive measure contributes to a rise of output value per worker by 4.5% for the baseline estimate from column 3 of Table 4. The estimates from model 1 and model 2 implies the improved output per worker by about 5.7% and 1.9% as consequences for using incentive measure. Meanwhile, the corresponding figures for value added per worker are 8.5%, 3.5% and 6.3% using model 1 in column 4, model 2 in column 5 and model 3 in column 6, respectively. For gross profit per worker, the marginal contributions of employing incentive measure are 6.0%, 2.4% and 5.1% using model 1 in column 7, model 2 in column 8, and model 3 in column 9, respectively.

20
!"#$% 4: &'(%')*+% ,%"-./% "'0 1*/, 2.)(2,%- Independent variables Dependent variables: Firm outcomes Output value per worker Value added per worker Gross profit per worker Model 1 Model 2 Model 3 Model 1 Model 2 Model 3 Model 1 Model 2 Model 3 (1) (2) (3) (4) (5) (6) (7) (8) (9) Incentive measure 0.055 (0.037) 0.019 (0.031) 0.044 (0.035) 0.082 (0.055) 0.034 (0.047) 0.061 (0.041) 0.058 (0.079) 0.024 (0.064) 0.050 (0.062) Firm size -0.367*** (0.037) -0.369*** (0.029) -0.376*** (0.031) -0.280*** (0.026) -0.271*** (0.020) -0.274*** (0.021) -0.471*** (0.035) -0.478*** (0.028) -0.482*** (0.030) Household enterprise -0.081 (0.230) -0.088 (0.229) -0.067 (0.230) -0.245* (0.124) -0.228* (0.121) -0.241* (0.122) -0.137 (0.132) -0.153 (0.137) -0.197 (0.152) Private/sole proprietorship 0.101 (0.207) 0.098 (0.206) 0.111 (0.203) -0.018 (0.115) -0.001 (0.115) -0.001 (0.113) 0.054 (0.147) 0.044 (0.144) 0.048 (0.152) Limited liability company 0.147 (0.196) 0.170 (0.193) 0.186 (0.187) -0.053 (0.108) -0.028 (0.107) -0.027 (0.098) -0.004 (0.120) 0.020 (0.111) 0.003 (0.099) Joint stock company 0.116 (0.238) 0.127 (0.234) 0.167 (0.218) -0.033 (0.141) -0.023 (0.146) -0.009 (0.150) -0.186 (0.216) -0.174 (0.221) -0.167 (0.218) Informal -0.034 (0.032) -0.034 (0.038) -0.050 (0.048) -0.004 (0.035) 0.003 (0.034) -0.008 (0.030) -0.003 (0.031) -0.006 (0.036) -0.020 (0.032) Export 0.437*** (0.102) 0.439*** (0.109) 0.479*** (0.122) 0.338* (0.164) 0.328* (0.166) 0.356* (0.178) 0.411*** (0.117) 0.418*** (0.121) 0.449*** (0.115) Inspection 0.093** (0.032) 0.143** (0.058) 0.084* (0.039) 0.037 (0.022) 0.133*** (0.034) 0.105*** (0.029) 0.138*** (0.041) 0.177*** (0.047) 0.136*** (0.037) PCI 0.027*** (0.007) 0.020* (0.010) 0.037*** (0.001) 0.038*** (0.006) 0.026*** (0.006) 0.042*** (0.002) 0.041*** (0.011) 0.035*** (0.010) 0.051*** (0.002) Constant 4.121*** (0.465) 4.487*** (0.611) 3.515*** (0.179) 2.344*** (0.319) 2.999*** (0.324) 2.274*** (0.121) 1.932*** (0.580) 2.228*** (0.529) 1.668*** (0.135) R2 0.098 0.110 0.132 0.126 0.142 0.160 0.124 0.135 0.159

21
Observations 4803 4803 4803 4803 4803 4803 4803 4803 4803 Province fixed effects No No Yes No No Yes No No Yes Year fixed effects No Yes Yes No Yes Yes No Yes Yes Province by year fixed effects No No Yes No No Yes No No Yes Notes: * Significant at a 10% level, **Significant at a 5% level, ***Significant at a 1% level. Robust standard errors clustered on the provincial level are in parentheses. Partnership/collective/cooperative is omitted among firm’s ownership structure dummies.

22
5.3 !"# $%&'()'* +'( ,)-. /012/.&$ Finally, Table 5 presents the estimation results for the impact of HRM cost on firm consequences. The findings show that there are statistically significant effects of HRM spending on output value per worker and value added per worker. However, we are failure to discover the statistically significant effects of HRM spending on gross profit per worker at any conventional levels. Columns 1, 2 and 3 of Table 5 show the estimates for output per worker. The baseline estimate in column 3 of Table 5 suggests that for any 10% increase in HRM spending, there is a 2% rise in output value per worker. The corresponding effects using model 1 and model 2 in column 1 and 2 respectively are 2.5% and 2.3%. While the estimate using model 1 is statistically significant at 1%, the estimates from model 2 and model 3 are both statistically significant at 10%. The estimates from columns 4, 5 and 6 are all statistically significant at 1%. The baseline estimate for value added per worker in column 6 of Table 5 implicates that the contribution for spending more 10% on HRM activities is about 1.6% higher in value added per worker. For other specifications, we find that the marginal effects of additional 10% in HRM spending are respectively approximately 1.8% and 1.6% rises in value added per worker. However, we can not find the statistically significant estimates from different specifications for gross profit per worker although the directions and magnitudes of the estimates are similar to those for other firm outcomes. In particular, an additional 10% spending on HRM activities leads to rises of 1.5%, 1.1% and 1.0% in gross profit per worker using model 1 in column 7, model 2 in column 8 and model 3 in column 9, respectively. Among these effects, 1.0% is the marginal effect from the baseline estimate.

23
!"#$% 5: &'( )*%+,-+. "+, /-01 234521%) Independent variables Dependent variable: Firm outcomes Output value per worker Value added per worker Gross profit per worker Model 1 Model 2 Model 3 Model 1 Model 2 Model 3 Model 1 Model 2 Model 3 (1) (2) (3) (4) (5) (6) (7) (8) (9) HRM cost per worker 0.264*** (0.072) 0.235** (0.075) 0.208** (0.068) 0.192*** (0.033) 0.171*** (0.030) 0.171*** (0.028) 0.154 (0.092) 0.119 (0.082) 0.107 (0.065) Firm size -0.369*** (0.038) -0.369*** (0.029) -0.376*** (0.032) -0.282*** (0.026) -0.271*** (0.020) -0.275*** (0.022) -0.473*** (0.036) -0.478*** (0.028) -0.482*** (0.031) Household enterprise -0.083 (0.225) -0.090 (0.225) -0.065 (0.223) -0.245* (0.119) -0.228* (0.120) -0.237* (0.118) -0.137 (0.127) -0.152 (0.134) -0.193 (0.145) Private/sole proprietorship 0.095 (0.204) 0.093 (0.205) 0.109 (0.200) -0.019 (0.112) -0.003 (0.115) 0.0001 (0.110) 0.052 (0.142) 0.043 (0.143) 0.049 (0.148) Limited liability company 0.142 (0.194) 0.161 (0.192) 0.182 (0.185) -0.050 (0.110) -0.031 (0.109) -0.027 (0.097) -0.003 (0.121) 0.017 (0.112) 0.004 (0.099) Joint stock company 0.125 (0.236) 0.126 (0.232) 0.174 (0.215) -0.014 (0.126) -0.018 (0.137) 0.004 (0.138) -0.173 (0.192) -0.170 (0.208) -0.156 (0.202) Informal -0.035 (0.033) -0.035 (0.039) -0.049 (0.049) -0.004 (0.033) 0.003 (0.033) -0.007 (0.029) -0.003 (0.032) -0.006 (0.036) -0.019 (0.032) Export 0.428*** (0.101) 0.431*** (0.109) 0.471*** (0.121) 0.330* (0.165) 0.321* (0.169) 0.346* (0.180) 0.405*** (0.117) 0.413 (0.173) 0.443*** (0.117) Inspection 0.074** (0.026) 0.138** (0.059) 0.080* (0.039) 0.012 (0.028) 0.128*** (0.034) 0.101*** (0.029) 0.120** (0.040) 0.173*** (0.046) 0.133*** (0.038) PCI 0.029*** (0.007) 0.020* (0.009) 0.034*** (0.0006) 0.040*** (0.005) 0.026*** (0.006) 0.040*** (0.001) 0.042*** (0.010) 0.035*** (0.010) 0.050*** (0.001) Constant 4.076*** (0.481) 4.492*** (0.595) 3.629*** (0.183) 2.279*** (0.280) 3.011*** (0.336) 2.400*** (0.090) 1.885*** (0.520) 2.237*** (0.549) 1.762*** (0.101) R2 0.100 0.112 0.134 0.125 0.144 0.160 0.123 0.135 0.159

24
Observations 4803 4803 4803 4803 4803 4803 4803 4803 4803 Province fixed effects No No Yes No No Yes No No Yes Year fixed effects No Yes Yes No Yes Yes No Yes Yes Province by year fixed effects No No Yes No No Yes No No Yes Notes: *Significant at a 10% level, **Significant at a 5% level, ***Significant at a 1% level. Robust standard errors clustered on the provincial level are in parentheses. Partnership/collective/cooperative is omitted among firm’s ownership structure dummies.

25
6 !"#$%&# '()"*$+&** ,%&-.* In this section, we check the sensitivity of the results to extended specifications. In particular, we include more control variables for firm manager’s characteristics into three specifications as reported in the last section, that consist of whether manager’s main income source is from the firm, whether manager is a veteran, and whether manager is a member of communist party of Vietnam. Table 6 provides the parameters of interest (!) for three firm outcomes using three extended specifications. Overall, the estimated coefficients do not significantly change in the direction and the magnitude as well compared to the main estimates reported from the previous section. Specifically, the estimates for the causal effects of whether provide a training are qualitatively similar to those in Table 2. The estimates in columns 1, 2 and 3 suggest that the contributions to output value per worker for a firm that provides training for its new workers are between 14.2% and 19.7% relative to the counterpart. The result estimated from the baseline extended specification in column 3 shows a 17.1% increase in output value per worker commensurate with delivering training that is insignificantly larger than the baseline result of 13.7% in column 3 of Table 2. The estimates are strongly statistically significant at 1% for column 1 and 2 and 5% for column 3. Meanwhile, the positive impacts of doing training on a firm’s value added per worker are 13.0%, 11.3% and 10.4% corresponding to the uses of model 1 in column 4, model 2 in column 5 and model 3 in column 6. The baseline estimate from the extended model in column 6 is roughly same to that in column 6 of Table 2 with effects of 10.4% and 10.0% respectively. The estimates are statistically significant at 1% for all three extended specifications. Columns 7, 8 and 9 shows the impacts of training on firm’s gross profit per worker spans between 8.9% and 15.5% although the baseline extended estimate loses its statistical significance. It is important to recognize that when adding more controls for manager characteristics, evidence on the positive impacts is more apparent with the increases in the statistical significance of the estimates. We see that the estimates are robust to the main estimates in Table 2.

26
The estimates for the effects of training days on firm outcomes using extended specifications are more strongly consistent with those estimated from the main specifications as in Table 3 in both the significant levels and the magnitudes of the effects. The only small exception is the estimate in column 6 that suggests a ten-day time of training leads to a 4.0% increase in value added per worker compared to 3.0% for the result in column 6 of Table 3. However, this change is very small and thus unimportant. The findings of the impacts of incentive measure on firm outcomes are also similar to those from the main results. The estimates are by no means statistically significant at any traditional levels although the magnitudes and the directions of the impacts are also analogous to the main estimates in Table 4. Finally, we consider the robustness of the estimates for HRM spending. Accordingly, the estimates using extended specifications as shown in Table 6 indicate the robust effects. For example, we also find statistically significant and positive effects in the cases of output value per worker and value added per worker. The estimates for output value per worker are significant at the 1%, 5% and 5% levels for model 1, model 2 and model 3 in columns 1, 2, and 3 respectively while the corresponding figures for value added per worker in columns 4, 5 and 6 are all 1%. Nonetheless, the estimates for gross profit per worker are all statistically insignificant for all extended specifications. This finding is similar to the main estimates in Table 5. To conclude, the estimated results for the further robustness checks in Table 6 demonstrate that the main findings of significant and apparent effects of training both for measures of binary and training days and HRM spending on firm outcomes are strongly robust regardless of a variety of estimation specification choices. The findings of statistically insignificant effects of incentive measure on all firm outcomes are also consistent for various modelling choices.

27
!"#$% 6: &'()*%( (+#',)-%,, .*%./, Independent variables Dependent variable: Firm outcomes Output value per worker Value added per worker Gross profit per worker Model 1 Model 2 Model 3 Model 1 Model 2 Model 3 Model 1 Model 2 Model 3 (1) (2) (3) (4) (5) (6) (7) (8) (9) Training 0.180*** (0.046) 0.158*** (0.048) 0.133** (0.049) 0.122** (0.044) 0.107*** (0.043) 0.099*** (0.043) 0.144** (0.068) 0.117** (0.058) 0.085 (0.056) Training days 0.005*** (0.001) 0.005*** (0.001) 0.004*** (0.001) 0.004*** (0.0005) 0.004*** (0.0005) 0.004*** (0.0005) 0.005*** (0.001) 0.005*** (0.001) 0.003*** (0.001) Incentive measure 0.056 (0.036) 0.020 (0.031) 0.046 (0.034) 0.084 (0.055) 0.034 (0.046) 0.063 (0.041) 0.060 (0.078) 0.025 (0.063) 0.051 (0.061) HRM cost per worker 0.259*** (0.070) 0.229*** (0.073) 0.201*** (0.066) 0.187*** (0.035) 0.164*** (0.032) 0.163*** (0.030) 0.147 (0.097) 0.111 (0.087) 0.098 (0.070) Province fixed effects No No Yes No No Yes No No Yes Year fixed effects No Yes Yes No Yes Yes No Yes Yes Province by year fixed effects No No Yes No No Yes No No Yes Notes: *Significant at a 10% level, **Significant at a 5% level, ***Significant at a 1% level. Robust standard errors clustered on the provincial level are in parentheses. All regressions consist of constant, HRM practice, firm size, household enterprise, private/sole proprietorship, limited liability company, joint stock company, informal, export, inspection, PCI and additional control variables for manager characteristics including main income source, veteran, and CPV member. The number of observations for all regressions is 4803.

28
7 !"#$%&'("# The current paper employs a fixed-effects framework to estimate the causal effects of HRM practices on firm outcomes using a panel sample of small- and medium-sized firms in Vietnam. We find the significantly robust results of positive impacts of training and per capita HRM spending on firm’s output value per worker, value added per worker and gross profit per worker. In particular, we discover that on average, a firm that provides the training for new workers generate about 13.7% higher in output value per worker, 10% higher in value added per worker and 14.9% higher in gross profit per worker than its counterpart. Moreover, an additional ten-day training time for new employees on average causes a 4.1% increase in output value per worker, 3.0% rise in value added per worker and 3.0% growth in gross profit per worker. Training is conventionally seen as an important factor of employee’s human capital and it in turn improves firm outcomes such as productivity or firm survival. Our findings on the positive effects of training on firm outcomes are consistent with other previous studies’ results for examples Zwick (2006) for Germany, Barrett & O’Connell (2001) for Ireland, and Nguyen et al. (2011) for China and Vietnam. We also find that the contributions for a marginal 10% spending on HRM practices are about 2% and 1.6% higher in output value per worker and value added per worker, respectively. We do not find statistically significant evidence on the impacts of HRM spending on gross profit per worker. In contrast to the apparent impacts of training and HRM spending on firm outcomes, we surprisingly find by no means statistically significant estimates on the effects of incentive measure on firm outcomes using all econometric specifications. This finding is contrast to the results from King-Kauanui et al. (2006) in which incentive measure has the largest effect on firm performance in Ha Noi of Vietnam. In conclusion, HRM practices undoubtedly play important roles for outcome improvements among Vietnamese SMEs. Training is one of measure for upgrading human capital of employees inside firm that in turn improves firm outcomes. In another manner, how much a firm spends on HRM activities implicitly indicates the degree of the application of HRM into its functions. These are possible explanations
29
for the positive impacts of training and HRM spending on firm outcomes in Vietnam. Despite successfully exploring the roles of HRM on improvements in firm outcomes with specific measures of marginal effects, we abandon an important research gap that what is a main mechanism through which HRM practices influence firm outcomes in Vietnam, a crucial research question for further studies. )*+*,*#$*' Barrett, A., & O’Connell, P.J. (2001). Does training generally work? The returns to in-company training. Industrial and labor relation review, 54(3), 647–662. Bartel, A., Ichniowski, C., & Shaw, K. (2007). How does information technology really affect productivity? Plant-level comparisons of product innovation, process improvement and worker skills. Quarterly Journal of Economics, 122(4), 1721–1758. Black, S., & Lynch, L. (2001). How to compete: the impact of workplace practices and information technology on productivity. Review of Economics and Statistics, 83(3), 434–445. Bloom, N., & van Reenen, J. (2007). Measuring and Explaining Management Practices Across Firms and Countries. Quarterly Journal of Economics, 122(4), 1351–1408. Bloom, N., & van Reenen, J. (2011). Human resource management and productivity. In Ashenfelter, O., & Card, D. (eds.), Handbook of Labor Economics. Amsterdam: North Holland. Bloom, N., Sadun, R., & van Reenen, J. (2012). Americans Do IT Better: US Multinationals and the Productivity Miracle. American Economic Review, 102(1), 167-201. Bloom, N., Sadun, R., & van Reenen, J. (2016). Management as a Technology? Harvard Business School Working Paper 16–133. Cardon, M. S., & Stevens, C. E. (2004). Managing human resources in small organizations: What do we know? Human Resource Management Review, 14, 295–323.

30
Cooke, W. (1994). Employee participation programs, group-based incentives, and company performance: A union-nonunion comparison. Industrial and Labor Relations Review, 47(4), 594–609. Freeman, R, & Kleiner, M. (2005). The last American shoe manufacturers: decreasing productivity and increasing profits in the shift from piece rates to continuous flow production. Journal of Industrial Relations, 44(2), 307–330. Hung, H. S. (2007). Strengthening supporting industries in Vietnam: Linking Vietnamese SMEs into global value chains. Ha Noi: Agency for SME Development, Ministry of Planning and Investment. Ichniowski, C., Shaw, K., & Prennushi, G. (1997). The effects of human resource management practices on productivity: A study of steel finishing lines. American Economic Review, 87(3), 291–313. King-Kauanui, S., Ngoc, S. D., & Ashley-Cotleur, C. (2006). Impact of human resource management: SME performance in Vietnam. Journal of Developmental Entrepreneurship, 11, 79–95. Kokko, A., & Sjöholm, F. (2005). The internationalization of Vietnamese small and medium-sized enterprises. Asian Economic Papers, 4(1), 152–177. Lavy, V. (2009). Performance pay and teachers’ effort, productivity and grading ethics. American Economic Review, 99(5), 1979–2011. Lazear, E. (2000). Performance pay and productivity. American Economic Review, 90(5), 1346–1361. Lazear, E. P., & Shaw, K. L. (2007). Personnel Economics: The Economist's View of Human Resources. Journal of Economic Perspectives, 21(4), 91–114. Lazear, E., & Oyer, P. (2013). Personnel Economics. In Gibbons, R., & Roberts, J. (eds.), Handbook of Organizational Economics. Princeton: Princeton University Press. Messersmith, J. G., & Guthrie, J. M. (2010). High performance work systems in emergent organizations: Implications for firm performance. Human Resource Management 49, 241–264. Milgrom, P., & Roberts, J. (1990). The economics of modern manufacturing: technology, strategy, and organization. American Economic Review, 80(3), 511–528.

31
Nguyen, T. N., Truong, Q., & Buyens, D. (2011). Training and firm performance in economies in transition: a comparison between Vietnam and China. Asia Pacific Business Review, 17(1), 103–119. Ogunyomi, P., & Bruning, N. S. (2016). Human resource management and organizational performance of small and medium enterprises (SMEs) in Nigeria. International Journal of Human Resource Management, 27(6), 612–634. Quang, T., & van der Heijden, B. I. J. M. (2009). The Changing Face of Human Resource Management in Vietnam. In Rowley, C. & Quang, T. (eds.), The Changing Face of Vietnamese Management. New York: Routledge. Trung, T. Q., Tung, N. T., Dong, T. D., & Duong, P. H. (2009). Performance of export-oriented small and medium-sized manufacturing enterprises in Viet Nam. Asia-Pacific Trade and Investment Review, 2008(4), 1–13. VNCI (Vietnam Competitiveness Initiative). 2008. The Vietnam Provincial Competitiveness Index 2008: Measuring Economic Governance for Private Sector Development. VNCI Policy Paper, Vietnam Chamber of Commerce and Industry and US Agency for International Development’s Vietnam Competitiveness Initiative, Ha Noi. VNCI (Vietnam Competitiveness Initiative). 2010. The Vietnam Provincial Competitiveness Index 2008: Measuring Economic Governance for Private Sector Development. VNCI Policy Paper, Vietnam Chamber of Commerce and Industry and US Agency for International Development’s Vietnam Competitiveness Initiative, Ha Noi. VNCI (Vietnam Competitiveness Initiative). 2012. The Vietnam Provincial Competitiveness Index 2008: Measuring Economic Governance for Private Sector Development. VNCI Policy Paper, Vietnam Chamber of Commerce and Industry and US Agency for International Development’s Vietnam Competitiveness Initiative, Ha Noi. Vu, H. V., Holmes, M., Tran, Q. T., & Lim, S. 2016. Firm exporting and productivity: What if productivity is no longer a black box. Baltic Journal of Economics, 16(2), 95–113. Zwick, T. (2006). The impact of training intensity on establishment productivity. Industrial relations, 54(1), 26–46.
32
-..*#/($*' 012%* -1: 3)4 .,1$5($*' $%1''(+(*/ 26 +(,7 '(8* HRM practice Total Micro firm Small firm Medium firm Training (%) 5.4 1.7 10.5 27.3 Training (days) 1.1 0.3 2.2 6.2 Incentive measure (%) 20.1 18.2 23.6 28.7 Per capita HRM spending (million VND) 0.05 0.01 0.12 0.21

33
Table A2. Additional Summary Statistics of the Sample (firm size, economic sectors and location) Variables Definition Total 2009 2011 2013 Mean SD Mean SD Mean SD Mean SD Micro firm Whether the firm is classified as a micro firm (< 10 employees) (1 = Yes, 0 = No) 0.703 0.457 0.679 0.467 0.703 0.457 0.726 0.446 Small firm Whether the firm is classified as a small firm (10-49 employees) (1 = Yes, 0 = No) 0.237 0.425 0.254 0.435 0.234 0.424 0.224 0.417 Medium firm Whether the firm is classified as a medium firm (50-300 employees) (1 = Yes, 0 = No) 0.060 0.238 0.067 0.251 0.062 0.242 0.051 0.219 Sector 1 The firm’s economic sector is “food products and beverages” (1 = Yes, 0 = No) 0.310 0.462 0.309 0.462 0.310 0.463 0.310 0.463 Sector 2 The firm’s economic sector is “tobacco products” (1 = Yes, 0 = No) 0.0004 0.020 0.001 0.025 0.000 0.000 0.001 0.025 Sector 3 The firm’s economic sector is “textiles” (1 = Yes, 0 = No) 0.011 0.103 0.009 0.093 0.009 0.096 0.014 0.116 Sector 4 The firm’s economic sector is “wearing apparel” (1 = Yes, 0 = No) 0.033 0.178 0.030 0.171 0.034 0.182 0.034 0.181 Sector 5 The firm’s economic sector is “tanning and dressing leather” (1 = Yes, 0 = No) 0.016 0.126 0.017 0.129 0.015 0.122 0.017 0.129 Sector 6 The firm’s economic sector is “wood and wood products” (1 = Yes, 0 = No) 0.116 0.320 0.124 0.329 0.112 0.316 0.112 0.316 Sector 7 The firm’s economic sector is “paper and paper products” (1 = Yes, 0 = No) 0.024 0.152 0.022 0.148 0.024 0.152 0.025 0.156 Sector 8 The firm’s economic sector is “publishing and printing” (1 = Yes, 0 = No) 0.024 0.153 0.025 0.156 0.025 0.156 0.022 0.146 Sector 9 The firm’s economic sector is “refined petroleum” (1 = Yes, 0 = No) 0.003 0.056 0.003 0.056 0.003 0.056 0.003 0.056 Sector 10 The firm’s economic sector is “chemical products” (1 = Yes, 0 = No) 0.015 0.122 0.016 0.124 0.014 0.116 0.016 0.126 Sector 11 The firm’s economic sector is “rubber and plastic products” (1 = Yes, 0 = No) 0.051 0.220 0.052 0.222 0.051 0.221 0.051 0.219 Sector 12 The firm’s economic sector is “nonmetallic mineral products” (1 = Yes, 0 = No) 0.044 0.204 0.044 0.206 0.044 0.206 0.042 0.202 Sector 13 The firm’s economic sector is “basic metals” (1 = Yes, 0 = No) 0.015 0.122 0.018 0.133 0.016 0.124 0.011 0.105

34
Sector 14 The firm’s economic sector is “fabricated metal products” (1 = Yes, 0 = No) 0.178 0.383 0.177 0.382 0.181 0.385 0.178 0.383 Sector 15 The firm’s economic sector is “electrical and office machinery and other machinery and equipment” (1 = Yes, 0 = No) 0.023 0.150 0.023 0.150 0.023 0.150 0.022 0.148 Sector 16 The firm’s economic sector is “vehicle parts” (1 = Yes, 0 = No) 0.008 0.091 0.009 0.096 0.008 0.090 0.007 0.086 Sector 17 The firm’s economic sector is “medical, optical, and photo equipment, watches and clocks” (1 = Yes, 0 = No) 0.007 0.081 0.006 0.075 0.007 0.086 0.007 0.083 Sector 18 The firm’s economic sector is “furniture, jewelry, musical instruments, sports equipment, and games and toys” (1 = Yes, 0 = No) 0.072 0.259 0.066 0.248 0.076 0.264 0.076 0.265 Sector 19 The firm’s economic sector is “recycling” (1 = Yes, 0 = No) 0.001 0.032 0.001 0.025 0.001 0.035 0.001 0.035 Ha Noi The firm’s location is Ha Noi (1 = Yes, 0 = No) 0.107 0.310 0.107 0.310 0.107 0.310 0.107 0.310 Phu Tho The firm’s location is Phu Tho (1 = Yes, 0 = No) 0.107 0.310 0.107 0.310 0.107 0.310 0.107 0.310 Ha Tay The firm’s location is Ha Tay (1 = Yes, 0 = No) 0.144 0.351 0.144 0.351 0.144 0.351 0.144 0.351 Hai Phong The firm’s location is Hai Phong (1 = Yes, 0 = No) 0.082 0.275 0.082 0.275 0.082 0.275 0.082 0.275 Nghe An The firm’s location is Nghe An (1 = Yes, 0 = No) 0.162 0.368 0.162 0.368 0.162 0.368 0.162 0.368 Quang Nam The firm’s location is Quang Nam (1 = Yes, 0 = No) 0.071 0.256 0.071 0.256 0.071 0.256 0.071 0.256 Khanh Hoa The firm’s location is Khanh Hoa (1 = Yes, 0 = No) 0.039 0.194 0.039 0.194 0.039 0.194 0.039 0.194 Lam Dong The firm’s location is Lam Dong (1 = Yes, 0 = No) 0.022 0.148 0.022 0.148 0.022 0.148 0.022 0.148 Ho Chi Minh City The firm’s location is Ho Chi Minh City (1 = Yes, 0 = No) 0.214 0.410 0.214 0.410 0.214 0.410 0.214 0.410 Long An The firm’s location is Long An (1 = Yes, 0 = No) 0.051 0.220 0.051 0.221 0.051 0.221 0.051 0.221 Observations The number of firms 4803 1601 1601 1601