wp mysql-enterprise whatsnewmonitor2.3.en
TRANSCRIPT

8/3/2019 Wp Mysql-Enterprise WhatsNewMonitor2.3.En
http://slidepdf.com/reader/full/wp-mysql-enterprise-whatsnewmonitor23en 1/7
MySQL Enterprise Monitor 2.3What’s New
Improved Monitoring, Ease of Use
A MySQL ®
White Paper
October, 2010
© 2010, Oracle Corporation and/or its affiliates

8/3/2019 Wp Mysql-Enterprise WhatsNewMonitor2.3.En
http://slidepdf.com/reader/full/wp-mysql-enterprise-whatsnewmonitor23en 2/7
Table of Contents
Introduction .................................................................................................................................3 Improved Monitoring ..................................................................................................................4 Conclusion ..................................................................................................................................7 Learn More...................................................................................................................................7
© 2010, Oracle Corporation and/or its affiliates2
8/3/2019 Wp Mysql-Enterprise WhatsNewMonitor2.3.En
http://slidepdf.com/reader/full/wp-mysql-enterprise-whatsnewmonitor23en 3/7
© 2010, Oracle Corporation and/or its affiliates3
Introduction
Oracle’s MySQL Enterprise Monitor is an enterprise monitoring solution for MySQL that enables you tokeep an eye on all of your MySQL servers from a consolidated, web-based dashboard. The EnterpriseMonitor proactively scans for real and potential performance, security and availability problems, andprovides alerts and MySQL expert advice that helps DBAs and Develoers find and fix the underlyingissues before they can become costly outages. To this end, the Enterprise Monitor collects MySQL andoperating system metrics from each of the MySQL Servers being monitored and uses a set of MySQLEnterprise Advisors to compare the status of the server to known best practice variable settings andvalues. When certain conditions and/or thresholds are reached or violated, the Advisors trigger eventsand optional SNMP or SMTP alerts that pinpoint the server needing attention and provide a complete,detailed summary of what happened and what actions should be taken to correct the problem or to tunethe server. In addition, statistical data and figures from the MySQL Servers are stored so users can viewthe information over time using the Enterprise Monitor’s collection of MySQL and operating systemgraphs, for both real-time and historical trend analysis.
Learn more about the Enterprise Monitor, Enterprise Advisors and Advanced Monitoring here:
http://mysql.com/products/enterprise/monitor.html
For deeper, application code level performance monitoring, analysis and tuning the Enterprise Monitorincludes the Query Analyzer, which can be configured to collect detailed information about the queriesexecuted across all of your development, QA and production servers. Query execution related data canbe browsed in aggregate via an intuitive user interface or can be filtered using “grab and go” correlationwith the Enterprise Monitor’s collection of graphs. Using this option users simply mouse over andhighlight a spike in any of the Monitor’s graphs and the Query Analyzer is opened, filtered for that specificpoint in time. Users can then easily analyze the queries that were running when a key resource was“pegged”. Once suspect query code is identified users can drill down into execution details, includingsample executions, EXPLAIN, histogram graphs on performance and application code level tracing.
Learn more about the Query Analyzer, enablement options, and application code level monitoring,
analysis and tuning here: http://mysql.com/products/enterprise/query.html
MySQL Enterprise Monitor 2.3 builds on Oracle’s continued investment in MySQL. In this latest version,the Enterprise Monitor can be used to monitor MySQL Servers that are part of a MySQL Clusterdeployment (including status information from the Data Nodes). MySQL Enterprise Monitor 2.3 alsoimproves general monitoring for MySQL and the Operating System by adding a set of new graphs formonitoring transactions and the new features available in InnoDB 1.1. Additionally, this latest versionenables all of the Enterprise Monitor’s features per Oracle’s commitment to providing the highest levels ofsupport to all users. Current MySQL users or those considering MySQL for new or future projects cannow use the full Enterprise Monitor feature set to implement MySQL in their development, QA andproduction environments, each with the highest levels of security, performance and availability.
MySQL Enterprise Monitor 2.3 includes these improvements:
Improved Monitoring
• New MySQL Cluster Advisor and Graphs – New MySQL Cluster specific Advisor Rules andGraphs enable users to ensure MySQL Cluster deployments are always up and running at thehighest levels of performance and availability..
o New MySQL Cluster Advisor Rules – Provide automated, real-time monitoring of Cluster datanodes memory, undo/redo buffer space, undo/redo log space, and node up/down status.
o New MySQL Cluster Graphs – Provide visual monitoring of Cluster data nodes memory,undo/redo buffer space, undo/redo log space.

8/3/2019 Wp Mysql-Enterprise WhatsNewMonitor2.3.En
http://slidepdf.com/reader/full/wp-mysql-enterprise-whatsnewmonitor23en 4/7
Learn more about the new MySQL Cluster Enterprise Advisor here: http://dev.mysql.com/doc/mysql-monitor/2.3/en/mem-reference-advgraph.html
• New MySQL and Operating System Graphs – New MySQL and OS specific graphs provide better
visual monitoring of key system resources for real-time and historical trending purposes.o New MySQL Graphs – Provide visual monitoring of database transactions, binlog cache
efficiency, binlog space usage, MyISAM key buffer activity, disk I/O, disk space and networkthroughput.
o New InnoDB specific Graphs – Provide visual monitoring of InnoDB 1.1 transactions andcompression times.
Each of these new features is detailed below.
Improved Monitoring
New MySQL Cluster Advisor and Graphs
MySQL Enterprise Monitor 2.3 provides a new MySQL Cluster- specific Enterprise Advisor that includesautomated best practice rules that alert on key performance and availability metrics from Cluster datanodes.
The new MySQL Cluster Advisor includes the following best practice rules:
• MySQL Cluster Data Node Memory Getting Low – Monitors and advises when the amount of datamemory configured for the data nodes starts to run low. Proactively ensures that database inserts donot fail as a result of low memory availability.
• MySQL Cluster Data Node Index Memory Getting Low – Monitors and advises when the amount ofindex memory configured for the data nodes starts to run low. Proactively ensures that databaseinserts do not fail as a result of low memory availability.
© 2010, Oracle Corporation and/or its affiliates4
8/3/2019 Wp Mysql-Enterprise WhatsNewMonitor2.3.En
http://slidepdf.com/reader/full/wp-mysql-enterprise-whatsnewmonitor23en 5/7
• MySQL Cluster Data Node Redo Buffer Space Getting Low – Monitors and advises when the redobuffers start to fill up so they can be proactively resized.
• MySQL Cluster Data Node Undo Buffer Space Getting Low - Monitors and advises when the undobuffers start to fill up so they can be proactively resized.
•
MySQL Cluster Data Node Undo Log Space Getting Low - Monitors and advises when the undo logspaces start to fill up so they can be proactively resized.
• MySQL Cluster Data Nodes Not Running - Monitors and advises when data nodes are not running sousers can proactively investigate and correct the issue.
The above rules can be automated to monitor MySQL Cluster data nodes by scheduling them to run onany MySQL Server that is connected to the Cluster using the ndbinfo database (introduced in MySQLCluster 7.1). The new MySQL Cluster Advisor can be activated (scheduled) against a single MySQLServer in the Cluster or against a redundant pair of servers in order to provide a higher level of availabilityfor the monitoring service. Further, each of the above rules can be automated to run at default or userspecified intervals and can be customized to better meet specific needs of a MySQL Cluster deploymentor application.
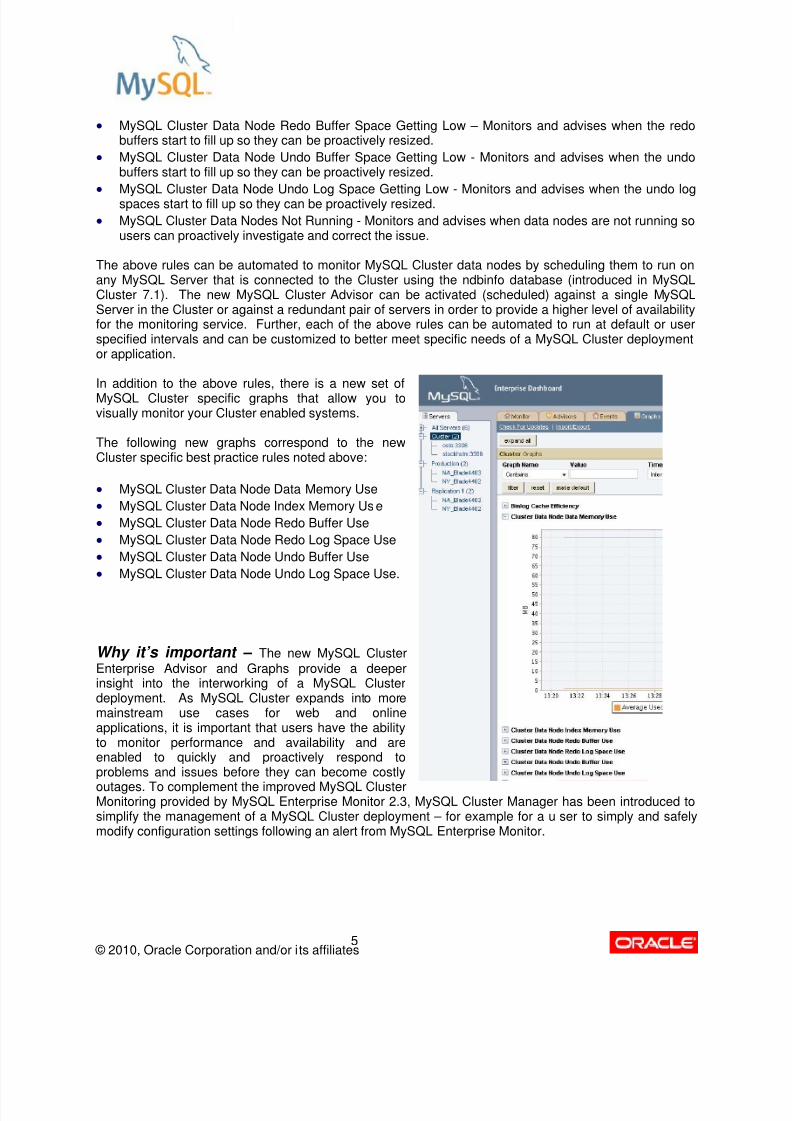
In addition to the above rules, there is a new set ofMySQL Cluster specific graphs that allow you tovisually monitor your Cluster enabled systems.
The following new graphs correspond to the newCluster specific best practice rules noted above:
• MySQL Cluster Data Node Data Memory Use
• eMySQL Cluster Data Node Index Memory Us
• MySQL Cluster Data Node Redo Buffer Use
• MySQL Cluster Data Node Redo Log Space Use
• MySQL Cluster Data Node Undo Buffer Use
• MySQL Cluster Data Node Undo Log Space Use.
ser to simply and safelyodify configuration settings following an alert from MySQL Enterprise Monitor.
Why it’s important – The new MySQL ClusterEnterprise Advisor and Graphs provide a deeperinsight into the interworking of a MySQL Clusterdeployment. As MySQL Cluster expands into moremainstream use cases for web and onlineapplications, it is important that users have the abilityto monitor performance and availability and areenabled to quickly and proactively respond toproblems and issues before they can become costly
outages. To complement the improved MySQL ClusterMonitoring provided by MySQL Enterprise Monitor 2.3, MySQL Cluster Manager has been introduced tosimplify the management of a MySQL Cluster deployment – for example for a um
© 2010, Oracle Corporation and/or its affiliates5

8/3/2019 Wp Mysql-Enterprise WhatsNewMonitor2.3.En
http://slidepdf.com/reader/full/wp-mysql-enterprise-whatsnewmonitor23en 6/7
New MySQL and Operating System Graphs
MySQL Enterprise Monitor 2.3 now includes a gallery of 40+ graphs that help you visually monitor yourMySQL and Operating System performance in real-time or over time to determine key resource usagetrends during peak user times.
Enterprise Monitor 2.3 includes these new and enhanced graphs:
New general usage graphs include:
• Database Transactions – monitors/tracks transaction statements per second
• Binlog Cache Efficiency – monitors/tracks cache operations per second
• Binlog Space Usage – monitors/tracks binlog space in MB
• MyISAM Key Buffer Activity – monitors/tracks cache operations per second
• ndDisk I/O Usage – monitors/tracks MB per seco
• Disk Space Usage – monitors/tracks GB used
Network – Interface Throughput – monitors/tracks throughput in KBs per second•
ewN graphs for InnoDB 1.1 include:
• InnoDB Transactions – monitors/tracks running, blocked and lock waiting transactions
InnoDB Cooperations
• mpression Time – monitors/tracks total seconds used during compress/uncompress
l graph
Adds Opened_table_definitions to the Opened Tables graph
Enhancements to current graphs include:
• Adds data dictionary memory usage to the InnoDB Buffer Poo
•
© 2010, Oracle Corporation and/or its affiliates6
8/3/2019 Wp Mysql-Enterprise WhatsNewMonitor2.3.En
http://slidepdf.com/reader/full/wp-mysql-enterprise-whatsnewmonitor23en 7/7
Why it’s important InnoDB 1.1, and Operat
– New and improved graphs provide better visual monitoring of key MySQL,ing System performance and throughput statistics.
Analyzer so users can visually monitorwn into application code level tracing. Finally, Enterprise Monitor 2.3 is fullySQL users and those considering MySQL for upcoming projects can use the full
rs, Query Analyzer, Replication Monitor and other advanced features to ensuretheir systems are always up and running at peak performance.
:
port ttp://mysql.com/products/enterprise/
ConclusionOracle’s MySQL Enterprise Monitor helps users manage one to many MySQL servers with less time andeffort, and helps reduce downtime by alerting and advising on problems before they become costlyoutages. The newest release of the Enterprise Monitor builds on Oracle’s commitment to MySQL byproviding a new MySQL Cluster Enterprise Advisor and Graphs gallery. This provides MySQL Clusterusers with a deeper insight into their Cluster deployments and adds to MySQL’s legacy of providingsolutions that are known for performance, reliability, and ease of use. Additionally, Enterprise Monitor 2.3provides a fresh set of MySQL and Operating System specific graphs that provide additional visual,correlated monitoring of server and application performance and throughput. As in previous releases, allof the new graphs are integrated with the MySQL Queryperformance and drill doenabled so all current Myset of Enterprise Adviso
Learn More
For more information on MySQL products and services, please visit MySQL Enterprise, the Enterprise Monitor, Query Analyzer and Production Sup h MySQL Cluster Architecture and New Features Whitepaper http://www.mysql.com/why-mysql/white-papers/mysql_wp_cluster7_architecture.php MySQL Cluster Manager Whitepaper http://www.mysql.com/why-mysql/white-papers/mysql_wp_cluster_manager.php
© 2010, Oracle Corporation and/or its affiliates7