wp1 - 2018: c.burlacu - patterns of use of payment instruments...
TRANSCRIPT

Máster en Microfinanzas e Inclusión Financiera

FacultaddeCienciasEconómicasMóduloII–Despacho212
c/FranciscoTomásyValiente,528049-Madrid
www.mastermicrofinance.com
UNIVERSIDADAUTÓNOMADEMADRID
ARTÍCULOCIENTÍFICOOPAPER
MÁSTERENMICROFINANZASEINCLUSIÓNFINANCIERA(9ªEdición)
PatternsofuseofpaymentinstrumentsacrossEuropeanUnion:
anapproximationthroughofficialstatistics
AUTORÍA: CorinaBurlacu
TUTORIZACIÓN: VerónicaLópezSabater
Presentadoparalaobtencióndel
TítuloPropiodelaUAM“MásterenMicrofinanzaseInclusiónFinanciera”
EnMadrid,el31demayode2018.

Facultad de Ciencias Económicas Módulo II – Despacho 212
c/ Francisco Tomás y Valiente, 5 28049 - Madrid
Page 2 of 53
TABLE OF CONTENTS
1. Abstract ....................................................................................................................................... 3
2. Glossary of Terms ....................................................................................................................... 4
3. Introduction ................................................................................................................................. 5
4. Payment System and its Importance for the Economy................................................................ 6
5. Payment System and Social Costs .............................................................................................. 8
6. Payment System and Decision Making on Payment Instruments ............................................... 9
7. Cash Payments .......................................................................................................................... 11
7.1. Distribution Network .................................................................................................................. 14
7.2. Average Cash Transactions ......................................................................................................... 15
7.3. Cash and Financial Inclusion ...................................................................................................... 16
7.4. Cash and economic (dis)incentives....................................................................................... 18
7.5. Cash and households expenditures ....................................................................................... 21
7.6. Cash and shadow economy ................................................................................................... 22
7.7. Cash and merchants behaviour ............................................................................................. 23
8. Alternatives for cash payments – electronic payments ............................................................. 23
8.1. Electronic Payments and Financial Inclusion ....................................................................... 25
8.2. Electronic Payments Value ................................................................................................... 25
8.3. Electronic Payments and Shadow Economy......................................................................... 26
8.4. Electronic Payments Usage .................................................................................................. 26
8.4.1. Credit Transfers ................................................................................................................ 28
8.4.2. Direct Debits .................................................................................................................... 29
8.4.3. Cheques ............................................................................................................................ 31
8.4.4. Card Payments and e-Money ........................................................................................... 33
8.4.4.1. Cards ............................................................................................................................ 33
8.4.4.2. Card acceptance network ............................................................................................. 35
8.4.4.3. Cards usage .................................................................................................................. 36
8.4.4.3.1. Cards usage (dis)incentives ..................................................................................... 37
8.4.4.4. Cards payments value at points-of-sale ....................................................................... 39
8.4.4.5. Cards payments and Internet access or mobile usage; E-money.................................. 40
8.5. Electronic Payments and Cybersecurity ............................................................................... 42
9. General Findings ....................................................................................................................... 43
10. CONCLUSIONS: Drivers of the Demand for Cash and Non-cash Payments ...................... 45
11. Proposals............................................................................................................................... 46
BIBLIOGRAPHY .............................................................................................................................. 49

Facultad de Ciencias Económicas Módulo II – Despacho 212
c/ Francisco Tomás y Valiente, 5 28049 - Madrid
Page 3 of 53
1. Abstract This paper analyses cash and electronic payments in the EU States and their
evolutions in the past ten years. Cash is an evergreen topic for the EU society and this paper tries to understand the drivers of demand for cash and cashless payments, and their implications. The research is based on the most recent payments statistics published by the European Central Bank (ECB) in SWD1 and most recent data on financial inclusion published by the World Bank. An important source of data was the ECB Occasional Paper Series No 201, “The use of cash by households in the euro area” (Henk Esselink, Lola Hernández, 2017). We conclude that it is not sufficient either to equip individuals with only basic transaction accounts or to ensure a high level of acceptance of digital payment technologies. Enhanced trust in new services that substitute cash and more involvement of consumers and merchants in the underlying process of change is a challenge for many stakeholders.
Acknowledgements
I sincerely thank my master thesis supervisor, Verónica López Sabater, for the support, time and expertise she shared with me. I would never forget her dedication and persistence while writing this thesis. It has been invaluable.
I want to thank Universidad Autónoma de Madrid and especially the Academic Director at International Master in Microfinance and Financial Inclusion, Maricruz Lacalle Calderón, for collaboration and patience during the whole study process and the opportunity to meet my master thesis supervisor, Verónica López Sabater, Director Fundacion Afi.
I also personally thank my classmate, Virginia Soto Sira, for her dedication in choosing the thesis theme. I really regret that she could not continue our work on this thesis.
1 ECB payments statistical data warehouse

Facultad de Ciencias Económicas Módulo II – Despacho 212
c/ Francisco Tomás y Valiente, 5 28049 - Madrid
Page 4 of 53
2. Glossary of Terms The ECB GLOSSARY OF TERMS RELATED TO PAYMENT, CLEARING AND
SETTLEMENT SYSTEMS provide the following definitions of retail and cashless payment instruments:
Automated teller
machine (ATM): an electromechanical device that allows authorised users, typically using
machine-readable plastic cards, to withdraw cash from their accounts and/or access other services (allowing them, for example, to make balance enquiries, transfer funds or deposit money).
Point-of-sale (POS) terminal:
a device allowing the use of payment cards at a physical (not virtual) point of sale. The payment information is captured either manually on paper vouchers or by electronic means.
Automated clearing house (ACH):2
an electronic clearing system in which payment orders are exchanged among participants (primarily via electronic media) and handled by a data-processing centre.
Retail payment: a non-time-critical payment of relatively low value. These payments are typically made outside of the financial markets and are both initiated by and made to individuals and non-financial institutions.
Card (payment card):
a device that can be used by its holder to pay for goods and services or to withdraw money.
Credit card (card with a credit function):
a card that enables cardholders to make purchases and/or withdraw cash up to a prearranged credit limit. The credit granted may be either settled in full by the end of a specified period, or settled in part, with the balance taken as extended credit (on which interest is usually charged).
Debit card (card with a debit function):
a card enabling its holders to make purchases and/or withdraw cash and have these transactions directly and immediately charged to their accounts, whether these are held with the card issuer or not.
Prepaid card: a card on which a monetary value can be loaded in advance and stored either on the card itself or on a dedicated account on a computer. Those funds can then be used by the holder to make purchases.
Credit transfer: a payment instrument allowing a payer to instruct the institution with which its account is held to transfer funds to a beneficiary.
Direct debit: a payment instrument for debiting of a payer’s payment account whereby a payment transaction is initiated by the payee on the basis of authorisation given by the payer.
Cheque: a written order from one party (the drawer) to another (the drawee; normally a credit institution) requiring the drawee to pay a specified sum on demand to the drawer or a third party specified by the drawer.
Electronic money:
a monetary value, represented by a claim on the issuer, which is: 1) stored on an electronic device (e.g. a card or computer); 2) issued upon receipt of funds in an amount not less in value than the monetary value received; and 3) accepted as a means of payment by undertakings other than the issuer.
Mobile payment (m-payment):
a payment where a mobile device (e.g. a phone or personal digital assistant (PDA)) is used at least for the initiation of the payment order and potentially also for the transfer of funds
Interchange fee: a transaction fee payable between the payment service providers involved in a transaction.
Merchant service charge (MSC):
a fee paid by the acceptor/merchant to the acquirer.
PSP Payment Services Provider
2 In this paper ACH payments is used for credit transfers, direct debits and cheques

Facultad de Ciencias Económicas Módulo II – Despacho 212
c/ Francisco Tomás y Valiente, 5 28049 - Madrid
Page 5 of 53
3. Introduction 3.1. Study object:
This paper analyses the patterns of use of retail payments instruments across EU countries in the past 10 years to figure out whether it is sufficient to equip individuals and retailers with basic transaction accounts or respectively with methods of acceptance of digital payments to move to a cashless economy.
3.2. Motivation:
Recent global financial inclusion efforts have generated perspectives of making available a broader range of financial services to individuals. Payments are inherent in everyday life. ECB defines retail payments to be mainly consumer payments of relatively low value and urgency3. Furthermore, the rapid development of new technologies and ascending growth of internet access fuelled the efforts of PSPs to ensure rapid acceptance of primary financial services (i.e. payments) by bank account holders. G20 Guidance Note for Governments (GPFI 2017) points that payments are typically the entry point in the use of financial services, and delivering financial services by digital means could spur economic growth.4 The EU states show, to a great extent, a high level of financial inclusion and this fact has motivated the author to find out whether a high level of financial inclusion generates a fast acceptance and use of electronic payments and the consequent independence of cash.
To purchase goods and services consumers use both cash and non-cash instruments. EU payment system have become increasingly digital within the last decade. At the same time, the quantity of cash in circulation has increased substantially. In this regard, the study comprises a literature review on consumer behaviour and an analysis of statistics in EU countries to better understand and identify the drivers of a fast transition to a cashless economy.
3.3. Relevance of the topic:
This paper provide an understanding on the evolution of patterns of use of payment instruments across EU countries within the last decade. Linked to this analysis the author use the evidence from different Diaries-based studies conducted in different countries, especially from the last ECB Occasional Paper Series No 201 “The use of cash by households in the euro area” (Henk Esselink, Lola Hernández, 2017). This topic is exciting because the payments industry is just beginning to be challenging. As explained above, the development and especially the promotion of the use of electronic payments is essential for economic development. Due to the synergy of the efforts of various stackeholders, several gaps could be avoided. The findings obtained in this research could help payment industry stakeholders to have an overview on use of retail payment instruments across EU countries within the last decade and find the optimal solution for efficient increase of non-cash payment instruments’ use in retail payments.
3.4. Research Methodology:
This paper applies a deductive approach based on analysis of data available at ‘ECB Payments statistics: methodological notes’ and the most recent payments statistics
3 https://www.ecb.europa.eu/paym/retpaym/undpaym/html/index.en.html 4 See : Mark Zandi, Virendra Singh, Justin Irving, 2013, “The Impact of Electronic Payments on Economic Growth”,
MOODYS ANALYTICS, February 2013

Facultad de Ciencias Económicas Módulo II – Despacho 212
c/ Francisco Tomás y Valiente, 5 28049 - Madrid
Page 6 of 53
published by the ECB and financial inclusion data by the World Bank. At the end the author did a summary of findings resulted from the statistical data analysis and submitted some relevant proposals.
3.5. Structure:
This paper is structured in eight chapters. The chapter “Payment System and its Importance for the Economy”, shows the importance of payments for the economy and impacts at macro level. Chapter 5 summarizes evidences on payments social and private costs at EU level. Chapter 6 highlights the impact at micro level from different Diaries-based studies conducted in different countries. Chapter 7 and 8 contains a statistical analysis of payments data in the last 10 years from the supply and demand side, and its correlation with the last indicators on financial inclusion, the shadow economy, etc., in search for incentives. The final chapters highlight the general findings and conclusions and some proposals aiming at streamlining the transition to non-cash payments.
4. Payment System and its Importance for the Economy Payments are inherent in everyday life, both for economic activity and households,
and banks have kept their role of major intermediary of these transactions among different agents: businesses, public institutions, individuals. What are the factors that determine the people to use payment instruments in their everyday life and what is the impact of their choice on the economy?
The payment system represents a foundation for the society to reap gains from economic exchanges (Malte Krüger, 2014). Deficiencies in payment systems’ functionality have effects on circulation of commodities and services. The choice of one specific payment method is made under the influence of innovative payment instruments provided by different providers, as well as changes and even historical habits and cultural traditions of consumers. The payment system is a necessary requisite to boost domestic and external trade, to develop financial system and to increase the welfare of the society (Malte Krüger, 2014).
Bank accounts are a centerpiece of retail payments services. Companies and individuals who do not hold accounts are limited to cash payments. While cash serves for certain day-to-day low value needs, it has considerable disadvantages for remote and/or of higher value payments such as eventual higher costs of delivery or higher risks of loss or theft (BIS and World Bank, 2015).
In late 2013, the President of the World Bank Group, Dr. Jim Yong Kim, set a goal of achieving Universal Financial Access (UFA) by 2020. The UFA goal was explicitly defined as “universal ownership of a store-of-value transaction account” (BIS and World Bank, 2015). Financial inclusion also involves making a broader range of financial products and services available to individuals who currently only have access to basic financial products (MONEYVAL, 2014, pag.7). Significantly reducing use of cash would reduce the massive transaction costs and thus make more affordable services mostly used within day-to-day households’ life. A report by A.T. Kearney and Friedrich Schneider (2013) points that increasing banking inclusion and the use of electronic payment systems brings more transparency to transactions and makes participating in the shadow economy more difficult.

Facultad de Ciencias Económicas Módulo II – Despacho 212
c/ Francisco Tomás y Valiente, 5 28049 - Madrid
Page 7 of 53
The transition process to a cashless economy has an important economic dimension. The existing studies indicate a link between the development of cashless system and economy growth (Iftekhar Hasan et al., 2012). It is considered that electronic retail payments render the economy more efficient. According to Wilko Bolt and Sujit Chakravorti (2010), technological progress has the potential to replace many paper transactions and reduce face-to-face transactions. However, the rate at which these changes will take place depends on the benefits and subjacent costs for the participants in the payment ecosystem. Moody's Analytics shows that using cards render the economy more efficient, offering a significant boost to economy growth year-by-year, among many factors, including the efficiency of transactions, access of consumers to credit and trust of consumers in payment systems, in general. Use and penetration of these payment instruments enhance personal consumption. Increased used of credit and debit cards contributes to economy by reducing the costs of transactions and improving the efficiency of commodity and service flows (Mark Zandi et al., 2013).
Other studies showed that technological development in the financial system is related to significant increases of productivity due to enhanced services delivered by banks (Allen N. Berger, 2003). Rafael López del Paso examined the Spanish case to analyze how the evolution of retail payment systems may change the behaviour of the demand for deposits and hence, bank credit supply. The results show that banks seem to have benefited from cashless instruments to adjust their credit supply when interest rates go up. The development of retail payment system has helped Spanish banks to increase their deposits and hence, credit supply. Moreover, larger institutions – usually with more liquidity – seem to benefit from the evolution of payment network to extend their loans. On the other hand, Fernando Alvarez and Francesco Lippi (2009) developed a theoretic model that points out that the elasticity of demand for money compared to interest rate decreases due to reduced cost of withdrawals from ATMs and costs of transactions. However, Naoki Wakamori and Angelika Welte (2012) show that the magnitude of cash use reduction is quite limited. The implication of this result resumes to the fact that current cash usage is driven by demand-side factors – consumers prefer cash especially in small transactions. Amromin and Chakravorti (2009) ascertain that the intensity of using debit cards has led to a lower demand for banknotes and low value coins, although the demand for high value banknotes has not been affected. In turn, the increase of interest rates influences the decrease of demand for high denomination banknotes but does not affect the use of debit cards.
A study by Humphrey et al. (2003) shows that the decision to use a certain payment method is based to great extent on price. Moreover, the evidence-based results of the Netherlands (Nicole Jonker et al., 2015) indicated positive effects of a public company on the use of debit cards. The company contributed to the replacement of cash with debit card payments reducing, thus, the social costs of retail payments. However, due to small changes in the number of debit card payments, the cost savings were rather modest. Taking into account that social benefits of electronic payments are quite high, these should convince the authorities to allow for coordination with payment services providers to implement policies to accelerate the cashless transition. The decrease in interest rate margins could accelerate the need for such decisions (Wilko Bolt et al., 2005). In
Facultad de Ciencias Económicas Módulo II – Despacho 212
c/ Francisco Tomás y Valiente, 5 28049 - Madrid
Page 8 of 53
particular, considering the positive impact of use of payment cards on GDP growth5, which according to Moody's Analytics would increase proportionally to private consumption growth generated by the use of cards (Mark Zandi et al., 2013).
5. Payment System and Social Costs
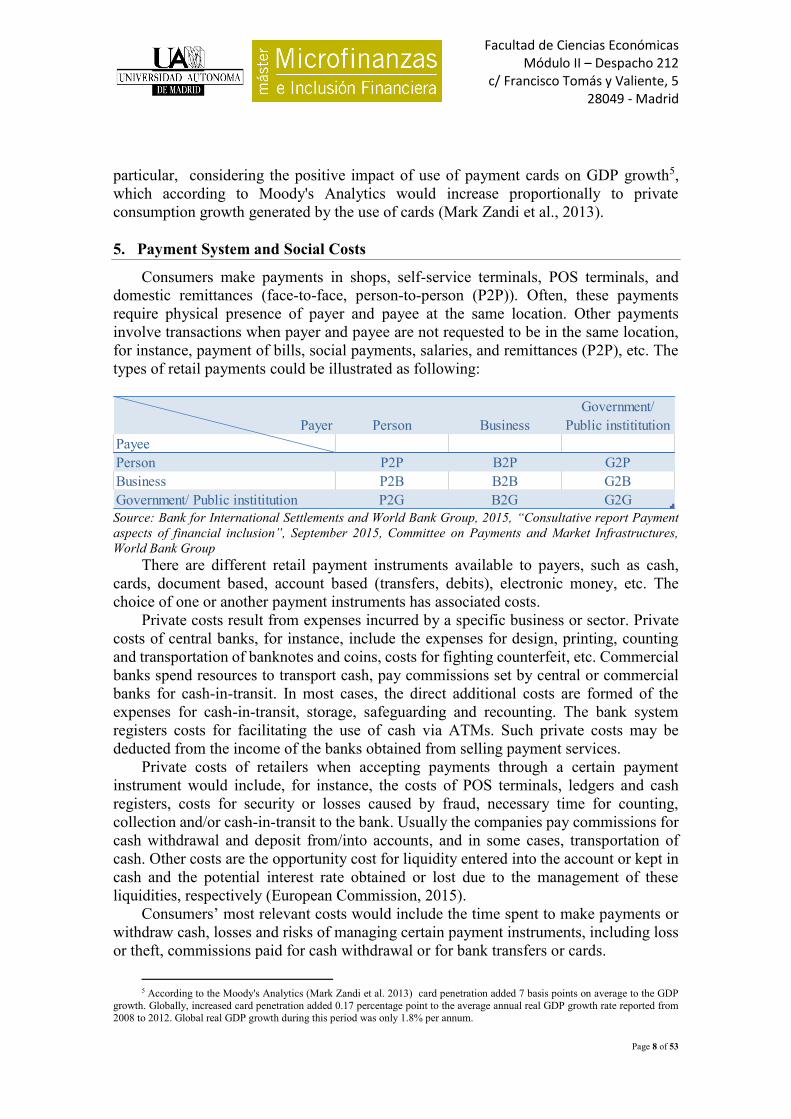
Consumers make payments in shops, self-service terminals, POS terminals, and domestic remittances (face-to-face, person-to-person (P2P)). Often, these payments require physical presence of payer and payee at the same location. Other payments involve transactions when payer and payee are not requested to be in the same location, for instance, payment of bills, social payments, salaries, and remittances (P2P), etc. The types of retail payments could be illustrated as following:
Source: Bank for International Settlements and World Bank Group, 2015, “Consultative report Payment aspects of financial inclusion”, September 2015, Committee on Payments and Market Infrastructures, World Bank Group
There are different retail payment instruments available to payers, such as cash, cards, document based, account based (transfers, debits), electronic money, etc. The choice of one or another payment instruments has associated costs.
Private costs result from expenses incurred by a specific business or sector. Private costs of central banks, for instance, include the expenses for design, printing, counting and transportation of banknotes and coins, costs for fighting counterfeit, etc. Commercial banks spend resources to transport cash, pay commissions set by central or commercial banks for cash-in-transit. In most cases, the direct additional costs are formed of the expenses for cash-in-transit, storage, safeguarding and recounting. The bank system registers costs for facilitating the use of cash via ATMs. Such private costs may be deducted from the income of the banks obtained from selling payment services.
Private costs of retailers when accepting payments through a certain payment instrument would include, for instance, the costs of POS terminals, ledgers and cash registers, costs for security or losses caused by fraud, necessary time for counting, collection and/or cash-in-transit to the bank. Usually the companies pay commissions for cash withdrawal and deposit from/into accounts, and in some cases, transportation of cash. Other costs are the opportunity cost for liquidity entered into the account or kept in cash and the potential interest rate obtained or lost due to the management of these liquidities, respectively (European Commission, 2015).
Consumers’ most relevant costs would include the time spent to make payments or withdraw cash, losses and risks of managing certain payment instruments, including loss or theft, commissions paid for cash withdrawal or for bank transfers or cards.
5 According to the Moody's Analytics (Mark Zandi et al. 2013) card penetration added 7 basis points on average to the GDP
growth. Globally, increased card penetration added 0.17 percentage point to the average annual real GDP growth rate reported from 2008 to 2012. Global real GDP growth during this period was only 1.8% per annum.
Payer Person BusinessGovernment/
Public instititutionPayeePerson P2P B2P G2PBusiness P2B B2B G2BGovernment/ Public instititution P2G B2G G2G

Facultad de Ciencias Económicas Módulo II – Despacho 212
c/ Francisco Tomás y Valiente, 5 28049 - Madrid
Page 9 of 53
Social costs reflect the value of all resources consumed in connection to a payment method. The ECB 2012 Study “The Social and Private Cost of Retail Payment Instruments – a European Perspective”, (Schmiedel, Heiko et al., 2012) pointed that social costs of retail payments are substantial 1 % of GDP or EUR 130 billion - all EU27. The breakdown of social costs according to the same study emphasised that the highest portion is covered by the banks and infrastructures (51%), followed by retailers and companies (46%), Central Banks (3%) and cash-in-transit (1%).
Based on their structure, social costs differ from one country to another. In EU, according to ECB Study (Schmiedel, Heiko et al., 2012) the social costs of cash were quantified at EUR 0.42 per transaction compared to costs of debit cards (EUR 0.72), direct debits (EUR 1.27), credit transfers (EUR 1.92). Credit cards (EUR 2.39) and cheques (EUR 3.55) have high social costs. These data should not absolutise the efficiency of social cost of cash due to its weight in retail transactions (scale effect), as well as historical evolution of its management mechanisms and streamlining of cash-management costs.
Central banks see cash as a commodity with an evergreen potential, due to their monopoly on the issuing process for which they collect a seigniorage fee.6
The promotion of cashless payments results in cost and revenue redistribution between public and private stakeholders. Electronic payment service providers (mostly banks) see the merchants as a source of revenue and charge commissions for use of electronic payment infrastructure. On the other hand, more often, the consumers pay to access this infrastructure (either as transaction commission or annual standard bank service fee, usually on a bank account or debit card). When cash comes into light, banks cover the costs for infrastructure for cash distribution and collection, not always being able to cover the direct costs with the commissions received (Paul van der Knaap et al., 2016).
Moreover, the author supposes that the retailers with high volumes of sales benefited as the banks from preliminary acceptance of electronic payments, currently benefiting from the scale effect over the years. Therefore, they also could benefit from the trust of their clients in the case of promotion sales using new digital payment method.
6. Payment System and Decision Making on Payment Instruments The most efficient payment instruments from the point of view of social costs are not
always attractive to users, who usually choose the most efficient method based on their individual private costs. The statistics show that in European states with higher level of digitalisation, the social costs of electronic payments are quite low (see case of Sweden: Mats Bergman et al., 2007). However, the electronic or paper-based payment instruments are also chosen for other benefits such as convenience, anonymity and accessibility.
Convenience, level of income and education are relevant in choosing the payment method. The 2009 Study of Deutsche Bundesbank highlights that (i) acceptance (access), (ii) convenience and speed as well as (iii) security and protection against financial losses were pivot criteria for consumers in Germany (Andreas Hoffmann/Dr Heike Wörlen, Andrea Friedrich, Nadine Knaust, Dr Ulf von Kalckreuth, Dr Tobias Schmidt, 2009).
6 Seigniorage, is the difference between the value of money and the cost to produce and distribute it. Seigniorage is a convenient
source of revenue for some governments. By providing the government with increased purchasing power at the expense of the public's purchasing power, it imposes what is metaphorically known as an inflation tax on the public. (https://en.wikipedia.org/wiki/Seigniorage)

Facultad de Ciencias Económicas Módulo II – Despacho 212
c/ Francisco Tomás y Valiente, 5 28049 - Madrid
Page 10 of 53
The 2013 Study of Central Bank of Spain (Marina Pérez et al., 2014) emphasised that individuals (85.7%) choose cash on retail market based on convenience (39.2 %), control over spending (21.1 %) and speed (16.6 %), while small retailers or hotels (93%) make their decision based on factors such as cost (41.2 %), convenience (25.3 %), and speed (20.4 %).
Research by Riksbank (Björn Segendorf and Thomas Jansson, 2012) points out that the choice of payment methods by consumers depends to some extent on their habits. Cash use grows with age and is more often seen among men, while use of cards grows along with income level, education level and is more frequently used by women.
According to ECB Study (John Bagnall et al., 2014), higher income and higher education are associated with lower cash use. People over 36 use significantly more cash than people 35 years or less. Cash use is strongly related to the acceptance of cards by the retailer and type of POS.
The study of the Bank of Canada (Kim P. Huynh et al., 2014) indicates that increased acceptance would strongly reduce demand for cash. Demand for cash in areas where cards are not accepted is determined partly by precautionary reasons or infrequent lumpy purchases that are paid for in cash.
In their study, Łukasz Goczek and Bartosz Witkowski (2015) note that one of the factors that can determine popularity of card payments is people´s trust in banks´ safety.
Another Study of Mats Bergman, Gabriella Guibourg and Björn Segendorf (2007) points out that Swedish clients are sensitive to economic incentives and determines that card and cash usage by consumers coincides strongly with private economic incentives. The Study of Naoki Wakamori and Angelika Welte (2012) suggests that multiple credit card holders prefer using the one with a higher credit limit or higher reward points. On the other hand, when consumers make lower value payments or those of a younger age, the use of credit card is less likely.
According to the study of Crystal Ossolinski, Tai Lam and David Emery (2014), cash is an important payment method, especially for low value payments. The use of cash grows along with the age of respondents. Secondly, the use of cash is lower in households with higher revenues, although this may be due to the effect of income on the mix of consumption and access to financial services (such as credit cards).
In Estonia, according to the survey commissioned in 2017 by Eesti Pank, convenience is the top priority for people making payments, followed by price and speed. Despite high popularity of electronic payments, Estonians do not accept the idea of a cashless society. Small towns’ inhabitants and pensioners, who tend to live alone, are more reluctant. Supporters are high income or young people aged between 18 and 34 years.
Results of the 2017 ECB Study (Henk Esselink, Lola Hernández, 2017) showed that the characteristics such as acceptance, speed and budgetary features of payment instruments are considered important aspects and may influence their choice.
However, it is less likely that cash will be replaced completely because cash and electronic payments are imperfectly substitutable. Cash has features that electronic payments do not. Key factors that influence the choice of electronic or cash payments could be generalized as follows (Paul van der Knaap et al., 2016):

Facultad de Ciencias Económicas Módulo II – Despacho 212
c/ Francisco Tomás y Valiente, 5 28049 - Madrid
Page 11 of 53
Efficiency –defined from a cost-efficiency perspective, measured generally as cost per transaction.
Availability –referred to as the accessibility of a certain payment method for the general public. In the case of credit transfers, direct debits and cards, the electronic payments require, besides a bank account, a special infrastructure in place and connection to processing and clearing and settlement mechanisms. For cash, this infrastructure is less complex and is already present. For cash payments no third party has to be involved. Cash is accepted virtually everywhere and is an easy and quick payment alternative in almost all circumstances (i.e. except for remote payments, e-commerce etc.). The potential disadvantages of the cards are that these are not accepted everywhere, technical disruptions, power failure or loss of data. The impossibility or technical obstacles for refund in case of electronic payments could be an argument why the retailers keep cash in their shops, while a cash payment is easy to refund.
Reliability – or payment performance. On the whole, cash transactions are much more reliable than non-cash payments. In general, cash is legal tender that signifies that is a medium of payment recognized by a legal system to be valid for meeting a financial obligation. This status is under scrutiny as an increasing number of shops in an increasing number of countries have declared themselves cash-free. Moreover, the uptime of cash is 100% compared to electronic payments.
Safety – in authorization, authentication and integrity of every transaction. Cash implies the risk of theft. However, due to cash availability, each of us can decide anytime whether to trust one or another payment instrument and/or what information to provide to a certain player on the market.
A common feature of both types of payment is that these are associated with considerable economy of scale. Establishing a logistics infrastructure to manage payments is costly in both cases. Once the infrastructure is in place, the marginal costs for marginal cash manipulation or additional electronic payment will drop. It means that the average cost of a certain payment decreases with the increase of the number of payments. In the case of electronic payments, there are possible effects of synergy that enhance continuously the economy of scale, because different types of electronic payments may be processed integrally or partly in the same infrastructure (Björn Segendorf, Thomas Jansson, 2012). The informational technologies evolution may seem to have an increased impact on the productivity and scale economy in processing electronic payments, which reduced dramatically the costs and may explain partly the redirection of client preferences from paper money to electronic payments (Allen N. Berger, 2003).
7. Cash Payments
In the ECB Occasional Paper “The social and private costs of retail payment instruments: a European perspective” (Schmiedel, Heiko et al., 2012), the authors state that cash is the most frequently used retail payment instrument on average. Furthermore,

Facultad de Ciencias Económicas Módulo II – Despacho 212
c/ Francisco Tomás y Valiente, 5 28049 - Madrid
Page 12 of 53
according to the authors of “World Payments Report 2016” of Capgemini and BNP Paribas, the quantity of cash in circulation has increased at global level in the last years.
In EU, the volume of cash in circulation has increased continuously and accounted for about EUR 1,170 billion in 2017. Compared to 2002, the volume of cash in circulation increased by about 5.3 times. In the same period, demand for banknotes grew: EUR 500 denominated notes (+8.5 times), EUR 100 (+7.2 times), EUR 50 (+6.9 times), and EUR 20 (+3.2 times). At the end of 2017, EUR 500 banknotes accounted for 21.9% or total; EUR 100, EUR 50 and EUR 20 accounted for about 70.9% of total cash in circulation (Fig.1, 2).
According to “The Cash Report 2016 for Europe” (Paul van der Knaap et al., 2016),
cash represents 60% of all payment transactions in the EU28 and it is by far the largest payment instrument in terms of volume; when limited to a C2C or C2B environment, where cash is commonly most used, this percentage would be even higher.
Amromin and Chakravorti (2009) separate the demand for cash as a payment method from demand for cash as a store of value by dividing the total currency stock into three denomination categories (small, medium and large). The medium category covers those banknotes denominations commonly dispensed by ATMs. Large-denomination banknotes are posited to be held for store of value purposes. Banknotes and coins in the small-denomination category are considered in use for the purpose of giving change.
In “The Cash Report 2016 for Europe” (Paul van der Knaap et al., 2016, pag.17), Ton Roos7, ECB acknowledges: ‘In the euro area we have seen a strong increase in the demand for cash at times of turmoil in the financial markets or in the case of sovereign debt crises. The supply of cash via ATMs has proven to be very important when banks had to be closed for a prolonged period of time. According to our estimates around 2/3 of the total amount of cash in circulation is used for hoarding. This means that ‘only’ 1/3 is used for actual transactions. Hoarding occurs mostly with larger denominations (200 and 500 euro), yet we estimate that almost half of the 50 euro notes is also used for this purpose.”
The ECB Study (Henk Esselink, Lola Hernández, 2017, pag.5) also confirms that cash is not only used as a means of payment, but also as a store of value, with almost a quarter of consumers keeping some cash at home as a precautionary reserve. Almost 20%
7 Ton Roos has been the Director Banknotes at the European Central Bank in Frankfurt since November 2008.

Facultad de Ciencias Económicas Módulo II – Despacho 212
c/ Francisco Tomás y Valiente, 5 28049 - Madrid
Page 13 of 53
of respondents reported having a €200 or €500 banknote in their possession in the year before the survey was carried out.
When looking at the distribution of the value of cash withdrawals by source, results demonstrate that ATMs were by far the most important source of cash (61%), while on average 8% was withdrawn from bank counters and only 2% was obtained via cashback (Henk Esselink, Lola Hernández, 2017, pag.37).
Because cash is primarily made available to the general public through ATM’s and bank branches, in this paper the author analyzes “cards cash withdrawals”8 shown in ECB payments statistical data warehouse9 (SDW) as a proxy for retail cash payments.
ECB (Henk Esselink, Lola Hernández, 2017, pag.16) estimates the value of cash payments resulting from the study to equal roughly 93% of cash withdrawals in the SDW. Some of the cash withdrawn leaves the country and is spent abroad when consumers travel.
According to SDW ECB, in 2006-2016, with some exceptions (UK, Sweden,
Netherlands, Finland, Ireland), most EU10 states registered an ascending evolution of cash withdrawals caused by both the demand for and printing of bank cards for a growing number of clients without changing their payment habits (Fig.3,4), as well as other factors such as migration or tourism. In such countries as Cyprus, Estonia, Spain, Greece, Portugal, Latvia, and Ireland the demand for cash from ATMs has been massively influenced by the behaviour of holders of bank card issued by non-resident PSPs. In this case, the author can admit that the number of tourists or seasonal migrants compared to total population has influenced enormously the demand for cash. On the other hand, the growing evolution of the demand for cash of holders of bank card issued by resident PSPs in Luxembourg, Ireland, Cyprus, Estonia, Latvia, Finland, Netherlands, Sweden,
8 Cards cash withdrawals includes: All transactions - For cards issued by resident PSPs, cards (all) - Via customer terminals provided by resident PSPs - e-money
card loading/unloading terminals - Value - Non-MFIs counterpart All cash transactions - For cards issued by resident PSPs, cards (all) - Via customer terminals provided by resident PSPs - cash
withdrawals - Value - Non-MFIs counterpart All cash transactions - For cards issued by resident PSPs, cards (all) - Via customer terminals provided by non-resident PSPs -
cash withdrawals - Value - Non-MFIs counterpart All cash transactions - For cards issued by non-resident PSPs, cards (all) - Via customer terminals provided by resident PSPs -
cash withdrawals - Value - Non-MFIs counterpart Resident Cards cash withdrawals includes: All cash transactions - For cards issued by resident PSPs, cards (all) - Via customer terminals provided by resident PSPs - cash
withdrawals - Value - Non-MFIs counterpart 9 http://sdw.ecb.europa.eu/reports.do?node=100000760 10 EU average +18.8% 2016 compared with 2006.

Facultad de Ciencias Económicas Módulo II – Despacho 212
c/ Francisco Tomás y Valiente, 5 28049 - Madrid
Page 14 of 53
Slovenia, Germany, and Belgium had an impact on the value of cash withdrawal via customer terminals provided by non-resident PSPs.
To describe the situation of retail cash payments made within the EU states, the researcher will use some Key Performance Indicators (KPIs) to shed light on these based on cash supply and demand, as well as on the trends registered in the EU states in this regard, and potential drivers that have an impact on these evolutions.
The cash payments analysis based on our KPIs includes the number of ATMs per million inhabitants and offices of institutions offering payment services to non-MFIs per million inhabitants, value and number of resident cards cash withdrawals per capita, per card, per terminal, share of resident cards cash withdrawals per capita in final consumption expenditures of households per capita etc.
7.1. Distribution Network
With regard to clients' access to payment services, in the process of streamlining operational activity, the institutions offering payment services to non-MFIs have tried to reduce or simplify the infrastructure.
In the past 10 years, EU institutions rendering payment services have reduced the number of offices by 15.9 thousand or by about 5.8%. This reduction has been more dramatic (-23 thousand offices) in the last 4 years, showing that after a period during which the number of offices was growing, the institutions have reversed the trend, including due to extension of digital solutions for making payments (Fig.6)
On average, the EU states registered 508 offices providing payment services per one million of inhabitants and about 868 ATMs per million of inhabitants (Fig.5). Denmark, the Netherlands, Sweden and Finland were the states with lowest density of infrastructure in 2016. At the other end of the list, Belgium, Portugal, Austria, Spain, UK and Germany had a dense infrastructure of ATMs by over one thousand units per one million of inhabitants. Only Spain reduced the number of ATM infrastructure in the past ten years by about 8.5 thousand units, which is the highest reduction in the EU. As for the number of offices providing payment services per million of inhabitants, Poland leads (1.6 units/million inhabitants) with a recent increase of infrastructure by about 38 thousand units or by 2.7 times – a diametrically opposite trend compared to the EU average. On the other hand, the author should mention that the decrease of the number of offices providing payment services in the EU has been essentially influenced by the evolutions recorded in Germany, Spain, Italy and France, which lately reduced the office infrastructure by about

Facultad de Ciencias Económicas Módulo II – Despacho 212
c/ Francisco Tomás y Valiente, 5 28049 - Madrid
Page 15 of 53
10.2 thousand, 14.5 thousand, 3.7 thousand and 3.2 thousand units, respectively. Lithuania is one of the countries that after an increase in the number of offices in the last 4 years, it decreased drastically by about 3.2 thousand units.
The intensity of using the available infrastructure by cardholders issued by PSPs and
average number of card cash withdrawals per card indicates significant differences in the EU states. Of course, high density of ATMs generates a reduced utility of these terminals as in Spain, Italy or Luxemburg. However, countries such as Finland, Netherlands, Ireland, Estonia and Sweden, besides intense use of available infrastructure, have registered in the last decade a decreased use of terminals for cash withdrawals by (-28.5%), (-17%), (-50%), (-31%) and (-56%), respectively. Poland, Germany and Slovenia, once the ATM infrastructure increased, registered in the past 10 years a decrease of use intensity of terminals for cash withdrawals by (-44.5%), (-19%) and (-23.4%), respectively. (Fig.7, 8) On the other hand, once the number of ATMs increased per million of inhabitants by 44.7%, Austria registered in the last decade a double increase of use of terminals to withdraw cash.
Moreover, Austria ranks in top EU states relating to average size of transaction of cash withdrawal per capita, which has increased by 2.7 times in the past ten years registering in 2016 EUR 465.
7.2. Average Cash Transactions
It is difficult to align the volume of cash transactions to the number of cash withdrawals from ATMs because cash transactions are not recorded, and to see the bigger picture, the author would need all data (Fig.9).
According to ECB (Henk Esselink, Lola Hernández, 2017, pag. 21-25), on average in the euro area, the value of a

Facultad de Ciencias Económicas Módulo II – Despacho 212
c/ Francisco Tomás y Valiente, 5 28049 - Madrid
Page 16 of 53
cash transaction was €12.38. In terms of value of transactions, the average value of a cash transaction was the highest in Cyprus, Luxembourg and Austria where it ranged from €18.60 to €17.80. In contrast, the average value of cash transaction was the lowest (below €10) in Spain, Latvia, France and Portugal where it ranged between €8.80 and €7.50. In general, cash was the instrument of choice for purchases under €45. Although the share of cash payments above €100 was small, in terms of value they amounted to 10% of the value of all cash payments at POS in the euro area. The share of cash payments above €100 in the total value of cash payments at POS was wide-ranging, from 3% in France or 5% in Belgium, to 21% in Ireland and Slovenia or 26% in Greece.
7.3. Cash and Financial Inclusion
The level of financial inclusion would represent a prolific framework to register a decreasing trend of cash use. One of the factors that would influence the lack of a bank account is level of poverty, even if the bank account does not cost a fortune. However, for those with little money, any commission counts. On the other hand, in a more advanced economy is more expensive not to have a bank account and/or bank card and pay only with cash. For instance, in Great Britain, the two million residents of this country who use cash and not a bank account have additional costs (poverty tax) up to £ 1,300 a year (UK Financial Inclusion Commission, 2015).
According to the latest survey of the World Bank (WB Global FINDEX 2017), the population share holding a bank account in the EU accounted for over 90%, being different by countries.
However, the unbanked in Central and Eastern Europe countries reported the factors that impede them from having a bank account: high costs of banking services (Hungary: 59.4%, Slovakia: 46.2%, Czech Republic: 39.6%), lack of sufficient funds (Bulgaria: 65.5%, Romania: 57.7%, Slovakia: 54.2%). Other factors such as distance to the nearest bank office (Bulgaria: 20.4%) or lack of confidence in the banking system (Hungary: 49.4%) were other declared reasons (Fig. 10, 11, 12, 13).

Facultad de Ciencias Económicas Módulo II – Despacho 212
c/ Francisco Tomás y Valiente, 5 28049 - Madrid
Page 17 of 53
The 2014 ECB Study (John Bagnall et al., 2014) points out an important correlation between cash use and the amount of cash balances consumers carry. It is clear that the author cannot talk about a decrease of cash use for personal consumption on the condition when many payments such as wages or other government payments in some EU states are still made in cash.
According to the latest WB Global Findex data published in April 2018, countries like Romania (60.25%), Bulgaria (48.5%), Hungary (37.7%), Lithuania (32.2%), Slovakia (31.6%), and Czech Republic (25.9%) reported a high level of population receiving state pensions in cash (Fig.14). Compared to other EU states, these countries reported a high share of beneficiaries of government transfers were received in cash: Romania (52.1%), Hungary (32.4%), Lithuania (17%), Slovakia (23.1%), and Czech Republic (17.2%). Other countries like Croatia (11.2%), Ireland (8.6%), Poland (7.9%), and Greece (5.2%) also paid in cash to beneficiaries of government payments (Fig.15).
The EU states reported a high level of wages paid in cash in Romania (32.21%), Cyprus (30.02%), Greece (16.32%), Bulgaria (14.93%), Hungary (13.25%), Portugal (12.46%), Malta (7.97%), Lithuania (7.12%), and Italy (6.35%), which indicates that the main source of this resides in the private sector accounting to 40.3% in Romania and 7.07% in Italy (Map 1).
Demonetization of transfers of wages and government payments would inevitably generate an increase of financial inclusion. The initiatives of the governments to move from cash payment of wages to bank payments would encourage the private employers to do the same.
Furthermore, according to WB Global Findex 2017, 8.7% of adult population in the euro zone received its wages from the state and in countries like Sweden - 25%, Slovakia -19%, Romania - 16% accounted for significant shares of employees in public sector.

Facultad de Ciencias Económicas Módulo II – Despacho 212
c/ Francisco Tomás y Valiente, 5 28049 - Madrid
Page 18 of 53
Moreover, the digitalization of government payments could benefit the Government by enhancing the security, transparency and efficiency of these payments.
According to the Report of the Council of Europe (MONEYVAL, 2014), the states and territories with mature financial systems, especially international financial centers, believe that the subject of financial inclusion should not be considered seriously, because their financial
sector is well developed and their residents have no obstacles in accessing financial services.
However, financial inclusion data in the euro zone indicate that about 35.2% of the population receiving pension form the state, 35.5% of population receiving government transfers and 19.1% of population receiving salaries – received these in their first opened bank account (Fig.16).
Relatively constant European average of the share of cash withdrawal transactions value to GDP (Fig.17) shows a natural leap of cash payments through bank offices and/or cash offices of business and institutions into card accounts, without influencing significantly the payment habits of the consumers. More, the high level of account ownership within a financial institution not always demonstrates a low predilection to withdraw cash (Fig. 18).
7.4.Cash and economic (dis)incentives Can we explain consumers’ choice of payment methods by studying what economic
incentives they have?
In various EU countries, restrictions on the use of cash are in place. In some cases, the limits imposed to residents of EU area have spiked the number of accounts held, especially bank cards, as well as bank transactions.

Facultad de Ciencias Económicas Módulo II – Despacho 212
c/ Francisco Tomás y Valiente, 5 28049 - Madrid
Page 19 of 53
For example, France has a limit for cash payments of EUR 1,000 which was cut down from EUR 3,000 in September 2015, Spain (since 2012) – EUR 2,500, Italy and Portugal (since 2012) EUR 1,000. Furthermore, in France government institutions cannot pay taxes, fees, and medical services in cash above EUR 300. In Spain fines for a cash payment of EUR 2,501 would rise to 25% of the amount, and in Italy all rental payments, even for holiday have to be done via bank. In Portugal the law requires that the payment of invoices or similar documents of the amount of more than EUR 1,000, should be made to retailer’s bank account by a mean that allows the identification of the receiver (bank transfer, bank debit or by a nominative cheque. In Greece cash payments (including VAT) for the purchase of products and services are permissible up to EUR 1,500. Beyond that limit, payments should be done via bank accounts, cheques or credit/debit cards. In Denmark, no limit on cash payments if they exceed a certain amount. However, a consumer will be jointly and severally responsible with the merchant, if the merchant does not pay taxes and VAT of the purchase price. This applies in cases where a purchase of either goods or services is paid in cash exceeding 10.000 DKK (including VAT) – approx. EUR 1,340. If a consumer cannot pay digitally, he can be released from the joint responsibility, if he reports the amount of the purchase to the Taxation Authority. In Sweden there are no limits in the legislation. However, the accepted payment instruments may be limited on contractual basis. A trader is not obliged to accept cash as payment, if the limitation is stated clearly before making the sale.11
In Germany, Austria, Cyprus, Malta, Slovenia, Lithuania, Finland there are no limits on retail cash payments. In 2016, the German Government announced the intention to introduce a limit of EUR 5,000 for cash payments. The initiative resulted in adverse reactions in the society, especially in the context of German banks intention to charge interest on money kept in the bank. This reluctance can be attributed to German special socio-demographic situation, since it is proven that older people are addicted to their old payment habits. One of the influencing factors could be that persons older than 65 years in Germany prevail 21% of total population, one of the highest rates within EU.
The Law that limits cash payments and receipts entered into force on 9 May 2015 in Romania and has the purpose to reduce the shadow economy and tax evasion.12Romanians cannot make cash transaction larger than RON 50,000 per day (between individuals ~EUR 10,704) and RON 10,000 per day (between individuals and companies ~EUR 2,140). The fine for exceeding the limits is 10% of the exceeded amount but not less than RON 100. As a result, 3 months after the implementation of the law, card and bank payment transactions increased, while the cash withdrawals from the ATMs or outside banking system stopped or even dropped.13
However, global studies showed that cash payments are frequently used for low-value acquisitions (Crystal Ossolinski et al., 2014; John Bagnall et al., 2014).
According to ECB Study (Henk Esselink, Lola Hernández, 2017, pag.24 ), most POS payments carried out by consumers involved lower transaction values; over a third of payments were lower than €5, and 65% were lower than €15. Looking at the way consumers paid according to payment instrument and amount, cash was the instrument of
11https://www.europe-consommateurs.eu/fileadmin/user_upload/eu-
consommateurs/PDFs/PDF_EN/Limit_for_cash_payments_in_EU.pdf 12 https://static.anaf.ro/static/10/Anaf/legislatie/L_70_2015.pdf 13 http://www.bancherul.ro/efectele-legii-privind-plafonarea-platilor-si-incasarilor-in-numerar-banii-din-conturile-bancare-
ale-romanilor-au-crescut-cu-6,2-miliarde-lei-in-trei-luni--14718

Facultad de Ciencias Económicas Módulo II – Despacho 212
c/ Francisco Tomás y Valiente, 5 28049 - Madrid
Page 20 of 53
choice for purchases under €45. These purchases accounted for 91% of all POS payments. Although the ECB has already decided to progressively phase out the €500 banknote, as long as cash exists, large payments will remain possible even with lower denomination banknotes.
On the other hand, the studies showed that within the process of paying, consumers consume “very little” real resources (Björn Segendorf and Thomas Jansson, 2012). The experience of Sweden and Norway (see their paper“Cards or cash. How should we pay?”) indicates that consumers are susceptible to price changes. Respectively, to boost the renunciation to cash, there is a need to impose transaction charges. But “Banks and businesses would probably find themselves caught in a ‘prisoner’s dilemma’ in which nobody wants to be first to introduce charges, even though this would be best for all” (Björn Segendorf and Thomas Jansson, 2012, pag.14).
For instance, to motivate consumers to stop using cash, some financial institutions imposed restrictions on the use of cash such as a maximum amount for cash ATM’s withdrawals and/or charges for ATM withdrawals (Paul van der Knaap et al., 2016). There is evidence, for instance in Australia, where reforms to the ATM system were implemented in March 2009 in order to increase transparency and allow ATM owners to better recover costs. The reforms had the effect of encouraging people to use ATMs provided free of charge by their own financial institution in order to avoid paying the now more transparent fee (Crystal Ossolinski et al., 2014).
According to ECB Study (Henk Esselink, Lola Hernández, 2017, pag. 48), 60% of the respondents said that they never have to pay a fee for withdrawing cash at ATMs, whereas 26% indicated that they sometimes have to pay a fee for using certain ATMs or for making a certain number of withdrawals. Only 6% responded that they pay a fee every time they withdraw money. In some countries, for example in Germany, cash withdrawals are free when using the ATM network of the bank, which issues the debit card. In other countries, for example Slovakia, most consumers are entitled to a specific number of withdrawals free of charge and only face a fee when they surpass this limited number of withdrawals.
The Paper “The Effect of Transaction Pricing on the Adoption of Electronic Payments: A Cross-Country Comparison” (Wilko Bolt et al., 2005) mentions that banks are aware of the fact that the transaction prices may accelerate the shift to electronic payments. However, they are reticent to lose their share on deposits. Even when the banks reach an agreement, it is less probable for the antitrust authorities to consider such coordination in the public interest, except for the case when social benefits from setting the price represents a favour for interest increase paid on deposits or decrease of flat fees or requirements regarding the minimum balance in the account.
In 2015, ING surveyed around 13,000 consumers in Europe, the US and Australia to ask how they might react if rates went negative. A remarkable 77% said that they would take money out of their savings accounts.14
In 2016 another ING survey15 showed that one in three people in Europe indicate that, because of low interest rates, saving is less satisfying. However, two in five (41%)
14 https://www.ing.com/Newsroom/All-news/Negative-interest-rates-to-make-savers-hoard-.htm 15 ING Survey Savings January 2017 https://www.ezonomics.com/ing_international_surveys/savings-2017/

Facultad de Ciencias Económicas Módulo II – Despacho 212
c/ Francisco Tomás y Valiente, 5 28049 - Madrid
Page 21 of 53
have either reduced the amount or added less money to their savings account and of the 71% who have savings, a large share (36%) have no more than the equivalent of three months in take-home pay. 18% in Europe say they have spent more money.
7.5.Cash and households expenditures EU consumers continue
to pay in cash for purchases made for personal use; in some states of the EU countries, this payment modality has a significant weight every year. Out of 26 EU considered, 15 showed an increase in resident cards cash withdrawals per capita in final consumption expenditures per capita (Fig.19).
The highest increase of this index in 2008-2016 was registered in Austria (+19 p.p.), Bulgaria (+12 p.p.), Italy (+10 p.p.), Romania (+10 p.p.), and Luxembourg (+9 p.p.).
According to WB Global Findex 2017, countries like Romania (86.78%), Bulgaria (84.01%), Greece (63.76%), Hungary (63.66%), Cyprus (47.59%), Lithuania (46.91%), Malta (39.10%), Slovakia (26.39%), Croatia (26.10%), Portugal (25.91%), Slovenia (23.84%), Italy (23.21%), Poland (21.84%), and Czech Republic (20.00%) reported high index of cash use when paying utility bills (Map 2).
The ECB Study (Henk Esselink, Lola Hernández, 2017, pag.26) points that on average euro area consumers paid in 2016 for almost 79% of their transactions using cash, this varied depending on the place of purchase. The share of cash usage was the highest at (i) street or market vendors and in restaurants and bars (both 90%), (ii) vending or ticketing machines (84%), (iii) in the entertainment and recreation sector (83%), and (iv) in shops for day-to-day items,

Facultad de Ciencias Económicas Módulo II – Despacho 212
c/ Francisco Tomás y Valiente, 5 28049 - Madrid
Page 22 of 53
such as supermarket or bakeries (80%). The author consider that this result shows a culture of cash use, which is rooted, in the European society.
How a consumer shops affects how a consumer pays. While investment in e-commerce and the ‘on-demand’ economy is growing, the majority of shopping still occurs in brick-and-mortar16 stores (Wendy Matheny et al., 2016). E-commerce accounts for approximately 10.4% of total EU retail sales, indicating that most retail sales do not occur online.17
7.6.Cash and shadow economy The Shadow Economy in Europe Survey (A.T. Kearney and Friedrich Schneider,
PhD, 2013), points that cash is the fuel in the engine of the shadow economy. The shadow economy forms from legal business activities that are performed outside the reach of government authorities. The size of the shadow economy relates strongly to economic cycles. In periods of economic decline, the people, especially small merchants try to compensate for missing revenue flows, for instance through underreporting shop sales to enhance own finances. Thus, equipping individuals and small merchants with only basic transaction accounts is not sufficient.
In the passive shadow economy, which accounts for roughly one-third of the shadow economy, one party (the consumer) pays in cash, while only the other party (the seller) benefits from the opportunity to hide the income. Here, cash payments provide an incentive not to report the transaction.18One of the reasons of passive participation in the shadow economy is the ease of participation. One of the cash features is anonymity. Cash is nameless and offers no history of transactions. Hence, paying in cash, people have the exclusive right to act freely in their private life (A.T. Kearney and Friedrich Schneider, PhD, 2013).
16 Brick & Mortar – Order and payment are conducted in person. The merchant delivers good/service in person to the consumer. On-demand - Order and payment are conducted via an online platform. Good/service is delivered in person by the merchant to
the consumer. (Source: Wendy Matheny et. al, 2016) 17 European Commission, Digital Scoreboard 18 EY, Reducing the Shadow Economy through Electronic Payments, EY Study Commissioned by MasterCard

Facultad de Ciencias Económicas Módulo II – Despacho 212
c/ Francisco Tomás y Valiente, 5 28049 - Madrid
Page 23 of 53
Taking into account the economy’s structure and the GDP, in many cases the source of the shadow economy does not only resume to the tolerance of people for created opportunities when paying cash only. Although the figures show some kind of correlation between the withdrawn cash and share of shadow economy in GDP, the evolution of these indexes is inconsequent in the case of many EU states (Fig.20). In Austria, Greece, Slovakia, Latvia, UK, Portugal, Czech Republic, and Germany the share of card cash withdrawals exceeded the share of shadow economy in GDP. And if analyzing the evidence of last years in the above mentioned countries, Austria, Greece, Slovakia, Latvia, Portugal, and Czech Republic have registered opposite evolutions in the shadow economy and cards cash withdrawals in GDP, respectively. The size of these evolutions is not susceptible for comparison (Fig.21).
7.7.Cash and merchants behaviour In this entire process, merchant’s behaviour is also important. Many self-employed
firms or family stores tend to shy away from electronic transactions, because of extra costs (including transaction and bank fees) and lack of awareness (Ghada Teima et al, 2016). According to Denmark’s National bank's 2013 survey, two advantages of cash were highlighted: (i) that it does not involve an acquirer fee as card payments do, and (ii) that cash provides certainty that the payment is done (Danish Payments Council, 2016).
The 2015 Diary of Consumer Payment Choice (Wendy Matheny et al.,2016) also asked participants if merchants asked for a minimum purchase amount before accepting a card payment. Most participants showed ignorance towards the existence or absence of such minimum and this requirement should not be an issue for the respective transaction. In all categories of expenses, 89% or more transactions took place without a minimum requirement. Even for low-value transactions, the minimum requirements do not seem to boost cash payments.
According to “Does a public campaign influence debit card usage? Evidence from the Netherlands” (Nicole Jonker et al., 2015), it was established that one of the reasons for not paying with debit card by consumers who wanted to change the payment habit was that they thought that the merchants preferred cash.
In Romania, the Government, to fight tax evasion, launched the lottery of receipts in 2015.19 The assumed costs are essential, but the application of this measure proved to be worth, according to the reports at the first phase of implementation. Furthermore, the Government did not tie this measure to the use of electronic payments by the population, even if Romania is the last in the field of electronic payments (cards payments as ratio of GDP in 2016: 6.36% compared to EU average of 19.65%).
8. Alternatives for cash payments – electronic payments
In the last decade, the new payment instruments have evolved significantly and have diversified the payment options. However, these instruments represent only variations of traditional payment instruments representing the transfer of funds between accounts. The innovative feature refers most of all to devices involved (for instance, mobile phones, computers, tablets, contactless cards, etc.) and used channels (for instance, internet,
19 http://www.mfinante.ro/loteriabonurilor.html

Facultad de Ciencias Económicas Módulo II – Despacho 212
c/ Francisco Tomás y Valiente, 5 28049 - Madrid
Page 24 of 53
mobile communication networks, etc.). Also many innovations are new in these payments by using prepaid or online accounts, usually managed by non-banks.
Electronic payment instruments can be classified in three broad categories: Electronic Funds Transfer (EFT)-based instruments: These are direct (i.e.
account-to-account) credit transfers and direct debit transfers. Payment card-based instruments: These include credit card payments, charge card
payments, and debit card payments, and typically still involve a physical plastic card.
Electronic money (e-money)-based instruments: In general terms, these instruments involve the payer maintaining a pre-funded transaction account with a PSP, often a non-bank. Specific products include online money when the mobile phones, and prepaid cards (BIS and WB Group, 2015).
Credit transfers and direct debits are used by different business parties. Typically, large corporate are heavy users of credit transfers and direct debits, while retailers use more POS payment instruments (Schmiedel, Heiko et al., 2012).
Across Europe the single euro payments area (SEPA) harmonises the way cashless euro payments are made. It allows European consumers, businesses and public administrations to make and receive credit transfers, direct debit and card payments under the same basic conditions. Initially, the EPC has designed the SEPA schemes for credit transfers and direct debits, and currently is developing a scheme for payment cards and it is also working on a new framework for mobile payments.20
Based on EU Directive (PSD2: (EU) 2015/2366) 21 on payment services in the internal market, a number of basic requirements regarding the transparency of commissions charged by payment service providers to payment accounts was established. This has substantially streamlined the activity of payment service providers by creating uniform norms regarding payment services and information that has to be communicated. In order to develop the payment system, the EU approved the Directive 2014/92/EU of the European Parliament and of the Council of 23 July 2014 on the comparability of fees related to payment accounts, payment account switching and access to payment accounts with basic features.
20 https://ec.europa.eu/info/business-economy-euro/banking-and-finance/consumer-finance-and-payments/payment-
services/single-euro-payments-area-sepa_en 21 DIRECTIVE (EU) 2015/2366 OF THE EUROPEAN PARLIAMENT AND OF THE COUNCIL of 25 November 2015 on
payment services in the internal market

Facultad de Ciencias Económicas Módulo II – Despacho 212
c/ Francisco Tomás y Valiente, 5 28049 - Madrid
Page 25 of 53
8.1.Electronic Payments and Financial Inclusion
The use of databases that connect a device and a bank account and authentication and instant confirmation system of money in the account is dominant in developing new payment instruments. Hence, people without a bank account cannot access such innovative services (BIS and WB Group, 2015).
Overall, the EU Member States demonstrated a reasonably high level of financial inclusion and the implementation of the Directive 2014/92/EU 22 should help to further improve the level of financial inclusion (MONEYVAL, 2014).
According to recent WB Global FINDEX 2017, over 90% of the EU28 population (age 15+) holds at least one bank account at a formal financial institution. However, there are significant differences between countries. Western and Northern European countries seem to score very high (with Denmark nearing complete coverage at 99.9%) whereas the Eastern countries as Hungary (74.9%), Bulgaria (72.2%) and Romania (57.6%) are still at the end of the list. Denmark, Finland, Slovenia, and Netherlands reported 100% bankarization of young persons aged 15 and 24 years. The list is concluded by Romania (51.06%), Greece (49.07%), Croatia (46.86%), Bulgaria (43.46%), and Czech Republic (41.18%) that are lagging behind (Map 3).
8.2.Electronic Payments Value The global volume of non-cash transactions in EU countries accounted for about
EUR 267,840 billion in 2016, registering a growth of about EUR 19,057 billion compared to 2006 (+7.7%) and an increase of EUR 9,659 billion compared to 2012 (+3.7%).
22 Directive 2014/92/EU of the European Parliament and of The Council of 23 July 2014 on the Comparability of fees related
to payment accounts, payment account switching and access to payment accounts with basic features

Facultad de Ciencias Económicas Módulo II – Despacho 212
c/ Francisco Tomás y Valiente, 5 28049 - Madrid
Page 26 of 53
The UK (34%), Germany (20.3%), France (10%), Netherlands (7.3%) and Spain (6.1%) account for about 78% of total value of non-cash payments registered in 2016 (Fig.23). Once the total value of electronic payments increased, the average value of a payment reduced by 35.3%, accounting for EUR 2,195 in 2016 (Fig.22). This trend indicates a clear modification of electronic payment structure during the entire period.
8.3.Electronic Payments and Shadow Economy
The evolution mentioned above can be explained by many factors such as, for instance, change of demand and offer of payers and beneficiaries of payments, technological development, cooperation and standardization of payment services provided by different suppliers, as well as the adoption and legal implementation of financial and regulatory initiatives. Another preferred standpoint of building a cashless economy is disposal of dark cash. However, the author should mention that the intensity of using electronic payments is one of the multiple factors that influence the level of shadow economy, usually having an impact on the quality control of passive shadow economy, i.e. underreporting shop sales.
Hence, is has been observed that the countries that register a high number of electronic payments per capita23 (Sweden, the Netherlands, UK, Denmark, Finland) have a lower share of shadow economy in GDP, while Italy, Bulgaria, Romania and Greece, countries with less electronic transactions per capita 24 , register a high share of shadow
economy in GDP (Fig.24).
8.4.Electronic Payments Usage Most of the payment card literature ignores competition between payment
instruments (Wilko Bolt and Sujit Chakravorti, 2010). But the evidence shows that new electronic payment instruments seem to be cannibalising other electronic payment instruments, rather than cash (Paul van der Knaap et al., 2016). On the other hand, in the case of Denmark, many types of payment usually done with cash are going electronic. For example, church collection boxes and street performers now accept mobile payments. According to Morten Bech et al. (2018), based on payments statistics, cash in circulation
23 More than 350 transactions per capita 24 Less than 50 transactions per capita
Facultad de Ciencias Económicas Módulo II – Despacho 212
c/ Francisco Tomás y Valiente, 5 28049 - Madrid
Page 27 of 53
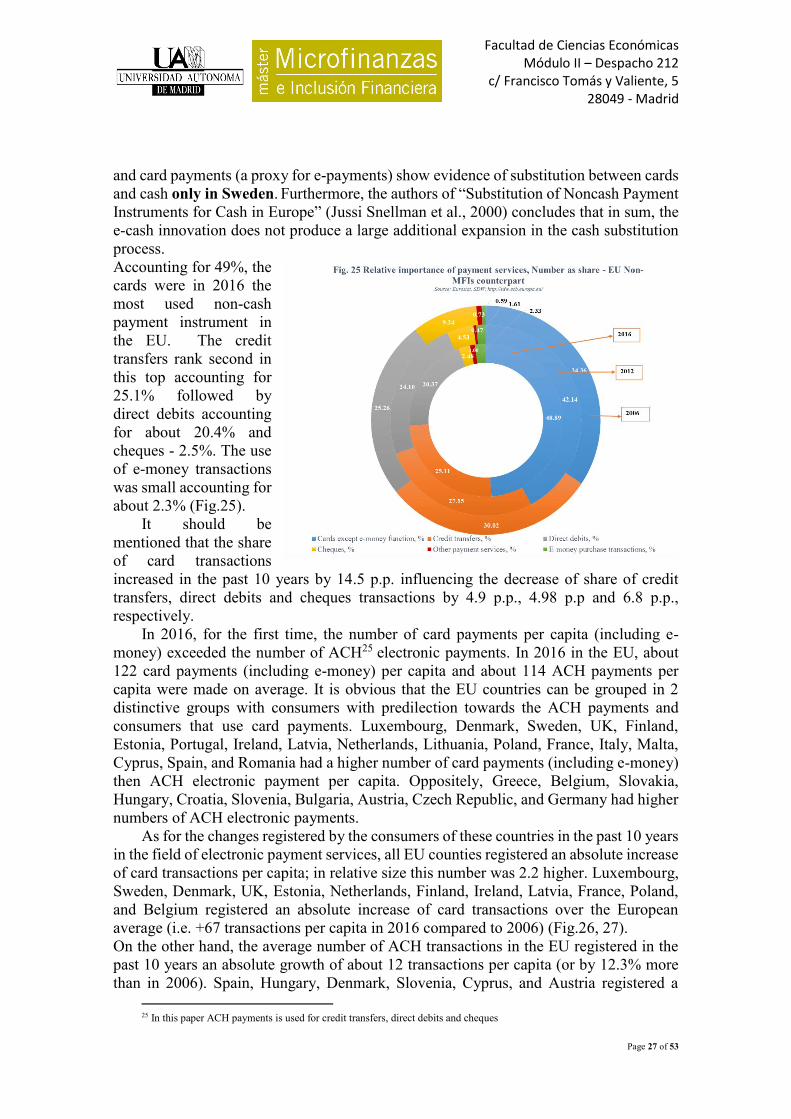
and card payments (a proxy for e-payments) show evidence of substitution between cards and cash only in Sweden. Furthermore, the authors of “Substitution of Noncash Payment Instruments for Cash in Europe” (Jussi Snellman et al., 2000) concludes that in sum, the e-cash innovation does not produce a large additional expansion in the cash substitution process. Accounting for 49%, the cards were in 2016 the most used non-cash payment instrument in the EU. The credit transfers rank second in this top accounting for 25.1% followed by direct debits accounting for about 20.4% and cheques - 2.5%. The use of e-money transactions was small accounting for about 2.3% (Fig.25).
It should be mentioned that the share of card transactions increased in the past 10 years by 14.5 p.p. influencing the decrease of share of credit transfers, direct debits and cheques transactions by 4.9 p.p., 4.98 p.p and 6.8 p.p., respectively.
In 2016, for the first time, the number of card payments per capita (including e-money) exceeded the number of ACH25 electronic payments. In 2016 in the EU, about 122 card payments (including e-money) per capita and about 114 ACH payments per capita were made on average. It is obvious that the EU countries can be grouped in 2 distinctive groups with consumers with predilection towards the ACH payments and consumers that use card payments. Luxembourg, Denmark, Sweden, UK, Finland, Estonia, Portugal, Ireland, Latvia, Netherlands, Lithuania, Poland, France, Italy, Malta, Cyprus, Spain, and Romania had a higher number of card payments (including e-money) then ACH electronic payment per capita. Oppositely, Greece, Belgium, Slovakia, Hungary, Croatia, Slovenia, Bulgaria, Austria, Czech Republic, and Germany had higher numbers of ACH electronic payments.
As for the changes registered by the consumers of these countries in the past 10 years in the field of electronic payment services, all EU counties registered an absolute increase of card transactions per capita; in relative size this number was 2.2 higher. Luxembourg, Sweden, Denmark, UK, Estonia, Netherlands, Finland, Ireland, Latvia, France, Poland, and Belgium registered an absolute increase of card transactions over the European average (i.e. +67 transactions per capita in 2016 compared to 2006) (Fig.26, 27). On the other hand, the average number of ACH transactions in the EU registered in the past 10 years an absolute growth of about 12 transactions per capita (or by 12.3% more than in 2006). Spain, Hungary, Denmark, Slovenia, Cyprus, and Austria registered a
25 In this paper ACH payments is used for credit transfers, direct debits and cheques

Facultad de Ciencias Económicas Módulo II – Despacho 212
c/ Francisco Tomás y Valiente, 5 28049 - Madrid
Page 28 of 53
decrease of the absolute number per capita. Germany, Netherlands, Finland, Sweden, Czech Republic, Belgium, France, Luxembourg, and the UK registered a number of ACH transactions above the average of the EU number in 2016.
We should not ignore that PSD226 and its access-to-account is combined with instant payments in a viable and scalable way, massive volumes could shift from cards to ACH. Cards will maintain a specific role in international, e-commerce, and travel and entertainment situations, thanks to their unique capabilities (such as their global reach), but that may be no more than a quarter of payments. It remains yet to be seen how these alternative scenarios will play out (Stephen Whitehouse et al., 2016).
8.4.1. Credit Transfers
In 2016 the value of credit transfers in EU countries accounted for EUR 262,515 billion by EUR 34,209 billion more than in 2006 (+15%), registering about 98% of total value of electronic payments (Fig.28,29).
26 DIRECTIVE (EU) 2015/2366 OF THE EUROPEAN PARLIAMENT AND OF THE COUNCIL of 25 November 2015 on payment services in the internal market

Facultad de Ciencias Económicas Módulo II – Despacho 212
c/ Francisco Tomás y Valiente, 5 28049 - Madrid
Page 29 of 53
The average number of monthly credit transfers recorded in EU in 2016 was 5 transactions per capita, which is one monthly transaction more than in 2006. Finland, Czech Republic, Sweden, the Netherlands, Belgium, Estonia, Luxembourg, Latvia, Germany, Slovenia, Croatia, Denmark, Slovakia, the UK, Poland, and Austria recorded a number of monthly transactions per capita higher than the EU average. 18 countries out of 28 EU countries registered an increase of monthly transaction number per capita over the EU average in the past 10 years. On the other hand, Luxembourg (-3.6%), Hungary (-7.9%), Slovenia (-11.9%), Germany (-14%), and Austria (-44.7%) registered a decrease of the average monthly number of credit transfers per capita in the last decade (Fig.30).
Monthly value of credit transfers per capita accounted for EUR 42.8 thousand by 4.5% more than 10 years ago (+EUR 1.8 thousand). The top countries with an average monthly value per capita over the EU average was led by Luxembourg, the UK, the Netherlands, Czech Republic, Germany, and Belgium. However, the author should mention that the UK registered in the past 10 years a reduction in this value by 30.5%. The ranking is closed by Italy, Portugal, Romania, Lithuania, Bulgaria, Croatia, and Greece, which registered an average monthly value of credit transfers per capita under EUR 10 thousand. The UK27, Greece (-36.6%), Lithuania (-28.3%), Latvia (-33.1%), and Finland (-40.2%) recorded a decrease in the average monthly value of credit transfers per capita. In the case of these countries, the decrease was caused by simultaneous increase of average number of credit transfers per capita (Fig.31)
It is interesting to mention that the ECB Study (Henk Esselink, Lola Hernández,
2017) has noted that credit transfers played a relatively important role in the accommodation sector, the “other” sector (typically services) and at offices of public authorities.
8.4.2. Direct Debits
In 2016 the value of direct debits in EU countries accounted for EUR 8,644 billion, which is EUR 629 billion more than in 2006 (+7.8%) and by 53% less than in 2012 (-EUR 9,781 billion) (Fig.32,33), accounting to about 3.23% of total value of electronic payments compared to 7.1% in 2012. In 2016, the value of direct debits in the EU accounted for 58.2% of GDP. Germany (124.87%), France (66.95%), and the United Kingdom (65.08%) recorded payments rates in the GDP over the EU average. However, these payment instruments accounted for significant rates in Spain (44.73%), Ireland
27 -30.5%

Facultad de Ciencias Económicas Módulo II – Despacho 212
c/ Francisco Tomás y Valiente, 5 28049 - Madrid
Page 30 of 53
(41.70%), Austria (37.33%), and the Netherlands (32.31%). Poland (1.48%), Romania (1.11%), and Bulgaria (0.41%) ranked last at this index. On the other hand, since the EU rate of these payment instruments decreased by 10.9 p.p. in the past ten years, then these earned value in France (+14.03 p.p), Belgium (+9.74 p.p), Czech Republic (+ 7.24p.p.), the United Kingdom (+7.04 p.p.), and Portugal (+6.67 p.p). The Netherlands (-11.59p.p), Spain (-19.47p.p), Finland (-23.69 p.p.), Germany (-28.29 p.p.), Denmark (-31.07 p.p.), and Austria (-64.76 p.p) registered a decrease of the share of direct debits in GDP during 2006-2016.
The ECB Study (Henk Esselink, Lola Hernández, 2017) points that direct debits are mainly recurrent payments, such as rent, utilities, telephone subscriptions and insurance, but also payments for the home delivery of oil or gas, or medical services. Direct Debit offers a relatively inexpensive payment method to merchants.
In 2006-2016, the total number of direct debits transactions in EU increased by 34% in 2016 accounting to 25 billion transactions. In 2016 in EU28, the average monthly number of direct debits was four transactions per capita by 21.9% more than in 2006. Germany, the Netherlands, the United Kingdom, and France had a number of monthly transactions per capita more than in the EU. Germany ranked first and recorded a double number of transactions compared to the next country on the list (the Netherlands). By relative importance of electronic payments, the number of direct debits registered a significant share in Germany (50.58%), Spain (27.92%), and Austria (25.55%). This is due to preferences of the consumers in these countries to pay for utility bills via direct debits. The Parliamentary Commission of the United Kingdom for financial inclusion stated in its 2015 Report – “to use direct debits, the persons have to have skills to manage budgets”. The relatively high share of direct debits in payment mix in France (18.95%), the United Kingdom (16.19%), the Netherlands (16.09%), Italy (13.76%), Belgium (12.95%), and Portugal (12.39%) is also notable.
In the past ten years, six countries of EU28 registered an increase of the number of monthly transactions per capita over the EU average (Fig.35). On the other hand, Slovakia (-4.0%), Hungary (-4.1%), Romania (-51.8%), the Netherlands (-2.15%), Cyprus (-24.5%), Spain (-12.8%), and Austria (-41.2%) registered a decrease of monthly average number of direct debits per capita.
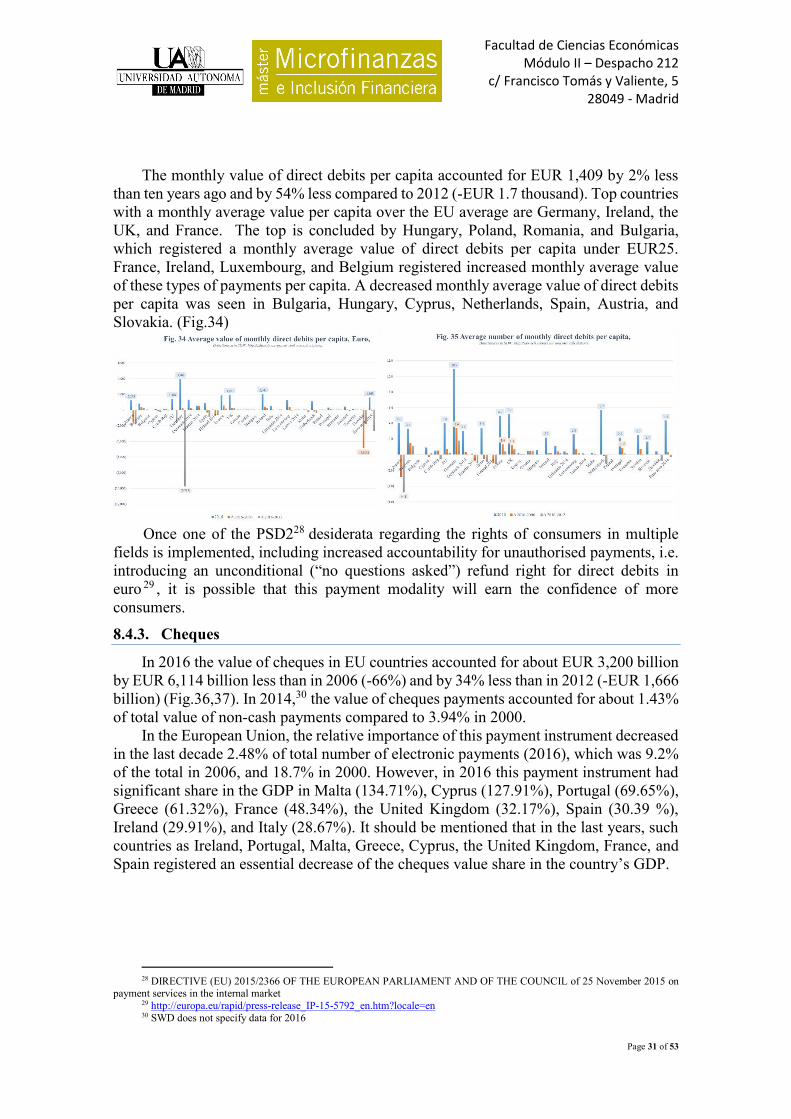
Facultad de Ciencias Económicas Módulo II – Despacho 212
c/ Francisco Tomás y Valiente, 5 28049 - Madrid
Page 31 of 53
The monthly value of direct debits per capita accounted for EUR 1,409 by 2% less than ten years ago and by 54% less compared to 2012 (-EUR 1.7 thousand). Top countries with a monthly average value per capita over the EU average are Germany, Ireland, the UK, and France. The top is concluded by Hungary, Poland, Romania, and Bulgaria, which registered a monthly average value of direct debits per capita under EUR25. France, Ireland, Luxembourg, and Belgium registered increased monthly average value of these types of payments per capita. A decreased monthly average value of direct debits per capita was seen in Bulgaria, Hungary, Cyprus, Netherlands, Spain, Austria, and Slovakia. (Fig.34)
Once one of the PSD228 desiderata regarding the rights of consumers in multiple
fields is implemented, including increased accountability for unauthorised payments, i.e. introducing an unconditional (“no questions asked”) refund right for direct debits in euro 29 , it is possible that this payment modality will earn the confidence of more consumers.
8.4.3. Cheques
In 2016 the value of cheques in EU countries accounted for about EUR 3,200 billion by EUR 6,114 billion less than in 2006 (-66%) and by 34% less than in 2012 (-EUR 1,666 billion) (Fig.36,37). In 2014,30 the value of cheques payments accounted for about 1.43% of total value of non-cash payments compared to 3.94% in 2000.
In the European Union, the relative importance of this payment instrument decreased in the last decade 2.48% of total number of electronic payments (2016), which was 9.2% of the total in 2006, and 18.7% in 2000. However, in 2016 this payment instrument had significant share in the GDP in Malta (134.71%), Cyprus (127.91%), Portugal (69.65%), Greece (61.32%), France (48.34%), the United Kingdom (32.17%), Spain (30.39 %), Ireland (29.91%), and Italy (28.67%). It should be mentioned that in the last years, such countries as Ireland, Portugal, Malta, Greece, Cyprus, the United Kingdom, France, and Spain registered an essential decrease of the cheques value share in the country’s GDP.
28 DIRECTIVE (EU) 2015/2366 OF THE EUROPEAN PARLIAMENT AND OF THE COUNCIL of 25 November 2015 on
payment services in the internal market 29 http://europa.eu/rapid/press-release_IP-15-5792_en.htm?locale=en 30 SWD does not specify data for 2016

Facultad de Ciencias Económicas Módulo II – Despacho 212
c/ Francisco Tomás y Valiente, 5 28049 - Madrid
Page 32 of 53
On the other hand, in 2016, nearly 70.7% of cheques issued at Union level were in France, far ahead of the United Kingdom (15.8%) and Italy (6.2%). The cheque accounts for nearly 17.8% of the number of cashless transactions in Malta (10.7% of the amounts), 10.2% in France (but only 4.03% of the amounts). There remains a strong French specificity: a Frenchman uses an average of 32 cheques per year, compared to 7 for an Englishman, 6 for a Portuguese and less than one (0.22) for a German.
The ECB study (Henk Esselink, Lola Hernández 2017) has noted that the cheques as the credit transfers played a relatively important role in the accommodation sector, the “other” sector (typically services) and at offices of public authorities.
Malta, Cyprus, Ireland, France, and Portugal recorded a monthly average value of cheque payments per capita of EUR 1,000. In the last years, the highest decrease of monthly average value per capita was registered in Ireland (-91.4%), followed by the UK, Greece, Portugal, Cyprus, France, and Spain.
It should be mentioned that the monthly average value of one payment (Fig.38) varied in Finland (EUR 2,531), Greece (EUR 1,193), the Netherlands (EUR 977), Germany (EUR 694), Austria (EUR 581), and Sweden (EUR 540) compared to the value in Denmark (EUR 101) and France (EUR 42).

Facultad de Ciencias Económicas Módulo II – Despacho 212
c/ Francisco Tomás y Valiente, 5 28049 - Madrid
Page 33 of 53
8.4.4. Card Payments and e-Money
The most evolved cashless transaction is the card payment. It is obviously related to the increased number of card holders, developed service infrastructure as well as advantages provided to the consumers, merchants and banks.
To describe the situation with retail payments made with bank cards in the EU countries, the author will use the Key Performance Indicators (KPIs) to shed light on the perspective of offer and demand as well as trends in the EU countries and potential drivers with impact on these evolutions.
KPIs of card payments will include the availability of and access to card payment infrastructure (measured by issued cards, POS terminals, internet penetration), as well as availability of cards used to pay, value and number of resident cards payments per capita, per card, per terminal, share of resident cards payments per capita in final consumption expenditures of households per capita etc.
8.4.4.1.Cards
902 million cards were issued in the EU in 2016, including with e-money function, the last accounting for 14.6%. The most cards issued by resident PSPs were debit cards registering an increase of 22.4% in the past ten years (Fig.39). In the same period, the number of cards per capita increased in Luxembourg (+1.83 card/capita or+86.88%), Finland (+1.05 card/ per capita or 149.50%), Malta (+0.77 card/ per capita or +61.37%), Denmark (+ 0.73 card/ per capita or +75.62%), Sweden (+ 0.65 card/ per capita or +43.99%), Ireland (+0.64 card/ per capita or 71.93%), Belgium +0.42 card/ per capita or +26.86%), Austria (+0.41 card/ per capita or +36.22%), Germany (+0.40 card/ per capita or +29.70%), Romania (+0.37 card/ per capita or +85.91%), Czech Republic (+0.34 card/ per capita or +42.79%), and Poland (+0.34 card/ per capita or +53.60%) (Fig.40,41).
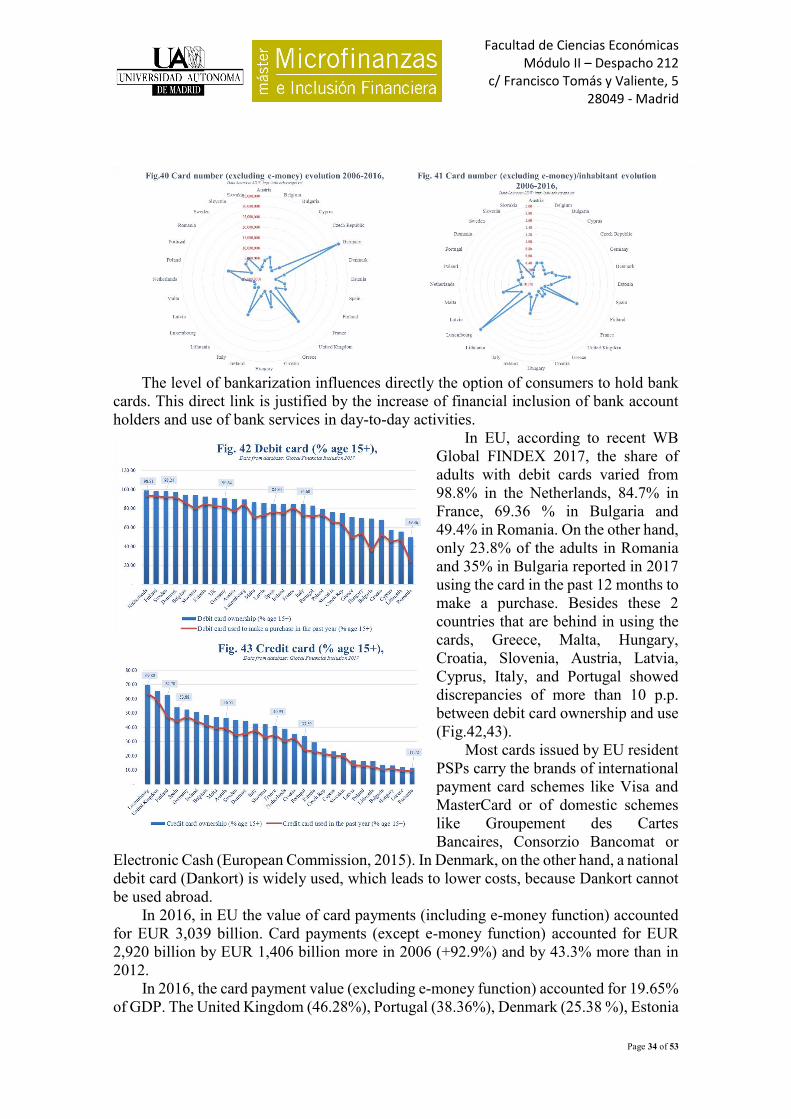
Facultad de Ciencias Económicas Módulo II – Despacho 212
c/ Francisco Tomás y Valiente, 5 28049 - Madrid
Page 34 of 53
The level of bankarization influences directly the option of consumers to hold bank
cards. This direct link is justified by the increase of financial inclusion of bank account holders and use of bank services in day-to-day activities.
In EU, according to recent WB Global FINDEX 2017, the share of adults with debit cards varied from 98.8% in the Netherlands, 84.7% in France, 69.36 % in Bulgaria and 49.4% in Romania. On the other hand, only 23.8% of the adults in Romania and 35% in Bulgaria reported in 2017 using the card in the past 12 months to make a purchase. Besides these 2 countries that are behind in using the cards, Greece, Malta, Hungary, Croatia, Slovenia, Austria, Latvia, Cyprus, Italy, and Portugal showed discrepancies of more than 10 p.p. between debit card ownership and use (Fig.42,43).
Most cards issued by EU resident PSPs carry the brands of international payment card schemes like Visa and MasterCard or of domestic schemes like Groupement des Cartes Bancaires, Consorzio Bancomat or
Electronic Cash (European Commission, 2015). In Denmark, on the other hand, a national debit card (Dankort) is widely used, which leads to lower costs, because Dankort cannot be used abroad.
In 2016, in EU the value of card payments (including e-money function) accounted for EUR 3,039 billion. Card payments (except e-money function) accounted for EUR 2,920 billion by EUR 1,406 billion more in 2006 (+92.9%) and by 43.3% more than in 2012.
In 2016, the card payment value (excluding e-money function) accounted for 19.65% of GDP. The United Kingdom (46.28%), Portugal (38.36%), Denmark (25.38 %), Estonia
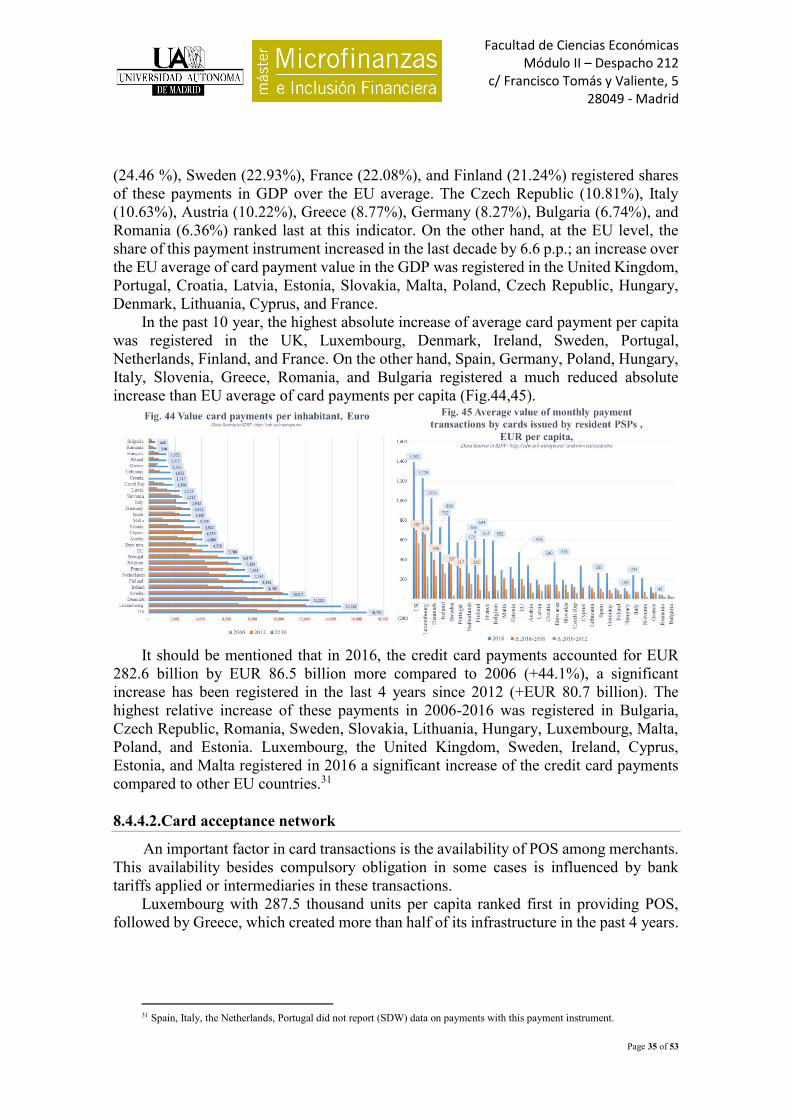
Facultad de Ciencias Económicas Módulo II – Despacho 212
c/ Francisco Tomás y Valiente, 5 28049 - Madrid
Page 35 of 53
(24.46 %), Sweden (22.93%), France (22.08%), and Finland (21.24%) registered shares of these payments in GDP over the EU average. The Czech Republic (10.81%), Italy (10.63%), Austria (10.22%), Greece (8.77%), Germany (8.27%), Bulgaria (6.74%), and Romania (6.36%) ranked last at this indicator. On the other hand, at the EU level, the share of this payment instrument increased in the last decade by 6.6 p.p.; an increase over the EU average of card payment value in the GDP was registered in the United Kingdom, Portugal, Croatia, Latvia, Estonia, Slovakia, Malta, Poland, Czech Republic, Hungary, Denmark, Lithuania, Cyprus, and France.
In the past 10 year, the highest absolute increase of average card payment per capita was registered in the UK, Luxembourg, Denmark, Ireland, Sweden, Portugal, Netherlands, Finland, and France. On the other hand, Spain, Germany, Poland, Hungary, Italy, Slovenia, Greece, Romania, and Bulgaria registered a much reduced absolute increase than EU average of card payments per capita (Fig.44,45).
It should be mentioned that in 2016, the credit card payments accounted for EUR
282.6 billion by EUR 86.5 billion more compared to 2006 (+44.1%), a significant increase has been registered in the last 4 years since 2012 (+EUR 80.7 billion). The highest relative increase of these payments in 2006-2016 was registered in Bulgaria, Czech Republic, Romania, Sweden, Slovakia, Lithuania, Hungary, Luxembourg, Malta, Poland, and Estonia. Luxembourg, the United Kingdom, Sweden, Ireland, Cyprus, Estonia, and Malta registered in 2016 a significant increase of the credit card payments compared to other EU countries.31
8.4.4.2.Card acceptance network
An important factor in card transactions is the availability of POS among merchants. This availability besides compulsory obligation in some cases is influenced by bank tariffs applied or intermediaries in these transactions.
Luxembourg with 287.5 thousand units per capita ranked first in providing POS, followed by Greece, which created more than half of its infrastructure in the past 4 years.
31 Spain, Italy, the Netherlands, Portugal did not report (SDW) data on payments with this payment instrument.

Facultad de Ciencias Económicas Módulo II – Despacho 212
c/ Francisco Tomás y Valiente, 5 28049 - Madrid
Page 36 of 53
In past years, 21 of 28 EU countries registered an increase over the EU average of the POS number per 1 million of inhabitants (Fig.46). Special efforts to ensure the infrastructure registered Luxembourg, Ireland, Greece, Netherlands, Italy, the UK, Estonia, Portugal, Latvia, Malta, Lithuania, and Bulgaria that increased their number of devices by over 10 thousand per million inhabitants. These efforts are possible due to the fact that in EU, most governments are not only using electronic payments for all transactions they initiate, but also offering opportunities to pay to them with means other than cash. This is a particularly important topic in Eastern European countries, such as Romania, which has established a national system for POS and online tax payment via bank card and managed to raise tax payments by card by 34 per cent year-on-year (A.T. Kearney and Friedrich Schneider, PhD, 2013).
8.4.4.3.Cards usage
However, the existence of POS does not always mean the availability to consumers to pay via these terminals. The share of card transactions made via POS accounted for 88% in the EU32 with essential differences between countries. Italy, Poland, Netherlands, Estonia, Greece, Denmark, and Lithuania registered over 90% of card transactions via POS from total card transactions (Fig.47).
32 2014

Facultad de Ciencias Económicas Módulo II – Despacho 212
c/ Francisco Tomás y Valiente, 5 28049 - Madrid
Page 37 of 53
With high coverage of POS network, Greece accounts for over 91% of card transactions via terminals, although the intensity of using a terminal for payment is quite low compared to other EU countries (Fig.48). This situation is seen in Italy and Spain, which have a developed POS infrastructure, but have low intensity of their use of 1,140 and 1,970 transactions per terminal, respectively. This is because the Greeks make only 2.6 card payments per month via POS, compared to Englishmen with 136 monthly payments or Germans with 30 monthly payments. In Spain and Italy, the consumers use to make more than 28 and 24 monthly payments, respectively. Ireland with high coverage of POS per capita registered low use of terminal network because only 36% of card transactions are made via POS (Fig.47).
Latvia, Poland, France, United Kingdom, Netherlands, Estonia, Belgium, Sweden, and Denmark, besides having high coverage of POS, registered high intensity of POS usage due to high share of card transactions made especially via POS (over 80%). A Frenchman makes on average 84 payments a month, a person from the Netherlands 35 payments via POS, a Polish about 30 payments, a Swede about 25 payments, a Dane about 16.3 payments and a Belgian about.14.5 monthly payments.
8.4.4.3.1. Cards usage (dis)incentives
The network efficiency is due to the initiatives implemented in these countries. In 2010, a strategic initiative by the Visa Polska Executive Committee aimed to double the size of Poland’s acceptance network. This “Visa cards accepted everywhere” initiative has been a huge success (A.T. Kearney and Friedrich Schneider, PhD, 2013).
Traditional card payment models require a commission (the merchant discount fee or merchant service charge) that is usually a fixed fee and/or a percentage of the payment amount (anywhere from 0.1% to 6%); merchants often pay for set-up fees as well.
In France, from 1 January 2016 banks are committed to develop and promote IP-based offers for all merchants. For merchants who could not equip themselves with hardware using the internet channel, especially for technical reasons, the banks are committed to work with telecom operators and routing companies to propose offers comparable to the cost of using the internet channel.33
Lack of transparency and an absence of price signals on at least one side of the industry (the merchant side) characterize the payment card markets.34 However, a study, published by the European Commission in 2015, showed that the cost for accepting a card transaction exceeds the cost for accepting a cash transaction for the same amount. EU Directive PSD235 points as a highlight the prohibition of surcharging (additional charge for the right to pay e.g. with a card) whether the payment instrument is used in shops or online. 36 In March 2015, the European Parliament voted the restrictions of interchange commissions of 0.3% beginning on 8 June 2015 on credit cards and 0.2% on debit cards.37 The author should mention that the interchange fees increase fees on one side of the industry (the merchant side) and decrease fees on the other side (the cardholder side).
33 Assises Des Moyens De Paiement, economie.gouv.fr https://www.economie.gouv.fr/files/0_dp-amp-150601.pdf 34 European Commission, 2015, Survey on merchants' costs of processing cash and card payments Final results, March 2015 35 DIRECTIVE (EU) 2015/2366 OF THE EUROPEAN PARLIAMENT AND OF THE COUNCIL of 25 November 2015 on
payment services in the internal market 36 http://europa.eu/rapid/press-release_IP-15-5792_en.htm?locale=en 37 http://europa.eu/rapid/press-release_IP-15-4585_en.htm

Facultad de Ciencias Económicas Módulo II – Despacho 212
c/ Francisco Tomás y Valiente, 5 28049 - Madrid
Page 38 of 53
These fees are a cost for merchants, which increase the price of their products (European Commission, 2015).
All these initiatives are motivated by the power of merchants to refuse to use some forms of payments that are too expensive for them. Retail is typically a high-volume, low-margin business, so small merchants rarely have enough profit margin to give to commissions. Every card payment imposes an invisible tax on others (the merchant and its customers) compared with non-card payments, which would most often be in cash (European Commission, 2015; Ghada Teima et al., 2016). The lower the transaction cost is, the more efficient trade will be (Björn Segendorf, Thomas Jansson, 2012, pag. 3).
For example, due to the higher fees charged by banks for the use of non-Danish issued cards (that consist of foreign card network interchange fees plus Danish banks own fees), many Danish merchants only accept Dankort and Danish-issued credit cards. Co-branded Dankort-Visa cards are very common in Denmark and do not carry the bigger fee, as Danish merchants treat them as regular Dankort cards within Denmark.
In Sweden, the law points that the parties are free to agree on another method of payment than cash, and the provision purely establishes a right to pay in cash unless otherwise agreed. According to the Swedish Trade Federation, 80 percent of all transactions in the retail trade in Sweden today are already made with cards.38 In Uppsala, Sweden’s fourth largest city, merchants are now being educated on how to reduce cash as part of a programme to eliminate cash payments in the city, even at the church.
These EU countries show a reversed correlation between card payment level in the households consumption and share of shadow economy in GDP (Fig.49).
Once the EU Directive PSD239 has been approved, the merchants have the option of installing a default choice of application in their payment terminals, based on the most cost-efficient brand for them and – as a consequence – for their customers.40 Furthermore, the ECB considers NFC-based41 mobile payments among the most promising payment
methods for consumers. Suppliers are making consistent investments to update their NFC 38 https://www.thelocal.se/20170809/sweden-predicted-to-be-a-cashless-society-by-2030 39 DIRECTIVE (EU) 2015/2366 OF THE EUROPEAN PARLIAMENT AND OF THE COUNCIL of 25 November 2015 on
payment services in the internal market 40 http://europa.eu/rapid/press-release_MEMO-16-2162_en.htm 41 NFC (near field communication) is the technology that allows two devices—like your phone and a payment terminal—to
talk to each other when they're close together. NFC is the technology that enables contactless payments. (https://en.wikipedia.org/wiki/Near-field_communication )

Facultad de Ciencias Económicas Módulo II – Despacho 212
c/ Francisco Tomás y Valiente, 5 28049 - Madrid
Page 39 of 53
hardware and merchants are installing contactless points of interaction based on NFC technology.
Another possible factor that streamlines the use of cards is the use of reward programmes to make this payment instrument more attractive. There is some evidence that incentives for using a particular payment instrument are able to steer consumers’ payment behaviour. Card providers, banks and retail organisations in some countries such as France and the Netherlands, have launched nationwide campaigns to promote card payments (Nicole Jonker et al., 2015). On the other hand, in Germany these types of campaigns that influence the consumers’ behaviour are not quite implemented.
8.4.4.4.Cards payments value at points-of-sale
The monthly average value of payments per card via POS in the EU in 201442
accounts for about EUR 216. Denmark, the UK, Sweden, France, Finland, Portugal, Belgium, and The Netherlands registered values above EU average (Fig.50). The author should mention that countries like Denmark, Sweden, Finland, France, the Netherlands, and the UK registered a high average value per card of card payments at POS and at the same time a large number of card transactions via POS. In Portugal this value could have been influenced by the average number of card transactions, which is lower than in the abovementioned countries. The decrease of the average monthly payments via POS per card in Finland and Ireland in the past years was not influenced by increased number of transactions per card; the number of transactions via POS per card in these countries showed a decrease in the past ten years. The author could suppose a shift to card payments for low-value purchases.
Data show, at large extent, that countries with higher value of monthly card payments per card registered a lower value of card cash withdrawals (Fig.51).
42 SWD does not provide 2016 data
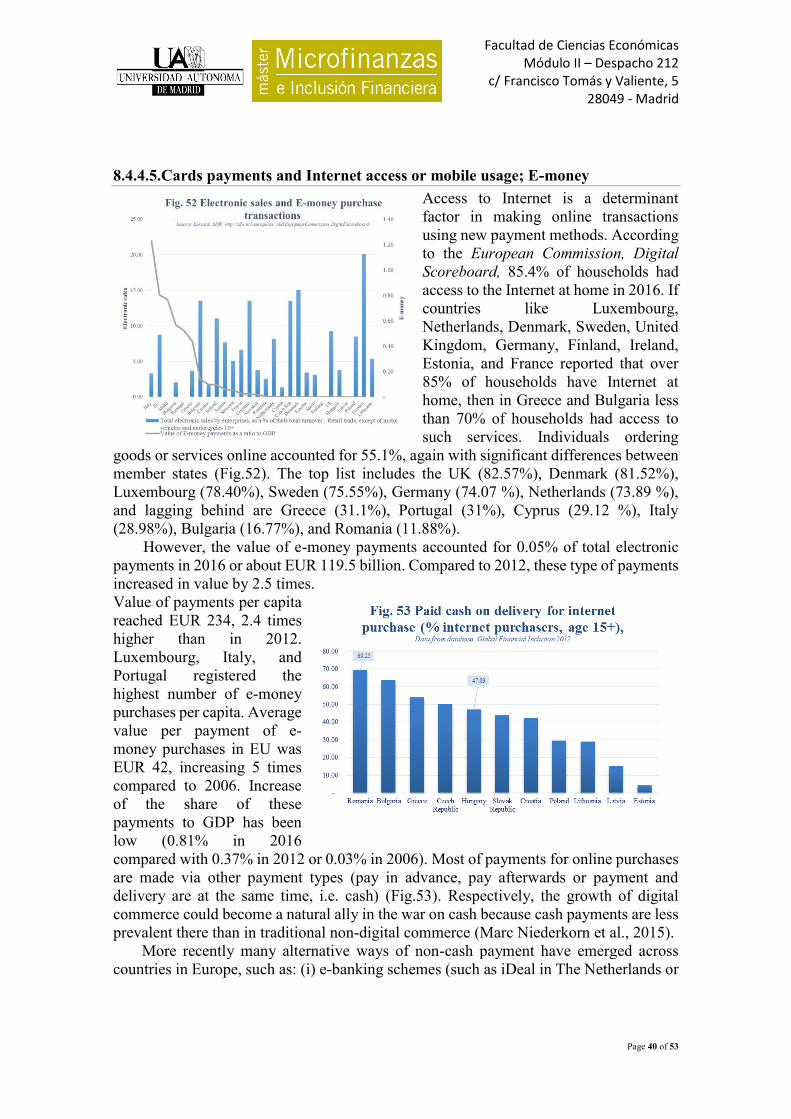
Facultad de Ciencias Económicas Módulo II – Despacho 212
c/ Francisco Tomás y Valiente, 5 28049 - Madrid
Page 40 of 53
8.4.4.5.Cards payments and Internet access or mobile usage; E-money Access to Internet is a determinant factor in making online transactions using new payment methods. According to the European Commission, Digital Scoreboard, 85.4% of households had access to the Internet at home in 2016. If countries like Luxembourg, Netherlands, Denmark, Sweden, United Kingdom, Germany, Finland, Ireland, Estonia, and France reported that over 85% of households have Internet at home, then in Greece and Bulgaria less than 70% of households had access to such services. Individuals ordering
goods or services online accounted for 55.1%, again with significant differences between member states (Fig.52). The top list includes the UK (82.57%), Denmark (81.52%), Luxembourg (78.40%), Sweden (75.55%), Germany (74.07 %), Netherlands (73.89 %), and lagging behind are Greece (31.1%), Portugal (31%), Cyprus (29.12 %), Italy (28.98%), Bulgaria (16.77%), and Romania (11.88%).
However, the value of e-money payments accounted for 0.05% of total electronic payments in 2016 or about EUR 119.5 billion. Compared to 2012, these type of payments increased in value by 2.5 times. Value of payments per capita reached EUR 234, 2.4 times higher than in 2012. Luxembourg, Italy, and Portugal registered the highest number of e-money purchases per capita. Average value per payment of e-money purchases in EU was EUR 42, increasing 5 times compared to 2006. Increase of the share of these payments to GDP has been low (0.81% in 2016 compared with 0.37% in 2012 or 0.03% in 2006). Most of payments for online purchases are made via other payment types (pay in advance, pay afterwards or payment and delivery are at the same time, i.e. cash) (Fig.53). Respectively, the growth of digital commerce could become a natural ally in the war on cash because cash payments are less prevalent there than in traditional non-digital commerce (Marc Niederkorn et al., 2015).
More recently many alternative ways of non-cash payment have emerged across countries in Europe, such as: (i) e-banking schemes (such as iDeal in The Netherlands or

Facultad de Ciencias Económicas Módulo II – Despacho 212
c/ Francisco Tomás y Valiente, 5 28049 - Madrid
Page 41 of 53
GiroPay and Sofort in Germany and EPS (Electronic Payment Standard)43 in Austria, MyBank by EBA(Euro Banking Association)44; (ii) Online payment schemes (such as Paypal); (iii) Mobile payments schemes, categorized in Mobile Contactless Payments, Mobile Remote Payments, M-Wallets, and mPOS initiatives.45
Furthermore, the technology used to make a payment is not important, for instance, mobile phone, traditional payment instruments are preferred when choosing the financing modality. According to the Report Federal Reserve Consumers and Mobile Financial Services 2016 (Sam Dodini et al., 2016), the debit cards are the most popular sources of fund transfers (56%), followed by credit cards (48%). Of those not using mobile banking, the primary reason respondents cited was a belief that their banking needs were being met without the use of mobile banking (88 percent).
According to WB Global Findex 2017, in EU countries, people use mobile phone or internet to access a financial institution account, more in Denmark, Finland, Sweden and Netherlands (Fig.54). Countries as Italy, Romania, Greece and Bulgaria registered a much-reduced use of mobile phones and internet to access a financial institution account, in some of these cases due to lower mobile and internet penetration rate.
Exceptional customer experience seems too critical to the success of online purchase and payments. It is important to mention here the significant impact on payments using the mobile phone of non-banks. In the EU countries, one of the main tasks of Directive EU PSD246 is opening the EU payment market for companies offering consumer or business-oriented payment services based on the access to information about the payment account – the so-called ‘payment initiation services providers’ and ‘account information services providers’.47 For example, a group of competing banks from Poland launched the Polish Payment Standard allowing the consumers to make any type of payments with the mobile phone. BLIK is available to approximately 70% of the Polish banks’ clients. 48 Other important players from Spain, such as Santander, Caixabank and Telefónica cooperated to launch the P2P remittance transfer service via mobile phoney YaaP Money49. However, in 2016 they announced the closure of the project due to incurred losses. This platform was replaced with an innovative payment solution, BIZUM, a pioneer in Europe through which the banks increased the service offer for their clients.
43 https://www.buckaroo-payments.com/products/payment-methods/eps/ 44 https://www.mybankpayments.eu/ 45 EPC091-14 EPC Overview on Mobile payments initiatives, 2014, European Payments Council 46 DIRECTIVE (EU) 2015/2366 OF THE EUROPEAN PARLIAMENT AND OF THE COUNCIL of 25 November 2015 on
payment services in the internal market 47 http://europa.eu/rapid/press-release_IP-15-5792_en.htm?locale=en 48 https://www.finextra.com/pressarticle/71555/blik-becomes-the-first-non-card-payment-scheme-in-poland/retail 49 https://www.genbeta.com/actualidad/la-espanola-yaap-money-anuncia-su-cierre-tras-solo-tres-anos-de-actividad

Facultad de Ciencias Económicas Módulo II – Despacho 212
c/ Francisco Tomás y Valiente, 5 28049 - Madrid
Page 42 of 53
27 banks that operate in Spanish market united to develop innovative payment solutions.50 In Sweden, partnerships launched in 2017 with Samsung Pay , and Apple Payhave encouraged consumers to explore contactless and mobile payments – taking Swedish consumers beyond traditional card use.51
8.5.Electronic Payments and Cybersecurity However, there is a dark side within the shift to a cashless society – concerns about
an increase in cybercrime and data theft, surveillance and the exclusion of those unbanked or only equipped with cash. The EU Directive PSD252 sets the priority to introduce strict security requirements for the initiation and processing of electronic payments and the protection of consumers’ financial data53 and Directive 92/2014 cares for those without a paying account.
In a recent study by ECB 2014, fraud with cards issued within SEPA stood at €1.3 billion in 2012 or 0.038% of the value of card transactions. In 2012, the essential share of the value of fraud resulted from payments via mail and telephone order or on the internet (60%), while 23% resulted from POS terminals and 17% from ATMs.54
The World Payments Report 2016 by Capgemini and BNP Paribas emphasised that 90% of payment industry executives declare that the corporate adoption of mobile devices in their sector is slow. The existing barriers limit the use of mobile phones to make payments to only approval of payment, reception of alerts and monitoring of transactions. 55 On the other hand, the consumers are more open to adopt a digital innovation from a supplier they have a trustworthy relationship. Respectively, when trust is earned, the consumers are open to adopt new services, especially in the case of mobile bank applications (VISA, 2017).56
Moreover, ensuing the accessibility and security of electronic payment channels or points that accept bank cards and/or other electronic payment instruments is important for banks as payment service providers. The author could suppose that the customer with immediate or convenient access to payment points use non-cash payment methods and tend to keep their money in their bank accounts for longer periods of time.
50 https://bizum.es/sobre-nosotros/ 51 https://vision.visaeurope.com/blogs/sweden-in-2018-one-step-closer-to-cashless 52 DIRECTIVE (EU) 2015/2366 OF THE EUROPEAN PARLIAMENT AND OF THE COUNCIL of 25 November 2015 on
payment services in the internal market 53 http://europa.eu/rapid/press-release_IP-15-5792_en.htm?locale=en 54 ECB, 2014, CARD PAYMENTS IN EUROPE – A RENEWED FOCUS ON SEPA FOR CARDS, April 2014, European
Central Bank, 2014 55 2016 World Payments Report, Capgemini & BNP Paribas, 12th edition 56 VISA, 2017, INNOVATIONS FOR A CASHLESS WORLD Consumer Desire and the Future of Payments 2017 EDITION,
Visa

Facultad de Ciencias Económicas Módulo II – Despacho 212
c/ Francisco Tomás y Valiente, 5 28049 - Madrid
Page 43 of 53
EU data show a direct relationship between the use of e-government services and acceptance and usage of bank cards (Fig.55). Hence, the measures to encourage and streamline trust in public services and the use of new technologies should be considered priorities by the governments where card payment penetration is low.
9. General Findings 1. Overall, EU Member States reached a reasonably high level of financial inclusion.
Eastern countries such as Hungary (74.9%), Bulgaria (72.2%) and Romania (57.6%) are still lagging behind.
2. Financial inclusion data show that 35.2% of population who receive pensions from the state, 35.5% of those receiving government transfers and 19.1% of wage earners received these in a bank account they opened for the first time in their lives precisely for this specific reason.
3. Demand for cash is growing. Compared to 2002, the volume of cash in circulation increased by about 5.3 times. In the same period, demand for EUR 500 denominated banknotes grew +8.5 times, EUR 100 +7.2 times, EUR 50 +6.9 times, and EUR 200 +3.2 times. At the end of 2017, EUR 500 denominated banknotes accounted for 21.9% of total, while EUR 100, EUR 50 and EUR 20 denominated banknotes accounted for 70.9% of total cash in circulation.
4. Most EU countries recorded an ascending evolution of cash withdrawals from ATMs due to evolution of supply and issuance of bankcards for a growing number of clients.
5. EU countries statistical data indicate that not always the high level of account ownership within a financial institution demonstrates a low predilection to withdraw cash.
6. In the past 10 years, the EU institutions offering payment services to non-MFIs reduced the number of offices. In the past 4 years, this decrease was drastic due to the extension of digital banking alternatives to brick and mortar “shops”.
7. The intensity of using the available ATM infrastructure by holders of cards issued by resident PSPs indicates significant differences in the EU countries. High

Facultad de Ciencias Económicas Módulo II – Despacho 212
c/ Francisco Tomás y Valiente, 5 28049 - Madrid
Page 44 of 53
density of ATMs generates low utility of these terminals in case of Spain, Italy or Luxemburg.
8. The UK (34%), Germany (20.3%), France (10%), the Netherlands (7.3%) and Spain (6.1%) account for 78% of total value of non-cash payments registered in 2016.
9. In 2016, for the first time, the number of card payments per capita (including e-money) exceeded the number of ACH electronic payments. On average, about 122 electronic card payments (including e-money) per capita and 114 ACH payments per capita were made in 2016 in the EU.
10. Most used non-cash payment instruments were cards (49% in 2016). Credit transfers ranked second (25.1%) followed by direct debits (20.4%) and cheques (2.5%). The use of e-money transactions was limited, accounting for about 2.3%.
11. The competition between all payment instruments is obvious; however, the competition between electronic payments instruments is simple but fierce compared to cash payments. The share of card transactions increased in the past 10 years by 14.5 p.p. influencing the decrease of share of credit transfers, direct debits and cheques transactions by 4.9 p.p., 4.98 p.p. and 6.8 p.p., respectively.
12. The average monthly number of credit transfers per capita was five in 2016, one more transaction per month than in 2006. Eighteen countries of EU28 recorded an increase of monthly transactions per capita over the EU average.
13. Based on the relative importance of electronic payments, the number of direct debits had a significant share in Germany (50.58%), Spain (27.92%), and Austria (25.55%).
14. The relative importance of cheques decreased in the past 10 years to 2.48% of total number of electronic payments, which in 2006 accounted for 9.2% of total, and in 2000 for 18.7%. In 2016, nearly 70.7% of cheques issued at Union level were in France.
15. Data show that in the past years, EU countries made considerable efforts to increase and improve the acceptance network of payment cards by registering an increase of POS per million of inhabitants.
16. Card payments at POS accounted for 88% with big differences between countries. Italy, Poland, Netherlands, Estonia, Greece, Denmark and Lithuania recorded a share of 90% card payments via POS of total card transactions.
17. Among the cards issued by resident PSPs, the cards with a debit function prevailed, registering an increase of 22.4% in the past 10 years.
18. EU countries that register a high number of electronic payments per capita 57 (Sweden, the Netherlands, UK, Denmark, Finland) have a lower share of shadow economy in GDP, while Italy, Bulgaria, Romania and Greece, countries with less electronic transactions per capita58, register a high share of shadow economy in
57 More than 350 transactions per capita 58 Less than 50 transactions per capita
Facultad de Ciencias Económicas Módulo II – Despacho 212
c/ Francisco Tomás y Valiente, 5 28049 - Madrid
Page 45 of 53
GDP. Furthermore, EU countries show a reversed correlation between card payment level in the households’ consumption and share of shadow economy in GDP.
19. Data show, at large extent, that countries with higher value of monthly card payments per card registered a lower value of card cash withdrawals.
20. The average value of e-money payments was EUR 42, which increased 5 times compared to 2006. Retail sales reorientation towards online system has not generated big increase of the share of these payments in the GDP.
21. People use mobile phone or internet to access a financial institution account, more in Denmark, Finland, Sweden and Netherlands. Countries as Italy, Romania, Greece and Bulgaria registered a much-reduced use of mobile phones and internet to access a financial institution account, in some of these cases due to lower mobile and internet penetration rate.
22. Data show a direct relation between the use of e-government services and level of acceptance and use of payment cards.
10. CONCLUSIONS: Drivers of the Demand for Cash and Non-cash Payments
From the analysis of EU statistical data on payments and financial inclusion, the author concludes that it is not sufficient either to equip individuals with only basic transaction accounts or to ensure a high level of acceptance of digital payment technologies within the transition to a cashless economy.
One could wonder why any industry would actively limit access to a good (i.e. cash), which is apparently in growing popular demand (Paul van der Knaapet al., 2016)? Independence of cash advocates advance three main arguments. The first concerns the costs of payment transactions: the electronic means are, they say, more advantageous than the cash settlement, from the point of view of efficiency and safety. Secondly, the disappearance of cash should strongly restrict shadow economy. Thirdly, the central bank would have more leeway because investors could no longer turn to cash to avoid negative interest rates (Hans Gersbach, Martin Hellwig, 2017).
Maybe the demand for cash (for transactional, hoarding or any other purpose) and non-cash payments is influenced by relative pragmatic factors as:
AT MACRO LEVEL: (i) Social stability in the society: if a society is unstable or an economic or financial
crisis arises, demand for cash increases (A.T. Kearney and Friedrich Schneider, PhD, 2013).
(ii) Interest rate: with lower interest rates, the level of hoarding goes up. This decreases the opportunity cost to hold cash because the consumers and merchants simply have few incentives to keep the money in banks or fewer reasons to not withdraw the cash from the accounts. This also streamlines the consumption or sales management depending on the volume of cash people carry or merchants receive as payments for their sales.

Facultad de Ciencias Económicas Módulo II – Despacho 212
c/ Francisco Tomás y Valiente, 5 28049 - Madrid
Page 46 of 53
(iii) Trust in financial sector and banks: this is related directly to the first point: once the financial stability decreases or even financial crisis appears, the trust in electronic financial system decreases and the demand for cash increases (Paul van der Knaap et al., 2016). The financial system in Europe is not as strong as thought. In the past ten years, the Europeans went through a Spanish banking crisis, Irish banking crisis or Greek banking crisis. And once the population starts to prefer cash, the banks are facing weak potential to attract deposits, which worsens their financial situation.
AT MICRO LEVEL: (iv) Technological development: advocating for new technologies and their
acceptance by the population in daily life cannot avoid the payment segment digitalization, because it represents one of the consumption process phases.
(v) Incentives: using awards programmes make the electronic payment instrument more attractive or imposing additional taxes make the use of cash less attractive.
(vi) Limits set: the restrictions to use a certain payment instrument, i.e. cash, has the purpose to reduce shadow economy, impose indirectly the consumers to abide by the new rules and in time, could modify their payment behaviour. It is not clear to what extent these restrictions can influence or streamline the electronic payments.
(vii) Or there are no rational reasons in choosing a payment instrument and the “decision-making is more of an emotional process than a cognitive process”.59
11. Proposals 1. Governments, consumers and merchants have potentially strong power to
influence the development of the use of electronic payments.
1.1 Governments should create incentives for people who do not use alternative payments methods to cash for low-value payments, such as adding VAT discounts for these purchases. This could be an easy measure to change behaviour. It should be mentioned here that public expenses (i.e. VAT discounts) should be assumed only for low-value payments to small merchants that are still reluctant to accept new technologies and payment methods. The State should not get involved in subsiding the purchases from big retailers, because they already benefit from scale effect of electronic payment method and in this case will be the main winners of this measure within the process of transition to a cashless society.
1.2 Governments have to raise the awareness of people who do not use their cards for low-value purchases by launching guidelines on how societies gain from an improved payment system are shared and invested. Create mechanisms to streamline electronic payments and their integration in e-government system. Furthermore, along with efforts to increase the safety and simplify e-government services, an important step would be to encourage the population to use e-government services to ensure the link with public institutions. This will create an important premise to increase the trust and knowledge of
59 According to Frank van der Horst and Ester Matthijsen of the Dutch National Bank, Source: Alan Wheatley, Cash is dead -
Long time Cash, 2017, FINANCE & DEVELOPMENT | June 2017, 32-35.

Facultad de Ciencias Económicas Módulo II – Despacho 212
c/ Francisco Tomás y Valiente, 5 28049 - Madrid
Page 47 of 53
internet users in managing these relations on-line. Moreover, the governments may launch pilot projects to test the availability of population to pay low-value fiscal fines or others via electronic means (i.e. cards) by reducing their value, if such payment instrument is selected.
1.3 To ensure more confidence in e-money or mobile payment instruments, the competent authorities should examine the level of protection of these funds (i.e. through deposits’ guarantee mechanisms) and launch awareness campaigns for the population regarding the viability of these instruments. Increasing e-money and m-payment transactions could generate scale savings for merchants, who already make on-line sales and encourage new merchants to adhere to the online environment.
1.4 Limits imposed by the governments for cash transaction management had their effects in the immediate period after their implementation. However, taking into account that an essential number of cash payments are made for low-value purchases, it is clear that these limits affect insignificantly this segment of sales. It would seem more efficient for the Governments, besides the receipt lotteries or other restrictive measures to reduce tax evasion, to take into account the effects of promoting electronic payments to reduce the shadow economy. An incentive would be the involvement of merchants with significant share of sales via electronic means (i.e. cards) in such types of lotteries.
2. Because banks and merchants drive the cashless transition process:
2.1 It is necessary to increase reliability and trust in new services that substitute cash. Here, the money transfer service development via mobile payments and cash withdrawal from ATMs was a phase to test the technologies. However, the inexistence of commissions for cash withdrawal favours these services to the detriment of electronic payments. In this case, banks have to make pro-active decisions to cover short-term losses (i.e. high risks of losing clients because of imposing cash withdrawal charges via ATMs) and provide incentives to clients who use electronic payments. For instance, a solution would be to provide clients who manage their purchases exclusively via electronic payments with attractive prices, even by reducing the price for current account management (i.e. commissions or minimum balance in the account).
2.2 Banks should assume more cost for encouraging small merchants and micro-retailers to use electronic payments. The banks have two options to provide incentives: or to reduce the costs collected or increase the interest rate to the extent when these clients create own incentives for their clients to use electronic payments when purchasing goods or services.
2.3 Commercial banks that reap benefits by developing and advocating for electronic payments at large scale have more mechanisms to play an active role in changing the behaviour of merchants and micro-retailers. An example is to impose requirements when receiving finances at reduced costs when these debtors have high shares of sales turnover via electronic payments.
Facultad de Ciencias Económicas Módulo II – Despacho 212
c/ Francisco Tomás y Valiente, 5 28049 - Madrid
Page 48 of 53
Furthermore, these measures would provide the banks with qualitative instruments to reduce financial risks. Thus, besides decreasing the rather high moral hazard risk in this group of debtors, they will reduce the refusal rate60 in financing them by banks (taking into account the low level of sale transparency due to usage of cash as payment modality most frequently accepted by them).
3. Because for the governments and central banks, the cash represents a commodity with an evergreen potential, they should assume a part of related social costs from the revenues obtained from fees imposed for issuing liquid money.
3.1 Central Banks should drastically increase the banks’ costs for money in circulation, even taking into account the perspective that commercial banks will translate these into costs to bank clients. It is clear that drastic increase of costs will not affect immediately the revenues of central banks, but will make cash a luxury. Respectively, the consumers will choose to pay via an additional method of payment to add to their privacy.
3.2 Governments should examine the effects of accepting some joint actions of banks (antitrust measures) to impose additional charges for cash withdrawal via ATMs. Of course, consumers should be aware / knowledgeable of the effects of such decisions. Furthermore, the governments could impose clear requirements for inverting the revenues obtained by banks as a result of such decisions by equipping small retailers with equipment that favours electronic payments.
60 Rejection rates of loan applications by micro-enterprises are three times higher than those of other firms - 18 %
Source: Karin Attström et al. 2015, ‘Interim evaluation of the European Progress Microfinance facility Final Report Specific Contract VC/2013/0660’, European Union, 2015), page 51

Facultad de Ciencias Económicas Módulo II – Despacho 212
c/ Francisco Tomás y Valiente, 5 28049 - Madrid
Page 49 of 53
BIBLIOGRAPHY
1. Henk Esselink, Lola Hernández, 2017, “The use of cash by households in the euro
area”, Occasional Paper Series No 201, European Central Bank (ECB),
November 2017
2. Paul van der Knaap, Taco de Vries, Karin Tielenius Kruythoff, 2016, “The Cash
Report 2016 for Europe”, G4S Cash Solutions and Payments Advisory Group
World Trade Center, 2016
3. Łukasz Goczek, Bartosz Witkowski, 2015, NBP Working Paper No. 196,
“Determinants of non-cash payments”, Economic Institute,Warsaw, 2015
4. Iftekhar Hasan, Tania De Renzis, Heiko Schmiedel, 2012, “Retail payments and
economic growth”, Bank of Finland Research, Discussion Papers 19, 2012
5. Björn Segendorf, Thomas Jansson, 2012, “Cards or cash. How should we pay?”,
Sveriges Riksbank Rconomic Review 2012:3
6. Ghada Teima, Nina Bilandzic, Oya Pinar Ardic Alper, Nicole Meyers, 2016,
“Innovation in Electronic Payment Adoption: The case of small retailers”, 2016,
The World Bank Group
7. Rafael López del Paso, Santiago Carbó Valverde - University of Granada and
Federal Reserve Bank of Chicago, “Does the development of non-cash payments
affect bank lending?”
8. Danish Payments Council, 2016, “Report On The Role Of Cash In Society”,
Danmarks Nationalbank, August 2016
9. Crystal Ossolinski, Tai Lam and David Emery, 2014, “The Changing Way We
Pay: Trends in Consumer Payments”, Research Discussion Paper RDP 2014-05,
the Reserve Bank of Australia, June 2014
10. Naoki Wakamori and Angelika Welte, 2012, “Why Do Shoppers Use Cash?
Evidence from Shopping Diary Data”, Working Paper/Document de travail 2012-
24, Bank of Canada, 2012
11. GPFI The Better Than Cash Alliance, 2017, “BUILDING INCLUSIVE DIGITAL
PAYMENTS ECOSYSTEMS: Guidance Note for Governments”, G20 Global
Partnership for Financial Inclusion (GPFI), May, 2017
12. Stephen Whitehouse, Rik Goslinga, Frederick Michna, Maciej Gawinecki, Philipe
Menier, 2016, “Cashing In on Cashless Commerce”, ATKearney, 2016
13. John Bagnall, David Bounie, Kim P. Huynh, Anneke Kosse, Tobias Schmidt,
Scott Schuh and Helmut Stix, 2014, “Consumer Cash Usage A Cross-Country
Comparison with Payment Diary Survey Data”, Working Paper Series NO 1685
/ June 2014, European Central Bank (ECB)
14. Bank for International Settlements and World Bank Group, 2015, “Consultative
report Payment aspects of financial inclusion”, September 2015, Committee on
Payments and Market Infrastructures, World Bank Group

Facultad de Ciencias Económicas Módulo II – Despacho 212
c/ Francisco Tomás y Valiente, 5 28049 - Madrid
Page 50 of 53
15. Marc Niederkorn, Phil Bruno, Grace Hou, Florent Istace, Sukriti Bansal, 2015, “Global Payments 2015: A Healthy Industry Confronts Disruption”, McKinsey & Company 2015
16. A.T. Kearney and Friedrich Schneider, PhD, 2013, “Shadow Economy in Europe, 2013”, A.T. Kearney
17. Schmiedel, Heiko; Kostova, Gergana; Ruttenberg, Wiebe, 2012, “The social and private costs of retail payment instruments: a European perspective”, ECB Occasional Paper, No. 137, European Central Bank (ECB)
18. Mark Zandi, Virendra Singh, Justin Irving, 2013, “The Impact of Electronic Payments on Economic Growth”, MOODYS ANALYTICS, February 2013
19. Morten Bech, Umar Faruqui, Frederik Ougaard, Cristina Picillo, 2018, “Payments are a-changin’ but cash still rules”, BIS Quarterly Review, March 2018
20. Asli Demirgüç-Kunt, Leora Klapper, Dorothe Singer, Saniya Ansar, Jake Hess, 2017, “The Global Findex Database: Measuring Financial Inclusion and the Fintech Revolution 2017”, 2018 International Bank for Reconstruction and Development/The World Bank
21. MONEYVAL, 2014, “Strengthening Financial Integrity Through Financial Inclusion”, Committee of Experts on the Evaluation of Anti-Money Laundering Measures and the Financing of Terrorism, Council of Europe, 2014
22. EY, “Reducing the Shadow Economy through Electronic Payments”, EY Study Commissioned by MasterCard
23. Wilko Bolt, David Humphrey, Roland Uittenbogaard, 2005, “The Effect Of Transaction Pricing On The Adoption Of Electronic Payments: A Cross-Country Comparison”, WORKING PAPER NO. 05-28, Federal Reserve Bank of Philadelphia, International Journal of Central Banking · March 2008
24. Allen N. Berger, 2003, “The Economic Effects of Technological Progress: Evidence from the Banking Industry”, Journal of Money, Credit, and Banking, Volume 35, 2003
25. Björn Segendorf and Thomas Jansson, 2012, “The Cost of Consumer Payments in Sweden”, Working Paper Series 262, Sveriges Riksbank, JUNE 2012
26. Mats Bergman, Gabriella Guibourg and Björn Segendorf, 2007, “The Costs of Paying – Private and Social Costs of Cash and Card”, Sveriges Riksbank Working Paper Series 212, September 2007
27. Wilko Bolt and Sujit Chakravorti, 2010, “Digitization of Retail Payments”, DNB Working Paper No. 270 / December 2010, De Nederlandsche Bank NV
28. Andreas Hoffmann/Dr Heike Wörlen (coordination), Andrea Friedrich, Nadine Knaust, Dr Ulf von Kalckreuth, Dr Tobias Schmidt, 2009, “Payment behaviour in Germany An empirical study of the selection and utilisation of payment instruments in the Federal Republic of Germany”, Deutsche Bundesbank 2009

Facultad de Ciencias Económicas Módulo II – Despacho 212
c/ Francisco Tomás y Valiente, 5 28049 - Madrid
Page 51 of 53
29. European Commission, 2015, “Survey on merchants' costs of processing cash and card payments Final results”, March 2015
30. Marina Pérez, Sonia Guinea and J. Darío Negueruela, 2014, “The Banco de España’s cash survey”, Banco de España, Billetaria, October 2014 |6-10
31. Kim P. Huynh, Philipp Schmidt-Dengler and Helmut Stix, 2014, “The Role of Card Acceptance in the Transaction Demand for Money”, Bank of Canada Working Paper 2014-44, September 2014
32. Malte Krüger, 2014, “Costs and Benefits of Cash and Cashless Payment Instruments”, Study commissioned by the Deutsche Bundesbank
33. Nicole Jonker, Mirjam Plooij and Johan Verburg, 2015, “Does a public campaign influence debit card usage? Evidence from the Netherlands”, DNB Working Paper No. 470 / April 2015
34. Wendy Matheny, Shaun O’Brien, and Claire Wang, 2016, “The State of Cash Preliminary Findings from the 2015 Diary of Consumer Payment Choice”, November, 2016
35. Sam Dodini, Alejandra, Lopez-Fernandini, Ellen Merry, and Logan Thomas, 2016, “Consumers and Mobile Financial Services 2016”, Report prepared by the Consumer and Community Development Research Section of the Federal Reserve Board’s Division of Consumer and Community Affairs (DCCA), March 2016.
36. VISA, 2017, “Innovations For A Cashless World Consumer Desire And The Future Of Payments 2017 Edition”, Visa
37. Capgemini & BNP Paribas, 2016, “2016 World Payments Report”, 12th edition
38. Jussi Snellman, Jukka Vesala, David Humphrey, 2000, “Substitution of Noncash Payment Instruments for Cash in Europe”, Bank Of Finland Discussion Papers1/2000
39. Fernando Alvarez and Francesco Lippi, 2009, “Financial Innovation And The Transactions Demand For Cash”, Econometrica, Vol. 77, No. 2 (March, 2009), 363–402
40. Amromin, Gene, and Sujit Chakravorti (2009), “Whither loose change?: The diminishing demand for small denomination currency,” Journal of Money, Credit and Banking, 41(2-3), 315-335
41. ECB 2014, “Card Payments In Europe – A Renewed Focus On Sepa For Cards”, April 2014, European Central Bank
42. UK Financial Inclusion Commission, “FINANCIAL INCLUSION: Improving the financial health of the nation”, Parliament Financial Inclusion Commission, The United Kingdom, March 2015
43. EPC091-14 “EPC Overview on Mobile payments initiatives”, 2014, European Payments Council
44. Karin Attström, Hanna-Maija Kuhn, Tsvetelina Blagoeva, Edmund Beavor; Annegret Bötel, 2014, “Interim evaluation of the European Progress

Facultad de Ciencias Económicas Módulo II – Despacho 212
c/ Francisco Tomás y Valiente, 5 28049 - Madrid
Page 52 of 53
Microfinance facility Final Report Specific Contract VC/2013/0660”, European Union, 2015
45. David Humphrey, Magnus Willesson, Ted Lindblom, Göran Bergendahl, “What does it Cost to Make a Payment?”, Review of Network Economics, Vol.2, Issue 2 – June 2003
46. Hans Gersbach, Martin Hellwig, 2017, « Supprimer l’argent liquide n’a guère de sens », La Vie économique 8–9 / 2017
47. Alan Wheatley, 2017, “Cash is dead - Long time Cash”, FINANCE & DEVELOPMENT | June 2017, 32-35
48. ING Survey Savings January 2017,
https://www.ezonomics.com/ing_international_surveys/savings-2017/
49. ECB GLOSSARY OF TERMS RELATED TO PAYMENT, CLEARING AND SETTLEMENT SYSTEMS, ECB December 2009
50. DIRECTIVE 2014/92/EU OF THE EUROPEAN PARLIAMENT AND OF THE COUNCIL of 23 July 2014 on the comparability of fees related to payment accounts, payment account switching and access to payment accounts with basic features
51. DIRECTIVE (EU) 2015/2366 OF THE EUROPEAN PARLIAMENT AND OF THE COUNCIL of 25 November 2015 on payment services in the internal market
52. ECB Payments statistics: methodological notes
53. Ministère Des Finances Et Des Comptes Publics, Ministère De L’économie, De L’industrie Et Du Numérique, « Assises Des Moyens De Paiement », 2015, Dossier De Presse Paris, le 2 juin 2015, economie.gouv.fr (https://www.economie.gouv.fr/files/0_dp-amp-150601.pdf )
54. Friedrich Schneider, 2015, “Size and Development of the Shadow Economy of 31 European and 5 other OECD Countries from 2003 to 2015: Different Developments”, http://www.econ.jku.at/members/Schneider/files/publications/2015/ShadEcEurope31.pdf
55. European Commission, Digital Scoreboard
56. EUROSTAT
57. http://databank.worldbank.org/data/reports.aspx?source=global-financial-inclusion
58. http://sdw.ecb.europa.eu/reports.do?node=100000760
59. https://www.ecb.europa.eu/paym/retpaym/undpaym/html/index.en.html
60. https://en.wikipedia.org/wiki/Seigniorage
61. https://en.wikipedia.org/wiki/Near-field_communication

Facultad de Ciencias Económicas Módulo II – Despacho 212
c/ Francisco Tomás y Valiente, 5 28049 - Madrid
Page 53 of 53
62. https://www.eestipank.ee/en/press/people-are-used-paying-bankcards-still-would-not-see-cashless-society-11122017
63. https://www.europe-consommateurs.eu/fileadmin/user_upload/eu- consommateurs/PDFs/PDF_EN/Limit_for_cash_payments_in_EU.pdf
64. https://static.anaf.ro/static/10/Anaf/legislatie/L_70_2015.pdf
65. http://www.bancherul.ro/efectele-legii-privind-plafonarea-platilor-si-incasarilor-in-numerar-banii-din-conturile-bancare-ale-romanilor-au-crescut-cu-6,2-miliarde-lei-in-trei-luni--14718
66. https://www.ing.com/Newsroom/All-news/Negative-interest-rates-to-make-savers-hoard-.htm
67. http://www.mfinante.ro/loteriabonurilor.html
68. https://ec.europa.eu/info/business-economy-euro/banking-and-finance/consumer-finance-and-payments/payment-services/single-euro-payments-area-sepa_en
69. http://europa.eu/rapid/press-release_IP-15-5792_en.htm?locale=en
70. http://europa.eu/rapid/press-release_IP-15-5792_en.htm?locale=en
71. http://europa.eu/rapid/press-release_IP-15-4585_en.htm
72. https://www.thelocal.se/20170809/sweden-predicted-to-be-a-cashless-society-by-2030
73. http://europa.eu/rapid/press-release_MEMO-16-2162_en.htm
74. http://europa.eu/rapid/press-release_IP-15-5792_en.htm?locale=en
75. https://www.finextra.com/pressarticle/71555/blik-becomes-the-first-non-card-payment-scheme-in-poland/retail
76. https://www.genbeta.com/actualidad/la-espanola-yaap-money-anuncia-su-cierre-tras-solo-tres-anos-de-actividad
77. https://bizum.es/sobre-nosotros/
78. https://vision.visaeurope.com/blogs/sweden-in-2018-one-step-closer-to-cashless
79. http://europa.eu/rapid/press-release_IP-15-5792_en.htm?locale=en
80. https://www.buckaroo-payments.com/products/payment-methods/eps/
81. https://www.mybankpayments.eu/