wp5.2. assessment of air emissions sources in the port of ... activities/risk... · assessment of...
TRANSCRIPT
WP5.2. Assessment of air
emissions sources in the Port of
Barcelona and future scenario
www.apice-project.eu
Assessment of air emissions sources in the Port of Barcelona and
future scenario
Pedro Fernández and Carolina Pérez, EUCC Mediterranean Centre
May 2012
Acknowledgments:
The authors would like to thank all stakeholders that contributed to this study. We are particularly
grateful to Mr Joaquim Cortés from the Port Authority of Barcelona and Mr Sergi Balagué from the
Technical Office for Air Quality Improvement Plans (Generalitat de Catalunya) for providing us with
data, information and knowledge on port activities and emissions. Furthermore,
we thank Mr Carles Rua (Strategy Department, Port of Barcelona) and Mr Carles Mayol (Commercial
Department, Port of Barcelona), and the towage companies SAR Remolcadores S.L. and Remolcadores
de Barcelona S.A. for their collaboration all over this work.
Finally, we acknowledge the Programme Med of the European Commission for their financial support
in the framework of the APICE project.
www.apice-project.eu
TABLE OF CONTENTS
1.1 Identification of the present time risk activities and vulnerability systems in terms of
emissions................................................................................................................................... 1
1.1.1. Description of the docks in Barcelona port........................................................ 1
1.1.2. Risk activities in terms of air emissions ........................................................... 14
ACTIVITIES OF SHIPS AND VESSELS.................................................................................. 14
HARBOR CRAFT................................................................................................................ 17
LAND TRAFFIC: HEAVY-DUTY VEHICLES........................................................................... 20
LAND TRAFFIC: LOCOMOTIVES........................................................................................ 21
TERMINAL EQUIPMENT: CONTAINERS (CARGO HANDLING EQUIPMENT) ..................... 22
SOLID BULKS .................................................................................................................... 23
ENLARGEMENT AND MAINTENANCE WORKS................................................................. 24
OTHER PUNCTUAL SOURCES ........................................................................................... 24
1.2 Identification of the future time risk activities and vulnerability systems in terms of
emissions............................................................................................................................. 26
ACTIVITIES OF SHIPS AND VESSELS.................................................................................. 26
HARBOR CRAFT................................................................................................................ 31
CARGO HANDLING........................................................................................................... 31
SOLID BULKS .................................................................................................................... 32
LAND TRAFFIC: HEAVY DUTY VEHICLES........................................................................... 32
LAND TRAFFIC: LOCOMOTIVES........................................................................................ 33
Summary future emissions.............................................................................................. 33
1.3 Identification of the future risk activities and vulnerability systems in terms of air
quality concentrations........................................................................................................ 36
1.4 Involvement of stakeholders in the activities relevant with the presence of the
port in Barcelona ............................................................................................................ 36
1.5 Additional issues........................................................................................................... 37
1.6 Conclusions for Barcelona ............................................................................................ 38

1
www.apice-project.eu
1.1 Identification of the present time risk activities and vulnerability systems in terms of
emissions
1.1.1. Description of the docks in Barcelona port
A. Containers and multipurpose
The maps show locations of these docks
1. TCB
Along its 1.380 metre wharf and with its 16 metre draft, berthing for a large vessel is secured
at all times. The total 54 ha yard extension and 486 reefer plugs, permit a rational
distribution and an optimal preservation of the cargo. The capacity of the terminal is of more
than 1.3 million TEUs. Through 8 lanes for trucks and with a direct link to the rail
terminal, complete intermodal transport connections are easily carried out. Customs offices
inside the terminal facilitate an integrated logistic process. All working processes are
certified under the regulations of ISO 9001:2008 and ISO 14001 and it counts with a Quality
Policy and Environmental Policy.
Location: Moll 24 Sud
Surface: 57,58 ha
Equipment:
EQUIPMENT NUM.
Container Cranes Babcock & Wilcox Panamax 3
Container Cranes Paceco Panamax 2
Container Cranes ZPMC Panamax 1
Container Cranes Konecranes Super Post-Panamax 5
Container Cranes ZPMC Super Post-Panamax 3
Straddle Carriers Sisu/Valmet (3-HIGH) 19
Straddle Carriers Kalmar (4-HIGH) 33
Straddle Carriers Noell (4-HIGH) 12

2
www.apice-project.eu
Reach Stackers Sisu/kalmar 2
Empty Container Forklifts Sisu /Kalmar/Fantuzzi 9
Extra complementary equipment (forklifts) 31
Operational capacity:
Year TEUs
2008 1.220.500
2007 1.220.500
2006 1.000.000
2005 1.015.000
2004 934.293
Working times:
- Marine operations: 24h/day, 361 days/year
- Land operations: Monday - Friday; 6am - 8pm
Information technology:
TCB has developed the most advanced Information Technology systems for the
management of the operation and administration to ensure smooth processes and being
able to offer the best service to our customers. Information systems cover all the terminal
activities.
Economical information:

3
www.apice-project.eu
Sales (in thousands of euros)
Year Sales
2008 99.877
2007 92.633
2006 69.953
2005 72.174
2004 65.638
Investments (in thousands of euros)
Year Investment
2008 12.105
2007 21.589
2006 21.600
2005 4.992
2004 6.985
Other Characteristics:
• Rail terminal ferroviària (5 ha)
• Container freight station: 13.800 m2
• Covered storages: 3.600 m2
2. Terminal de Catalunya (TERCAT)
2.1. Terminal Muelle Príncipe de España
TERCAT was established in 1990 as the container terminal of “Muelle Príncipe de España”. In
2009, TERCAT handled half the containers that moved through the Port of Barcelona. It
operates 24/7.
Chararceristics:
Quay: 1.080 m
Berths: 4
Draft: 14 m
Ro-Ro ramps: 2

4
www.apice-project.eu
Area: 42 ha
Quay crane: 8 SuperPostPanamax and 1 PostPanamax
RTG (1 over 5; 1 over 4): 11
Reachstacker: 33
Tractors: 28
Reefer Plugs: 470
Rail: 2 x 450 m
Container freight station: 3.607 m2
Covered storages: 14.225 m2
2.2. Muelle Prat (work in progress, operations start foreseen in June 2012)
Polyvalent terminal:
Cranes: 8 moviles
Reach Stacker: 6
Frontal machines: 60
Fork-lifts: 5
Covered storages: 7.920 m2
Characteristics:
- Since November 2006, TERCAT has held a 35-year concession to build and operate a
new container terminal based at Muelle Prat. The new terminal will be semi-
automated.
- This terminal will help HPH develop TERCAT into its principal gateway port for the
Western Mediterranean
- The first phase of the development will consist of 1,500 meters of quay with a
minimum depth alongside of 16 meters.
- Upon completion of Phase Two, the new terminal will have 132 hectares of area
with 2,100 meters of quay and a depth alongside of up to 18 meters.
- Eventually, the terminal will cover over 200 hectares, rivaling with Northern
European terminals in size.

5
www.apice-project.eu
New Prat Terminal Total Phase 1 Phase 2
Berth Length (m) 2,100 1,500 600
No. Berths 7 5 2
Total Terminal Area 132 100 32
QC 24 18 6
ASC 112 80 32
Shuttle Carriers 57 42 15
3. Port Nou
Port Nou is a multi purpose terminal with capacity to handling any kind of goods: containers,
vehicles, semi trailers, general cargo, project cargo, etc.
Characteristics:
surface: 75.000 m2
berth line: 450 lineal meters and 12 m. draft
2 warehouses with 1.800 sqm.
2 Ro-Ro ramps.
75 power sources for reefer containers
1 mobile crane Liebherr LHM500S (140 t.)
2 gantry cranes Panamax of 40 t.
2 RTG of 50 t.
8 Reach Stacker of 45 t.
8 Tug masters for platforms and roll-trailers
2 fork-lifts 30 t.
3 fork-lifts 16 t.
3 fork-lifts 6 t.
24 fork-lifts 4 t.
B. Passengers terminals
6
www.apice-project.eu
Moll Adossat:
Terminal Marítima Internacional A. Turnaround: 4.500 pax
Terminal Marítima Internacional B. Turnaround: 4.500 pax
Terminal Marítima Internacional C. Turnaround: 3.800 pax
Terminal Marítima Internacional D. Turnaround: 4.500 pax
Moll de Barcelona:
Terminal Marítima Internacional Nord N
Terminal Marítima Internacional Sud S
Turnaround: 800 pax (Nord) –1.400 pax (Sud) – 1.500 Transit only
Terminal Marítima Drassanes Z:
Maritime station for ferries that, sometimes serves as terminal for passengers cruises and
therefore it fulfils all safety requirements.
Moll d’Espanya:
Terminal Marítima Maremagnum M. Turnaround: 200 pax
Moll de Sant Bertrà:
Terminal Ferry de Barcelona T. Turnaround: 250 pax
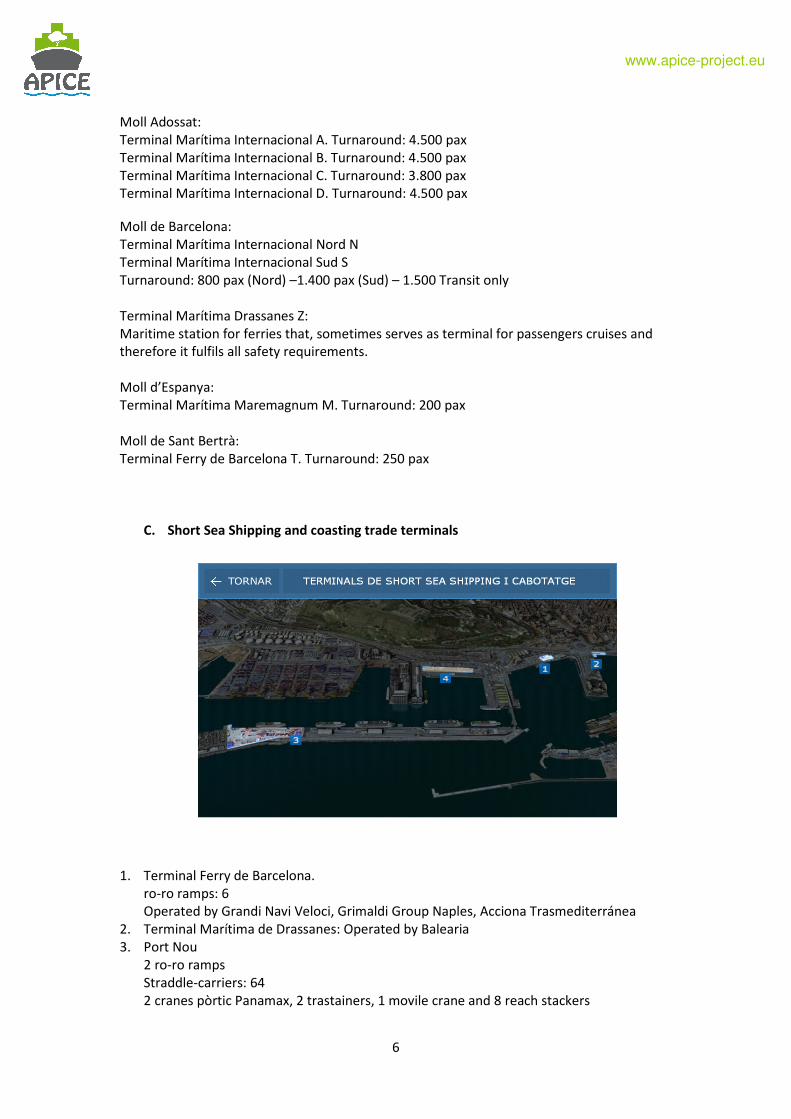
C. Short Sea Shipping and coasting trade terminals
1. Terminal Ferry de Barcelona.
ro-ro ramps: 6
Operated by Grandi Navi Veloci, Grimaldi Group Naples, Acciona Trasmediterránea
2. Terminal Marítima de Drassanes: Operated by Balearia
3. Port Nou
2 ro-ro ramps
Straddle-carriers: 64
2 cranes pòrtic Panamax, 2 trastainers, 1 movile crane and 8 reach stackers

7
www.apice-project.eu
Operated by: Cie Tunisenne de Navigation (Cotunav), Cie National Algerienne Navigation
(CNAM) and Fast Line.
4. Moll Costa. Future maritime station with 3 connection ganways. Vertical space for
storage. Direct rail access.
D. Cars terminals
1. Autoterminal, SA
Surface: 33 ha
Vertical space: 37,8 ha and 26.981 places
Autoterminal initiated its activity in 1991 and it has an administrative concession to
operate until 2020
2. Setram, SA
Surface: 8,7 ha
Vertical space: 17 ha and i 8.934 places
E. Depots terminals
8
www.apice-project.eu
1. Progeco
Surface: 68.000 m2
General services:
- Handling empty
- Estimates IICL-ACC In-service criterion
- Repairs IICL-ACC norms
- Cleaning
- Stock control
Other services:
- Reefer maintenance (depot equiped with reefer plugs for pre-trip inspections at 38º
V and 220 V)
- Tank services (check and maintenance tank containers including systematic pressing
test, test 2,5/5 years)
- Bulk bags and flexitanks (they can be installed on shipping containers
Lifting equipment:
- 4 lifts truck spreader 20’/40’ – 6 stacking
- 2 lifts truck spreader 20’/40’ – 4 stacking
- 3 forkfit 20’ – 3 stacking
2. Martainer
- Surface: 65.200 m2
- Equipment: 6 spreaders
3. Damex
- Uncovered surface: 25.000 m2
- Covered surface: 8.000 m2
- Cranes up to 35 Tn
4. MSC Depots
Surface: 24.700 m2
5. Cimat
Uncovered surface: 40.000 m2
Covered surface: 1.850 m2
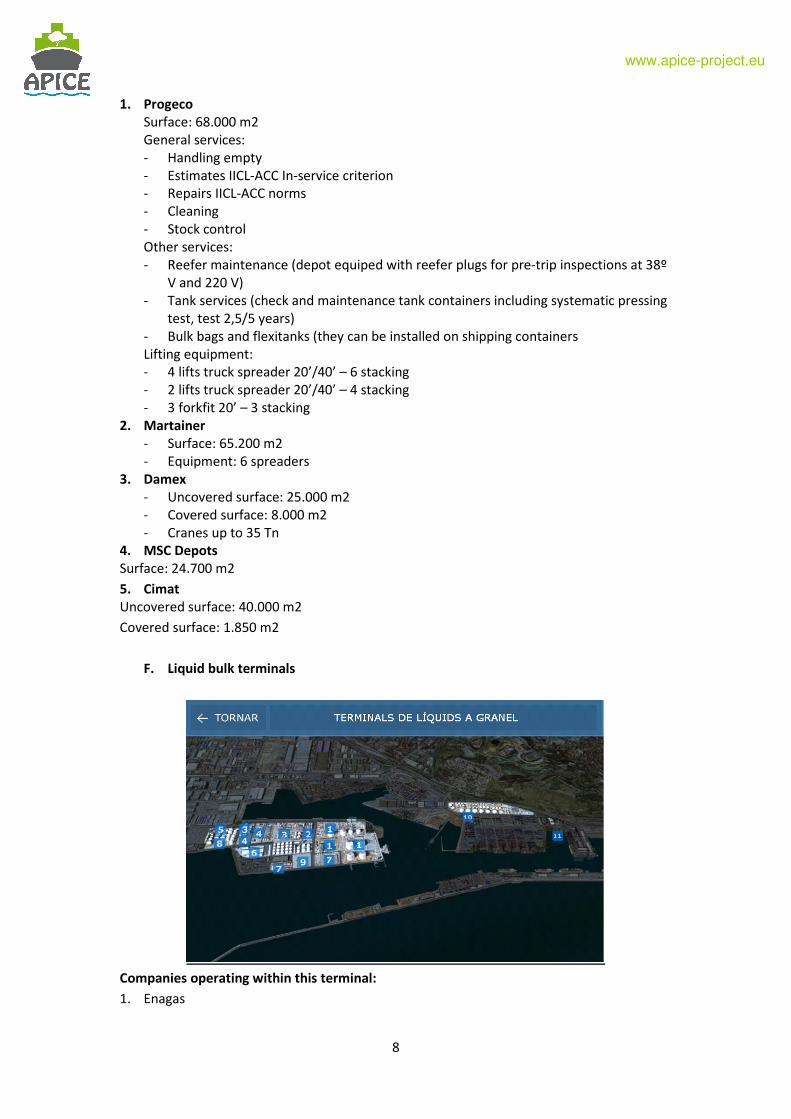
F. Liquid bulk terminals
Companies operating within this terminal:
1. Enagas
9
www.apice-project.eu
2. Relisa
3. Tepsa
4. Terquimsa
5. Decal
6. Quimidroga
7. Trabede
8. Koalagas
9. Meroil
10. CLH
11. Bunge
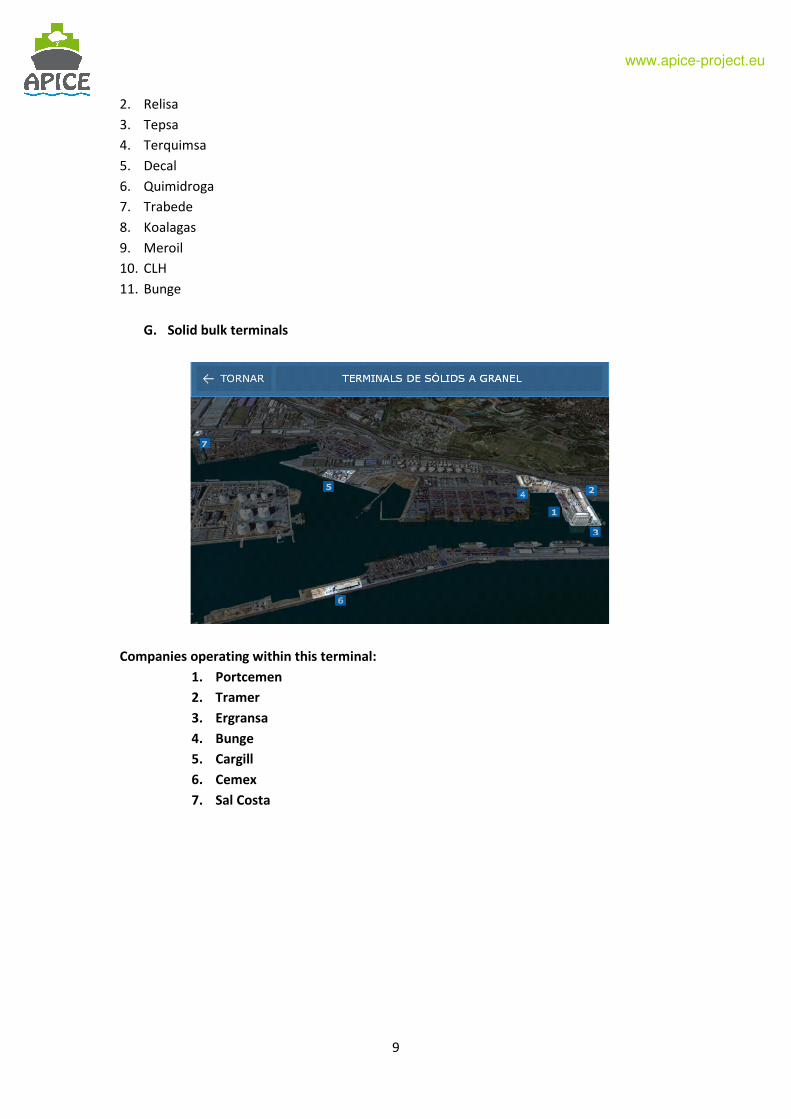
G. Solid bulk terminals
Companies operating within this terminal:
1. Portcemen
2. Tramer
3. Ergransa
4. Bunge
5. Cargill
6. Cemex
7. Sal Costa

10
www.apice-project.eu
H. Food products terminals
Fruit terminal
1. Barcelona Reefer Terminal
Surface: 5.556 m2 fridge storage
Simultaneous storage of 6000 palets
Coffee and cocoa terminals
2. BIT, SA
Surface: 17.000 m2
Capacity: 20.000 t
3. Molenbergnatie
Surface: 25.000 m2
Capacity: 22.500 t
4. Viorvi
Surface: 10.000 m2
5. Pacorini
Surface: 9.100 m2 + 4.000 m2 (ZAL II)
11
www.apice-project.eu
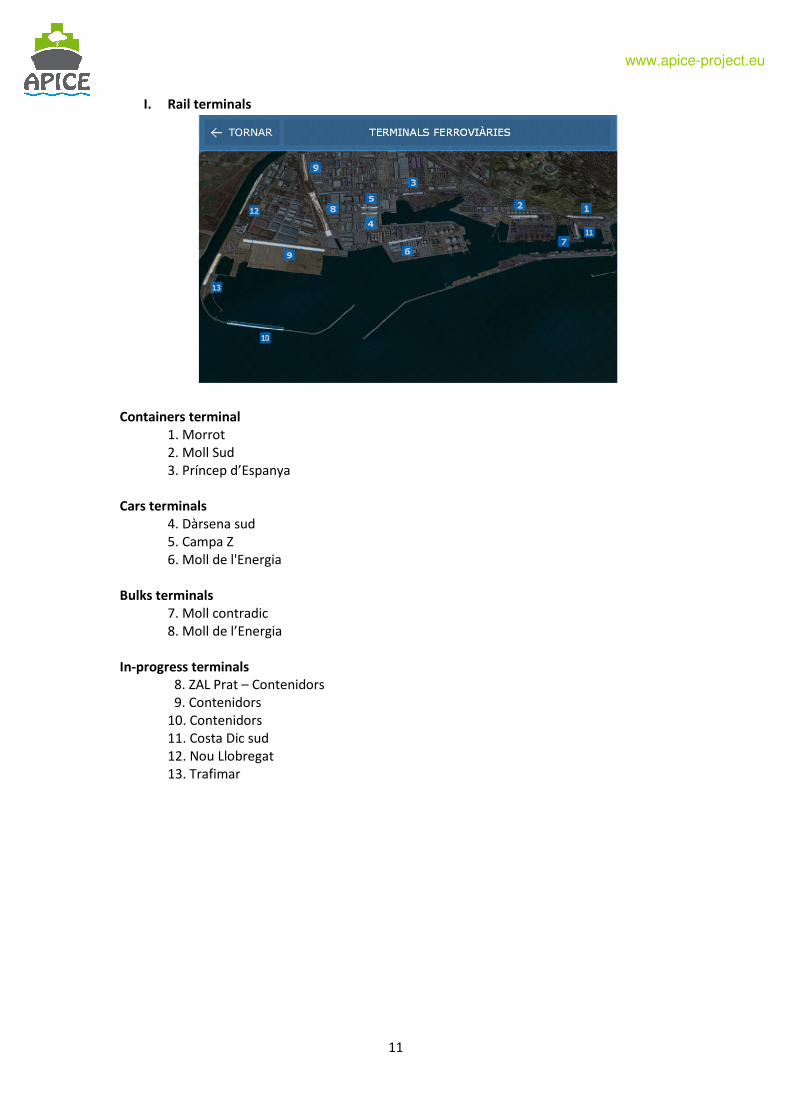
I. Rail terminals
Containers terminal
1. Morrot
2. Moll Sud
3. Príncep d’Espanya
Cars terminals
4. Dàrsena sud
5. Campa Z
6. Moll de l'Energia
Bulks terminals
7. Moll contradic
8. Moll de l’Energia
In-progress terminals
8. ZAL Prat – Contenidors
9. Contenidors
10. Contenidors
11. Costa Dic sud
12. Nou Llobregat
13. Trafimar

12
www.apice-project.eu
J. Logistics Activities Zone (ZAL)
1. ZAL Barcelona. It includes these companies:
• Agility Spain
• Aldeasa
• APP Italia
• Ati
• Bofill & Arnan
• Catalgrup, SA
• Cebecen
• Cisam
• Condeminas
Servicios
Logísticos, SA
• Control
Financiero e
Informático, SL
• CTC
• Dalteco Group
• Decoexsa
• DHL
• Eis Marítimo
• Embarmar
• Explotaciones
Turísticas
Gaditanas, SA
• Fundación Cares
• Globelink
Uniexco
• Grupo Marmedsa
• Grupo
Transcoma
• GV Express, SA
• Honda Logístics,
SA
• IFS Internacional
Forwarding, SL
• Integral de
Negocios
• J. Gibert, SL
• Jas Forwarding
• Just Logística, SL
• Kühne & Nagel
• Lauson, SA
• Lo Trans
• Logipoint, SL
• Marítima del
Mediterráneo,
SA
• Mascaró Morera,
SA
• Mediterranean
Fresh Supplier
• Multimodal
Spain
• Oliver Getransa,
SA
• Operinter
• Red Car, SA
• Salvat Logística,
SA
• Servinter
• Space Cargo
• Steinweg Iberia
• Stock Cargo
• Trafimar
• Transmec De
Bortoli Group
España, SA
• Transportes
Quiñonero
• Transportes y
Consignaciones
Marítimas, SA
• Travima
• Trebig Handling,
SL
• Universal
Marítima
• Whirlpool Iberia
2. ZAL Prat. . It includes these companies:
• Airfarm • Alfil Logistics • Barnatrans

13
www.apice-project.eu
• Carrefour
• CFS
• Clariant
• DAMM
• DDB Schenker
• Decathlon
• Fagor
• Fornes Barcelona
de Grupatges, SA
• Gefco España, SA
• Hellman
Worldwide
• MCC
• Nippon Express
de España, SA
• NYK Logistics
• SEUR
• Sparber
Transport, SA
• TIPSA
• Total
Petrochemical
Ibérica, SLU
• Transabadell –
Transterrassa
• GV Express, SA
• Transglory
• Transnatur, SA
• Universal
Forwarding, SL
Service Center. . It includes these companies:
• 3-80 Nous
Associats
• Acciona
Forwarding, SA
• Atlantic
Forwarding
• Bergé Marítima,
SA
• Buffer Logistica
• Capsa
• Cilsa
• CHT
• Clasquin España
• CMA-CGM, SA
• Concatel –
Vanture
• Delongui España
• Fahrner Iberia
• Fremap
• Fundación
Logística Justa
• GV Sea Freight
• Hansa Meyer
Global Transport,
SL
• Ingeniería de
Instrumentación
y Control SA
• Logismar
• NYC Conveyors
• Polar
• Polar Fruit
Europa
• TCE – Transconti
• TIC Solutions
• Transportes
Magalhaes
• Vasco Catalana
• Vetri Speciali,
SRL
• Yudigar

14
www.apice-project.eu
1.1.2. Risk activities in terms of air emissions
Note: Emissions are specific for the Port of Barcelona (100x100 km scale includes Port of
Tarragona), so it is reflected in model BCN005.
In the Port of Barcelona, the activities presenting risks regarding air emissions are as it
follows:
1. Vessels: maneuvering, hotelling, etc.
2. Harbor craft: tug boats and auxiliary means
3. Land traffic: heavy-duty vehicles
4. Land traffic: locomotives
5. Terminal equipment: cargo handling
6. Solid bulks
7. Enlargement and maintenance works
ACTIVITIES OF SHIPS AND VESSELS
The table shows emissions by type of vessel in 2008 (provided by Generalitat de Catalunya).
CO NOx SOx NMVOCs NH3 PM10 PM2.5
CAR-CARRIER 384.07 18.66 29.62
CARGO LO-LO 157.66 6.57 10.79
FRIDGE CARGO 10.66 0.47 0.76
DRY BULK CARRIERS 201.09 7.27 12.96
PASSENGERS 684.76 29.54 50.28
PETROL ER (LIQUID
BULK) 10.70 0.79 1.17
CONTAINER 2214.89 109.76 176.69
RO-RO CARGO 191.46 8.91 14.34
LIQUID BULK CARGO 1028.97 76.11 112.21
FERRY (PASSENGER) 701.65 35.06 58.58
HIGH SPEED FERRY
(PASSENGER) 16.65 1.10 1.78
TOTAL 3619 5602.56 6768,37 294.24 469.17
In red, estimated emissions respect to NOx considering ratios in other port areas (Marseille,
Thessaloniki and Venice).
Emissions have been calculated for manoevring and hotelling phases, but not for on-route.
This table shows the emissions distributions by phase:

15
www.apice-project.eu
Phase Emissions NOx (t/a) Emissions PM10 (t/a)
Manoeuvring 1.326,4 160,8
Hotelling 4.276,1 308,3
Total 5.602,6 469,2
Source: Generalitat de Catalunya
Seasonal emissions
The monthly variability has been assessed for these vessels. It has been found that it is
important for cruises and ferries transporting passengers. The following figures show the
average fluctuation over the period 2007-2011.
Monthly variability CRUISE passengers
0
50.000
100.000
150.000
200.000
250.000
300.000
350.000
Janu
ary
Febru
ary
Mar
chApr
il
May
June
July
Aug
ust
Sep
tem
ber
Octobe
r
Nove
mbe
r
Dece
mbe
r
variability ferries passengers
0
50000
100000
150000
200000
250000
300000
Janu
ary
Febru
ary
Mar
chApr
il
May
June
July
Aug
ust
Sep
tem
ber
Octobe
r
Nove
mbe
r
Dece
mbe
r
16
www.apice-project.eu
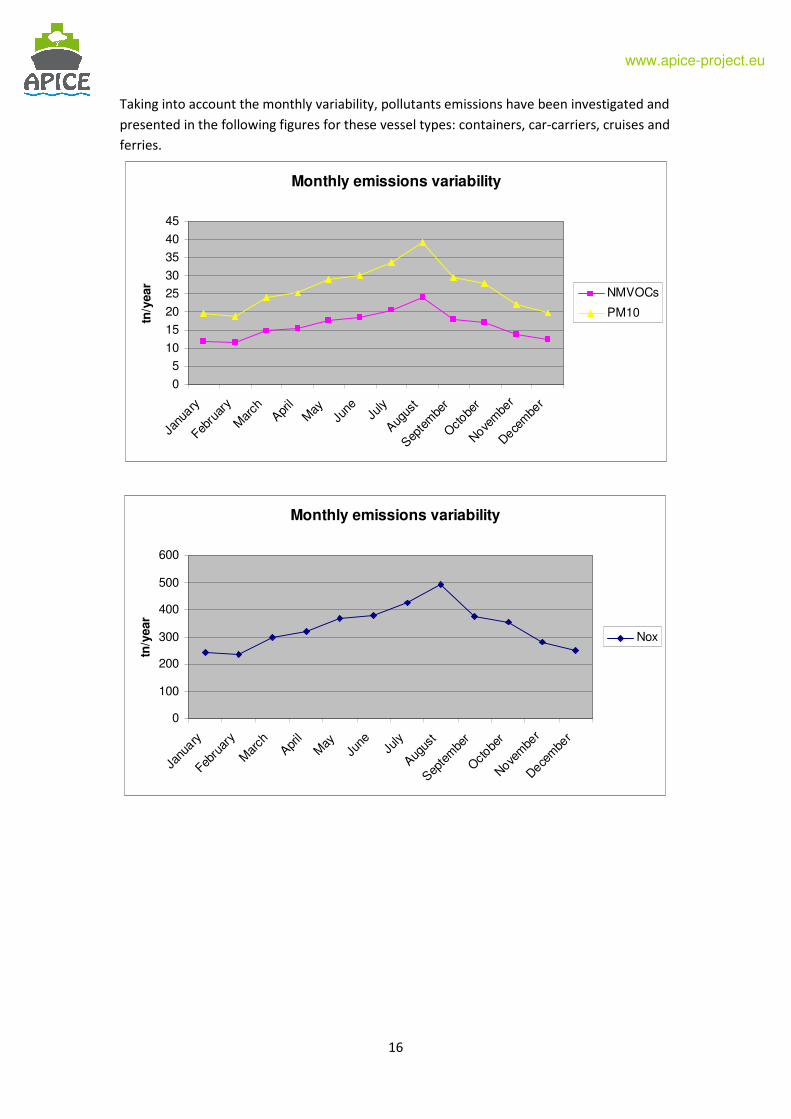
Taking into account the monthly variability, pollutants emissions have been investigated and
presented in the following figures for these vessel types: containers, car-carriers, cruises and
ferries.
Monthly emissions variability
0
5
10
15
20
25
30
35
40
45
Janu
ary
Febru
ary
Mar
chApr
il
May
June
July
Aug
ust
Sep
tem
ber
Octobe
r
Nove
mbe
r
Dece
mbe
r
tn/y
ear
NMVOCs
PM10
Monthly emissions variability
0
100
200
300
400
500
600
Janu
ary
Febru
ary
Mar
chApr
il
May
June
July
Aug
ust
Sep
tem
ber
Octobe
r
Nove
mbe
r
Dece
mbe
r
tn/y
ear
Nox
17
www.apice-project.eu
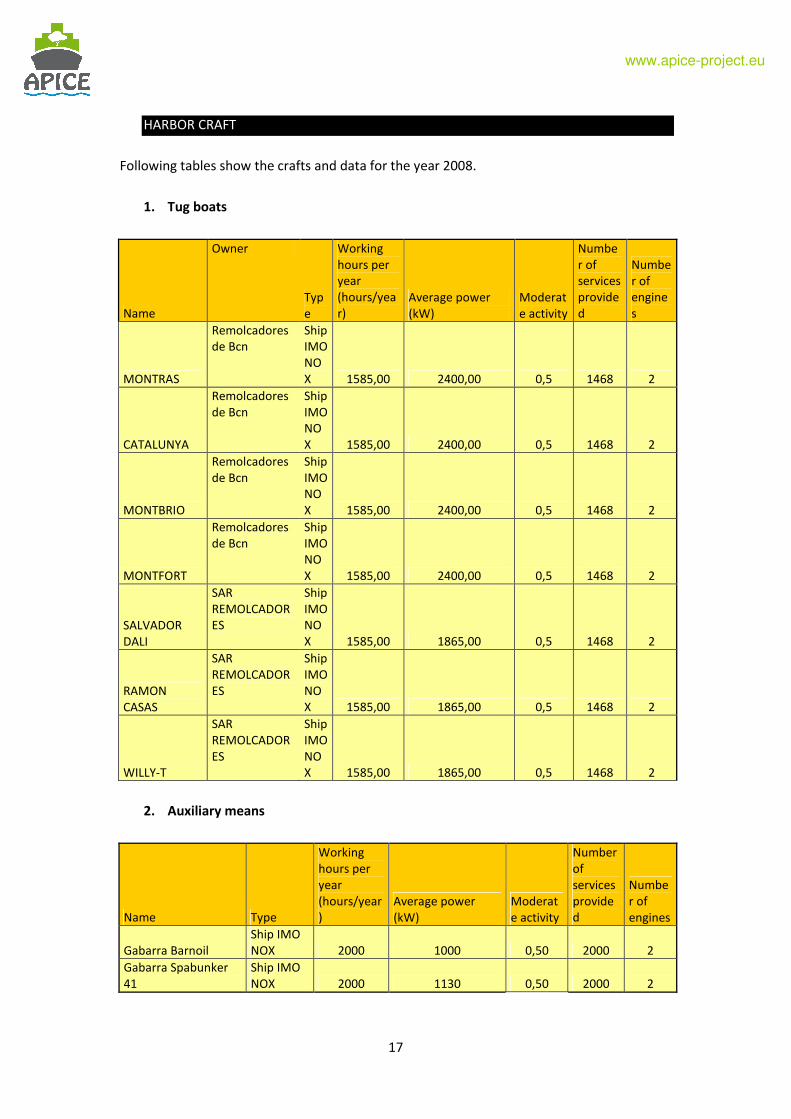
HARBOR CRAFT
Following tables show the crafts and data for the year 2008.
1. Tug boats
Name
Owner
Typ
e
Working
hours per
year
(hours/yea
r)
Average power
(kW)
Moderat
e activity
Numbe
r of
services
provide
d
Numbe
r of
engine
s
MONTRAS
Remolcadores
de Bcn
Ship
IMO
NO
X 1585,00 2400,00 0,5 1468 2
CATALUNYA
Remolcadores
de Bcn
Ship
IMO
NO
X 1585,00 2400,00 0,5 1468 2
MONTBRIO
Remolcadores
de Bcn
Ship
IMO
NO
X 1585,00 2400,00 0,5 1468 2
MONTFORT
Remolcadores
de Bcn
Ship
IMO
NO
X 1585,00 2400,00 0,5 1468 2
SALVADOR
DALI
SAR
REMOLCADOR
ES
Ship
IMO
NO
X 1585,00 1865,00 0,5 1468 2
RAMON
CASAS
SAR
REMOLCADOR
ES
Ship
IMO
NO
X 1585,00 1865,00 0,5 1468 2
WILLY-T
SAR
REMOLCADOR
ES
Ship
IMO
NO
X 1585,00 1865,00 0,5 1468 2
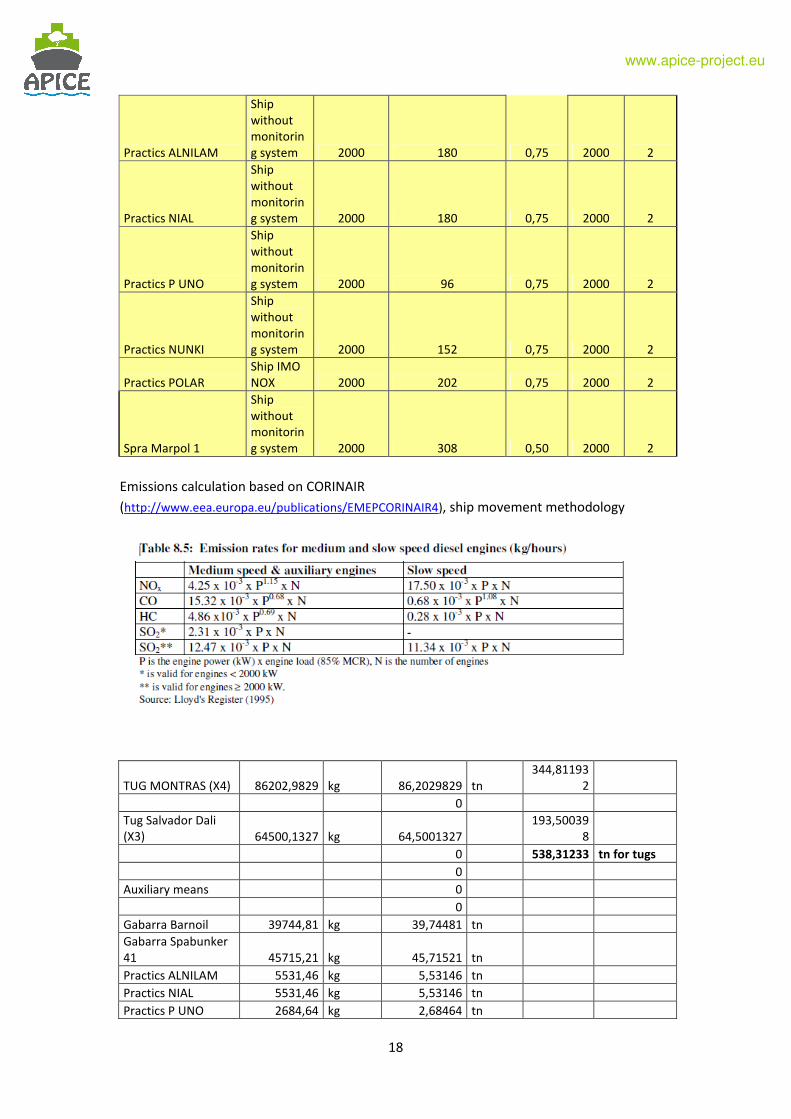
2. Auxiliary means
Name Type
Working
hours per
year
(hours/year
)
Average power
(kW)
Moderat
e activity
Number
of
services
provide
d
Numbe
r of
engines
Gabarra Barnoil
Ship IMO
NOX 2000 1000 0,50 2000 2
Gabarra Spabunker
41
Ship IMO
NOX 2000 1130 0,50 2000 2
18
www.apice-project.eu
Practics ALNILAM
Ship
without
monitorin
g system 2000 180 0,75 2000 2
Practics NIAL
Ship
without
monitorin
g system 2000 180 0,75 2000 2
Practics P UNO
Ship
without
monitorin
g system 2000 96 0,75 2000 2
Practics NUNKI
Ship
without
monitorin
g system 2000 152 0,75 2000 2
Practics POLAR
Ship IMO
NOX 2000 202 0,75 2000 2
Spra Marpol 1
Ship
without
monitorin
g system 2000 308 0,50 2000 2
Emissions calculation based on CORINAIR
(http://www.eea.europa.eu/publications/EMEPCORINAIR4), ship movement methodology
TUG MONTRAS (X4) 86202,9829 kg 86,2029829 tn
344,81193
2
0
Tug Salvador Dali
(X3) 64500,1327 kg 64,5001327
193,50039
8
0 538,31233 tn for tugs
0
Auxiliary means 0
0
Gabarra Barnoil 39744,81 kg 39,74481 tn
Gabarra Spabunker
41 45715,21 kg 45,71521 tn
Practics ALNILAM 5531,46 kg 5,53146 tn
Practics NIAL 5531,46 kg 5,53146 tn
Practics P UNO 2684,64 kg 2,68464 tn

19
www.apice-project.eu
Practics NUNKI 4553,96 kg 4,55396 tn
Practics POLAR 6315,84 kg 6,31584 tn
Spra Marpol 1 10259,16 kg 10,25916 tn
Total auxiliary 120,33654
tn for
auxiliary
Total inner fleet 658,64887 tn Nox
Example calculation:
MONTRAS (NOx kg)= ((4.25*10-3
) x (2400 x 0.85)1.15
x 2) x 1585 = 86202,9829 kg =
86,2029829 tn
Companies providing the service:
Grupo Rebarsa:
- Remolcadores de Barcelona, S.A.
Grupo REYSER:
- SAR REMOLCADORES S.L. 932 256 545
These two companies work in the port through a temporary union of companies.
Interviews have been hold with both of them in order to find out more input on the risk
assessment and future scenario.
In the case of Remoldadores de Barcelona, MONTRAS is not operative anymore but
nowadays there are two other on work: MONTALT and MONTCLAR, from 2009 onwards. In
2008 there were 6 tug boats, now there are 5. The auxiliary boat Spra Marpol 1 belongs also
to this company.
Tub boats are tied up in dock Príncipe de España (next to TCB container terminal) and
electrified since 2001 (see picture). Remolcadores de Barcelona has a tug boat in bocana
north. Port Authority designates where these tug boats must be located while tied up.
Photo: Willy-T tug boat electrified while tied up (Pedro Fernández)
20
www.apice-project.eu
Tug boats operate everyday 24h, with a slight activity reduction in August.
The Port Authority released in July 2010 a new version of terms of reference for towage
activity, although companies report no major change occurred. Regarding air emissions, port
Authority only demands IMO-NOx certificate for operating at the port. This certificate is
delivered by national Merchant Navy when acquiring each tug boat.
It is not foreseen to renew the fleet since they are relatively new, the oldest ones dating
from 2005 (Tier I). Once the Muelle del Prat will be operative (June 2012), there can be a
change on location of tug boats, maybe some of them will move there. It is not foreseen to
increase the fleet. It is not known whether this dock will provide electrification (it depends
on Port Authority).
Both companies are assessed annually yearly to get the Lloyd’s register certification (quality
programme), which is done in a voluntary basis. However the Port Authority demands this
certificate to operate at the port. In order to get this certificate, air emissions are assessed
and improvement measures are proposed and monitored.
In principle, there are not on-board air pollutants emissions measures, though they have
been done punctually.
At Remolcadores de Barcelona, emissions are estimated according to fuel consumption and
then applying emission factors. This is reported to the audit.
In the case of SAR, on-board measurements took place in order to follow the Monitoring and
Control of its manual of Environmental Management System according to UNE EN ISO
14001/04. According to this study, it is verified whether the engines emit below the limits
established by MARPOL. It is expressed in g/KWh.
Regarding fuel consumption, SAR informs that their boats consume 165 l/hour at work. It
has provided extensive information on this. For 2008, total consumption was 276.600 l for
3.950 work hours. The company uses as (efficiency) indicator: total consumption/engine
hours. It also uses, for management purposes, the indicator: tug fuel consumption/number
of services. The objective is to maintain fuel consumption compared to previous year.
In Remolcadores de Barcelona, it is reported 350 l/h.
Fuel contains 0.1% S, as indicated by legislation. It is gasoil C/DMA
LAND TRAFFIC: HEAVY-DUTY VEHICLES
Trucks movement generated by maritime traffic is high and still very important compared to
goods transported by rail. Furthermore, the area around the port is highly condensed, being
one of the main accesses to Barcelona city, which means that high emissions result from
this.
Emissions from heavy duty vehicles related to port activity have been estimated considering
the data provided by the Generalitat de Catalunya, which in turn entrusted a specific study
to a consultancy. The NOx and PM10 emissions factors were calculated by the consultancy

21
www.apice-project.eu
considering an average fleet. The following table shows data and emissions, which related to
the amount of tones transported.
2008
Tranported tones by road 32687121 tn
Average load 19,8 tn/vehicle Average distance within Plan area 30 km
Average distance at port 4 km
Truck movements 1650865 movements
EF Nox 12,1 g/km
EF PM10 0,52 g/km
Nox emissions wihin port 79,90 tn
PM10 emissions within port 3,43 tn
Nox emissions within Plan area 599,26 tn PM10 emissions within Plan area 25,75 tn
Note that emissions have been calculated for:
- emissions released within the port
- emissions generated by maritime transport within the area considered in the
Catalan Plan for improving air quality.
It is important to note two initiatives regarding the inner road transport system:
- Strategy to optimize the port terrestrial transport system, signed by Port Authority
and Generalitat de Catalunya.
- Collaboration agreement to implement training and sustainable mobility actions,
signed by the Logistic Activities Zone, Barcelona-Catalunya Logistic Centre and Royal
Automobile Club of Catalonia.
LAND TRAFFIC: LOCOMOTIVES
Rail traffic is progressively increasing in the Port of Barcelona and it is expected to play a
very important role in the near future. Locomotives working within the port use diesel
(although it changes to electric traction once out of the port, at Can Tunis station). In this
section we describe emissions resulting from the use of diesel.
It has been calculated considering CORINAIR methodology Tier III and the results are showed
in the following table. As for the emission factors, it has been considered an average from
the study Status and future development of the diesel fleet1.
1 Retrieved from
http://www.google.es/url?sa=t&rct=j&q=&esrc=s&source=web&cd=1&ved=0CCkQFjAA&url=http%3A

22
www.apice-project.eu
2008
Number of trains movements 1665 movements
Average time within port 0,25 h
Average time within Plan area 0,5 h
Average nominal power output 800 kW
Average load factor 0,5
Average EF Nox 11,73 g/kW
Average EF PM 0,32 g/kW
Nox emissions within port 1,95 tn
PM emissions within port 0,05 tn
Nox emission induced in Plan area 3,91 tn
PM emissions induced in Plan area 0,11 tn
It is interesting to know the units of merchandise transported by train, which is shown in the
following table (data for year 2011):
It is important to note that trains work to maximal capacity and therefore increasing goods
would mean increasing number of trains.
Furthermore, all trains are directed with diesel traction to Can Tunis station, next to the
Port, from there the traction is electrical. As for the trains with cars to SEAT factory, diesel
traction is until Sant Boi (around 3 km far from the port) and from there it uses electric
traction. Solid bulk is transported totally by diesel traction to the potash mineries. Liquid
bulk corresponds to bleach transport.
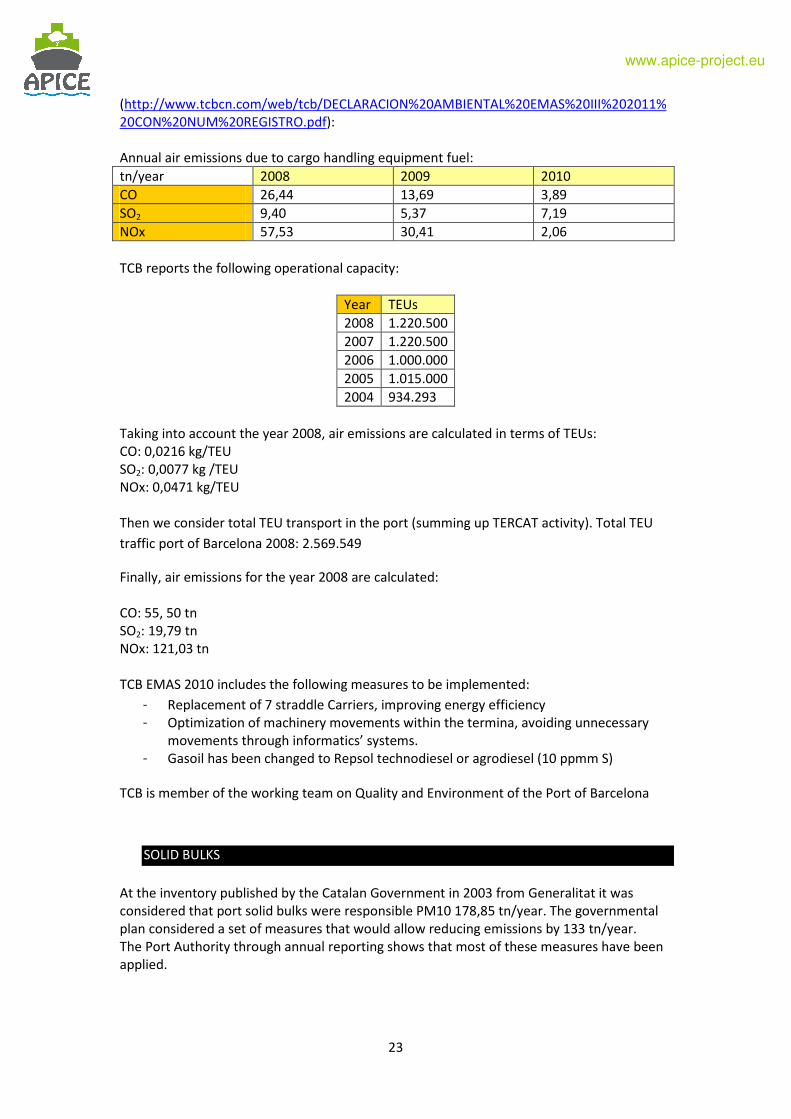
TERMINAL EQUIPMENT: CONTAINERS (CARGO HANDLING EQUIPMENT)
Useful information regarding air emissions figures have been found at Information in EMAS
III declaration (2010) from TCB
%2F%2Fwww.uic.org%2Fdownload.php%2Fenvironnement%2F2006-01-diesel-study-
wp1.pdf&ei=hgCYT7WYI46DhQeCuMDhBQ&usg=AFQjCNEU_Un1H3d4XvG4WNUWrLw9887krQ&sig2
=B0rC3pN3gGvcWJbNNzky0A
23
www.apice-project.eu
(http://www.tcbcn.com/web/tcb/DECLARACION%20AMBIENTAL%20EMAS%20III%202011%
20CON%20NUM%20REGISTRO.pdf):
Annual air emissions due to cargo handling equipment fuel:
tn/year 2008 2009 2010
CO 26,44 13,69 3,89
SO2 9,40 5,37 7,19
NOx 57,53 30,41 2,06
TCB reports the following operational capacity:
Year TEUs
2008 1.220.500
2007 1.220.500
2006 1.000.000
2005 1.015.000
2004 934.293
Taking into account the year 2008, air emissions are calculated in terms of TEUs:
CO: 0,0216 kg/TEU
SO2: 0,0077 kg /TEU
NOx: 0,0471 kg/TEU
Then we consider total TEU transport in the port (summing up TERCAT activity). Total TEU
traffic port of Barcelona 2008: 2.569.549
Finally, air emissions for the year 2008 are calculated:
CO: 55, 50 tn
SO2: 19,79 tn
NOx: 121,03 tn
TCB EMAS 2010 includes the following measures to be implemented:
- Replacement of 7 straddle Carriers, improving energy efficiency
- Optimization of machinery movements within the termina, avoiding unnecessary
movements through informatics’ systems.
- Gasoil has been changed to Repsol technodiesel or agrodiesel (10 ppmm S)
TCB is member of the working team on Quality and Environment of the Port of Barcelona
SOLID BULKS
At the inventory published by the Catalan Government in 2003 from Generalitat it was
considered that port solid bulks were responsible PM10 178,85 tn/year. The governmental
plan considered a set of measures that would allow reducing emissions by 133 tn/year.
The Port Authority through annual reporting shows that most of these measures have been
applied.

24
www.apice-project.eu
Thus, for 2008, we consider that 75% of these measures have been applied. Considering the
figure of solid bulks movement for that year, PM10 emissions in 2008 are estimated in 79,97
tn. The following table summarizes this:
solid bulks
2003 2008
total bulk 3468306 3.506.472
related PM10 178,85 180,82
no measures measures 75%
reduction PM10 with measures 100,85
PM10 178,85 79,97
It is important to note that the Port Authority has drafted guidelines for solid bulk
operations which may come soon into force. This would support emissions reduction.
ENLARGEMENT AND MAINTENANCE WORKS
In the last years, the port has gone through an enlargement process which has involved a
great amount of construction material movements, as well as trucks traffic. Besides,
maintenance works at dock is done regularly. Related emissions have not been estimated
but they should be considered in future APICE activities and emissions abatement plan,
particularly regarding PM10.
OTHER PUNCTUAL SOURCES
Within the port, there are other concrete air emissions sources such as the wastewater
treatment plant, power generation plants and industries. Another significant source is the
construction works, whether they are aimed at enlarging the harbour or maintenance. These
sources are not considered in the estimation of emissions as the other port sources.
In the case of power generation plants and industries, they are considered under the Air
Quality Improvement Plan of the Catalan Government
(http://www20.gencat.cat/docs/dmah/Home/Ambits%20dactuacio/Atmosfera/Qualitat%20
de%20laire/Oficina%20Tecnica%20de%20Plans%20de%20Millora/document%20base/docs/
4_%20mesures%20Generalitat.pdf).
Concerning the wastewater treatment plant located within the port, PRTP inventory in Spain
states the following emissions:
Pollutant Year Kg/year
2007 333.000 NMVOC
2010 207.000
NOx 2008 694.000
At this regard, it is important to note that the long monitoring campaign carried out by CSIC-
IDAEA in the frame of this project shows that NH3 levels are higher around the WWTP.

25
www.apice-project.eu
Finally, regarding the construction works, they have a heavy influence on particulate matter,
which also shown by the sampling campaign.
Summary table 2008 emissions:
ACTIVITIES OF SHIPS AND VESSELS
CO NOx SOx NMVOCs NH3 PM10 PM2.5
CAR-CARRIER 384.07 18.66 29.62
CARGO LO-LO 157.66 6.57 10.79
FRIDGE CARGO 10.66 0.47 0.76
DRY BULK CARRIERS 201.09 7.27 12.96
PASSENGERS 684.76 29.54 50.28
PETROL ER (LIQUID
BULK) 10.70 0.79 1.17
CONTAINER 2214.89 109.76 176.69
RO-RO CARGO 191.46 8.91 14.34
LIQUID BULK CARGO 1028.97 76.11 112.21
FERRY (PASSENGER) 701.65 35.06 58.58
HIGH SPEED FERRY
(PASSENGER) 16.65 1.10 1.78
TOTAL 3619 5602,56 6768,37 294,24 469,17
IN-PORT STORAGE
CO NOx SOx NMVOCs NH3 PM10 PM2.5
Solid bulk operations 79,97
etc
IN-PORT TRAFFIC LOAD INDUCED BY PORT ACTIVITIES
CO NOx SOx NMVOCs NH3 PM10 PM2.5
Heavy-duty vehicles 599,26 25,75
Locomotives 3,91 0,11
OTHER ACTIVITIES NOT MENTIONED BEFORE
CO NOx SOx NMVOCs NH3 PM10 PM2.5
Tug boats 360,14 538,31 673,53 29,28 46,70
Auxiliary means 81,62 120,33 152,64 6,63 10,58
Cargo handling 55,5 121,03 19,79
26
www.apice-project.eu
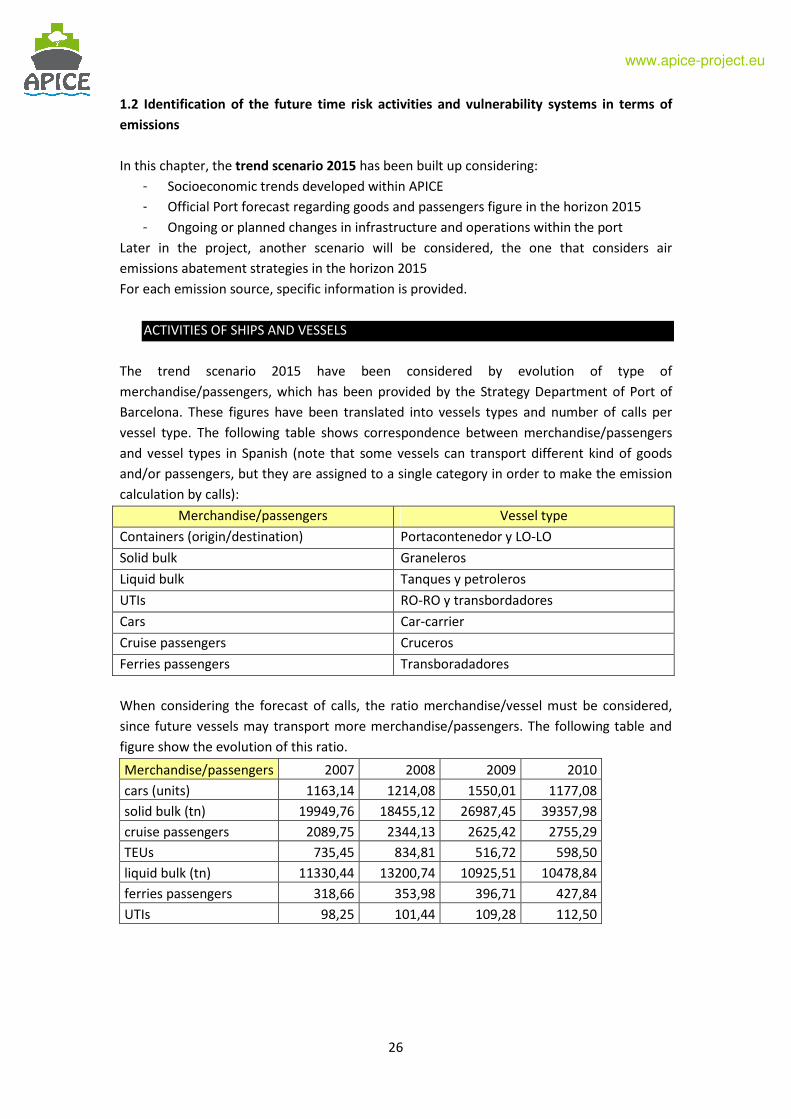
1.2 Identification of the future time risk activities and vulnerability systems in terms of
emissions
In this chapter, the trend scenario 2015 has been built up considering:
- Socioeconomic trends developed within APICE
- Official Port forecast regarding goods and passengers figure in the horizon 2015
- Ongoing or planned changes in infrastructure and operations within the port
Later in the project, another scenario will be considered, the one that considers air
emissions abatement strategies in the horizon 2015
For each emission source, specific information is provided.
ACTIVITIES OF SHIPS AND VESSELS
The trend scenario 2015 have been considered by evolution of type of
merchandise/passengers, which has been provided by the Strategy Department of Port of
Barcelona. These figures have been translated into vessels types and number of calls per
vessel type. The following table shows correspondence between merchandise/passengers
and vessel types in Spanish (note that some vessels can transport different kind of goods
and/or passengers, but they are assigned to a single category in order to make the emission
calculation by calls):
Merchandise/passengers Vessel type
Containers (origin/destination) Portacontenedor y LO-LO
Solid bulk Graneleros
Liquid bulk Tanques y petroleros
UTIs RO-RO y transbordadores
Cars Car-carrier
Cruise passengers Cruceros
Ferries passengers Transboradadores
When considering the forecast of calls, the ratio merchandise/vessel must be considered,
since future vessels may transport more merchandise/passengers. The following table and
figure show the evolution of this ratio.
Merchandise/passengers 2007 2008 2009 2010
cars (units) 1163,14 1214,08 1550,01 1177,08
solid bulk (tn) 19949,76 18455,12 26987,45 39357,98
cruise passengers 2089,75 2344,13 2625,42 2755,29
TEUs 735,45 834,81 516,72 598,50
liquid bulk (tn) 11330,44 13200,74 10925,51 10478,84
ferries passengers 318,66 353,98 396,71 427,84
UTIs 98,25 101,44 109,28 112,50

27
www.apice-project.eu
0,0
500,0
1000,0
1500,0
2000,0
2500,0
3000,0
2007 2008 2009 2010
0,0
5000,0
10000,0
15000,0
20000,0
25000,0
30000,0
35000,0
40000,0
45000,0
cars (units)
cruise passengers
TEUs
ferries passengers
UTIs
solid bulk (tn)
l iquid bulk (tn)
From these ratios, we can see that dry bulk carriers tend to increase this ratio which is
considered for the calls in future scenarios.
The following table and figure show the evolution of calls over the last years as well as the
forecast for 2015 and 2020.
Tipus Vaixell 2007 2008 2009 2010 2015 2020
CAR-CARRIER 689 590 283 468 530 750
GRANELEROS 194 190 145 90 120 200
PASAJE 845 885 820 853 930 1200
PORTACONTENEDOR 2399 2383 2644 2480 2800 3900
CARGA (LO-LO) 1150 695 834 771 930 1300
PETROLEROS 19 10 12 11 11 11
TANQUES 951 907 1064 1092 1230 1480
TRANSBORDADORES 3496 3244 2644 2589 2560 2700
RO-RO 666 605 478 437 460 500
FRIGORIFICO 50 27 7 36 15 15
0
500
1000
1500
2000
2500
3000
3500
4000
4500
2007 2008 2009 2010 2011 2012 2014 2015 2016 2017 2018 2019 2020
CAR-CARRIER
GRANELEROS
PASAJE
PORTACONTENEDOR
CARGA (LO-LO)
TANQUES
TRANSBORDADORES
RO-RO

28
www.apice-project.eu
Since we know 2008 emissions by vessel type, emissions can be calculated for the 2015
scenarios. SOx and CO emissions are estimated in relation (proportion) to NOx emissions. In
the case of SOx, it is considered a reduction by 97,3% in hotelling phase as a result of EU
regulation (2005/33/EC), assuming that in 2008 the fuel sulfur content was 2,7% m/m and
from 2010 is 0,10% m/m. PM10 is also affected by this and it is considered a reduction of
50%.
The following table and figures show and compare the emissions in 2008 and the scenario
2015.

29
www.apice-project.eu
Maritime transport scenarios Related emissions 2008 Related emissions "Port forecast"
2008 2015 Nox NMVOCs PM10 Sox CO Nox NMVOCs PM10 Sox CO
units merchandise calls Port forecast
cars (units) 438.654 283 676.106 530 384,07 18,66 29,62 719,05 34,94 55,45
TEUs 1.797.157 3478 3.253.478 3730 2214,89 109,76 176,69 2375,37 117,71 189,49
cruise passengers 2.152.847 820 2.800.000 930 684,76 29,54 50,28 776,62 33,50 57,02
ferries passengers 1.048.890 2644 1.233.086 2560 718,30 36,16 60,36 695,48 35,01 58,44
liquid bulk (tn) 12.105.080 1076 14.118.000 1241 1039,67 76,90 113,38 1199,10 88,69 130,77
solid bulk (tn) 3.506.472 145 4.018.000 120 358,75 13,84 23,75 296,90 11,45 19,66
UTIs 341.173 485 370.447 463 202,12 9,38 15,10 192,98 8,96 14,42
TOTAL EMISSIONS 8931 9574 5602,56 294,24 469,18 6768,37 3619,12 6255,49 330,26 351,92 2753,99 4040,90

30
www.apice-project.eu
Vessels (I)
0
1000
2000
3000
4000
5000
6000
7000
8000
Nox Sox COtn
/y Related emissions 2008
Related emissions "Port
forecast"
Vessels (II)
0
50
100
150
200
250
300
350
400
450
500
NMVOCs PM10
tn/
y
Related emissions 2008
Related emissions "Port
forecast"

31
www.apice-project.eu
HARBOR CRAFT
1. Tug boats
No change on tug boats fleet is foreseen by 2015 in a way that we can assume that type of
boats, fuel and operations will be the same. In that case, only the number of calls varies tug
boats operations and related emissions. We do not consider ferries which do not require
towage.
Since we know 2008 NOx emissions and the number of vessels calls, we can distribute tug
NOx emission through those calls, and then calculate emissions for other number of calls.
This table shows the calculation:
2008 calls
2015 calls
cars (units) 283 530
TEUs 3478 3730
cruise passengers 820 930
liquid bulk (tn) 1076 1241
solid bulk (tn) 145 120
UTIs 485 463
total calls 6287 7014
NOx 538,31 600,55
2. Auxiliary means
NOx emissions resulting from auxiliary means working within the port have been estimated
considering the overall change of activity at the Port. According to the official forecast,
activity would increase around 15%.
2008 Port forecast 2015
increased activity 15%
NOx 120,33 138,38
CARGO HANDLING
Cargo handling related emissions are estimated in function of TEUs movements evolution
and new terminal equipment. The following table shows TEUs evolution and related
emissions. Furthermore, the new containers terminal will be semi-automated which means
that an important fraction of machinery will be electrified resulting into a reduction of
emissions, which is estimated in 45%.
2008 Port forecast 2015
TEUs 2569549 3253478
NOx 121,03 84,28
SO2 19,79 13,78

32
www.apice-project.eu
CO 55,50 38,65
No other changes are considered regarding the evolution and substitution of machinery, fuel
and operations.
SOLID BULKS
As for solid bulks, reference data is from 2003 as calculated by Generalitat de Catalunya. As
explained in previous section, PM10 emissions for 2008 are estimated applying 75% of the
measures proposed in 2003. For the scenarios of 2015, solid bulks movement is estimated
considering full mitigation measures implementation. The following table shows the
estimations:
2003 2008 Port forecast 2015
total bulk 3468306 3.506.472 4018000
related PM10 178,85 180,82 207,20
no measures measures 75% measures 100%
reduction PM10 with measures 100,85 154,08
PM10 178,85 79,97 53,12
LAND TRAFFIC: HEAVY DUTY VEHICLES
The trend scenario considers evolution according to the amount of tones expected to be
transported by trucks, as well as a reduction by 10% on the emissions factors due to fleet
renewal.
The table shows the calculation:
2008 2015
Tranported tones by road 32687121 tn 29931005 tn
Average load 19,8 tn/vehicle 19,8 tn/vehicle
Average distance within Plan area 30 km 30 km
Average distance at port 4 km 4 km
Truck movements 1650865 movements 1511667 movements
EF Nox 12,1 g/km 10,89 g/km
EF PM10 0,52 g/km 0,468 g/km
Nox emissions wihin port 79,90 tn 65,85 tn
PM10 emissions within port 3,43 tn 2,83 tn
Nox emissions within Plan area 599,26 tn 493,86 tn
PM10 emissions within Plan area 25,75 tn 21,22 tn

33
www.apice-project.eu
LAND TRAFFIC: LOCOMOTIVES
Rail transport is expected to increase considerably in the coming years reaching a 13,9%
quota by 2015. This has been used to estimate the trains’ movements. As for emission
factors, it has been considered the average for fleet post 1990, from the study Status and
future development of the diesel fleet.
2008 2015
Number of trains movements 1665 movements 13618
Average time within port 0,25 h 0,25
Average time within Plan area 0,5 h 0,5
Average nominal power output 800 kW 800
Average load factor 0,5 0,5
Average EF Nox 11,73 g/kW 9,86
Average EF PM 0,32 g/kW 0,19
Nox emissions within port 1,95 tn 13,43 tn
PM emissions within port 0,05 tn 0,26 tn
Nox emission induced in Plan area 3,91 tn 26,85 tn
PM emissions induced in Plan area 0,11 tn 0,52 tn
Beyond the horizon 2015, it is expected that the new container terminal will be fully
operational with an enhanced rail system which will be more electrified, and thus emissions
will be lowered due to substitution of diesel traction.
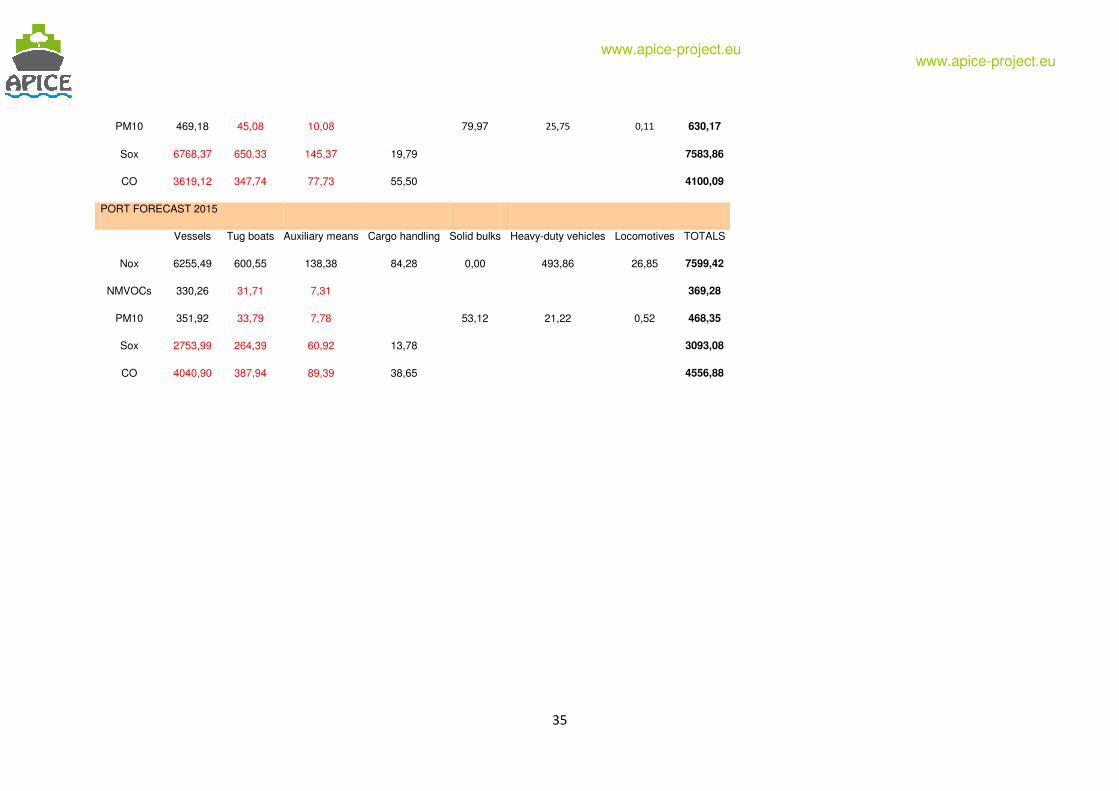
Summary future emissions
The following table shows total port emissions for 2008 and 2015 scenarios. Note that there
is a distinction between emissions generated within port, and those induced by the port; this
related to the fact of land traffic (trucks and locomotives) which circulates around the port
area. For this, it is considered the same area as that of the Air Quality Improvement Plan of
the Catalan Government.
* In red, data which is estimated from NOx emissions

34
www.apice-project.eu www.apice-project.eu
Aggregated scenarios: emissions within the port
2008
Vessels Tug boats Auxiliary means Cargo handling Solid bulks Heavy-duty vehicles Locomotives TOTALS
Nox 5602,56 538,31 120,33 121,03 79,90 1,95 6464,08
NMVOCs 294,24 28,27 6,32 328,83
PM10 469,18 45,08 10,08 79,97 3,43 0,05 607,79
Sox 6768,37 650,33 145,37 19,79 7583,86
CO 3619,12 347,74 77,73 55,50 4100,09
PORT FORECAST 2015
Vessels Tug boats Auxiliary means Cargo handling Solid bulks Heavy-duty vehicles Locomotives TOTALS
Nox 6255,49 600,55 138,38 84,28 65,85 13,43 7157,98
NMVOCs 330,26 31,71 7,31 369,28
PM10 351,92 33,79 7,78 53,12 2,83 0,26 449,69
Sox 2753,99 264,39 60,92 13,78 3093,08
CO 4040,90 387,94 89,39 38,65 4556,88
Aggregated scenarios: emissions induced the port
2008
Vessels Tug boats Auxiliary means Cargo handling Solid bulks Heavy-duty vehicles Locomotives TOTALS
Nox 5602,56 538,31 120,33 121,03 0,00 599,26 3,91 6985,40
NMVOCs 294,24 28,27 6,32 328,83
35
www.apice-project.eu www.apice-project.eu
PM10 469,18 45,08 10,08 79,97 25,75 0,11 630,17
Sox 6768,37 650,33 145,37 19,79 7583,86
CO 3619,12 347,74 77,73 55,50 4100,09
PORT FORECAST 2015
Vessels Tug boats Auxiliary means Cargo handling Solid bulks Heavy-duty vehicles Locomotives TOTALS
Nox 6255,49 600,55 138,38 84,28 0,00 493,86 26,85 7599,42
NMVOCs 330,26 31,71 7,31 369,28
PM10 351,92 33,79 7,78 53,12 21,22 0,52 468,35
Sox 2753,99 264,39 60,92 13,78 3093,08
CO 4040,90 387,94 89,39 38,65 4556,88
36
www.apice-project.eu
1.3 Identification of the future risk activities and vulnerability systems in terms of air
quality concentrations
The model will be run after the completion of this study
1.4 Involvement of stakeholders in the activities relevant with the presence of the port in
Barcelona
Stakeholders, their roles and desirable involvement in APICE are explained by risk activity
and type of competence/field of action:
ACTIVITIES OF SHIPS AND VESSELS
Legal framework: IMO is the international responsible for maritime transport legal
framework, under the MARPOL Convention. It can intervene in terms of type of vessels
engines and fuel. EU can also legislate at this regard. Thus, they should be approached by
proposing specific measures and targets by the overall APICE project, not by project site. In
Spain, we should furthermore consider:
- General Direction of Environmental Quality and Evaluation within the Ministry of
Environment
- The General Direction of the Merchant Navy:
o General Sub direction for Safety, Pollution and Maritime Inspection
o General Sub direction for Maritime Normative and International Cooperation
Operations: The Port Authority of Barcelona (APB) can regulate the vessels access to the port
(e.g. speed). It is also responsible for terminals location, maintenance, etc. Therefore any
measure regarding vessels movement within the port must be agreed with the APB.
Users/exploitation: Ship companies are the main stakeholder. It might be difficult to involve
all of them, therefore the European Community Shipowners’ Associations (ECSA) could be
approached the same way as IMO. It is important to note ECSA’s position regarding air
quality, for example it has released the study Analysis of the Consequences of Low Sulphur
Fuel Requirements.
INNER VESSELS FLEET (HARBOR CRAFT)
Legal framework: as in previous activity, IMO and EU are responsible for this.
Operations: the APB defines how the towage operations must be performed through the
conditions established at Plec de prescipcions particulars del servei portuari bàsic de remolc
al Port de Barcelona. Mitigation measures will be discussed vis-à-vis the APB so they can be
included in this document.
Users/exploitation: There are two companies providing towage at the Port of Barcelona:
Grupo Rebarsa and Grupo REYSER. Both of them have been already visited and mitigation
measures will be presented and discussed with them.
37
www.apice-project.eu
LAND TRAFFIC: TRUCKS AND LOCOMOTIVES
Legal framework: Within Europe railway engines’ emissions are regulated by the non-road
mobile machinery (NRMM) directives. The legislation currently in force for heavy-duty
vehicles is Directive 2005/55/EC (agreed in co-decision) and Directive 2005/78/EC
(implementing provisions).
Operations: The APB is responsible for planning land traffic within the port. ADIF is
responsible for planning the rail system. Both will be approached for optimization of land
traffic. It is important to note two initiatives regarding the inner road transport system:
- Strategy to optimize the port terrestrial transport system, signed by Port Authority
and Generalitat de Catalunya.
- Collaboration agreement to implement training and sustainable mobility actions,
signed by the Logistic Activities Zone, Barcelona-Catalunya Logistic Centre and Royal
Automobile Club of Catalonia.
Users/exploitation: Truck transport is done by free-lance truck drivers, while rail transport is
served by several train companies.
SOLID BULKS
Legal framework: no information
Operations: The APB establishes the conditions under which companies can handle solid
bulks. This includes actions to reduce air emissions. Therefore APICE project would dialogue
on additional prescriptions to be included.
Users/exploitation: There is a specific terminal for this purpose with the following
companies: Portcemen, Tramer, Ergransa, Bunge, Cargill, Cemex and Sal Costa. These
companies will be approached if measures at proposed addressing this source.
CARGO HANDLING
Legal framework: Machinery is regulated by non-road mobile machinery (NRMM) directives
(DIRECTIVE 2002/88/EC amends Directive 97/68/EC measures against the emission of
gaseous and particulate pollutants from internal combustion engines to be installed in non-
road mobile machinery).
Operations: APB establishes the conditions under which companies can handle containers.
Therefore APICE project would dialogue on additional prescriptions to be included.
Users/exploitation: There are two companies providing the service: TCB and TERCAT. They
will be approached in case there are measures addressing this source. They have an
environmental quality system including air emissions, and therefore they could include
additional targets.
1.5 Additional issues
Regarding future emissions scenarios, we have considered a limited number of factors that
will control these emissions, e.g., S content in fuel, goods and passengers movements, land
traffic evolution, etc. However, a number of factors have not been applied, especially for

38
www.apice-project.eu
cargo handling, heavy-duty vehicles, and locomotives. Other EU legislation applies to them
91/542/EEC and non-road mobile machinery (NRMM) directives). Notwithstanding, for
heavy-duty vehicles and locomotives, lower emission factors have been considered in the
future.
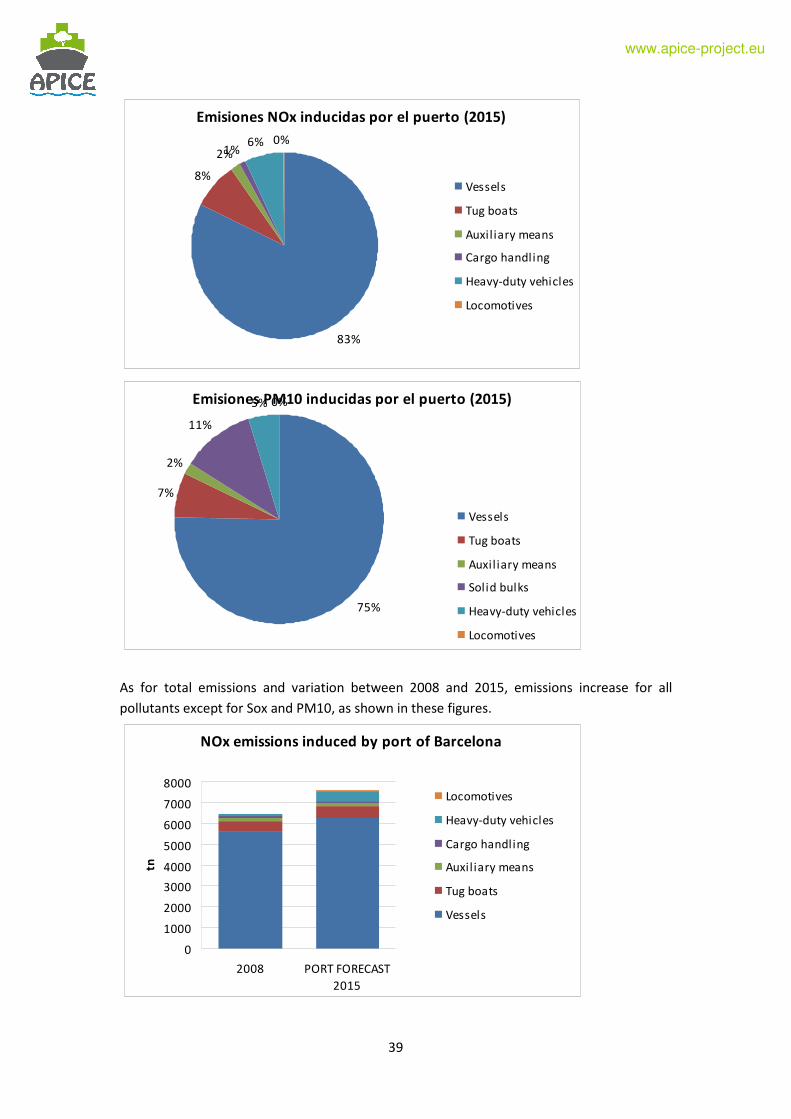
1.6 Conclusions for Barcelona
Research and assessment of emissions sources in Port of Barcelona show that main
emissions come from maritime traffic during the phases of manoeuvring and hotelling. The
following figures show the % of emissions sources for NOx and PM10.
Emisiones NOx inducidas por el puerto (2008)
79%
8%
2%2%
9% 0%
Vessels
Tug boats
Auxil iary means
Cargo handling
Heavy-duty vehicles
Locomotives
Emisiones PM10 inducidas por el puerto (2008)
74%
7%
2%
13%
4% 0%
Vessels
Tug boats
Auxil iary means
Solid bulks
Heavy-duty vehicles
Locomotives
The scenario 2015 shows a similar distribution of these sources, as shown in these figures for
the same pollutants.
39
www.apice-project.eu
Emisiones NOx inducidas por el puerto (2015)
83%
8%
2%1%6% 0%
Vessels
Tug boats
Auxil iary means
Cargo handling
Heavy-duty vehicles
Locomotives
Emisiones PM10 inducidas por el puerto (2015)
75%
7%
2%
11%
5% 0%
Vessels
Tug boats
Auxil iary means
Solid bulks
Heavy-duty vehicles
Locomotives
As for total emissions and variation between 2008 and 2015, emissions increase for all
pollutants except for Sox and PM10, as shown in these figures.
NOx emissions induced by port of Barcelona
0
1000
2000
3000
4000
5000
6000
7000
8000
2008 PORT FORECAST
2015
tn
Locomotives
Heavy-duty vehicles
Cargo handling
Auxil iary means
Tug boats
Vessels

40
www.apice-project.eu
PM10 emissions induced by port of Barcelona
0
100
200
300
400
500
600
700
2008 PORT FORECAST
2015
tn/
y
Locomotives
Heavy-duty vehicles
Solid bulks
Auxil iary means
Tug boats
Vessels
SOx emissions induced by Port of Barcelona
0
1000
2000
3000
4000
5000
6000
7000
8000
2008 PORT FORECAST
2015
Cargo handling
Auxiliary means
Tug boats
Vessels
NMVOCs induced by Port of Barcelona
0
50
100
150
200
250
300
350
400
2008 PORT FORECAST 2015
Auxil iary means
Tug boats
Vessels
41
www.apice-project.eu
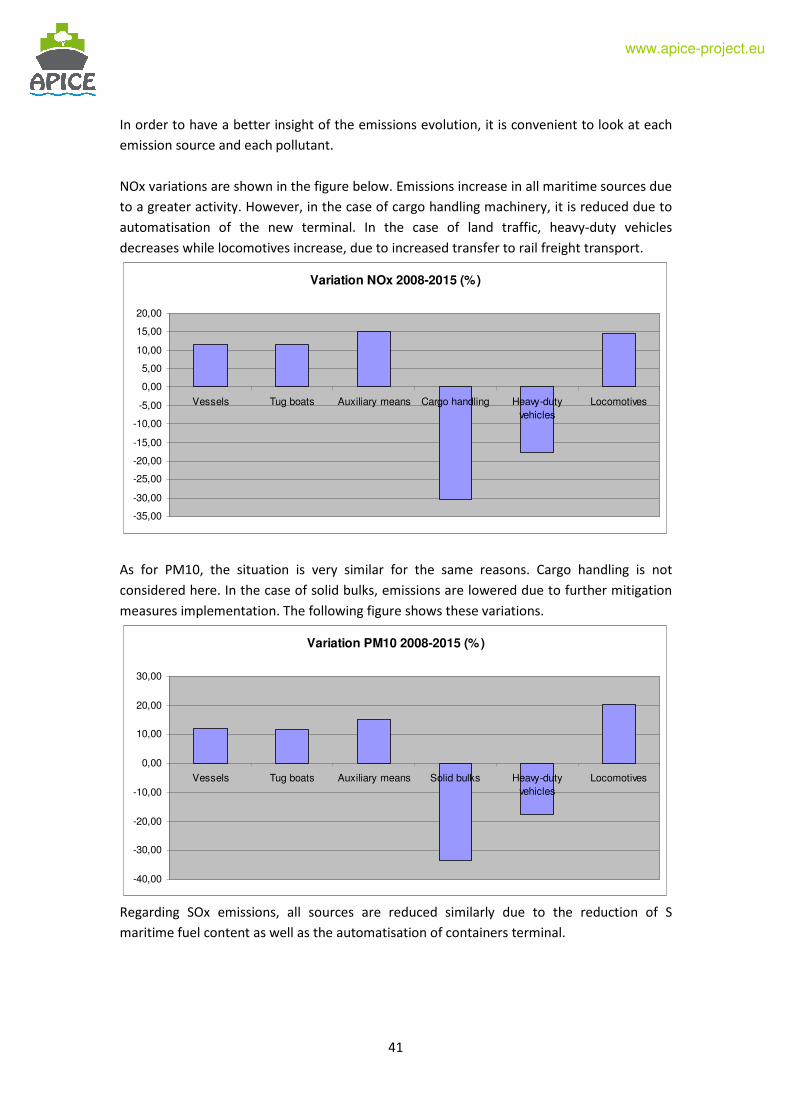
In order to have a better insight of the emissions evolution, it is convenient to look at each
emission source and each pollutant.
NOx variations are shown in the figure below. Emissions increase in all maritime sources due
to a greater activity. However, in the case of cargo handling machinery, it is reduced due to
automatisation of the new terminal. In the case of land traffic, heavy-duty vehicles
decreases while locomotives increase, due to increased transfer to rail freight transport.
Variation NOx 2008-2015 (%)
-35,00
-30,00
-25,00
-20,00
-15,00
-10,00
-5,00
0,00
5,00
10,00
15,00
20,00
Vessels Tug boats Auxiliary means Cargo handling Heavy-duty
vehicles
Locomotives
As for PM10, the situation is very similar for the same reasons. Cargo handling is not
considered here. In the case of solid bulks, emissions are lowered due to further mitigation
measures implementation. The following figure shows these variations.
Variation PM10 2008-2015 (%)
-40,00
-30,00
-20,00
-10,00
0,00
10,00
20,00
30,00
Vessels Tug boats Auxiliary means Solid bulks Heavy-duty
vehicles
Locomotives
Regarding SOx emissions, all sources are reduced similarly due to the reduction of S
maritime fuel content as well as the automatisation of containers terminal.

42
www.apice-project.eu
Variation SOx 2008-2015 (%)
-120,00
-100,00
-80,00
-60,00
-40,00
-20,00
0,00
Vessels Tug boats Auxiliary means Cargo handling
Finally, it is important to focus on how the ratio rail/road freight transport has an effect on
air emissions. Although land traffic is expected to increase due to greater port activity,
emissions as a result of land traffic diminish due to greater proportion transported by rail. In
the case of NOx, emissions are reduced by 13,67% while for PM10, by 15,93%. The following
figures show this evolution.

43
www.apice-project.eu
To conclude, it has been shown that air emissions caused by vessels in moneuvring and
hotelling phases are the main source of air pollution at the port. Although SOx have started
to be drastically cut due to new IMO legislation in force, NOx emissions and PM10 emissions
are expected to increase. The reduction of these pollutants must be seen in a longer
perspective than 2015 since this would be achieved through new engines and fuels that will
not be legally required in the short term. The same applies for tug boats and auxiliary
means.
In the case of cargo handling machinery, the semi-automatisation of new TERCAT terminal
will have important effects on improving air quality. However, it might be considered to
introduce some measures in TCB terminal.
Solid bulks handling have been improved over the last years and mitigation measures have
been included. It will be further investigated whether additional measures could be
proposed.
The Port Authority has a strong willingness on transfering more traffic land to locomotives,
and important efforts are being devoted from the point of view of infrastructures,
operations and marketing. Although land traffic emissions will likely diminish, additional
measures, mainly technical, could have an improved effect on air quality.
NOx emissions by land traffic
0,00
100,00
200,00
300,00
400,00
500,00
600,00
700,00
2008 PORT FORECAST 2015
Heavy-duty vehicles Locomotives
PM10 emissions by land traffic
0,00
5,00
10,00
15,00
20,00
25,00
30,00
2008 PORT FORECAST 2015
Heavy-duty vehicles Locomotives

44
www.apice-project.eu
This research will allow the team to model air emissions to study pollutants concentrations,
especially in the light of future scenarios. An additional 2015 scenario will be proposed
which will include mitigation measures proposed by APICE project, as part of the Common
Transnational Strategy and Local Adaptation Plan. These activities will follow to this study,
based on the insight gained and further research on air emissions abatement strategies.