wr final -1 - pdfmachine from broadgun software, http...
TRANSCRIPT

1
A
Ready Reckoner
April, 2010
Executive Director (Agric.)
Sardar Sarovar Narmada Nigam Limited
12, Sardar Bhavan, Sachivalaya
Gandhinagar (Gujarat)
For official use only
id24124649 pdfMachine by Broadgun Software - a great PDF writer! - a great PDF creator! - http://www.pdfmachine.com http://www.broadgun.com

2
I. Global:
II. International (country-wise)
UN report 2003; We are in the midst of a water crises that has many faces.
An assessment has projected that 4.0 billion people will live in water stressed
conditions in the year 2050.
Water-scarce and water-stressed countries, 1995-2050
Year Population (billions) Nos. of countries
1995 0.46 31
2025 2.8 48
2050 4.0 54
(Sources : http://info.k4health.org/pr/m14/m14chap2.shtml)
Per capita water availability in selected countries (M3/year):
Year Country
China India Pak. UK USA Bangaladesh Nepal
1975 3000 3100 5600 1300 11300 15800 16400
2000 2200 1900 2700 1200 8900 9400 8800
2025 1900 1400 1600 1200 7600 6800 5500
(Source : www.nih.ernet.in)
The concept of Water Stress:
(Source: www.worldwatercouncil.org)
3
II. International (country-wise):
III. International water resources disputes
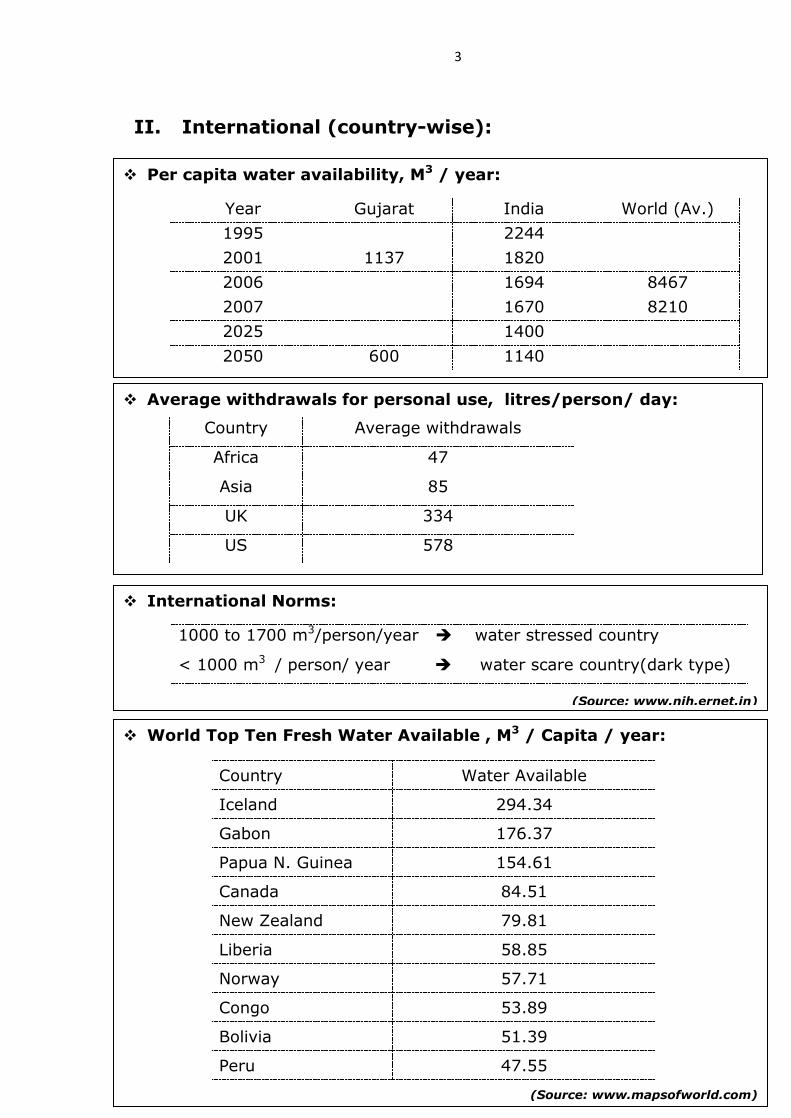
Per capita water availability, M3 / year:
Year Gujarat India World (Av.)
1995 2244
2001 1137 1820
2006 1694 8467
2007 1670 8210
2025 1400
2050 600 1140
Average withdrawals for personal use, litres/person/ day:
Country Average withdrawals
Africa 47
Asia 85
UK 334
US 578
International Norms:
1000 to 1700 m3/person/year water stressed country
< 1000 m3 / person/ year water scare country(dark type)
(Source: www.nih.ernet.in)
World Top Ten Fresh Water Available , M3 / Capita / year:
Country Water Available
Iceland 294.34
Gabon 176.37
Papua N. Guinea 154.61
Canada 84.51
New Zealand 79.81
Liberia 58.85
Norway 57.71
Congo 53.89
Bolivia 51.39
Peru 47.55
(Source: www.mapsofworld.com)
4
IV. National
IV. National
Total estimation of annual requirement of fresh water :
Year Volume, BCM Remark
2010 694 to 710 various sectors including irrigation, domestic,
industrial, hydropower and other uses depending
on the low and high demand scenarios
Estimates show that this demand will be met by
harnessing 700 BCM of surface water and 350 BCM
of ground water.
2025 784 to 850
2050 973 to 1180
(Source : www.nih.ernet.in)
Supply of fresh water for different purpose:
Purpose India (%) World (%)
Agricultural 90 69
Industry 7 23
Domestic 3 8
(Source: www.nih.ernet.in)
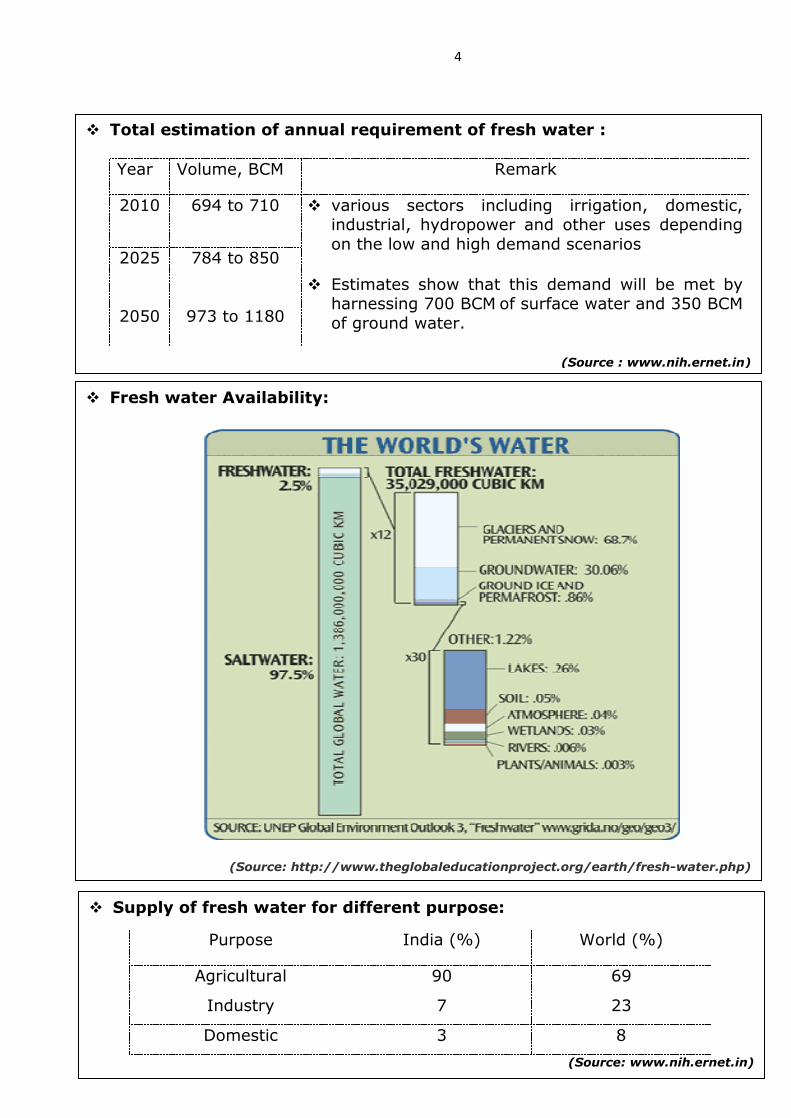
Fresh water Availability:
(Source: http://www.theglobaleducationproject.org/earth/fresh-water.php)

5
III. International water resources dispute:
Dispute between countries:
China- India �Brahmaputra � 3 Gorges
India and Pakistan � Baglihar hydroelectric project over the Chenab River
Inter-State water disputes under Inter-State River Water Disputes Act
(ISRWD), 1956:
River(s) States
Date of
Constitution of
Tribunal
Date of Award
Krishna Maharashtra, Andhra
Pradesh, Karnataka April 1969 May 1976
Godavari
Maharashtra, Andhra
Pradesh, Karnataka, Madhya
Pradesh and Orissa
April 1969 July 1980
Narmada Rajasthan, Madhya Pradesh,
Gujarat, Maharashtra October 1969 December 1979
Cauvery
Kerala, Karnataka, Tamil
Nadu and Union Territory of
Pondicherry
June 1990
Report u/s 5(2)
received
5.2.2007
Krishna Karnataka, Andhra Pradesh
and Maharashtra April 2004
Report u/s 5(2)
pending
Model/
Mandovi/Mahadayi/ Goa, Karnataka and - -
Vansadhara Andhra Pradesh & Orissa - -
(Source : http://india.gov.in/sectors/water_resources/river_water.php)
Countries have started Desalinization - Middle East
Imports water & uses sewage treated- Singapore
Water processed for disinfection, filtration
and twice reverse cosmoses.
6
IV. National:
Water Resources Potential of River Basins of India
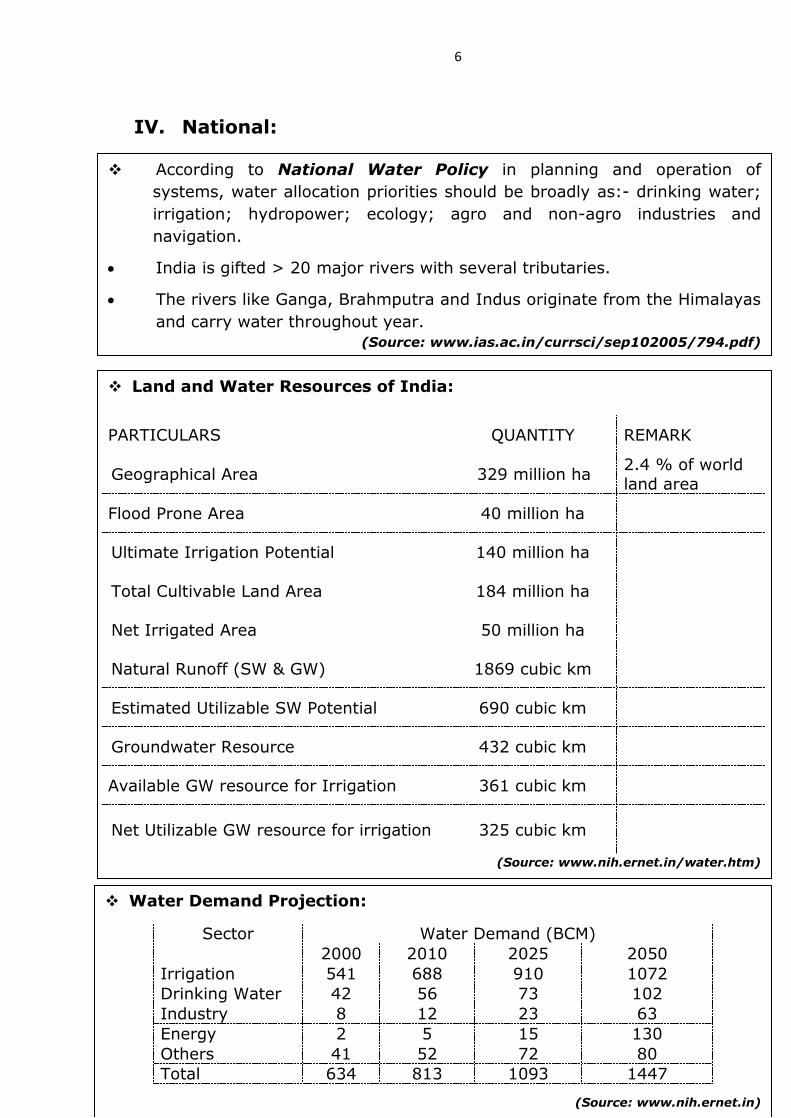
Land and Water Resources of India:
PARTICULARS QUANTITY REMARK
Geographical Area 329 million ha 2.4 % of world
land area
Flood Prone Area 40 million ha
Ultimate Irrigation Potential 140 million ha
Total Cultivable Land Area 184 million ha
Net Irrigated Area 50 million ha
Natural Runoff (SW & GW) 1869 cubic km
Estimated Utilizable SW Potential 690 cubic km
Groundwater Resource 432 cubic km
Available GW resource for Irrigation 361 cubic km
Net Utilizable GW resource for irrigation 325 cubic km
(Source: www.nih.ernet.in/water.htm)
According to National Water Policy in planning and operation of
systems, water allocation priorities should be broadly as:- drinking water;
irrigation; hydropower; ecology; agro and non-agro industries and
navigation.
India is gifted > 20 major rivers with several tributaries.
The rivers like Ganga, Brahmputra and Indus originate from the Himalayas
and carry water throughout year.
(Source: www.ias.ac.in/currsci/sep102005/794.pdf)
Water Demand Projection:
Sector Water Demand (BCM)
2000 2010 2025 2050
Irrigation 541 688 910 1072
Drinking Water 42 56 73 102
Industry 8 12 23 63
Energy 2 5 15 130
Others 41 52 72 80
Total 634 813 1093 1447
(Source: www.nih.ernet.in)
7
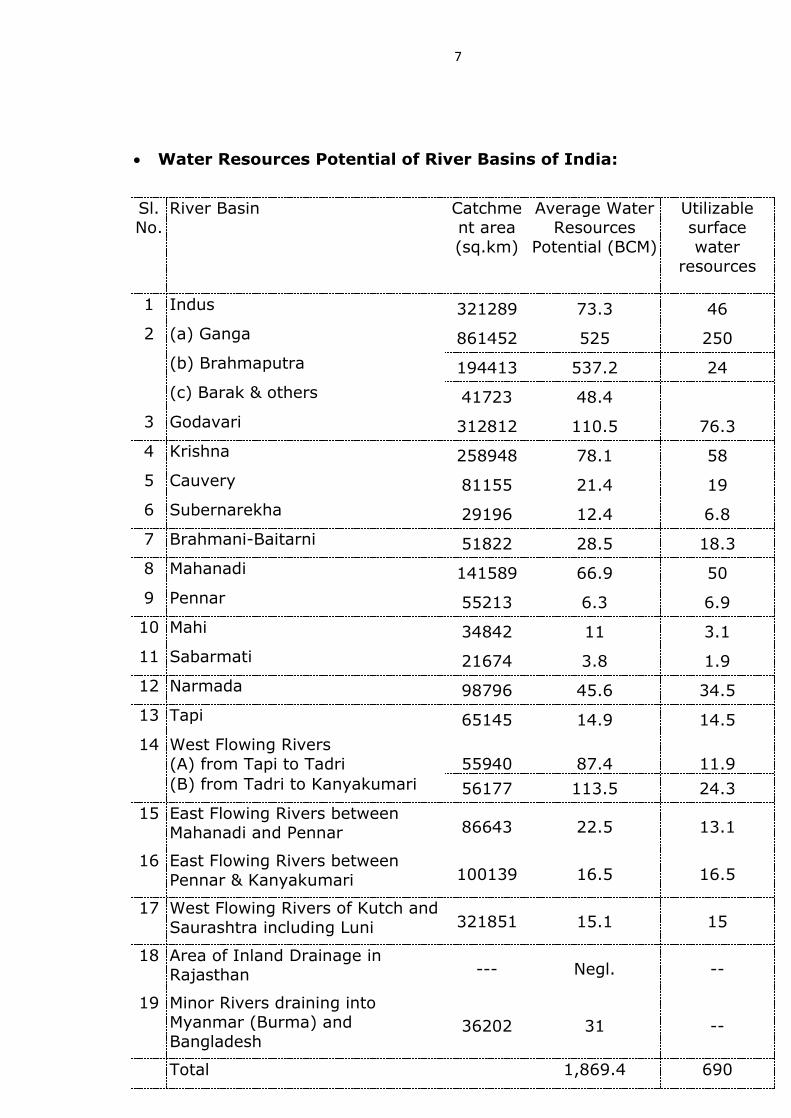
Water Resources Potential of River Basins of India:
Sl.
No.
River Basin Catchme
nt area
(sq.km)
Average Water
Resources
Potential (BCM)
Utilizable
surface
water
resources
1 Indus 321289 73.3 46
2 (a) Ganga 861452 525 250
(b) Brahmaputra 194413 537.2 24
(c) Barak & others 41723 48.4
3 Godavari 312812 110.5 76.3
4 Krishna 258948 78.1 58
5 Cauvery 81155 21.4 19
6 Subernarekha 29196 12.4 6.8
7 Brahmani-Baitarni 51822 28.5 18.3
8 Mahanadi 141589 66.9 50
9 Pennar 55213 6.3 6.9
10 Mahi 34842 11 3.1
11 Sabarmati 21674 3.8 1.9
12 Narmada 98796 45.6 34.5
13 Tapi 65145 14.9 14.5
14 West Flowing Rivers
(A) from Tapi to Tadri
55940
87.4
11.9
(B) from Tadri to Kanyakumari 56177 113.5 24.3
15 East Flowing Rivers between
Mahanadi and Pennar 86643 22.5 13.1
16 East Flowing Rivers between
Pennar & Kanyakumari 100139 16.5 16.5
17 West Flowing Rivers of Kutch and
Saurashtra including Luni 321851 15.1 15
18 Area of Inland Drainage in
Rajasthan --- Negl. --
19 Minor Rivers draining into
Myanmar (Burma) and
Bangladesh 36202 31 --
Total 1,869.4 690
8
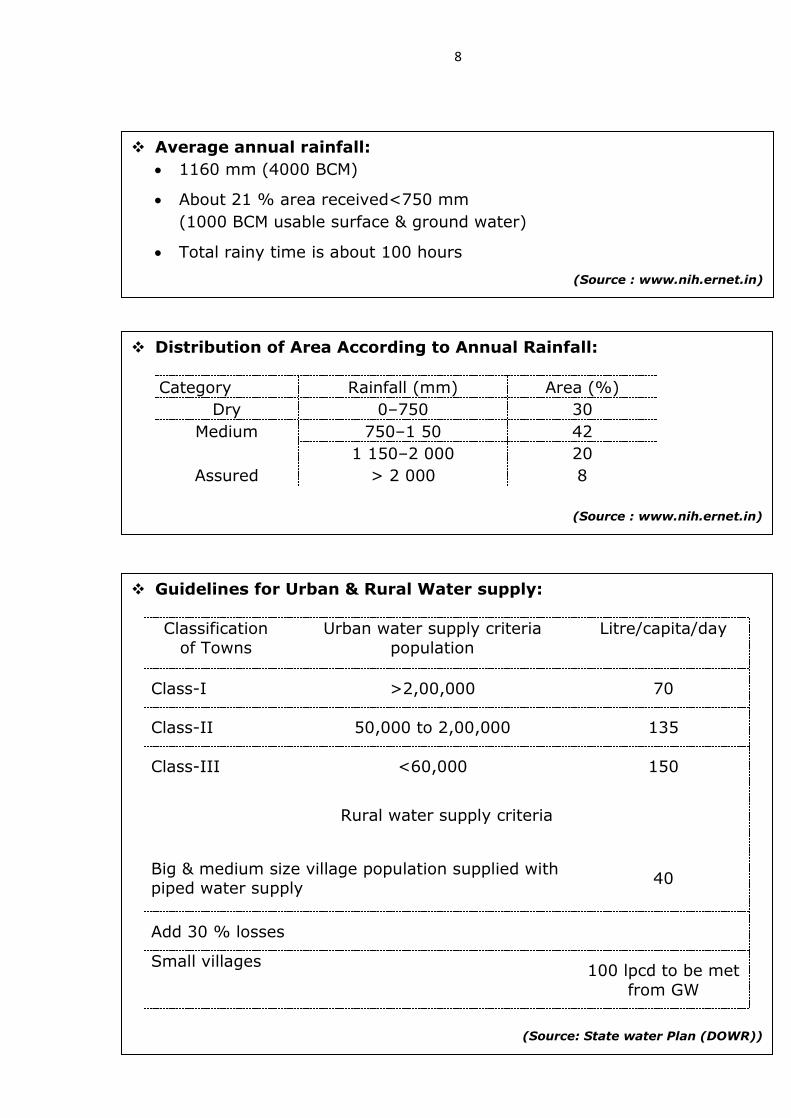
Distribution of Area According to Annual Rainfall:
Category Rainfall (mm) Area (%)
Dry 0�750 30
Medium 750�1 50 42
1 150�2 000 20
Assured > 2 000 8
(Source : www.nih.ernet.in)
Guidelines for Urban & Rural Water supply:
Classification
of Towns
Urban water supply criteria
population
Litre/capita/day
Class-I >2,00,000 70
Class-II 50,000 to 2,00,000 135
Class-III <60,000 150
Rural water supply criteria
Big & medium size village population supplied with
piped water supply 40
Add 30 % losses
Small villages 100 lpcd to be met
from GW
(Source: State water Plan (DOWR))
Average annual rainfall:
1160 mm (4000 BCM)
About 21 % area received<750 mm
(1000 BCM usable surface & ground water)
Total rainy time is about 100 hours
(Source : www.nih.ernet.in)
9
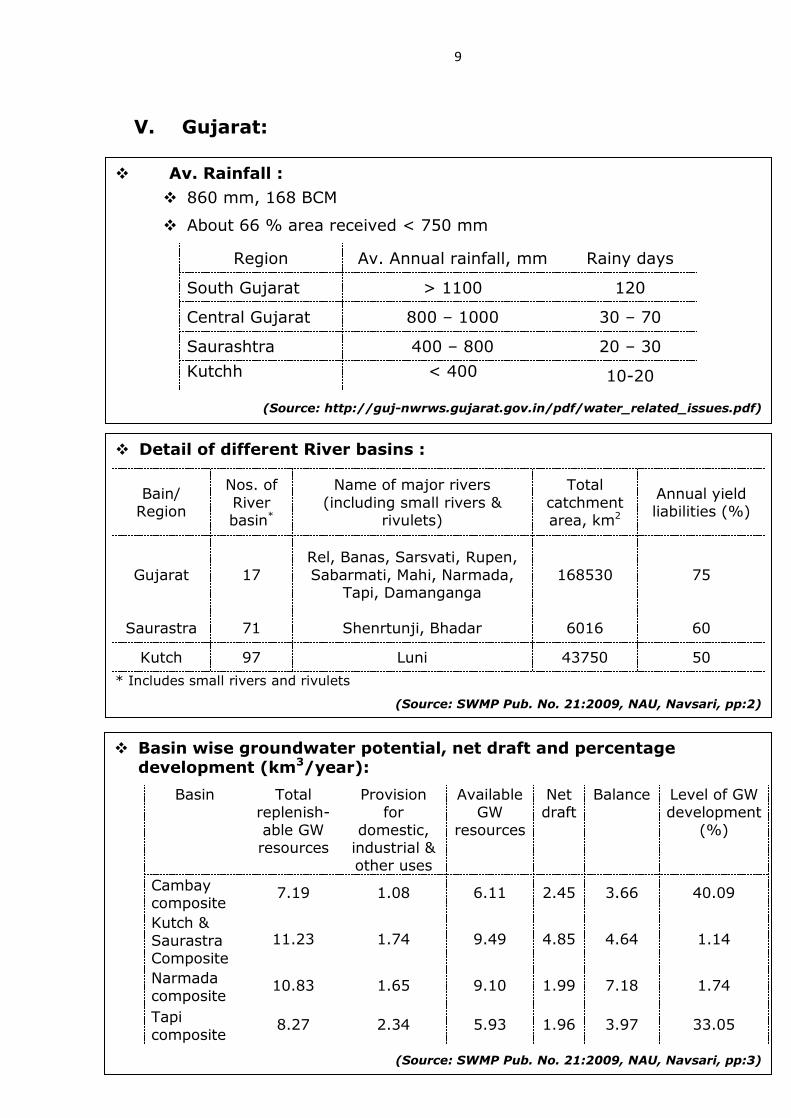
V. Gujarat:
Av. Rainfall :
860 mm, 168 BCM
About 66 % area received < 750 mm
Region Av. Annual rainfall, mm Rainy days
South Gujarat > 1100 120
Central Gujarat 800 � 1000 30 � 70
Saurashtra 400 � 800 20 � 30
Kutchh < 400 10-20
(Source: http://guj-nwrws.gujarat.gov.in/pdf/water_related_issues.pdf)
Detail of different River basins :
Bain/
Region
Nos. of
River
basin*
Name of major rivers
(including small rivers &
rivulets)
Total
catchment
area, km2
Annual yield
liabilities (%)
Gujarat 17
Rel, Banas, Sarsvati, Rupen,
Sabarmati, Mahi, Narmada,
Tapi, Damanganga
168530 75
Saurastra 71 Shenrtunji, Bhadar 6016 60
Kutch 97 Luni 43750 50
* Includes small rivers and rivulets
(Source: SWMP Pub. No. 21:2009, NAU, Navsari, pp:2)
Basin wise groundwater potential, net draft and percentage
development (km3/year):
Basin Total
replenish-
able GW
resources
Provision
for
domestic,
industrial &
other uses
Available
GW
resources
Net
draft
Balance Level of GW
development
(%)
Cambay
composite 7.19 1.08 6.11 2.45 3.66 40.09
Kutch &
Saurastra
Composite
11.23 1.74 9.49 4.85 4.64 1.14
Narmada
composite 10.83 1.65 9.10 1.99 7.18 1.74
Tapi
composite 8.27 2.34 5.93 1.96 3.97 33.05
(Source: SWMP Pub. No. 21:2009, NAU, Navsari, pp:3)
10
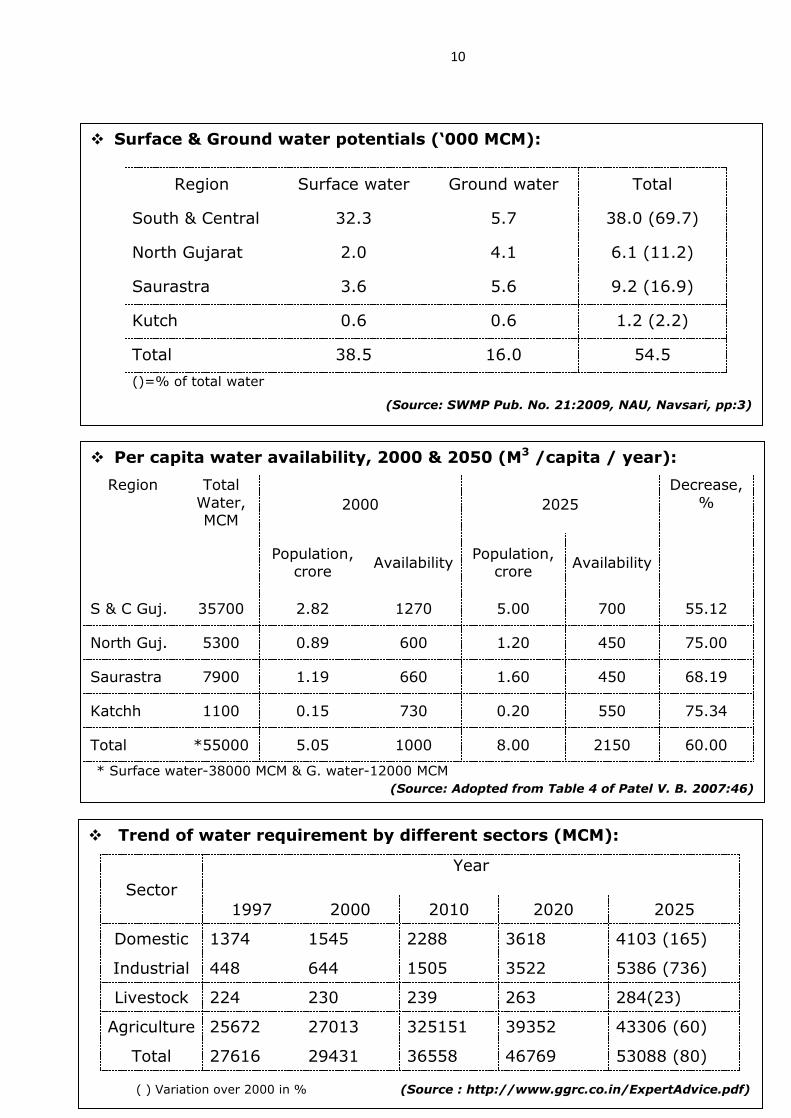
Surface & Ground water potentials (�000 MCM):
Region Surface water Ground water Total
South & Central 32.3 5.7 38.0 (69.7)
North Gujarat 2.0 4.1 6.1 (11.2)
Saurastra 3.6 5.6 9.2 (16.9)
Kutch 0.6 0.6 1.2 (2.2)
Total 38.5 16.0 54.5
()=% of total water
(Source: SWMP Pub. No. 21:2009, NAU, Navsari, pp:3)
Per capita water availability, 2000 & 2050 (M3 /capita / year):
Region Total
Water,
MCM
2000 2025
Decrease,
%
Population,
crore Availability
Population,
crore Availability
S & C Guj. 35700 2.82 1270 5.00 700 55.12
North Guj. 5300 0.89 600 1.20 450 75.00
Saurastra 7900 1.19 660 1.60 450 68.19
Katchh 1100 0.15 730 0.20 550 75.34
Total *55000 5.05 1000 8.00 2150 60.00
* Surface water-38000 MCM & G. water-12000 MCM
(Source: Adopted from Table 4 of Patel V. B. 2007:46)
Trend of water requirement by different sectors (MCM):
Sector
Year
1997 2000 2010 2020 2025
Domestic 1374 1545 2288 3618 4103 (165)
Industrial 448 644 1505 3522 5386 (736)
Livestock 224 230 239 263 284(23)
Agriculture 25672 27013 325151 39352 43306 (60)
Total 27616 29431 36558 46769 53088 (80)
( ) Variation over 2000 in % (Source : http://www.ggrc.co.in/ExpertAdvice.pdf)

11
Ground water development trend:
Category Nos. of Districts Nos. of Talukas
1984 1997 2002 1984 1997 2002
White 19 9 15 163 96 104
Gray Nil 6 4 13 43 63
Dark Nil 1 1 1 7 12
OE Nil 3 5 5 31 30
Saline --- --- --- 2 7 14
Total 19 19 25 184 184 223
OE = Over Exploited (Source: SWMP Pub. No. 21:2009, NAU, Navsari, pp:6)
Irrigation potential (Ha):
Sr.
No. Name of Sector
Potential created in
Total 2007-08 2008-09
1
Major & Medium Irrigation
(excluding Sardar Sarovar
Project
38182 65439 103621
2 Sardar Sarovar Project 66000 20885 86885
3 Total of Major &
Medium Irrigation 104182 86324 190506
4 Minor Irrigation 1980 16270 18250
5 Check Dams (indirect
benefits) 40680 27858 68538
6 Grand Total 146842 130452 277294
Water utilization pattern (�000 MCM):
Region Available Utilization % Utilization of
total available
S & C Gujarat 38.0 7.0 18
North Gujarat 6.1 6.0 98
Saurastra 9.2 5.4 59
Kuchhch 1.2 0.7 58
TOTAL 54.5 19.1 35
(Source: SWMP Pub. No. 21:2009, NAU, Navsari, pp:4)
12
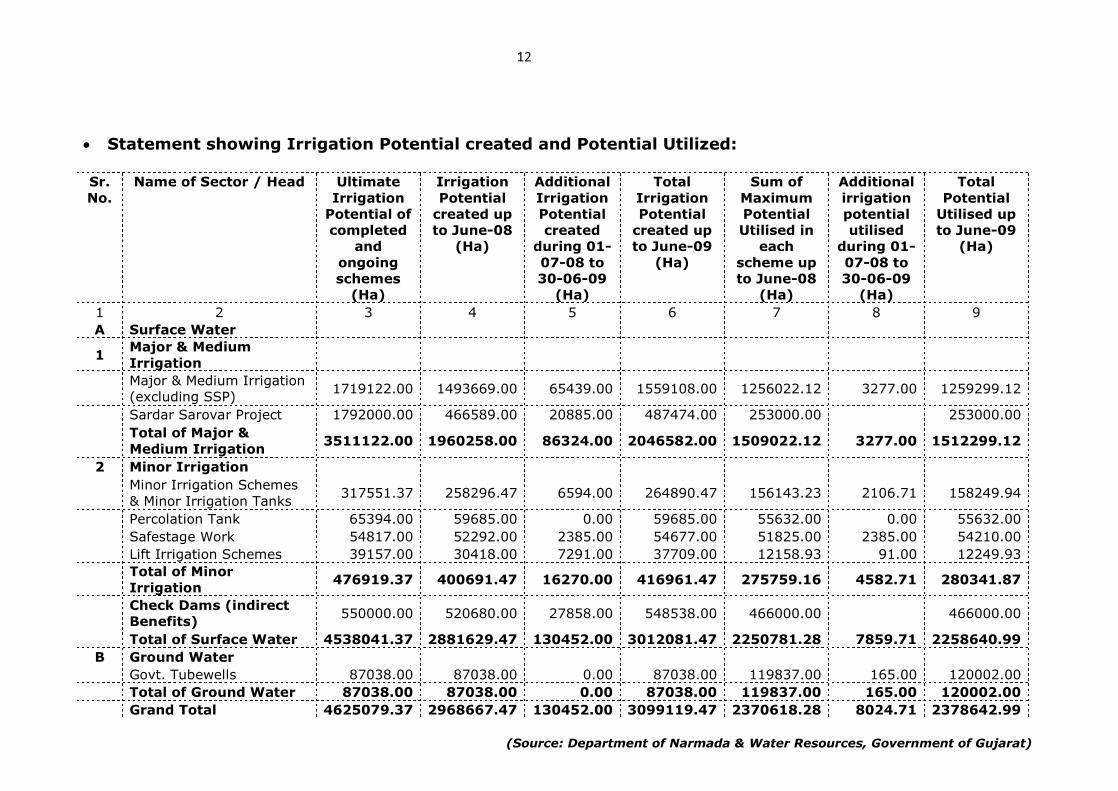
Statement showing Irrigation Potential created and Potential Utilized:
Sr.
No.
Name of Sector / Head Ultimate
Irrigation
Potential of
completed
and
ongoing
schemes
(Ha)
Irrigation
Potential
created up
to June-08
(Ha)
Additional
Irrigation
Potential
created
during 01-
07-08 to
30-06-09
(Ha)
Total
Irrigation
Potential
created up
to June-09
(Ha)
Sum of
Maximum
Potential
Utilised in
each
scheme up
to June-08
(Ha)
Additional
irrigation
potential
utilised
during 01-
07-08 to
30-06-09
(Ha)
Total
Potential
Utilised up
to June-09
(Ha)
1 2 3 4 5 6 7 8 9
A Surface Water
1 Major & Medium
Irrigation
Major & Medium Irrigation
(excluding SSP) 1719122.00 1493669.00 65439.00 1559108.00 1256022.12 3277.00 1259299.12
Sardar Sarovar Project 1792000.00 466589.00 20885.00 487474.00 253000.00 253000.00
Total of Major &
Medium Irrigation 3511122.00 1960258.00 86324.00 2046582.00 1509022.12 3277.00 1512299.12
2 Minor Irrigation
Minor Irrigation Schemes
& Minor Irrigation Tanks 317551.37 258296.47 6594.00 264890.47 156143.23 2106.71 158249.94
Percolation Tank 65394.00 59685.00 0.00 59685.00 55632.00 0.00 55632.00
Safestage Work 54817.00 52292.00 2385.00 54677.00 51825.00 2385.00 54210.00
Lift Irrigation Schemes 39157.00 30418.00 7291.00 37709.00 12158.93 91.00 12249.93
Total of Minor
Irrigation 476919.37 400691.47 16270.00 416961.47 275759.16 4582.71 280341.87
Check Dams (indirect
Benefits) 550000.00 520680.00 27858.00 548538.00 466000.00 466000.00
Total of Surface Water 4538041.37 2881629.47 130452.00 3012081.47 2250781.28 7859.71 2258640.99
B Ground Water
Govt. Tubewells 87038.00 87038.00 0.00 87038.00 119837.00 165.00 120002.00
Total of Ground Water 87038.00 87038.00 0.00 87038.00 119837.00 165.00 120002.00
Grand Total 4625079.37 2968667.47 130452.00 3099119.47 2370618.28 8024.71 2378642.99
(Source: Department of Narmada & Water Resources, Government of Gujarat)

13
District and source wise irrigated area:
Districts Gross Irrigated Area Percent Irrigated by Net
Irrigated
Area
(�000 ha.) �000 ha (%) Surface
source
Ground
source
Ahmedabad 2100 38 25 75 1669
Amreli 1188 21 5 95 1024
Anand 2314 79 42 58 1794
Banaskantha 4721 46 8 92 3732
Bharuch 1086 32 43 57 980
Bhavnagar 2158 35 5 95 1977
Dahod 749 25 18 82 531
Dang 5 --- 0 100 4
Gandhinagar 1132 57 0 100 970
Jamnagar 1527 22 6 94 1242
Junagadh 2193 32 6 94 1776
Kheda 2556 63 28 72 1951
Kutch 2223 31 14 86 1781
Mahesana 2436 55 5 95 1990
Narmada 256 25 35 65 229
Navasari 1002 59 56 44 905
Panchmahal 515 17 30 70 421
Patan 1253 30 2 98 1037
Porbandar 223 17 7 93 192
Rajkot 2626 30 10 90 2094
Sabarkantha 1773 33 14 86 1415
Surat 2718 59 67 33 2420
Surendranagar 1302 18 5 95 1145
Vadodra 2498 44 10 90 2008
Valsad 515 29 13 87 420
State 41069 36 19 81 33707
(Source: SWMP Pub. No. 21:2009, NAU, Navsari, pp:9-10)
14
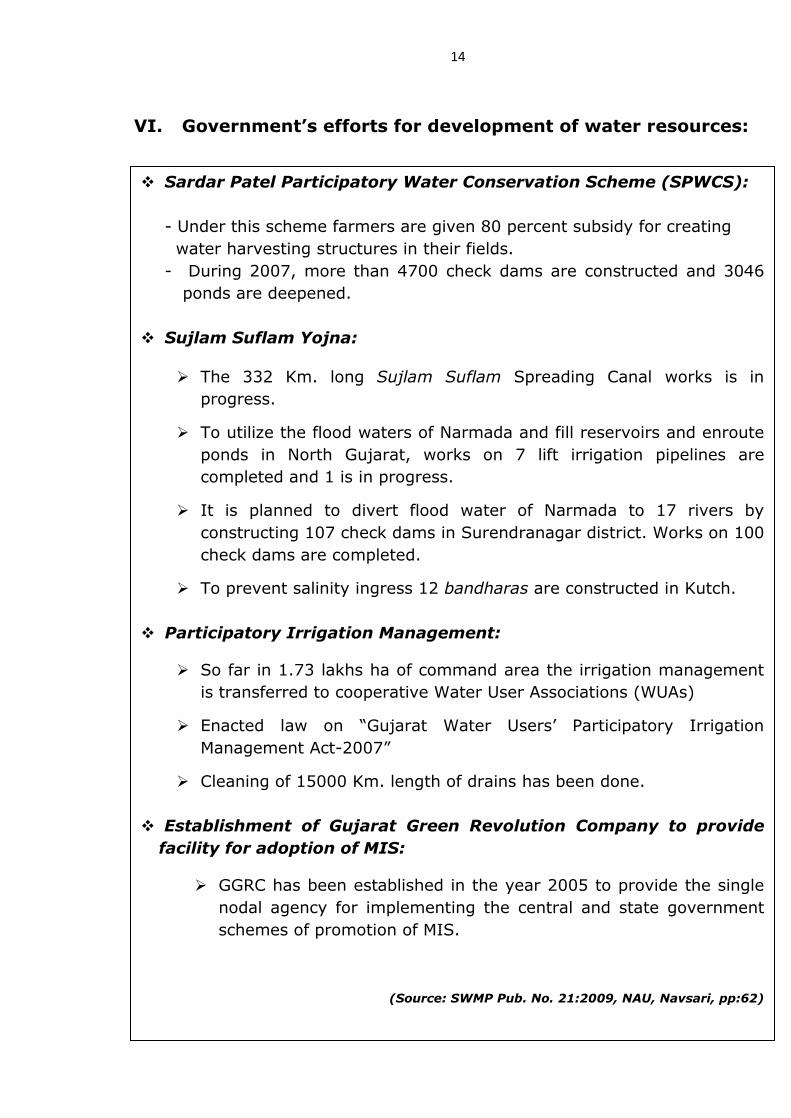
VI. Government�s efforts for development of water resources:
Sardar Patel Participatory Water Conservation Scheme (SPWCS):
- Under this scheme farmers are given 80 percent subsidy for creating
water harvesting structures in their fields.
- During 2007, more than 4700 check dams are constructed and 3046
ponds are deepened.
Sujlam Suflam Yojna:
The 332 Km. long Sujlam Suflam Spreading Canal works is in
progress.
To utilize the flood waters of Narmada and fill reservoirs and enroute
ponds in North Gujarat, works on 7 lift irrigation pipelines are
completed and 1 is in progress.
It is planned to divert flood water of Narmada to 17 rivers by
constructing 107 check dams in Surendranagar district. Works on 100
check dams are completed.
To prevent salinity ingress 12 bandharas are constructed in Kutch.
Participatory Irrigation Management:
So far in 1.73 lakhs ha of command area the irrigation management
is transferred to cooperative Water User Associations (WUAs)
Enacted law on �Gujarat Water Users� Participatory Irrigation
Management Act-2007�
Cleaning of 15000 Km. length of drains has been done.
Establishment of Gujarat Green Revolution Company to provide
facility for adoption of MIS:
GGRC has been established in the year 2005 to provide the single
nodal agency for implementing the central and state government
schemes of promotion of MIS.
(Source: SWMP Pub. No. 21:2009, NAU, Navsari, pp:62)
15
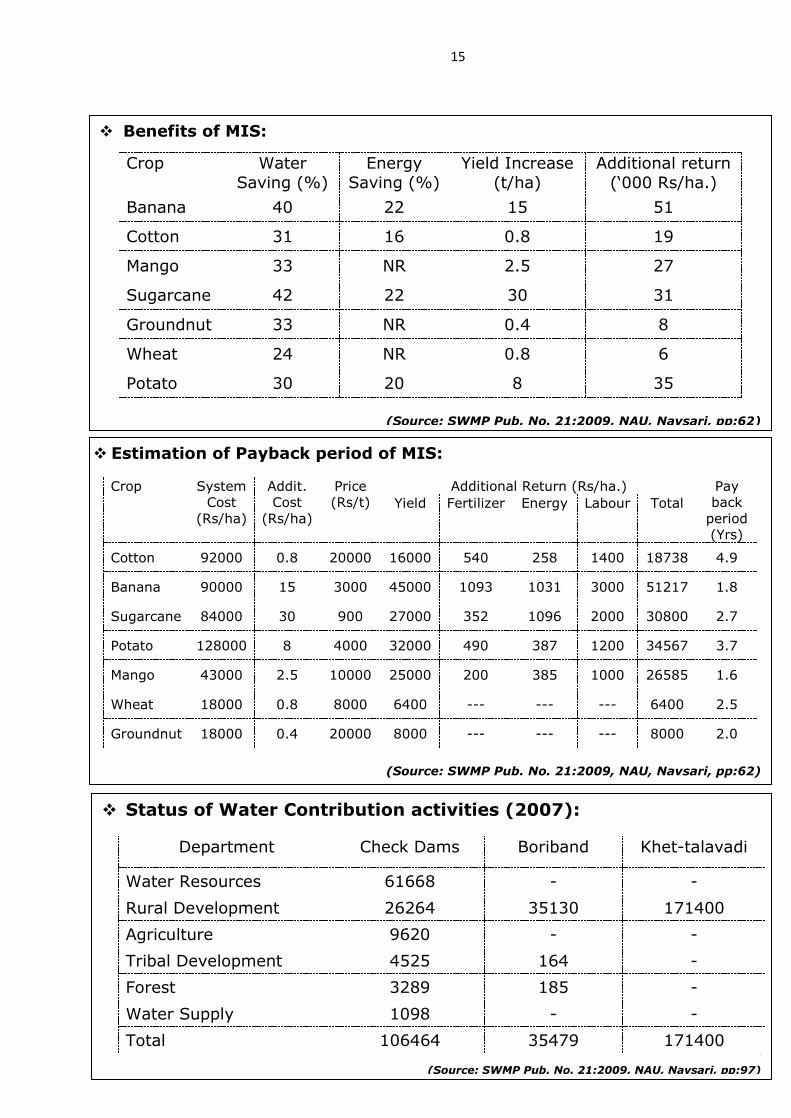
Benefits of MIS:
Crop Water
Saving (%)
Energy
Saving (%)
Yield Increase
(t/ha)
Additional return
(�000 Rs/ha.)
Banana 40 22 15 51
Cotton 31 16 0.8 19
Mango 33 NR 2.5 27
Sugarcane 42 22 30 31
Groundnut 33 NR 0.4 8
Wheat 24 NR 0.8 6
Potato 30 20 8 35
(Source: SWMP Pub. No. 21:2009, NAU, Navsari, pp:62)
Estimation of Payback period of MIS:
Crop System
Cost
(Rs/ha)
Addit.
Cost
(Rs/ha)
Price
(Rs/t)
Additional Return (Rs/ha.) Pay
back
period
(Yrs)
Yield Fertilizer Energy Labour Total
Cotton 92000 0.8 20000 16000 540 258 1400 18738 4.9
Banana 90000 15 3000 45000 1093 1031 3000 51217 1.8
Sugarcane 84000 30 900 27000 352 1096 2000 30800 2.7
Potato 128000 8 4000 32000 490 387 1200 34567 3.7
Mango 43000 2.5 10000 25000 200 385 1000 26585 1.6
Wheat 18000 0.8 8000 6400 --- --- --- 6400 2.5
Groundnut 18000 0.4 20000 8000 --- --- --- 8000 2.0
(Source: SWMP Pub. No. 21:2009, NAU, Navsari, pp:62)
Status of Water Contribution activities (2007):
Department Check Dams
Boriband Khet-talavadi
Water Resources 61668 - -
Rural Development 26264 35130 171400
Agriculture 9620 - -
Tribal Development 4525 164 -
Forest 3289 185 -
Water Supply 1098 - -
Total 106464 35479 171400 [
(Source: SWMP Pub. No. 21:2009, NAU, Navsari, pp:97)
16
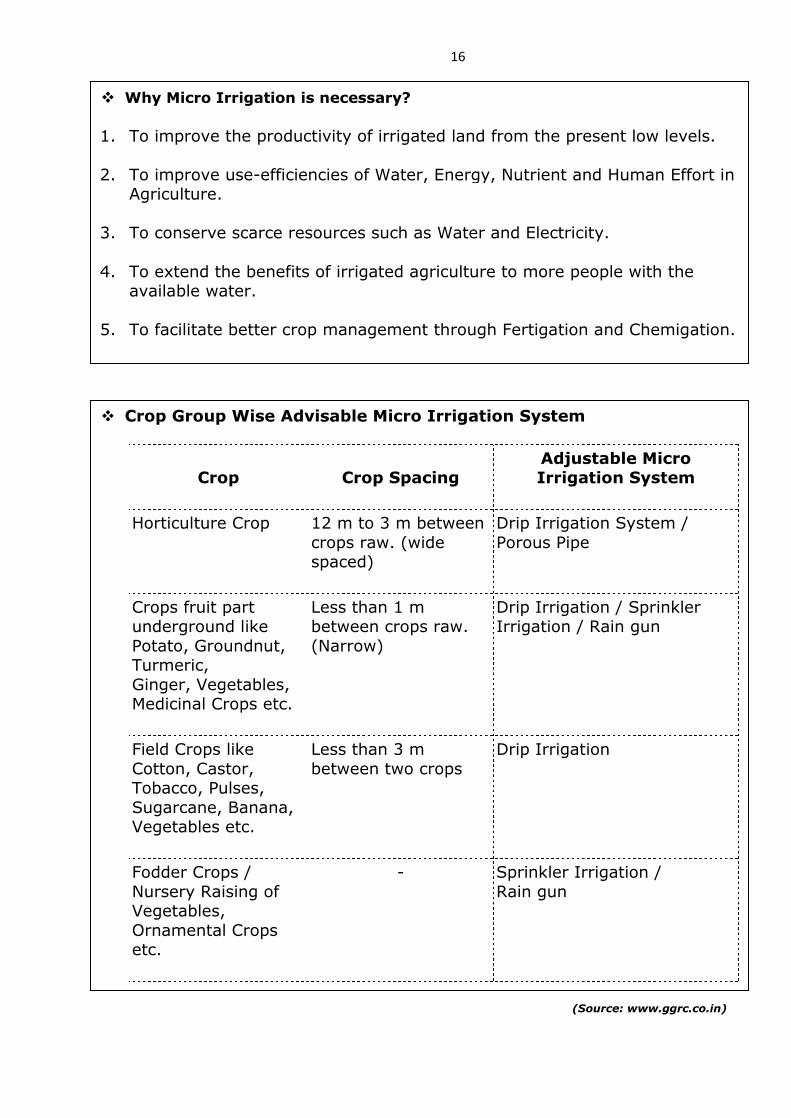
(Source: www.ggrc.co.in)
Why Micro Irrigation is necessary?
1. To improve the productivity of irrigated land from the present low levels.
2. To improve use-efficiencies of Water, Energy, Nutrient and Human Effort in
Agriculture.
3. To conserve scarce resources such as Water and Electricity.
4. To extend the benefits of irrigated agriculture to more people with the
available water.
5. To facilitate better crop management through Fertigation and Chemigation.
Crop Group Wise Advisable Micro Irrigation System
Crop Crop Spacing
Adjustable Micro
Irrigation System
Horticulture Crop 12 m to 3 m between
crops raw. (wide
spaced)
Drip Irrigation System /
Porous Pipe
Crops fruit part
underground like
Potato, Groundnut,
Turmeric,
Ginger, Vegetables,
Medicinal Crops etc.
Less than 1 m
between crops raw.
(Narrow)
Drip Irrigation / Sprinkler
Irrigation / Rain gun
Field Crops like
Cotton, Castor,
Tobacco, Pulses,
Sugarcane, Banana,
Vegetables etc.
Less than 3 m
between two crops
Drip Irrigation
Fodder Crops /
Nursery Raising of
Vegetables,
Ornamental Crops
etc.
- Sprinkler Irrigation /
Rain gun
17
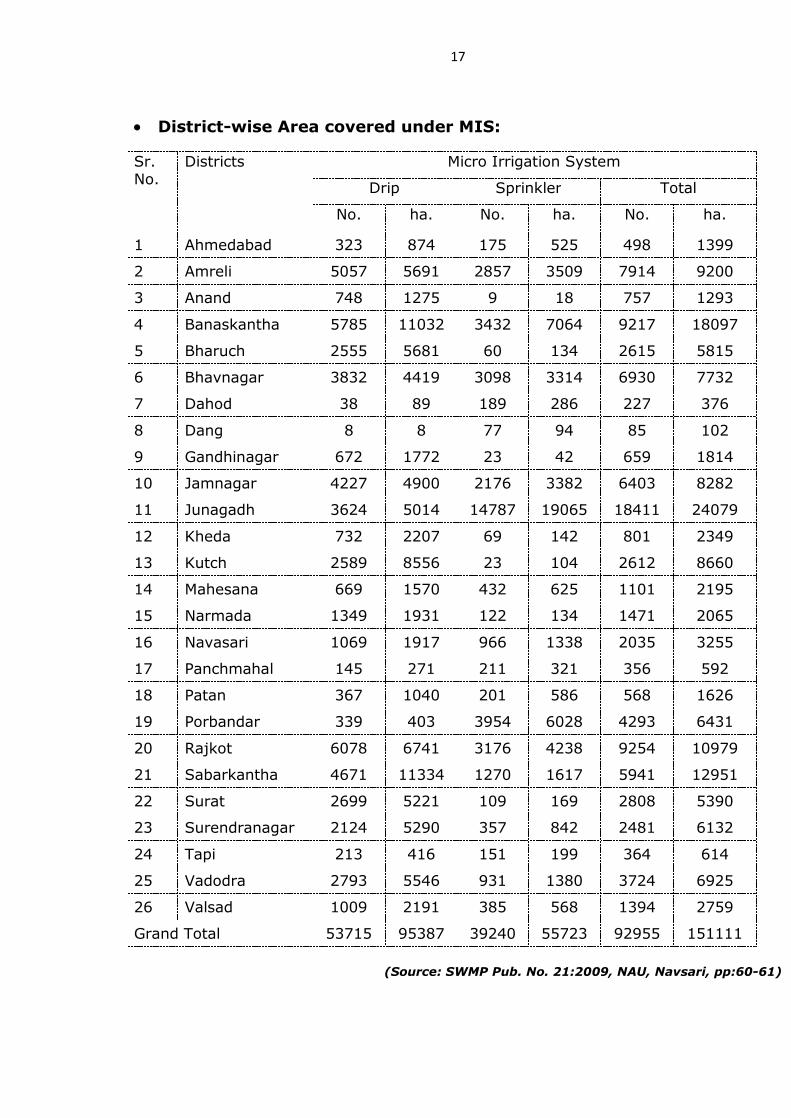
District-wise Area covered under MIS:
Sr.
No.
Districts Micro Irrigation System
Drip Sprinkler Total
No. ha. No. ha. No. ha.
1 Ahmedabad 323 874 175 525 498 1399
2 Amreli 5057 5691 2857 3509 7914 9200
3 Anand 748 1275 9 18 757 1293
4 Banaskantha 5785 11032 3432 7064 9217 18097
5 Bharuch 2555 5681 60 134 2615 5815
6 Bhavnagar 3832 4419 3098 3314 6930 7732
7 Dahod 38 89 189 286 227 376
8 Dang 8 8 77 94 85 102
9 Gandhinagar 672 1772 23 42 659 1814
10 Jamnagar 4227 4900 2176 3382 6403 8282
11 Junagadh 3624 5014 14787 19065 18411 24079
12 Kheda 732 2207 69 142 801 2349
13 Kutch 2589 8556 23 104 2612 8660
14 Mahesana 669 1570 432 625 1101 2195
15 Narmada 1349 1931 122 134 1471 2065
16 Navasari 1069 1917 966 1338 2035 3255
17 Panchmahal 145 271 211 321 356 592
18 Patan 367 1040 201 586 568 1626
19 Porbandar 339 403 3954 6028 4293 6431
20 Rajkot 6078 6741 3176 4238 9254 10979
21 Sabarkantha 4671 11334 1270 1617 5941 12951
22 Surat 2699 5221 109 169 2808 5390
23 Surendranagar 2124 5290 357 842 2481 6132
24 Tapi 213 416 151 199 364 614
25 Vadodra 2793 5546 931 1380 3724 6925
26 Valsad 1009 2191 385 568 1394 2759
Grand Total 53715 95387 39240 55723 92955 151111
(Source: SWMP Pub. No. 21:2009, NAU, Navsari, pp:60-61)
18
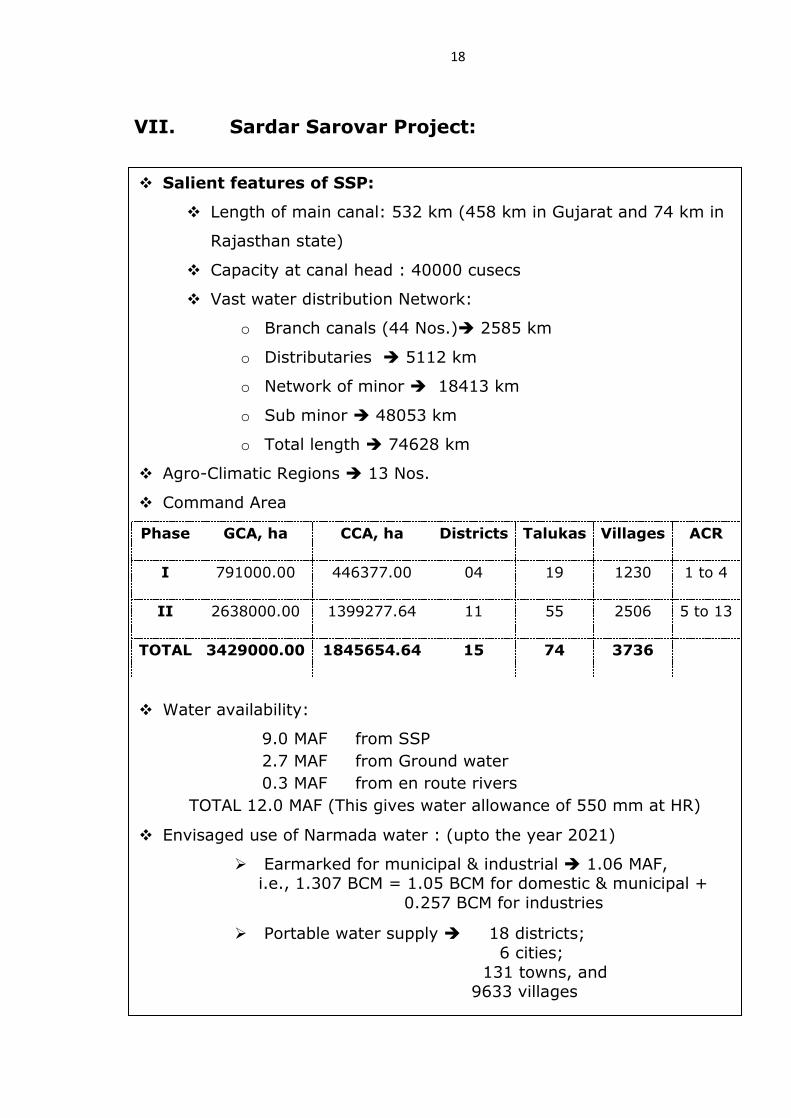
VII. Sardar Sarovar Project:
Salient features of SSP:
Length of main canal: 532 km (458 km in Gujarat and 74 km in
Rajasthan state)
Capacity at canal head : 40000 cusecs
Vast water distribution Network:
o Branch canals (44 Nos.) 2585 km
o Distributaries 5112 km
o Network of minor 18413 km
o Sub minor 48053 km
o Total length 74628 km
Agro-Climatic Regions 13 Nos.
Command Area
Phase GCA, ha CCA, ha Districts Talukas Villages ACR
I 791000.00 446377.00 04 19 1230 1 to 4
II 2638000.00 1399277.64 11 55 2506 5 to 13
TOTAL 3429000.00 1845654.64 15 74 3736
Water availability:
9.0 MAF from SSP
2.7 MAF from Ground water
0.3 MAF from en route rivers
TOTAL 12.0 MAF (This gives water allowance of 550 mm at HR)
Envisaged use of Narmada water : (upto the year 2021)
Earmarked for municipal & industrial 1.06 MAF,
i.e., 1.307 BCM = 1.05 BCM for domestic & municipal +
0.257 BCM for industries
Portable water supply 18 districts;
6 cities;
131 towns, and
9633 villages

19
Agro Climatic Regions of Sardar Sarovar Project Command:
LEGEND:
ACR Name of Talukas
1 Naswadi, Sankheda, Waghodiya, Savli, Pavi-Jetpur, Halol, Kalol,
Jambughoda, Nandod, Tilakwada
2 Dabhoi, Vadodra, Sinor, Karjan, Padra,
3 Amod, Vagra, Bharuch, Jambusar
4 Amod, Vagra, Jambusar
5 Nadiad, Kapadvanj, Kathlal, Thasra, Matar, Memdavad,
Gandhinagar, Dehgam, Dascroi, Tarapur
6 Sanand, Viramgam, Kadi, Kalol
7 Dholka, Dhandhuka, Limbdi, Lakhtar, Vallbhipur, Bhavnagar
8 Dhandhuka, Limbdi, Lakhtar, Vadhvan, Vallbhipur, Botad,
Gadhda
9 Dhangadhra, Hadvad, Morbi, Maliya
10 Viramgam, Dasada, Chansama, Mahesana
11 Sami, Harij
12 Vav, Tharad, Diodar, Kankrej, Radhanpur, Santalpur
13 Anjar, Bhachau, Rapar, Mundra, Bhuj, Mandvi

20

21
Envisaged Delta, BDC & perspective crops promoting
conjunctive use in 13 ACRs:
ACR Allotted*
Delta
(mm)
BDC*
(lps/ha)
Perspective crops promoting Conjunctive use@
Summer after Rabi Summer after Kharif
1 417.62 0.70 Bajra, Groundnut,
Jowar, Vegetable Maize
2 531.63 0.70 Bajra, Groundnut,
Jowar, Vegetable Maize
3 412.71 0.70 Bajra, Groundnut,
Jowar, Vegetable,
Grass crop
Maize
4 281.49 0.43 Bajra, Groundnut,
Jowar, Vegetable,
Grass crop
Maize
5 555.64 0.70
Bajra, Paddy Bajra, Grass
6 441.80 0.65 Bajra, Groundnut,
Pulses, Hy. Bajra
Bajra, Groundnut,
Cow pea, Mug bean
7 258.40 0.45 Bajra, Wheat, Pulses,
Hy. Bajra Bajra, Pulses
8 362.17 0.60 Bajra, Wheat, Pulses,
Hy. Bajra Bajra, Pulses
9 398.67 0.60 Wheat, Pulses, Hy.
Bajra, Summer
Groundnut
Bajra, Pulses
10 388.93 0.60 Bajra, Groundnut,
Pulses, Hy. Bajra
Bajra, Groundnut,
Cow pea, Mug bean
11 224.43 0.45
Bajra, Grass Cluster bean
12 415.55 0.60
Bajra, Grass Cluster bean
13 464.04 0.60
Castor, Maize Bajra, Pulses
Source : * Planning for Prosperity, Sardar Sarovar Development Plan published by NPG,
SSNNL Edition: Nov.1989 statement 10.9, Page no. 371
22
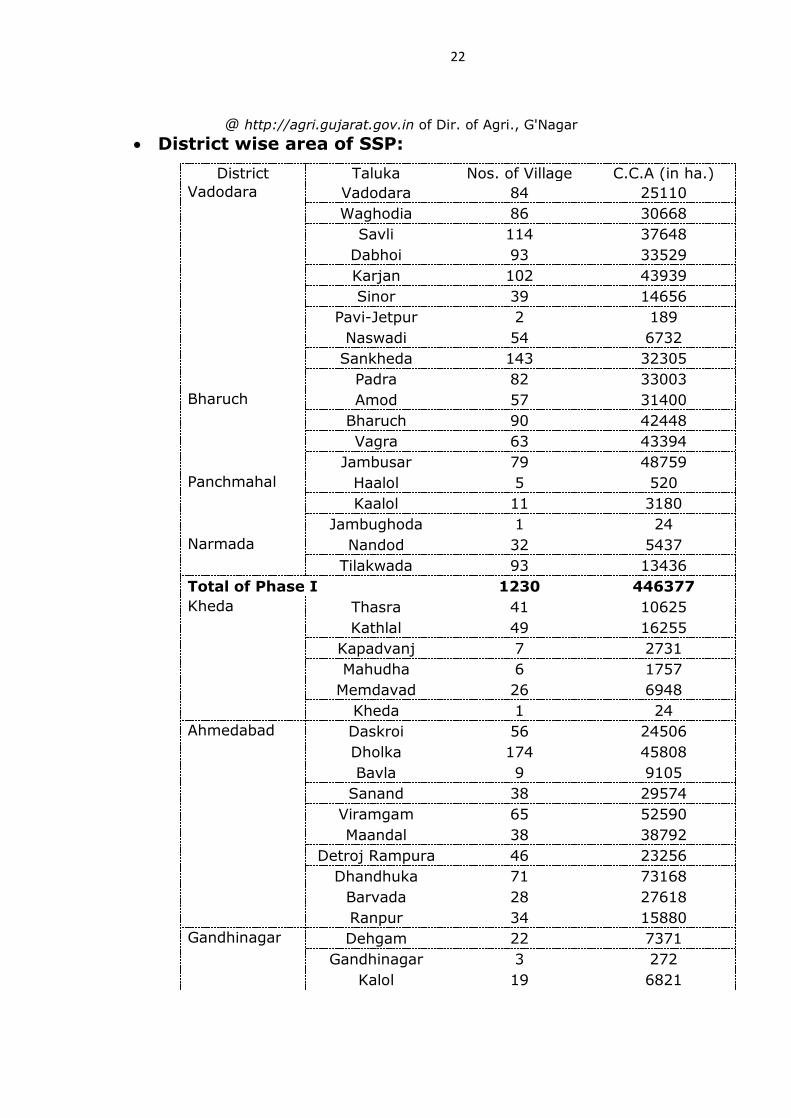
@ http://agri.gujarat.gov.in of Dir. of Agri., G'Nagar
District wise area of SSP:
District Taluka Nos. of Village C.C.A (in ha.)
Vadodara Vadodara 84 25110
Waghodia 86 30668
Savli 114 37648
Dabhoi 93 33529
Karjan 102 43939
Sinor 39 14656
Pavi-Jetpur 2 189
Naswadi 54 6732
Sankheda 143 32305
Padra 82 33003
Bharuch Amod 57 31400
Bharuch 90 42448
Vagra 63 43394
Jambusar 79 48759
Panchmahal Haalol 5 520
Kaalol 11 3180
Jambughoda 1 24
Narmada Nandod 32 5437
Tilakwada 93 13436
Total of Phase I 1230 446377
Kheda Thasra 41 10625
Kathlal 49 16255
Kapadvanj 7 2731
Mahudha 6 1757
Memdavad 26 6948
Kheda 1 24
Ahmedabad Daskroi 56 24506
Dholka 174 45808
Bavla 9 9105
Sanand 38 29574
Viramgam 65 52590
Maandal 38 38792
Detroj Rampura 46 23256
Dhandhuka 71 73168
Barvada 28 27618
Ranpur 34 15880
Gandhinagar Dehgam 22 7371
Gandhinagar 3 272
Kalol 19 6821

23
District Taluka Nos. of Village C.C.A (in ha.)
Anand Tarapur 1 122
Surendranagar Lakhtar 51 41828
Limbdi 66 65340
Dasada 164 93822.76
Wadhawan 46 26685
Dhangadhra 64 51661
Halvad 68 48150
Chuda 36 21297
Mahesana Kadi 89 38871
Bechraji 41 21128.27
Mahesana 4 1624
Patan Chanasama 15 6015.72
Harij 36 22619.79
Sami 106 92382.44
Radhanpur 55 35706.13
Santalpur 66 48364.30
Banaskantha Kankarej 25 13234.87
Bhabhar 49 32593.35
Deodar 5 1390
Tharad 42 21016.57
Vav 117 99751.67
Katchh Rapar 47 38560.04
Bhachau 33 25934.9
Bhuj 6 1343.34
Gandhidham 8 4134.72
Anjar 24 13367.16
Mundra 34 18239.7
Mandvi 30 11197.91
Rajkot Maliya 46 16512
Morbi 117 27991
Bhavnagar Vallbhipur 57 36708
Bhavnagar 59 8821
Botad 51 12399
Gadhada 74 2769
Umrala 41 4595
Total of Phase II 2506 1399277.64
Total of Command Area 3736 1845654.64