wrap-up of financing - mit opencourseware · wrap-up of financing katharina lewellen finance theory...
TRANSCRIPT

Wrap-up of FinancingKatharina LewellenFinance Theory IIMarch 11, 2003
Overview of Financing
Financial forecastingShort-run forecastingGeneral dynamics: Sustainable growth.
Capital structureDescribing a firm’s capital structureBenchmark: MM irrelevanceTheory 1: Static Trade-Off TheoryTheory 2: Pecking Order TheoryAn integrated approach
Note: Throughout we take “operations” as given.
2
Forecasting a Firm’s Funding Needs
Question: Given our operations (and the forecast thereof), will we need funding, and how much?
Short-run forecasting
General dynamics:The concept of sustainable growthCash Cows and Finance junkies
3
Financial Forecasting: General Approach
Need (a model of) the firm’s production functionUse available dataCommon senseSpecific knowledge of firm and industry
Given this model forecast all items in the balance sheet except “funding needs”
Infer the funding need from identity of Assets and Liabilities + Net Worth
4
Forecasting: Our approach
Forecast AssetsForecast non-bank liabilities, excluding Net WorthForecast Net Income
Assume some starting value for Bank Loan = “Bank Plug”Forecast interest using Bank Plug
Forecast Net WorthConsistency check: Assets = Liabilities + Net Worth?
If yes, stopIf not, adjust Bank Plug
Recall: All we want are rough approximations
5
General Dynamics
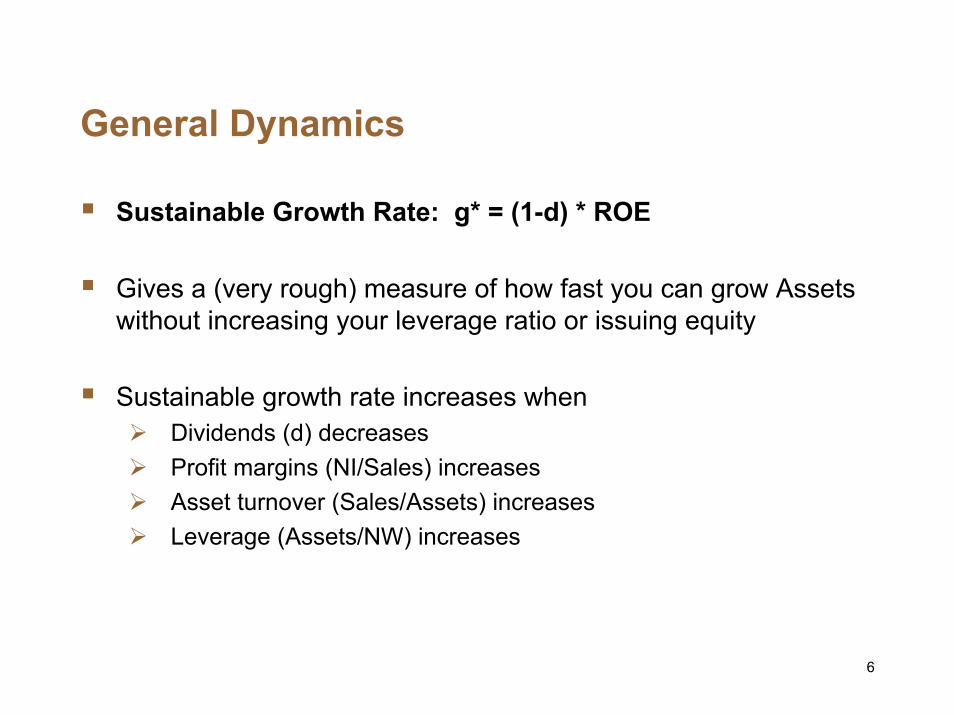
Sustainable Growth Rate: g* = (1-d) * ROE
Gives a (very rough) measure of how fast you can grow Assets without increasing your leverage ratio or issuing equity
Sustainable growth rate increases whenDividends (d) decreasesProfit margins (NI/Sales) increasesAsset turnover (Sales/Assets) increasesLeverage (Assets/NW) increases
6

Key Points
Key Point 0: The concept of sustainable growth does not tell you whether growing is good or not
Key Point 1: Sustainable growth is relevant only if you cannot or will not raise equity, and you cannot let D/E ratio increase
Key Point 2: Sustainable growth gives a quick idea of general dynamics: Cash cows (g << g*) or Finance junkies (g >> g*)
Key Point 3: Financial and business strategies cannot be set independently
7

Capital Structure
Describing a firm’s capital structure
MM theorem
Theory 1: Static Trade-off TheoryTax shield vs. Expected distress costs
Theory 2: Pecking Order TheoryImplications for investment Implications for capital structure
Pulling it all together
8

MM Theorem
MM: In frictionless markets, financial policy is irrelevant.
Finance Theory 1: Financial transactions are NPV=0. QED
Corollary: All the following are irrelevant:Capital structureLong- vs. short-term debtDividend policyRisk managementEtc.
9
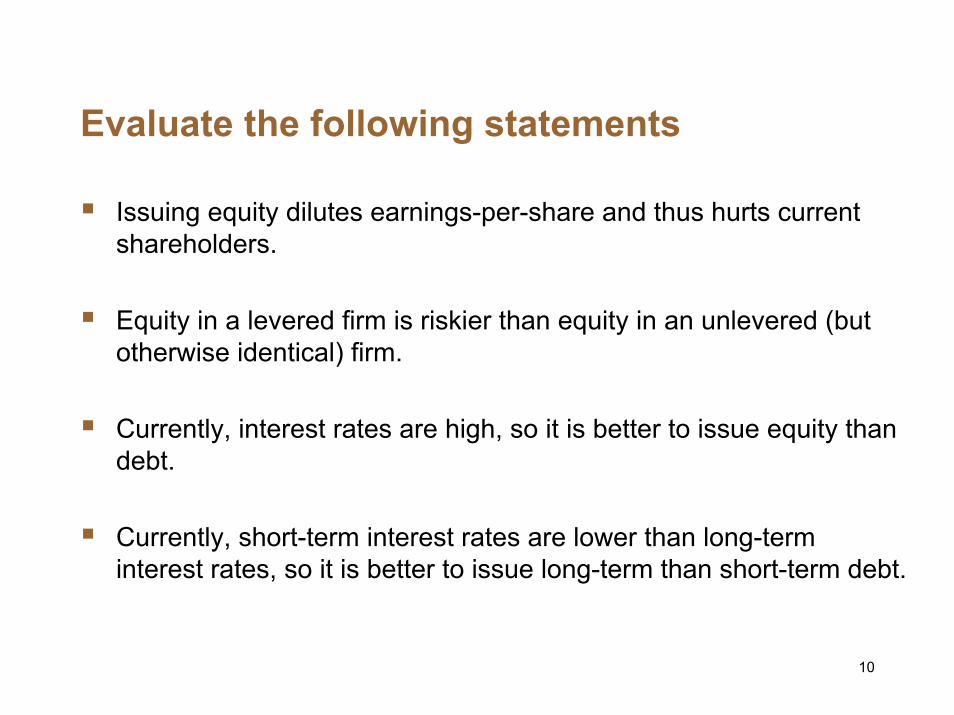
Evaluate the following statements
Issuing equity dilutes earnings-per-share and thus hurts current shareholders.
Equity in a levered firm is riskier than equity in an unlevered (but otherwise identical) firm.
Currently, interest rates are high, so it is better to issue equity than debt.
Currently, short-term interest rates are lower than long-term interest rates, so it is better to issue long-term than short-term debt.
10
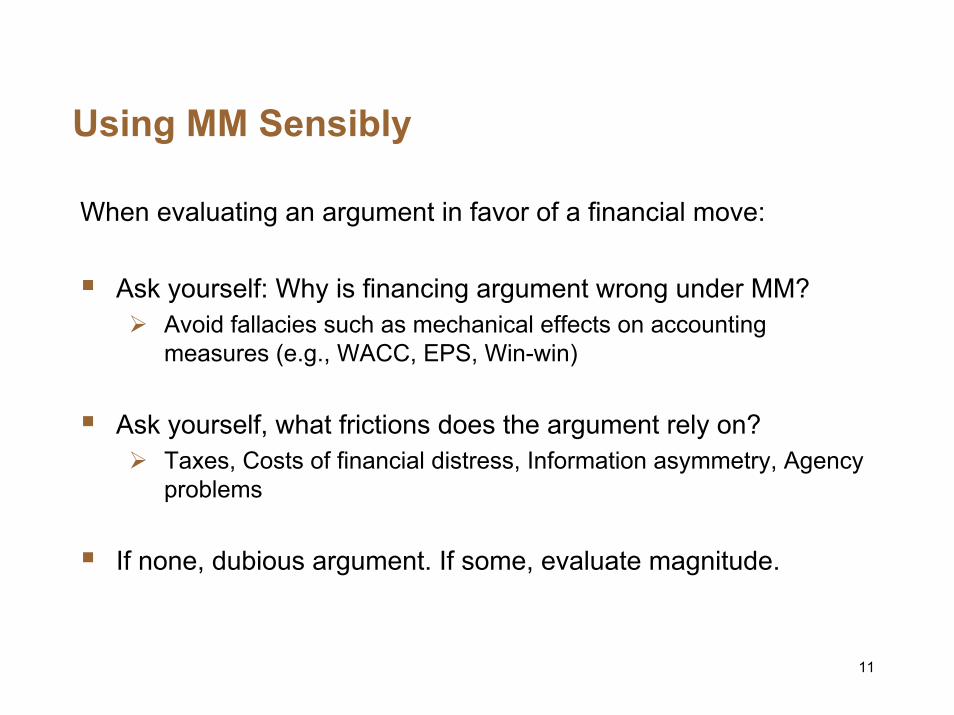
Using MM Sensibly
When evaluating an argument in favor of a financial move:
Ask yourself: Why is financing argument wrong under MM?Avoid fallacies such as mechanical effects on accounting measures (e.g., WACC, EPS, Win-win)
Ask yourself, what frictions does the argument rely on?Taxes, Costs of financial distress, Information asymmetry, Agency problems
If none, dubious argument. If some, evaluate magnitude.
11

Financing Choices
EquityDebt vs.
12

Theory 1: Static Trade-Off Theory
Talks about costs and benefits of Debt relative to Equity
The optimal target capital structure is determined by balancing
Tax Shield of Tax Shield of DebtDebt
Expected Costs Expected Costs of Fin. Distressof Fin. Distress
Note: The theory does not give you a precise target but rather a range, an order of magnitude.
13
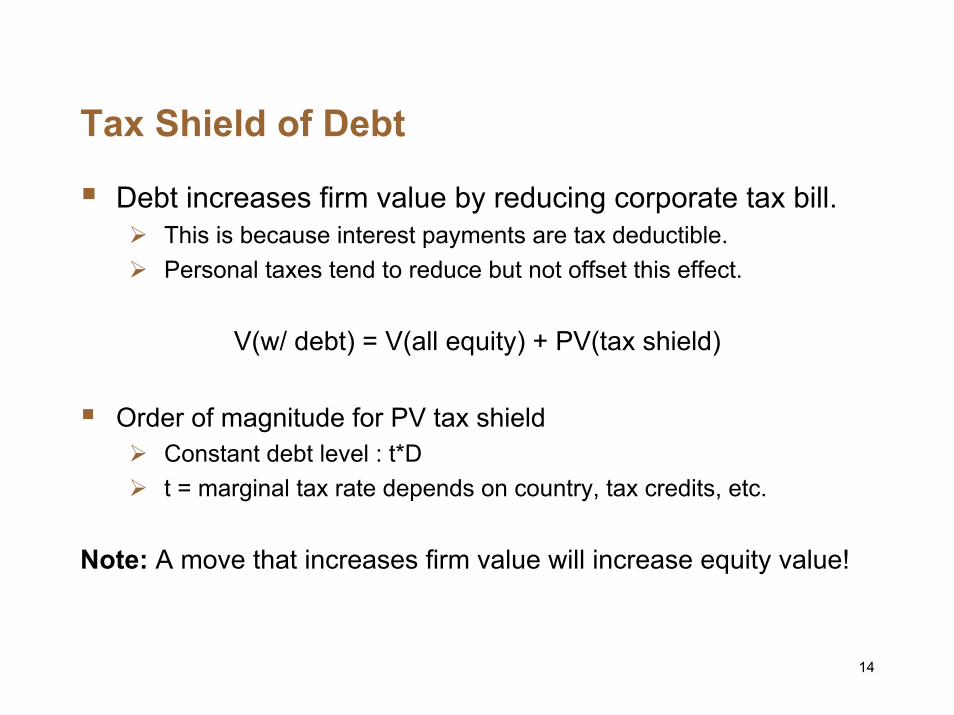
Tax Shield of Debt
Debt increases firm value by reducing corporate tax bill.This is because interest payments are tax deductible.Personal taxes tend to reduce but not offset this effect.
V(w/ debt) = V(all equity) + PV(tax shield)
Order of magnitude for PV tax shieldConstant debt level : t*Dt = marginal tax rate depends on country, tax credits, etc.
Note: A move that increases firm value will increase equity value!
14
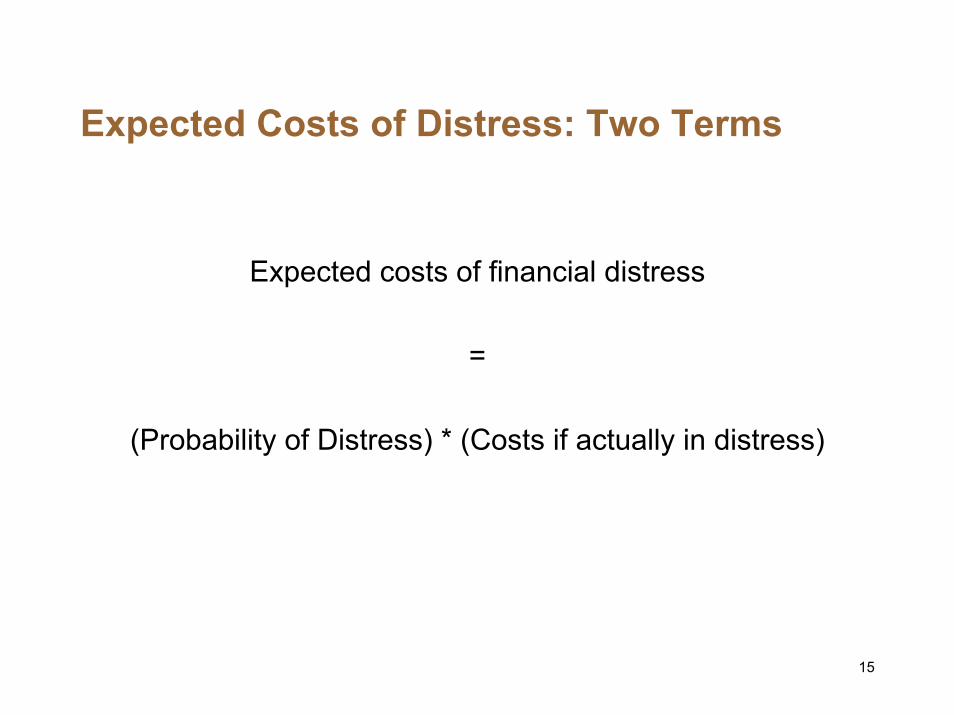
Expected Costs of Distress: Two Terms
Expected costs of financial distress
=
(Probability of Distress) * (Costs if actually in distress)
15

Probability of Distress
Cashflow volatilityIs industry risky? Is firm’s strategy risky?Are there uncertainties induced by competition?Is there a risk of technological change?Sensitive to macroeconomic shocks, seasonal fluctuations?Etc.
Use past data but also knowledge of industry.
Beware of changes of environment.
16
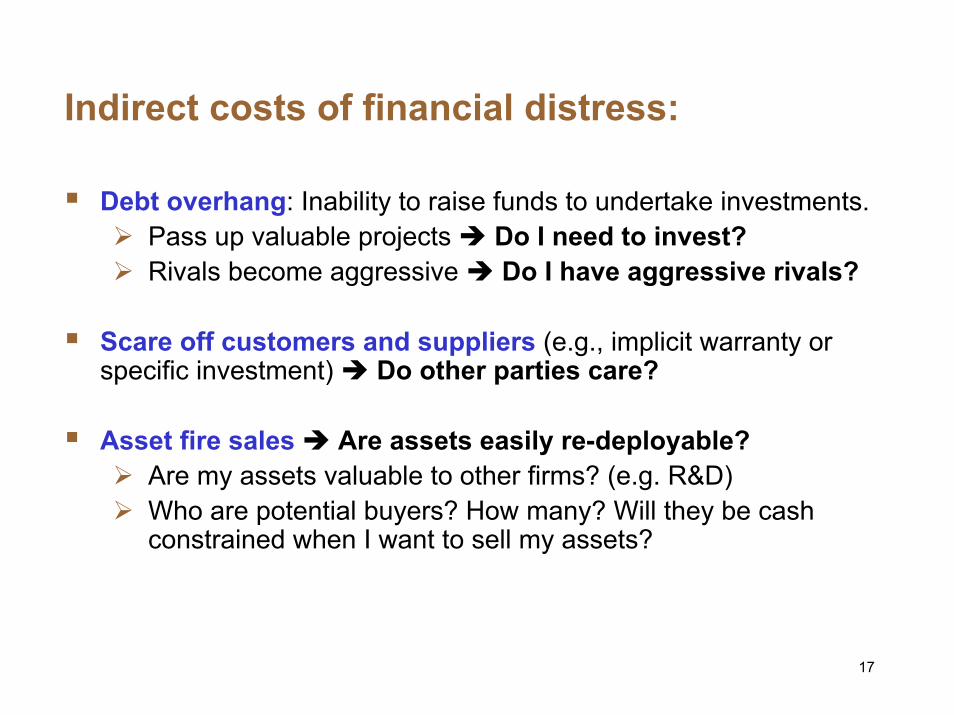
Indirect costs of financial distress:
Debt overhang: Inability to raise funds to undertake investments.Pass up valuable projects Do I need to invest?Rivals become aggressive Do I have aggressive rivals?
Scare off customers and suppliers (e.g., implicit warranty or specific investment) Do other parties care?
Asset fire sales Are assets easily re-deployable?Are my assets valuable to other firms? (e.g. R&D)Who are potential buyers? How many? Will they be cash constrained when I want to sell my assets?
17
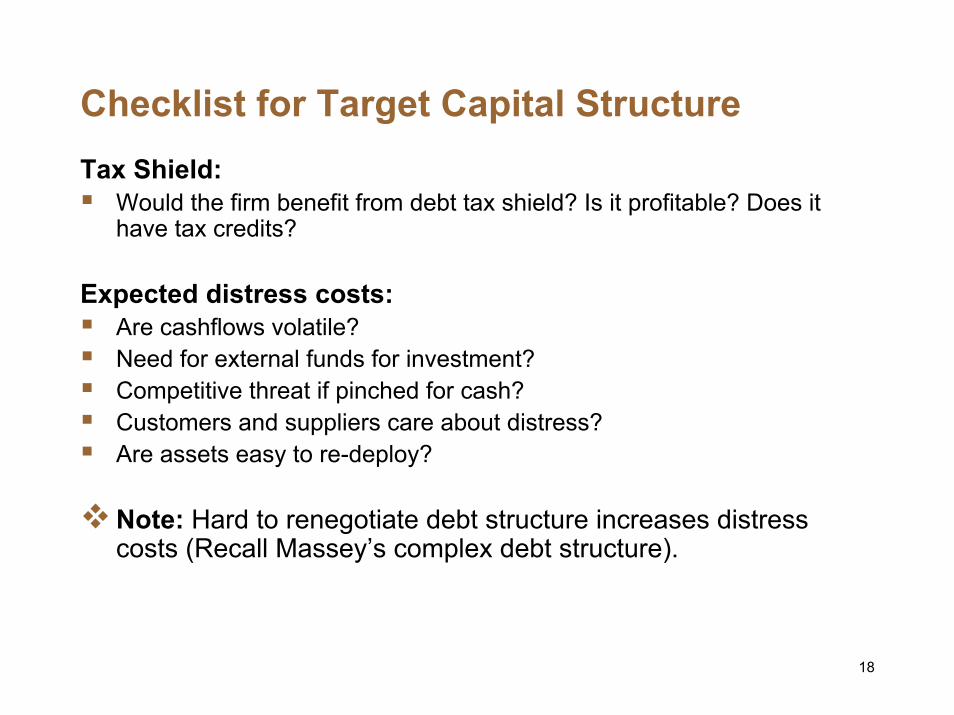
Checklist for Target Capital StructureTax Shield:
Would the firm benefit from debt tax shield? Is it profitable? Does it have tax credits?
Expected distress costs:Are cashflows volatile?Need for external funds for investment?Competitive threat if pinched for cash?Customers and suppliers care about distress?Are assets easy to re-deploy?
Note: Hard to renegotiate debt structure increases distress costs (Recall Massey’s complex debt structure).
18
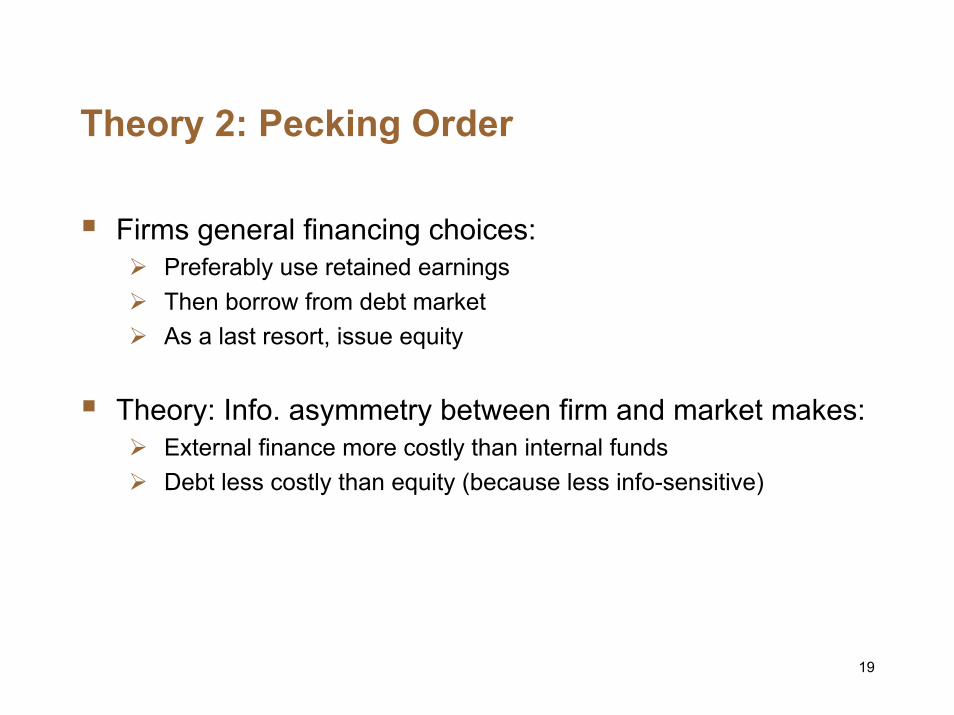
Theory 2: Pecking Order
Firms general financing choices:Preferably use retained earningsThen borrow from debt marketAs a last resort, issue equity
Theory: Info. asymmetry between firm and market makes:External finance more costly than internal fundsDebt less costly than equity (because less info-sensitive)
19
Implications for Investment
The value of a project depends on how it is financed.
Some projects will be undertaken only if funded internally or with relatively safe debt but not if financed with risky debt or equity.
Companies with less cash and more leverage will be more prone to under-invest.
Rationale for hoarding cash.
20

Implications for Capital Structure
If a firm follows the Pecking Order, its leverage ratio results from a series of incremental decisions, not attempt to reach a target.
High cash flow ==> Leverage ratio decreasesLow cash flow ==> Leverage ratio increases
There may be good and bad times to issue equity depending on the degree of information asymmetry.
Rationale for hybrid instruments.
21

What Do We Do With Two Theories?
Sometimes, both theories will give the same recommendation
But sometimes, they will differ
Consider Massey Ferguson:Static Trade-off theory ==> Equity issuePecking Order Theory ==> Debt issue
Two questions:Is one theory better at describing what firms do?Is one theory better at telling what they should be doing?
22

But As a Prescriptive Theory?
If firms use Pecking order blindly and ignore static trade-off:
Cash cows will end up with too little leverage (UST).Good news: Never too late to lever-up
Finance junkies will end up with too much leverage (Massey)Bad news: It can be too late to unlever (debt-overhang).ST debt is temporary relief but worsens things in fine.
23

DON'T TALK TO DEERE & COMPANY ABOUT MARKET SIGNALING (from Higgins)
(Please see “Don’t Talk to Deere & Company About Market Signaling” from the course textbook by Higgins.)
24
An Integrative Approach
Each theory makes a statement about what is first order issue:STO: Tax shield and Distress costsPO: Information ( Price of claims you issue)
Both theories need not be incompatible:Use each when you think they emphasize the right issues
When getting far away from target, STO type issues dominate
When reasonably close to target, PO type issues dominate
25

An Integrative Approach (cont.)
Establish long-run “target” capital structure
Evaluate the true economic costs of issuing equityWhat is real cost of price hit vs. foregone investment or increase
in expected cost of distress.
If still reluctant to issue equity:Are there ways to reduce the cost? (e.g., give information)Will the cost be lower if you issue later?Can you use hybrids and packages to get there? But be careful. (Recall MCI might get stuck with too much debt)
26

An Integrative Approach (cont.)
Straying from target may be warranted. But, be as systematic and precise as possible about justification -- Are benefits from straying plausibly large relative to costs?
Remember: Lion’s share of value is created on LHS. Don’t want to endanger operations. Beware excessive leverage. Ultimately, business strategy should drive financial strategy, not the otherway around.
Avoid rules of thumb like: ''Never issue in a down market''; or ''Don't knock props out from under stock.'' These may make sense in some, but certainly not all circumstances.
27
Conclusion
The bulk of the value is created on the LHS by making good investment decisions.
You can destroy much value by mismanaging your RHS: Financial policy should be supporting your business strategy.
You cannot make sound financial decisions without knowing the implications for the business.
Finance is too serious to leave it to finance people.
28

Apex Drugs and Products
1988 1989 1990 1991 1992Sales 2,471.7 2,685.1 3,062.6 3,406.3 3,798.5 Net income 277.9 306.2 348.4 396.0 445.9 EPS 1.75 1.94 2.21 2.51 2.84 DPS 1.00 1.15 1.33 1.50 1.70 Cash 358.8 322.9 436.6 493.8 593.3 Total assets 1,510.9 1,611.3 1,862.2 2,090.7 2,370.3 A/P and other non-interest bearing liabilities 511.60 565.70 670.50 758.40 883.60
Long-term + short-term debt 7.8 10.3 13.7 10.3 13.9 Net worth 991.5 1,035.3 1,178.0 1,322.0 1,472.8
29

Describe Apex’s capital structure.What are the likely factors that led to this capital structure.
Different measures of leverage should give you a similar picture:
1988 1989 1990 1991 1992Cash 358.8 322.9 436.6 493.8 593.3 Total assets 1,510.9 1,611.3 1,862.2 2,090.7 2,370.3 Long-term + short-term debt 7.8 10.3 13.7 10.3 13.9 Net worth 991.5 1,035.3 1,178.0 1,322.0 1,472.8 D/(D+NW) 1% 1% 1% 1% 1%D/(Total Assets) 1% 1% 1% 0% 1%(D-Cash)/(Total Assets) -23% -19% -23% -23% -24%
30
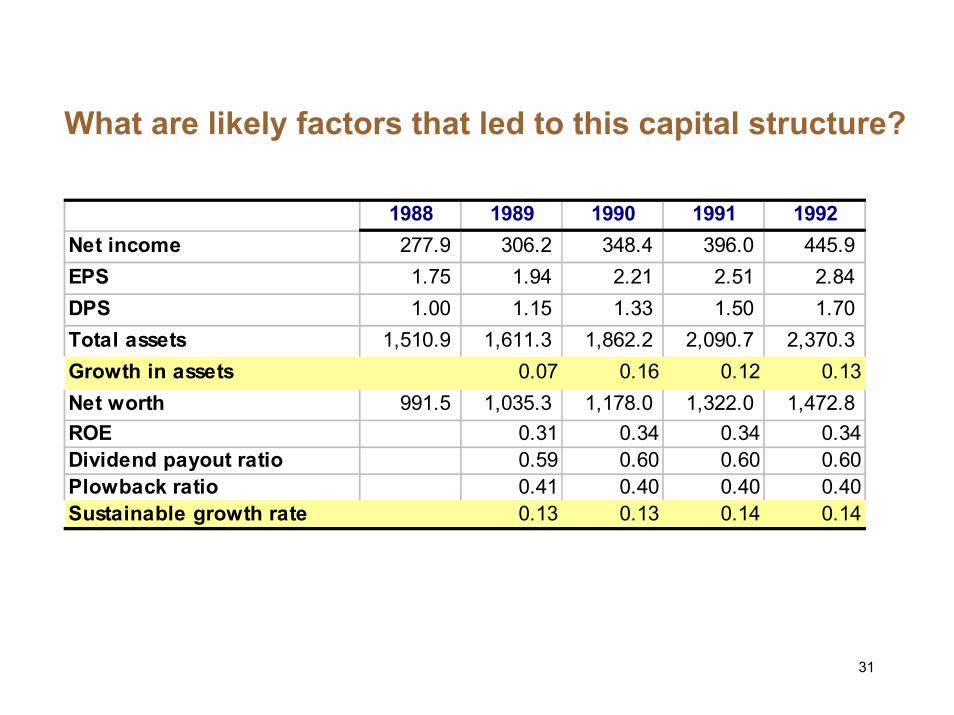
What are likely factors that led to this capital structure?
1988 1989 1990 1991 1992Net income 277.9 306.2 348.4 396.0 445.9 EPS 1.75 1.94 2.21 2.51 2.84 DPS 1.00 1.15 1.33 1.50 1.70 Total assets 1,510.9 1,611.3 1,862.2 2,090.7 2,370.3 Growth in assets 0.07 0.16 0.12 0.13Net worth 991.5 1,035.3 1,178.0 1,322.0 1,472.8 ROE 0.31 0.34 0.34 0.34Dividend payout ratio 0.59 0.60 0.60 0.60Plowback ratio 0.41 0.40 0.40 0.40Sustainable growth rate 0.13 0.13 0.14 0.14
31

What are likely factors that led to this capital structure?
In most years, assets grew slower than the sustainable rateRetained earnings more than covered the investment needsApex never had to raise outside fundsA classic “cash cow”
What explains the high sustainable rate?High profit margins and asset turnover offset the mechanical effect of low leverage and the high payout ratios
Apex management has not attempt to voluntarily increase leverage
32
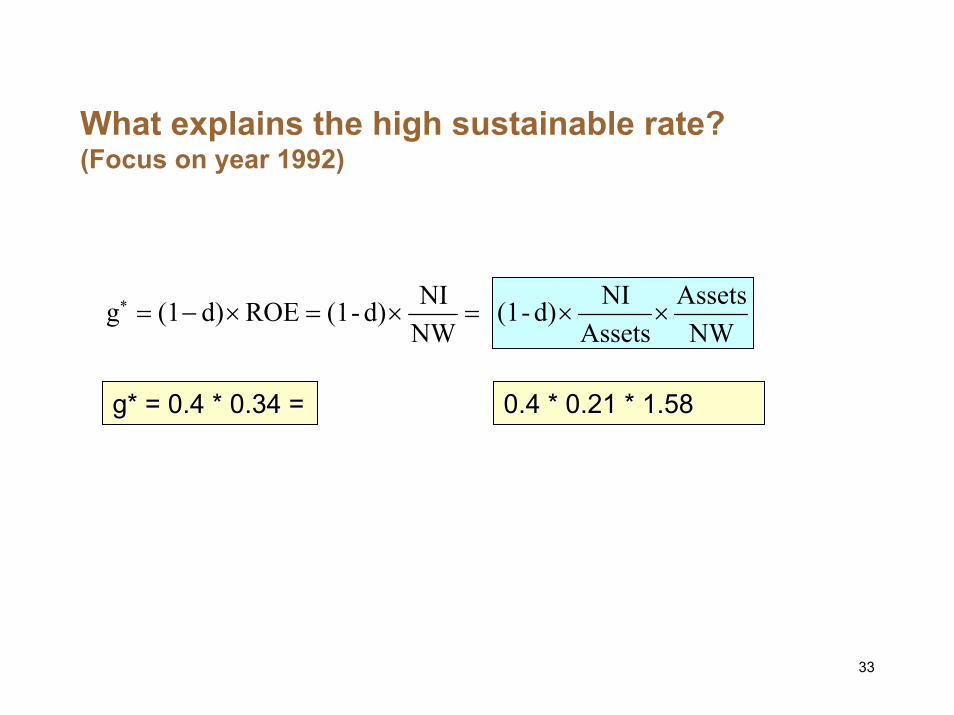
What explains the high sustainable rate?(Focus on year 1992)
NWAssets
AssetsNId)-(1 ××=×=×−=∗
NWNId)-(1ROEd)(1g
g* = 0.4 * 0.34 =g* = 0.4 * 0.34 = 0.4 * 0.21 * 1.580.4 * 0.21 * 1.58
33

What explains the high sustainable rate?(Focus on year 1992)
NWAssets
AssetsNId)-(1 ××=×=×−=∗
NWNId)-(1ROEd)(1g
g* = 0.4 * 0.34 =g* = 0.4 * 0.34 = 0.4 * 0.21 * 1.580.4 * 0.21 * 1.58
Turnover AssetMargin Profit
AssetsSales
SalesNI
AssetsNIROA ×==
ROA= 0.12 * 1.82ROA= 0.12 * 1.82
34
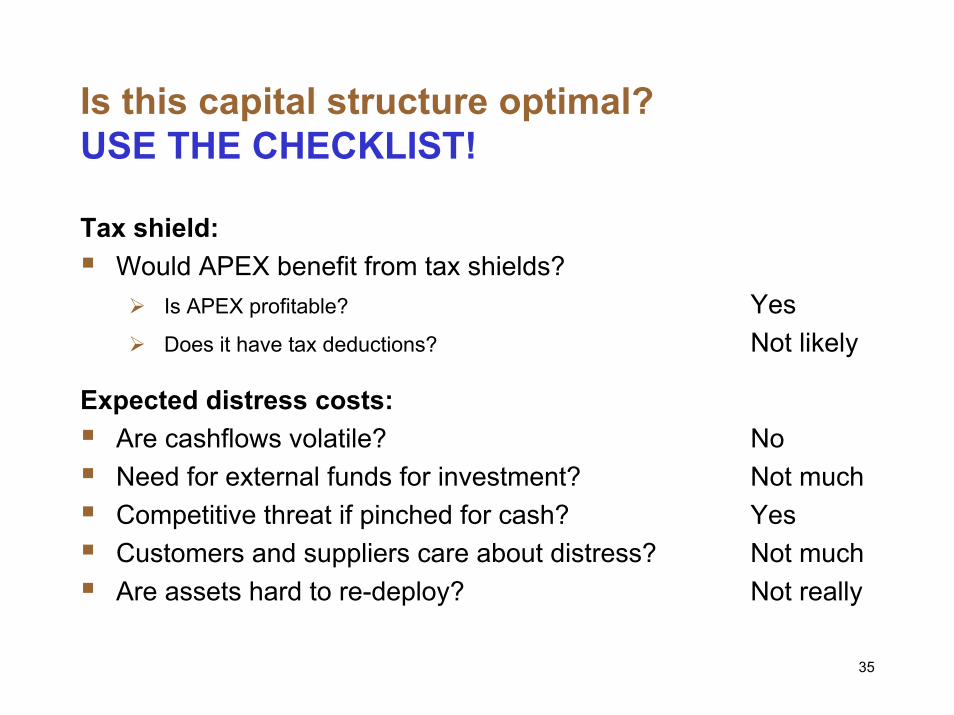
Is this capital structure optimal?USE THE CHECKLIST!
Tax shield:Would APEX benefit from tax shields?
Is APEX profitable? YesDoes it have tax deductions? Not likely
Expected distress costs:Are cashflows volatile? NoNeed for external funds for investment? Not muchCompetitive threat if pinched for cash? YesCustomers and suppliers care about distress? Not muchAre assets hard to re-deploy? Not really
35

Apex’s capital structure in 1993?Sales will grow at 11%. Profit margin will fall to 7%.
1992 1993Sales 3,799 4,216 Net income 446 295 Profit margin 0 0.07 Retained earnings 178 118 NW (NW 1993 + Retained earnings 1994) 1,473 1,591 Cash (remains constant) 593 593 Total assets (all other assets grow at 11%) 2,370 2,566 A/P and other non-interest bearing liabilities (grow at 11%)
884 981
Bank plug (Total assets - NW - A/P) 14 (6)
External funding needs = External funding needs = --6 6 –– 14 = 14 = --2020=> Apex has => Apex has excess internal funds of 20excess internal funds of 20..
36

Apex’s target capital structure in the long run?
More uncertaintyPotential regulationTechnological change
More competitive pressureRegulation may favor competition in generic drugs
Apex needs to invest moreAdvances in biotechnology => more R&D required
Less internally generated fundsPatents expire
Bottom line: Lower target leverage.
37