wto 2000 - world trade organization · 2001-10-24 · wto 2000 international trade statistics 2000....
TRANSCRIPT

WTO
200
0
Internationaltrade statistics2000

AlbaniaAngolaAntigua and BarbudaArgentinaAustraliaAustriaBahrainBangladeshBarbadosBelgiumBelizeBeninBoliviaBotswanaBrazilBrunei DarussalamBulgariaBurkina FasoBurundiCameroonCanadaCentral African Rep.ChadChileColombiaCongoCongo, Dem. Rep. of theCosta RicaCôte d’IvoireCubaCyprusCzech RepublicDenmarkDjiboutiDominicaDominican RepublicEcuadorEgyptEl SalvadorEstoniaEuropean CommunitiesFijiFinlandFranceGabonGambia
GeorgiaGermanyGhanaGreeceGrenadaGuatemalaGuinea BissauGuinea, Rep. ofGuyanaHaitiHondurasHong Kong, ChinaHungaryIcelandIndiaIndonesiaIrelandIsraelItalyJamaicaJapanJordanKenyaKorea, Rep. ofKuwaitKyrgyz RepublicLatviaLesothoLiechtensteinLuxembourgMacau, ChinaMadagascarMalawiMalaysiaMaldivesMaliMaltaMauritaniaMauritiusMexicoMongoliaMoroccoMozambiqueMyanmarNamibiaNetherlands
New ZealandNicaraguaNigerNigeriaNorwayPakistanPanamaPapua New GuineaParaguayPeruPhilippinesPolandPortugalQatarRomaniaRwandaSt. Kitts and NevisSt. LuciaSt. Vincent & the GrenadinesSenegalSierra LeoneSingaporeSlovak RepublicSloveniaSolomon IslandsSouth AfricaSpainSri LankaSurinameSwazilandSwedenSwitzerlandTanzaniaThailandTogoTrinidad and TobagoTunisiaTurkeyUgandaUnited Arab EmiratesUnited KingdomUnited StatesUruguayVenezuelaZambiaZimbabwe
WTO Members(As of 8 September 2000)
This report is also available in French and Spanish(Price : SFr 50, one volume)
To order, please contact :WTO PublicationsWorld Trade Organization154, rue de LausanneCH-1211 Geneva 21Tel : (41 22) 739 52 08 or 53 08Fax : (41 22) 739 54 58Email : [email protected]
ISSN 0072-064XISBN 92-870-1216-4Printed in FranceXI-2000-3000© World Trade Organization 2000

iii
Table of Contents
Overview . . . . . . . . . . . . . . . . . . . . . . . . . . . . . . . . . . . . . . . . . . . . . . . . . . . . . . . . . . . . . . . . . . . . . . . . . . . . . . . . . . . . . . . . . 1
1. Main features of trade developments in 1999 . . . . . . . . . . . . . . . . . . . . . . . . . . . . . . . . . . . . . . . . . . . . . . . . . . . . . . . . . . . 12. Trade developments in the first half of 2000 and outlook . . . . . . . . . . . . . . . . . . . . . . . . . . . . . . . . . . . . . . . . . . . . . . . . . . . 23. Global trade and output developments. . . . . . . . . . . . . . . . . . . . . . . . . . . . . . . . . . . . . . . . . . . . . . . . . . . . . . . . . . . . . . . . . 34. Merchandise trade by product . . . . . . . . . . . . . . . . . . . . . . . . . . . . . . . . . . . . . . . . . . . . . . . . . . . . . . . . . . . . . . . . . . . . . . . 35. Commercial services trade in 1999. . . . . . . . . . . . . . . . . . . . . . . . . . . . . . . . . . . . . . . . . . . . . . . . . . . . . . . . . . . . . . . . . . . . 56. Trade by region . . . . . . . . . . . . . . . . . . . . . . . . . . . . . . . . . . . . . . . . . . . . . . . . . . . . . . . . . . . . . . . . . . . . . . . . . . . . . . . . . . 5
I. World trade in 1999 – Overview . . . . . . . . . . . . . . . . . . . . . . . . . . . . . . . . . . . . . . . . . . . . . . . . . . . . . . . . . . . . . . . . 17
II. Selected long-term trends . . . . . . . . . . . . . . . . . . . . . . . . . . . . . . . . . . . . . . . . . . . . . . . . . . . . . . . . . . . . . . . . . . . . . 25
III. Trade by region . . . . . . . . . . . . . . . . . . . . . . . . . . . . . . . . . . . . . . . . . . . . . . . . . . . . . . . . . . . . . . . . . . . . . . . . . . . . . . . 35
1. Overview . . . . . . . . . . . . . . . . . . . . . . . . . . . . . . . . . . . . . . . . . . . . . . . . . . . . . . . . . . . . . . . . . . . . . . . . . . . . . . . . . . . . . . . 352. North America . . . . . . . . . . . . . . . . . . . . . . . . . . . . . . . . . . . . . . . . . . . . . . . . . . . . . . . . . . . . . . . . . . . . . . . . . . . . . . . . . . . 413. Latin America. . . . . . . . . . . . . . . . . . . . . . . . . . . . . . . . . . . . . . . . . . . . . . . . . . . . . . . . . . . . . . . . . . . . . . . . . . . . . . . . . . . . 494. Western Europe . . . . . . . . . . . . . . . . . . . . . . . . . . . . . . . . . . . . . . . . . . . . . . . . . . . . . . . . . . . . . . . . . . . . . . . . . . . . . . . . . . 575. Central and Eastern Europe, the Baltic States and the CIS (transition economies) . . . . . . . . . . . . . . . . . . . . . . . . . . . . . . . . . 666. Africa. . . . . . . . . . . . . . . . . . . . . . . . . . . . . . . . . . . . . . . . . . . . . . . . . . . . . . . . . . . . . . . . . . . . . . . . . . . . . . . . . . . . . . . . . . 737. Middle East . . . . . . . . . . . . . . . . . . . . . . . . . . . . . . . . . . . . . . . . . . . . . . . . . . . . . . . . . . . . . . . . . . . . . . . . . . . . . . . . . . . . . 778. Asia . . . . . . . . . . . . . . . . . . . . . . . . . . . . . . . . . . . . . . . . . . . . . . . . . . . . . . . . . . . . . . . . . . . . . . . . . . . . . . . . . . . . . . . . . . . 80
IV. Trade by sector . . . . . . . . . . . . . . . . . . . . . . . . . . . . . . . . . . . . . . . . . . . . . . . . . . . . . . . . . . . . . . . . . . . . . . . . . . . . . . . . 93
1. Overview . . . . . . . . . . . . . . . . . . . . . . . . . . . . . . . . . . . . . . . . . . . . . . . . . . . . . . . . . . . . . . . . . . . . . . . . . . . . . . . . . . . . . . . 932. Agricultural products . . . . . . . . . . . . . . . . . . . . . . . . . . . . . . . . . . . . . . . . . . . . . . . . . . . . . . . . . . . . . . . . . . . . . . . . . . . . . . 952. 2.1 Food . . . . . . . . . . . . . . . . . . . . . . . . . . . . . . . . . . . . . . . . . . . . . . . . . . . . . . . . . . . . . . . . . . . . . . . . . . . . . . . . . . . . . . . 1003. Mining products. . . . . . . . . . . . . . . . . . . . . . . . . . . . . . . . . . . . . . . . . . . . . . . . . . . . . . . . . . . . . . . . . . . . . . . . . . . . . . . . . . 1042. 3.1 Fuels. . . . . . . . . . . . . . . . . . . . . . . . . . . . . . . . . . . . . . . . . . . . . . . . . . . . . . . . . . . . . . . . . . . . . . . . . . . . . . . . . . . . . . . 1064. Manufactures. . . . . . . . . . . . . . . . . . . . . . . . . . . . . . . . . . . . . . . . . . . . . . . . . . . . . . . . . . . . . . . . . . . . . . . . . . . . . . . . . . . . 1102. 4.1 Iron and steel . . . . . . . . . . . . . . . . . . . . . . . . . . . . . . . . . . . . . . . . . . . . . . . . . . . . . . . . . . . . . . . . . . . . . . . . . . . . . . . . 1162. 4.2 Chemicals . . . . . . . . . . . . . . . . . . . . . . . . . . . . . . . . . . . . . . . . . . . . . . . . . . . . . . . . . . . . . . . . . . . . . . . . . . . . . . . . . . . 1202. 4.3 Machinery and transport equipment . . . . . . . . . . . . . . . . . . . . . . . . . . . . . . . . . . . . . . . . . . . . . . . . . . . . . . . . . . . . . . . 1232. 4.3 Office machines and telecom equipment . . . . . . . . . . . . . . . . . . . . . . . . . . . . . . . . . . . . . . . . . . . . . . . . . . . . . . . . . . . . 1282. 4.3 Automative products. . . . . . . . . . . . . . . . . . . . . . . . . . . . . . . . . . . . . . . . . . . . . . . . . . . . . . . . . . . . . . . . . . . . . . . . . . . 1352. 4.4 Textiles . . . . . . . . . . . . . . . . . . . . . . . . . . . . . . . . . . . . . . . . . . . . . . . . . . . . . . . . . . . . . . . . . . . . . . . . . . . . . . . . . . . . . 1412. 4.5 Clothing . . . . . . . . . . . . . . . . . . . . . . . . . . . . . . . . . . . . . . . . . . . . . . . . . . . . . . . . . . . . . . . . . . . . . . . . . . . . . . . . . . . . 1485. Commercial services. . . . . . . . . . . . . . . . . . . . . . . . . . . . . . . . . . . . . . . . . . . . . . . . . . . . . . . . . . . . . . . . . . . . . . . . . . . . . . . 1552. 5.1 Transportation services . . . . . . . . . . . . . . . . . . . . . . . . . . . . . . . . . . . . . . . . . . . . . . . . . . . . . . . . . . . . . . . . . . . . . . . . . 1552. 5.2 Travel services . . . . . . . . . . . . . . . . . . . . . . . . . . . . . . . . . . . . . . . . . . . . . . . . . . . . . . . . . . . . . . . . . . . . . . . . . . . . . . . . 1572. 5.3 Other commercial services . . . . . . . . . . . . . . . . . . . . . . . . . . . . . . . . . . . . . . . . . . . . . . . . . . . . . . . . . . . . . . . . . . . . . . . 159
Appendix tables. . . . . . . . . . . . . . . . . . . . . . . . . . . . . . . . . . . . . . . . . . . . . . . . . . . . . . . . . . . . . . . . . . . . . . . . . . . . . . . . . . . 161
Technical Notes . . . . . . . . . . . . . . . . . . . . . . . . . . . . . . . . . . . . . . . . . . . . . . . . . . . . . . . . . . . . . . . . . . . . . . . . . . . . . . . . . . . 209

v
List of tables and charts
Overview
Chart 1 Merchandise trade by selected region, 1999. . . . . . . . . . . . . . . . . . . . . . . . . . . . . . . . . . . . . . . . . . . . . . . . . . . 1Chart 2 World merchandise trade and output growth by major product group, 1999. . . . . . . . . . . . . . . . . . . . . . . . . . . 3Chart 3 World merchandise trade by product, 1999 . . . . . . . . . . . . . . . . . . . . . . . . . . . . . . . . . . . . . . . . . . . . . . . . . . . 4Chart 4 Commercial services trade by selected region, 1999 . . . . . . . . . . . . . . . . . . . . . . . . . . . . . . . . . . . . . . . . . . . . . 5Table 1 GDP and trade developments in North America, 1990-99 . . . . . . . . . . . . . . . . . . . . . . . . . . . . . . . . . . . . . . . . . 6Chart 5 Latin America. Merchandise trade by country, 1990-99 . . . . . . . . . . . . . . . . . . . . . . . . . . . . . . . . . . . . . . . . . . . 7Table 2 GDP and trade developments in Latin America, 1990-99 . . . . . . . . . . . . . . . . . . . . . . . . . . . . . . . . . . . . . . . . . 8Table 3 GDP and trade developments in Western Europe, 1990-99 . . . . . . . . . . . . . . . . . . . . . . . . . . . . . . . . . . . . . . . . 8Chart 6 Western Europe. Merchandise trade by country, 1990-99 . . . . . . . . . . . . . . . . . . . . . . . . . . . . . . . . . . . . . . . . . 9Table 4 GDP and trade developments in transition economies, 1995-99 . . . . . . . . . . . . . . . . . . . . . . . . . . . . . . . . . . . . 10Chart 7 Transition economies. Merchandise trade by country, 1995-99 . . . . . . . . . . . . . . . . . . . . . . . . . . . . . . . . . . . . . 11Table 5 GDP and trade developments in Africa, 1990-99 . . . . . . . . . . . . . . . . . . . . . . . . . . . . . . . . . . . . . . . . . . . . . . . 12Chart 8 Africa. Merchandise trade by country, 1990-99. . . . . . . . . . . . . . . . . . . . . . . . . . . . . . . . . . . . . . . . . . . . . . . . . 13Chart 9 Middle East. Merchandise trade by country, 1990-99 . . . . . . . . . . . . . . . . . . . . . . . . . . . . . . . . . . . . . . . . . . . . 14Table 6 Trade developments in the Middle East, 1990-99 . . . . . . . . . . . . . . . . . . . . . . . . . . . . . . . . . . . . . . . . . . . . . . . 15Table 7 GDP and trade developments in Asia, 1990-99. . . . . . . . . . . . . . . . . . . . . . . . . . . . . . . . . . . . . . . . . . . . . . . . . 15Chart 10 Asia. Merchandise trade by country, 1990-99 . . . . . . . . . . . . . . . . . . . . . . . . . . . . . . . . . . . . . . . . . . . . . . . . . . 16
I. World trade in 1999 – Overview
Table I.1 Growth in the volume of world merchandise exports and production by major product group, 1990-99 . . . . . . 17Table I.2 Growth in the volume of world merchandise trade by selected region, 1990-99 . . . . . . . . . . . . . . . . . . . . . . . . 17Table I.3 Growth in the value of world merchandise trade by region, 1999 . . . . . . . . . . . . . . . . . . . . . . . . . . . . . . . . . . . 18Table I.4 Growth in the value of world trade in commercial services by selected region, 1999 . . . . . . . . . . . . . . . . . . . . . 18Table I.5 Leading exporters and importers in world merchandise trade, 1999 . . . . . . . . . . . . . . . . . . . . . . . . . . . . . . . . . 19Table I.6 Leading exporters and importers in world merchandise trade (excluding intra-EU trade), 1999 . . . . . . . . . . . . . 20Table I.7 Leading exporters and importers in world trade in commercial services, 1999 . . . . . . . . . . . . . . . . . . . . . . . . . . 21Table I.8 Share of goods and commercial services in the total trade of selected regions and economies, 1999. . . . . . . . . 22Table I.9 Merchandise trade of selected regional integration arrangements, 1999 . . . . . . . . . . . . . . . . . . . . . . . . . . . . . . 23
II. Selected long-term trends
Chart II.1 World merchandise trade and output by major product group, 1950-99 . . . . . . . . . . . . . . . . . . . . . . . . . . . . . . 25Chart II.2 World merchandise trade by major product group, 1950-99 . . . . . . . . . . . . . . . . . . . . . . . . . . . . . . . . . . . . . . . 26Table II.1 World merchandise exports, production and gross domestic product, 1950-99 . . . . . . . . . . . . . . . . . . . . . . . . . 27Table II.2 World merchandise trade by region and selected economy, 1948-99 . . . . . . . . . . . . . . . . . . . . . . . . . . . . . . . . 28Table II.3 Merchandise trade of North America by region and by product, 1963, 1973, 1983, 1993 and 1999 . . . . . . . . . 29Table II.4 Merchandise trade of Western Europe by region and by product, 1963, 1973, 1983, 1993 and 1999 . . . . . . . . 30Table II.5 Merchandise trade of Japan by region and by product, 1963, 1973, 1983, 1993 and 1999 . . . . . . . . . . . . . . . 31Table II.6 Merchandise exports of selected regions and economies to the least-developed countries, 1980-99 . . . . . . . . . 32Table II.7 Merchandise imports of selected regions and economies from the least-developed countries, 1980-99 . . . . . . . 33
III. Trade by region
1. Overview
Chart III.1 Value of world merchandise trade by region, 1992-99 . . . . . . . . . . . . . . . . . . . . . . . . . . . . . . . . . . . . . . . . . . . 35Chart III.2 Volume of world merchandise trade by selected region, 1992-99 . . . . . . . . . . . . . . . . . . . . . . . . . . . . . . . . . . . 36Table III.1 World merchandise exports by region, 1999 . . . . . . . . . . . . . . . . . . . . . . . . . . . . . . . . . . . . . . . . . . . . . . . . . . . 37Table III.2 World merchandise imports by region, 1999. . . . . . . . . . . . . . . . . . . . . . . . . . . . . . . . . . . . . . . . . . . . . . . . . . . 37Table III.3 Intra- and inter-regional merchandise trade, 1999 . . . . . . . . . . . . . . . . . . . . . . . . . . . . . . . . . . . . . . . . . . . . . . 38Chart III.3 World trade in commercial services by selected region, 1992-99. . . . . . . . . . . . . . . . . . . . . . . . . . . . . . . . . . . . 39Table III.4 World exports of commercial services by selected region, 1999. . . . . . . . . . . . . . . . . . . . . . . . . . . . . . . . . . . . . 40Table III.5 World imports of commercial services by selected region, 1999 . . . . . . . . . . . . . . . . . . . . . . . . . . . . . . . . . . . . 40
vi
2. North America
Table III.6 Merchandise trade of North America, 1999 . . . . . . . . . . . . . . . . . . . . . . . . . . . . . . . . . . . . . . . . . . . . . . . . . . . 41Table III.7 Merchandise trade of North America by region and by major product group, 1999 . . . . . . . . . . . . . . . . . . . . . . 41Chart III.4 Merchandise trade of North America, 1989-99 . . . . . . . . . . . . . . . . . . . . . . . . . . . . . . . . . . . . . . . . . . . . . . . . . 41Chart III.5 Share of North America in world merchandise trade, 1989-99 . . . . . . . . . . . . . . . . . . . . . . . . . . . . . . . . . . . . . 41Table III.8 Merchandise exports of North America by product, 1999 . . . . . . . . . . . . . . . . . . . . . . . . . . . . . . . . . . . . . . . . . 42Table III.9 Merchandise imports of North America by product, 1999 . . . . . . . . . . . . . . . . . . . . . . . . . . . . . . . . . . . . . . . . . 42Table III.10 Merchandise exports of North America by destination, 1999. . . . . . . . . . . . . . . . . . . . . . . . . . . . . . . . . . . . . . . 43Table III.11 Merchandise imports of North America by origin, 1999. . . . . . . . . . . . . . . . . . . . . . . . . . . . . . . . . . . . . . . . . . . 43Table III.12 Gross domestic product and trade in goods and services of Canada and the United States, 1999 . . . . . . . . . . . 44Table III.13 Merchandise exports and imports of Canada and the United States, 1999 . . . . . . . . . . . . . . . . . . . . . . . . . . . . 44Table III.14 Merchandise trade of Canada by region and economy, 1999 . . . . . . . . . . . . . . . . . . . . . . . . . . . . . . . . . . . . . . 45Table III.15 Merchandise trade of the United States by region and economy, 1999 . . . . . . . . . . . . . . . . . . . . . . . . . . . . . . . 46Table III.16 Merchandise exports of NAFTA countries by destination, 1990-99 . . . . . . . . . . . . . . . . . . . . . . . . . . . . . . . . . . 47Table III.17 Trade in commercial services of Canada, 1999 . . . . . . . . . . . . . . . . . . . . . . . . . . . . . . . . . . . . . . . . . . . . . . . . . 48Table III.18 Trade in commercial services of the United States, 1999 . . . . . . . . . . . . . . . . . . . . . . . . . . . . . . . . . . . . . . . . . . 48
3. Latin America
Table III.19 Merchandise trade of Latin America, 1999 . . . . . . . . . . . . . . . . . . . . . . . . . . . . . . . . . . . . . . . . . . . . . . . . . . . . 49Table III.20 Merchandise trade of Latin America by region and by major product group, 1999. . . . . . . . . . . . . . . . . . . . . . . 49Chart III.6 Merchandise trade of Latin America, 1989-99 . . . . . . . . . . . . . . . . . . . . . . . . . . . . . . . . . . . . . . . . . . . . . . . . . 49Chart III.7 Share of Latin America in world merchandise trade, 1989-99 . . . . . . . . . . . . . . . . . . . . . . . . . . . . . . . . . . . . . . 49Table III.21 Merchandise exports of Latin America by product, 1999 . . . . . . . . . . . . . . . . . . . . . . . . . . . . . . . . . . . . . . . . . . 50Table III.22 Merchandise exports of Latin America by destination, 1999 . . . . . . . . . . . . . . . . . . . . . . . . . . . . . . . . . . . . . . . 50Table III.23 Leading merchandise exporters and importers in Latin America, 1999. . . . . . . . . . . . . . . . . . . . . . . . . . . . . . . . 51Table III.24 Merchandise exports of MERCOSUR countries by region, 1990-99 . . . . . . . . . . . . . . . . . . . . . . . . . . . . . . . . . . 52Table III.25 Merchandise imports of MERCOSUR countries by region, 1990-99 . . . . . . . . . . . . . . . . . . . . . . . . . . . . . . . . . . 53Table III.26 Merchandise exports of ANDEAN countries by region, 1990-99 . . . . . . . . . . . . . . . . . . . . . . . . . . . . . . . . . . . . 54Table III.27 Merchandise imports of ANDEAN countries by region, 1990-99 . . . . . . . . . . . . . . . . . . . . . . . . . . . . . . . . . . . . 55Table III.28 Leading exporters and importers of commercial services in Latin America, 1999 . . . . . . . . . . . . . . . . . . . . . . . . 56
4. Western Europe
Table III.29 Merchandise trade of Western Europe, 1999. . . . . . . . . . . . . . . . . . . . . . . . . . . . . . . . . . . . . . . . . . . . . . . . . . . 57Table III.30 Merchandise trade of Western Europe by region and by major product group, 1999 . . . . . . . . . . . . . . . . . . . . . 57Chart III.8 Merchandise trade of Western Europe, 1989-99 . . . . . . . . . . . . . . . . . . . . . . . . . . . . . . . . . . . . . . . . . . . . . . . . 57Chart III.9 Share of Western Europe in world merchandise trade, 1989-99 . . . . . . . . . . . . . . . . . . . . . . . . . . . . . . . . . . . . 57Table III.31 Merchandise exports of Western Europe by product, 1999 . . . . . . . . . . . . . . . . . . . . . . . . . . . . . . . . . . . . . . . . 58Table III.32 Merchandise imports of Western Europe by product, 1999 . . . . . . . . . . . . . . . . . . . . . . . . . . . . . . . . . . . . . . . . 58Table III.33 Merchandise exports of Western Europe by destination, 1999. . . . . . . . . . . . . . . . . . . . . . . . . . . . . . . . . . . . . . 59Table III.34 Merchandise imports of Western Europe by origin, 1999. . . . . . . . . . . . . . . . . . . . . . . . . . . . . . . . . . . . . . . . . . 59Table III.35 Gross domestic product and trade in goods and services in Western Europe, 1999 . . . . . . . . . . . . . . . . . . . . . . 60Table III.36 Leading merchandise exporters and importers in Western Europe, 1999 . . . . . . . . . . . . . . . . . . . . . . . . . . . . . . 61Table III.37 Merchandise trade of European Union by region and economy, 1999 . . . . . . . . . . . . . . . . . . . . . . . . . . . . . . . . 62Table III.38 Leading exporters and importers of commercial services in Western Europe, 1999. . . . . . . . . . . . . . . . . . . . . . . 63Table III.39 Trade in commercial services of France, 1999 . . . . . . . . . . . . . . . . . . . . . . . . . . . . . . . . . . . . . . . . . . . . . . . . . . 64Table III.40 Trade in commercial services of Germany, 1999 . . . . . . . . . . . . . . . . . . . . . . . . . . . . . . . . . . . . . . . . . . . . . . . . 64Table III.41 Trade in commercial services of Italy, 1999 . . . . . . . . . . . . . . . . . . . . . . . . . . . . . . . . . . . . . . . . . . . . . . . . . . . . 65Table III.42 Trade in commercial services of the United Kingdom, 1999. . . . . . . . . . . . . . . . . . . . . . . . . . . . . . . . . . . . . . . . 65
5. Central and Eastern Europe, the Baltic States and the CIS (transition economies)
Table III.43 Merchandise trade of the Central and Eastern Europe, the Baltic States and the CIS, 1999 . . . . . . . . . . . . . . . . 66Table III.44 Merchandise trade of the Central and Eastern Europe, the Baltic States and the CIS by region
and by major product group, 1999 . . . . . . . . . . . . . . . . . . . . . . . . . . . . . . . . . . . . . . . . . . . . . . . . . . . . . . . . . . 66Chart III.10 Merchandise trade of the Central and Eastern Europe, the Baltic States and the CIS, 1989-99 . . . . . . . . . . . . . 66Chart III.11 Share of the Central and Eastern Europe, the Baltic States and the CIS in world merchandise trade, 1989-99 . . 66Table III.45 Merchandise exports of the Central and Eastern Europe, the Baltic States and the CIS by major product group
and main destination, 1999 . . . . . . . . . . . . . . . . . . . . . . . . . . . . . . . . . . . . . . . . . . . . . . . . . . . . . . . . . . . . . . . 67Table III.46 Relative importance of inter-regional trade in the total merchandise trade of the Baltic States and the CIS,
1999 . . . . . . . . . . . . . . . . . . . . . . . . . . . . . . . . . . . . . . . . . . . . . . . . . . . . . . . . . . . . . . . . . . . . . . . . . . . . . . . . 67
vii
Table III.47 Leading merchandise exporters and importers in Central and Eastern Europe, the Baltic States and the CIS,1999 . . . . . . . . . . . . . . . . . . . . . . . . . . . . . . . . . . . . . . . . . . . . . . . . . . . . . . . . . . . . . . . . . . . . . . . . . . . . . . . . 68
Table III.48 Merchandise exports of selected Central and Eastern European countries by region, major trading partner,and major product group, 1997-99. . . . . . . . . . . . . . . . . . . . . . . . . . . . . . . . . . . . . . . . . . . . . . . . . . . . . . . . . . 69
Table III.49 Merchandise imports of selected Central and Eastern European countries by region, major trading partner,and major product group, 1997-99. . . . . . . . . . . . . . . . . . . . . . . . . . . . . . . . . . . . . . . . . . . . . . . . . . . . . . . . . . 70
Table III.50 Merchandise exports of selected economies to the Baltic States and the CIS, 1997-99 . . . . . . . . . . . . . . . . . . . 71Table III.51 Merchandise imports of selected economies from the Baltic States and the CIS, 1997-99 . . . . . . . . . . . . . . . . . 72
6. Africa
Table III.52 Merchandise trade of Africa, 1999 . . . . . . . . . . . . . . . . . . . . . . . . . . . . . . . . . . . . . . . . . . . . . . . . . . . . . . . . . . 73Table III.53 Merchandise trade of Africa by region and by major product group, 1999. . . . . . . . . . . . . . . . . . . . . . . . . . . . . 73Chart III.12 Merchandise trade of Africa, 1989-99 . . . . . . . . . . . . . . . . . . . . . . . . . . . . . . . . . . . . . . . . . . . . . . . . . . . . . . . 73Chart III.13 Share of Africa in world merchandise trade, 1989-99 . . . . . . . . . . . . . . . . . . . . . . . . . . . . . . . . . . . . . . . . . . . . 73Table III.54 Merchandise exports of Africa by major product group and main destination, 1999 . . . . . . . . . . . . . . . . . . . . . 74Table III.55 Merchandise exports of Africa by destination, 1999 . . . . . . . . . . . . . . . . . . . . . . . . . . . . . . . . . . . . . . . . . . . . . 74Table III.56 Leading merchandise exporters and importers in Africa, 1999. . . . . . . . . . . . . . . . . . . . . . . . . . . . . . . . . . . . . . 75Table III.57 Merchandise exports of the European Union to developing countries in Africa by product, 1999 . . . . . . . . . . . . 76Table III.58 Merchandise imports of the European Union from developing countries in Africa by product, 1999. . . . . . . . . . 76
7. Middle East
Table III.59 Merchandise trade of the Middle East, 1999 . . . . . . . . . . . . . . . . . . . . . . . . . . . . . . . . . . . . . . . . . . . . . . . . . . 77Table III.60 Merchandise trade of the Middle East by region and by major product group, 1999 . . . . . . . . . . . . . . . . . . . . . 77Chart III.14 Merchandise trade of the Middle East, 1989-99 . . . . . . . . . . . . . . . . . . . . . . . . . . . . . . . . . . . . . . . . . . . . . . . . 77Chart III.15 Share of the Middle East in world merchandise trade, 1989-99 . . . . . . . . . . . . . . . . . . . . . . . . . . . . . . . . . . . . 77Table III.61 Merchandise exports of the Middle East by major product group and main destination, 1999. . . . . . . . . . . . . . 78Table III.62 Merchandise exports of the Middle East by destination, 1999. . . . . . . . . . . . . . . . . . . . . . . . . . . . . . . . . . . . . . 78Table III.63 Fuel imports of selected regions and economies from the Middle East, 1990 and 1999 . . . . . . . . . . . . . . . . . . 79Table III.64 Leading merchandise exporters and importers in the Middle East, 1999 . . . . . . . . . . . . . . . . . . . . . . . . . . . . . . 79
8. Asia
Table III.65 Merchandise trade of Asia, 1999 . . . . . . . . . . . . . . . . . . . . . . . . . . . . . . . . . . . . . . . . . . . . . . . . . . . . . . . . . . . 80Table III.66 Merchandise trade of Asia by region and by major product group, 1999 . . . . . . . . . . . . . . . . . . . . . . . . . . . . . . 80Chart III.16 Merchandise trade of Asia, 1989-99. . . . . . . . . . . . . . . . . . . . . . . . . . . . . . . . . . . . . . . . . . . . . . . . . . . . . . . . . 80Chart III.17 Share of Asia in world merchandise trade, 1989-99 . . . . . . . . . . . . . . . . . . . . . . . . . . . . . . . . . . . . . . . . . . . . . 80Table III.67 Merchandise exports of Asia by main product group and main destination, 1999 . . . . . . . . . . . . . . . . . . . . . . . 81Table III.68 Merchandise exports of Asia by product, 1999 . . . . . . . . . . . . . . . . . . . . . . . . . . . . . . . . . . . . . . . . . . . . . . . . . 82Table III.69 Merchandise exports of Asia by destination, 1999 . . . . . . . . . . . . . . . . . . . . . . . . . . . . . . . . . . . . . . . . . . . . . . 82Table III.70 Leading merchandise exporters and importers in Asia, 1999 . . . . . . . . . . . . . . . . . . . . . . . . . . . . . . . . . . . . . . . 83Table III.71 Merchandise trade of Japan by region and by economy, 1999 . . . . . . . . . . . . . . . . . . . . . . . . . . . . . . . . . . . . . 84Table III.72 Merchandise exports of the United States, European Union and Japan to China by major product, 1999. . . . . . 85Table III.73 Merchandise imports of the United States, European Union and Japan from China by major product, 1999 . . . 86Table III.74 Merchandise exports of ASEAN countries by region, 1990-99 . . . . . . . . . . . . . . . . . . . . . . . . . . . . . . . . . . . . . . 87Table III.75 Merchandise imports of ASEAN countries by region, 1990-99. . . . . . . . . . . . . . . . . . . . . . . . . . . . . . . . . . . . . . 88Table III.76 Merchandise trade of Asian economies in financial crisis by region, 1999 . . . . . . . . . . . . . . . . . . . . . . . . . . . . . 89Chart III.18 Merchandise trade of Asian economies in financial crisis, 1995-00 . . . . . . . . . . . . . . . . . . . . . . . . . . . . . . . . . . 89Table III.77 Leading exporters and importers of commercial services in Asia, 1999 . . . . . . . . . . . . . . . . . . . . . . . . . . . . . . . 90Table III.78 Trade in commercial services of Japan, 1999. . . . . . . . . . . . . . . . . . . . . . . . . . . . . . . . . . . . . . . . . . . . . . . . . . . 91
IV. Trade by sector
1. Overview
Chart IV.1 World merchandise exports by product, 1990 and 1999 . . . . . . . . . . . . . . . . . . . . . . . . . . . . . . . . . . . . . . . . . . 93Table IV.1 World merchandise exports by product, 1999 . . . . . . . . . . . . . . . . . . . . . . . . . . . . . . . . . . . . . . . . . . . . . . . . . . 93Chart IV.2 World exports of commercial services by category, 1990, 1995 and 1999 . . . . . . . . . . . . . . . . . . . . . . . . . . . . . 94Table IV.2 World exports of commercial services by category, 1999. . . . . . . . . . . . . . . . . . . . . . . . . . . . . . . . . . . . . . . . . . 94
viii
2. Agricultural products
Table IV.3 World trade in agricultural products, 1999 . . . . . . . . . . . . . . . . . . . . . . . . . . . . . . . . . . . . . . . . . . . . . . . . . . . . 95Table IV.4 Major regional flows in world exports of agricultural products, 1999 . . . . . . . . . . . . . . . . . . . . . . . . . . . . . . . . 95Table IV.5 Share of agricultural products in trade in total merchandise and in primary products by region, 1999 . . . . . . . . 95Chart IV.3 Regional shares in world trade in agricultural products, 1999 . . . . . . . . . . . . . . . . . . . . . . . . . . . . . . . . . . . . . . 95Table IV.6 Exports of agricultural products by region, 1999 . . . . . . . . . . . . . . . . . . . . . . . . . . . . . . . . . . . . . . . . . . . . . . . . 96Table IV.7 Leading exporters and importers of agricultural products, 1999 . . . . . . . . . . . . . . . . . . . . . . . . . . . . . . . . . . . . 97Table IV.8 Exports of agricultural products of selected economies, 1990-99 . . . . . . . . . . . . . . . . . . . . . . . . . . . . . . . . . . . 98Table IV.9 Imports of agricultural products of selected economies, 1990-99 . . . . . . . . . . . . . . . . . . . . . . . . . . . . . . . . . . . 99
2.1. Food
Table IV.10 World trade in food, 1999 . . . . . . . . . . . . . . . . . . . . . . . . . . . . . . . . . . . . . . . . . . . . . . . . . . . . . . . . . . . . . . . . 100Table IV.11 Major regional flows in world exports of food, 1999. . . . . . . . . . . . . . . . . . . . . . . . . . . . . . . . . . . . . . . . . . . . . 100Table IV.12 Share of food in trade in total merchandise and in primary products by region, 1999 . . . . . . . . . . . . . . . . . . . . 100Chart IV.4 Regional shares in world trade in food, 1999 . . . . . . . . . . . . . . . . . . . . . . . . . . . . . . . . . . . . . . . . . . . . . . . . . . 100Table IV.13 Exports of food by principal region, 1999 . . . . . . . . . . . . . . . . . . . . . . . . . . . . . . . . . . . . . . . . . . . . . . . . . . . . . 101Table IV.14 Imports of food into the European Union, North America and Japan by region, 1999 . . . . . . . . . . . . . . . . . . . . 102Table IV.15 Leading exporters and importers of food, 1999 . . . . . . . . . . . . . . . . . . . . . . . . . . . . . . . . . . . . . . . . . . . . . . . . 103
3. Mining products
Table IV.16 World trade in mining products, 1999 . . . . . . . . . . . . . . . . . . . . . . . . . . . . . . . . . . . . . . . . . . . . . . . . . . . . . . . 104Table IV.17 Major regional flows in world exports of mining products, 1999 . . . . . . . . . . . . . . . . . . . . . . . . . . . . . . . . . . . . 104Table IV.18 Share of mining products in trade in total merchandise and in primary products by region, 1999 . . . . . . . . . . . 104Chart IV.5 Regional shares in world trade in mining products, 1999 . . . . . . . . . . . . . . . . . . . . . . . . . . . . . . . . . . . . . . . . . 104Table IV.19 Exports of mining products by region, 1999 . . . . . . . . . . . . . . . . . . . . . . . . . . . . . . . . . . . . . . . . . . . . . . . . . . . 105
3.1 Fuels
Table IV.20 World trade in fuels, 1999 . . . . . . . . . . . . . . . . . . . . . . . . . . . . . . . . . . . . . . . . . . . . . . . . . . . . . . . . . . . . . . . . 106Table IV.21 Major regional flows in world exports of fuels, 1999 . . . . . . . . . . . . . . . . . . . . . . . . . . . . . . . . . . . . . . . . . . . . 106Table IV.22 Share of fuels in trade in total merchandise and in primary products by region, 1999 . . . . . . . . . . . . . . . . . . . . 106Chart IV.6 Regional shares in world trade in fuels, 1999 . . . . . . . . . . . . . . . . . . . . . . . . . . . . . . . . . . . . . . . . . . . . . . . . . . 106Table IV.23 Fuels imports of selected economies by region and supplier, 1999 . . . . . . . . . . . . . . . . . . . . . . . . . . . . . . . . . . 107Table IV.24 Imports of fuels of selected economies, 1990-99 . . . . . . . . . . . . . . . . . . . . . . . . . . . . . . . . . . . . . . . . . . . . . . . 109
4. Manufactures
Table IV.25 World trade in manufactures, 1999 . . . . . . . . . . . . . . . . . . . . . . . . . . . . . . . . . . . . . . . . . . . . . . . . . . . . . . . . . 110Table IV.26 Major regional flows in world exports of manufactures, 1999 . . . . . . . . . . . . . . . . . . . . . . . . . . . . . . . . . . . . . . 110Table IV.27 Share of manufactures in total merchandise trade by region, 1999 . . . . . . . . . . . . . . . . . . . . . . . . . . . . . . . . . . 110Chart IV.7 Regional shares in world trade in manufactures, 1999 . . . . . . . . . . . . . . . . . . . . . . . . . . . . . . . . . . . . . . . . . . . 110Table IV.28 Exports of manufactures by region, 1999 . . . . . . . . . . . . . . . . . . . . . . . . . . . . . . . . . . . . . . . . . . . . . . . . . . . . . 111Table IV.29 Trade in manufactures of the United States, European Union and Japan by region, 1999 . . . . . . . . . . . . . . . . . 112Table IV.30 Leading exporters and importers of manufactures, 1999. . . . . . . . . . . . . . . . . . . . . . . . . . . . . . . . . . . . . . . . . . 113Table IV.31 Exports of manufactures of selected economies, 1990-99 . . . . . . . . . . . . . . . . . . . . . . . . . . . . . . . . . . . . . . . . . 114Table IV.32 Imports of manufactures of selected economies, 1990-99. . . . . . . . . . . . . . . . . . . . . . . . . . . . . . . . . . . . . . . . . 115
4.1 Iron and steel
Table IV.33 World trade in iron and steel, 1999 . . . . . . . . . . . . . . . . . . . . . . . . . . . . . . . . . . . . . . . . . . . . . . . . . . . . . . . . . 116Table IV.34 Major regional flows in world exports of iron and steel, 1999. . . . . . . . . . . . . . . . . . . . . . . . . . . . . . . . . . . . . . 116Table IV.35 Share of iron and steel in trade in total merchandise and in manufactures by region, 1999. . . . . . . . . . . . . . . . 116Chart IV.8 Regional shares in world trade in iron and steel, 1999 . . . . . . . . . . . . . . . . . . . . . . . . . . . . . . . . . . . . . . . . . . . 116Table IV.36 Exports of iron and steel by principal region, 1999 . . . . . . . . . . . . . . . . . . . . . . . . . . . . . . . . . . . . . . . . . . . . . . 117Table IV.37 Iron and steel imports of the European Union and the United States by region and supplier, 1999 . . . . . . . . . . 118Table IV.38 Leading exporters and importers of iron and steel, 1999 . . . . . . . . . . . . . . . . . . . . . . . . . . . . . . . . . . . . . . . . . 119

ix
4.2 Chemicals
Table IV.39 World trade in chemicals, 1999 . . . . . . . . . . . . . . . . . . . . . . . . . . . . . . . . . . . . . . . . . . . . . . . . . . . . . . . . . . . . 120Table IV.40 Major regional flows in world exports of chemicals, 1999. . . . . . . . . . . . . . . . . . . . . . . . . . . . . . . . . . . . . . . . . 120Table IV.41 Share of chemicals in trade in total merchandise and in manufactures by region, 1999. . . . . . . . . . . . . . . . . . . 120Chart IV. 9 Regional shares in world trade in chemicals, 1999 . . . . . . . . . . . . . . . . . . . . . . . . . . . . . . . . . . . . . . . . . . . . . . 120Table IV.42 Exports of chemicals by principal region, 1999 . . . . . . . . . . . . . . . . . . . . . . . . . . . . . . . . . . . . . . . . . . . . . . . . . 121Table IV.43 Leading exporters and importers of chemicals, 1999. . . . . . . . . . . . . . . . . . . . . . . . . . . . . . . . . . . . . . . . . . . . . 122
4.3 Machinery and transport equipment
Table IV.44 World trade in machinery and transport equipment, 1999. . . . . . . . . . . . . . . . . . . . . . . . . . . . . . . . . . . . . . . . . 123Table IV.45 Major regional flows in world exports of machinery and transport equipment, 1999 . . . . . . . . . . . . . . . . . . . . . 123Table IV.46 Share of machinery and transport equipment in trade in total merchandise and in manufactures by region, 1999 123Chart IV.10 Regional shares in world trade in machinery and transport equipment, 1999 . . . . . . . . . . . . . . . . . . . . . . . . . . 123Table IV.47 Exports of machinery and transport equipment by principal region, 1999 . . . . . . . . . . . . . . . . . . . . . . . . . . . . . 124Table IV.48 Leading exporters and importers of machinery and transport equipment, 1999 . . . . . . . . . . . . . . . . . . . . . . . . . 125Table IV.49 Exports of machinery and transport equipment of selected economies, 1990-99 . . . . . . . . . . . . . . . . . . . . . . . . 126Table IV.50 Imports of machinery and transport equipment of selected economies, 1990-99 . . . . . . . . . . . . . . . . . . . . . . . . 127
Office machines and telecom equipment
Table IV.51 World trade in office machines and telecom equipment, 1999 . . . . . . . . . . . . . . . . . . . . . . . . . . . . . . . . . . . . . 128Table IV.52 Major regional flows in world exports of office machines and telecom equipment, 1999. . . . . . . . . . . . . . . . . . 128Table IV.53 Share of office machines and telecom equipment in trade in total merchandise and in manufactures by region,
1999 . . . . . . . . . . . . . . . . . . . . . . . . . . . . . . . . . . . . . . . . . . . . . . . . . . . . . . . . . . . . . . . . . . . . . . . . . . . . . . . . 128Chart IV.11 Regional shares in world trade in office machines and telecom equipment, 1999 . . . . . . . . . . . . . . . . . . . . . . . 128Table IV.54 Exports of office machines and telecom equipment by principal region, 1999 . . . . . . . . . . . . . . . . . . . . . . . . . . 129Table IV.55 Imports of office machines and telecom equipment of selected economies by region and supplier, 1999 . . . . . . 130Table IV.56 Leading exporters and importers of office machines and telecom equipment, 1999. . . . . . . . . . . . . . . . . . . . . . 132Table IV.57 Exports of office machines and telecom equipment of selected economies, 1990-99 . . . . . . . . . . . . . . . . . . . . . 133Table IV.58 Imports of office machines and telecom equipment of selected economies, 1990-99. . . . . . . . . . . . . . . . . . . . . 134
Automotive products
Table IV.59 World trade in automotive products, 1999 . . . . . . . . . . . . . . . . . . . . . . . . . . . . . . . . . . . . . . . . . . . . . . . . . . . . 135Table IV.60 Major regional flows in world exports of automotive products, 1999 . . . . . . . . . . . . . . . . . . . . . . . . . . . . . . . . 135Table IV.61 Share of automotive products in trade in total merchandise and in manufactures by region, 1999 . . . . . . . . . . 135Chart IV.12 Regional shares in world trade in automotive products, 1999 . . . . . . . . . . . . . . . . . . . . . . . . . . . . . . . . . . . . . . 135Table IV.62 Exports of automotive products by principal region, 1999. . . . . . . . . . . . . . . . . . . . . . . . . . . . . . . . . . . . . . . . . 136Table IV.63 Imports of automotive products of selected economies by region and supplier, 1999. . . . . . . . . . . . . . . . . . . . . 137Table IV.64 Leading exporters and importers of automotive products, 1999 . . . . . . . . . . . . . . . . . . . . . . . . . . . . . . . . . . . . 138Table IV.65 Exports of automotive products of selected economies, 1990-99 . . . . . . . . . . . . . . . . . . . . . . . . . . . . . . . . . . . 139Table IV.66 Imports of automotive products of selected economies, 1990-99 . . . . . . . . . . . . . . . . . . . . . . . . . . . . . . . . . . . 140
4.4 Textiles
Table IV.67 World trade in textiles, 1999 . . . . . . . . . . . . . . . . . . . . . . . . . . . . . . . . . . . . . . . . . . . . . . . . . . . . . . . . . . . . . . 141Table IV.68 Major regional flows in world exports of textiles, 1999. . . . . . . . . . . . . . . . . . . . . . . . . . . . . . . . . . . . . . . . . . . 141Table IV.69 Share of textiles in trade in total merchandise and in manufactures by region, 1999. . . . . . . . . . . . . . . . . . . . . 141Chart IV.13 Regional shares in world trade in textiles, 1999 . . . . . . . . . . . . . . . . . . . . . . . . . . . . . . . . . . . . . . . . . . . . . . . . 141Table IV.70 Exports of textiles by principal region, 1999 . . . . . . . . . . . . . . . . . . . . . . . . . . . . . . . . . . . . . . . . . . . . . . . . . . . 142Table IV.71 Textile imports of selected economies by region and supplier, 1999 . . . . . . . . . . . . . . . . . . . . . . . . . . . . . . . . . 143Table IV.72 Leading exporters and importers of textiles, 1999. . . . . . . . . . . . . . . . . . . . . . . . . . . . . . . . . . . . . . . . . . . . . . . 145Table IV.73 Exports of textiles of selected economies, 1990-99 . . . . . . . . . . . . . . . . . . . . . . . . . . . . . . . . . . . . . . . . . . . . . . 146Table IV.74 Imports of textiles of selected economies, 1990-99. . . . . . . . . . . . . . . . . . . . . . . . . . . . . . . . . . . . . . . . . . . . . . 147
4.5 Clothing
Table IV.75 World trade in clothing, 1999. . . . . . . . . . . . . . . . . . . . . . . . . . . . . . . . . . . . . . . . . . . . . . . . . . . . . . . . . . . . . . 148Table IV.76 Major regional flows in world exports of clothing, 1999 . . . . . . . . . . . . . . . . . . . . . . . . . . . . . . . . . . . . . . . . . . 148

x
Table IV.77 Share of clothing in trade in total merchandise and in manufactures by region, 1999 . . . . . . . . . . . . . . . . . . . . 148Chart IV.14 Regional shares in world trade in clothing, 1999 . . . . . . . . . . . . . . . . . . . . . . . . . . . . . . . . . . . . . . . . . . . . . . . 148Table IV.78 Exports of clothing by principal region, 1999 . . . . . . . . . . . . . . . . . . . . . . . . . . . . . . . . . . . . . . . . . . . . . . . . . . 149Table IV.79 Clothing imports of selected economies by region and supplier, 1999 . . . . . . . . . . . . . . . . . . . . . . . . . . . . . . . . 150Table IV.80 Leading exporters and importers of clothing, 1999 . . . . . . . . . . . . . . . . . . . . . . . . . . . . . . . . . . . . . . . . . . . . . . 152Table IV.81 Exports of clothing of selected economies, 1990-99 . . . . . . . . . . . . . . . . . . . . . . . . . . . . . . . . . . . . . . . . . . . . . 153Table IV.82 Imports of clothing of selected economies, 1990-99 . . . . . . . . . . . . . . . . . . . . . . . . . . . . . . . . . . . . . . . . . . . . . 154
5. Commercial services
5.1 Transportation services
Table IV.83 World exports of transportation services, 1999 . . . . . . . . . . . . . . . . . . . . . . . . . . . . . . . . . . . . . . . . . . . . . . . . . 155Chart IV.15 World exports of transportation services and share in total commercial services, 1992-99 . . . . . . . . . . . . . . . . . 155Table IV.84 Share of transportation services in total trade of commercial services by selected region, 1999 . . . . . . . . . . . . . 155Chart IV.16 Regional shares in world trade in transportation services, 1999 . . . . . . . . . . . . . . . . . . . . . . . . . . . . . . . . . . . . 155Table IV.85 Leading exporters and importers of transportation services, 1999 . . . . . . . . . . . . . . . . . . . . . . . . . . . . . . . . . . . 156
5.2 Travel services
Table IV.86 World exports of travel services, 1999 . . . . . . . . . . . . . . . . . . . . . . . . . . . . . . . . . . . . . . . . . . . . . . . . . . . . . . . 157Chart IV.17 World exports of travel services and share in total commercial services, 1992-99 . . . . . . . . . . . . . . . . . . . . . . . 157Table IV.87 Share of travel services in total trade of commercial services by selected region, 1999 . . . . . . . . . . . . . . . . . . . 157Chart IV.18 Regional shares in world trade in travel services, 1999 . . . . . . . . . . . . . . . . . . . . . . . . . . . . . . . . . . . . . . . . . . . 157Table IV.88 Leading exporters and importers of travel services, 1999 . . . . . . . . . . . . . . . . . . . . . . . . . . . . . . . . . . . . . . . . . 158
5.3 Other commercial services
Table IV.89 World exports of other commercial services, 1999 . . . . . . . . . . . . . . . . . . . . . . . . . . . . . . . . . . . . . . . . . . . . . . 159Chart IV.19 World exports of other commercial services and share in total commercial services, 1992-99 . . . . . . . . . . . . . . 159Table IV.90 Share of other commercial services in total trade of commercial services by selected region, 1999 . . . . . . . . . . 159Chart IV.20 Regional shares in world trade in other commercial services, 1999 . . . . . . . . . . . . . . . . . . . . . . . . . . . . . . . . . . 159Table IV.91 Leading exporters and importers of other commercial services, 1999 . . . . . . . . . . . . . . . . . . . . . . . . . . . . . . . . 160
Appendix tables
Table A1 World merchandise exports, production and gross domestic product, 1989-99 . . . . . . . . . . . . . . . . . . . . . . . . . 161Table A2 Network of world merchandise trade by region, 1997-99 . . . . . . . . . . . . . . . . . . . . . . . . . . . . . . . . . . . . . . . . . 162Table A3 World merchandise exports by region and selected economy, 1989-99 . . . . . . . . . . . . . . . . . . . . . . . . . . . . . . . 164Table A4 World merchandise imports by region and selected economy, 1989-99. . . . . . . . . . . . . . . . . . . . . . . . . . . . . . . 168Table A5 World exports of commercial services by selected region and economy, 1989-99 . . . . . . . . . . . . . . . . . . . . . . . 172Table A6 World imports of commercial services by selected region and economy, 1989-99 . . . . . . . . . . . . . . . . . . . . . . . 175Table A7 Network of world merchandise trade by product and region, 1997-99 . . . . . . . . . . . . . . . . . . . . . . . . . . . . . . . 178Table A8 Merchandise trade by product, region and major trading partner, 1997-99 - Canada . . . . . . . . . . . . . . . . . . . . 182Table A9 Merchandise trade by product, region and major trading partner, 1997-99 - United States . . . . . . . . . . . . . . . . 184Table A10 Merchandise trade by product, region and major trading partner, 1997-99 - Mexico . . . . . . . . . . . . . . . . . . . . . 186Table A11 Merchandise trade by product, region and major trading partner, 1997-99 - European Union (15) . . . . . . . . . . 188Table A12 Merchandise trade by product, region and major trading partner, 1997-99 - France . . . . . . . . . . . . . . . . . . . . . 190Table A13 Merchandise trade by product, region and major trading partner, 1997-99 - Germany . . . . . . . . . . . . . . . . . . . 192Table A14 Merchandise trade by product, region and major trading partner, 1997-99 - United Kingdom . . . . . . . . . . . . . 194Table A15 Merchandise trade by product, region and major trading partner, 1997-99 - Japan . . . . . . . . . . . . . . . . . . . . . . 196Table A16 Merchandise trade by product, region and major trading partner, 1997-99 - Hong Kong, China . . . . . . . . . . . . 198Table A17 Domestic exports and re-exports of merchandise by product, region and major trading partner,
1997-99 - Hong Kong, China . . . . . . . . . . . . . . . . . . . . . . . . . . . . . . . . . . . . . . . . . . . . . . . . . . . . . . . . . . . . . . 200Table A18 Merchandise trade by product, region and major trading partner, 1997-99 - Korea, Rep. of. . . . . . . . . . . . . . . . 202Table A19 Merchandise trade by product, region and major trading partner, 1997-99 - Singapore. . . . . . . . . . . . . . . . . . . 204Table A20 Merchandise trade by product, region and major trading partner, 1997-99 - Taipei, Chinese . . . . . . . . . . . . . . . 206Table A21 Export prices of primary commodities, 1989-00 . . . . . . . . . . . . . . . . . . . . . . . . . . . . . . . . . . . . . . . . . . . . . . . . 208

xi
Abbreviations and symbols
ANDEAN Andean Common MarketAPEC Asia-Pacific Economic Cooperation ASEAN Association of South-East Asian Nations BOP Balance of PaymentsBPM5 Balance of Payments Manual, fifth editionCEFTA Central European Free Trade Agreement CIS Commonwealth of Independent States EFTA European Free Trade Association EU European Union EUROSTAT Statistical Office of the European CommunitiesFAO Food and Agriculture Organization of the United Nations FDI Foreign direct investmentGDP Gross Domestic Product GNP Gross National Product HS Harmonized Commodity Description and Coding SystemIEA International Energy Agency IMF International Monetary Fund ISIC International Standard Industrial Classification MERCOSUR Southern Common Market NAFTA North American Free Trade Agreement OECD Organisation for Economic Cooperation and Development SAPTA South Asian Preferential Trade Arrangement SITC Standard International Trade Classification UNECE United Nations Economic Commission for Europe UNECLAC United Nations Economic Commission for Latin America and the Caribbean UNCTAD United Nations Conference on Trade and Development UNIDO United Nations Industrial Development Organization UNSD United Nations Statistics Division
c.i.f. cost, insurance and freight f.o.b. free on board n.e.s. not elsewhere specified n.i.e. not included elsewhere
The following symbols are used in this publication :
... not available 0 figure is zero or became zero due to rounding– not applicable $ United States dollars
Q1, Q2 1st quarter, 2nd quarterI break in comparability of data series. Data after the symbol do not form a consistent series with those from earlier
years.
Billion means one thousand million.
Minor discrepancies between constituent figures and totals are due to rounding.
Unless otherwise indicated, (i) all value figures are expressed in U.S. dollars ; (ii) trade figures include the intra-trade of free trade areas,customs unions, regional and other country groupings ; (iii) merchandise trade figures are on a customs basis and (iv) merchandiseexports are f.o.b. and merchandise imports are c.i.f. Data for the latest year are provisional.
Closing date 1 September 2000

Ove
rvie
w
1
Overview
1. Main features of tradedevelopments in 1999
In the course of 1999, global economic output gainedmomentum and international trade growth accelerated markedly,reversing the downward trend prevailing until the first quarter of1999. The recovery in Asia and the continued high growth ofoutput in North America provided the major stimulus tointernational trade. Restraining factors for the expansion of tradewere the deceleration of economic activity in Western Europetogether with a decline in output in South and Central America.As the dynamic and contractionary forces balanced each other,the overall rate of trade growth remained unchanged at about5% in volume terms (i.e., adjusted for price changes). The valueof world merchandise exports rose by 3.5% and that ofcommercial services exports by 1.5% to US$5.47 trillion andUS$1.35 trillion, respectively.
The strength of GDP growth in Asia and North America ledto double digit import growth in these regions. By contrastweaker demand growth in Western Europe halved the region’sreal import growth if compared with 1998, and the sluggishoverall growth in Latin America caused a small decrease inimports. Imports of Africa and the transition economies haveslumped in 1999 as their relatively large current account deficitscould no longer be financed by capital inflows. Although thestrength of intra-regional trade lifted North America’s and Asia’sreal export growth above the global average, their exportexpansion lagged well behind import expansion. All otherregions experienced an excess of export over import growth in1999 due to sluggish domestic demand growth – providing yetanother demonstration of how international trade can attenuateswings in regional business cycles. In North America,international trade contributed to reduce the risks of anoverheated economy, while in Latin America and WesternEurope it sustained employment and mobilized otherwise idleproduction capacity.
Looking at trade developments by sector, the fastest growthin value terms could be observed for fuels, office and telecomequipment and automotive products. A decline in international
trade was registered for all major categories of primary products,except fuels, as well as for textiles and iron and steel. The valueincrease of all three major services categories, transport, traveland other commercial services remained very moderate.
Developing country merchandise exports rose by 9%,increasing their share in world exports in 1999 to 26.5%. Thehigher share was not only due to the recovery in fuels trade; thelarger shares for the developing countries could also be observedfor all nine groups of manufactures. In agricultural trade,however, the developing countries’ share decreased slightly lastyear. Taking the period 1990-1999, however, there is consistentlyan increase in the developing countries’ share of totalmerchandise exports, both in agricultural and manufacturedgoods. Among manufactured goods, the strongest gains areobserved for office and telecom equipment; automotive productsand chemicals also expanded annually at double digit rates overthe 1990s. For the developing countries as a group,manufactured goods account now for more than two thirds ofmerchandise exports.
The least-developed countries also saw their merchandiseexports increase faster than world merchandise trade. Exports ofmining products (including fuels) increased by about one fifthand that of manufactures by about 5%. For agricultural products,however, shipments decreased largely due to lower prices.Available data point to a stagnation or moderate increase inleast-developed countries’ imports in 1999.
What are the main factors that explain the international tradelandscape for 1999? Besides overall economic growth, capitalflows and trade policy are the major determinants ofinternational trade flows. The impact of trade policy changes onregional trade patterns is generally seen only over the mediumterm, while changes in capital flows often have immediaterepercussions on year-to-year trade developments. Other factors,such as commodity prices and exchange rate variations also hada notable impact on nominal trade values.
International capital flows remained a major factor in shapinginternational trade developments in 1999. The sharp increase inthe US current account deficit was financed by a record capitalinflow. United States domestic investment expenditure stayedstrong while the share of savings of private households todisposable income fell to a historically low level. Despite rathersluggish GDP growth, FDI inflows into Latin America continuedto increase, thereby dampening the impact of lower portfolioinvestments and the repayment of bank loans. In 1999, FDIinflows alone exceeded the region’s current account deficit. Asnet capital flows (private and official) to developing Asiaremained rather small in 1999, the sizeable current accountsurplus of Asia was predominantly used to increase the foreignexchange reserves. In contrast to Latin America, IMF estimatesindicate that net FDI inflows into Asia decreased for the secondyear in a row. Net FDI inflows into the transition economiesincreased slightly to a new peak level of US$20.5 billion in1999, although other private capital and official capital flowsturned negative. In fact, total net capital flows to all transitioneconomies were reduced by nearly one half to US$14.6 billion.Much of this reduction is accounted for by capital outflows fromRussia.
Summarizing the main features of capital developments in1999, one can observe that capital flows were increasinglydirected to North America and Latin America and that the shareof foreign direct investment and securities in total capital flowsexpanded sharply. At the same time, international bank loans to
Chart 1
Merchandise trade by selected region, 1999
(Annual percentage change in volume terms)
Imports
Exports
North America
Asia
Western EuropeWorld average
Africa
Latin America
Transitioneconomies
-10 -8 -6 -4 -2 0 2 4 6 8 10 12 14Source: Table 1.2
Ove
rvie
w
2
banks and non-banks decreased markedly. This implies that thestock of outstanding international bank loans was shrinking in1999, reducing private banks’ exposure to international creditrisks.1
An important issue is the sustainability of the current patternof international capital flows, given their role in financing largecurrent account deficits. The composition of international capitalflows has shifted from short-term bank loans and portfolioinvestments to longer-term engagements in the form of foreigndirect investments and securities, which reduces the risk of alarge, sudden reversal of capital flows. However, capital flowscontinue to be affected by business cycles and by changingbusiness strategies, which implies that a certain degree ofvariability is unavoidable and indeed necessary. The current waveof mergers and acquisitions is likely to run out of steam in thefuture, even if developments in the first half of 2000 indicate afurther rise in the volume of announced mergers andacquisitions. This development is bound to lead to a furthersharp rise in global FDI flows in 2000.
The increasing number and size of cross-border mergersraises concerns about whether national competition authoritiescan maintain competitive markets in all sectors of theireconomies. The present situation, with ad hoc cooperationamongst national and regional authorities, has its limitations.This has led to a growing debate over whether more formalpermanent cooperation – and/or a multilateral agreement –could deal better with these issues in the future. More generally,government policies in both developed and developing countriesthat favour deregulation, privatization of public enterprises andliberalization of investment regimes have supported the boom ofFDI flows in recent years.
The strong net capital outflows from the euro area to NorthAmerica contributed to the weakness of the euro vis-à-vis the USdollar. While this development provides support for Europeanexporters and domestic producers competing with imports, italso fuels import prices and contributes eventually to risingconsumer prices. Despite very low interest rates in Japan and alarge capital outflow, the high level of savings combined withlow investment expenditure has caused the yen to appreciatesteadily in 1999 and in the first half of 2000.
Prices of international traded goods differed significantly bymajor product groups. While prices of agricultural products andmanufactured goods recorded a further decline in 1999, theprices of fuels recovered partially from their steep fall in 1998.Exchange rate developments, in particular the weakness of theeuro vis-à-vis the dollar, contributed to the dollar price decline ofmanufactured and agricultural products.
Goods traded within Western Europe are largely priced ineuro or other European currencies and their prices are notchanged in the short run if the European currencies change intheir dollar value. In 1999, the dollar appreciated vis-à-vis theeuro and other European currencies which meant that roughlystable prices in euro terms for intra-West European tradedeclined once in dollar terms. As Western Europe’s intra-tradeaccounts for 30% of world trade, these price changes haverepercussions at the global level.
The impact of trade policy on annual changes in trade flowsis usually difficult to evaluate. In the case of multilateral orregional trade liberalization, the reduction of tariffs and non-tariff barriers is typically phased in over a number of years. Thisresults in a modest impact in a given year, often dwarfed byother factors such as the business cycle or exchange ratevariations. Beginning in 1999, the bulk of the Uruguay Roundtariff cuts have been completed in the developed countries –with some exceptions – notably in textiles and agriculture.Consequently, the customs duty collected on imports has
decreased between 1994 and 1999 by 10% to US$39.4 billionfor the United States, the EU (15) and Japan, which combinedaccount for nearly one half of world imports. As their importsincreased over the same period by 40%, the ratio of collectedduties to imports has decreased by about one third. Thesereductions closely match those calculated for the bound MFNtariffs agreed in the Uruguay Round. In 1999, the ratio of dutiescollected to imports ranged from 2.5% for the US (excludingimports from NAFTA partners), over 2.3% in Japan and to 1.7%for the EU (excluding intra-EU imports).
Trade flows of regional integration agreements (RIAs) evolvedquite differently in 1999. While NAFTA intra-trade expanded by11% – in line with the increase in overall imports – its exportsto all other regions decreased slightly. The recession inMERCOSUR countries led to a contraction of intra-trade by onequarter while exports to regions outside Latin Americastagnated. EU intra-trade lagged behind extra-imports butexceeded extra-regional exports. Among the four major RIAs,only the ASEAN grouping recorded an expansion of intra-tradewhich exceeded somewhat the growth of extra-regional exportsand imports.
2. Trade developments in the first halfof 2000 and outlook
Economic activity in the first half of 2000 picked up morestrongly than most forecasters had projected at the beginning ofthe year. Recent IMF projections point to global GDP growth of4.5% for 2000,2 1 percentage point more than the precedingyear. Stronger demand has already resulted in more dynamictrade growth.
Data available for the first six months of 2000 indicate thatthe value of world merchandise trade grew by 14% or four timesfaster than in 1999. Oil exporting countries achieved aboveaverage growth due to the continued rise of oil prices whichstarted to exceed US$30 per barrel on the spot markets in thesecond quarter. Asia’s imports and exports rose by about onequarter. China’s trade expanded by more than one third. In thefirst six months of 2000, imports of the five Asian developingcountries most affected by the 1997/1998 financial crisis againexceeded their pre-crisis level. US imports rose by 21% whileexports increased by 14%, contributing to a new record currentaccount deficit of US$400 billion equivalent to 4.5% of GDP.Western Europe’s exports and imports in dollar terms rose by 4and 6% respectively. Latin America’s imports recovered andexports rose by about 20%.
Price developments by major product groups differeddramatically in the first half of 2000. While oil prices surged by90%, non-fuel commodity prices recovered by 5%, those ofmanufactures remained almost unchanged on a year-to-yearbasis. A major element in the stability of dollar prices formanufactured goods is the weakness of the euro vis-à-vis the USdollar.
The volume of world merchandise trade rose by about 12%.On the assumption that real trade growth is losing some of itssteam in the second half but is still growing on a seasonallyadjusted basis, the real growth of world merchandise exportsshould exceed some 10% and thereby match the best annual
1. Information on international capital flows is taken from IMF, InternationalCapital Markets, September 2000.2. Measured with weights using purchasing power parities. Using weights basedon market exchange rates – a method retained in WTO statistics – the projectedgrowth for 2000 is 4.1 % (see IMF, WEO Sept. 2000, Annex Table 1).

Ove
rvie
w
3
trade growth in the 1990s. For 2001 a deceleration of worldtrade to 7% is expected.
3. Global trade and outputdevelopments
The acceleration in the growth of both global GDP andmerchandise production to 2.5% in 1999 was accompanied byan expansion in merchandise trade of 5%, which was unchangedfrom the preceding year. Trade in manufactures rose 6% –significantly faster than trade in agricultural products. For bothproduct groups the expansion in 1999 was somewhat fasterthan in 1998. Exports of mining products, however, dropped by4.5% in real terms, the first such decline since 1985. Miningoutput decreased 2% due to lower oil and coal production. Thisshows a rather unusual development in an otherwise expandingeconomy. The source of these developments can be found in theoil industry, by far the largest segment of the mining sector. Asprices of crude oil fell to a low of nearly US$10 per barrel in thefirst quarter of 1999, OPEC and other oil producing countriesagreed to cut back on oil output. OPEC countries reduced theiroutput by about 4% in 1999, which was a marked departurefrom the steady expansion of their output during the previousten years. OECD countries also met still rising oil demand by amarked run down of stocks.
The volume of exports of agricultural products (includingprocessed food) in 1999 benefitted from above average growthin Western Europe and the return to positive growth in NorthAmerican and Asian shipments. Agricultural production rose by1.5%, somewhat faster than in the preceding year but still lessthan over the 1990-99 period.
As might be expected, world trade in manufactures in 1999diverged across regions. While the exports of manufactures fromLatin America, Asia and North America expanded above theglobal average in 1999, those of Western Europe grew less thanin the preceding year and less than the world average.Manufacturing production is estimated to have risen by 3.5%,which is somewhat faster than in 1998 and throughout the1990s when output rose by about 2% annually.
In 1999 trade growth across all major product groupsremained below the average rate for the 1990-1999 period. Thedifferences were particularly stark for agricultural products and,above all, mining products. The latter group expanded by 4.5%
annually in the 1990s but dropped by about the same amount in1999.
A comparison of trade and output growth by sector showsthat the historically large gap between the two rates observed inthe 1990s narrowed considerably in 1999 for agriculturalproducts and manufactures and was even reversed for miningproducts. Consequently, 1999 witnessed the smallest excess oftotal merchandise trade over output growth in the 1990s.Whether this is only an exceptional development linked to thegyration of the energy markets or a more general feature of theworld economy remains to be seen. The indications available forthe first half of 2000 with very strong trade growth, however,suggest that it was largely a temporary phenomenon (see Table I.1).
4. Merchandise trade by product
The pattern of merchandise trade growth by product groupwas broadly similar to that experienced over the 1990s with thenotable exception of fuels. All primary product groups, and ironand steel saw their share in world trade decline steadily in the1990s and a decrease in their value in 1999. Despite the markedincrease in the export value of fuels, the share of this productgroup in world trade was only 7.3% in 1999 – still threepercentage points below its share in 1990. The product groupswhich recorded the largest gains in market share throughout the1990s were office and telecom equipment, chemicals andautomotive products which also recorded above average growthin 1999.
Primarily due to weaker prices, the value of food andagricultural raw materials decreased for the third year in a row.Food exports declined by almost 4%, which was one of thestrongest decreases among all product groups. With theexception of Australia and New Zealand, all major exportingregions experienced a decline in their agricultural exports. LatinAmerica and Africa, home of many developing countriesexporting primarily agricultural products, recorded the strongestexport decreases.3 Although highly sensitive to cyclical variationsin global demand growth, the world export values for non-ferrous metals, ores and minerals and iron and steel decreasedfurther in 1999. This was despite the acceleration of globaleconomic activity over the course of 1999. Again weaker pricesfor these products played a major role in these developments.This was especially true in the case of iron and steel which sawglobal exports drop by 11% in 1999, the strongest decrease ofall 14 product categories distinguished in this report. Thesteepest export and import declines in this product group wererecorded for Latin America and the transition economies.
In 1999, world exports of textiles continued to decrease whileglobal trade in clothing increased by about one-and-a-half percent. In fact, throughout the 1990s the share of textiles in worldexport levels tended to decline, reaching a record low of 2.7%last year. In contrast, the share of clothing exports remainedbetween 3 to 3.5%. The 1990s also saw a major shift amongthe leading suppliers in terms of shares of world textiles trade.Western Europe, which accounted for more than one half ofworld textiles exports in 1990, saw its share falling by 10percentage points to 43%, while Asia’s share advanced by 6
Chart 2
World merchandise trade and output growthby major product group, 1999(Annual percentage change in volume terms)
Manufactures
Agriculturalproducts
Mining products
All merchandise
-4 -2 0 2 4 6 8Source: Table I.1
1 3 5 7-1 -3-5
Exports
Output
3. From the 33 countries for which exports of agricultural products account formore than one half of their total merchandise exports, 28 are found in LatinAmerica and Africa. Developing countries’ agricultural exports contain a relativelyhigh share of primary agricultural products – a product segment in whichinternational trade expanded far less rapidly in the 1990s than for value addedagricultural products.

Ove
rvie
w
4
percentage points, nearly matching the share of Western Europein 1999. Smaller gains in market share could be observed forNorth America and Latin America, in particular in the 1995-1999period.
Western Europe, North America and Japan togetheraccounted for more than four fifths of world clothing imports in1999. Import growth among these three leading importersdiffered widely. Japan’s imports recovered by 11%, while NorthAmerica’s slowed down sharply from the double digit growthrecorded in the two preceding years. Western Europe’s importscontinued to decline moderately, partly due to the weakness ofthe euro vis-à-vis the US dollar. Since 1995, North America’sshare in world clothing imports has increased from one quarterto more than 30% in 1999, while Western Europe and Japan’sshare decreased by 3.5 and 2.5 percentage points respectively.Clothing exports from the Asian region recovered by 2.5% dueto the strength of shipments to Japan and Western Europe.Although Asia remains the world’s largest supplier of clothing,with a 43% share in 1999, this is well below its peak level of48% reached in 1993, and has remained rather stable over thelast four years. The most dynamic region in terms of clothingexports throughout the 1990-1999 period was Latin America. Byexpanding its shipments annually by 20%, the region has nearlytripled its share in world exports to 10.3% in 1999. Throughoutthe 1990s Latin American exporters gained considerable marketshares in the US primarily at the expense of Hong Kong, China;the Republic of Korea and Chinese Taipei. In 1999, however, theslowdown in North America also contributed to a markeddeceleration for Latin America’s clothing exports as the regiontakes more than 90% of Latin America’s clothing exports.
Although the transition economies’ clothing exportsdecreased in 1999, overall their shipments expanded throughoutthe 1990s at twice the pace of global clothing trade. Like LatinAmerica, shipments from transition economies are highlyconcentrated on one major market, Western Europe, which alonetakes nearly 90% of its total clothing exports. The outstandingexpansion and high regional concentration of clothing exports ofLatin America and the transition economies must be partlyattributable to preferences given in various regional integrationarrangements, which link these regions closely to the NorthAmerican and Western European markets (see Tables IV.75-82).
Among manufactures, exports of automotive products andoffice and telecom equipment recorded the strongest growth in1999, at 5.5 and 10%, respectively. As the registrations of new
automobiles recovered, production and trade expanded strongly.However, large regional differences in demand prevailed, whichin some cases were accentuated by exchange rate developments.North America’s imports of automotive products surged by 18%while its exports, largely concentrated on NAFTA countries,increased by 12%.
The importance of the North American market for global tradein automotive products is highlighted by the fact that the size ofits imports increased by US$31 billion in 1999 – a figure whichexceeded the rise in total world trade in automotive products.
While North America is the world’s largest net importer andAsia the largest net exporter of automotive products, WesternEurope remains the largest exporting and importing region withthe balance tipped slightly towards exports. As intra-WestEuropean trade accounts for about four fifths of Western Europe’sexports of automotive products, the marked slowdown fromdouble-digit growth in 1998 to near stagnation in 1999 led to amodest overall increase in the region’s trade. The most dynamicexporters of automobiles have not been the large traditionalproducers, but rather Mexico, the Republic of Korea, Brazil andCentral/Eastern Europe, which expanded their exports at doubledigit rates throughout the 1990s (see Tables IV.59 – IV.66).
World trade in office and telecom equipment was stimulatedby strong demand growth for computers, semi-conductors andmobile phones. It has been estimated that the dollar value ofworld exports in mobile phones rose by one quarter, that ofsemiconductors by nearly 15% and that of computers (includingparts) by somewhat less than 10%. In many respects office andtelecom equipment comprises the hardware component oftoday’s revolution in information technology. Trade in thisproduct category has been growing more than two times fasterthan total trade, not only in 1999, but also throughout the1990s.
Asia, which accounts for nearly one half of world exports ofoffice and telecom equipment, contributed most to the return tohigher growth as both exports and imports expanded by about15% – considerably faster than the trade of other regions.
Developing countries in Asia have a unique role in the worldsupply of office and telecom products as they account not onlyfor more than one third of world exports, but also for onequarter of world imports due to their extensive intra-industryexchanges. North America also accounted for one quarter ofworld imports – and grew only slightly faster than world trade asa whole. In contrast to Asia and North America, Western Europeis the largest importer of office and telecom equipment andrecorded a sharp deceleration of its export and import growth toabout 3 to 5% in 1999 (see Tables IV.51 – IV.58).
Trade in fuels rose by 19% to US$400 billion in 1999,recovering about one half of the losses recorded in the precedingyear. The increase in fuel exports was equivalent to about onethird of global nominal trade growth. Oil prices increased bymore than one third in 1999 without fully recovering from theirdecline in preceding years. World export prices of fuels increasedconsiderably less than crude oil prices on spot markets. Crude oilimported under long-term contracts, oil products and natural gasrecorded less price pressure and dampened the overall fuel priceincrease in 1999. Of the nearly 25 countries for which fuelaccounts for one half or more of their total export earnings, 10are situated in the Middle East. The Middle East is not only theregion with the highest share of fuels in its exports, but also byfar the largest fuel exporter, accounting for nearly 30% of worldfuel exports. Middle East fuel exports rose by nearly one third in1999. African fuel exports increased by one fifth, but their valueremained below the peak of 1997. Among the other regional netexporters of fuels, Latin America’s exports rose well above theglobal average, while the transition economies as a group
Chart 3
World merchandise trade by product, 1999
(Annual percentage change in value terms)
Fuels
Office and telecom equipmentAutomotive products
Average
Other consumer goods
Chemicals
Other semi- manufactures
-10-12 -8 -6 -4 -2 0 2 4 6 8 10 12 14 16 18 20
Source: Table IV.1
Clothing
Other mach. and transport equipm.
Non-ferrous metals
Textiles
Agricultural products
Ores and minerals
Iron and steel

Ove
rvie
w
5
recorded only a 10% increase largely due to the furthercontraction of the region’s intra-trade. Looking at world trade infuels in the 1990s, one notices that the shares of regions inworld fuel exports have changed only marginally. On the importside, however, significant changes have occurred. The share ofWestern Europe and Japan in world fuel imports decreased by7.5 and 3 percentage points respectively, while developing Asiaand Latin America increased their shares by 7 and 1 percentagepoints respectively. The higher share of these two regions alsoreflects their above average economic growth in the 1990s.Despite the increased weight of developing countries in worldfuel imports, the combined share of North America, WesternEurope and Japan in world imports amounted to close two thirdsin 1999 (see Tables IV.20 – IV.24).
5. Commercial services trade in 1999
World exports of commercial services rose by 1.5% toUS$1350 billion in 1999. As in the preceding year, the overallmodest trade expansion conceals rather large regional year-to-year variations. North America and Asia recorded a strongerperformance in 1999 over the previous year, while EasternEurope, the transition economies and Latin America were muchweaker.
Particularly strong export and import growth in commercialservices was achieved in the United States and the Asiandeveloping countries. In the case of North America, it wastransportation services which, linked to the boomingmerchandise trade, recorded untypically the strongest growthamong the three major services categories. In Asia, travel servicesexports and imports both recovered by about 9% after a doubledigit decline in 1998. The weaker performance of WesternEurope’s commercial services trade could be observed in all threeproduct categories, but was most pronounced in the residualgroup “Other commercial services”. Latin America’s contractionof commercial services imports was most pronounced for travelservices, which decreased by 11%. However, on the export side,travel services still recorded a modest increase indicating that thecontraction of intra-regional travel could be offset by an increaseof travel receipts from tourists outside the region.
Africa’s commercial services exports are estimated to haveexpanded by 8.5% in 1999, the strongest increase among all
regions. The recovery in Africa’s exports can be largely attributedto the rebound of Egypt’s tourist earnings which lifted Egypt’sexports of commercial services by 18%. However, Africa’sexports, excluding Egypt, still increased by about 4%, faster thanthe global average.
The transition economies form the only region which recordeda sharp contraction in both exports and imports. The shrinking ofRussia’s exports and imports by about one quarter has been themajor element in this development.
While large differences could be observed in the year-to-yearvariations of commercial services trade by region for the world asa whole, the differences across major product categoriesremained in a rather narrow range of an average of 1.5%.Throughout the 1990s, global transportation and travel servicesreceipts expanded by 3.5 and 6% annually, markedly less thanthose of “Other commercial services”, which rose to 8.5%.However, in 1999 trade in “Other commercial services”expanded only at the average rate. The less dynamic growth inthis product category could be observed across all major regionsand is the principal reason why total commercial services tradeexpanded less rapidly than merchandise trade in 1999 for thefirst time since 1995.4 The principal factor behind the lacklustregrowth of this service category would appear to be the decline inconstruction services as well as a marked deceleration in thegrowth of royalties and license fees.
6. Trade by region
North America continued to be the major motor of globaltrade expansion in 1999. With a share of slightly more than onefifth of world imports, its increase in merchandise imports ofUS$128 billion and of commercial services imports of nearlyUS$16 billion accounted for more than one half of the expansionof both world merchandise and commercial services trade. Thestrength of US domestic demand, combined with the high valueof the dollar, pushed the United States’ shared worldmerchandise imports to 18%, a level never before reached inhistory.
For the third year in a row, North America’s GDP growthexceeded 4%, contributing to an inflation adjusted import rise ofmore than 10% annually. Real merchandise export growthaccelerated somewhat but remained at nearly 6%, about halfthe rate recorded for imports. Again for the third year in a row,the value of North America’s commercial services imports rosefaster than commercial services exports. The region’s economicperformance is largely determined by the growth patterns of theUS economy which is marked by an even larger divergencebetween export and import growth than the regional aggregate.As a result of these developments, the US merchandise tradedeficit continued to widen, the surplus in commercial servicestrade eroded and the US current account deficit amounted to3.7% of GDP exceeding the 1987 peak. Although Canada’s GDPgrowth matched that of the US in 1999, its domestic demandgrowth was markedly lower than that of the US, which is onefactor explaining why merchandise exports and imports bothexpanded by 10.5% in real terms. Another major factor in thestrength of Canada’s exports has been the rise by one quarter inthe value of shipments of automotive products to the UnitedStates. Favourable price trends also contributed to the fact that
Chart 4
Commercial services trade by selected region, 1999
(Annual percentage change in value terms)
North America
Asia
Western Europe World average
Africa
Latin America
Transitioneconomies
-10 -8 -6 -4 -2 0 2 4 6 8 10Source: Table I.4
Imports
Exports 4. The statistical data in respect to the category “Other commercial services”seem to be in general of a weaker quality than that of transportation and travelservices. The former group is subject to more frequent changes in methods andrevisions at the national level and its year-to-year developments have apparently amuch weaker link to business cycles than transportation and travel.

Ove
rvie
w
6
the value growth of exports exceeded that for imports for bothmerchandise and commercial services trade.
An analysis of North America’s merchandise exports by majordestinations reflects the large differences in other regions’ importdemand growth and, in most cases, a loss of market share forNorth American products. Intra-North American trade – whichaccounts for nearly 40% of North America’s exports – rose by10%, slightly less than the region’s imports. Exports to Asia –which account for slightly more than one fifth of total exports –rose by 3%, while Asia’s imports recovered by 10%. NorthAmerica’s exports to Western Europe rose by nearly 3%,somewhat faster than Western Europe’s total imports. A markedfall in US food exports (-US$2.4 billion) was more than offset bystrong growth in shipments of US aircraft (+ US$3 billion), officeand telecom equipment (+ US$1.5 billion) and Canadian fuelexports (+ US$2 billion). North American exports to Latin America(excluding Mexico), the Middle East, Africa and the transitioncountries declined by between 10 and 25% (see Table III.10).
North American imports from Asia, Western Europe and LatinAmerica (excluding Mexico), rose by about 10% – at the samerate as intra-North American trade. Above average growth wasrecorded for shipments from Mexico and the Middle East.Imports from Africa and the transition economies rose by 5-6% –or only half the rate of total imports.
The major changes in the origin of North American importsbetween 1990 and 1999 are to be found not at the regional butat the country level. While China increased its share of NorthAmerican imports by 4.5 percentage points to 7.4%, Japan’sshare decreased by 5%. The share of the four high-incomedeveloping Asian economies (Hong Kong, China; the Republic ofKorea; Singapore and Chinese Taipei) also fell by 2.5 percentagepoints. On balance, Asia’s share remained unchanged at 34.5%.Mexico’s share in North American imports increased to 9.2% in1999 – an increase of 4 percentage points since 1990. The shareof all the other Latin American countries combined declined by1% (see Table III.11).
The main feature of the structural change in North Americanexports in the 1990s is the increased prominence of intra-NorthAmerican trade – especially exports to Mexico. While the exportsto NAFTA countries accounted for nearly 50% of the region’sexports – an increase of 9 percentage points since 1990 –exports to Western Europe and Asia experienced a correspondingdecline. This major change occurred as exports to NAFTAcountries rose by nearly 10% annually, or twice the growth rateof exports to Asia and Western Europe.
Latin America’s GDP, which expanded by 3.5% between1990 and 1997, slowed down in 1998 and stagnated in 1999.Imports of merchandise and commercial services declined for thefirst time in the 1990s, contrasting sharply with the very dynamicgrowth throughout the 1990-98 period. The average growth ofLatin American trade and output growth masks the very differentexperience of the region’s leading trader, Mexico, and the otherLatin American countries. Mexico, which accounts for about 45%of the region’s total merchandise trade, recorded double digitmerchandise export and import growth in 1999, while all otherLatin American countries reported a steep fall in their importsand a stagnation in the value of their exports. The principalexplanation for this divergent picture can be found in Mexico’shigh integration with the North American trading system, whileother Latin American countries depend much more on intra-regional trade, which has been shrinking.
Latin America’s merchandise trade is highly concentratedamong a few countries. Mexico and Brazil alone account for60% of the region’s merchandise trade, and the top five tradersaccount for more than three quarters of the region’smerchandise exports and imports.
Chart 5 ranks the Latin American countries according to theiroverall merchandise trade value in 1999. It shows thatmerchandise trade often plays a more important role for smallereconomies than for larger ones, if measured by the value of percapita trade. The per capita trade values by country in 1999 alsoreveal the large differences between countries, and indicate theimportance of trade to economies with small populations.
The annual variation in merchandise exports in 1999 reflectsthe above average growth of the oil exporting countries (e.g.Venezuela, Netherlands Antilles and Bahamas) and the aboveaverage decline of the MERCOSUR countries. The outstandinggrowth of Costa Rican exports is linked to the sharp rise inshipments from a new micro-processor plant, lifting the share ofoffice and telecom equipment in Costa Rica’s exports to nearly40%. As regards export developments in 1990-99, the oilexporting countries report below average growth, while Mexico,the Dominican Republic, Costa Rica, El Salvador and Panamareport average annual growth rates ranging from 10 to 18%.
The gravity of the recession in Central and South Americafound its repercussions in a marked import contraction among15 countries. Despite the widespread recession in the region,8 countries expanded their imports by more than 10%. Thecountries which recorded high import and export growth werethe Dominican Republic, Costa Rica, El Salvador and Panama.
Table 1
GDP and trade developments in North America, 1990-99
(Annual percentage change)
GDP 3.1 4.2 4.2 3.1 4.3 4.1 2.2 3.0 4.2
Merchandise
Exports (nominal) 6.7 -0.7 4.1 6.5 -0.9 1.9 7.2 0.0 11.3
Imports (nominal) 8.0 4.6 11.2 8.3 5.0 12.2 6.7 2.6 6.9
Exports (real) 7.0 3.5 6.0 6.5 2.5 4.5 8.5 8.0 10.5
Imports (real) 8.5 10.5 11.0 8.5 11.5 11.5 8.5 4.5 10.5
Commercial services
Exports (nominal) 7.5 2.5 5.6 7.5 2.2 5.6 7.1 5.0 5.9
Imports (nominal) 6.4 6.4 7.8 7.0 8.4 8.8 3.8 -1.3 3.4
North America United States Canada
1990-99 1998 1999 1990-99 1998 1999 1990-99 1998 1999

Ove
rvie
w
7
0
20
40
60
80
100
120
140
160
180
200
0
1000
2000
3000
4000
5000
6000Netherlands Antilles
(14,300)
Costa RicaTrinidad and
Tobago
Barbados
Average
-5
0
5
10
15
20
25
-30
-20
-10
0
10
20
30
Chart 5
Latin America. Merchandise trade by country, 1990-99
Merchandise trade of Latin American countries, 1999(Exports plus imports, billion dollars)
Merchandise exports of Latin American countries, 1990-99(Average annual percentage change in dollar values)
Per capita merchandise trade of Latin American countries, 1999(Exports plus imports, dollars)
Merchandise exports of Latin American countries, 1999(Percentage change in dollar values)
Merchandise imports of Latin American countries, 1990-99(Average annual percentage change in dollar values)
Merchandise imports of Latin American countries, 1999(Percentage change in dollar values)
Mexico(285)
Brazil
Argentina
VenezuelaChile
Colombia
Chile
20
15
10
5
0
-5
-10
-15
30
20
10
0
-10
-20
-30
Mexico
Costa Rica
Chile Panama
Average Guyana
Brazil
Venezuela
Cuba
Argentina
MexicoVenezuela
Costa Rica
Netherlands Antilles
Bahamas
Haiti
Average
Uruguay
Honduras
Paraguay
Costa Rica
NetherlandsAntilles
Haiti
Average
Average
Honduras
Argentina
Nicaragua
Cuba
Guyana
Mexico
NicaraguaHaiti
Colombia
Ecuador(-46) Paraguay
Dominica
Bahamas(9,800)

Ove
rvie
w
8
This was largely due to their extensive processing trade with theUnited States. Taking a mid-term view, the expansion of importsbetween 1990 and 1999 exceeded the global average rate of6% for two thirds of Latin American countries. There are onlytwo countries in Latin America whose import and export value in1999 was below the 1990 level. In the case of Cuba, the declineof its merchandise trade was largely concentrated in the 1990-92 period and is linked to the break up of its previously closetrade ties with the former centrally-planned economies inEurope. In the second half of the 1990s, Cuba’s imports ofmerchandise expanded rapidly while exports stagnated.
Latin America’s commercial services exports and imports areless concentrated among a few major traders than is the case formerchandise trade although the three leading traders remainMexico, Brazil and Argentina. The most dynamic exporters ofcommercial services are not the large economies of the region,but the Dominican Republic and Cuba, which report double digitexport growth not only in 1999 but throughout the 1990-99period. This is due to their booming tourism industry.
The decline in Mexico’s exports of commercial services in1999 can be partly attributed to the marked fall in touristearnings, which still accounted for two thirds of Mexico’s servicesexports. Mexico’s commercial services imports rose by 9%, whilefor other Latin American countries commercial services imports
decreased by 10% on average. The largest decline is reported byBrazil (less 24%) and Ecuador (less 16%). The developments in1999 differ from trends observed over the 1990s in so far asMexico’s average annual import growth of 4% was much smallerthan the average growth of the other Latin American countrieswhich rose by 8% – even faster than world trade in commercialservices (see Table III.28).
The slowdown of Western Europe’s trade in 1999 has to beseen in conjunction with the region’s weakening GDP growth.Exports and imports of merchandise and commercial servicesstagnated in nominal dollar terms.5 Adjusted for the deflation indollar terms, merchandise exports and imports expanded bynearly 4% in real terms. The impact of the US dollar rise vis-à-visWest European currencies had a larger impact on nominal tradeflows in dollar terms than the deceleration in volumes. WesternEurope’s exports by product groups show declines across allcategories except fuels, office and telecom equipment, chemicalsand automotive products. While the value decline for most otherproduct groups ranged between 2 and 4%, textiles and iron andsteel products recorded above average decreases. The decline in
Table 2
GDP and trade developments in Latin America, 1990-99
(Annual percentage change)
GDP 3.0 2.1 -0.1 3.1 4.8 3.7 3.0 1.4 -1.0
Merchandise
Exports (nominal) 8.1 -1.3 6.4 14.4 6.4 16.4 4.7 -6.2 -0.8
Imports (nominal) 11.3 5.0 -3.0 14.6 14.0 13.6 8.9 0.1 -13.2
Exports (real) 8.5 7.5 7.5 14.0 11.0 13.5 5.5 5.5 3.0
Imports (real) 10.5 8.5 -1.0 12.5 16.0 15.5 9.0 4.5 -11.0
Commercial services
Exports (nominal) 6.5 7.0 -0.5 5.5 6.5 -1.0 7.0 7.0 0.0
Imports (nominal) 6.5 4.5 -6.5 3.5 7.0 9.5 8.0 4.0 -10.0
Latin America Mexico Latin America excl. Mexico
1990-99 1998 1999 1990-99 1998 1999 1990-99 1998 1999
Table 3
GDP and trade developments in Western Europe, 1990-99
(Annual percentage change)
GDP 1.8 2.6 2.0 1.8 2.6 2.3 ... ... ...
Merchandise
Exports (nominal) 4.1 3.5 -0.4 4.1 4.0 -0.6 4.6 -0.3 -1.8
Imports (nominal) 4.0 5.5 0.6 4.0 5.9 1.1 4.3 4.6 2.9
Exports (real) 6.0 6.0 4.0 6.0 6.5 3.5 3.5 0.5 3.5
Imports (real) 5.5 8.0 4.0 5.5 8.5 4.0 4.0 7.0 5.0
Commercial services
Exports (nominal) 4.9 7.2 -0.7 5.0 7.1 0.2 ... ... ...
Imports (nominal) 5.0 9.3 0.8 5.4 9.5 0.4 ... ... ...
Western Europe European Union (15) EU (15) extra-trade
1990-99 1998 1999 1990-99 1998 1999 1990-99 1998 1999
5. If measured in euro terms, Western Europe’s exports of merchandise andcommercial services rose by 4.6 and 4.2 %, respectively, in 1999.

Ove
rvie
w
9
0
200
400
600
800
1000
1200
0
5000
10000
15000
20000
25000
30000
35000
0
5
10
15
0
5
10
15
Germany
FranceUnited Kingdom
ItalyNetherlands
Ireland Iceland
Belgium-LuxembourgIreland
Netherlands
Switzerland
Germany
Iceland
Average
Turkey
AverageNetherlands
Spain
Ireland
Turkey
Portugal
n.a.
15
10
5
0
-5
-10
-15
Average
Spain
Ireland
Turkey
Greece
n.a.
15
10
5
0
-5
-10
-15
Spain
Ireland
Average
Greece
Norway
Turkey
Belgium-Luxembourg
Germany
Ireland
Norway
Italy
Finland Portugal
Greece
Average
Chart 6
Western Europe. Merchandise trade by country, 1990-99
Merchandise trade of Western European countries, 1999(Exports plus imports, billion dollars)
Merchandise exports of Western European countries, 1990-99(Average annual percentage change in dollar values)
Per capita merchandise trade of Western European countries, 1999(Exports plus imports, dollars)
Merchandise exports of Western European countries, 1999(Percentage change in dollar values)
Merchandise imports of Western European countries, 1990-99(Average annual percentage change in dollar values)
Merchandise imports of Western European countries, 1999(Percentage change in dollar values)

Ove
rvie
w
10
imports followed a similar pattern in that the highest and lowestgrowth rates are reported across the same product categories.The product groups with the most dynamic growth in 1999 –office and telecom equipment and automotive products – alsorecorded above average growth throughout the 1990s with thenoticeable exception of fuels (see Tables III.31 and III.32).
Western Europe’s export growth by destination differedacross regions. While intra-West European trade stagnated,shipments to North America rose by 11.5%. Exports to thetransition economies fell by nearly 10%, and to Latin America,Africa and the Middle East by about 6 to 7%. The recovery inWestern Europe’s exports to Asia remained moderate at 2%. Thedouble digit growth of shipments to Japan and China was offsetby a further contraction of shipments to other Asian developingcountries. The products which contributed most to the doubledigit growth of exports to North America and Japan were aboveall chemicals and automotive products (see Appendix Table A7).
Western Europe’s exports of commercial services decreasedslightly in 1999 as transportation receipts fell by about 2.5%.Travel receipts stagnated, and receipts from “Other commercialservices” grew by a modest 1%. Due to the importance of intra-regional trade, the sectoral growth pattern of commercialservices imports was rather similar to that of exports. One of theoutstanding developments in Western Europe’s commercialservices trade was the sharp deceleration in “Other commercialservices” trade, which might be partly attributed to a change inthe recording methods of some countries.
Western Europe’s merchandise trade by country in 1999 and1990-1999 is reported in Chart 6. Norway and Ireland recordedthe fastest export growth in 1999, thanks to the importance offuels and office and telecom equipment in their export baskets.Spain, Ireland and Greece recorded the strongest import growth.On the other hand, Turkey’s imports fell by 12% as its economycontracted under the repercussions of a major earthquake.
In the 1990-1999 period, Ireland, Spain and Turkey achievedby far the highest growth for merchandise exports and importsamong the West European countries. Three of the four largestWest European traders, (e.g. France, Germany and Italy) recordedexport and import growth below the European average.
The transition economies grew by nearly 2% in 1999, yetreal exports are estimated to have decreased by 1.5% and realimports by nearly 9%. These developments contrast with thepreceding years (1995-1998) when trade expanded strongly at atime when output growth was on average slightly negative. This
seemingly anomalous trend can be attributed largely todevelopments in Russia which led to a steep fall of intra-tradeamong transition economies. Efforts by the Central/EasternEuropean countries to limit their current account deficits in thewake of overall stagnating merchandise exports resulted in amoderate import reduction.
Following Russia’s financial crisis, the steep devaluation of therouble, and a contraction of output in 1998, the Russianeconomy recovered in 1999 by about 3%. Under the impact ofthe devaluation, merchandise imports plunged by a further 30%.Domestic producers regained competitiveness, maintained theirexport level and increased their market shares at home. Thecontraction of Russia’s imports translated into a fall of exportsfor those economies for which Russia was a principal exportmarket (e.g. Belarus, Moldavia and Lithuania).
Moderate GDP growth for the group of Central/East Europeancountries, together with the deceleration in West Europeanimport growth and stagnating net capital inflows, led to amarked slow down in trade growth, particularly for imports. Theimportance of Western Europe in the trade of Central/EastEuropean countries has risen steadily over the last years. In1999, Western Europe was the destination for three quarters ofCentral/East European merchandise exports. Western Europe alsoprovided two thirds of merchandise imports for these countries(see Tables III.48 and III.49). The product composition ofmerchandise exports has changed markedly. Exports ofmanufactured goods account now for more than 80% of totalexports due to the very marked increase of the share ofautomotive products and office and telecom equipment.
A summary review of merchandise trade of all the transitioneconomies provided in Chart 7 shows that 17 out of 21transition economies recorded a decrease of their imports in1999. In 12 cases, the decrease ranges between 10 and 45%.For merchandise exports, the number of economies withincreasing exports in 1999 nearly matches those with decreasingexports. Some of the smaller traders report even exceptionallystrong growth, linked to the marked rise in their crude oil andnatural gas production. For 1999, one third of the transitioncountries report a lower export and import value than for 1995,underscoring the numerous difficulties these countries face intheir efforts to participate in the expansion of world trade. Overthe same period, four countries – Hungary, Estonia, Azerbaijanand Georgia – recorded an expansion of exports and imports ofover 10% annually.
Table 4
GDP and trade developments in transition economies, 1995-99
(Annual percentage change)
GDP 0.3 -1.1 1.8 2.1 1.9 1.8 -1.5 -4.6 3.0
Merchandise
Exports (nominal) 7.5 -4.5 -0.5 6.5 9.5 1.0 4.0 -16.0 0.0
Imports (nominal) 8.5 -2.0 -11.5 8.5 11.0 -1.0 -1.0 -19.5 -30.5
Exports (real) 4.5 5.0 -1.5 ... ... ... ... ... ...
Imports (real) 5.5 4.5 -9.0 ... ... ... ... ... ...
Commercial services
Exports (nominal) 1.0 0.5 -10.0 0.0 10.5 -5.5 -3.5 -12.0 -26.5
Imports (nominal) -1.5 0.5 -8.0 2.5 12.0 3.0 -11.0 -14.0 -23.5
Transition economies C./E. Europe Russian Federation
1995-99 1998 1999 1995-99 1998 1999 1995-99 1998 1999

Ove
rvie
w
11
0
20
40
60
80
100
120
-15
-10
-5
0
5
10
15
20
-30
-20
-10
0
10
20
30
40
50
60
70
80
-15
-10
-5
0
5
10
15
20
-50
-40
-30
-20
-10
0
10
20
30
40
50
Russian Fed.
Poland
Czech Rep.Hungary
UkraineSlovak Rep.
RomaniaBelarus
6000
5000
4000
3000
2000
1000
0
Czech Rep.Hungary
Slovak Rep.
Estonia
Lithuania Latvia
Bulgaria Average
Georgia
Hungary
Estonia
Bulgaria
Average
Georgia
Ukraine
Uzbekistan
Moldova, Rep. of
ArmeniaTajikistan
Albania
Azerbaijan
Hungary
Lithuania
Average
UkraineUzbekistan
Moldova, Rep. of
Albania
Azerbaijan
BelarusKygyzstan
Turkmenistan
Hungary
Estonia Latvia
Average
Georgia
Ukraine
Moldova, Rep. of
Albania
Turkmenistan
Poland
Kazakhstan
Russian Fed.
Hungary Bulgaria
Average
Moldova, Rep. of
Albania
BelarusKygyzstan
Turkmenistan
Poland
Russian Fed.
Romania
Chart 7
Transition economies. Merchandise trade by country, 1995-99
Merchandise trade of transition economies, 1999(Exports plus imports, billion dollars)
Merchandise exports of transition economies, 1995-99(Average annual percentage change in dollar values)
Per capita merchandise trade of transition economies, 1999(Exports plus imports, dollars)
Merchandise exports of transition economies, 1999(Percentage change in dollar values)
Merchandise imports of transition economies, 1995-99(Average annual percentage change in dollar values)
Merchandise imports of transition economies, 1999(Percentage change in dollar values)

Ove
rvie
w
12
Africa’s economic expansion continued at about 3% in1999, unchanged from the rate in the two proceeding years, andhardly above the region’s population growth. Merchandiseexports recovered strongly in both nominal and real terms.Merchandise imports, however, stagnated as the further strongdecrease in South Africa’s imports was balanced principally byhigher imports among the oil-exporting countries. For commercialservices, the available data also points to a sharp increase inexports and a moderate decline in imports. The strength ofAfrica’s commercial services exports can be attributed to thedynamic growth of travel receipts in four countries, Egypt,Morocco, Tunisia and Mauritius. Africa’s total travel receipts areestimated to have recovered by 16%, reaching a new peak ofUS$14 billion.
Africa’s merchandise trade developments are still stronglyaffected by commodity price developments. While the recovery offuel prices boosted the earnings of the fuel exporting countriesby about one quarter, the further double digit decline of non-fuelcommodities prices in 1999 led to another decrease in Africa’sexports in agricultural products. Africa’s exports of manufacturedgoods, however, expanded strongly, in particular chemicals andother semi-manufactures.
About one half of Africa’s merchandise exports are destinedto Western Europe, a share which was somewhat less than atthe beginning of the decade. EU imports from Africa recoveredby 6% in 1999, due largely to the double digit growth of fuelsimports. Despite this recovery, EU fuels imports from Africa werestill well below their 1990 level. Imports of manufactures andagricultural products, however, rose by an average of 6 and 2%respectively over the 1990-1999 period. Among manufacturedgoods, clothing imports rose by 8% annually, amounting toUS$6.8 billion or 11% of total imports from Africa in 1999.
Asia gained in importance as an export destination forAfrican exports, largely due to Asian developing countries’growing demand for African mining products and, in particular,fuels. North America’s share of Africa’s exports roughly equalledAsia’s share – at some 15% each – in 1999. These shares wereunchanged from 1990. Intra-African trade accounts for nearly10% of Africa’s merchandise exports in 1999.
A comparison of the merchandise trade developments of 40African countries in 1999 against the period 1990-99 is shownin Chart 8. Their merchandise trade value in 1999 ranges frommore than US$50 billion (South Africa) to less than US$500million (Rwanda). The top five African traders account for morethan one half of Africa’s total merchandise trade. Africa’s tradeper capita was about US$300. Three countries – Botswana,Gabon and Mauritius – report per capita trade of about
US$3000, but for more than 20 countries per capita trade isbelow the regional average.
Export and import growth in 1999 showed large variationsfrom country to country. Seven fuel exporting countries reporteddouble digit growth in exports for 1999 – in contrast to the period1990-1999 when the majority of these same countries reportedfalling or stagnating exports. Among the 12 African countrieswhich reported a drop in their export earnings in 1999, BurkinaFaso, Cameroon, Ethiopia and Malawi experienced the sharpestcontractions, ranging from 15 to 30%. About one quarter of theAfrican countries in our sample reported export growth at orabove the global average for the 1990-99 period.6 Although thedifferences in import growth rates among the African countries areless pronounced than for exports, they remain very large. Theimports of 13 African countries decreased, while 8 other Africancountries recorded import growth of above 10% in 1999.
Due to the oil price developments, the Middle East’s exportsrecovered to US$170 billion in 1999, which was still below the1997 level. Iraq and Yemen recorded outstanding increases whilenon-fuel exporters, Lebanon, Jordan and Cyprus reported amodest increase or even a decline in their merchandise exportvalue. Israel’s exports rose by 12%, benefitting from the strongexpansion of international demand for office and telecomequipment, which accounted for nearly one fifth of Israel’smerchandise export revenues. The region’s merchandise importsincreased by 3% to US$150 billion. Eight countries saw importsfall, while Iraq, Israel, Qatar and Yemen recorded double digitimport growth.
Developments by country in 1999 differ significantly fromtrends throughout the 1990-1999 period. Despite their strongexport recovery, the value of exports from Iran and Iraq in 1999was still below 1990 levels, while Israel and Jordan’s exportsrose by 9 and 6% annually (see Table III.64).
Chart 9 also shows per capita merchandise trade by country.It reveals the large differences that prevail among Middle Easteconomies. Merchandise exports and imports per capita in fourof the five economies with populations exceeding 15 millionrange between US$300 and US$700, while in seven economieswith smaller populations per capita trade ranges betweenUS$5000 and US$20000.
In the aftermath of the financial crisis of 1997/1998, Asia’strade and output recovered strongly. The region’s GDP growthmatched the growth of the global economy as a whole, whileAsia’s merchandise and commercial services trade exceeded the
Table 5
GDP and trade developments in Africa, 1990-99
(Annual percentage change)
GDP 2.3 3.2 3.1 1.4 0.5 1.2 2.6 3.9 3.5
Merchandise
Exports (nominal) 1.0 -15.5 8.5 2.0 -9.0 1.5 0.5 -18.0 11.0
Imports (nominal) 4.0 1.0 0.0 4.5 -9.5 -8.5 3.5 5.0 2.5
Commercial services
Exports (nominal) 5.0 -2.5 8.5 3.5 -1.0 -6.5 5.5 -3.0 12.0
Imports (nominal) 3.0 -1.5 -2.5 2.5 -9.0 -1.5 3.0 0.0 -2.5
Africa South Africa Africa excl. South Africa
1990-99 1998 1999 1990-99 1998 1999 1990-99 1998 1999
6. In some cases, the high average growth was achieved from exceptionally lowlevels in 1990.

Ove
rvie
w
13
0
-30
-20
-10
0
10
20
30
40
-30
-20
-10
0
10
20
30
40
South Africa
AlgeriaNigeria
EgyptMorocco
Libyan Arab JamahiriyaTunisia
0
Tunisia
Libyan A. J.
BotswanaGabon Mauritius
Namibia
Swaziland
Average
Rwanda
3500
3000
2500
2000
1500
1000
500
25
20
15
10
5
0
-5
-10
Average
Morocco
GhanaKenya
Sudan
Uganda Lesotho
Mozambique
Rwanda
Zambia
CameroonLibyan Arab Jamahirya
Côte d'Ivoire
Cameroon
EthiopiaMalawi
Burkina Faso
Average
Mozambique
Sudan
Congo R.
Gabon
AngolaLibya A.J.
25
20
15
10
5
0
-5
-10
Average
Ghana
Sudan
Uganda
Benin
Congo, R
Zambia
Congo, D.R.
Average
Sudan
Egypt
TanzaniaEthiopia
Congo, D.R.
Chad
Burkina FasoKenya
60
50
40
30
20
10
Chart 8
Africa. Merchandise trade by country, 1990-99
Merchandise trade of African countries, 1999(Exports plus imports, billion dollars)
Merchandise exports of African countries, 1990-99(Average annual percentage change in dollar values)
Per capita merchandise trade of African countries, 1999(Exports plus imports, dollars)
Merchandise exports of African countries, 1999(Percentage change in dollar values)
Merchandise imports of African countries, 1990-99(Average annual percentage change in dollar values)
Merchandise imports of African countries, 1999(Percentage change in dollar values)

Ove
rvie
w
14
0
20
40
60
80
100
0
5000
10000
15000
20000
25000
0
5
10
15
20
-20
-10
0
10
20
30
40
50
60
70
80
-20
-10
0
10
20
30
40
50
60
70
80
Saudi Arabia
Israel United Arab Emirates
Iran, Islamic Rep. of
KuwaitIraq
Oman QatarCyprus
Israel
United Arab Emirates
Kuwait
Iraq
Qatar
Cyprus
Average
Bahrain
Jordan
Iran YemenSyrian A.R.
-5
Israel
Kuwait
Iraq
Average
Iran
UAE
Syrian Arab Republic
Lebanon
Jordan
Yemen
Israel
KuwaitOman
Qatar
Cyprus
Average
Jordan
IranSaudi Arabia
Lebanon
Iraq
Yemen
Oman
20
15
10
5
0
-5
SaudiArabia
Israel
United Arab Emirates
Kuwait
Iraq
Oman
Qatar
Cyprus
Average
Bahrain
Jordan
Iran
Lebanon
Yemen
Saudi Arabia
Israel
Kuwait
Iraq
Oman
Qatar
Cyprus
Average
Bahrain Jordan
IranUAEYemen
LebanonSyrian Arab
Republic
Chart 9
Middle East. Merchandise trade by country, 1990-99
Merchandise trade of Middle Eastern countries, 1999(Exports plus imports, billion dollars)
Merchandise exports of Middle Eastern countries, 1990-99(Average annual percentage change in dollar values)
Per capita merchandise trade of Middle Eastern countries, 1999(Exports plus imports, dollars)
Merchandise exports of Middle Eastern countries, 1999(Percentage change in dollar values)
Merchandise imports of Middle Eastern countries, 1990-99(Average annual percentage change in dollar values)
Merchandise imports of Middle Eastern countries, 1999(Percentage change in dollar values)

Ove
rvie
w
15
world average. Large variations could be observed at the countrylevel for both output and trade. The five Asian developingcountries most affected by the crisis recorded a GDP growth of6% – or about twice the global income growth. However, theirreturn to positive growth was quite uneven as individual GDPgrowth rates ranged from Indonesia’s near stagnation to theRepublic of Korea’s growth of above 10%. The region’s largesteconomy, Japan, recorded sluggish growth. The most populouscountries, China and India, achieved an outstandingly high GDPgrowth of about 6 to 7%.
Following the severe contraction of dollar trade values in1998, Asia’s merchandise and commercial services tradeexpanded dramatically in 1999 – once again exceeding theglobal average. The recovery of intra-regional trade, exchangerate developments, higher commodity prices and strong globaldemand for information technology products were the principalfactors underpinning Asia’s trade expansion in 1999. The rise inAsia’s merchandise exports by 7.5% was boosted by double digitgrowth of intra-regional exports and a rise of 14% in theregion’s office and telecom equipment exports. Import growthexceeded export growth in both nominal and real terms.Although the five Asian countries most affected by the1997/1998 crisis recorded an import surge of about 15%, thisincrease could not fully offset the steep fall in the precedingyears. Japan’s import rise in real terms was rather strong giventhe sluggish state of its economy.
Asia’s commercial services exports rose by 3.5% to US$264billion in 1999. Travel and transportation receipts recovered by9 and 6% respectively in conjunction with the region’s tradeand output recovery. However, other commercial servicesreceipts, comprising communication, construction, financialservices and royalties and licence fees, recorded a furtherdecline in 1999. The decline across this product group wasparticularly marked in China, Chinese Taipei, Japan and thePhilippines, and was not fully offset by gains from India andSingapore (see Table 1.7).
Data on Asia’s merchandise trade by country are provided inChart 10. The chart highlights the big variations in per capitatrade values between high and middle income countries and lowones. While the former report per capita trade values of aboutUS$6000 and upwards, the latter group typically displays valueswell below US$500.
Many Asian low income countries with a modest share inworld trade achieved outstandingly high export growth in both1999 and throughout the 1990/1999 period. Seven of thesecountries report export and import growth rates well above theAsian average rates. Export growth exceeding 10% annually canbe found for Bangladesh, Cambodia, the Lao People’sDemocratic Republic, Myanmar, Nepal and Viet Nam. Among theleading traders in Asia, China expanded its merchandise trade atnearly twice the rate of Asia as a group in the 1990s, whileJapan’s trade growth lagged behind.
Table 6
Trade developments in the Middle East, 1990-99
(Annual percentage change)
Merchandise
Exports (nominal) 17 5 -23 24 2 4 3
Imports (nominal) 7 8 -3 3 6 4 5
Commercial services
Exports (nominal) 3 13 7 -3 5 5 5
Imports (nominal) 7 11 -4 2 4 4 4
1996 1997 1998 1999 1990-95 1995-99 1990-99
Table 7
GDP and trade developments in Asia, 1990-99
(Annual percentage change)
GDP 3.3 -0.8 2.9 1.2 -2.8 0.3 5.0 -8.3 6.1
Merchandise
Exports (nominal) 7.3 -6.0 7.5 4.3 -7.8 8.1 10.5 -3.5 10.2
Imports (nominal) 6.0 -17.8 10.3 3.2 -17.2 11.0 6.4 -30.9 15.0
Exports (real) 7.5 3.5 7.5 2.5 -1.5 2.0 13.0 13.0 13.0
Imports (real) 7.0 -8.5 11.5 4.5 -5.5 9.5 7.0 -22.5 16.0
Commercial services
Exports (nominal) 8.1 -14.8 3.4 4.3 -9.3 -2.4 10.5 -24.2 2.3
Imports (nominal) 7.3 -10.8 5.3 3.4 -9.3 3.1 10.7 -26.3 5.9
Asia Japan Asia (5) a
1995-99 1998 1999 1995-99 1998 1999 1995-99 1998 1999
a The five countries most affected by the financial crisis in 1997/98 are Indonesia, Republic of Korea, Malaysia, Philippines and Thailand.

Ove
rvie
w
16
0
100
200
300
400
500
600
700
800
0
2000
4000
6000
8000
10000
12000
14000
16000
18000
20000
-10
0
5
10
15
20
25
30
-30
-20
-10
0
10
20
30
40
-30
-20
-10
0
10
20
30
40
Japan
ChinaHong Kong, China
Korea, Rep. ofChinese Taipei
SingaporeMalaysia
AustraliaThailand
IndiaIndonesia
PhilippinesNew Zealand
China
Hong Kong, China(51,000)
Singapore(56,000)
MalaysiaAustralia
Thailand
India
New Zealand
Average
Brunei Darussalam
Macau, China
Chinese Taipei
Samoa
-5
China
Hong Kong, China
MalaysiaThailand
Philippines Viet Nam
MyanmarBangladesh
Sri Lanka
Mongolia
Nepal
Cambodia
Average
Lao People'sDem. Rep. Malaysia
Thailand
Philippines Viet Nam
Mongolia
Nepal
Cambodia
Average
Lao People'sDem. Rep.
Maldives
Samoa
Sri Lanka
Brunei Darussalam
30
25
20
15
10
5
0
-5
-10
Philippines
Viet Nam
Mongolia
Cambodia
Average
Lao People'sDem. Rep.
China
Hong Kong,China
Myanmar
Japan
Indonesia
Bangladesh
India
Maldives
Thailand
Mongolia
Nepal
Average
Maldives
Samoa
Brunei Darussalam MyanmarIndonesia
China
Hong Kong,China
Korea, Rep. of
New Zealand Pakistan
MalaysiaSingapore
Chart 10
Asia. Merchandise trade by country, 1990-99
Merchandise trade of Asian countries, 1999(Exports plus imports, billion dollars)
Merchandise exports of Asian countries, 1990-99(Average annual percentage change in dollar values)
Per capita merchandise trade of Asian countries, 1999(Exports plus imports, dollars)
Merchandise exports of Asian countries, 1999(Percentage change in dollar values)
Merchandise imports of Asian countries, 1990-99(Average annual percentage change in dollar values)
Merchandise imports of Asian countries, 1999(Percentage change in dollar values)
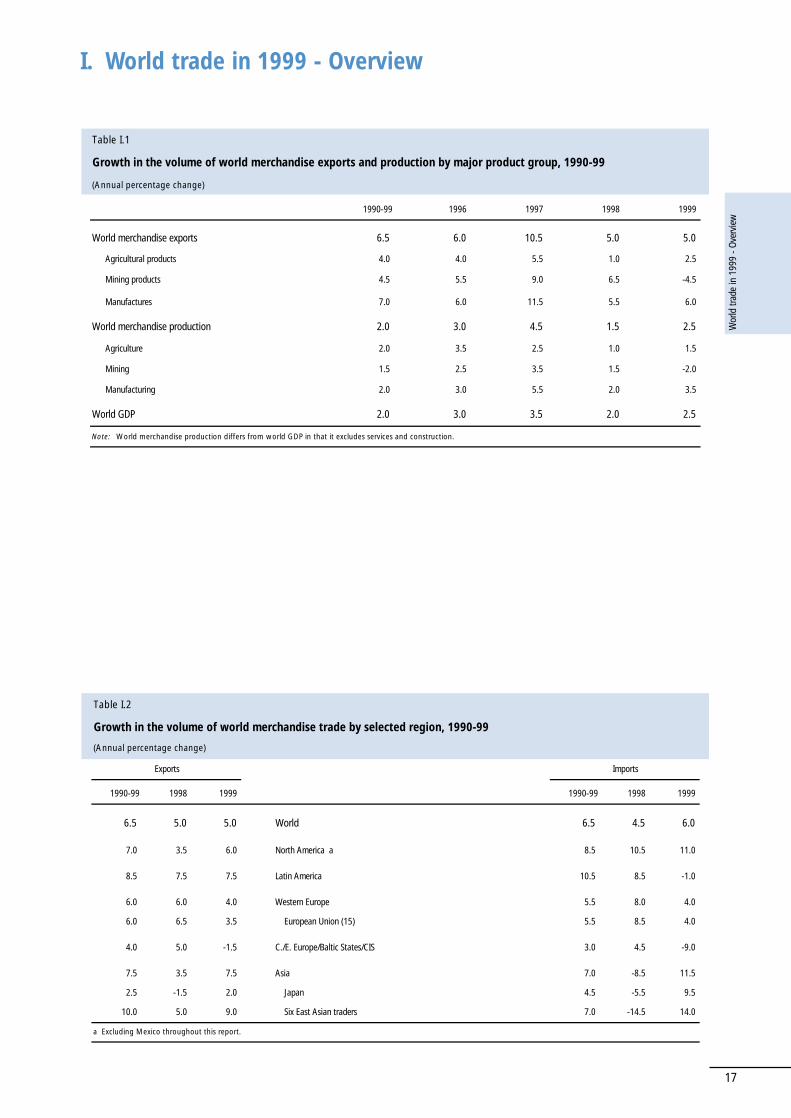
I. World trade in 1999 - Overview
Wor
ld tr
ade
in 1
999
- Ove
rvie
w
17
Table I.1
Growth in the volume of world merchandise exports and production by major product group, 1990-99
(Annual percentage change)
1990-99 1996 1997 1998 1999
World merchandise exports 6.5 6.0 10.5 5.0 5.0
Agricultural products 4.0 4.0 5.5 1.0 2.5
Mining products 4.5 5.5 9.0 6.5 -4.5
Manufactures 7.0 6.0 11.5 5.5 6.0
World merchandise production 2.0 3.0 4.5 1.5 2.5
Agriculture 2.0 3.5 2.5 1.0 1.5
Mining 1.5 2.5 3.5 1.5 -2.0
Manufacturing 2.0 3.0 5.5 2.0 3.5
World GDP 2.0 3.0 3.5 2.0 2.5
Note: World merchandise production differs from world GDP in that it excludes services and construction.
Table I.2
Growth in the volume of world merchandise trade by selected region, 1990-99
(Annual percentage change)
Exports Imports
1990-99 1998 1999 1990-99 1998 1999
6.5 5.0 5.0 World 6.5 4.5 6.0
7.0 3.5 6.0 North America a 8.5 10.5 11.0
8.5 7.5 7.5 Latin America 10.5 8.5 -1.0
6.0 6.0 4.0 Western Europe 5.5 8.0 4.0
6.0 6.5 3.5 European Union (15) 5.5 8.5 4.0
4.0 5.0 -1.5 C./E. Europe/Baltic States/CIS 3.0 4.5 -9.0
7.5 3.5 7.5 Asia 7.0 -8.5 11.5
2.5 -1.5 2.0 Japan 4.5 -5.5 9.5
10.0 5.0 9.0 Six East Asian traders 7.0 -14.5 14.0
a Excluding Mexico throughout this report.

Wor
ld tr
ade
in 1
999
- Ove
rvie
w
18
Table I.3
Growth in the value of world merchandise trade by region, 1999
(Billion dollars and percentage)
Exports Imports
Value Annual percentage change Value Annual percentage change
1999 1990-99 1998 1999 1999 1990-99 1998 1999
5473 5 -2 3 World 5729 6 -1 4
934 7 -1 4 North America a 1280 8 5 11
297 8 -1 6 Latin America 335 11 5 -3
2353 4 4 0 Western Europe 2418 4 6 1
2180 4 4 -1 European Union (15) 2232 4 6 1
214 6 -5 -1 C./E. Europe/Baltic States/CIS 214 5 -2 -12
102 7 9 1 Central and Eastern Europe 131 10 11 -1
112 - -14 -2 Baltic States and the CIS 83 - -14 -24
112 1 -16 9 Africa 133 4 1 0
170 3 -23 24 Middle East 150 5 -3 3
1394 7 -6 8 Asia 1200 6 -18 10
419 4 -8 8 Japan 311 3 -17 11
195 14 0 6 China 166 13 -1 18
546 8 -7 8 Six East Asian traders 485 6 -25 11
a Excluding Mexico throughout this report.
Note: It should be mentioned at the outset that there are breaks in the continuity of the figures at the country and regional levels. These breaks are indicated in Appendix
Tables A3 and A4. Explanations of significant breaks are given in the Technical Notes.
Table I.4
Growth in the value of world trade in commercial services by selected region, 1999
(Billion dollars and percentage)
Exports Imports
Value Annual percentage change Value Annual percentage change
1999 1990-99 1998 1999 1999 1990-99 1998 1999
1350 6 1 1 World 1345 6 2 2
288 7 3 6 North America a 219 6 6 8
53 7 7 0 Latin America 62 7 5 -6
640 5 7 -1 Western Europe 609 5 9 1
574 5 7 0 European Union (15) 561 5 9 0
29 5 -3 8 Africa 35 3 -1 -2
264 8 -15 3 Asia 336 7 -11 5
24 17 -3 -1 China 31 25 -5 16
60 4 -9 -2 Japan 114 3 -9 3
124 9 -18 7 Six East Asian traders 121 9 -13 7
a Excluding Mexico throughout this report.
Note: It should be mentioned at the outset that there are numerous breaks in the continuity of the figures at the country and regional levels due to frequent revisions to
the trade in services data. See the Technical Notes.

Wor
ld tr
ade
in 1
999
- Ove
rvie
w
19
Table I.5
Leading exporters and importers in world merchandise trade, 1999
(Billion dollars and percentage)
Annual Annualpercentage percentage
Rank Exporters Value Share change Rank Importers Value Share change
1 United States 695.2 12.4 2 1 United States 1059.1 18.0 122 Germany 541.5 9.6 0 2 Germany 472.5 8.0 03 Japan 419.4 7.5 8 3 United Kingdom 320.3 5.4 24 France 300.4 5.3 -2 4 Japan 311.3 5.3 115 United Kingdom 269.0 4.8 -1 5 France 290.1 4.9 06 Canada 238.4 4.2 11 6 Canada 220.2 3.7 77 Italy 230.6 4.1 -6 7 Italy 216.9 3.7 -18 Netherlands 200.4 3.6 0 8 Netherlands 187.6 3.2 09 China 195.2 3.5 6 9 Hong Kong, China 180.7 3.1 -3
10 Belgium 176.3 3.1 - retained imports a 28.7 0.5 -2110 China 165.8 2.8 18
11 Hong Kong, China 174.4 3.1 0 11 Belgium 160.9 2.7 - domestic exports 22.4 0.4 -9 12 Mexico 148.7 2.5 14 re-exports 152.0 2.7 1 13 Spain 144.8 2.5 9
12 Korea, Rep. of 144.7 2.6 9 14 Korea, Rep. of 119.8 2.0 2813 Mexico 136.7 2.4 16 15 Singapore 111.1 1.9 914 Taipei, Chinese 121.6 2.2 10 retained imports a 65.1 1.1 1815 Singapore 114.7 2.0 4 16 Taipei, Chinese 110.7 1.9 5
domestic exports 68.7 1.2 8 17 Switzerland 79.9 1.4 0 re-exports 46.0 0.8 -1 18 Australia 69.1 1.2 7
16 Spain 110.1 2.0 1 19 Austria 68.8 1.2 117 Sweden 84.9 1.5 0 20 Sweden 68.5 1.2 018 Malaysia 84.5 1.5 1519 Switzerland 80.4 1.4 220 Russian Fed. 74.3 1.3 0
21 Ireland 70.4 1.3 9 21 Malaysia 65.0 1.1 1122 Austria 63.5 1.1 1 22 Brazil 51.7 0.9 -1523 Thailand 58.4 1.0 7 23 Thailand 50.3 0.9 1724 Australia 56.1 1.0 0 24 Ireland 46.4 0.8 425 Saudi Arabia b 50.5 0.9 27 25 Poland 45.9 0.8 -226 Denmark 49.0 0.9 2 26 India 44.6 0.8 427 Indonesia 48.7 0.9 0 27 Denmark 44.3 0.8 -428 Brazil 48.0 0.9 -6 28 Russian Fed. 41.1 0.7 -3029 Norway 44.9 0.8 13 29 Turkey 40.4 0.7 -1230 Finland 41.7 0.7 -3 30 Portugal 38.6 0.7 1
31 Philippines 36.7 0.7 24 31 Norway 34.0 0.6 -632 India 36.6 0.6 9 32 Israel 33.2 0.6 1333 United Arab Emirates b 29.5 0.5 15 33 Philippines 32.5 0.6 334 Poland 27.4 0.5 -3 34 Finland 31.5 0.5 -335 Czech Rep. 26.9 0.5 2 35 Greece 30.2 0.5 536 South Africa 26.7 0.5 1 36 United Arab Emirates b 28.9 0.5 637 Turkey 26.0 0.5 -4 37 Czech Rep. c 28.8 0.5 038 Israel 25.8 0.5 12 38 Saudi Arabia 28.0 0.5 -739 Hungary 25.0 0.4 9 39 Hungary 28.0 0.5 940 Portugal 23.9 0.4 -4 40 South Africa 26.7 0.5 -9
41 Argentina 23.3 0.4 -12 41 Argentina 25.5 0.4 -1942 Venezuela 19.9 0.4 15 42 Indonesia 24.0 0.4 -1243 Iran, Islamic Rep. of b 16.2 0.3 27 43 Egypt 16.0 0.3 -144 Chile 15.6 0.3 5 44 Chile 15.1 0.3 -1945 New Zealand 12.5 0.2 3 45 Venezuela 14.8 0.3 -746 Kuwait b 12.2 0.2 27 46 New Zealand 14.3 0.2 1447 Algeria b 11.9 0.2 17 47 Iran, Islamic Rep. of b 13.2 0.2 648 Ukraine 11.6 0.2 -8 48 Ukraine 11.8 0.2 -1949 Colombia 11.6 0.2 7 49 Viet Nam 11.6 0.2 150 Viet Nam 11.5 0.2 23 50 Slovak Rep. c 11.2 0.2 -14
Total of above d 5354.0 95.2 - Total of above d 5434.0 92.4 -World d 5625.0 100.0 3 World d 5881.0 100.0 4
a Retained imports are defined as imports less re-exports. See the Technical Notes.
b Secretariat estimates.
c Imports are valued f.o.b.
d Includes significant re-exports or imports for re-export.
Note: For annual data 1989-99, see Appendix Tables A3 and A4.

Wor
ld tr
ade
in 1
999
- Ove
rvie
w
20
Table I.6
Leading exporters and importers in world merchandise trade (excluding intra-EU trade), 1999
(Billion dollars and percentage)
Annual Annual percentage percentage
Rank Exporters Value Share change Rank Importers Value Share change
1 Extra-EU exports 795.6 18.8 -2 1 United States 1059.1 23.6 122 United States 695.2 16.4 2 2 Extra-EU imports 843.4 18.8 33 Japan 419.4 9.9 8 3 Japan 311.3 6.9 114 Canada 238.4 5.6 11 4 Canada 220.2 4.9 75 China 195.2 4.6 6 5 Hong Kong, China 180.7 4.0 -36 Hong Kong, China 174.4 4.1 0 retained imports a 28.7 0.6 -21
domestic exports 22.4 0.5 -9 6 China 165.8 3.7 18 re-exports 152.0 3.6 1 7 Mexico 148.7 3.3 14
7 Korea, Rep. of 144.7 3.4 9 8 Korea, Rep. of 119.8 2.7 288 Mexico 136.7 3.2 16 9 Singapore 111.1 2.5 99 Taipei, Chinese 121.6 2.9 10 retained imports a 65.1 1.4 18
10 Singapore 114.7 2.7 4 10 Taipei, Chinese 110.7 2.5 5 domestic exports 68.7 1.6 8 re-exports 46.0 1.1 -1
11 Malaysia 84.5 2.0 15 11 Switzerland 79.9 1.8 012 Switzerland 80.4 1.9 2 12 Australia 69.1 1.5 713 Russian Fed. 74.3 1.8 0 13 Malaysia 65.0 1.4 1114 Thailand 58.4 1.4 7 14 Brazil 51.7 1.2 -1515 Australia 56.1 1.3 0 15 Thailand 50.3 1.1 1716 Saudi Arabia b 50.5 1.2 27 16 Poland 45.9 1.0 -217 Indonesia 48.7 1.1 0 17 India 44.6 1.0 418 Brazil 48.0 1.1 -6 18 Russian Fed. 41.1 0.9 -3019 Norway 44.9 1.1 13 19 Turkey 40.4 0.9 -1220 Philippines 36.7 0.9 24 20 Norway 34.0 0.8 -6
21 India 36.6 0.9 9 21 Israel 33.2 0.7 1322 United Arab Emirates b 29.5 0.7 15 22 Philippines 32.5 0.7 323 Poland 27.4 0.6 -3 23 United Arab Emirates b 28.9 0.6 624 Czech Rep. 26.9 0.6 2 24 Czech Rep. c 28.8 0.6 025 South Africa 26.7 0.6 1 25 Saudi Arabia 28.0 0.6 -726 Turkey 26.0 0.6 -4 26 Hungary 28.0 0.6 927 Israel 25.8 0.6 12 27 South Africa 26.7 0.6 -928 Hungary 25.0 0.6 9 28 Argentina 25.5 0.6 -1929 Argentina 23.3 0.6 -12 29 Indonesia 24.0 0.5 -1230 Venezuela 19.9 0.5 15 30 Egypt 16.0 0.4 -1
31 Iran, Islamic Rep. of b 16.2 0.4 27 31 Chile 15.1 0.3 -1932 Chile 15.6 0.4 5 32 Venezuela 14.8 0.3 -733 New Zealand 12.5 0.3 3 33 New Zealand 14.3 0.3 1434 Kuwait b 12.2 0.3 27 34 Iran, Islamic Rep. of b 13.2 0.3 635 Algeria b 11.9 0.3 17 35 Ukraine 11.8 0.3 -1936 Ukraine b 11.6 0.3 -8 36 Viet Nam 11.6 0.3 137 Colombia 11.6 0.3 7 37 Slovak Rep. c 11.2 0.3 -1438 Viet Nam 11.5 0.3 23 38 Pakistan 10.8 0.2 1639 Nigeria b 11.3 0.3 16 39 Colombia 10.7 0.2 -2740 Slovak Rep. 10.2 0.2 -5 40 Morocco 10.6 0.2 3
41 Iraq b 9.7 0.2 76 41 Romania 10.4 0.2 -1242 Libyan Arab Jamahiriya b 9.1 0.2 37 42 Nigeria b 10.4 0.2 443 Pakistan 8.9 0.2 4 43 Slovenia 10.0 0.2 -244 Slovenia 8.6 0.2 -5 44 Algeria b 9.8 0.2 445 Romania 8.5 0.2 2 45 Tunisia 8.5 0.2 246 Morocco 7.4 0.2 3 46 Dominican Republic b 8.2 0.2 847 Oman 7.2 0.2 31 47 Peru 8.1 0.2 -1848 Costa Rica 6.6 0.2 19 48 Croatia 7.8 0.2 -749 Peru 6.1 0.1 7 49 Bangladesh b 7.7 0.2 1050 Belarus 5.9 0.1 -16 50 Kuwait 7.6 0.2 -12
Total of above d 4088.0 96.4 - Total of above d 4277.0 95.2 -World (excl. intra-EU trade) d 4241.0 100.0 5 World (excl. intra-EU trade) d 4492.0 100.0 5
a Retained imports are defined as imports less re-exports. See the Technical Notes.
b Secretariat estimates.
c Imports are valued f.o.b.
d Includes significant re-exports or imports for re-export.

Wor
ld tr
ade
in 1
999
- Ove
rvie
w
21
Table I.7
Leading exporters and importers in world trade in commercial services, 1999
(Billion dollars and percentage)
Annual Annualpercentage percentage
Rank Exporters Value Share change Rank Importers Value Share change
1 United States 253.4 18.8 6 1 United States 180.4 13.4 9
2 United Kingdom 101.5 7.5 3 2 Germany 132.8 9.9 3
3 France 82.6 6.1 -2 3 Japan 114.2 8.5 3
4 Germany 79.3 5.9 0 4 United Kingdom 81.4 6.0 4
5 Italy 61.2 4.5 -8 5 France 63.1 4.7 -4
6 Japan 60.3 4.5 -2 6 Italy 58.4 4.3 -7
7 Netherlands 54.2 4.0 3 7 Netherlands 47.5 3.5 1
8 Spain 53.0 3.9 8 8 Canada 38.5 2.9 3
9 Belgium-Luxembourg 39.0 2.9 6 9 Belgium-Luxembourg 36.6 2.7 7
10 Hong Kong, China 34.9 2.6 4 10 China 30.7 2.3 16
11 Canada 34.2 2.5 6 11 Spain 30.0 2.2 11
12 Austria 30.5 2.3 -4 12 Austria 28.3 2.1 -6
13 Switzerland 26.3 1.9 2 13 Korea, Rep. of 26.1 1.9 11
14 Korea, Rep. of 24.8 1.8 4 14 Ireland 26.1 1.9 -9
15 China 23.7 1.8 -1 15 Hong Kong, China 24.5 1.8 -2
16 Singapore 23.6 1.7 25 16 Taipei, Chinese 23.5 1.7 1
17 Sweden 18.4 1.4 4 17 Sweden 23.0 1.7 6
18 Australia 17.2 1.3 9 18 Singapore 18.8 1.4 8
19 Turkey a 16.0 1.2 … 19 Australia 17.9 1.3 6
20 Denmark 15.8 1.2 4 20 Norway 17.7 1.3 16
21 Norway 15.4 1.1 10 21 India 17.2 1.3 21
22 Taipei, Chinese 14.5 1.1 -13 22 Switzerland 16.1 1.2 5
23 Thailand 14.1 1.0 8 23 Denmark 15.2 1.1 -4
24 Ireland 14.0 1.0 -12 24 Malaysia a 14.3 1.1 …
25 India 13.9 1.0 26 25 Thailand 14.0 1.0 18
26 Malaysia a 12.0 0.9 … 26 Mexico 13.8 1.0 9
27 Mexico 11.8 0.9 -1 27 Russian Fed. 12.4 0.9 -23
28 Israel 10.3 0.8 15 28 Brazil 11.9 0.9 -24
29 Greece a 10.1 0.7 … 29 Indonesia 11.3 0.8 -4
30 Poland 10.0 0.7 -9 30 Israel 10.8 0.8 12
31 Egypt 9.3 0.7 18 31 Saudi Arabia 9.5 0.7 9
32 Russian Fed. 9.1 0.7 -27 32 Turkey a 8.4 0.6 …
33 Portugal 8.3 0.6 -3 33 Argentina 8.2 0.6 -7
34 Czech Rep. 6.8 0.5 -8 34 Poland 7.6 0.6 16
35 Brazil 6.8 0.5 -5 35 Finland 7.6 0.6 -2
36 Finland 6.6 0.5 -2 36 Philippines 7.5 0.6 …
37 Hungary 5.6 0.4 -5 37 Portugal 6.5 0.5 -3
38 Saudi Arabia 5.2 0.4 9 38 Egypt 6.0 0.4 1
39 South Africa 4.8 0.4 -6 39 Czech Rep. 5.6 0.4 -1
40 Philippines 4.8 0.4 … 40 South Africa 5.2 0.4 -1
Total of above 1240.0 91.7 - Total of above 1225.0 90.9 -
World 1350.0 100.0 1 World 1345.0 100.0 2
a Secretariat estimate.
Note: Figures for a number of countries and territories have been estimated by the Secretariat. Annual percentage changes and rankings are affected by continuity breaks
in the series for a large number of economies, and by limitations in cross-country comparability. See the Technical Notes. For annual data 1989-99, see Appendix Tables A5 and A6.

Wor
ld tr
ade
in 1
999
- Ove
rvie
w
22
Table I.8
Share of goods and commercial services in the total trade of selected regions and economies, 1999
(Billion dollars and percentage, based on balance of payments data)
Exports Imports
Value Share Value Share
Commercial CommercialTotal Goods services Total Goods services
World 6890 80.4 19.6 6870 80.4 19.6
North America 1216 76.3 23.7 1469 85.1 14.9 Canada 277 87.7 12.3 259 85.1 14.9 United States 939 73.0 27.0 1211 85.1 14.9
Latin America 358 85.1 14.9 386 83.8 16.2 Argentina 28 84.5 15.5 32 74.7 25.3 Brazil 55 87.7 12.3 61 80.5 19.5 Chile 19 80.8 19.2 18 77.9 22.1 Colombia 14 86.7 13.3 14 76.2 23.8 Mexico 149 92.0 8.0 156 91.1 8.9 Venezuela 20 93.4 6.6 19 76.3 23.7
Western Europe 2934 78.2 21.8 2822 78.4 21.6 Austria 94 67.6 32.4 96 70.4 29.6 Belgium-Luxembourg 192 79.6 20.4 182 79.9 20.1 Denmark 65 75.8 24.2 58 73.9 26.1 Finland 48 86.4 13.6 38 80.0 20.0 France 381 78.3 21.7 341 81.5 18.5 Germany 619 87.2 12.8 602 77.9 22.1 Greece 15 34.5 65.5 26 80.5 19.5 Ireland 81 82.7 17.3 69 62.2 37.8 Italy 292 79.0 21.0 269 78.3 21.7 Netherlands 222 75.6 24.4 199 76.2 23.8 Norway 61 74.8 25.2 56 68.6 31.4 Portugal 34 75.6 24.4 46 85.9 14.1 Spain 164 67.7 32.3 170 82.4 17.6 Sweden 104 82.2 17.8 92 75.0 25.0 Switzerland 122 78.4 21.6 109 85.2 14.8 Turkey 45 64.7 35.3 48 82.6 17.4 United Kingdom 369 72.5 27.5 392 79.2 20.8
Africa 147 80.1 19.9 158 77.7 22.3 Egypt 15 36.1 63.9 21 71.8 28.2 Morocco 10 72.4 27.6 11 86.6 13.4 Nigeria 14 92.9 7.1 12 72.2 27.8 South Africa 33 85.6 14.4 30 82.5 17.5 Tunisia 9 68.0 32.0 9 87.9 12.1
Asia 1788 85.3 14.7 1616 79.2 20.8 Australia 73 76.5 23.5 84 78.6 21.4 China 218 89.2 10.8 189 83.8 16.2 Hong Kong, China a 210 83.4 16.6 202 87.9 12.1 India 51 72.9 27.1 63 72.6 27.4 Indonesia 53 91.3 8.7 41 72.5 27.5 Japan 464 87.0 13.0 395 71.1 28.9 Korea, Rep. of 170 85.4 14.6 143 81.7 18.3 Malaysia 96 87.5 12.5 76 81.1 18.9 New Zealand 17 74.8 25.2 18 74.3 25.7 Philippines 39 87.7 12.3 37 79.6 20.4 Singapore a 139 83.0 17.0 123 84.8 15.2 Taipei, Chinese 136 89.3 10.7 129 81.8 18.2 Thailand 71 80.0 20.0 57 75.6 24.4
Memorandum item:
European Union (15) 2680 78.6 21.4 2579 78.2 21.8
a Trade in goods includes significant re-exports or imports for re-exports.
Note: Trade in goods is derived from balance of payments statistics and does not correspond to the merchandise trade statistics given elsewhere in this report.
It is likely that for most economies trade in commercial services is understated. See the Technical Notes.

Wor
ld tr
ade
in 1
999
- Ove
rvie
w
23
Table I.9
Merchandise trade of selected regional integration arrangements, 1999
(Billion dollars and percentage)
Share in totalValue exports/imports Annual percentage change
1999 1990 1998 1999 1990-99 1998 1999
APEC (21)
Total exports 2497 100.0 100.0 100.0 7 -4 6 Intra-exports 1774 67.5 69.3 71.0 8 -7 9 Extra-exports 723 32.5 30.7 29.0 6 4 0Total imports 2625 100.0 100.0 100.0 7 -7 10 Intra-imports 1883 65.4 71.3 71.8 8 -6 11 Extra-imports 741 34.6 28.7 28.2 5 -10 8
EU (15)
Total exports 2180 100.0 I 100.0 100.0 4 4 -1 Intra-exports 1385 64.9 I 63.1 63.5 4 7 0 Extra-exports 796 35.1 36.9 36.5 5 0 -2Total imports 2232 100.0 I 100.0 100.0 4 6 1 Intra-imports 1389 63.0 I 62.8 62.2 4 7 0 Extra-imports 843 37.0 37.2 37.8 4 5 3
NAFTA (3)
Total exports 1070 100.0 100.0 100.0 7 0 6 Intra-exports 579 42.6 51.2 54.1 10 5 11 Extra-exports 491 57.4 48.8 45.9 5 -5 -1Total imports a 1420 100.0 100.0 100.0 9 5 12 Intra-imports 575 34.4 40.3 40.5 11 6 12 Extra-imports 846 65.6 59.7 59.5 7 5 11
ASEAN (10)
Total exports 359 100.0 100.0 100.0 11 -7 9 Intra-exports 79 20.1 21.9 22.1 12 -18 10 Extra-exports 280 79.9 78.1 77.9 10 -3 9Total imports 299 100.0 100.0 100.0 7 -25 7 Intra-imports 69 16.2 22.6 22.9 11 -16 9 Extra-imports 231 83.8 77.4 77.1 6 -27 7
CEFTA (6)
Total exports 107 - 100.0 100.0 - 12 1 Intra-exports 13 - 13.0 12.0 - 6 -7 Extra-exports 94 - 87.0 88.0 - 13 2Total imports 134 - 100.0 100.0 - 11 -2 Intra-imports 13 - 9.7 9.5 - 8 -4 Extra-imports 122 - 90.3 90.5 - 11 -1
MERCOSUR (4)
Total exports 74 100.0 100.0 100.0 5 -2 -9 Intra-exports 15 8.9 25.0 20.3 15 -1 -26 Extra-exports 59 91.1 75.0 79.7 4 -3 -3Total imports 83 100.0 100.0 100.0 12 -3 -16 Intra-imports 16 14.5 21.0 19.0 16 -1 -24 Extra-imports 67 85.5 79.0 81.0 12 -4 -14
ANDEAN (5)
Total exports 43 100.0 100.0 100.0 4 -16 10 Intra-exports 4 4.3 13.9 8.9 13 -3 -29 Extra-exports 39 95.7 86.1 91.1 3 -18 16Total imports b 36 100.0 100.0 100.0 8 2 -20 Intra-imports 4 7.7 11.7 11.7 13 -10 -20 Extra-imports 32 92.3 88.3 88.3 8 4 -20
a Import of Canada and Mexico are valued f.o.b.
b Import of Peru and Venezuela are valued f.o.b.
Note: The figures are not fully adjusted for differences in the way members of the arrangements in this table record their merchandise trade.

25
II. Selected long-term trends
Sele
cted
long
-term
tren
ds
25
Chart II.1
World merchandise trade and output by major product group, 1950-99
(Average annual percentage change in volume terms)
Trade Output
All merchandise
0
2
4
6
8
10
12
1990-991973-901963-731950-63
Agricultural products
0
2
4
6
8
10
12
1990-991973-901963-731950-63
Mining products (including petroleum)
0
2
4
6
8
10
12
1990-991973-901963-731950-63
Manufactures
0
2
4
6
8
10
12
1990-991973-901963-731950-63

Sele
cted
long
-term
tren
ds
26
0
2
4
6
8
10
12
1990-991973-901950-73
Average Annual Change
Agricultural products
Mining products
Manufactures
Chart II.2
World merchandise trade by major product group, 1950-99
1950 55 60 65 70 75 80 85 90 9995
200
100
500
1000
2000
3000
Manufactures
Mining products
Agricultural products
Log.
scale
Volume indices, 1950 = 100

Sele
cted
long
-term
tren
ds
27
Table II.1
World merchandise exports, production and gross domestic product, 1950-99
(Index, 1990=100)
Value Volume
WorldExports Exports Production GDP
Agricultural Mining Agricultural MiningTotal a products products Manufactures Total a products products Manufactures Total Agriculture Mining Manufacturing
1950 2 7 2 1 9 26 18 5 18 37 29 13 19
1951 2 9 2 1 9 27 18 6 20 37 32 14 21
1952 2 7 3 1 10 27 22 6 21 38 32 15 21
1953 2 7 3 1 11 27 23 6 22 40 33 16 23
1954 3 8 3 2 11 27 25 7 22 40 33 16 23
1955 3 8 3 2 13 30 27 7 24 42 37 19 25
1956 3 8 4 2 13 31 29 8 25 44 39 20 26
1957 3 9 4 2 15 34 31 9 26 44 40 20 27
1958 3 8 4 2 14 35 29 9 26 47 39 20 27
1959 3 9 4 2 16 39 32 10 28 48 41 22 28
1960 4 10 4 3 18 41 39 11 30 49 45 24 30
1961 4 10 5 3 19 44 40 11 31 50 48 26 31
1962 4 10 5 3 20 44 42 12 34 52 51 28 33
1963 5 11 5 3 22 45 44 14 36 53 53 29 35
1964 5 11 6 4 25 48 48 16 39 55 57 32 37
1965 6 12 6 4 26 50 49 17 41 55 60 35 39
1966 6 12 7 5 29 52 52 19 44 57 63 38 41
1967 6 12 7 5 30 53 58 20 46 59 64 40 43
1968 7 13 8 6 33 56 65 23 49 61 69 43 45
1969 8 14 9 7 37 59 69 27 51 61 70 47 48
1970 9 15 10 8 41 61 77 29 54 63 76 49 50
1971 10 16 12 9 44 62 78 32 57 65 79 51 53
1972 12 20 13 11 47 66 83 35 59 65 81 55 56
1973 17 29 19 14 53 67 92 40 64 68 86 60 60
1974 25 35 44 19 56 64 90 43 66 69 88 62 61
1975 26 36 42 21 52 65 79 42 65 72 82 60 61
1976 29 40 49 23 58 70 85 47 69 73 89 65 65
1977 33 45 54 27 60 72 87 49 72 74 92 68 68
1978 39 51 56 32 63 77 92 52 75 77 93 71 70
1979 48 63 81 39 66 80 97 55 78 78 101 74 73
1980 59 71 115 45 68 86 91 58 78 78 99 75 73
1981 58 70 112 45 68 90 82 60 78 81 91 75 75
1982 54 65 100 43 66 88 77 59 77 84 85 74 76
1983 53 64 92 43 68 89 77 62 78 84 84 76 78
1984 57 67 91 47 73 91 80 69 83 88 87 81 82
1985 56 63 88 49 75 90 79 72 86 90 86 84 84
1986 62 70 67 59 78 89 86 75 88 92 89 87 87
1987 72 81 74 70 83 94 88 80 91 93 90 91 90
1988 82 92 75 82 89 96 93 87 95 94 95 96 94
1989 89 96 87 87 95 99 97 94 99 98 99 99 97
1990 100 100 100 100 100 100 100 100 100 100 100 100 100
1991 102 101 94 103 104 103 103 104 100 100 100 99 101
1992 108 108 93 112 109 109 107 109 100 103 100 99 102
1993 107 104 88 111 113 111 108 112 100 103 102 99 103
1994 121 119 91 128 124 120 114 126 104 107 107 102 105
1995 145 139 108 152 136 126 126 137 107 109 109 106 108
1996 152 143 127 159 143 131 132 146 110 113 112 109 111
1997 157 142 130 167 158 139 144 163 115 115 115 115 114
1998 155 135 103 169 166 139 154 172 117 117 117 118 117
1999 160 131 115 175 174 143 147 182 120 118 115 122 120
a Includes unspecified products.
Note: World merchandise production differs from world GDP in that it excludes services and construction. For sources and methods, see the Technical Notes.
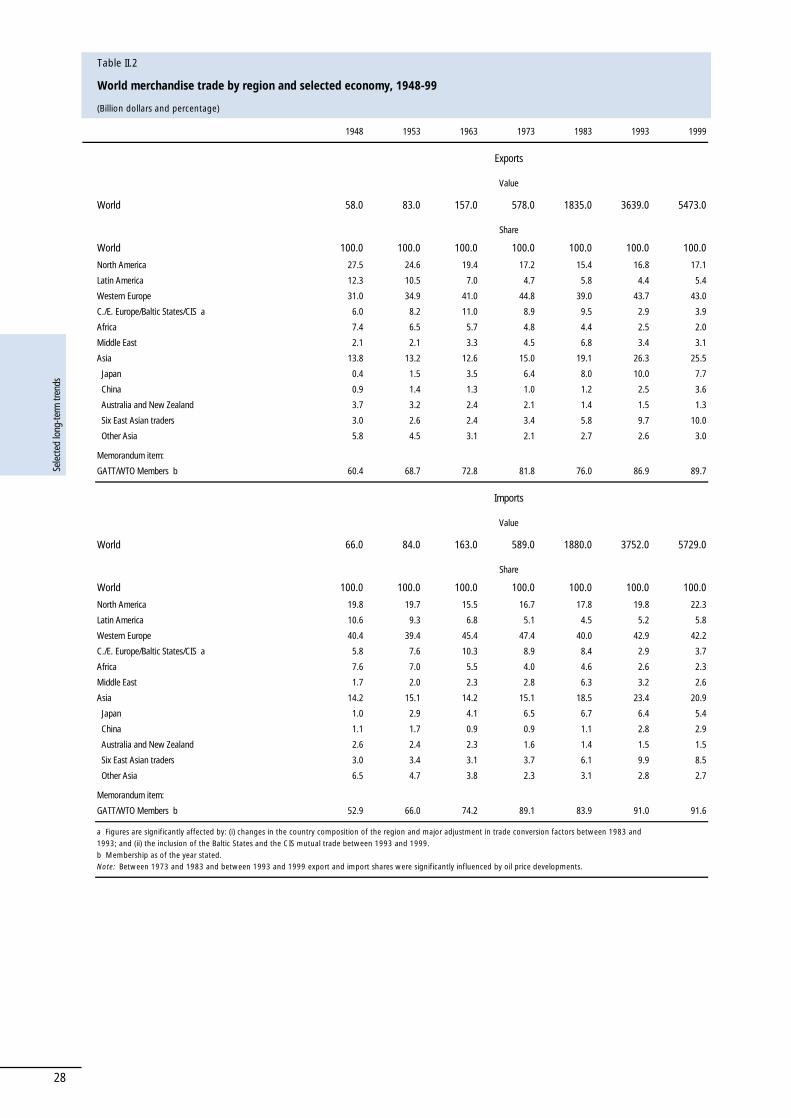
Sele
cted
long
-term
tren
ds
28
Table II.2
World merchandise trade by region and selected economy, 1948-99
(Billion dollars and percentage)
1948 1953 1963 1973 1983 1993 1999
Exports
Value
World 58.0 83.0 157.0 578.0 1835.0 3639.0 5473.0
Share
World 100.0 100.0 100.0 100.0 100.0 100.0 100.0
North America 27.5 24.6 19.4 17.2 15.4 16.8 17.1
Latin America 12.3 10.5 7.0 4.7 5.8 4.4 5.4
Western Europe 31.0 34.9 41.0 44.8 39.0 43.7 43.0
C./E. Europe/Baltic States/CIS a 6.0 8.2 11.0 8.9 9.5 2.9 3.9
Africa 7.4 6.5 5.7 4.8 4.4 2.5 2.0
Middle East 2.1 2.1 3.3 4.5 6.8 3.4 3.1
Asia 13.8 13.2 12.6 15.0 19.1 26.3 25.5
Japan 0.4 1.5 3.5 6.4 8.0 10.0 7.7
China 0.9 1.4 1.3 1.0 1.2 2.5 3.6
Australia and New Zealand 3.7 3.2 2.4 2.1 1.4 1.5 1.3
Six East Asian traders 3.0 2.6 2.4 3.4 5.8 9.7 10.0
Other Asia 5.8 4.5 3.1 2.1 2.7 2.6 3.0
Memorandum item:
GATT/WTO Members b 60.4 68.7 72.8 81.8 76.0 86.9 89.7
Imports
Value
World 66.0 84.0 163.0 589.0 1880.0 3752.0 5729.0
Share
World 100.0 100.0 100.0 100.0 100.0 100.0 100.0
North America 19.8 19.7 15.5 16.7 17.8 19.8 22.3
Latin America 10.6 9.3 6.8 5.1 4.5 5.2 5.8
Western Europe 40.4 39.4 45.4 47.4 40.0 42.9 42.2
C./E. Europe/Baltic States/CIS a 5.8 7.6 10.3 8.9 8.4 2.9 3.7
Africa 7.6 7.0 5.5 4.0 4.6 2.6 2.3
Middle East 1.7 2.0 2.3 2.8 6.3 3.2 2.6
Asia 14.2 15.1 14.2 15.1 18.5 23.4 20.9
Japan 1.0 2.9 4.1 6.5 6.7 6.4 5.4
China 1.1 1.7 0.9 0.9 1.1 2.8 2.9
Australia and New Zealand 2.6 2.4 2.3 1.6 1.4 1.5 1.5
Six East Asian traders 3.0 3.4 3.1 3.7 6.1 9.9 8.5
Other Asia 6.5 4.7 3.8 2.3 3.1 2.8 2.7
Memorandum item:
GATT/WTO Members b 52.9 66.0 74.2 89.1 83.9 91.0 91.6
a Figures are significantly affected by: (i) changes in the country composition of the region and major adjustment in trade conversion factors between 1983 and
1993; and (ii) the inclusion of the Baltic States and the CIS mutual trade between 1993 and 1999.
b Membership as of the year stated.
Note: Between 1973 and 1983 and between 1993 and 1999 export and import shares were significantly influenced by oil price developments.
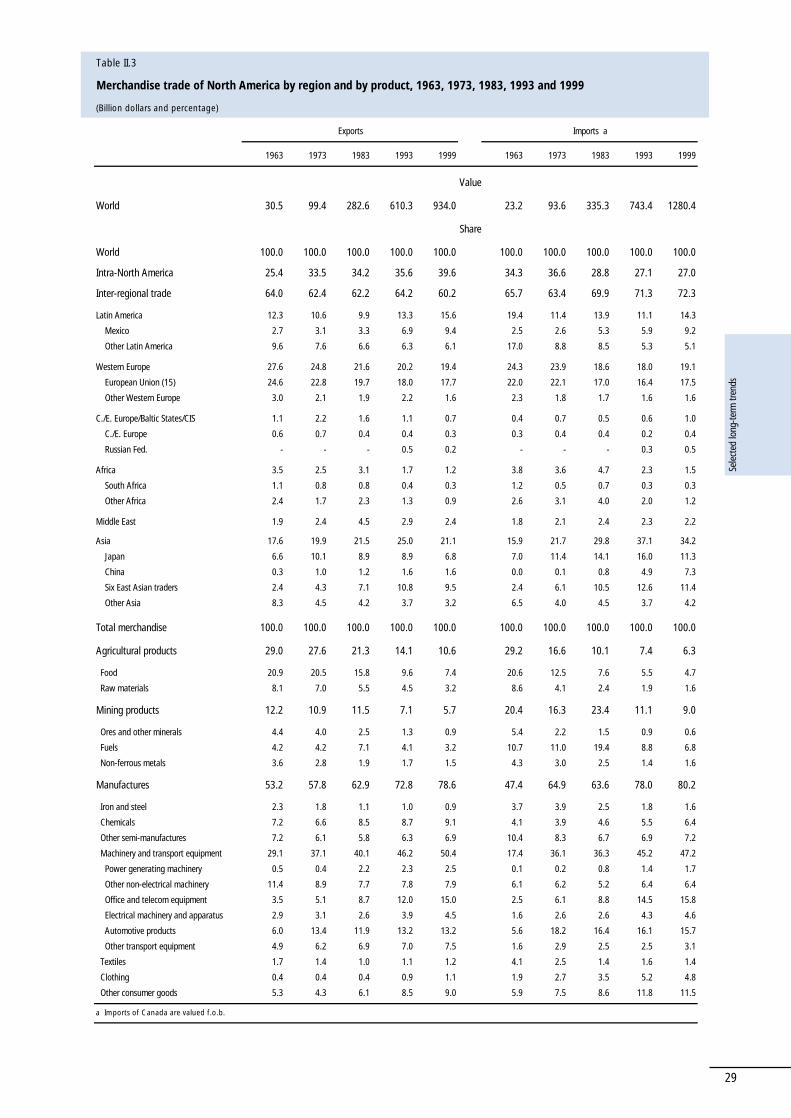
Sele
cted
long
-term
tren
ds
29
Table II.3
Merchandise trade of North America by region and by product, 1963, 1973, 1983, 1993 and 1999
(Billion dollars and percentage)
Exports Imports a
1963 1973 1983 1993 1999 1963 1973 1983 1993 1999
Value
World 30.5 99.4 282.6 610.3 934.0 23.2 93.6 335.3 743.4 1280.4
Share
World 100.0 100.0 100.0 100.0 100.0 100.0 100.0 100.0 100.0 100.0
Intra-North America 25.4 33.5 34.2 35.6 39.6 34.3 36.6 28.8 27.1 27.0
Inter-regional trade 64.0 62.4 62.2 64.2 60.2 65.7 63.4 69.9 71.3 72.3
Latin America 12.3 10.6 9.9 13.3 15.6 19.4 11.4 13.9 11.1 14.3
Mexico 2.7 3.1 3.3 6.9 9.4 2.5 2.6 5.3 5.9 9.2
Other Latin America 9.6 7.6 6.6 6.3 6.1 17.0 8.8 8.5 5.3 5.1
Western Europe 27.6 24.8 21.6 20.2 19.4 24.3 23.9 18.6 18.0 19.1
European Union (15) 24.6 22.8 19.7 18.0 17.7 22.0 22.1 17.0 16.4 17.5
Other Western Europe 3.0 2.1 1.9 2.2 1.6 2.3 1.8 1.7 1.6 1.6
C./E. Europe/Baltic States/CIS 1.1 2.2 1.6 1.1 0.7 0.4 0.7 0.5 0.6 1.0
C./E. Europe 0.6 0.7 0.4 0.4 0.3 0.3 0.4 0.4 0.2 0.4
Russian Fed. - - - 0.5 0.2 - - - 0.3 0.5
Africa 3.5 2.5 3.1 1.7 1.2 3.8 3.6 4.7 2.3 1.5
South Africa 1.1 0.8 0.8 0.4 0.3 1.2 0.5 0.7 0.3 0.3
Other Africa 2.4 1.7 2.3 1.3 0.9 2.6 3.1 4.0 2.0 1.2
Middle East 1.9 2.4 4.5 2.9 2.4 1.8 2.1 2.4 2.3 2.2
Asia 17.6 19.9 21.5 25.0 21.1 15.9 21.7 29.8 37.1 34.2
Japan 6.6 10.1 8.9 8.9 6.8 7.0 11.4 14.1 16.0 11.3
China 0.3 1.0 1.2 1.6 1.6 0.0 0.1 0.8 4.9 7.3
Six East Asian traders 2.4 4.3 7.1 10.8 9.5 2.4 6.1 10.5 12.6 11.4
Other Asia 8.3 4.5 4.2 3.7 3.2 6.5 4.0 4.5 3.7 4.2
Total merchandise 100.0 100.0 100.0 100.0 100.0 100.0 100.0 100.0 100.0 100.0
Agricultural products 29.0 27.6 21.3 14.1 10.6 29.2 16.6 10.1 7.4 6.3
Food 20.9 20.5 15.8 9.6 7.4 20.6 12.5 7.6 5.5 4.7
Raw materials 8.1 7.0 5.5 4.5 3.2 8.6 4.1 2.4 1.9 1.6
Mining products 12.2 10.9 11.5 7.1 5.7 20.4 16.3 23.4 11.1 9.0
Ores and other minerals 4.4 4.0 2.5 1.3 0.9 5.4 2.2 1.5 0.9 0.6
Fuels 4.2 4.2 7.1 4.1 3.2 10.7 11.0 19.4 8.8 6.8
Non-ferrous metals 3.6 2.8 1.9 1.7 1.5 4.3 3.0 2.5 1.4 1.6
Manufactures 53.2 57.8 62.9 72.8 78.6 47.4 64.9 63.6 78.0 80.2
Iron and steel 2.3 1.8 1.1 1.0 0.9 3.7 3.9 2.5 1.8 1.6
Chemicals 7.2 6.6 8.5 8.7 9.1 4.1 3.9 4.6 5.5 6.4
Other semi-manufactures 7.2 6.1 5.8 6.3 6.9 10.4 8.3 6.7 6.9 7.2
Machinery and transport equipment 29.1 37.1 40.1 46.2 50.4 17.4 36.1 36.3 45.2 47.2
Power generating machinery 0.5 0.4 2.2 2.3 2.5 0.1 0.2 0.8 1.4 1.7
Other non-electrical machinery 11.4 8.9 7.7 7.8 7.9 6.1 6.2 5.2 6.4 6.4
Office and telecom equipment 3.5 5.1 8.7 12.0 15.0 2.5 6.1 8.8 14.5 15.8
Electrical machinery and apparatus 2.9 3.1 2.6 3.9 4.5 1.6 2.6 2.6 4.3 4.6
Automotive products 6.0 13.4 11.9 13.2 13.2 5.6 18.2 16.4 16.1 15.7
Other transport equipment 4.9 6.2 6.9 7.0 7.5 1.6 2.9 2.5 2.5 3.1
Textiles 1.7 1.4 1.0 1.1 1.2 4.1 2.5 1.4 1.6 1.4
Clothing 0.4 0.4 0.4 0.9 1.1 1.9 2.7 3.5 5.2 4.8
Other consumer goods 5.3 4.3 6.1 8.5 9.0 5.9 7.5 8.6 11.8 11.5
a Imports of Canada are valued f.o.b.

Sele
cted
long
-term
tren
ds
30
Table II.4
Merchandise trade of Western Europe by region and by product, 1963, 1973, 1983, 1993 and 1999
(Billion dollars and percentage)
Exports Imports
1963 1973 1983 1993 1999 1963 1973 1983 1993 1999
Value
World 63.7 258.9 714.8 1591.1 2352.5 73.4 277.4 752.3 1608.0 2417.9
Share
World 100.0 100.0 100.0 100.0 100.0 100.0 100.0 100.0 100.0 100.0
Intra-Western Europe 64.1 69.2 65.2 68.6 69.1 56.1 64.3 61.8 68.2 67.6
European Union (15) 56.3 61.8 59.2 62.5 63.4 51.8 59.8 56.2 62.6 62.6
Other Western Europe 7.8 7.4 6.0 6.1 5.7 4.3 4.5 5.6 5.6 5.0
Inter-regional trade 35.2 29.7 33.5 29.6 29.8 43.8 34.7 37.6 31.1 31.8
North America 8.8 8.6 8.4 8.0 9.9 13.9 9.6 8.9 8.2 8.4
Latin America 4.5 3.3 2.2 2.4 2.4 6.2 3.6 3.5 2.0 1.9
C./E. Europe/Baltic States/CIS 4.0 4.5 4.3 3.9 5.1 4.2 3.9 5.4 3.7 5.0
C./E. Europe 2.4 3.0 1.7 2.4 3.7 2.4 2.5 1.9 1.8 3.2
Batic States/CIS - - - 1.5 1.4 - - - 1.8 1.8
Africa 7.7 5.2 6.1 3.1 2.5 7.6 5.7 6.6 3.2 2.7
North Africa 2.5 1.8 3.1 1.5 1.3 2.5 2.0 3.4 1.6 1.3
Sub-Saharan Africa 5.2 3.4 3.0 1.6 1.2 5.1 3.7 3.2 1.6 1.3
South Africa 1.6 1.1 0.8 0.5 0.4 1.0 0.7 0.7 0.5 0.5
Other Sub-Saharan Africa 3.6 2.3 2.2 1.1 0.7 4.1 3.0 2.5 1.1 0.8
Middle East 2.5 2.7 6.7 3.3 2.4 4.9 5.6 5.6 2.1 1.5
Asia 7.6 5.3 5.8 8.9 7.5 7.0 6.3 7.5 12.0 12.2
Japan 1.0 1.4 1.2 2.0 1.8 0.9 2.2 3.3 4.5 3.6
China 0.3 0.4 0.4 1.0 1.0 0.3 0.3 0.4 1.5 2.2
Australia and New Zealand 2.2 1.1 0.8 0.7 0.7 2.5 1.2 0.6 0.5 0.4
Six East Asian traders 1.5 1.3 1.8 3.8 2.8 1.2 1.5 2.3 4.0 4.3
Other Asia 2.7 1.1 1.5 1.5 1.2 2.2 1.0 1.0 1.5 1.7
Total merchandise 100.0 100.0 100.0 100.0 100.0 100.0 100.0 100.0 100.0 100.0
Agricultural products 18.3 15.5 13.0 11.9 10.0 32.8 22.7 15.5 13.1 11.0
Food 12.4 11.7 10.5 10.2 8.6 22.1 16.4 11.8 10.7 8.9
Raw materials 5.8 3.8 2.5 1.7 1.4 10.6 6.3 3.7 2.4 2.1
Mining products 8.5 7.6 13.0 6.6 5.5 18.6 17.7 26.3 10.8 8.2
Ores and other minerals 1.7 1.2 1.0 0.8 0.6 3.5 2.9 2.2 1.4 1.2
Fuels 4.3 3.6 9.6 4.2 3.3 11.5 11.2 21.7 7.5 5.2
Non-ferrous metals 2.5 2.8 2.4 1.7 1.6 3.6 3.6 2.4 1.9 1.8
Manufactures 71.8 75.8 71.7 77.8 80.5 46.6 58.9 56.0 72.5 77.2
Iron and steel 6.8 6.4 4.4 3.3 2.7 4.7 4.8 2.9 2.6 2.5
Chemicals 8.6 10.2 11.7 12.4 13.2 6.0 7.9 9.0 10.1 10.9
Other semi-manufactures 9.3 10.1 9.6 9.5 9.1 6.4 8.5 7.3 8.6 8.4
Machinery and transport equipment 32.8 34.0 31.7 36.5 40.7 19.8 24.7 23.9 33.6 39.4
Power generating machinery 0.5 0.4 1.4 1.6 1.8 0.2 0.3 1.0 1.3 1.7
Other non-electrical machinery 12.1 11.6 9.8 10.2 9.6 7.6 7.6 5.6 6.6 7.1
Office and telecom equipment 3.2 4.0 4.3 6.4 9.4 2.4 4.0 5.4 9.1 12.1
Electrical machinery and apparatus 4.1 4.5 3.5 4.3 4.5 2.7 3.5 2.6 4.0 4.4
Automotive products 8.6 9.5 8.8 10.0 11.5 4.4 6.3 6.5 9.0 10.6
Other transport equipment 4.3 4.0 3.9 3.9 3.8 2.4 3.0 2.7 3.6 3.5
Textiles 6.1 5.1 3.5 3.1 2.7 4.3 4.2 3.0 2.9 2.4
Clothing 1.9 2.4 2.3 2.9 2.6 1.4 2.6 2.7 4.4 3.8
Other consumer goods 6.4 7.6 8.5 10.0 9.6 4.0 6.1 7.1 10.3 9.8
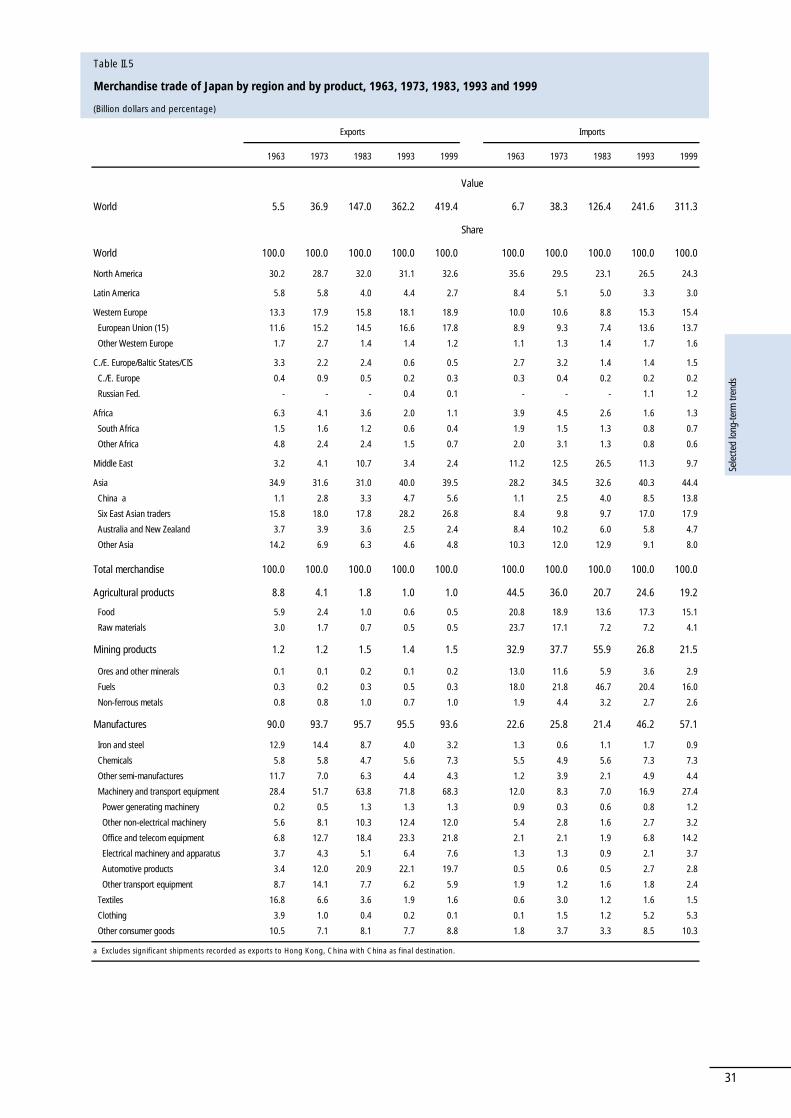
Sele
cted
long
-term
tren
ds
31
Table II.5
Merchandise trade of Japan by region and by product, 1963, 1973, 1983, 1993 and 1999
(Billion dollars and percentage)
Exports Imports
1963 1973 1983 1993 1999 1963 1973 1983 1993 1999
Value
World 5.5 36.9 147.0 362.2 419.4 6.7 38.3 126.4 241.6 311.3
Share
World 100.0 100.0 100.0 100.0 100.0 100.0 100.0 100.0 100.0 100.0
North America 30.2 28.7 32.0 31.1 32.6 35.6 29.5 23.1 26.5 24.3
Latin America 5.8 5.8 4.0 4.4 2.7 8.4 5.1 5.0 3.3 3.0
Western Europe 13.3 17.9 15.8 18.1 18.9 10.0 10.6 8.8 15.3 15.4
European Union (15) 11.6 15.2 14.5 16.6 17.8 8.9 9.3 7.4 13.6 13.7
Other Western Europe 1.7 2.7 1.4 1.4 1.2 1.1 1.3 1.4 1.7 1.6
C./E. Europe/Baltic States/CIS 3.3 2.2 2.4 0.6 0.5 2.7 3.2 1.4 1.4 1.5
C./E. Europe 0.4 0.9 0.5 0.2 0.3 0.3 0.4 0.2 0.2 0.2
Russian Fed. - - - 0.4 0.1 - - - 1.1 1.2
Africa 6.3 4.1 3.6 2.0 1.1 3.9 4.5 2.6 1.6 1.3
South Africa 1.5 1.6 1.2 0.6 0.4 1.9 1.5 1.3 0.8 0.7
Other Africa 4.8 2.4 2.4 1.5 0.7 2.0 3.1 1.3 0.8 0.6
Middle East 3.2 4.1 10.7 3.4 2.4 11.2 12.5 26.5 11.3 9.7
Asia 34.9 31.6 31.0 40.0 39.5 28.2 34.5 32.6 40.3 44.4
China a 1.1 2.8 3.3 4.7 5.6 1.1 2.5 4.0 8.5 13.8
Six East Asian traders 15.8 18.0 17.8 28.2 26.8 8.4 9.8 9.7 17.0 17.9
Australia and New Zealand 3.7 3.9 3.6 2.5 2.4 8.4 10.2 6.0 5.8 4.7
Other Asia 14.2 6.9 6.3 4.6 4.8 10.3 12.0 12.9 9.1 8.0
Total merchandise 100.0 100.0 100.0 100.0 100.0 100.0 100.0 100.0 100.0 100.0
Agricultural products 8.8 4.1 1.8 1.0 1.0 44.5 36.0 20.7 24.6 19.2
Food 5.9 2.4 1.0 0.6 0.5 20.8 18.9 13.6 17.3 15.1
Raw materials 3.0 1.7 0.7 0.5 0.5 23.7 17.1 7.2 7.2 4.1
Mining products 1.2 1.2 1.5 1.4 1.5 32.9 37.7 55.9 26.8 21.5
Ores and other minerals 0.1 0.1 0.2 0.1 0.2 13.0 11.6 5.9 3.6 2.9
Fuels 0.3 0.2 0.3 0.5 0.3 18.0 21.8 46.7 20.4 16.0
Non-ferrous metals 0.8 0.8 1.0 0.7 1.0 1.9 4.4 3.2 2.7 2.6
Manufactures 90.0 93.7 95.7 95.5 93.6 22.6 25.8 21.4 46.2 57.1
Iron and steel 12.9 14.4 8.7 4.0 3.2 1.3 0.6 1.1 1.7 0.9
Chemicals 5.8 5.8 4.7 5.6 7.3 5.5 4.9 5.6 7.3 7.3
Other semi-manufactures 11.7 7.0 6.3 4.4 4.3 1.2 3.9 2.1 4.9 4.4
Machinery and transport equipment 28.4 51.7 63.8 71.8 68.3 12.0 8.3 7.0 16.9 27.4
Power generating machinery 0.2 0.5 1.3 1.3 1.3 0.9 0.3 0.6 0.8 1.2
Other non-electrical machinery 5.6 8.1 10.3 12.4 12.0 5.4 2.8 1.6 2.7 3.2
Office and telecom equipment 6.8 12.7 18.4 23.3 21.8 2.1 2.1 1.9 6.8 14.2
Electrical machinery and apparatus 3.7 4.3 5.1 6.4 7.6 1.3 1.3 0.9 2.1 3.7
Automotive products 3.4 12.0 20.9 22.1 19.7 0.5 0.6 0.5 2.7 2.8
Other transport equipment 8.7 14.1 7.7 6.2 5.9 1.9 1.2 1.6 1.8 2.4
Textiles 16.8 6.6 3.6 1.9 1.6 0.6 3.0 1.2 1.6 1.5
Clothing 3.9 1.0 0.4 0.2 0.1 0.1 1.5 1.2 5.2 5.3
Other consumer goods 10.5 7.1 8.1 7.7 8.8 1.8 3.7 3.3 8.5 10.3
a Excludes significant shipments recorded as exports to Hong Kong, China with China as final destination.

Sele
cted
long
-term
tren
ds
32
Table II.6
Merchandise exports of selected regions and economies to the least-developed countries, 1980-99
(Million dollars and percentage)
Share in region’s Share in region’sValue exports to LDCs total exports
1980 1990 1998 1999 1980 1990 1999 1980 1990 1999
North America
Total merchandise 2103 2079 2718 2708 100.0 100.0 100.0 0.7 0.4 0.3
Agricultural products 891 775 1061 904 42.4 37.3 33.4 1.3 0.9 0.9
Mining products 75 27 19 25 3.6 1.3 0.9 0.2 0.1 0.0
Manufactures 1104 1140 1499 1620 52.5 54.8 59.8 0.6 0.3 0.2
Western Europe
Total merchandise 10045 10232 9790 9175 100.0 100.0 100.0 1.2 0.6 0.4
Agricultural products 1640 2029 2408 2243 16.3 19.8 24.4 1.6 1.1 1.0
Mining products 409 283 242 270 4.1 2.8 2.9 0.4 0.2 0.2
Manufactures 7871 7778 6931 6440 78.4 76.0 70.2 1.3 0.6 0.3
Australia and New Zealand
Total merchandise 285 403 445 421 100.0 100.0 100.0 1.0 0.8 0.6
Agricultural products 178 220 237 205 62.7 54.6 48.7 1.3 1.3 0.9
Mining products 3 45 47 38 1.2 11.2 9.0 0.0 0.3 0.2
Manufactures 97 97 142 155 33.9 24.1 36.8 2.2 1.1 0.8
China
Total merchandise 446 707 2592 2529 100.0 100.0 100.0 2.5 1.1 1.3
Agricultural products … 139 160 153 … 19.7 6.0 … 1.4 1.1
Mining products … 21 40 35 … 3.0 1.4 … 0.3 0.4
Manufactures … 547 2321 2317 … 77.3 91.6 … 1.2 1.3
Japan
Total merchandise 1874 1707 1440 1512 100.0 100.0 100.0 1.4 0.6 0.4
Agricultural products 153 30 31 27 8.2 1.8 1.8 5.2 0.9 0.6
Mining products 25 5 7 17 1.3 0.3 1.1 1.0 0.1 0.3
Manufactures 1683 1666 1375 1445 89.8 97.6 95.6 1.4 0.6 0.4
Six East Asian traders
Total merchandise 1390 2856 6237 6811 100.0 100.0 100.0 1.5 1.1 1.2
Agricultural products 333 651 1010 1054 24.0 22.8 15.5 2.0 2.4 3.2
Mining products 179 534 812 1074 12.9 18.7 15.8 1.5 2.7 3.6
Manufactures 877 1650 4383 4648 63.1 57.8 68.2 1.5 0.8 1.0
Total of above
Total merchandise 16144 17983 23222 23156 100.0 100.0 100.0 1.2 0.6 0.5
Agricultural products … 3844 4907 4586 … 21.4 19.8 … 1.2 1.1
Mining products … 915 1167 1459 … 5.1 6.3 … 0.4 0.6
Manufactures … 12877 16651 16625 … 71.6 71.8 … 0.6 0.5

Sele
cted
long
-term
tren
ds
33
Table II.7
Merchandise imports of selected regions and economies from the least-developed countries, 1980-99
(Million dollars and percentage)
Share in region’s Share in region’sValue imports from LDCs total imports
1980 1990 1998 1999 1980 1990 1999 1980 1990 1999
North America
Total merchandise 2625 4807 6613 7208 100.0 100.0 100.0 0.8 0.7 0.6
Agricultural products 870 399 477 487 33.1 8.3 6.8 2.6 0.8 0.6
Mining products 1319 3148 2960 3001 50.3 65.5 41.6 1.2 3.3 2.6
Manufactures 422 1180 3142 3693 16.1 24.5 51.2 0.2 0.2 0.4
Western Europe
Total merchandise 8510 10629 10284 9884 100.0 100.0 100.0 0.9 0.6 0.4
Agricultural products 3052 2472 2973 2623 35.9 23.3 26.5 2.2 1.1 1.0
Mining products 3194 4384 1365 1308 37.5 41.2 13.2 1.2 2.0 0.7
Manufactures 1557 3597 5788 5903 18.3 33.8 59.7 0.3 0.3 0.3
Australia and New Zealand
Total merchandise 92 86 123 173 100.0 100.0 100.0 0.3 0.2 0.2
Agricultural products 43 26 31 38 46.9 30.2 22.0 1.9 0.7 0.7
Mining products 11 30 19 57 12.2 34.9 32.9 0.2 0.8 0.9
Manufactures 37 27 73 78 40.4 31.4 45.1 0.2 0.1 0.1
China
Total merchandise 262 314 943 1396 100.0 100.0 100.0 1.3 0.6 0.8
Agricultural products … 170 141 201 … 54.0 14.4 … 2.2 1.5
Mining products … 47 738 1112 … 14.9 79.7 … 1.6 6.3
Manufactures … 98 64 82 … 31.1 5.9 … 0.2 0.1
Japan
Total merchandise 1356 1250 1069 1015 100.0 100.0 100.0 1.0 0.5 0.3
Agricultural products 403 541 664 656 29.7 43.3 64.6 1.3 1.1 1.1
Mining products 601 645 280 237 44.3 51.6 23.3 0.7 0.8 0.4
Manufactures 124 55 106 118 9.1 4.4 11.6 0.5 0.1 0.1
Six East Asian traders
Total merchandise 556 1500 3062 3871 100.0 100.0 100.0 0.5 0.5 0.8
Agricultural products 343 653 1025 860 61.7 43.5 22.2 2.0 2.1 2.2
Mining products 112 380 1417 2593 20.1 25.4 67.0 0.4 0.8 3.7
Manufactures 99 461 612 403 17.8 30.8 10.4 0.2 0.2 0.1
Total of above
Total merchandise 13400 18586 22094 23547 100.0 100.0 100.0 0.9 0.6 0.5
Agricultural products … 4260 5311 4865 … 22.9 20.7 … 1.2 1.0
Mining products … 8634 6779 8308 … 46.5 35.3 … 1.9 1.7
Manufactures … 5418 9785 10277 … 29.2 43.6 … 0.3 0.3

Trad
e by
regi
on
35
III. Trade by region1. Overview
Exports
North America Latin America
Western Europe Africa
C./E. Europe/Baltic States/CIS Middle East
Asia World
Imports
-25
-15
-10
-5
0
5
10
15
20
25
30
19991996199519941993-25
-15
-10
-5
0
5
10
15
20
25
30
1999199819971996199519941993
-25
-15
-10
-5
0
5
10
15
20
25
30
1999199819971996199519941993-25
-15
-10
-5
0
5
10
15
20
25
30
1999199819971996199519941993
-25
-15
-10
-5
0
5
10
15
20
25
30
1999199819971996199519941993-25
-20
-15
-10
-5
0
5
10
15
20
25
30
1999199819971996199519941993
-25
-20
-15
-10
-5
0
5
10
15
20
25
30
1999199819971996199519941993-25
-15
-10
-5
0
5
10
15
20
25
30
1999199819971996199519941993
Chart III.1
Value of world merchandise trade by region, 1992-99
(Annual percentage change in value)
1997 1998

Trad
e by
regi
on
36
Exports Imports
-15
-10
-5
0
5
10
15
20
25
30
1999199819971996199519941993-15
-10
-5
0
5
10
15
20
25
30
1999199819971996199519941993
-15
-10
-5
0
5
10
15
20
25
30
1999199819971996199519941993-15
-10
-5
0
5
10
15
20
25
30
1999199819971996199519941993
-15
-10
-5
0
5
10
15
20
25
30
1999199819971996199519941993-15
-10
-5
0
5
10
15
20
25
30
1999199819971996199519941993
North America Latin America
Western Europe C./E. Europe/Baltic States/CIS
Asia World
Chart III.2
The volume of world merchandise trade by selected region, 1992-99
(Annual percentage change)

Trad
e by
regi
on
37
Table III.1
World merchandise exports by region, 1999
(Billion dollars and percentage)
Value Share Annual percentage change
1999 1990 1999 1990-99 1997 1998 1999
World 5473 100.0 100.0 5 4 -2 3
North America 934 15.4 17.1 7 9 -1 4 United States 695 11.6 12.7 7 10 -1 2
Latin America 297 4.3 5.4 8 11 -1 6 Mexico 137 1.2 2.5 14 15 6 16
Western Europe 2353 48.3 43.0 4 -1 4 0 European Union (15) 2180 44.5 39.8 4 0 4 -1
C./E. Europe/Baltic States/CIS 214 3.1 3.9 6 4 -5 -1 Central and Eastern Europe 102 1.4 1.9 7 6 9 1 Baltic States and the CIS 112 - 2.0 - 3 -14 -2
Africa 112 3.1 2.0 1 2 -16 9
South Africa 27 0.7 0.5 2 6 -9 1
Middle East 170 4.0 3.1 3 5 -23 24
Asia 1394 21.8 25.5 7 5 -6 8 Japan 419 8.5 7.7 4 2 -8 8 China 195 1.8 3.6 14 21 0 6 Six East Asian traders 546 7.9 10.0 8 3 -7 8
Memorandum item: NAFTA (3) 1070 16.6 19.6 7 10 0 6 MERCOSUR (4) 74 1.4 1.4 5 11 -2 -9 ASEAN (10) 359 4.3 6.6 11 4 -7 9
Table III.2
World merchandise imports by region, 1999
(Billion dollars and percentage)
Value Share Annual percentage change
1999 1990 1999 1990-99 1997 1998 1999
World 5729 100.0 100.0 6 4 -1 4
North America 1280 18.4 22.3 8 10 5 11
United States 1059 14.8 18.5 8 9 5 12
Latin America 335 3.7 5.8 11 18 5 -3
Mexico 149 1.2 2.6 15 23 14 14
Western Europe 2418 48.7 42.2 4 0 6 1
European Union (15) 2232 44.7 39.0 4 0 6 1
C./E. Europe/Baltic States/CIS 214 3.3 3.7 5 6 -2 -12
Central and Eastern Europe 131 1.4 2.3 10 6 11 -1
Baltic States and the CIS 83 - 1.4 - 7 -14 -24
Africa 133 2.7 2.3 4 6 1 0
South Africa 27 0.5 0.5 4 10 -9 -9
Middle East 150 2.8 2.6 5 8 -3 3
Asia 1200 20.3 20.9 6 0 -18 10
Japan 311 6.7 5.4 3 -3 -17 11
China 166 1.5 2.9 13 2 -1 18
Six East Asian traders 485 8.0 8.5 6 1 -25 11
Memorandum item:
NAFTA (3) 1428 19.5 24.9 9 11 5 11
MERCOSUR (4) 83 0.8 1.4 12 18 -3 -16
ASEAN (10) 299 4.7 5.2 7 -1 -25 7

Table III.3
Intra- and inter-regional merchandise trade, 1999
(Billion dollars and percentage)
Destination C./E. Europe/
North Latin Western Baltic MiddleOrigin America America Europe States/CIS Africa East Asia World
Value
North America 370 146 181 6 11 22 197 934
Latin America 183 47 38 3 3 3 18 297
Western Europe 232 57 1625 120 59 57 176 2353
C./E. Europe/Baltic States/CIS 9 4 120 56 3 4 16 214
Africa 17 3 57 1 11 2 15 112
Middle East 25 2 34 1 8 14 73 170
Asia 367 35 252 13 21 37 650 1394
World 1203 294 2307 200 116 139 1145 5473
Share of intra- and inter-regional trade flows in each region’s total merchandise exports
North America 39.6 15.6 19.4 0.7 1.2 2.4 21.1 100.0
Latin America 61.6 16.0 12.9 0.9 0.9 1.0 6.0 100.0
Western Europe 9.9 2.4 69.1 5.1 2.5 2.4 7.5 100.0
C./E. Europe/Baltic States/CIS 4.4 1.9 56.0 26.1 1.2 1.9 7.4 100.0
Africa 14.9 3.0 51.0 1.2 9.9 1.5 13.8 100.0
Middle East 14.8 1.3 20.2 0.7 4.7 8.3 42.9 100.0
Asia 26.3 2.5 18.1 0.9 1.5 2.6 46.6 100.0
World 22.0 5.4 42.2 3.7 2.1 2.5 20.9 100.0
Share of intra- and inter-regional trade flows in world merchandise exports
North America 6.8 2.7 3.3 0.1 0.2 0.4 3.6 17.1
Latin America 3.3 0.9 0.7 0.0 0.1 0.1 0.3 5.4
Western Europe 4.2 1.0 29.7 2.2 1.1 1.0 3.2 43.0
C./E. Europe/Baltic States/CIS 0.2 0.1 2.2 1.0 0.0 0.1 0.3 3.9
Africa 0.3 0.1 1.0 0.0 0.2 0.0 0.3 2.0
Middle East 0.5 0.0 0.6 0.0 0.1 0.3 1.3 3.1
Asia 6.7 0.6 4.6 0.2 0.4 0.7 11.9 25.5
World 22.0 5.4 42.2 3.7 2.1 2.5 20.9 100.0
Trad
e by
regi
on
38

Trad
e by
regi
on
39
Exports Imports
-15
-10
-5
0
5
10
15
20
25
30
1999199819971996199519941993-15
-10
-5
0
5
10
15
20
25
30
1999199819971996199519941993
-15
-10
-5
0
5
10
15
20
25
30
1999199819971996199519941993-15
-10
-5
0
5
10
15
20
25
30
1999199819971996199519941993
-15
-10
-5
0
5
10
15
20
25
30
1999199819971996199519941993-15
-10
-5
0
5
10
15
20
25
30
1999199819971996199519941993
North America Latin America
Western Europe Africa
Asia World
Chart III.3
World trade in commercial services by selected region, 1992-99
(Annual percentage change in value)

Trad
e by
regi
on
40
Table III.4
World exports of commercial services by selected region, 1999
(Billion dollars and percentage)
Value Share Annual percentage change
1999 1990 1999 1990-99 1997 1998 1999
World 1350 100.0 100.0 6 4 1 1
North America 288 19.2 21.3 7 9 3 6
United States 253 16.9 18.8 7 9 2 6
Latin America 53 3.8 4.0 7 7 7 0
Mexico 12 0.9 0.9 6 5 6 -1
Brazil 7 0.5 0.5 7 23 29 -5
Western Europe 640 53.2 47.4 5 2 7 -1
European Union (15) 574 47.3 42.6 5 1 7 0
United Kingdom 102 6.8 7.5 7 14 7 3
France 83 8.5 6.1 2 -3 5 -2
Germany 79 6.6 5.9 5 -2 2 0
Italy 61 6.2 4.5 3 2 0 -8
Africa 29 2.4 2.2 5 0 -3 8
Egypt 9 0.6 0.7 8 0 -14 18
South Africa 5 0.4 0.4 4 7 -1 -6
Asia 264 16.8 19.5 8 5 -15 3
Japan 60 5.3 4.5 4 3 -9 -2
Hong Kong, China 35 2.3 2.6 8 1 -13 4
Korea, Rep. of 25 1.2 1.8 12 12 -6 4
China 24 0.7 1.8 17 19 -3 -1
Singapore 24 1.6 1.7 7 2 -37 25
Australia 17 1.3 1.3 6 0 -13 9
Table III.5
World imports of commercial services by selected region, 1999
(Billion dollars and percentage)
Value Share Annual percentage change
1999 1990 1999 1990-99 1997 1998 1999
World 1345 100.0 100.0 6 3 2 2
North America 219 15.4 16.3 6 10 6 8
United States 180 12.1 13.4 7 11 8 9
Latin America 62 4.3 4.6 7 13 5 -6
Mexico 14 1.2 1.0 4 19 7 9
Brazil 12 0.8 0.9 7 18 9 -24
Western Europe 609 48.2 45.3 5 1 9 1
European Union (15) 561 43.0 41.7 5 0 9 0
Germany 133 9.8 9.9 6 -3 4 3
United Kingdom 81 5.5 6.0 7 9 10 4
France 63 6.2 4.7 3 -5 5 -4
Italy 58 5.7 4.3 3 3 7 -7
Africa 35 3.3 2.6 3 2 -1 -2
Egypt 6 0.4 0.4 7 23 1 1
South Africa 5 0.5 0.4 3 6 -9 -1
Asia 336 22.0 25.0 7 2 -11 5
Japan 114 10.4 8.5 3 -5 -9 3
China 31 0.5 2.3 25 24 -5 16
Korea, Rep. of 26 1.2 1.9 11 0 -19 11
Hong Kong, China 24 1.4 1.8 9 5 8 -2
Taipei, Chinese 23 1.7 1.7 6 2 -4 1
Singapore 19 1.1 1.4 9 -3 -9 8

Trad
e by
regi
on
41
Table III.6
Merchandise trade of North America, 1999
(Billion dollars and percentage)
Exports Imports
Value 934 1280
Share in world merchandise trade 17.1 22.3
Annual percentage change
Value
1980-85 1 6
1985-90 11 8
1990-99 7 8
1997 9 10
1998 -1 5
1999 4 11
Volume
1980-85 -0.5 7.0
1985-90 8.5 5.0
1990-99 7.0 8.5
1997 11.0 13.0
1998 3.5 10.5
1999 6.0 11.0
Table III.7
Merchandise trade of North America by regionand by major product group, 1999(Billion dollars and percentage)
Value Share
Exports Imports Exports Imports
Total 934 1275 100.0 100.0
Region
North America 370 346 39.6 27.1
Latin America 146 183 15.6 14.3
Western Europe 181 244 19.4 19.2
C./E. Europe/Baltic States/CIS 6 13 0.7 1.0
Africa 11 19 1.2 1.5
Middle East 22 28 2.4 2.2
Asia 197 438 21.1 34.3
Product group
Agricultural products 99 80 10.6 6.3
Mining products 53 115 5.7 9.0
Manufactures 736 1026 78.8 80.5
Note: Imports of Canada are valued f.o.b.
2. North America
Chart III.4
Merchandise trade of North America,1989-99(Billion dollars)
0
200
400
600
800
1000
1200
1400
9998979695949392919089
Exports
Imports
10
12
14
16
18
20
22
24
9998979695949392919089
Exports
Imports
Chart III.5
Share of North America in world merchandise trade, 1989-99(Percentage based on value data)

Trad
e by
regi
on
42
Table III.8
Merchandise exports of North America by product, 1999
(Billion dollars and percentage)
Share in exports Share inValue of North America world exports Annual percentage change
1999 1990 1999 1990 1999 1990-99 1997 1998 1999
Agricultural products 99.0 15.7 10.6 19.7 18.2 2 -1 -9 -2
Food 69.0 10.2 7.4 16.9 15.8 3 -2 -8 -4
Raw materials 30.1 5.4 3.2 28.7 28.0 1 -1 -12 0
Mining products 53.0 9.1 5.7 9.8 9.5 1 6 -15 2
Ores and other minerals 8.6 2.2 0.9 22.2 15.3 -3 6 -16 -6
Fuels 30.3 4.8 3.2 7.0 7.5 2 6 -20 9
Non-ferrous metals 14.2 2.1 1.5 14.7 14.3 3 7 -6 -7
Manufactures 736.1 69.7 78.8 15.2 17.6 8 13 2 5
Iron and steel 8.4 1.1 0.9 5.2 6.6 5 11 -1 -9
Chemicals 85.0 8.8 9.1 15.6 16.2 7 12 -2 4
Other semi-manufactures 64.4 6.1 6.9 12.1 15.6 8 8 2 6
Machinery and transport equipment 472.1 44.0 50.5 18.9 20.6 8 13 2 6
Automotive products 123.7 11.7 13.2 19.1 22.5 8 10 1 12
Office and telecom equipment 140.0 11.0 15.0 19.2 18.2 10 13 -4 10
Other machinery and transport equipment 208.3 21.4 22.3 18.7 21.3 7 16 7 0
Textiles 11.6 1.1 1.2 5.5 7.8 8 14 1 4
Clothing 10.2 0.6 1.1 2.7 5.5 15 16 4 -3
Other consumer goods 84.4 8.0 9.0 13.9 17.2 8 12 3 5
Total merchandise exports 934.0 100.0 100.0 15.4 17.1 7 9 -1 4
Table III.9
Merchandise imports of North America by product, 1999
(Billion dollars and percentage)
Share in imports Share inValue of North America world imports Annual percentage change
1999 1990 1999 1990 1999 1990-99 1997 1998 1999
Agricultural products 80.4 7.7 6.3 11.1 13.7 6 9 1 5
Food 60.1 5.9 4.7 11.0 12.7 5 11 3 5
Raw materials 20.3 1.9 1.6 11.2 17.7 6 4 -4 6
Mining products 114.8 15.0 9.0 18.9 19.4 2 8 -18 19
Ores and other minerals 8.2 1.2 0.6 13.2 12.9 1 4 -3 -6
Fuels 86.4 12.0 6.8 20.3 20.2 1 8 -24 25
Non-ferrous metals 20.1 1.8 1.6 16.0 19.8 6 12 5 6
Manufactures 1026.4 73.9 80.5 19.2 23.5 9 11 8 11
Iron and steel 20.6 2.0 1.6 11.5 15.0 5 10 17 -19
Chemicals 82.4 5.0 6.5 10.3 15.1 11 12 8 12
Other semi-manufactures 91.8 7.0 7.2 16.1 20.8 8 11 10 11
Machinery and transport equipment 604.0 43.0 47.4 22.3 25.6 9 11 6 12
Automotive products 201.0 16.4 15.8 32.4 35.5 8 10 6 18
Office and telecom equipment 201.7 11.6 15.8 24.6 25.5 12 8 2 13
Other machinery and transport equipment 201.3 15.0 15.8 15.8 20.0 9 14 11 7
Textiles 18.3 1.4 1.4 8.4 11.8 8 17 7 5
Clothing 62.1 4.6 4.9 26.2 31.7 9 16 11 5
Other consumer goods 147.2 10.9 11.5 22.5 28.3 9 12 9 11
Total merchandise imports 1274.8 100.0 100.0 18.7 23.0 8 11 5 11
Note: Imports of Canada are valued f.o.b.
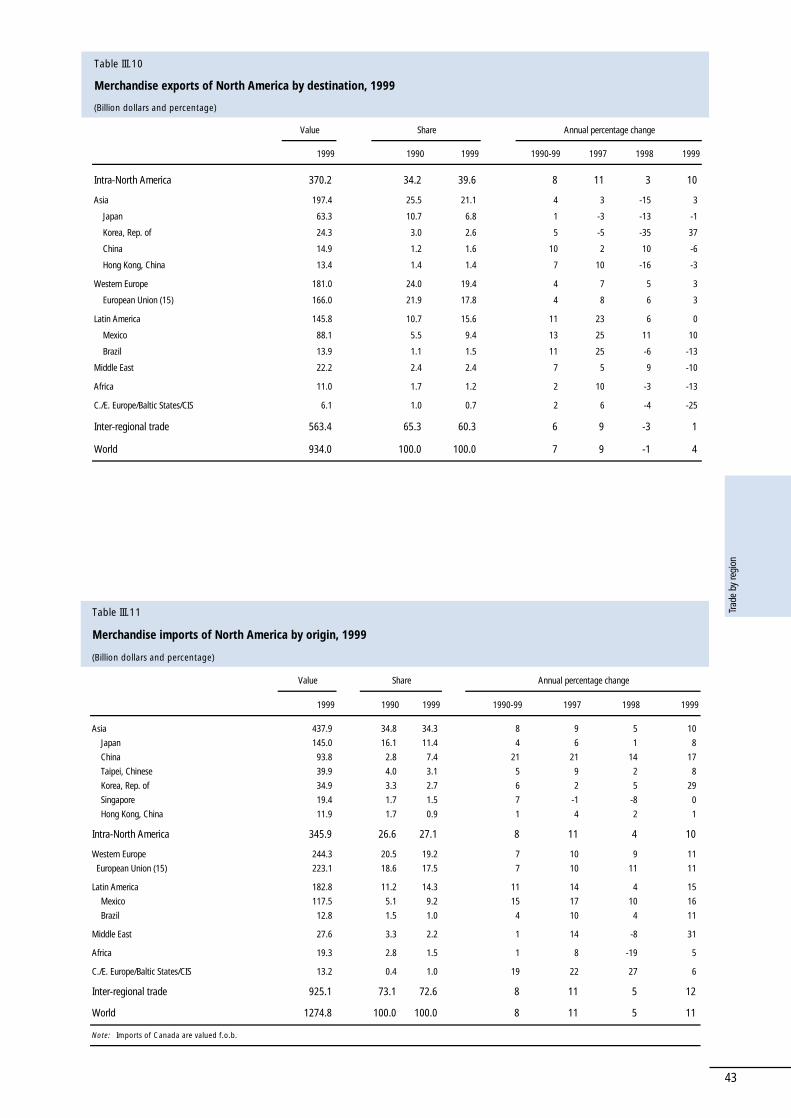
Trad
e by
regi
on
43
Table III.10
Merchandise exports of North America by destination, 1999
(Billion dollars and percentage)
Value Share Annual percentage change
1999 1990 1999 1990-99 1997 1998 1999
Intra-North America 370.2 34.2 39.6 8 11 3 10
Asia 197.4 25.5 21.1 4 3 -15 3
Japan 63.3 10.7 6.8 1 -3 -13 -1
Korea, Rep. of 24.3 3.0 2.6 5 -5 -35 37
China 14.9 1.2 1.6 10 2 10 -6
Hong Kong, China 13.4 1.4 1.4 7 10 -16 -3
Western Europe 181.0 24.0 19.4 4 7 5 3
European Union (15) 166.0 21.9 17.8 4 8 6 3
Latin America 145.8 10.7 15.6 11 23 6 0
Mexico 88.1 5.5 9.4 13 25 11 10
Brazil 13.9 1.1 1.5 11 25 -6 -13
Middle East 22.2 2.4 2.4 7 5 9 -10
Africa 11.0 1.7 1.2 2 10 -3 -13
C./E. Europe/Baltic States/CIS 6.1 1.0 0.7 2 6 -4 -25
Inter-regional trade 563.4 65.3 60.3 6 9 -3 1
World 934.0 100.0 100.0 7 9 -1 4
Table III.11
Merchandise imports of North America by origin, 1999
(Billion dollars and percentage)
Value Share Annual percentage change
1999 1990 1999 1990-99 1997 1998 1999
Asia 437.9 34.8 34.3 8 9 5 10
Japan 145.0 16.1 11.4 4 6 1 8
China 93.8 2.8 7.4 21 21 14 17
Taipei, Chinese 39.9 4.0 3.1 5 9 2 8
Korea, Rep. of 34.9 3.3 2.7 6 2 5 29
Singapore 19.4 1.7 1.5 7 -1 -8 0
Hong Kong, China 11.9 1.7 0.9 1 4 2 1
Intra-North America 345.9 26.6 27.1 8 11 4 10
Western Europe 244.3 20.5 19.2 7 10 9 11
European Union (15) 223.1 18.6 17.5 7 10 11 11
Latin America 182.8 11.2 14.3 11 14 4 15
Mexico 117.5 5.1 9.2 15 17 10 16
Brazil 12.8 1.5 1.0 4 10 4 11
Middle East 27.6 3.3 2.2 1 14 -8 31
Africa 19.3 2.8 1.5 1 8 -19 5
C./E. Europe/Baltic States/CIS 13.2 0.4 1.0 19 22 27 6
Inter-regional trade 925.1 73.1 72.6 8 11 5 12
World 1274.8 100.0 100.0 8 11 5 11
Note: Imports of Canada are valued f.o.b.

Trad
e by
regi
on
44
Table III.12
Gross domestic product and trade in goods and services of Canada and the United States, 1999
(Billion dollars and percentage)
Value Annual percentage change in volume
1999 1990-99 1994 1995 1996 1997 1998 1999
Gross domestic product
North America 9814 3.1 4.1 2.7 3.4 4.2 4.2 4.2
Canada 624 2.4 4.7 2.8 1.7 4.0 3.1 4.2
United States 9190 3.1 4.0 2.7 3.6 4.2 4.3 4.2
Exports of goods and services
North America 1278 7.1 9.7 10.0 7.7 11.7 3.4 5.0
Canada 279 8.3 13.1 9.0 5.8 8.5 8.2 9.7
United States 998 6.8 8.9 10.3 8.2 12.5 2.2 3.8
Imports of goods and services
North America 1512 8.6 11.3 7.8 8.1 13.9 10.4 11.3
Canada 260 7.4 8.3 6.2 5.8 14.6 5.8 9.7
United States 1252 8.9 12.0 8.2 8.6 13.7 11.6 11.7
Table III.13
Merchandise exports and imports of Canada and the United States, 1999
(Billion dollars and percentage)
Annual percentage change
Value Value Volume
1999 1990-99 1997 1998 1999 1990-99 1997 1998 1999
Exports
North America 934 7 9 -1 4 7.0 11.0 3.5 6.0
Canada 238 7 6 0 11 8.5 8.0 8.0 10.5
United States 695 7 10 -1 2 6.5 12.0 2.5 4.5
Imports
North America 1280 8 10 5 11 8.5 13.0 10.5 11.0
Canada 220 7 15 3 7 8.5 18.5 4.5 10.5
United States 1059 8 9 5 12 8.5 12.0 11.5 11.5

Trad
e by
regi
on
45
Table III.14
Merchandise trade of Canada by region and economy, 1999
(Billion dollars and percentage)
Exports Imports a
Destination Annual Origin Annualpercentage percentage
Value Share change Value Share change
1999 1990 1999 1998 1999 1999 1990 1999 1998 1999
Region Region
World 238.45 100.0 100.0 -1 11 World 215.56 100.0 100.0 2 7
North America 205.08 75.1 86.0 3 13 North America 144.44 64.6 67.0 3 5
Western Europe 14.44 9.8 6.1 1 17 Asia 29.35 14.4 13.6 6 9
Asia 12.89 10.9 5.4 -28 -1 Western Europe 24.92 14.5 11.6 -4 13
Latin America 3.83 1.8 1.6 -12 -12 Latin America 10.00 3.4 4.6 0 14
Africa 1.09 0.8 0.5 -9 -24 Africa 1.37 0.8 0.6 -10 1
Middle East 1.05 0.7 0.4 -38 16 C./E. Europe/ C./E. Europe/ Baltic States/CIS 0.94 0.4 0.4 14 -9
Baltic States/CIS 0.41 0.8 0.2 -13 -29 Middle East 0.82 0.7 0.4 -39 10
Economies Economies
United States 205.02 75.0 86.0 3 13 United States 144.43 64.6 67.0 3 5
European Union (15) 13.37 8.5 5.6 -2 22 European Union (15) 22.04 12.7 10.2 -1 15
Japan 5.65 5.5 2.4 -28 -3 Japan 10.12 7.0 4.7 4 7
China 1.79 1.1 0.8 -3 6 Mexico 6.42 1.3 3.0 2 24
Korea, Rep. of 1.34 1.1 0.6 -44 9 China 6.00 1.0 2.8 13 16
Above 5 227.17 91.3 95.3 1 13 Above 5 189.02 86.6 87.7 3 7
Mexico 1.10 0.4 0.5 2 12 Taipei, Chinese 3.09 1.6 1.4 8 14
Taipei, Chinese 0.77 0.5 0.3 -32 -3 Korea, Rep. of 2.41 1.7 1.1 9 8
Hong Kong, China 0.74 0.5 0.3 -28 -19 Norway 1.72 1.2 0.8 -29 1
Brazil 0.70 0.3 0.3 -24 -25 Malaysia 1.39 0.3 0.6 -6 3
Australia 0.65 0.6 0.3 -8 -1 Thailand 1.02 0.3 0.5 1 18
Norway 0.50 0.4 0.2 4 -14 Brazil 0.92 0.6 0.4 -3 -2
Indonesia 0.37 0.2 0.2 -37 0 Hong Kong, China 0.88 0.8 0.4 -7 4
Iran, Islamic Rep. of 0.36 0.2 0.2 -66 104 Switzerland 0.85 0.5 0.4 13 12
Venezuela 0.35 0.2 0.1 -31 -26 Singapore 0.84 0.4 0.4 -6 6
Switzerland 0.33 0.7 0.1 101 -48 Australia 0.82 0.6 0.4 1 -5
Algeria 0.32 0.2 0.1 -18 -12 Philippines 0.70 0.1 0.3 23 9
India 0.28 0.2 0.1 -26 7 India 0.68 0.2 0.3 13 13
Malaysia 0.28 0.2 0.1 -39 -9 Venezuela 0.68 0.4 0.3 -19 20
Cuba 0.27 0.1 0.1 21 -16 Indonesia 0.58 0.1 0.3 5 -6
Singapore 0.25 0.3 0.1 -28 -13 Algeria 0.44 - 0.2 -15 18
Chile 0.24 0.1 0.1 -20 7 South Africa 0.42 0.1 0.2 3 7
Thailand 0.20 0.3 0.1 -40 0 Russian Fed. 0.41 0.0 0.2 10 -17
Saudi Arabia 0.20 0.2 0.1 -47 -7 Israel 0.30 0.1 0.1 24 6
Israel 0.20 0.1 0.1 -13 28 Saudi Arabia 0.29 0.5 0.1 -43 9
Philippines 0.20 - 0.1 -43 14 Chile 0.28 0.1 0.1 3 17
South Africa 0.18 0.1 0.1 -22 -23 New Zealand 0.25 0.2 0.1 -3 -3
Colombia 0.17 0.1 0.1 -7 -46 Cuba 0.21 0.1 0.1 -12 -8
Turkey 0.15 0.1 0.1 -37 -5 Argentina 0.21 0.1 0.1 4 17
Argentina 0.14 0.0 0.1 -22 -39 Nigeria 0.20 0.4 0.1 -46 0
New Zealand 0.14 0.1 0.1 -34 -2 Colombia 0.19 0.1 0.1 5 -17
Above 30 236.24 97.6 99.1 - - Above 30 208.78 97.0 96.9 - -
a Imports are valued f.o.b.

Trad
e by
regi
on
46
Table III.15
Merchandise trade of the United States by region and economy, 1999
(Billion dollars and percentage)
Exports Imports
Destination Annual Origin Annualpercentage percentage
Value Share change Value Share change
1999 1990 1999 1998 1999 1999 1990 1999 1998 1999
Region Region
World 692.8 100.0 100.0 -1 2 World 1059.2 100.0 100.0 5 12
Asia 184.0 30.3 26.6 -14 3 Asia 408.5 39.5 38.6 5 11
Western Europe 165.8 28.7 23.9 5 2 Western Europe 219.4 21.9 20.7 11 11
North America 164.3 21.2 23.7 3 6 North America 201.5 18.1 19.0 4 13
Latin America 141.6 13.7 20.4 6 0 Latin America 172.8 13.0 16.3 4 15
Middle East 21.1 2.9 3.0 12 -11 Middle East 26.8 3.9 2.5 -6 32
Africa 9.9 2.0 1.4 -2 -11 Africa 18.0 3.3 1.7 -19 6 C./E. Europe/ C./E. Europe/ Baltic States/CIS 5.7 1.1 0.8 -3 -24 Baltic States/CIS 12.2 0.5 1.2 28 7
Economies Economies
Canada 163.9 21.1 23.7 3 6 Canada 201.4 18.1 19.0 4 13
European Union (15) 152.0 26.3 21.9 6 1 European Union (15) 201.1 20.0 19.0 12 10
Mexico 87.0 7.2 12.6 11 10 Japan 134.9 18.1 12.7 1 8
Japan 57.5 12.4 8.3 -12 -1 Mexico 111.1 5.9 10.5 10 16
Korea, Rep. of 22.9 3.7 3.3 -34 39 China 87.8 3.1 8.3 14 17
Above 5 483.3 70.7 69.8 1 6 Above 5 736.2 65.3 69.5 7 12
Taipei, Chinese 19.1 2.9 2.8 -11 5 Taipei, Chinese 36.8 4.6 3.5 2 7
Singapore 16.2 2.0 2.3 -12 4 Korea, Rep. of 32.5 3.7 3.1 4 31
Brazil 13.2 1.3 1.9 -5 -13 Malaysia 22.1 1.1 2.1 5 13
China 13.1 1.2 1.9 11 -8 Singapore 18.5 2.0 1.8 -8 -1
Hong Kong, China 12.6 1.7 1.8 -14 -2 Thailand 15.2 1.1 1.4 7 8
Australia 11.8 2.2 1.7 -1 -1 Philippines 12.8 0.7 1.2 14 4
Malaysia 9.1 0.9 1.3 -17 1 Venezuela 12.0 1.9 1.1 -30 19
Switzerland 8.4 1.3 1.2 -13 15 Brazil 11.9 1.7 1.1 5 12
Saudi Arabia 7.9 1.0 1.1 25 -25 Hong Kong, China 11.0 1.9 1.0 2 1
Israel 7.7 0.8 1.1 16 10 Indonesia 10.3 0.7 1.0 2 3
Philippines 7.2 0.6 1.0 -9 7 Switzerland 10.1 1.1 0.9 6 10
Venezuela 5.4 0.8 0.8 -1 -18 Israel 10.0 0.7 0.9 18 14
Thailand 5.0 0.8 0.7 -29 -5 India 9.6 0.7 0.9 12 11
Argentina 4.9 0.3 0.7 1 -16 Saudi Arabia 8.9 2.1 0.8 -29 24
Dominican Republic 4.1 0.4 0.6 1 3 Colombia 6.6 0.7 0.6 -2 34
India 3.7 0.6 0.5 -2 5 Russian Fed. 6.0 - 0.6 33 0
Colombia 3.5 0.5 0.5 -7 -27 Australia 5.6 0.6 0.5 16 -2
Turkey 3.2 0.6 0.5 -1 -9 Nigeria 4.6 1.2 0.4 -32 2
Chile 3.1 0.4 0.4 -9 -23 Iraq 4.5 0.6 0.4 329 232
Egypt 3.0 0.6 0.4 -20 -1 Dominican Republic 4.4 0.4 0.4 2 -4
South Africa 2.8 0.5 0.4 21 -24 Costa Rica 4.2 0.2 0.4 18 42
United Arab Emirates 2.7 0.3 0.4 -9 14 South Africa 3.5 0.4 0.3 20 4
Costa Rica 2.4 0.3 0.3 14 4 Chile 3.3 0.3 0.3 7 17
Honduras 2.4 0.1 0.3 15 2 Honduras 2.8 0.1 0.3 9 5
Indonesia 1.9 0.5 0.3 -49 -15 Argentina 2.8 0.3 0.3 3 14
Above 30 657.9 93.3 95.0 - - Above 30 1006.1 94.2 95.0 - -

Trad
e by
regi
on
47
Table III.16
Merchandise exports of NAFTA countries by destination, 1990-99
(Billion dollars and percentage)
Destination United All otherOrigin States Canada Mexico NAFTA (3) countries World
Value
United States 1990 - 83.0 28.3 111.3 282.3 393.6
1997 - 150.1 71.4 221.5 467.2 688.7
1998 - 154.2 79.0 233.1 449.4 682.5
1999 - 163.9 87.0 250.9 444.3 695.2
Canada 1990 95.2 - 0.5 95.7 31.9 127.6
1997 176.8 - 1.0 177.8 36.7 214.4
1998 181.9 - 1.0 182.8 31.5 214.3
1999 205.0 - 1.1 206.1 32.3 238.4
Mexico 1990 32.3 0.2 - 32.6 8.2 40.7
1997 93.0 2.3 - 95.3 15.1 110.4
1998 101.9 1.7 - 103.6 13.9 117.5
1999 119.3 2.6 - 121.9 14.8 136.7
NAFTA (3) 1990 127.6 83.2 28.9 239.6 322.3 561.9
1997 269.8 152.4 72.3 494.6 519.0 1013.6
1998 283.8 155.9 80.0 519.6 494.7 1014.3
1999 324.3 166.5 88.1 578.9 491.4 1070.4
Share
United States 1990 - 14.8 5.0 19.8 50.2 70.0
1999 - 15.3 8.1 23.4 41.5 65.0
Canada 1990 16.9 - 0.1 17.0 5.7 22.7
1999 19.2 - 0.1 19.3 3.0 22.3
Mexico 1990 5.8 0.0 - 5.8 1.5 7.2
1999 11.1 0.2 - 11.4 1.4 12.8
NAFTA (3) 1990 22.7 14.8 5.1 42.6 57.4 100.0
1999 30.3 15.6 8.2 54.1 45.9 100.0
Annual percentage change
United States 1990-99 - 8 13 9 5 7
1998 - 3 11 5 -4 -1
1999 - 6 10 8 -1 2
Canada 1990-99 9 - 9 9 0 7
1998 3 - 2 3 -14 0
1999 13 - 12 13 3 11
Mexico 1990-99 16 32 - 16 7 14
1998 10 -25 - 9 -8 6
1999 17 52 - 18 7 16
NAFTA (3) 1990-99 11 8 13 10 5 7
1998 5 2 11 5 -5 0
1999 14 7 10 11 -1 6

Trad
e by
regi
on
48
Table III.17
Trade in commercial services of Canada, 1999
(Billion dollars and percentage)
Exports Imports
Value Share Value Share
1999 1995 1999 1999 1995 1999
Total commercial services 34.2 100.0 100.0 38.5 100.0 100.0
Transportation 6.3 20.7 18.5 8.1 24.1 21.1
Sea transport 1.3 5.7 3.9 2.8 9.0 7.2
Air transport 2.8 8.3 8.1 3.6 10.2 9.5
Other transport 2.2 6.6 6.6 1.7 4.8 4.5
Travel 10.2 31.1 29.8 11.3 31.1 29.5
Other commercial services 17.7 48.2 51.7 19.0 44.8 49.4
Communication services 1.4 5.0 4.0 1.4 3.9 3.7
Construction services 0.2 0.4 0.6 0.2 0.6 0.4
Insurance services 2.6 8.9 7.7 3.4 8.4 8.9
Financial services 1.0 2.5 2.8 1.3 2.9 3.5
Computer and information services 1.1 4.0 3.2 0.8 1.5 2.1
Royalties and licence fees 1.2 1.5 3.4 2.6 5.7 6.8
Other business services 9.2 23.0 26.8 8.1 18.8 21.0
Personal, cultural, and recreational services 1.1 2.9 3.2 1.2 3.0 3.1
Table III.18
Trade in commercial services of the United States, 1999
(Billion dollars and percentage)
Exports Imports
Value Share Value Share
1999 1995 1999 1999 1995 1999
Total commercial services 253.4 100.0 100.0 180.4 100.0 100.0
Transportation 48.4 22.8 19.1 55.8 32.3 30.9
Sea transport 4.2 2.8 1.7 16.3 9.2 9.1
Air transport 25.9 11.3 10.2 25.0 13.5 13.9
Other transport 18.4 8.7 7.3 14.5 9.6 8.0
Travel 87.1 37.3 34.4 62.0 35.7 34.3
Other commercial services 117.8 39.9 46.5 62.6 32.0 34.7
Communication services a 3.6 1.8 1.4 8.2 6.0 4.6
Construction services a 4.5 1.3 1.8 0.8 0.3 0.4
Insurance services a 3.4 0.7 1.3 7.7 4.1 4.3
Financial services a 15.8 3.6 6.2 3.9 1.9 2.2
Computer and information services a 4.1 1.2 1.6 0.5 0.2 0.3
Royalties and licence fees 37.2 15.4 14.7 12.4 5.4 6.9
Other business services 44.4 14.7 17.5 28.9 14.0 16.0
Personal, cultural, and recreational services 4.9 1.3 1.9 0.2 0.1 0.1
a Excludes transactions between affiliates, which are recorded under "Other business services".
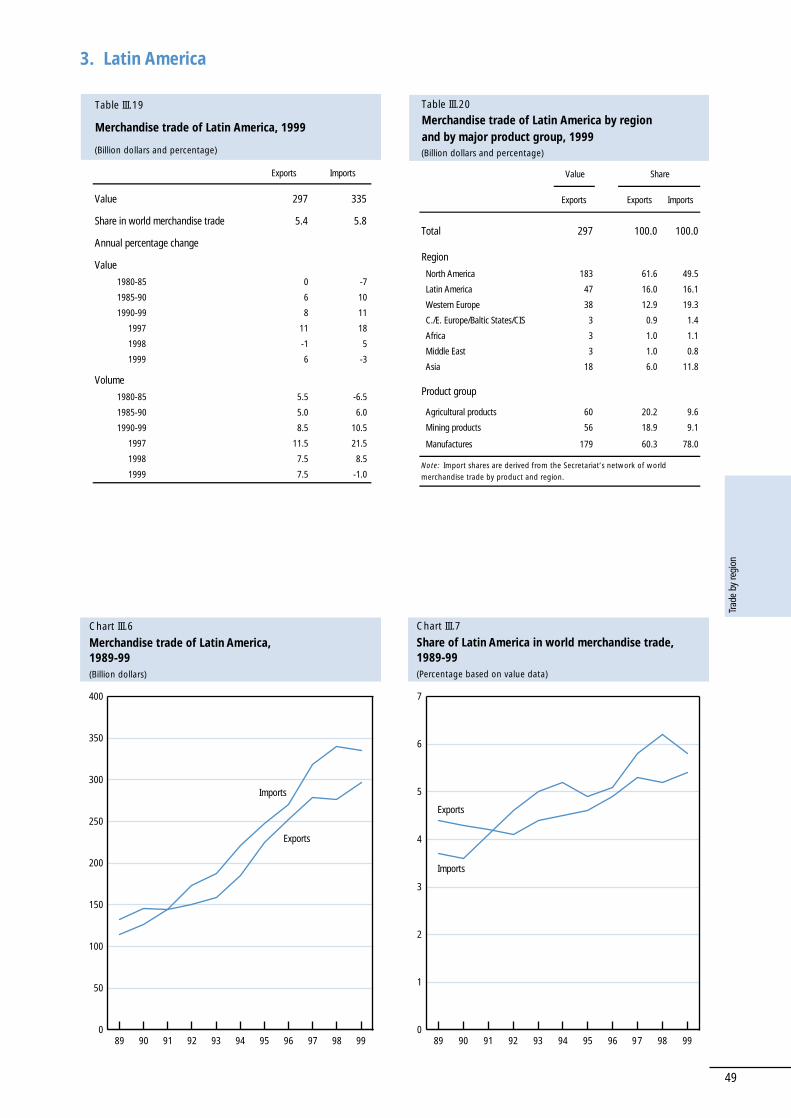
Trad
e by
regi
on
49
Table III.19
Merchandise trade of Latin America, 1999
(Billion dollars and percentage)
Exports Imports
Value 297 335
Share in world merchandise trade 5.4 5.8
Annual percentage change
Value
1980-85 0 -7
1985-90 6 10
1990-99 8 11
1997 11 18
1998 -1 5
1999 6 -3
Volume
1980-85 5.5 -6.5
1985-90 5.0 6.0
1990-99 8.5 10.5
1997 11.5 21.5
1998 7.5 8.5
1999 7.5 -1.0
Table III.20
Merchandise trade of Latin America by regionand by major product group, 1999(Billion dollars and percentage)
Value Share
Exports Exports Imports
Total 297 100.0 100.0
Region
North America 183 61.6 49.5
Latin America 47 16.0 16.1
Western Europe 38 12.9 19.3
C./E. Europe/Baltic States/CIS 3 0.9 1.4
Africa 3 1.0 1.1
Middle East 3 1.0 0.8
Asia 18 6.0 11.8
Product group
Agricultural products 60 20.2 9.6
Mining products 56 18.9 9.1
Manufactures 179 60.3 78.0
Note: Import shares are derived from the Secretariat’s network of world
merchandise trade by product and region.
Chart III.6
Merchandise trade of Latin America,1989-99(Billion dollars)
0
50
100
150
200
250
300
350
400
9998979695949392919089
Exports
Imports
0
1
2
3
4
5
6
7
9998979695949392919089
Exports
Imports
Chart III.7
Share of Latin America in world merchandise trade, 1989-99(Percentage based on value data)
3. Latin America

Trad
e by
regi
on
50
Table III.21
Merchandise exports of Latin America by product, 1999
(Billion dollars and percentage)
Share in exports Share inValue of Latin America world exports Annual percentage change
1999 1990 1999 1990 1999 1990-99 1997 1998 1999
Agricultural products 60.1 27.0 20.2 9.6 11.1 5 11 -4 -8
Food 53.1 24.0 17.9 11.2 12.2 5 12 -4 -10
Raw materials 7.0 3.0 2.4 4.4 6.5 5 -1 -11 6
Mining products 56.0 33.3 18.9 10.1 10.1 2 0 -24 19
Ores and other minerals 9.0 5.1 3.0 14.3 16.0 2 11 -2 -1
Fuels 38.0 22.7 12.8 9.3 9.5 1 -5 -31 32
Non-ferrous metals 9.0 5.4 3.0 10.9 9.1 1 10 -16 -3
Manufactures 179.1 38.0 60.3 2.3 4.3 14 18 10 9
Iron and steel 7.0 4.2 2.4 5.8 5.5 1 5 -8 -16
Chemicals 14.4 4.7 4.8 2.3 2.7 8 7 0 -1
Other semi-manufactures 16.0 4.8 5.4 2.7 3.9 10 13 0 4
Machinery and transport equipment 101.0 16.3 34.0 2.0 4.4 17 19 13 14
Automotive products 32.4 5.0 10.9 2.3 5.9 18 17 8 4
Office and telecom equipment 30.7 3.7 10.3 1.8 4.0 21 24 24 28
Other machinery and transport equipment 37.8 7.6 12.7 1.9 3.9 14 18 11 12
Textiles 4.1 1.5 1.4 2.2 2.7 7 14 -2 -4
Clothing 19.2 2.4 6.5 3.3 10.3 21 30 28 14
Other consumer goods 17.5 4.0 5.9 2.0 3.5 13 24 6 7
Total merchandise exports 297.0 100.0 100.0 4.3 5.4 8 11 -1 6
Table III.22
Merchandise exports of Latin America by destination, 1999
(Billion dollars and percentage)
Value Share Annual percentage change
1999 1990 1999 1990-99 1997 1998 1999
North America 183.0 45.4 61.6 12 13 4 20
Intra-Latin America 47.4 14.0 16.0 10 15 -5 -16
Western Europe 38.3 21.2 12.9 2 5 -1 -6
European Union (15) 36.1 20.2 12.1 2 6 -1 -6
Asia 17.8 9.5 6.0 3 4 -25 -1
Japan 6.8 5.1 2.3 -1 2 -26 3
China 2.3 0.8 0.8 8 14 -23 -19
Other 8.7 3.7 2.9 5 3 -25 2
Middle East 2.9 1.6 1.0 2 16 -3 -14
Africa 2.8 1.4 1.0 3 9 -3 -18
C./E. Europe/Baltic States/CIS 2.6 4.5 0.9 -10 -1 -8 -12
Inter-regional trade 247.4 83.8 83.3 8 10 0 12
World 297.0 100.0 100.0 8 11 -1 6

Trad
e by
regi
on
51
Table III.23
Leading merchandise exporters and importers in Latin America, 1999
(Billion dollars and percentage)
Value Share Annual percentage change
1999 1980 1990 1995 1999 1990-99 1997 1998 1999
Exporters
Mexico 136.7 16.4 27.7 34.8 46.0 14 15 6 16
maquiladoras 63.9 2.3 9.4 13.6 21.5 19 22 17 20
Brazil 48.0 18.4 21.4 20.3 16.2 5 11 -4 -6
Argentina 23.3 7.3 8.4 9.2 7.9 7 11 0 -12
Venezuela 19.9 17.5 11.9 8.1 6.7 1 -6 -20 15
Chile 15.6 4.3 5.7 7.0 5.3 7 8 -11 5
Colombia 11.6 3.6 4.6 4.4 3.9 6 9 -6 7
Costa Rica 6.6 0.9 1.0 1.5 2.2 18 14 29 19
Peru 6.1 3.6 2.2 2.4 2.1 7 16 -16 7
Dominican Republic 5.2 1.1 1.5 1.7 1.8 10 14 8 4
Ecuador 4.5 2.3 1.8 1.9 1.5 6 7 -20 6
Guatemala 2.4 1.4 0.8 0.9 0.8 8 15 10 -7
Trinidad and Tobago 2.2 3.7 1.4 1.1 0.8 1 0 -12 -1
Uruguay 2.2 1.0 1.2 0.9 0.8 3 14 2 -19
Cuba 1.6 5.1 3.5 0.7 0.5 -12 -2 -21 4
Netherlands Antilles 1.4 4.7 1.2 0.7 0.5 -3 17 -20 14
Latin America 297.0 100.0 100.0 100.0 100.0 8 11 -1 6
Importers
Mexico 148.7 17.9 33.4 29.9 44.4 15 23 14 14
maquiladoras 50.4 1.4 7.9 10.3 15.1 19 19 17 18
Brazil 51.7 20.2 17.3 21.2 15.5 10 14 -7 -15
Argentina 25.5 8.5 3.1 7.9 7.6 23 28 3 -19
Chile 15.1 4.7 5.9 6.3 4.5 8 10 -4 -19
Venezuela 14.8 9.6 5.6 5.0 4.4 8 48 9 -7
Colombia 10.7 3.8 4.3 5.5 3.2 7 12 -5 -27
Dominican Republic 8.2 1.6 2.3 2.0 2.4 12 15 15 8
Peru 8.1 2.0 2.7 3.6 2.4 10 8 -4 -18
Costa Rica 6.3 1.2 1.5 1.6 1.9 14 15 27 1
Guatemala 4.4 1.3 1.3 1.3 1.3 11 22 21 -6
Cuba 4.0 5.3 3.5 1.1 1.2 -2 5 4 14
Panama 3.5 1.2 1.2 1.0 1.1 10 8 2 14
Uruguay 3.4 1.4 1.0 1.1 1.0 11 12 2 -12
El Salvador 3.1 0.8 1.0 1.1 0.9 11 11 5 1
Ecuador 3.0 1.8 1.4 1.6 0.9 6 26 13 -46
Latin America 334.7 100.0 100.0 100.0 100.0 11 18 5 -3
Memorandum item:
ANDEAN (5)
Exports 43.0 27.8 21.2 17.3 14.5 4 2 -16 10 Imports 38.3 17.8 14.5 16.3 11.4 8 22 2 -20
MERCOSUR (4) Exports 74.3 26.9 31.6 30.8 25.0 5 11 -2 -9 Imports 82.8 30.6 22.5 31.5 24.8 12 18 -3 -16

Trad
e by
regi
on
52
Table III.24
Merchandise exports of MERCOSUR countries by region, 1990-99
(Million dollars and percentage)
Destination MERCOSUR (4) All other regions World
Origin Total Latin America Other regions
Value
Argentina 1990 1833 10520 1577 8943 123531998 9421 17020 3875 13145 264411999 6979 16354 3355 12999 23333
Brazil 1990 1320 30094 2399 27695 314141998 8877 42243 5442 36801 511201999 6778 41233 4686 36547 48011
Paraguay 1990 379 580 123 457 9591998 531 483 91 392 10141999 307 434 51 383 741
Uruguay 1990 595 1098 94 1004 16931998 1533 1236 196 1040 27691999 1007 1225 190 1035 2232
MERCOSUR (4) 1990 4127 42292 4193 38099 464191998 20362 60982 9604 51378 813441999 15071 59246 8282 50964 74317
Share
Argentina 1990 3.9 22.7 3.4 19.3 26.61999 9.4 22.0 4.5 17.5 31.4
Brazil 1990 2.8 64.8 5.2 59.7 67.71999 9.1 55.5 6.3 49.2 64.6
Paraguay 1990 0.8 1.2 0.3 1.0 2.11999 0.4 0.6 0.1 0.5 1.0
Uruguay 1990 1.3 2.4 0.2 2.2 3.61999 1.4 1.6 0.3 1.4 3.0
MERCOSUR (4) 1990 8.9 91.1 9.0 82.1 100.01999 20.3 79.7 11.1 68.6 100.0
Annual percentage change
Argentina 1990-99 16 5 9 4 71998 -2 1 1 2 01999 -26 -4 -13 -1 -12
Brazil 1990-99 20 4 8 3 51998 -2 -4 -3 -4 -41999 -24 -2 -14 -1 -6
Paraguay 1990-99 -2 -3 -9 -2 -31998 -9 -4 5 -6 -71999 -42 -10 -44 -2 -27
Uruguay 1990-99 6 1 8 0 31998 13 -10 15 -13 21999 -34 -1 -3 0 -19
MERCOSUR (4) 1990-99 15 4 8 3 51998 -1 -3 -1 -3 -21999 -26 -3 -14 -1 -9

Trad
e by
regi
on
53
Table III.25
Merchandise imports of MERCOSUR countries by region, 1990-99
(Million dollars and percentage)
Origin MERCOSUR (4) All other regions World
Destination Total Latin America Other regions
Value
Argentina 1990 833 3243 516 2727 40761998 7875 23529 1752 21777 314041999 6299 19167 1464 17703 25466
Brazil 1990 2443 20081 1551 18530 225241998 9858 50935 3310 47625 607931999 7044 44703 3047 41656 51747
Paraguay 1990 405 947 64 883 13521998 1467 1733 55 1678 32001999 957 1318 40 1278 2275
Uruguay 1990 560 783 137 646 13431998 1648 2163 176 1987 38111999 1461 1896 254 1642 3357
MERCOSUR (4) 1990 4241 25054 2268 22786 292951998 20848 78360 5293 73067 992081999 15761 67084 4805 62279 82845
Share
Argentina 1990 2.8 11.1 1.8 9.3 13.91999 7.6 23.1 1.8 21.4 30.7
Brazil 1990 8.3 68.5 5.3 63.3 76.91999 8.5 54.0 3.7 50.3 62.5
Paraguay 1990 1.4 3.2 0.2 3.0 4.61999 1.2 1.6 0.0 1.5 2.7
Uruguay 1990 1.9 2.7 0.5 2.2 4.61999 1.8 2.3 0.3 2.0 4.1
MERCOSUR (4) 1990 14.5 85.5 7.7 77.8 100.01999 19.0 81.0 5.8 75.2 100.0
Annual percentage change
Argentina 1990-99 25 22 12 23 231998 4 3 -2 3 31999 -20 -19 -16 -19 -19
Brazil 1990-99 12 9 8 9 101998 -3 -7 -21 -6 -71999 -29 -12 -8 -13 -15
Paraguay 1990-99 10 4 -5 4 61998 -16 5 -51 9 -61999 -35 -24 -27 -24 -29
Uruguay 1990-99 11 10 7 11 111998 2 3 -27 6 21999 -11 -12 44 -17 -12
MERCOSUR (4) 1990-99 16 12 9 12 121998 -1 -4 -16 -3 -31999 -24 -14 -9 -15 -16

Trad
e by
regi
on
54
Table III.26
Merchandise exports of ANDEAN countries by region, 1990-99
(Million dollars and percentage)
Destination ANDEAN (5) All other regions World
Origin Total Latin America Other regions
Value
Bolivia 1990 60 866 357 509 9261998 318 785 269 516 11031999 244 801 … ... 1045
Colombia 1990 373 6393 802 5591 67661998 2135 8717 1127 7590 108521999 1635 9941 1278 8663 11576
Ecuador 1990 189 2525 587 1938 27141998 548 3655 562 3093 42031999 389 4062 … ... 4451
Peru 1990 214 3016 283 2733 32301998 473 5262 562 4700 57351999 346 5768 632 5136 6114
Venezuela 1990 489 17008 2278 14730 174971998 1957 15236 3799 11437 171931999 1221 18631 5678 12953 19852
ANDEAN (5) 1990 1325 29808 4307 25501 311331998 5431 33655 6319 27336 390861999 3835 39203 … … 43038
Share
Bolivia 1990 0.2 2.8 1.1 1.6 3.01999 0.6 1.9 … … 2.4
Colombia 1990 1.2 20.5 2.6 18.0 21.71999 3.8 23.1 3.0 20.1 26.9
Ecuador 1990 0.6 8.1 1.9 6.2 8.71999 0.9 9.4 … … 10.3
Peru 1990 0.7 9.7 0.9 8.8 10.41999 0.8 13.4 1.5 11.9 14.2
Venezuela 1990 1.6 54.6 7.3 47.3 56.21999 2.8 43.3 13.2 30.1 46.1
ANDEAN (5) 1990 4.3 95.7 13.8 81.9 100.01999 8.9 91.1 … … 100.0
Annual percentage change
Bolivia 1990-99 17 -1 … … 11998 27 -14 -9 -17 -51999 -23 2 … … -5
Colombia 1990-99 18 5 5 5 61998 1 -7 -13 -7 -61999 -23 14 13 14 7
Ecuador 1990-99 8 5 … … 61998 -14 -21 -22 -21 -201999 -29 11 … … 6
Peru 1990-99 5 7 9 7 71998 -8 -17 -16 -17 -161999 -27 10 12 9 7
Venezuela 1990-99 11 1 11 -1 11998 -7 -22 -16 -24 -201999 -38 22 49 13 15
ANDEAN (5) 1990-99 13 3 … … 41998 -3 -18 -16 -18 -161999 -29 16 … … 10

Trad
e by
regi
on
55
Table III.27
Merchandise imports of ANDEAN countries by region, 1990-99
(Million dollars and percentage)
Origin ANDEAN (5) All other regions World
Destination Total Latin America Other regions
Value
Bolivia 1990 30 657 301 356 6871998 171 1812 697 1115 19831999 151 1604 … … 1755
Colombia 1990 474 5116 732 4384 55901998 1952 12683 1986 10697 146351999 1439 9220 1381 7839 10659
Ecuador 1990 119 1742 302 1440 18611998 964 4612 977 3635 55761999 610 2407 526 1881 3017
Peru a 1990 515 2385 440 1945 29001998 1182 7038 1496 5542 82201999 1032 5791 1175 4616 6823
Venezuela a 1990 213 6388 697 5691 66011998 964 13286 2254 11032 142501999 940 12614 1935 10679 13554
ANDEAN (5) 1990 1351 16288 2472 13816 176391998 5233 39431 7410 32021 446641999 4172 31636 … … 35808
Share
Bolivia 1990 0.2 3.7 1.7 2.0 3.91999 0.4 4.5 … … 4.9
Colombia 1990 2.7 29.0 4.1 24.9 31.71999 4.0 25.7 3.9 21.9 29.8
Ecuador 1990 0.7 9.9 1.7 8.2 10.61999 1.7 6.7 1.5 5.3 8.4
Peru 1990 2.9 13.5 2.5 11.0 16.41999 2.9 16.2 3.3 12.9 19.1
Venezuela 1990 1.2 36.2 4.0 32.3 37.41999 2.6 35.2 5.4 29.8 37.9
ANDEAN (5) 1990 7.7 92.3 14.0 78.3 100.01999 11.7 88.3 … … 100.0
Annual percentage change
Bolivia 1990-99 20 10 … … 111998 2 8 4 10 71999 -12 -11 … … -11
Colombia 1990-99 13 7 7 7 71998 -12 -4 14 -6 -51999 -26 -27 -30 -27 -27
Ecuador 1990-99 20 4 6 3 61998 14 12 26 9 131999 -37 -48 -46 -48 -46
Peru 1990-99 8 10 12 10 101998 -25 1 -2 1 -41999 -13 -18 -21 -17 -17
Venezuela 1990-99 18 8 12 7 81998 -6 10 7 10 81999 -2 -5 -14 -3 -5
ANDEAN (5) 1990-99 13 8 … … 81998 -10 4 9 2 21999 -20 -20 … … -20
a Imports are valued f.o.b.

Trad
e by
regi
on
56
Table III.28
Leading exporters and importers of commercial services in Latin America, 1999
(Billion dollars and percentage)
Value Share Annual percentage change
1999 1990 1999 1990-99 1997 1998 1999
Exporters
Mexico 11.8 24.3 22.2 6 5 6 -1
Brazil 6.8 12.5 12.7 7 23 29 -5
Argentina 4.3 7.6 8.0 7 2 4 -5
Chile 3.7 6.0 6.9 8 12 0 -8
Dominican Republic 2.8 3.7 5.3 11 14 2 17
Cuba a 2.4 2.1 4.5 16 12 13 …
Colombia 1.8 5.2 3.4 2 -2 -4 -8
Jamaica 1.8 3.3 3.4 7 6 3 4
Bahamas 1.8 4.9 3.4 2 1 -4 18
Netherlands Antilles 1.6 3.8 3.1 4 2 0 1
Peru 1.6 2.4 3.0 9 9 14 -3
Panama 1.6 3.1 3.0 6 6 8 2
Costa Rica a 1.3 2.0 2.5 9 7 18 …
Venezuela a 1.3 3.8 2.4 2 -6 -5 …
Uruguay 1.3 1.5 2.4 12 2 -7 -3
Latin America 53.4 100.0 100.0 7 7 7 0
Importers
Mexico 13.8 29.0 22.1 4 19 7 9
Brazil 11.9 19.4 19.1 7 18 9 -24
Argentina 8.2 8.3 13.1 12 12 5 -7
Venezuela a 4.5 6.9 7.1 7 16 -10 …
Chile 4.0 5.7 6.3 8 3 4 -3
Colombia 3.2 4.9 5.2 7 8 -3 -7
Peru 2.0 3.1 3.3 7 11 -1 -6
Dominican Republic 1.4 1.3 2.2 13 5 12 4
Jamaica 1.3 1.9 2.0 7 7 3 3
Ecuador 1.3 2.2 2.0 6 22 5 -16
Costa Rica a 1.1 1.6 1.7 8 0 15 …
Panama 1.1 1.9 1.7 5 24 -9 -6
Bahamas 0.9 1.5 1.4 6 18 19 -4
Netherlands Antilles 0.9 1.5 1.4 6 -8 6 14
Uruguay 0.8 1.0 1.4 10 6 -1 2
Latin America 62.4 100.0 100.0 7 13 5 -6
a Includes Secretariat estimates.
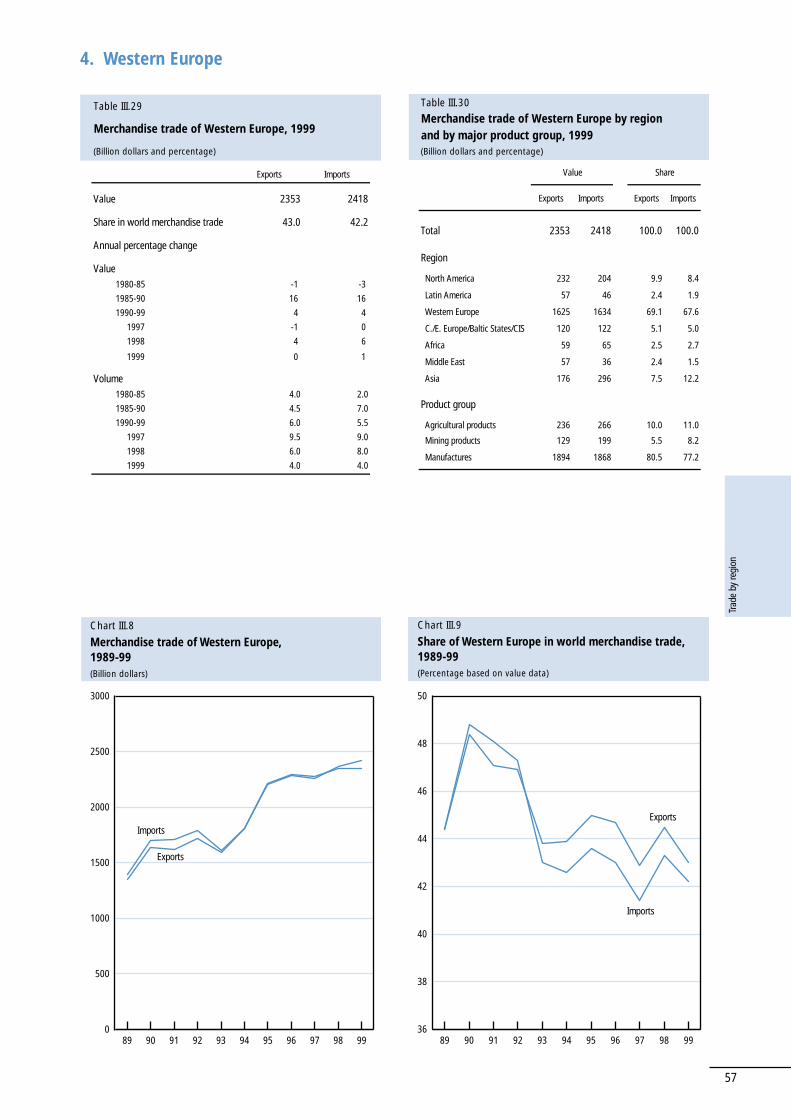
Trad
e by
regi
on
57
Table III.29
Merchandise trade of Western Europe, 1999
(Billion dollars and percentage)
Exports Imports
Value 2353 2418
Share in world merchandise trade 43.0 42.2
Annual percentage change
Value 1980-85 -1 -3
1985-90 16 16
1990-99 4 4
1997 -1 0
1998 4 6
1999 0 1
Volume 1980-85 4.0 2.0
1985-90 4.5 7.0
1990-99 6.0 5.5
1997 9.5 9.0
1998 6.0 8.0
1999 4.0 4.0
Table III.30
Merchandise trade of Western Europe by regionand by major product group, 1999(Billion dollars and percentage)
Value Share
Exports Imports Exports Imports
Total 2353 2418 100.0 100.0
Region
North America 232 204 9.9 8.4
Latin America 57 46 2.4 1.9
Western Europe 1625 1634 69.1 67.6
C./E. Europe/Baltic States/CIS 120 122 5.1 5.0
Africa 59 65 2.5 2.7
Middle East 57 36 2.4 1.5
Asia 176 296 7.5 12.2
Product group
Agricultural products 236 266 10.0 11.0
Mining products 129 199 5.5 8.2
Manufactures 1894 1868 80.5 77.2
0
500
1000
1500
2000
2500
3000
9998979695949392919089
Exports
Imports
Chart III.8
Merchandise trade of Western Europe,1989-99(Billion dollars)
36
38
40
42
44
46
48
50
9998979695949392919089
Exports
Imports
Chart III.9
Share of Western Europe in world merchandise trade, 1989-99(Percentage based on value data)
4. Western Europe

Trad
e by
regi
on
58
Table III.31
Merchandise exports of Western Europe by product, 1999
(Billion dollars and percentage)
Share in exports Share in
Value of Western Europe world exports Annual percentage change
1999 1990 1999 1990 1999 1990-99 1997 1998 1999
Agricultural products 236 11.5 10.0 45.2 43.4 3 -3 1 -2
Food 202 9.4 8.6 48.7 46.4 3 -3 1 -2
Raw materials 34 2.1 1.4 34.4 31.3 0 -2 -2 -4
Mining products 129 7.2 5.5 24.5 23.2 1 0 -16 5
Ores and other minerals 14 0.9 0.6 26.9 25.3 0 8 -12 -4
Fuels 76 4.3 3.3 19.7 19.1 1 -3 -23 11
Non-ferrous metals 39 2.1 1.6 46.2 39.0 2 4 -2 -1
Manufactures 1894 79.2 80.5 54.2 45.2 4 2 4 0
Iron and steel 63 3.9 2.7 61.0 49.7 0 -2 2 -10
Chemicals 311 11.8 13.2 65.1 59.1 5 2 6 2
Other semi-manufactures 214 10.0 9.1 61.8 51.8 3 -2 2 -1
Machinery and transport equipment 957 37.2 40.7 50.2 41.7 5 3 6 0
Automotive products 271 10.6 11.5 54.4 49.4 5 -1 8 1
Office and telecom equipment 221 5.8 9.4 32.0 28.7 10 11 8 3
Other machinery and transport equipment 464 20.8 19.7 57.1 47.6 4 1 4 -2
Textiles 63 3.4 2.7 53.2 42.7 1 3 1 -7
Clothing 60 2.9 2.6 43.6 32.4 3 9 -5 -2
Other consumer goods 226 10.0 9.6 54.5 46.0 4 1 1 0
Total merchandise exports 2353 100.0 100.0 48.3 43.0 4 -1 4 0
Table III.32
Merchandise imports of Western Europe by product, 1999
(Billion dollars and percentage)
Share in imports Share inValue of Western Europe world imports Annual percentage change
1999 1990 1999 1990 1999 1990-99 1997 1998 1999
Agricultural products 266 13.1 11.0 50.3 45.3 2 -5 2 -3
Food 216 10.0 8.9 50.3 45.8 3 -6 3 -3
Raw materials 50 3.1 2.1 50.3 43.4 -1 -2 -1 -3
Mining products 199 13.0 8.2 43.8 33.6 -1 -1 -15 3
Ores and other minerals 29 1.7 1.2 50.5 45.5 0 5 -4 -4
Fuels 126 8.9 5.2 40.6 29.5 -2 -5 -23 8
Non-ferrous metals 44 2.4 1.8 55.0 43.5 1 6 2 -6
Manufactures 1868 72.2 77.2 50.3 42.8 5 2 8 1
Iron and steel 60 3.3 2.5 49.8 43.8 1 0 11 -10
Chemicals 263 10.0 10.9 55.7 48.0 5 1 8 0
Other semi-manufactures 203 9.0 8.4 55.6 46.1 3 -3 5 1
Machinery and transport equipment 954 33.6 39.4 46.8 40.4 6 3 11 2
Automotive products 257 9.5 10.6 50.1 45.5 5 0 13 2
Office and telecom equipment 292 8.0 12.1 45.2 36.8 9 8 10 5
Other machinery and transport equipment 405 16.2 16.7 45.9 40.3 4 3 9 1
Textiles 59 3.2 2.4 50.1 37.7 1 3 2 -7
Clothing 92 3.6 3.8 55.3 47.2 5 6 -1 0
Other consumer goods 236 9.4 9.8 52.2 45.4 4 0 5 2
Total merchandise imports 2418 100.0 100.0 48.7 42.2 4 0 6 1

Trad
e by
regi
on
59
Table III.33
Merchandise exports of Western Europe by destination, 1999
(Billion dollars and percentage)
Value Share Annual percentage change
1999 1990 1999 1990-99 1997 1998 1999
Intra-Western Europe 1625 71.4 69.1 4 -2 6 0 European Union (15) 1492 65.1 63.4 4 -2 6 0
North America 232 7.8 9.9 7 10 9 12 United States 210 6.9 8.9 7 9 10 11
Asia 176 7.3 7.5 4 -3 -19 2 Japan 43 2.1 1.8 2 -10 -13 10 China 24 0.5 1.0 13 0 3 19 Australia and New Zealand 16 0.8 0.7 3 1 -5 -6 Other 93 4.0 4.0 4 -1 -27 -3
C./E. Europe/Baltic States/CIS 120 3.8 5.1 8 13 3 -9 Central and Eastern Europe 88 1.7 3.7 13 9 13 -2 Russian Fed. 17 - 0.7 - 21 -21 -34 Baltic States 7 - 0.3 - 29 10 -16
Africa 59 3.3 2.5 1 0 7 -7 South Africa 10 0.5 0.4 3 -3 5 -14 Other Africa 48 3.0 2.1 0 1 7 -5
Middle East 57 2.8 2.4 3 6 -5 -6
Latin America 57 1.8 2.4 8 13 7 -6
Inter-regional trade 701 26.8 29.8 5 5 -2 0
World 2353 100.0 100.0 4 -1 4 0
Table III.34
Merchandise imports of Western Europe by origin, 1999
(Billion dollars and percentage)
Value Share Annual percentage change
1999 1990 1999 1990-99 1997 1998 1999
Intra-Western Europe 1634 69.0 67.6 4 -2 6 0 European Union (15) 1514 63.2 62.6 4 -2 6 0
Asia 296 10.0 12.2 6 4 8 3 Japan 88 4.3 3.6 2 1 8 2 China 52 0.8 2.2 15 11 11 11 Australia and New Zealand 10 0.5 0.4 1 4 7 -9 Other 145 4.3 6.0 8 4 7 2
North America 204 8.2 8.4 4 6 5 -1 United States 186 7.3 7.7 5 10 5 -1
C./E. Europe/Baltic States/CIS 122 3.6 5.0 8 5 5 10 Central and Eastern Europe 77 1.6 3.2 13 7 19 9 Russian Fed. 30 - 1.2 - 2 -21 10 Baltic States 6 - 0.3 - 8 4 8
Africa 65 3.9 2.7 0 -5 -8 5 South Africa 13 0.6 0.5 3 4 6 7 Other Africa 52 3.3 2.1 -1 -7 -11 5
Latin America 46 2.3 1.9 2 2 0 0
Middle East 36 2.3 1.5 -1 -1 -11 9
Inter-regional trade 768 30.3 31.8 5 4 4 3
World 2418 100.0 100.0 4 0 6 1

Trad
e by
regi
on
60
Table III.35
Gross domestic product and trade in goods and services in Western Europe, 1999
(Billion dollars and percentage)
Value Annual percentage change in volume
Exports of goods Imports of goodsGDP GDP and services and services
1999 1990-99 1998 1999 1990-99 1998 1999 1990-99 1998 1999
Germany 2112 1.8 2.2 1.5 5.1 7.0 4.3 5.3 8.5 7.1
France 1434 1.6 3.2 2.9 5.8 7.7 3.6 4.3 11.3 3.1
United Kingdom 1423 2.0 2.2 2.1 5.3 2.4 2.9 5.5 8.8 7.5
Italy 1162 1.4 1.5 1.4 5.2 3.3 -0.4 4.1 9.1 3.4
Spain 591 2.3 4.0 3.7 10.1 7.1 8.5 8.5 11.1 12.6
Netherlands 395 2.7 3.7 3.6 5.3 6.4 4.7 4.9 7.7 5.1
Switzerland 257 0.6 2.1 1.7 2.9 4.6 4.4 3.5 9.4 5.3
Belgium 247 1.9 2.7 2.5 4.2 4.2 5.0 4.0 6.3 4.1
Sweden 239 1.4 3.0 3.8 6.8 7.3 5.2 4.6 10.4 5.0
Austria 209 2.0 2.9 2.2 5.3 8.7 4.7 5.4 6.9 3.5
Turkey 195 3.1 3.1 -5.0 9.9 12.0 -7.0 8.6 2.3 -3.7
Denmark 174 2.2 2.5 1.6 3.4 2.2 7.0 4.3 7.3 1.3
Norway 151 3.4 2.0 0.9 5.0 0.3 1.7 4.5 9.3 -3.1
Finland 129 1.7 5.0 3.5 8.5 9.3 7.4 4.0 8.5 3.4
Greece 125 2.1 3.7 3.2 4.3 4.2 6.2 4.6 1.9 5.4
Portugal 111 2.5 3.9 3.0 6.0 9.3 5.0 7.8 13.3 8.5
Ireland 91 6.5 8.9 8.7 13.9 20.5 14.0 12.5 23.2 14.5
Western Europe a 9070 1.9 2.7 2.1 5.7 5.9 3.6 5.2 9.0 5.4
European Union (15) 8458 1.9 2.7 2.3 5.8 5.9 3.8 5.2 9.1 5.7
a Excludes the former Yugoslavia.

Trad
e by
regi
on
61
Table III.36
Leading merchandise exporters and importers in Western Europe, 1999
(Billion dollars and percentage)
Annual percentage change
Value Share Value Volume
1999 1990 1999 1990-99 1997 1998 1999 1990-99 1997 1998 1999
Exporters
Germany 541.5 25.7 23.0 3 -2 6 0 5.5 12.0 7.0 4.0
France 300.4 13.2 12.8 4 0 5 -2 5.5 10.0 6.5 3.5
United Kingdom 269.0 11.3 11.4 4 8 -3 -1 5.0 7.5 1.5 2.0
Italy 230.6 10.4 9.8 3 -5 2 -6 4.5 5.5 2.5 -1.0
Netherlands 200.4 8.0 8.5 5 -4 4 0 7.0 8.0 9.5 4.5
Belgium 176.3 - 7.5 - - - -1 - - - 3.5
Spain 110.1 3.4 4.7 8 2 5 1 11.0 14.5 6.5 6.5
Sweden 84.9 3.5 3.6 4 -2 2 0 7.5 11.0 7.0 5.0
Switzerland 80.4 3.9 3.4 3 -6 4 2 3.5 7.5 5.0 3.5
Ireland 70.4 1.5 3.0 13 10 20 9 14.5 15.0 24.5 15.0
Austria 63.5 2.5 2.7 5 1 7 1 7.0 10.0 8.5 6.0
Denmark 49.0 2.3 2.1 3 -5 -1 2 5.5 6.0 2.0 5.5
Norway 44.9 2.1 1.9 3 -2 -18 13 7.5 5.0 -1.5 5.0
Finland 41.7 1.6 1.8 5 1 6 -3 7.5 11.5 9.0 3.5
Turkey 26.0 0.8 1.1 8 13 3 -4 8.0 13.5 6.0 6.5
Western Europe 2352.5 100.0 100.0 4 -1 4 0 6.0 9.5 6.0 4.0
Importers
Germany 472.5 20.9 19.5 3 -3 6 0 5.0 8.0 9.0 3.5
United Kingdom 320.3 13.1 13.2 4 7 2 2 5.0 8.5 7.5 5.5
France 290.1 13.8 12.0 2 -4 7 0 5.0 8.0 8.0 3.0
Italy 216.9 10.7 9.0 2 1 4 -1 4.5 12.0 10.0 4.0
Netherlands 187.6 7.4 7.8 5 -3 5 0 6.0 7.0 9.0 2.5
Belgium 160.9 - 6.7 - - - -2 - - - 0.5
Spain 144.8 5.2 6.0 6 1 8 9 9.5 12.5 13.0 14.0
Switzerland 79.9 4.1 3.3 2 -4 5 0 3.5 6.5 8.0 8.0
Austria 68.8 2.9 2.8 4 -4 5 1 5.0 4.5 7.0 4.0
Sweden 68.5 3.2 2.8 3 -2 4 0 5.5 11.0 10.0 3.0
Ireland 46.4 1.2 1.9 9 9 14 4 10.0 15.0 18.0 6.5
Denmark 44.3 2.0 1.8 3 -1 4 -4 5.5 10.0 2.5 1.5
Turkey 40.4 1.3 1.7 7 11 -5 -12 8.0 23.5 -2.5 0.0
Portugal 38.6 1.5 1.6 5 0 10 1 6.5 23.5 -2.5 -1.0
Norway 34.0 1.6 1.4 3 0 1 -6 4.5 11.0 6.5 -0.5
Western Europe 2417.9 100.0 100.0 4 0 6 1 5.5 9.0 8.0 4.0
Memorandum item:
European Union (15)
Exports 2180.4 92.2 92.7 4 0 4 -1 6.0 9.5 6.5 3.5
Imports 2232.2 91.6 92.3 4 0 6 1 5.5 9.0 8.5 4.0

Trad
e by
regi
on
62
Table III.37
Merchandise trade of European Union by region and economy, 1999
(Billion dollars and percentage)
Exports Imports
Destination Annual percentage Origin Annual percentageValue Share change Value Share change
1999 1990 1999 1998 1999 1999 1990 1999 1998 1999
Region Region
World 2180.4 100.0 100.0 4 -1 World 2232.2 100.0 100.0 6 1
Western Europe 1511.4 71.6 69.3 6 0 Western Europe 1503.9 69.1 67.4 6 0
North America 212.0 7.8 9.7 10 11 Asia 279.3 10.1 12.5 8 4
Asia 161.8 7.2 7.4 -20 2 North America 189.1 8.2 8.5 6 0
C./E. Europe/ C./E. Europe/ Baltic States/CIS 111.7 3.7 5.1 4 -10 Baltic States/CIS 110.4 3.4 4.9 5 11
Africa 55.8 3.4 2.6 6 -7 Africa 61.8 4.0 2.8 -8 6
Latin America 53.5 1.8 2.5 7 -6 Latin America 42.9 2.3 1.9 0 0
Middle East 51.8 2.7 2.4 -4 -7 Middle East 33.5 2.2 1.5 -10 11
Economies Economies
European Union (15) 1384.8 64.9 63.5 7 0 European Union (15) 1388.8 63.0 62.2 7 0
United States 188.9 6.9 8.7 11 8 United States 173.2 7.3 7.8 6 0
Switzerland 65.3 3.7 3.0 4 5 Japan 82.1 4.3 3.7 8 3
Japan 38.0 2.0 1.7 -14 10 Switzerland 54.5 3.0 2.4 6 1
Poland 30.2 0.4 1.4 10 -2 China 50.2 0.8 2.2 10 14
Above 5 1707.2 78.0 78.3 6 1 Above 5 1748.8 78.5 78.3 7 1
Norway 24.1 1.2 1.1 4 -12 Norway 30.2 1.7 1.4 -20 1
China 23.0 0.5 1.1 4 21 Russian Fed. 23.3 - 1.0 -23 5
Turkey 20.8 0.7 1.0 -5 -11 Taipei, Chinese 22.5 0.8 1.0 10 6
Czech Rep. 19.0 - 0.9 6 1 Korea, Rep. of 19.6 0.6 0.9 17 10
Hungary 18.2 0.3 0.8 21 -1 Poland 18.8 0.5 0.8 12 2
Canada 16.4 0.9 0.8 2 3 Hungary 18.5 0.3 0.8 25 11
Hong Kong, China 15.9 0.6 0.7 -17 -16 Czech Rep. 17.6 - 0.8 22 8
Russian Fed. 15.2 - 0.7 -20 -33 Hong Kong, China 17.0 0.7 0.8 8 6
Brazil 14.5 0.3 0.7 3 -14 Turkey 15.7 0.5 0.7 12 3
Australia 14.1 0.6 0.6 -3 -1 Canada 14.8 0.8 0.7 1 0
Israel 13.4 0.5 0.6 -8 13 Singapore 14.3 0.4 0.6 -2 -5
Singapore 12.1 0.5 0.6 -22 2 Brazil 14.2 0.8 0.6 5 -8
Taipei, Chinese 11.8 0.4 0.5 -9 -8 Malaysia 12.5 0.3 0.6 1 -4
Mexico 11.1 0.3 0.5 23 9 South Africa 12.5 0.6 0.6 6 10
India 10.9 0.5 0.5 -12 8 India 10.7 0.4 0.5 1 -4
Korea, Rep. of 10.6 0.5 0.5 -44 17 Thailand 10.7 0.3 0.5 5 0
South Africa 10.0 0.5 0.5 5 -15 Indonesia 9.8 0.2 0.4 3 -3
United Arab Emirates 9.7 0.3 0.4 13 -1 Israel 8.7 0.3 0.4 8 10
Saudi Arabia 9.5 0.7 0.4 -8 -29 Libyan Arab Jamahiriya 8.1 0.7 0.4 -27 28
Egypt 8.1 0.4 0.4 7 0 Algeria 7.9 0.6 0.4 -20 4
Slovenia 7.2 - 0.3 5 -3 Saudi Arabia 7.8 0.7 0.4 -29 -8
Morocco 6.4 0.3 0.3 11 -1 Australia 7.0 0.4 0.3 8 -10
Romania 6.4 0.1 0.3 23 -8 Slovak Rep. 6.3 - 0.3 34 3
Malaysia 6.2 0.2 0.3 -40 6 Romania 6.1 0.1 0.3 14 3
Tunisia 6.2 0.3 0.3 8 -3 Morocco 5.6 - 0.3 5 -1
Above 30 2027.8 - 93.0 - - Above 30 2088.9 - 93.6 - -

Trad
e by
regi
on
63
Table III.38
Leading exporters and importers of commercial services in Western Europe, 1999
(Billion dollars and percentage)
Value Share Annual percentage change
1999 1990 1999 1990-99 1997 1998 1999
Exporters
United Kingdom 101.5 12.8 15.9 7 14 7 3
France 82.6 15.9 12.9 2 -3 5 -2
Germany 79.3 12.4 12.4 5 -2 2 0
Italy 61.2 11.7 9.6 3 2 0 -8
Netherlands 54.2 7.1 8.5 7 3 4 3
Spain 53.0 6.6 8.3 7 0 12 8
Belgium-Luxembourg 39.0 5.9 6.1 5 3 8 6
Austria 30.5 5.5 4.8 3 -13 9 -4
Switzerland 26.3 4.4 4.1 4 -3 5 2
Sweden 18.4 3.2 2.9 4 5 1 4
Turkey a 16.0 1.9 2.5 8 49 21 …
Denmark 15.8 3.1 2.5 2 -14 8 4
Norway 15.4 3.0 2.4 2 3 -3 10
Ireland 14.0 0.8 2.2 17 9 … -12
Greece a 10.1 1.6 1.6 5 0 9 …
Western Europe 640.1 100.0 100.0 5 2 7 -1
Importers
Germany 132.8 20.2 21.8 6 -3 4 3
United Kingdom 81.4 11.4 13.4 7 9 10 4
France 63.1 12.9 10.4 3 -5 5 -4
Italy 58.4 11.9 9.6 3 3 7 -7
Netherlands 47.5 7.4 7.8 6 0 5 1
Belgium-Luxembourg 36.6 6.2 6.0 5 0 8 7
Spain 30.0 3.9 4.9 8 2 13 11
Austria 28.3 3.6 4.6 8 -3 6 -6
Ireland 26.1 1.3 4.3 20 13 … -9
Sweden 23.0 4.3 3.8 3 4 11 6
Norway 17.7 3.1 2.9 4 9 4 16
Switzerland 16.1 2.8 2.6 4 -10 8 5
Denmark 15.2 2.6 2.5 5 -6 15 -4
Turkey a 8.4 0.7 1.4 13 34 17 …
Finland 7.6 1.9 1.2 0 -7 -4 -2
Western Europe 609.3 100.0 100.0 5 1 9 1
Memorandum item:
European Union (15)
Exports 574.5 88.9 89.7 5 1 7 0
Imports 561.4 89.2 92.1 5 0 9 0
a Includes Secretariat estimates.

Trad
e by
regi
on
64
Table III.39
Trade in commercial services of France, 1999
(Billion dollars and percentage)
Exports Imports
Value Share Value Share
1999 1995 1999 1999 1995 1999
Total commercial services 82.6 100.0 100.0 63.1 100.0 100.0
Transportation 20.0 24.6 24.2 19.6 32.9 31.1
Sea transport 3.5 4.5 4.2 4.6 7.4 7.2
Air transport 9.1 10.7 11.1 8.9 14.5 14.1
Other transport 7.3 9.5 8.9 6.1 10.9 9.7
Travel 31.4 33.2 38.0 18.6 25.4 29.5
Other commercial services 31.2 42.2 37.8 24.9 41.7 39.5
Communication services 1.0 0.6 1.2 0.9 0.6 1.4
Construction services 4.0 3.7 4.9 2.1 1.6 3.4
Insurance services 1.0 2.2 1.2 1.1 2.4 1.7
Financial services 1.4 3.1 1.7 1.4 3.6 2.2
Computer and information services 0.8 0.4 0.9 0.6 0.8 1.0
Royalties and licence fees 2.0 2.2 2.4 2.3 3.6 3.6
Other business services 19.8 28.5 24.0 14.8 27.0 23.4
Personal, cultural, and recreational services 1.2 1.4 1.5 1.7 2.1 2.8
Table III.40
Trade in commercial services of Germany, 1999
(Billion dollars and percentage)
Exports Imports
Value Share Value Share
1999 1995 1999 1999 1995 1999
Total commercial services 79.3 100.0 100.0 132.8 100.0 100.0
Transportation 20.0 26.0 25.2 24.4 19.6 18.4
Sea transport 6.7 8.2 8.4 7.4 6.1 5.6
Air transport 9.5 12.6 12.0 7.3 6.5 5.5
Other transport 3.8 5.2 4.8 9.7 7.0 7.3
Travel 16.7 23.8 21.1 48.4 41.6 36.4
Other commercial services 42.6 50.2 53.7 60.0 38.7 45.2
Communication services 1.8 2.7 2.2 3.2 2.4 2.4
Construction services 4.4 7.0 5.6 5.1 4.7 3.9
Insurance services 2.5 1.7 3.2 2.1 1.2 1.6
Financial services 4.0 3.2 5.0 2.9 0.4 2.1
Computer and information services 2.7 1.9 3.4 4.3 1.6 3.3
Royalties and licence fees 3.0 4.2 3.8 4.4 4.7 3.3
Other business services 24.0 29.3 30.3 34.6 22.2 26.1
Personal, cultural, and recreational services 0.1 0.2 0.2 3.3 1.6 2.5

Trad
e by
regi
on
65
Table III.41
Trade in commercial services of Italy, 1998
(Billion dollars and percentage)
Exports Imports
Value Share Value Share
1998 1995 1998 1998 1995 1998
Total commercial services 66.6 100.0 100.0 62.9 100.0 100.0
Transportation 10.6 17.7 16.0 13.6 24.5 21.7
Sea transport 4.7 7.5 7.0 6.0 11.9 9.5
Air transport 3.6 6.1 5.3 4.8 7.2 7.6
Other transport 2.4 4.1 3.6 2.8 5.4 4.5
Travel 29.8 47.0 44.7 17.6 27.2 28.0
Other commercial services 26.2 35.3 39.3 31.7 48.4 50.4
Communication services 0.7 0.5 1.0 1.4 1.1 2.3
Construction services 4.5 5.2 6.7 1.4 2.8 2.2
Insurance services 1.3 2.3 1.9 1.8 1.6 2.9
Financial services 2.3 4.3 3.4 3.1 8.2 4.9
Computer and information services 0.3 0.3 0.4 0.8 0.8 1.2
Royalties and licence fees 0.5 0.8 0.7 1.2 2.1 1.8
Other business services 16.2 21.5 24.4 20.7 29.7 33.0
Personal, cultural, and recreational services 0.4 0.6 0.6 1.3 2.0 2.0
Table III.42
Trade in commercial services of the United Kingdom, 1999
(Billion dollars and percentage)
Exports Imports
Value Share Value Share
1999 1995 1999 1999 1995 1999
Total commercial services 101.5 100.0 100.0 81.4 100.0 100.0
Transportation 18.8 21.6 18.5 23.5 28.4 28.9
Sea transport 6.4 9.0 6.3 7.9 11.1 9.7
Air transport 10.9 11.2 10.7 14.0 15.8 17.1
Other transport 1.5 1.5 1.4 1.7 1.5 2.1
Travel 23.1 27.5 22.8 36.4 41.8 44.7
Other commercial services 59.6 50.9 58.7 21.5 29.8 26.4
Communication services 2.4 2.1 2.3 2.8 3.5 3.5
Construction services 0.4 0.3 0.4 0.2 0.3 0.2
Insurance services 6.0 6.0 5.9 0.9 1.3 1.2
Financial services a 11.8 9.5 11.6 0.3 0.5 0.4
Computer and information services 3.0 1.7 2.9 0.8 0.8 1.0
Royalties and licence fees 7.0 7.5 6.9 6.0 8.3 7.3
Other business services 28.1 22.4 27.6 9.7 13.8 12.0
Personal, cultural, and recreational services 1.0 1.5 1.0 0.7 1.3 0.8
a The service earnings of financial institutions are recorded net of their foreign expenses. Imports of financial services only cover imports by non-financial institutions.

Trad
e by
regi
on
66
Table III.43
Merchandise trade of the Central and Eastern Europe,the Baltic States and the CIS, 1999(Billion dollars and percentage)
Exports Imports
Value 214 214
Share in world merchandise trade 3.9 3.7
Annual percentage change
Value
1980-85 a 0 -1
1985-90 a 3 5
1990-99 6 5
1997 4 6
1998 -5 -2
1999 -1 -12
Volume
1990-99 4.0 3.0
1997 10.5 13.5
1998 5.0 4.5
1999 -1.5 -9.0
a Includes the former German Democratic Republic.
Table III.44
Merchandise trade of the C./E. Europe, the Baltic Statesand the CIS by region and by major product group, 1999(Billion dollars and percentage)
Value Share
Exports Exports Imports
Total 214 100.0 100.0
Region
North America 9 4.4 3.0
Latin America 4 1.9 1.3
Western Europe 120 56.0 60.1
C./E. Europe/Baltic States/CIS 56 26.1 27.9
Africa 3 1.2 0.7
Middle East 4 1.9 0.6
Asia 16 7.4 6.4
Product group
Agricultural products 22 10.1 12.4
Mining products 60 28.0 11.9
Manufactures 122 57.2 71.0
Note: Import shares are derived from the Secretariat’s network of world
merchandise trade by product and region.
0
50
100
150
200
250
300
9998979695949392919089
Exports
Imports
Chart III.10
Merchandise trade of the Central and Eastern Europe,the Baltic States and the CIS, 1989-99(Billion dollars)
Note: New valuation in 1990 and change in area definition in 1992 and 1996.
0
1
2
3
4
5
6
7
9998979695949392919089
Exports
Imports
Chart III.11
Share of the Central and Eastern Europe, the Baltic Statesand the CIS in world merchandise trade, 1989-99(Percentage based on value data)
Note: New valuation in 1990 and change in area definition in 1992 and 1996.
5. Central and Eastern Europe, the Baltic States and the CIS (transition economies)

Trad
e by
regi
on
67
Table III.45
Merchandise exports of the C./E. Europe, the Baltic States and the CIS by major product group and main destination, 1999
(Billion dollars and percentage)
Value Share Annual percentage change
1999 1990 1999 1990-99 1997 1998 1999
Manufactures
World 122.3 100.0 100.0 … 5 9 -2
Western Europe 77.6 43.5 63.5 15 11 24 5
C./E. Europe/Baltic States/CIS 24.1 32.0 19.7 … 0 -9 -20
Asia 8.1 12.3 6.6 3 -13 -24 14
Mining products
World 60.0 100.0 100.0 … 7 -16 4
Western Europe 31.4 67.7 52.3 2 8 -16 9
C./E. Europe/Baltic States/CIS 19.1 17.6 31.8 … 14 -21 -10
Asia 3.8 8.4 6.3 2 1 -14 28
Agricultural products
World 21.6 100.0 100.0 … 0 -13 -7
Western Europe 9.5 63.8 44.0 2 -5 -3 2
C./E. Europe/Baltic States/CIS 8.0 14.1 37.0 … 2 -21 -20
Asia 2.3 12.1 10.5 4 21 -11 10
Total merchandise
World 214.0 100.0 100.0 6 4 -5 -1
Western Europe 119.8 55.2 56.0 8 9 6 6
C./E. Europe/Baltic States/CIS 55.9 23.8 26.1 … 4 -15 -16
Asia 15.9 10.9 7.4 4 -4 -22 20
a The figures are affected by breaks in the continuity of the data series. See the Technical Notes.
Table III.46
Relative importance of inter-regional trade in the total merchandise trade of the Baltic States and the CIS, 1999
(Million dollars and percentage)
Exports Imports
Value Share Value Share
Baltic All Baltic All Baltic All Baltic AllStates and other States and other States and other States and other
World the CIS countries the CIS countries World the CIS countries the CIS countries
Belarus 5920 4130 1790 69.8 30.2 Tajikistan 665 520 145 78.2 21.8
Moldova, Rep. of 470 265 205 56.4 43.6 Belarus 6665 4420 2245 66.3 33.7
Tajikistan 690 320 370 46.4 53.6 Ukraine 11845 6940 4905 58.6 41.4
Georgia 240 110 130 45.8 54.2 Kazakhstan 3685 1610 2075 43.7 56.3
Kyrgyzstan 455 190 265 41.8 58.2 Kyrgyzstan 600 260 340 43.3 56.7
Turkmenistan 1600 540 1060 33.8 66.3 Moldova, Rep. of 570 230 340 40.4 59.6
Lithuania 3005 1000 2005 33.3 66.7 Georgia 600 225 375 37.5 62.5
Kazakhstan 5590 1685 3905 30.1 69.9 Azerbaijan 1035 325 710 31.4 68.6
Ukraine 11580 3420 8160 29.5 70.5 Turkmenistan 1080 330 750 30.6 69.4
Uzbekistan 2000 560 1440 28.0 72.0 Latvia 2945 845 2100 28.7 71.3
Estonia 2940 765 2175 26.0 74.0 Lithuania 4835 1350 3485 27.9 72.1
Armenia 235 60 175 25.5 74.5 Russian Fed. 41100 10300 30800 25.1 74.9
Latvia 1725 420 1305 24.3 75.7 Armenia 800 175 625 21.9 78.1
Azerbaijan 930 215 715 23.1 76.9 Estonia 4115 855 3260 20.8 79.2
Russian Fed. 74300 14810 59490 19.9 80.1 Uzbekistan 2250 350 1900 15.6 84.4
Baltic States and Baltic States and the CIS 111680 28490 83190 25.5 74.5 the CIS 82790 28735 54055 34.7 65.3

Trad
e by
regi
on
68
Table III.47
Leading merchandise exporters and importers in the Central and Eastern Europe, the Baltic States and the CIS, 1999
(Billion dollars and percentage)
Value Share Annual percentage change
1999 1996 1999 1997 1998 1999
Exporters
Russian Fed. 74.3 41.5 34.7 0 -16 0
Poland 27.4 11.4 12.8 5 3 -3
Czech Rep. 26.9 10.3 12.5 4 16 2
Hungary 25.0 7.4 11.7 22 20 9
Ukraine 11.6 6.7 5.4 -1 -11 -8
Slovak Rep. 10.2 4.1 4.8 -7 11 -5
Romania 8.5 3.8 4.0 4 -2 2
Belarus 5.9 2.6 2.8 29 -3 -16
Kazakhstan 5.6 2.8 2.6 10 -16 3
Bulgaria 4.1 2.3 1.9 1 -13 -6
C./E. Europe/Baltic States/CIS 214.0 100.0 100.0 4 -5 -1
Importers
Poland 45.9 16.2 21.5 14 11 -2
Russian Fed. 41.1 29.9 19.2 7 -20 -30
Czech Rep. a 28.8 12.1 13.5 -2 6 0
Hungary 28.0 7.9 13.1 17 21 9
Ukraine 11.8 7.7 5.5 -3 -14 -19
Slovak Rep. a 11.2 4.8 5.3 -8 11 -14
Romania 10.4 5.0 4.9 -1 5 -12
Belarus 6.7 3.0 3.1 25 -2 -22
Bulgaria 5.5 2.2 2.6 -3 1 10
Lithuania 4.8 2.0 2.3 24 3 -17
C./E. Europe/Baltic States/CIS 213.9 100.0 100.0 6 -2 -12
Memorandum item:
Central and Eastern Europe
Exports 102.4 39.4 47.8 6 9 1
Imports 131.1 48.5 61.3 6 11 -1
Baltic States
Exports 7.7 3.2 3.6 23 3 -12
Imports 11.9 4.4 5.6 27 8 -14
CIS
Exports 104.0 57.4 48.6 2 -15 -1
Imports 70.9 47.1 33.1 5 -16 -26
a Imports are valued f.o.b.

Trad
e by
regi
on
69
Table III.48
Merchandise exports of selected Central and Eastern European countries by region, major trading partner, and major product group, 1997-99(Million dollars and percentage)
Origin Czech SlovakDestination Bulgaria Rep. Rep. Hungary Poland a Romania
Value
Total 1997 4940 22775 9695 19100 25750 8430
1998 4300 26350 10775 23005 28230 83001999 4060 26855 10245 25015 27405 8505
Share in total
Region and major trading partner
North America 1997 3.6 2.8 2.0 3.4 3.0 4.21998 3.2 2.5 1.4 4.8 3.0 4.61999 4.5 2.7 1.6 5.3 3.1 4.0
Latin America 1997 1.4 0.7 0.6 0.4 0.9 1.51998 1.4 0.7 0.5 0.8 1.0 1.71999 1.2 0.5 0.6 0.5 1.2 1.0
Western Europe 1997 58.3 64.3 51.4 77.2 66.5 65.21998 64.1 68.4 59.9 78.0 70.9 72.41999 69.6 73.3 63.6 80.9 73.9 74.6
European Union (15) 1997 43.2 59.9 47.1 71.2 64.2 56.51998 49.7 64.2 55.6 72.9 68.3 64.51999 51.8 69.2 59.5 76.2 70.5 65.5
C./E. Europe/Baltic States/CIS 1997 21.4 27.0 43.5 15.3 24.1 10.91998 17.4 24.0 36.4 13.0 20.9 9.21999 13.0 19.5 31.7 9.8 17.1 9.9
Central and Eastern Europe 1997 3.5 21.2 36.1 7.7 6.8 4.61998 4.8 19.2 31.7 8.1 7.1 5.01999 3.8 16.4 28.8 6.8 7.8 6.6
Russian Fed. 1997 8.0 3.4 3.4 5.1 8.4 3.01998 5.4 2.5 1.9 2.9 5.7 1.01999 4.0 1.4 1.0 1.4 2.6 0.6
Africa 1997 2.1 0.8 0.4 0.6 1.4 5.41998 2.9 0.7 0.4 0.6 1.1 4.41999 2.4 0.6 0.5 0.4 1.4 3.8
Middle East 1997 3.3 1.6 0.7 1.0 0.9 6.81998 3.1 1.3 0.5 0.8 1.3 5.31999 2.6 1.2 0.5 0.8 0.7 4.1
Asia 1997 4.8 2.6 1.3 1.7 3.1 5.91998 4.6 2.1 0.7 1.9 1.7 2.31999 3.9 2.0 1.1 2.3 2.3 2.5
Major product group
Agricultural products 1997 16.8 8.1 7.3 16.0 14.5 10.61998 19.0 7.2 6.0 12.9 12.6 9.01999 18.3 6.7 6.0 10.0 11.0 10.4
Mining products 1997 18.6 6.0 9.1 5.7 12.5 10.61998 15.3 5.1 7.0 4.3 10.1 9.61999 18.5 4.7 8.0 3.7 10.0 10.3
Manufactures 1997 61.1 85.5 83.3 78.2 72.8 78.31998 61.7 87.3 83.6 82.7 77.1 80.61999 59.7 88.1 81.9 86.2 78.6 78.3
a New arrangements in customs procedures beginning with 1998. See the Technical Notes.

Trad
e by
regi
on
70
Table III.49
Merchandise imports of selected Central and Eastern European countries by region, major trading partnerand major product group, 1997-99(Million dollars and percentage)
Destination Czech Slovak
Origin Bulgaria Rep. a Rep. a Hungary Poland b Romania
Value
Total 1997 4930 27165 11670 21235 42310 11280
1998 4980 28790 13005 25705 47055 11840
1999 5475 28825 11245 28010 45910 10390
Share in total
Region and major trading partner
North America 1997 3.9 4.1 3.4 4.2 4.9 4.9
1998 4.2 4.1 3.2 4.3 4.3 4.8
1999 3.2 4.4 2.8 3.7 4.0 3.8
Latin America 1997 4.1 0.9 0.7 1.5 1.6 2.7
1998 4.1 0.8 0.6 1.6 1.4 2.1
1999 3.7 0.9 0.6 1.7 1.2 1.9
Western Europe 1997 43.3 64.7 46.3 65.9 67.2 56.9
1998 51.2 66.6 52.8 67.3 69.2 62.4
1999 54.5 67.6 54.3 67.4 68.5 65.3
European Union (15) 1997 37.7 61.5 43.8 62.8 63.8 52.5
1998 45.0 63.3 50.1 64.1 66.0 57.7
1999 48.5 64.0 51.7 64.4 65.0 60.4
C./E. Europe/Baltic States/CIS 1997 37.6 21.1 43.0 17.8 14.5 20.8
1998 30.3 18.9 36.2 14.2 12.9 20.4
1999 29.7 17.4 35.7 13.5 14.0 18.1
Central and Eastern Europe 1997 4.7 13.0 26.2 6.8 5.9 5.9
1998 5.2 12.2 23.5 6.5 6.0 8.8
1999 6.0 11.4 22.0 6.6 6.2 8.5
Russian Fed. 1997 28.0 6.8 13.9 9.2 6.4 12.0
1998 20.1 5.5 10.4 6.5 5.0 9.0
1999 19.0 4.8 12.0 5.8 5.8 6.8
Africa 1997 1.6 0.7 0.4 0.5 1.2 1.7
1998 1.6 0.6 0.3 0.5 1.1 0.7
1999 1.4 0.7 0.3 0.4 0.9 0.8
Middle East 1997 3.0 0.4 0.3 0.3 0.4 3.0
1998 2.7 0.4 0.2 0.3 0.4 2.0
1999 2.5 0.3 0.2 0.3 0.5 1.4
Asia 1997 4.0 6.5 5.0 9.7 9.9 9.9
1998 4.7 7.1 5.2 11.8 10.6 7.5
1999 4.1 7.1 5.3 12.9 10.7 8.3
Major product group
Agricultural products 1997 11.2 8.8 9.4 6.9 10.7 7.8
1998 10.2 8.6 8.0 6.1 9.7 9.9
1999 8.9 7.8 8.0 4.8 8.8 8.8
Mining products 1997 36.3 12.4 14.8 13.6 11.5 22.3
1998 28.0 10.3 9.5 9.5 9.0 15.3
1999 23.7 9.9 12.4 8.6 9.8 13.3
Manufactures 1997 50.1 78.7 67.0 79.5 77.4 67.9
1998 59.3 81.0 76.6 84.3 80.2 72.8
1999 65.5 82.3 73.7 86.5 80.3 77.0
a Imports are valued f.o.b.
b New arrangements in customs procedures beginning with 1998. See the Technical Notes.

Trad
e by
regi
on
71
Table III.50
Merchandise exports of selected economies to the Baltic States and the CIS, 1997-99
(Million dollars)
Origin European Union (15) Central and Eastern Europe Turkey
Destination 1997 1998 1999 1997 1998 1999 1997 1998 1999
Baltic States and the CIS 43635 38923 28347 9350 7660 5090 3628 2719 1579
Baltic States 6830 7565 6300 830 1038 1061 65 53 45
Estonia 2679 2965 2507 100 127 163 6 6 9
Latvia 1728 1989 1682 189 288 286 3 12 10
Lithuania 2423 2611 2111 540 622 612 56 35 26
Commonwealth of Independent States 36805 31358 22047 8520 6622 4029 3563 2666 1534
Armenia 172 175 180 40 34 29 0 0 0
Azerbaijan 286 360 229 76 79 52 320 327 248
Belarus 1387 1277 1024 486 397 336 9 8 5
Georgia 253 303 187 188 168 128 174 164 114
Kazakhstan 867 1374 973 144 210 146 211 214 97
Kyrgyzstan 81 93 75 8 12 10 49 41 23
Moldova, Rep. of 327 320 267 317 293 226 21 28 21
Russian Fed. 28545 22795 15658 4871 3434 1764 2106 1348 589
Tajikistan 35 46 25 27 16 8 7 10 5
Turkmenistan 160 177 222 11 13 18 118 96 107
Ukraine 3833 3783 2672 2192 1889 1230 337 274 226
Uzbekistan 859 655 535 160 79 83 211 156 99
Origin United States Japan China
Destination 1997 1998 1999 1997 1998 1999 1997 1998 1999
Baltic States and the CIS 5028 4962 3290 1247 1260 787 2437 2444 2279
Baltic States 354 336 446 25 38 32 28 45 48
Estonia 48 87 162 13 21 13 8 7 7
Latvia 219 187 218 6 10 11 6 14 14
Lithuania 87 62 66 6 7 8 14 24 27
Commonwealth of Independent States 4674 4626 2844 1222 1222 755 2409 2399 2231
Armenia 62 51 50 0 2 1 0 1 12
Azerbaijan 62 123 55 20 19 36 1 1 1
Belarus 41 30 26 20 11 4 17 6 5
Georgia 141 137 83 2 3 7 1 6 2
Kazakhstan 256 103 179 31 53 61 95 205 494
Kyrgyzstan 28 21 21 2 1 6 71 172 103
Moldova, Rep. of 20 21 11 0 1 3 0 0 0
Russian Fed. 3289 3585 1845 1014 978 480 2038 1840 1497
Tajikistan 19 12 13 2 5 3 11 11 2
Turkmenistan 118 28 18 4 8 14 12 10 7
Ukraine 404 368 204 71 74 54 101 90 81
Uzbekistan 234 147 339 56 67 86 62 57 27

Trad
e by
regi
on
72
Table III.51
Merchandise imports of selected economies from the Baltic States and the CIS, 1997-99
(Million dollars)
Destination European Union (15) Central and Eastern Europe Turkey
Origin 1997 1998 1999 1997 1998 1999 1997 1998 1999
Baltic States and the CIS 39479 33138 37375 13415 11435 11075 3695 3818 3802
Baltic States 5333 5509 6136 194 233 342 72 93 68
Estonia 1872 2048 2340 31 30 67 31 10 5
Latvia 1921 1791 1908 31 42 44 2 3 2
Lithuania 1540 1670 1888 132 161 230 39 80 61
Commonwealth of Independent States 34146 27629 31239 13221 11202 10733 3623 3725 3734
Armenia 75 72 94 1 1 2 0 0 0
Azerbaijan 81 60 375 9 5 6 58 50 44
Belarus 507 534 604 352 300 293 39 21 21
Georgia 58 69 115 20 5 6 66 91 93
Kazakhstan 970 1058 1546 91 88 204 165 254 296
Kyrgyzstan 49 212 135 16 15 22 8 7 3
Moldova, Rep. of 120 134 164 77 76 59 15 12 11
Russian Fed. 29332 22406 24953 10846 9054 8799 2182 2155 2374
Tajikistan 106 95 89 23 20 17 3 8 4
Turkmenistan 71 139 202 11 26 22 74 42 67
Ukraine 2140 2319 2475 1553 1423 1187 918 989 774
Uzbekistan 637 531 487 220 191 117 95 96 47
Destination United States Japan China
Origin 1997 1998 1999 1997 1998 1999 1997 1998 1999
Baltic States and the CIS 5648 7464 7771 4428 3174 4046 5094 4355 5293
Baltic States 339 352 606 38 31 28 7 16 11
Estonia 86 138 259 9 8 9 3 8 3
Latvia 163 126 242 12 8 5 1 8 7
Lithuania 90 88 105 17 15 14 3 0 1
Commonwealth of Independent States 5309 7112 7165 4390 3143 4018 5087 4339 5282
Armenia 6 17 16 0 6 1 0 0 0
Azerbaijan 6 5 28 2 0 0 14 0 0
Belarus 70 113 100 14 10 6 26 11 21
Georgia 7 15 19 1 1 1 3 2 1
Kazakhstan 119 178 240 194 120 86 433 431 644
Kyrgyzstan 2 0 1 1 1 1 36 26 32
Moldova, Rep. of 55 120 98 0 0 0 1 1 0
Russian Fed. 4523 6008 6017 3997 2892 3766 4086 3641 4223
Tajikistan 9 33 24 1 0 0 9 8 6
Turkmenistan 2 3 9 3 0 0 4 2 2
Ukraine 470 585 586 141 73 123 334 185 340
Uzbekistan 40 35 27 36 40 34 141 32 13

Trad
e by
regi
on
73
Table III.52
Merchandise trade of Africa, 1999
(Billion dollars and percentage)
Exports Imports
Value 112 133
Share in world merchandise trade 2.0 2.3
Annual percentage change
Africa
1980-85 -8 -6 1985-90 5 6 1990-99 1 4 1997 2 6 1998 -16 1 1999 9 0
South Africa
1980-85 -9 -10 1985-90 8 10 1990-99 2 4 1997 6 10 1998 -9 -9 1999 1 -9
Other Africa
1980-85 -7 -6 1985-90 4 6 1990-99 1 7 1997 0 1 1998 -4 1 1999 2 1
Table III.53
Merchandise trade of Africa by regionand by major product group, 1999(Billion dollars and percentage)
Value Share
Exports Exports Imports
Total a 112 100.0 100.0
Region
North America 17 14.9 9.5
Latin America 3 3.0 2.4
Western Europe 57 51.0 50.9
C./E. Europe/Baltic States/CIS 1 1.2 2.3
Africa 11 9.9 9.6
Middle East 2 1.5 6.9
Asia 15 13.8 18.4
Product group
Agricultural products 22 19.8 16.6
Mining products 53 47.2 10.1
Manufactures 34 30.3 70.2
a Includes significant exports of unspecified products.
Note: Import shares are derived from the Secretariat’s network of world
merchandise trade by product and region.
0
20
40
60
80
100
120
140
160
9998979695949392919089
Exports
Imports
Chart III.12
Merchandise trade of Africa,1989-99(Billion dollars)
0
1
2
3
4
5
9998979695949392919089
Exports
Imports
Chart III.13
Share of Africa in world merchandise trade, 1989-99(Percentage based on value data)
6. Africa

Trad
e by
regi
on
74
Table III.54
Merchandise exports of Africa by major product group and main destination, 1999
(Billion dollars and percentage)
Value Share Annual percentage change
1999 1990 1999 1990-99 1997 1998 1999
Mining products
World 53.0 100.0 100.0 0 1 -27 17
Western Europe 24.0 61.5 45.3 -4 -3 -24 6
North America 12.3 24.7 23.1 -1 6 -27 4
Asia 8.1 5.9 15.3 11 22 -37 40
Manufactures
World 34.0 100.0 100.0 6 2 -2 9
Western Europe 19.6 62.1 57.5 5 3 3 5
Africa 5.5 11.6 16.2 10 4 -13 15
North America 3.3 5.9 9.7 12 9 9 11
Agricultural products
World 22.2 100.0 100.0 3 -1 -2 -6
Western Europe 12.0 61.1 54.2 2 -3 3 -13
Asia 3.6 15.1 16.3 4 -2 -13 1
Africa 2.6 11.8 11.9 4 2 -8 6
Total merchandise a
World 112.1 100.0 100.0 1 2 -16 9
Western Europe 57.2 58.4 51.0 -1 -1 -11 1
North America 16.7 15.4 14.9 1 6 -20 4
Asia 15.4 7.8 13.8 8 16 -33 20
a Includes significant exports of unspecified products.
Table III.55
Merchandise exports of Africa by destination, 1999
(Billion dollars and percentage)
Value Share Annual percentage change
1999 1990 1999 1990-99 1997 1998 1999
Western Europe 57.2 58.4 51.0 -1 -1 -11 1
European Union (15) 54.5 53.0 48.6 0 -1 -10 1
North America 16.7 15.4 14.9 1 6 -20 4
Asia 15.4 7.8 13.8 8 16 -33 20
Japan 3.3 3.0 3.0 1 -5 -19 4
Other 12.1 4.8 10.8 10 22 -37 25
Intra-Africa 11.1 6.0 9.9 7 -2 -14 21
Latin America 3.4 1.5 3.0 9 11 -12 19
Middle East 1.7 1.5 1.5 1 -6 -11 5
C./E. Europe/Baltic States/CIS 1.4 2.3 1.2 -6 -19 -12 -3
Inter-regional trade 95.8 87.0 85.4 1 3 -16 5
World 112.1 100.0 100.0 1 2 -16 9

Trad
e by
regi
on
75
Table III.56
Leading merchandise exporters and importers in Africa, 1999
(Billion dollars and percentage)
Value Share Annual percentage change
1999 1980 1990 1995 1999 1990-99 1997 1998 1999
Exporters
South Africa a 26.7 21.1 22.6 26.0 23.8 2 6 -9 1
Algeria 11.9 11.5 12.4 9.5 10.6 -1 10 -26 17
Nigeria 11.3 21.5 13.1 10.9 10.1 -2 -6 -36 16
Libyan Arab Jamahiriya 9.1 18.1 13.3 8.4 8.1 -5 -2 -31 37
Morocco 7.4 2.1 4.1 4.4 6.6 6 2 2 3
Tunisia 5.9 1.8 3.4 5.1 5.3 6 1 3 3
Côte d'Ivoire 4.1 2.6 3.0 3.4 3.6 3 -2 -2 0
Angola 4.0 1.6 3.8 3.6 3.5 0 -7 -32 37
Egypt 3.6 2.5 2.5 3.2 3.2 4 11 -19 11
Gabon 2.6 1.8 2.1 2.5 2.3 2 -6 -32 24
Botswana 2.5 0.4 1.7 2.0 2.2 4 12 -31 28
Zimbabwe 2.1 1.2 1.7 2.0 1.9 2 6 -17 0
Kenya 1.9 1.0 1.0 1.8 1.7 7 -1 -2 -8
Ghana b 1.8 1.0 0.9 1.6 … 8 -2 10 …
Congo b 1.3 0.8 0.9 1.1 … 6 7 -25 …
Africa 112.1 100.0 100.0 100.0 100.0 1 2 -16 9
Importers
South Africa a 26.7 20.2 19.4 24.3 20.1 4 10 -9 -9
Egypt 16.0 5.0 9.7 9.4 12.1 6 1 22 -1
Morocco 10.6 4.3 7.2 6.8 8.0 5 -2 8 3
Nigeria 10.4 17.2 5.9 7.4 7.8 7 29 -3 4
Algeria 9.8 10.9 10.2 8.6 7.4 0 -5 8 4
Tunisia 8.5 3.7 5.8 6.3 6.4 5 3 5 2
Libyan Arab Jamahiriya 5.9 7.0 5.6 4.3 4.4 1 4 -11 7
Ghana b 2.6 1.2 1.3 1.5 … 13 10 10 …
Côte d'Ivoire 3.3 3.1 2.2 2.3 2.5 5 -4 15 2
Kenya 2.9 2.2 2.2 2.4 2.2 3 11 -3 -11
Zimbabwe 2.8 1.5 1.9 2.1 2.1 5 10 -10 2
Angola 2.3 1.4 1.7 1.4 1.8 4 14 -9 10
Botswana 2.3 0.7 2.1 1.5 1.7 2 31 6 -4
Mauritius 2.1 0.6 1.7 1.6 1.6 3 -4 -5 3
Tanzania, United Rep. of 1.8 1.3 1.1 1.3 1.3 6 -2 11 18
Africa 132.5 100.0 100.0 100.0 100.0 4 6 1 0
a Beginning with 1998, figures refer to South Africa only and no longer to the South African Customs Union.
b 1998 instead of 1999.
Note: Recent figures for a number of traders in the region have been estimated by the Secretariat.

Trad
e by
regi
on
76
Table III.57
Merchandise imports of the European Union from developing countries in Africa by product, 1999
(Billion dollars and percentage)
Value Share Annual percentage change
1999 1990 1999 1990-99 1997 1998 1999
Mining products 20.9 62.3 42.3 -5 -10 -26 11
Fuels 18.9 55.5 38.3 -5 -11 -28 12
Ores and other minerals 1.3 3.1 2.7 -2 -2 -1 8
Non-ferrous metals 0.6 3.7 1.3 -12 6 -5 -7
Manufactures 15.0 16.9 30.4 6 -2 5 4
Clothing 6.7 6.3 13.6 8 -2 10 3
Semi-manufactures 2.9 3.8 5.9 4 -15 -16 15
Agricultural products 11.1 17.8 22.5 2 -7 4 -4
Food 8.6 13.0 17.3 3 -9 4 -5
Raw materials 2.5 4.8 5.1 0 2 4 -2
Total merchandise imports 49.3 100.0 100.0 -1 -7 -11 5
Note: The European Union accounted for 58 per cent of developing Africa’s merchandise exports in 1999. Developing Africa is defined as Africa less South Africa.
Table III.58
Merchandise exports of the European Union to developing countries in Africa by product, 1999
(Billion dollars and percentage)
Value Share Annual percentage change
1999 1990 1999 1990-99 1997 1998 1999
Manufactures 35.6 79.0 77.8 0 -1 5 -5
Machinery and transport equipment 18.2 41.4 39.7 0 0 6 -3
Power generating machinery 1.1 1.7 2.3 4 11 30 -1
Other non-electrical machinery 6.8 15.5 14.8 0 1 4 -7
Office and telecom equipment 2.8 4.6 6.2 4 0 26 5
Electrical machinery and apparatus 2.4 4.2 5.3 3 11 10 -4
Automotive products 3.4 9.8 7.5 -2 1 2 -3
Other transport equipment 1.6 5.6 3.5 -5 -21 -18 3
Chemicals 5.5 11.6 12.0 1 3 5 -6
Other semi-manufactures 3.6 8.9 7.8 -1 -7 1 -7
Textiles 3.2 5.1 7.0 4 -1 12 -5
Iron and steel 1.2 4.5 2.7 -5 -7 1 -23
Agricultural products 7.0 15.6 15.2 0 3 8 -9
Food 6.0 13.7 13.0 0 3 10 -10
Mining products 1.8 4.0 3.9 0 1 -5 -4
Fuels 1.2 2.6 2.6 1 1 -12 -3
Total merchandise exports 45.7 100.0 100.0 1 1 6 -5
Note: The European Union accounted for 49 per cent of developing Africa’s merchandise imports in 1999. Developing Africa is defined as Africa less South Africa.

Trad
e by
regi
on
77
7. Middle East
Table III.59
Merchandise trade of the Middle East, 1999
(Billion dollars and percentage)
Exports Imports
Value 170 150
Share in world merchandise trade 3.1 2.6
Annual percentage change
1980-85 -14 -3
1985-90 6 2
1990-99 3 5
1997 5 8
1998 -23 -3
1999 24 3
Table III.60
Merchandise trade of the Middle East by regionand by major product group, 1999(Billion dollars and percentage)
Value Share
Exports Exports Imports
Total 170 100.0 100.0
Region
North America 25 14.8 16.0 Latin America 2 1.3 2.0 Western Europe 34 20.2 41.3 C./E. Europe/Baltic States/CIS 1 0.7 2.9 Africa 8 4.7 1.2 Middle East 14 8.3 10.1 Asia 73 42.9 26.5
Product group
Agricultural products 6 3.7 13.9 Mining products 118 69.3 6.6 Manufactures 43 25.5 75.4
Note: Import shares are derived from the Secretariat’s network of world
merchandise trade by product and region.
0
20
40
60
80
100
120
140
160
180
200
9998979695949392919089
Exports
Imports
Chart III.14
Merchandise trade of the Middle East,1989-99(Billion dollars)
0
1
2
3
4
5
9998979695949392919089
Exports
Imports
Chart III.15
Share of the Middle East in world merchandise trade, 1989-99(Percentage based on value data)

Trad
e by
regi
on
78
Table III.61
Merchandise exports of the Middle East by major product group and main destination, 1999
(Billion dollars and percentage)
Value Share Annual percentage change
1999 1990 1999 1990-99 1997 1998 1999
Mining products
World 118.0 100.0 100.0 1 3 -30 30
Asia 64.3 45.3 54.5 3 8 -33 24
Western Europe 19.8 25.0 16.8 -3 -3 -22 17
North America 13.7 14.1 11.6 -1 11 -23 50
Manufactures
World 43.4 100.0 100.0 9 8 0 11
Western Europe 12.4 32.5 28.6 8 15 7 2
North America 10.3 16.4 23.8 14 13 16 11
Asia 7.3 19.6 16.8 7 0 -24 19
Middle East 6.5 18.3 15.0 7 11 2 10
Agriculture
World 6.3 100.0 100.0 4 2 -13 3
Total merchandise
World 170.1 100.0 100.0 3 5 -23 24
Asia 72.9 39.8 42.9 4 8 -32 23
Western Europe 34.4 26.9 20.2 -1 1 -12 10
North America 25.2 14.0 14.8 3 14 -7 31
Middle East 14.0 6.3 8.3 6 6 -12 20
Table III.62
Merchandise exports of the Middle East by destination, 1999
(Billion dollars and percentage)
Value Share Annual percentage change
1999 1990 1999 1990-99 1997 1998 1999
Asia 72.9 39.9 42.9 4 8 -32 23
Japan 27.3 20.9 16.0 0 9 -33 19
Other 45.7 19.0 26.8 7 7 -31 26
Western Europe 34.4 27.0 20.2 -1 1 -12 10
European Union (15) 30.7 24.0 18.0 -1 3 -11 8
North America 25.2 14.1 14.8 3 14 -7 31
Intra-Middle East 14.0 6.4 8.3 6 6 -12 20
Africa 8.0 3.1 4.7 8 10 -7 31
Latin America 2.2 3.7 1.3 -9 4 -26 -5
C./E. Europe/Baltic States/CIS 1.1 2.6 0.7 -12 -12 -17 -8
Inter-regional trade 143.9 90.4 84.6 2 7 -23 21
World 170.1 100.0 100.0 3 5 -23 24

Trad
e by
regi
on
79
Table III.63
Fuel imports of selected regions and economies from the Middle East, 1990 and 1999
(Billion dollars and percentage)
Value Annual percentage change
1990 1999 1990-99 1997 1998 1999
North America 16.7 14.9 -1 11 -24 51
United States 16.0 14.4 -1 9 -21 52
Canada a 0.7 0.4 -6 39 -58 8
Western Europe 28.5 19.5 -4 -6 -23 14
European Union (15) 25.5 18.3 -4 -3 -20 16
France 5.6 4.2 -3 -2 -20 13
Italy 4.5 3.6 -2 7 -30 18
Netherlands 4.6 3.5 -3 -1 -29 21
Germany 2.8 1.6 -6 -7 -24 35
Turkey 2.5 1.4 -6 -24 -42 17
Asia 52.9 64.4 2 8 -31 12
Japan 29.4 28.7 0 10 -34 20
Korea, Rep. of 4.8 13.2 12 14 -34 28
Singapore 6.3 7.1 1 0 -37 20
India b 2.7 4.8 6 -8 33 …
Thailand 1.1 3.6 14 16 -30 29
Taipei, Chinese 2.8 3.1 1 2 -32 42
a Imports are valued f.o.b.
b 1998 instead of 1999.
Table III.64
Leading merchandise exporters and importers in the Middle East, 1999
(Billion dollars and percentage)
Value Share Annual percentage change
1999 1980 1990 1995 1999 1990-99 1997 1998 1999
Exporters
Saudi Arabia 50.5 50.9 33.1 34.4 29.7 1 0 -35 27 United Arab Emirates 29.5 10.2 15.5 15.3 17.3 4 13 -13 15 Israel 25.8 2.6 9.0 13.1 15.2 9 9 2 12 Iran, Islamic Rep. of 16.2 6.6 12.6 11.5 9.5 0 -5 -31 27 Kuwait 12.2 9.2 5.3 9.5 7.2 6 -4 -33 27
Iraq 9.7 12.3 9.2 0.3 5.7 -3 529 20 76 Oman 7.2 1.7 4.1 4.2 4.3 3 4 -28 31 Qatar 5.7 2.6 2.9 2.5 3.4 4 25 -14 19 Bahrain 4.1 1.7 2.8 2.8 2.4 1 -7 -25 25 Syrian Arab Republic 3.5 1.0 3.1 2.4 2.0 -2 -2 -26 20
Middle East 170.1 100.0 100.0 100.0 100.0 3 5 -23 24
Importers
Israel 33.2 9.5 16.9 22.7 22.2 8 -3 -5 13 United Arab Emirates 28.9 8.5 11.3 16.1 19.3 11 32 -9 6 Saudi Arabia 28.0 29.3 24.3 21.5 18.7 2 4 4 -7 Iran, Islamic Rep. of 13.2 11.9 15.8 8.6 8.8 -2 7 -11 6 Kuwait 7.6 6.4 4.0 6.0 5.1 8 -2 5 -12
Iraq 6.8 13.6 7.7 0.6 4.5 -1 348 8 48 Lebanon 6.2 3.6 2.5 5.6 4.1 10 -1 -5 -12 Oman 4.7 1.7 2.7 3.3 3.1 6 10 13 -18 Qatar 4.2 1.4 1.7 2.4 2.8 11 50 -14 11 Syrian Arab Republic 3.8 4.0 2.4 3.6 2.6 5 -25 -3 -2
Middle East 149.7 100.0 100.0 100.0 100.0 5 8 -3 3
Note: Recent figures for a number of significant traders in the region have been estimated by the Secretariat.

Trad
e by
regi
on
80
Table III.65
Merchandise trade of Asia, 1999
(Billion dollars and percentage)
Exports Imports
Value 1394 1200
Share in world merchandise trade 25.5 20.9
Annual percentage change
Value
1980-85 5 2
1985-90 13 14
1990-99 7 6
1997 5 0
1998 -6 -18
1999 8 10
Volume
1980-85 7.5 5.5
1985-90 8.0 12.0
1990-99 7.5 7.0
1997 13.0 5.5
1998 3.5 -8.5
1999 7.5 11.5
Table III.66
Merchandise trade of Asia by regionand by major product group, 1999(Billion dollars and percentage)
Value Share
Exports Exports Imports
Total 1394 100.0 100.0
Region
North America 367 26.3 17.2
Latin America 35 2.5 1.6
Western Europe 252 18.1 15.4
C./E. Europe/Baltic States/CIS 13 0.9 1.4
Africa 21 1.5 1.3
Middle East 37 2.6 6.4
Asia 650 46.6 56.7
Product group
Agricultural products 99 7.1 10.6
Mining products 87 6.3 14.5
Manufactures 1177 84.5 72.5
Note: Import shares are derived from the Secretariat’s network of world
merchandise trade by product and region.
0
200
400
600
800
1000
1200
1400
1600
9998979695949392919089
ExportsImports
Chart III.16
Merchandise trade of Asia,1989-99(Billion dollars)
10
15
20
25
30
9998979695949392919089
Exports
Imports
Chart III.17
Share of Asia in world merchandise trade, 1989-99(Percentage based on value data)
8. Asia

Trad
e by
regi
on
81
Table III.67
Merchandise exports of Asia by main product group and main destination, 1999
(Billion dollars and percentage)
Share in total Share in product Annual percentageValue merchandise group change
1999 1990 1999 1990 1999 1990-99 1998 1999
Total merchandise
World 1393.6 100.0 100.0 - - 7 -6 8
Intra-Asia 649.6 42.1 46.6 - - 9 -17 12
Japan 125.9 10.4 9.0 - - 6 -15 13
Other 523.7 31.7 37.6 - - 9 -17 12
North America 366.6 28.3 26.3 - - 6 3 8
Western Europe 251.6 20.0 18.1 - - 6 8 1
All other regions 105.5 8.1 7.6 - - 6 4 -7
Manufactures
World 1177.2 79.1 84.5 100.0 100.0 8 -5 9
Intra-Asia 504.2 28.5 36.2 36.0 42.8 10 -16 14
Japan 83.0 4.3 6.0 5.5 7.0 11 -12 19
Other 421.2 24.1 30.2 30.5 35.8 10 -17 14
North America 343.6 26.1 24.7 33.0 29.2 7 3 9
Western Europe 224.1 17.4 16.1 22.0 19.0 6 6 4
All other regions 88.0 6.2 6.3 7.8 7.5 8 5 -8
Agricultural products
World 98.5 9.7 7.1 100.0 100.0 4 -11 0
Intra-Asia 60.1 5.5 4.3 56.8 61.0 4 -16 1
Japan 19.9 2.3 1.4 23.2 20.2 2 -15 5
Other 40.2 3.3 2.9 33.6 40.8 6 -16 0
Western Europe 15.1 1.7 1.1 17.2 15.3 2 -5 -5
North America 12.5 1.1 0.9 11.4 12.7 5 1 3
All other regions 10.7 1.4 0.8 14.3 10.8 0 -4 -4
Mining products
World 87.1 8.9 6.3 100.0 100.0 3 -15 8
Intra-Asia 71.1 7.1 5.1 79.7 81.6 3 -21 10
Japan 22.5 3.6 1.6 40.6 25.8 -2 -23 5
Other 48.7 3.5 3.5 39.1 55.8 7 -19 12
Western Europe 5.6 0.6 0.4 6.9 6.5 2 9 -9
North America 5.4 0.8 0.4 8.9 6.2 -1 5 0
All other regions 3.3 0.3 0.2 2.8 3.8 6 54 8

Trad
e by
regi
on
82
Table III.68
Merchandise exports of Asia by product, 1999
(Billion dollars and percentage)
Share in exports Share in Value of Asia world exports Annual percentage change
1999 1990 1999 1990 1999 1990-99 1997 1998 1999
Agricultural products 98.5 9.7 7.1 17.4 18.1 4 -1 -11 0
Food 76.9 6.8 5.5 16.0 17.6 5 1 -8 0
Raw materials 21.7 2.9 1.6 21.7 20.2 0 -6 -20 0
Mining products 87.1 8.9 6.3 13.6 15.7 3 6 -15 8
Ores and other minerals 12.2 1.5 0.9 20.6 21.7 1 2 -7 -7
Fuels 57.0 6.2 4.1 12.8 14.2 3 5 -20 13
Non-ferrous metals 17.9 1.3 1.3 12.9 18.1 7 14 -6 4
Manufactures 1177.2 79.1 84.5 24.5 28.1 8 6 -5 9
Iron and steel 29.6 2.8 2.1 19.5 23.5 4 10 -2 -11
Chemicals 84.7 4.6 6.1 11.4 16.1 11 8 -6 11
Other semi-manufactures 81.1 6.2 5.8 17.4 19.6 7 4 -9 8
Machinery and transport equipment 697.0 43.2 50.0 26.3 30.4 9 5 -5 11
Automotive products 104.6 9.7 7.5 22.4 19.0 4 7 -4 9
Office and telecom equipment 363.8 18.6 26.1 45.9 47.3 11 7 -5 14
Other machinery and transport equipment 228.6 15.0 16.4 18.6 23.4 8 1 -6 8
Textiles 61.8 5.0 4.4 35.3 41.8 6 4 -10 2
Clothing 79.1 6.4 5.7 43.6 42.5 6 12 -1 3
Other consumer goods 143.8 11.0 10.3 27.1 29.2 7 7 -4 9
Total merchandise exports 1393.6 100.0 100.0 21.8 25.5 7 5 -6 8
Table III.69
Merchandise exports of Asia by destination, 1999
(Billion dollars and percentage)
Value Share Annual percentage change
1999 1990 1999 1990-99 1997 1998 1999
Intra-Asia 649.6 42.1 46.6 9 2 -17 12
Japan 125.9 10.4 9.0 6 -3 -15 13 Australia and New Zealand 38.1 2.7 2.7 7 6 -2 9 China 84.6 3.3 6.1 15 5 -8 9 Other 401.0 25.7 28.8 9 2 -20 13
North America 366.6 28.3 26.3 6 9 3 8
Western Europe 251.6 20.0 18.1 6 9 8 1 European Union (15) 235.9 18.6 16.9 6 7 7 4
Middle East 36.9 2.9 2.6 6 6 9 -7
Latin America 34.6 1.8 2.5 11 22 4 -8
Africa 21.3 1.5 1.5 8 6 5 0 South Africa 5.9 0.2 0.4 14 -1 -2 -9 Other Africa 15.4 1.2 1.1 6 9 8 3
C./E. Europe/Baltic States/CIS 12.8 1.9 0.9 -1 11 -9 -13 C./E. Europe 6.5 0.4 0.5 10 17 0 0 Baltic States/CIS 6.2 1.5 0.4 -6 7 -16 -23
Inter-regional trade 723.8 56.4 51.9 6 9 5 3
World 1393.6 100.0 100.0 7 5 -6 8
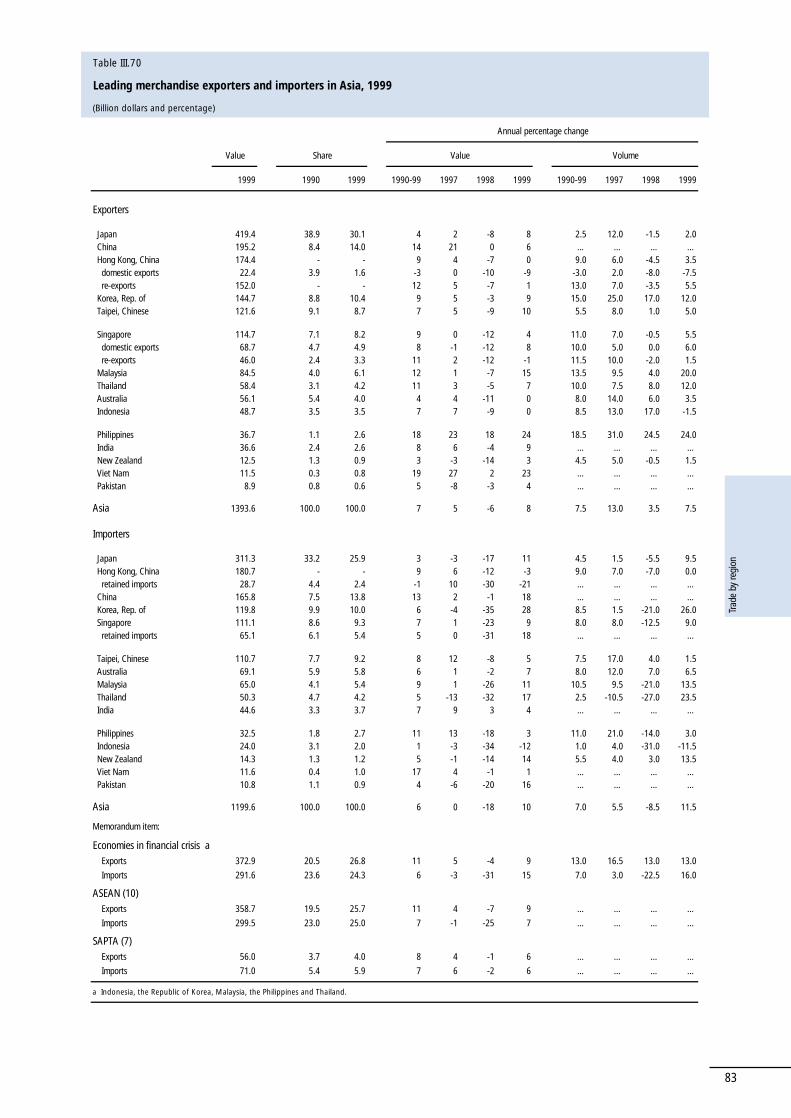
Trad
e by
regi
on
83
Table III.70
Leading merchandise exporters and importers in Asia, 1999
(Billion dollars and percentage)
Annual percentage change
Value Share Value Volume
1999 1990 1999 1990-99 1997 1998 1999 1990-99 1997 1998 1999
Exporters
Japan 419.4 38.9 30.1 4 2 -8 8 2.5 12.0 -1.5 2.0 China 195.2 8.4 14.0 14 21 0 6 … … … … Hong Kong, China 174.4 - - 9 4 -7 0 9.0 6.0 -4.5 3.5 domestic exports 22.4 3.9 1.6 -3 0 -10 -9 -3.0 2.0 -8.0 -7.5 re-exports 152.0 - - 12 5 -7 1 13.0 7.0 -3.5 5.5 Korea, Rep. of 144.7 8.8 10.4 9 5 -3 9 15.0 25.0 17.0 12.0 Taipei, Chinese 121.6 9.1 8.7 7 5 -9 10 5.5 8.0 1.0 5.0
Singapore 114.7 7.1 8.2 9 0 -12 4 11.0 7.0 -0.5 5.5 domestic exports 68.7 4.7 4.9 8 -1 -12 8 10.0 5.0 0.0 6.0 re-exports 46.0 2.4 3.3 11 2 -12 -1 11.5 10.0 -2.0 1.5 Malaysia 84.5 4.0 6.1 12 1 -7 15 13.5 9.5 4.0 20.0 Thailand 58.4 3.1 4.2 11 3 -5 7 10.0 7.5 8.0 12.0 Australia 56.1 5.4 4.0 4 4 -11 0 8.0 14.0 6.0 3.5 Indonesia 48.7 3.5 3.5 7 7 -9 0 8.5 13.0 17.0 -1.5
Philippines 36.7 1.1 2.6 18 23 18 24 18.5 31.0 24.5 24.0 India 36.6 2.4 2.6 8 6 -4 9 … … … … New Zealand 12.5 1.3 0.9 3 -3 -14 3 4.5 5.0 -0.5 1.5 Viet Nam 11.5 0.3 0.8 19 27 2 23 … … … … Pakistan 8.9 0.8 0.6 5 -8 -3 4 … … … …
Asia 1393.6 100.0 100.0 7 5 -6 8 7.5 13.0 3.5 7.5
Importers
Japan 311.3 33.2 25.9 3 -3 -17 11 4.5 1.5 -5.5 9.5 Hong Kong, China 180.7 - - 9 6 -12 -3 9.0 7.0 -7.0 0.0 retained imports 28.7 4.4 2.4 -1 10 -30 -21 … … … … China 165.8 7.5 13.8 13 2 -1 18 … … … … Korea, Rep. of 119.8 9.9 10.0 6 -4 -35 28 8.5 1.5 -21.0 26.0 Singapore 111.1 8.6 9.3 7 1 -23 9 8.0 8.0 -12.5 9.0 retained imports 65.1 6.1 5.4 5 0 -31 18 … … … …
Taipei, Chinese 110.7 7.7 9.2 8 12 -8 5 7.5 17.0 4.0 1.5 Australia 69.1 5.9 5.8 6 1 -2 7 8.0 12.0 7.0 6.5 Malaysia 65.0 4.1 5.4 9 1 -26 11 10.5 9.5 -21.0 13.5 Thailand 50.3 4.7 4.2 5 -13 -32 17 2.5 -10.5 -27.0 23.5 India 44.6 3.3 3.7 7 9 3 4 … … … …
Philippines 32.5 1.8 2.7 11 13 -18 3 11.0 21.0 -14.0 3.0 Indonesia 24.0 3.1 2.0 1 -3 -34 -12 1.0 4.0 -31.0 -11.5 New Zealand 14.3 1.3 1.2 5 -1 -14 14 5.5 4.0 3.0 13.5 Viet Nam 11.6 0.4 1.0 17 4 -1 1 … … … … Pakistan 10.8 1.1 0.9 4 -6 -20 16 … … … …
Asia 1199.6 100.0 100.0 6 0 -18 10 7.0 5.5 -8.5 11.5
Memorandum item:
Economies in financial crisis a Exports 372.9 20.5 26.8 11 5 -4 9 13.0 16.5 13.0 13.0
Imports 291.6 23.6 24.3 6 -3 -31 15 7.0 3.0 -22.5 16.0
ASEAN (10) Exports 358.7 19.5 25.7 11 4 -7 9 … … … …
Imports 299.5 23.0 25.0 7 -1 -25 7 … … … …
SAPTA (7) Exports 56.0 3.7 4.0 8 4 -1 6 … … … …
Imports 71.0 5.4 5.9 7 6 -2 6 … … … …
a Indonesia, the Republic of Korea, Malaysia, the Philippines and Thailand.

Trad
e by
regi
on
84
Table III.71
Merchandise trade of Japan by region and by economy, 1999
(Billion dollars and percentage)
Exports Imports
Destination Annual Origin Annualpercentage percentage
Value Share change Value Share change
1999 1990 1999 1998 1999 1999 1990 1999 1998 1999
Region Region
World 417.14 100.0 100.0 -8 7 World 309.92 100.0 100.0 -17 10
Asia 165.81 34.2 39.7 -23 15 Asia 138.29 35.1 44.6 -16 15
North America 136.60 34.1 32.7 1 8 North America 75.53 26.1 24.4 -12 0
Western Europe 79.43 22.2 19.0 8 3 Western Europe 47.81 18.2 15.4 -13 10
Latin America 11.48 2.5 2.8 3 -18 Middle East 30.32 13.3 9.8 -33 19
Middle East 10.15 3.2 2.4 20 -20 Latin America 9.30 4.0 3.0 -20 4
Africa 4.52 1.5 1.1 -2 -6 C./E. Europe/ C./E. Europe/ Baltic States/CIS 4.63 1.7 1.5 -25 23
Baltic States/CIS 2.02 1.1 0.5 -1 -16 Africa 4.05 1.6 1.3 -20 4
Economy Economy
United States 129.65 31.7 31.1 1 8 United States 67.51 22.5 21.8 -11 0
European Union (15) 74.50 20.4 17.9 9 4 China 42.84 5.1 13.8 -11 16
Taipei, Chinese 28.74 5.4 6.9 -7 12 European Union (15) 42.77 16.0 13.8 -13 9
China 23.31 2.1 5.6 -8 16 Korea, Rep. of 16.03 5.0 5.2 -17 33
Korea, Rep. Of 22.87 6.1 5.5 -41 49 Australia 12.80 5.3 4.1 -11 -2
Above 5 279.07 65.7 66.9 -3 10 Above 5 181.96 53.9 58.7 -12 8
Hong Kong, China 22.00 4.6 5.3 -17 -3 Taipei, Chinese 12.79 3.6 4.1 -18 25
Singapore 16.27 3.7 3.9 -27 10 Indonesia 12.58 5.4 4.1 -26 16
Thailand 11.27 3.2 2.7 -36 20 Malaysia 10.91 2.3 3.5 -24 26
Malaysia 11.10 1.9 2.7 -36 19 Thailand 8.86 1.8 2.9 -15 8
Philippines 8.75 0.9 2.1 -16 20 United Arab Emirates 8.80 3.9 2.8 -32 6
Australia 8.44 2.4 2.0 1 5 Saudi Arabia 8.30 4.5 2.7 -40 16
Canada 6.92 2.3 1.7 4 9 Canada 7.91 3.6 2.6 -22 3
Panama 6.84 1.0 1.6 -7 11 Singapore 5.43 1.5 1.8 -20 15
Indonesia 4.84 1.8 1.2 -58 13 Philippines 5.30 0.9 1.7 -12 20
Mexico 4.39 0.8 1.1 9 4 Russian Fed. 3.77 - 1.2 -28 30
Saudi Arabia 3.31 1.2 0.8 29 -17 Qatar 3.45 0.9 1.1 -8 23
United Arab Emirates 2.52 0.5 0.6 13 -12 Switzerland 3.36 1.7 1.1 -12 12
India 2.42 0.6 0.6 9 0 Iran, Islamic Rep. of 3.13 1.5 1.0 -31 28
Switzerland 2.15 1.0 0.5 3 -2 Kuwait 3.01 0.7 1.0 -37 29
Brazil 2.04 0.4 0.5 -10 -22 Brazil 2.67 1.4 0.9 -22 -8
South Africa 1.64 0.5 0.4 -5 -9 Chile 2.52 0.7 0.8 -20 5
Viet Nam 1.62 0.1 0.4 4 22 South Africa 2.29 0.8 0.7 -16 -3
New Zealand 1.48 0.4 0.4 -17 27 India 2.25 0.9 0.7 -18 3
Norway 1.24 0.3 0.3 -7 -4 Viet Nam 1.96 0.3 0.6 -20 12
Israel 1.07 0.2 0.3 1 2 New Zealand 1.90 0.7 0.6 -17 -2
Egypt 0.94 0.2 0.2 18 -12 Hong Kong, China 1.79 0.9 0.6 -23 3
Turkey 0.91 0.3 0.2 -4 -46 Oman 1.69 0.8 0.5 -40 54
Argentina 0.71 0.1 0.2 27 -29 Mexico 1.65 0.8 0.5 -24 34
Kuwait 0.70 0.1 0.2 25 -41 Norway 1.32 0.3 0.4 -18 28
Russian Fed. 0.48 - 0.1 -4 -51 Brunei Darussalam 1.05 0.5 0.3 -27 2
Above 30 403.09 94.2 96.6 - - Above 30 300.65 94.3 97.0 - -

Trad
e by
regi
on
85
Table III.72
Merchandise exports of the United States, European Union and Japan to China by major product, 1999
(Billion dollars and percentage)
Share in economy’s
total merchandise tolal exports by Annual percentage
Value exports product group change
1999 1990 1999 1990 1999 1990-99 1997 1998 1999
United States
Total merchandise exports 13.1 100.0 100.0 1.2 1.9 12 7 11 -8
Agricultural products 1.3 24.4 9.7 2.0 1.9 1 -21 -17 -25
Food 0.8 11.2 5.8 1.3 1.5 4 -24 11 -31
Mining products 0.6 2.7 4.4 0.5 2.6 18 32 -23 26
Manufactures 11.1 71.9 84.3 1.2 1.9 14 14 19 -7
Chemicals 2.1 21.9 15.9 2.7 2.9 8 12 2 6
Other semi-manufactures 0.6 2.7 4.6 0.6 1.5 19 0 16 0
Machinery and transport equipment 7.1 40.4 54.5 1.1 1.9 16 17 26 -13 Other non electrical machinery 1.3 12.0 10.1 1.7 2.1 10 0 -18 -5 Office and telecom equipment 2.2 5.2 17.0 0.5 1.8 27 9 64 9 Other transport eqipment 2.4 16.1 18.1 2.1 3.9 13 23 68 -35 Other consumer goods 1.0 5.1 8.0 0.7 1.5 18 5 3 10
European Union (15)
Total merchandise exports 23.0 100.0 100.0 0.5 1.1 13 0 4 21
Agricultural products 1.4 8.4 6.2 0.4 0.6 10 17 35 67
Food 0.9 5.7 3.8 0.3 0.5 8 20 37 52
Mining products 0.8 1.0 3.5 0.1 0.8 30 -10 -18 157
Manufactures 19.0 88.4 82.5 0.5 1.1 12 -1 -3 15
Chemicals 2.0 10.9 8.8 0.5 0.7 11 -2 -9 42
Other semi-manufactures 1.5 4.8 6.5 0.2 0.7 17 27 -1 26
Machinery and transport equipment 13.5 63.6 58.5 0.8 1.5 12 -3 -3 9 Other non electrical machinery 3.2 33.4 23.5 53.0 2.6 9 -24 -15 14 Office and telecom equipment 3.2 4.7 13.9 0.4 1.5 28 10 41 -4
Other consumer goods 1.2 4.0 5.4 0.2 0.6 17 17 8 34
Japan
Total merchandise exports 23.3 100.0 100.0 2.1 5.6 16 -1 -8 16
Agricultural products 0.5 3.7 2.2 6.9 12.0 9 -7 -13 -4
Mining products 1.0 2.0 4.4 3.1 16.3 27 38 -27 20
Non-ferrous metals 0.6 0.8 2.5 2.1 14.2 33 -2 29 41
Manufactures 21.2 92.8 90.9 2.1 5.4 16 -2 -7 16
Iron and steel 1.5 17.3 6.6 8.5 11.4 4 4 -12 1
Chemicals 3.0 12.2 12.9 4.7 9.8 17 8 5 30
Other semi-manufactures 1.2 6.3 5.3 2.8 6.8 14 5 0 14
Machinery and transport equipment 11.6 43.8 49.8 1.3 4.1 18 -6 -7 12 Other non electrical machinery 3.7 14.4 15.9 2.5 7.4 17 -22 -24 13 Office and telecom equipment 3.6 16.7 15.5 1.5 4.0 15 8 4 25 Electrical machinery and apparatus 2.5 5.2 10.9 1.9 7.9 26 10 -2 22
Textiles 2.3 7.1 9.7 7.4 34.3 20 -1 -15 26
Other consumer goods 1.5 5.9 6.4 1.5 4.0 17 -2 -5 26
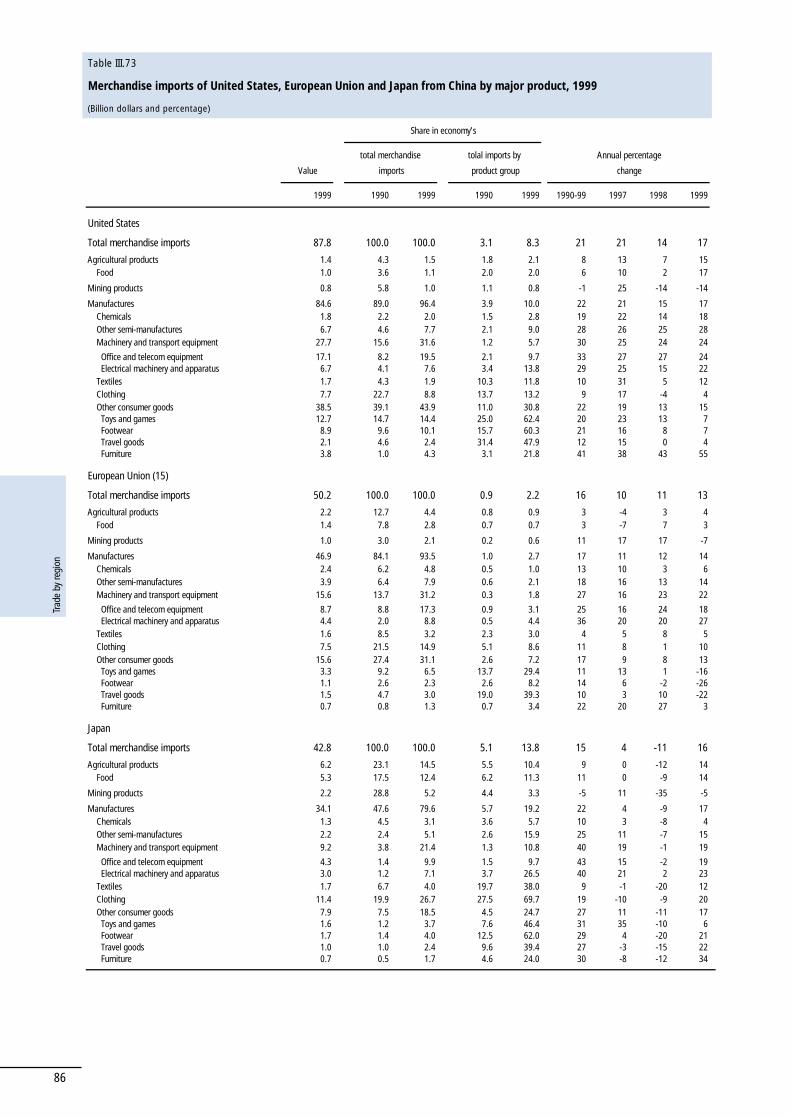
Trad
e by
regi
on
86
Table III.73
Merchandise imports of United States, European Union and Japan from China by major product, 1999
(Billion dollars and percentage)
Share in economy’s
total merchandise tolal imports by Annual percentage
Value imports product group change
1999 1990 1999 1990 1999 1990-99 1997 1998 1999
United States
Total merchandise imports 87.8 100.0 100.0 3.1 8.3 21 21 14 17
Agricultural products 1.4 4.3 1.5 1.8 2.1 8 13 7 15 Food 1.0 3.6 1.1 2.0 2.0 6 10 2 17
Mining products 0.8 5.8 1.0 1.1 0.8 -1 25 -14 -14
Manufactures 84.6 89.0 96.4 3.9 10.0 22 21 15 17 Chemicals 1.8 2.2 2.0 1.5 2.8 19 22 14 18 Other semi-manufactures 6.7 4.6 7.7 2.1 9.0 28 26 25 28 Machinery and transport equipment 27.7 15.6 31.6 1.2 5.7 30 25 24 24
Office and telecom equipment 17.1 8.2 19.5 2.1 9.7 33 27 27 24 Electrical machinery and apparatus 6.7 4.1 7.6 3.4 13.8 29 25 15 22 Textiles 1.7 4.3 1.9 10.3 11.8 10 31 5 12 Clothing 7.7 22.7 8.8 13.7 13.2 9 17 -4 4 Other consumer goods 38.5 39.1 43.9 11.0 30.8 22 19 13 15 Toys and games 12.7 14.7 14.4 25.0 62.4 20 23 13 7 Footwear 8.9 9.6 10.1 15.7 60.3 21 16 8 7 Travel goods 2.1 4.6 2.4 31.4 47.9 12 15 0 4 Furniture 3.8 1.0 4.3 3.1 21.8 41 38 43 55
European Union (15)
Total merchandise imports 50.2 100.0 100.0 0.9 2.2 16 10 11 13
Agricultural products 2.2 12.7 4.4 0.8 0.9 3 -4 3 4 Food 1.4 7.8 2.8 0.7 0.7 3 -7 7 3
Mining products 1.0 3.0 2.1 0.2 0.6 11 17 17 -7
Manufactures 46.9 84.1 93.5 1.0 2.7 17 11 12 14 Chemicals 2.4 6.2 4.8 0.5 1.0 13 10 3 6 Other semi-manufactures 3.9 6.4 7.9 0.6 2.1 18 16 13 14 Machinery and transport equipment 15.6 13.7 31.2 0.3 1.8 27 16 23 22
Office and telecom equipment 8.7 8.8 17.3 0.9 3.1 25 16 24 18 Electrical machinery and apparatus 4.4 2.0 8.8 0.5 4.4 36 20 20 27 Textiles 1.6 8.5 3.2 2.3 3.0 4 5 8 5 Clothing 7.5 21.5 14.9 5.1 8.6 11 8 1 10 Other consumer goods 15.6 27.4 31.1 2.6 7.2 17 9 8 13 Toys and games 3.3 9.2 6.5 13.7 29.4 11 13 1 -16 Footwear 1.1 2.6 2.3 2.6 8.2 14 6 -2 -26 Travel goods 1.5 4.7 3.0 19.0 39.3 10 3 10 -22 Furniture 0.7 0.8 1.3 0.7 3.4 22 20 27 3
Japan
Total merchandise imports 42.8 100.0 100.0 5.1 13.8 15 4 -11 16
Agricultural products 6.2 23.1 14.5 5.5 10.4 9 0 -12 14 Food 5.3 17.5 12.4 6.2 11.3 11 0 -9 14
Mining products 2.2 28.8 5.2 4.4 3.3 -5 11 -35 -5
Manufactures 34.1 47.6 79.6 5.7 19.2 22 4 -9 17 Chemicals 1.3 4.5 3.1 3.6 5.7 10 3 -8 4 Other semi-manufactures 2.2 2.4 5.1 2.6 15.9 25 11 -7 15 Machinery and transport equipment 9.2 3.8 21.4 1.3 10.8 40 19 -1 19
Office and telecom equipment 4.3 1.4 9.9 1.5 9.7 43 15 -2 19 Electrical machinery and apparatus 3.0 1.2 7.1 3.7 26.5 40 21 2 23 Textiles 1.7 6.7 4.0 19.7 38.0 9 -1 -20 12 Clothing 11.4 19.9 26.7 27.5 69.7 19 -10 -9 20 Other consumer goods 7.9 7.5 18.5 4.5 24.7 27 11 -11 17 Toys and games 1.6 1.2 3.7 7.6 46.4 31 35 -10 6 Footwear 1.7 1.4 4.0 12.5 62.0 29 4 -20 21 Travel goods 1.0 1.0 2.4 9.6 39.4 27 -3 -15 22 Furniture 0.7 0.5 1.7 4.6 24.0 30 -8 -12 34

Trad
e by
regi
on
87
Table III.74
Merchandise exports of ASEAN countries by region, 1990-99
(Billion dollars and percentage)
Destination ASEAN (10) All other regions World
Origin Total Asia Other regions
Value
ASEAN (10) 1990 28.95 115.13 ... ... 144.091998 72.28 257.14 ... ... 329.421999 79.20 279.53 ... ... 358.73
Indonesia 1990 2.57 23.11 15.31 7.80 25.681998 9.35 39.50 20.10 19.41 48.851999 8.28 40.39 21.97 18.42 48.67
Malaysia 1990 8.62 20.80 9.65 11.14 29.421998 17.87 55.44 22.64 32.80 73.311999 20.13 64.33 27.57 36.75 84.46
Philippines 1990 0.59 7.47 2.59 4.88 8.071998 3.82 25.68 8.45 17.23 29.501999 4.99 31.66 11.55 20.11 36.65
Singapore a 1990 13.57 39.18 15.16 24.02 52.751998 28.86 81.03 33.43 47.60 109.901999 32.14 82.55 36.19 46.36 114.69
Thailand 1990 2.75 20.32 6.78 13.54 23.071998 9.91 44.55 16.31 28.24 54.461999 10.84 47.55 18.48 29.08 58.39
Share
ASEAN (10) 1990 20.1 79.9 ... ... 100.01999 22.1 77.9 ... ... 100.0
Indonesia 1990 1.8 16.0 10.6 5.4 17.81999 2.3 11.3 6.1 5.1 13.6
Malaysia 1990 6.0 14.4 6.7 7.7 20.41999 5.6 17.9 7.7 10.2 23.5
Philippines 1990 0.4 5.2 1.8 3.4 5.61999 1.4 8.8 3.2 5.6 10.2
Singapore 1990 9.4 27.2 10.5 16.7 36.61999 9.0 23.0 10.1 12.9 32.0
Thailand 1990 1.9 14.1 4.7 9.4 16.01999 3.0 13.3 5.2 8.1 16.3
Annual percentage change
ASEAN (10) 1990-99 12 10 ... ... 111998 -18 -3 ... ... -71999 10 9 ... ... 9
Indonesia 1990-99 14 6 4 10 71998 3 -11 -18 -2 -91999 -11 2 9 -5 0
Malaysia 1990-99 10 13 12 14 121998 -19 -2 -12 6 -71999 13 16 22 12 15
Philippines 1990-99 27 17 18 17 181998 11 19 11 23 181999 31 23 37 17 24
Singapore 1990-99 10 9 10 8 91998 -24 -7 -13 -2 -121999 11 2 8 -3 4
Thailand 1990-99 16 10 12 9 111998 -21 -1 -12 8 -51999 9 7 13 3 7
a Includes significant re-exports.

Trad
e by
regi
on
88
Table III.75
Merchandise imports of ASEAN countries by region, 1990-99
(Billion dollars and percentage)
Origin ASEAN (10) All other regions World
Destination Total Asia Other regions
Value
ASEAN (10) 1990 26.31 136.49 ... ... 162.801998 63.09 215.72 ... ... 278.811999 68.59 230.90 ... ... 299.49
Indonesia 1990 1.88 19.96 10.12 9.83 21.841998 4.51 22.83 10.45 12.38 27.341999 4.77 19.23 ... ... 24.00
Malaysia 1990 5.65 23.61 12.12 11.49 29.261998 13.22 45.10 23.25 21.84 58.321999 15.35 49.62 26.72 22.90 64.97
Philippines 1990 1.37 11.67 5.22 6.45 13.041998 4.72 26.83 14.03 12.81 31.551999 4.76 27.78 14.75 13.04 32.55
Singapore a 1990 12.45 48.45 20.78 27.67 60.901998 29.48 72.02 28.37 43.64 101.501999 31.29 79.77 33.66 46.11 111.06
Thailand 1990 4.37 29.01 15.82 13.19 33.381998 6.46 36.51 18.25 18.27 42.971999 7.98 42.32 21.48 20.85 50.31
Share
ASEAN (10) 1990 16.2 83.8 ... ... 100.01999 22.9 77.1 ... ... 100.0
Indonesia 1990 1.2 12.3 6.2 6.0 13.41999 1.6 6.4 … … 8.0
Malaysia 1990 3.5 14.5 7.4 7.1 18.01999 5.1 16.6 8.9 7.6 21.7
Philippines 1990 0.8 7.2 3.2 4.0 8.01999 1.6 9.3 4.9 4.4 10.9
Singapore 1990 7.6 29.8 12.8 17.0 37.41999 10.4 26.6 11.2 15.4 37.1
Thailand 1990 2.7 17.8 9.7 8.1 20.51999 2.7 14.1 7.2 7.0 16.8
Annual percentage change
ASEAN (10) 1990-99 11 6 ... ... 71998 -16 -27 ... ... -251999 9 7 ... ... 7
Indonesia 1990-99 11 0 … … 11998 -17 -37 -40 -34 -341999 6 -16 … … -12
Malaysia 1990-99 12 9 9 8 91998 -18 -28 -29 -28 -261999 16 10 15 5 11
Philippines 1990-99 15 10 12 8 111998 -10 -20 -15 -24 -181999 1 4 5 2 3
Singapore 1990-99 11 6 6 6 71998 -16 -26 -30 -23 -231999 6 11 19 6 9
Thailand 1990-99 7 4 3 5 51998 -20 -33 -31 -36 -321999 24 16 18 14 17
a Includes significant imports for re-export.

Trad
e by
regi
on
89
Table III.76
Merchandise trade of Asian economies in financial crisis by region, 1999
(Billion dollars and percentage)
Exports Imports
Annual percentage Annual percentageValue Share change Value Share change
1999 1999 1997 1998 1999 Destination / Origin 1999 1999 1997 1998 1999
372.9 100.0 5 -4 9 World a 291.6 100.0 -3 -31 15
192.2 51.6 4 -13 14 Asia 160.0 54.9 -4 -29 18
49.0 13.1 -4 -18 20 Japan 59.9 20.5 -11 -37 22
20.4 5.5 12 -9 14 China 16.0 5.5 16 -29 31
8.3 2.2 16 13 7 Australia and New Zealand 11.0 3.8 -4 -27 5
114.5 30.7 5 -13 12 Other 73.2 25.1 0 -22 15
81.9 22.0 7 6 14 North America 56.3 19.3 -2 -26 9
78.2 21.0 7 7 15 United States 52.8 18.1 -2 -26 10
3.6 1.0 15 0 8 Canada 3.2 1.1 -3 -29 -4
62.4 16.7 12 12 0 Western Europe 38.0 13.0 -8 -38 6
57.3 15.4 9 6 7 European Union (15) 33.0 11.3 -8 -38 3
10.5 2.8 -3 13 -5 Middle East 21.5 7.4 12 -33 21
11.6 3.1 1 7 -4 Latin America 5.4 1.9 -7 -47 31
6.8 1.8 11 8 -3 Africa 5.1 1.7 40 -48 36
3.8 1.0 2 -21 -18 C./E. Europe/Baltic States/CIS 4.1 1.4 -10 -51 61
a Includes unspecified destination/origin.
Note: The figures refer to the combined trade of Indonesia, the Republic of Korea, Malaysia, the Philippines and Thailand.
-40
-30
-20
-10
0
10
20
30
40
00Q200Q199Q499Q399Q299Q198Q498Q398Q298Q197Q497Q397Q297Q196Q496Q396Q296Q1
Exports
Imports
Chart III.18
Merchandise trade of Asian economies in financial crisis, 1995-00
(Year to year percentage change)
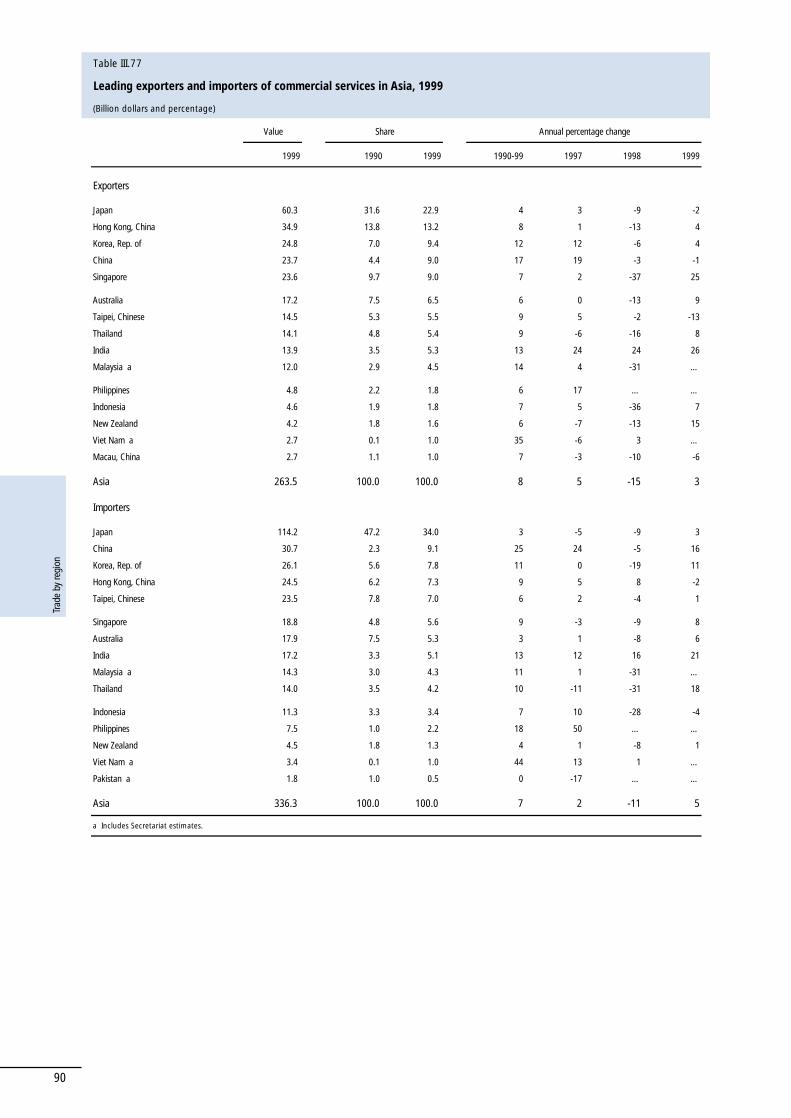
Trad
e by
regi
on
90
Table III.77
Leading exporters and importers of commercial services in Asia, 1999
(Billion dollars and percentage)
Value Share Annual percentage change
1999 1990 1999 1990-99 1997 1998 1999
Exporters
Japan 60.3 31.6 22.9 4 3 -9 -2
Hong Kong, China 34.9 13.8 13.2 8 1 -13 4
Korea, Rep. of 24.8 7.0 9.4 12 12 -6 4
China 23.7 4.4 9.0 17 19 -3 -1
Singapore 23.6 9.7 9.0 7 2 -37 25
Australia 17.2 7.5 6.5 6 0 -13 9
Taipei, Chinese 14.5 5.3 5.5 9 5 -2 -13
Thailand 14.1 4.8 5.4 9 -6 -16 8
India 13.9 3.5 5.3 13 24 24 26
Malaysia a 12.0 2.9 4.5 14 4 -31 …
Philippines 4.8 2.2 1.8 6 17 … …
Indonesia 4.6 1.9 1.8 7 5 -36 7
New Zealand 4.2 1.8 1.6 6 -7 -13 15
Viet Nam a 2.7 0.1 1.0 35 -6 3 …
Macau, China 2.7 1.1 1.0 7 -3 -10 -6
Asia 263.5 100.0 100.0 8 5 -15 3
Importers
Japan 114.2 47.2 34.0 3 -5 -9 3
China 30.7 2.3 9.1 25 24 -5 16
Korea, Rep. of 26.1 5.6 7.8 11 0 -19 11
Hong Kong, China 24.5 6.2 7.3 9 5 8 -2
Taipei, Chinese 23.5 7.8 7.0 6 2 -4 1
Singapore 18.8 4.8 5.6 9 -3 -9 8
Australia 17.9 7.5 5.3 3 1 -8 6
India 17.2 3.3 5.1 13 12 16 21
Malaysia a 14.3 3.0 4.3 11 1 -31 …
Thailand 14.0 3.5 4.2 10 -11 -31 18
Indonesia 11.3 3.3 3.4 7 10 -28 -4
Philippines 7.5 1.0 2.2 18 50 … …
New Zealand 4.5 1.8 1.3 4 1 -8 1
Viet Nam a 3.4 0.1 1.0 44 13 1 …
Pakistan a 1.8 1.0 0.5 0 -17 … …
Asia 336.3 100.0 100.0 7 2 -11 5
a Includes Secretariat estimates.

Trad
e by
regi
on
91
Table III.78
Trade in commercial services of Japan, 1999
(Billion dollars and percentage)
Exports Imports
Value Share Value Share
1999 1995 1999 1999 1995 1999
Total commercial services 60.3 100.0 100.0 114.2 100.0 100.0
Transportation 22.9 35.2 38.0 30.6 29.6 26.8
Sea transport 15.0 23.1 24.8 19.5 19.0 17.1
Air transport 7.9 12.1 13.2 11.1 10.6 9.7
Other transport 0.0 0.0 0.0 0.1 0.0 0.1
Travel 3.4 5.0 5.7 32.8 30.2 28.7
Other commercial services 34.0 59.8 56.3 50.8 40.2 44.5
Communication services 0.8 0.8 1.3 1.4 0.7 1.2
Construction services 5.7 10.3 9.5 4.3 2.6 3.8
Insurance services -0.1 0.5 0.0 2.3 2.1 2.0
Financial services 2.0 0.5 3.4 2.7 0.4 2.4
Computer and information services 1.3 … 2.1 3.0 … 2.6
Royalties and licence fees 8.2 9.4 13.6 9.9 7.7 8.6
Other business services 15.8 38.2 26.2 26.0 26.2 22.8
Personal, cultural, and recreational services 0.2 0.2 0.4 1.1 0.5 1.0

Trad
e by
sec
tor
93
IV. Trade by sector1. Overview
0 5 10 15 20
1990
1999
Chart IV.1
World merchandise exports by product, 1990 and 1999
(Share based on value)
Machinery and transp. equip. a
Office and telecom equipment
Mining products
Automotive products
Agricultural products
Chemicals
Other consumer goods
Other semi-manufactures
Clothing
Textiles
Iron and steel
a Excluding automotive products and office and telecom equipment (throughout this report they are included with machinery and transport equipment, unless otherwise noted).
Table IV.1
World merchandise exports by product, 1999
(Billion dollars and percentage)
Value Share Annual percentage change
1999 1990 1999 1990-99 1997 1998 1999
All products a 5473 100.0 100.0 5 4 -2 3
Agricultural products 544 12.2 9.9 3 -1 -5 -3
Food 437 9.3 8.0 4 0 -3 -4
Raw materials 107 2.9 2.0 1 -2 -11 -1
Mining products 556 14.3 10.2 2 3 -21 12
Ores and other minerals 56 1.6 1.0 1 7 -7 -5
Fuels 401 10.5 7.3 1 1 -26 19
Non-ferrous metals 99 2.1 1.8 3 7 -4 -1
Manufactures 4186 70.5 76.5 6 5 1 4
Iron and steel 126 3.1 2.3 2 3 -2 -11
Chemicals 526 8.7 9.6 7 4 1 4
Other semi-manufactures 414 7.8 7.6 5 1 0 3
Machinery and transport equipment 2295 35.8 41.9 7 6 3 5
Automotive products 549 9.4 10.0 6 5 5 5
Office and telecom equipment 769 8.8 14.1 11 10 0 10
Other machinery and transport equipment 976 17.6 17.8 6 4 3 1
Textiles 148 3.1 2.7 4 4 -4 -2
Clothing 186 3.2 3.4 6 11 1 1
Other consumer goods 492 8.8 9.0 6 5 0 4
a Includes unspecified products. They accounted for 3 per cent of world merchandise exports in 1999.

Trad
e by
sec
tor
94
1990
1995
1999
0 10 20 30 40 50
Chart IV.2
World exports of commercial services by category, 1990, 1995 and 1999
(Percentage)
Transportation
Travel
Other commercial services
Table IV.2
World exports of commercial services by category, 1999
(Billion dollars and percentage)
Value Share Annual percentage change
1999 1990 1999 1990-99 1997 1998 1999
All commercial services 1350 100.0 100.0 6 4 1 1
Transportation 310 28.5 23.0 4 2 -1 1
Travel 440 33.8 32.8 6 0 0 2
Other commercial services 600 37.7 44.2 8 8 2 1
Note: Exports of transportation services are significantly under-reported. See the Technical Notes.

Trad
e by
sec
tor
95
Table IV.3
World trade in agricultural products, 1999
(Billion dollars and percentage)
Value 544
Annual percentage change
1980-85 -2
1985-90 9
1990-99 3
1997 -1
1998 -5
1999 -3
Share in world merchandise trade 9.9
Share in world exports of primary products 49.4
Table IV.4
Major regional flows in world exports of agricultural products, 1999(Billion dollars and percentage)
Value Annual percentage change
1999 1990-99 1998 1999
Intra-Western Europe 179.7 2 3 -3
Intra-Asia 60.1 4 -16 1
North America to Asia 32.6 0 -20 2
Intra-North America 31.8 7 0 6
Latin America to North America 18.6 7 1 7
Latin America to Western Europe 17.7 3 -8 -10
2. Agricultural products
Table IV.5
Share of agricultural products in trade in total merchandise and in primary products by region, 1999(Percentage)
Exports Imports
Share of agricultural products in total merchandise
World 9.9 9.9
North America 10.6 6.4
Latin America 20.2 9.6
Western Europe 10.0 10.8
C./E. Europe/Baltic States/CIS 10.1 12.4
Africa 19.8 16.6
Middle East 3.7 13.9
Asia 7.1 10.6
Share of agricultural products in primary products
World 49.4 49.4
North America 65.1 42.3
Latin America 51.8 51.5
Western Europe 64.6 55.9
C./E. Europe/Baltic States/CIS 26.5 51.1
Africa 29.5 62.2
Middle East 5.0 67.8
Asia 53.1 42.3
Western Europe
Asia
North America
Latin America
C./E. Europe/Baltic States/CIS
Africa
Middle East
0 10 20 30 40 50 60
Exports
Imports
Chart IV.3
Regional shares in world trade in agricultural products,1999(Percentage)

Trad
e by
sec
tor
96
Table IV.6
Exports of agricultural products by region, 1999
(Billion dollars and percentage)
Share in
Value Region’s exports World exports Annual percentage change
1999 1990 1999 1990 1999 1990-99 1998 1999
World 543.8 - - 100.0 100.0 3 -5 -3
Western Europe
World 236.0 100.0 100.0 45.2 43.4 3 1 -2 Western Europe 179.7 78.2 76.1 35.4 33.0 2 3 -3 Asia 14.3 4.8 6.1 2.2 2.6 5 -15 13 North America 12.3 4.6 5.2 2.1 2.3 4 2 10 C./E. Europe/Baltic States/CIS 10.8 3.1 4.6 1.4 2.0 7 -15 -19 Africa 7.8 4.1 3.3 1.8 1.4 0 6 -9 Middle East 6.4 3.2 2.7 1.4 1.2 1 -6 5 Latin America 3.7 1.6 1.6 0.7 0.7 2 1 -9
North America
World 99.0 100.0 100.0 19.7 18.2 2 -9 -2 Asia 32.6 38.7 32.9 7.6 6.0 0 -20 2 North America 31.8 21.3 32.1 4.2 5.9 7 0 6 Western Europe 14.1 20.4 14.2 4.0 2.6 -2 -9 -15 Latin America 13.0 8.4 13.1 1.7 2.4 7 7 -10 Africa 3.1 3.2 3.1 0.6 0.6 2 -5 -10 Middle East 2.8 3.3 2.9 0.6 0.5 1 -21 6 C./E. Europe/Baltic States/CIS 1.3 4.4 1.3 0.9 0.2 -11 -15 -34
Asia
World 98.5 100.0 100.0 17.4 18.1 4 -11 0 Asia 60.1 56.8 61.0 9.9 11.0 4 -16 1 Western Europe 15.1 17.2 15.3 3.0 2.8 2 -5 -5 North America 12.5 11.4 12.7 2.0 2.3 5 1 3 Middle East 4.6 5.1 4.6 0.9 0.8 2 -3 5 Africa 3.2 2.7 3.2 0.5 0.6 6 5 4 C./E. Europe/Baltic States/CIS 1.6 5.0 1.6 0.9 0.3 -9 -15 -24 Latin America 1.3 1.5 1.3 0.3 0.2 3 -10 -17
Latin America
World 60.1 100.0 100.0 9.6 11.1 5 -4 -8 North America 18.6 26.2 30.9 2.5 3.4 7 1 7 Western Europe 17.7 33.5 29.5 3.2 3.3 3 -8 -10 Latin America 9.7 11.3 16.2 1.1 1.8 9 6 -24 Asia 7.8 10.1 12.9 1.0 1.4 8 -19 -8 Middle East 2.2 3.1 3.6 0.3 0.4 7 3 -9 C./E. Europe/Baltic States/CIS 1.9 13.2 3.2 1.3 0.3 -11 -7 -11 Africa 1.7 2.5 2.9 0.2 0.3 6 -3 -21
Africa
World 22.2 100.0 100.0 3.9 4.1 3 -2 -6 Western Europe 12.0 61.1 54.2 2.4 2.2 2 3 -13 Asia 3.6 15.1 16.3 0.6 0.7 4 -13 1 Africa 2.6 11.8 11.9 0.5 0.5 4 -8 6 North America 1.1 5.3 5.0 0.2 0.2 3 9 -10 C./E. Europe/Baltic States/CIS 1.0 3.5 4.6 0.1 0.2 6 -10 -1 Middle East 0.5 2.3 2.2 0.1 0.1 3 1 -11 Latin America 0.3 0.4 1.4 0.0 0.1 20 -15 -15
C./E. Europe/Baltic States/CIS a
World 21.6 100.0 100.0 3.0 I 4.0 … -13 -7 Western Europe 9.5 63.8 44.0 1.9 1.8 2 -3 2 C./E. Europe/Baltic States/CIS 8.0 14.1 I 37.0 0.4 I 1.5 … -21 -20 Asia 2.3 12.1 10.5 0.4 0.4 4 -11 10 Middle East 0.6 1.6 2.6 0.0 0.1 12 -14 -6 North America 0.4 2.8 1.7 0.1 0.1 0 13 2 Africa 0.4 2.7 1.7 0.1 0.1 1 -8 -8 Latin America 0.1 2.7 0.6 0.1 0.0 -11 -47 14
Middle East
World 6.3 100.0 100.0 1.1 1.2 4 -13 3 Middle East 2.3 25.5 36.0 0.3 0.4 8 -17 0 Western Europe 2.0 46.4 31.4 0.5 0.4 -1 -9 -5 Asia 0.6 6.1 9.9 0.1 0.1 9 -21 21 All other regions 1.0 18.5 15.6 0.2 0.2 2 4 1
a Includes the intra trade of the Baltic States and the CIS beginning with 1996.

Trad
e by
sec
tor
97
Table IV.7
Leading exporters and importers of agricultural products, 1999
(Billion dollars and percentage)
Share in world Value exports/imports Annual percentage change
1999 1980 1990 1999 1990-99 1997 1998 1999
Exporters
United States 65.94 17.0 14.3 12.1 1 -6 -10 -6
France 39.37 6.9 9.0 7.2 1 -5 -1 -4
Netherlands 33.80 5.7 7.7 6.2 1 -12 -3 -2
Canada 32.60 5.0 5.4 6.0 4 9 -9 4
Germany 27.85 4.2 5.9 5.1 1 -8 5 -12
Belgium 19.97 - - 3.7 - - - -
United Kingdom 17.69 3.1 3.6 3.3 2 3 -7 -9
Spain 17.08 1.4 2.3 3.1 7 7 -1 -5
Italy 16.62 2.1 2.9 3.1 4 -8 2 -3
Brazil 15.98 3.4 2.4 2.9 6 14 -7 -6
Australia 15.29 3.3 2.9 2.8 3 6 -23 5
China 14.21 1.5 2.4 2.6 4 5 -9 -1
Argentina 11.92 1.9 1.8 2.2 5 2 2 -15
Denmark 11.83 2.1 2.6 2.2 1 -1 -3 -2
Thailand 11.75 1.2 1.9 2.2 5 -7 -12 2
Above 15 351.89 61.0 68.1 64.7 - - - -
Importers
United States 66.14 8.7 9.0 11.3 6 9 1 6
Japan 59.74 9.6 11.4 10.2 2 -8 -16 6
Germany 44.34 9.7 10.7 7.6 -1 -8 2 -15
United Kingdom 34.43 6.5 6.7 5.9 2 1 -1 -2
France 31.62 6.1 6.5 5.4 1 -6 3 -5
Italy 29.53 6.3 7.1 5.0 -1 -5 -1 -8
Netherlands 21.20 4.3 4.3 3.6 1 -16 -1 0
Belgium 19.00 - - 3.2 - - - -
Spain 17.81 1.9 2.8 3.0 4 -3 4 -3
Canada a 14.28 1.8 2.0 2.4 5 11 2 2
China 13.85 1.9 1.8 2.4 7 -4 -14 10
Hong Kong, China 11.32 - - - 3 3 -13 -11
retained imports 6.21 1.0 1.0 1.1 3 11 -14 -10
Korea, Rep. of 11.08 1.5 2.2 1.9 2 -11 -34 19
Russian Fed. b 9.88 - - 1.7 - 6 -25 -26
Mexico a 9.65 1.2 1.2 1.6 7 4 8 1
Above 15 388.76 63.4 69.8 66.2 - - - -
a Imports are valued f.o.b.
b Includes Secretariat estimates.

Trad
e by
sec
tor
98
Table IV.8
Exports of agricultural products of selected economies, 1990-99
(Million dollars and percentage)
Share in economy’s totalValue merchandise exports
1990 1996 1997 1998 1999 1990 1999 a
World 414190 I 592870 589230 560560 543820 12.2 9.9
Argentina 7482 13285 13609 13942 11917 60.6 51.1Australia 12073 17736 18787 14516 15292 30.4 27.3Bangladesh 329 432 442 452 ... 21.1 8.9Belgium - - - - 19970 - 11.3Belgium-Luxembourg 13063 I 18942 20294 20533 - 11.1 -Belize 99 139 145 ... ... 91.7 91.2Brazil 9779 16050 18304 17065 15980 31.1 33.3Cameroon 722 870 ... ... ... 36.1 49.2Canada 22338 31513 34291 31222 32599 17.5 13.7Chile 2779 5713 5724 5595 ... 33.2 37.7
China 10059 14944 15732 14314 14209 16.2 7.3Colombia 2514 3414 4273 4004 3341 37.2 28.9Costa Rica 926 2010 2147 2309 1969 64.0 29.9Denmark 10648 I 12728 12552 12115 11831 28.9 24.1Ecuador 1235 2593 3165 2854 ... 45.5 67.9Egypt 496 525 449 580 ... 19.2 18.2El Salvador 237 546 758 595 497 40.7 42.7France 37101 I 43640 41510 41069 39371 17.1 13.1Germany 24620 I 32738 30124 31674 27846 5.8 5.1Greece 2584 I 4109 3268 3299 3194 31.9 28.7
Guatemala 849 1330 1524 1660 1517 73.0 63.3Honduras 474 572 705 790 504 57.0 40.4Hungary 2558 I 2917 3054 2966 2502 25.6 10.0Iceland 1274 1459 1384 1462 1411 80.0 70.4India 3505 7040 6863 6235 ... 19.5 18.5Indonesia 4153 8477 8548 7706 7544 16.2 15.5Ireland 5709 I 7972 6820 6917 6984 24.0 9.9Italy 11858 I 18150 16724 17079 16617 7.0 7.2Kenya 559 1269 1220 1244 1093 54.2 59.1Luxembourg - - - - 579 - 7.5
Madagascar 223 193 170 116 99 69.9 47.7Malaysia 7495 10897 10229 9544 9214 25.5 10.9Mauritius 396 541 455 457 383 33.2 24.8Morocco 1228 I 1678 1568 ... ... 28.8 22.3Netherlands 31858 I 40279 35362 34400 33800 24.2 16.9New Zealand 5965 8816 8521 7236 7339 62.9 58.9Nicaragua 295 423 483 473 431 89.4 79.2Pakistan 1080 1401 1109 1306 1277 19.3 14.4Paraguay 863 857 962 872 624 90.0 84.2Peru 813 1797 2296 1343 1578 25.2 25.8
Philippines 1682 2292 2331 2201 1803 20.8 4.9Poland 2268 3193 3742 I 3559 3018 15.8 11.0Portugal 2208 I 2455 2503 2464 2415 13.4 10.1Romania 184 967 889 746 887 3.7 10.4Russian Fed. b - 6640 5903 6057 3690 - 5.0South Africa 2945 4024 3941 I 3970 3738 12.5 14.0Spain 9368 I 17041 18274 18041 17082 16.8 15.5Sri Lanka 758 1065 ... ... 1031 38.2 22.4Thailand 7786 14017 13021 11523 11748 33.7 20.1Tunisia 417 446 650 577 685 11.8 11.6
Turkey 3300 4938 5471 5032 4442 25.5 17.1United Kingdom 14960 I 20344 20883 19484 17686 8.1 6.6United States 59403 81952 77266 69846 65941 15.1 9.5Uruguay 1025 1484 1674 1644 ... 60.5 59.4Zimbabwe 753 1236 1202 ... ... 43.6 47.3
Memorandum item: European Union (15) 175847 I 233034 224825 226709 221004 11.7 10.1 Intra-exports 130571 I 169758 160277 166259 161555 13.3 11.7 Extra-exports 45276 63276 64548 60450 59448 8.6 7.5
a Or nearest year.
b Includes Secretariat estimates.

Trad
e by
sec
tor
99
Table IV.9
Imports of agricultural products of selected economies, 1990-99
(Million dollars and percentage)
Share in economy’s totalValue merchandise imports
1990 1996 1997 1998 1999 1990 1999 a
Algeria 2765 3117 3036 ... ... 28.5 34.9Austria 4178 I 5795 5805 5893 5950 8.5 8.7Bangladesh 835 1328 1505 1451 ... 24.3 20.7Belgium - - - - 18997 - 11.8Belgium-Luxembourg 14740 I 19639 20150 20448 - 12.3 -Brazil 2691 7811 7577 7149 5130 11.9 9.9Cameroon 314 195 ... ... ... 22.4 15.9Canada b 9009 12404 13737 13997 14281 7.7 6.6Chile 460 1431 1441 1443 ... 6.0 7.7China 7854 15300 14633 12610 13853 14.7 8.4
Colombia 592 2008 2040 2020 1616 10.6 15.2Cyprus 404 1016 1038 796 763 15.7 21.1Denmark 4822 I 6436 6785 6976 6866 14.5 15.5Egypt 3553 4632 4241 4301 ... 38.6 26.6France 28893 I 34411 32321 33212 31621 12.3 10.9Germany 47205 I 55397 51037 51884 44339 13.3 9.4Greece 3717 I 4869 4403 4716 3986 18.8 13.2Hong Kong, China 8325 14257 14645 12698 11319 9.8 6.3 retained imports 4591 7269 8058 6915 6212 14.7 21.7India 1720 3034 3562 4632 ... 7.3 10.8Indonesia 2126 6976 5656 4704 6034 9.7 25.1
Ireland 2568 I 3390 3505 3639 3844 12.4 8.3Israel 1564 2435 2435 2267 2288 9.3 6.9Italy 31331 I 34021 32250 32062 29530 17.2 13.6Japan 50459 73157 67105 56588 59735 21.4 19.2Jordan 709 1245 966 962 873 27.3 23.4Korea, Rep. of 9529 15685 14013 9306 11084 13.6 9.3Luxembourg - - - - 1221 - 11.2Madagascar 71 76 95 86 72 12.4 14.3Mauritius 255 441 391 411 359 15.8 16.8Mexico b 5374 8541 8897 9571 9653 13.3 6.6
Morocco 1096 I 1993 1742 ... ... 16.1 18.3Netherlands 18979 I 25360 21345 21227 21199 15.1 11.3Oman 506 835 847 ... ... 18.9 16.9Pakistan 1568 2236 2607 2328 2408 20.8 22.3Peru 667 1424 1347 1503 1145 19.2 14.2Poland 1253 4743 4533 I 4557 4045 10.8 8.8Portugal 3891 I 5635 5420 5841 5541 15.4 14.4Romania 1249 1080 882 1171 919 16.4 8.8Russian Fed. c - 16741 17736 13389 9880 - 24.0Saudi Arabia 3486 5043 5265 4955 ... 14.5 16.5
Slovak Rep. b - 1075 I 1065 1041 898 - 8.0Spain 12239 I 18315 17713 18438 17805 14.0 12.3Sri Lanka 549 867 ... ... 879 20.4 16.5Taipei, Chinese 6202 10023 9777 7801 7675 11.3 6.9Thailand 3226 5608 4960 3724 3964 9.7 7.9Tunisia 819 1012 1126 1114 929 14.8 11.0Turkey 2806 4805 4928 4321 3398 12.6 8.4United Kingdom 29578 I 35184 35498 35288 34434 13.3 10.8United States 39965 56900 61833 62395 66138 7.7 6.2Venezuela b 986 1666 1718 1954 1938 14.9 14.3Zimbabwe b 115 347 280 ... ... 6.2 9.1
Memorandum item: European Union (15) 208502 I 263612 249891 257008 250333 13.4 11.2 Intra-imports d 130913 I 13.3 Extra-imports 77589 93854 89614 90749 88777 13.5 10.5
a Or nearest year.
b Imports are valued f.o.b.
c Includes Secretariat estimates.
d See the Technical Notes for information on intra-EU imports.
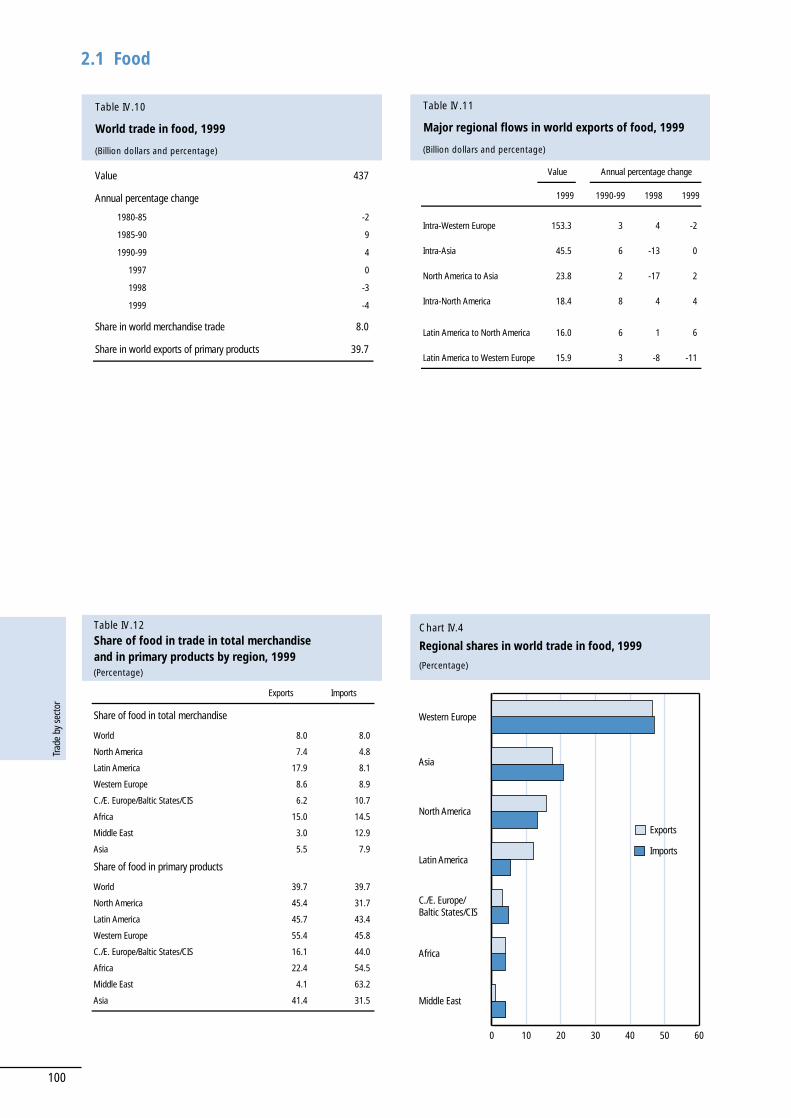
Trad
e by
sec
tor
100
Table IV.10
World trade in food, 1999
(Billion dollars and percentage)
Value 437
Annual percentage change
1980-85 -2
1985-90 9
1990-99 4
1997 0
1998 -3
1999 -4
Share in world merchandise trade 8.0
Share in world exports of primary products 39.7
Table IV.11
Major regional flows in world exports of food, 1999
(Billion dollars and percentage)
Value Annual percentage change
1999 1990-99 1998 1999
Intra-Western Europe 153.3 3 4 -2
Intra-Asia 45.5 6 -13 0
North America to Asia 23.8 2 -17 2
Intra-North America 18.4 8 4 4
Latin America to North America 16.0 6 1 6
Latin America to Western Europe 15.9 3 -8 -11
2.1 Food
Table IV.12
Share of food in trade in total merchandise and in primary products by region, 1999(Percentage)
Exports Imports
Share of food in total merchandise
World 8.0 8.0
North America 7.4 4.8
Latin America 17.9 8.1
Western Europe 8.6 8.9
C./E. Europe/Baltic States/CIS 6.2 10.7
Africa 15.0 14.5
Middle East 3.0 12.9
Asia 5.5 7.9
Share of food in primary products
World 39.7 39.7
North America 45.4 31.7
Latin America 45.7 43.4
Western Europe 55.4 45.8
C./E. Europe/Baltic States/CIS 16.1 44.0
Africa 22.4 54.5
Middle East 4.1 63.2
Asia 41.4 31.5
0 10 20 30 40 50 60
Exports
Imports
Western Europe
Asia
North America
Latin America
C./E. Europe/Baltic States/CIS
Africa
Middle East
Chart IV.4
Regional shares in world trade in food, 1999
(Percentage)

Trad
e by
sec
tor
101
Table IV.13
Exports of food by principal region, 1999
(Billion dollars and percentage)
Share in
Value Region’s exports World exports Annual percentage change
1999 1990 1999 1990 1999 1990-99 1998 1999
World 436.5 - - 100.0 100.0 4 -3 -4
Western Europe
World 202.5 100.0 100.0 48.7 46.4 3 1 -2
Western Europe 153.3 77.0 75.7 37.5 35.1 3 4 -2
Asia 11.6 4.9 5.7 2.4 2.7 5 -14 12
North America 11.3 5.1 5.6 2.5 2.6 4 3 11
C./E. Europe/Baltic States/CIS 9.4 3.1 4.7 1.5 2.2 8 -17 -20
Africa 6.7 4.3 3.3 2.1 1.5 0 8 -9
Middle East 6.0 3.5 2.9 1.7 1.4 1 -6 6
Latin America 3.4 1.8 1.7 0.9 0.8 2 2 -9
Asia
World 76.9 100.0 100.0 16.0 17.6 5 -8 0
Asia 45.5 54.3 59.3 8.7 10.4 6 -13 0
Western Europe 11.1 15.6 14.4 2.5 2.5 4 -2 -4
North America 10.5 13.2 13.7 2.1 2.4 5 4 7
Middle East 4.3 6.7 5.6 1.1 1.0 3 -2 5
Africa 3.0 3.3 3.8 0.5 0.7 7 6 6
C./E. Europe/Baltic States/CIS 1.4 5.2 1.8 0.8 0.3 -7 -17 -26
Latin America 1.0 1.5 1.2 0.2 0.2 2 -7 -18
North America
World 69.0 100.0 100.0 16.9 15.8 3 -8 -4
Asia 23.8 37.1 34.5 6.3 5.5 2 -17 2
North America 18.4 18.0 26.7 3.0 4.2 8 4 4
Latin America 10.5 10.1 15.2 1.7 2.4 8 6 -8
Western Europe 9.2 19.4 13.4 3.3 2.1 -1 -10 -18
Africa 2.8 3.9 4.1 0.7 0.6 3 -4 -10
Middle East 2.6 4.6 3.8 0.8 0.6 1 -23 6
C./E. Europe/Baltic States/CIS 1.2 6.5 1.8 1.1 0.3 -11 -16 -35
Latin America
World 53.1 100.0 100.0 11.2 12.2 5 -4 -10
North America 16.0 26.8 30.2 3.0 3.7 6 1 6
Western Europe 15.9 33.4 29.9 3.7 3.6 3 -8 -11
Latin America 8.8 10.7 16.5 1.2 2.0 10 9 -25
Asia 6.3 8.6 11.9 1.0 1.4 9 -17 -12
Middle East 2.1 3.3 4.0 0.4 0.5 7 2 -9
C./E. Europe/Baltic States/CIS 1.9 14.5 3.5 1.6 0.4 -11 -7 -11
Africa 1.7 2.7 3.1 0.3 0.4 6 -3 -22
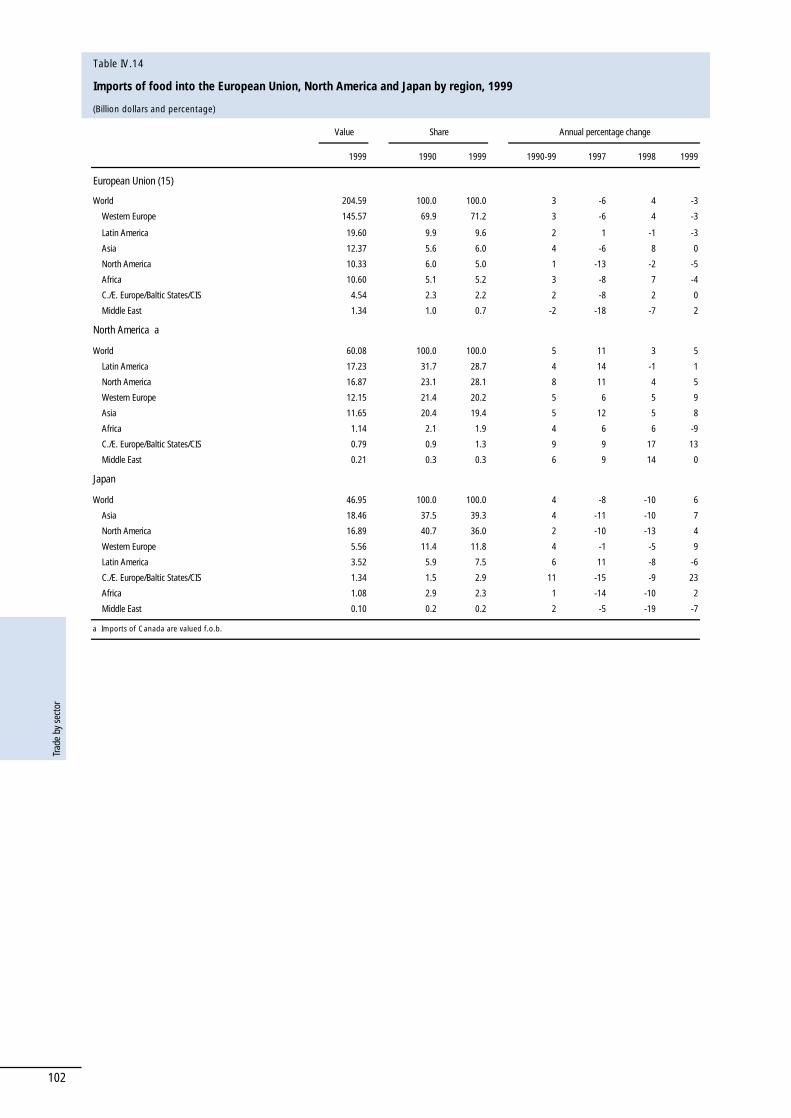
Trad
e by
sec
tor
102
Table IV.14
Imports of food into the European Union, North America and Japan by region, 1999
(Billion dollars and percentage)
Value Share Annual percentage change
1999 1990 1999 1990-99 1997 1998 1999
European Union (15)
World 204.59 100.0 100.0 3 -6 4 -3
Western Europe 145.57 69.9 71.2 3 -6 4 -3
Latin America 19.60 9.9 9.6 2 1 -1 -3
Asia 12.37 5.6 6.0 4 -6 8 0
North America 10.33 6.0 5.0 1 -13 -2 -5
Africa 10.60 5.1 5.2 3 -8 7 -4
C./E. Europe/Baltic States/CIS 4.54 2.3 2.2 2 -8 2 0
Middle East 1.34 1.0 0.7 -2 -18 -7 2
North America a
World 60.08 100.0 100.0 5 11 3 5
Latin America 17.23 31.7 28.7 4 14 -1 1
North America 16.87 23.1 28.1 8 11 4 5
Western Europe 12.15 21.4 20.2 5 6 5 9
Asia 11.65 20.4 19.4 5 12 5 8
Africa 1.14 2.1 1.9 4 6 6 -9
C./E. Europe/Baltic States/CIS 0.79 0.9 1.3 9 9 17 13
Middle East 0.21 0.3 0.3 6 9 14 0
Japan
World 46.95 100.0 100.0 4 -8 -10 6
Asia 18.46 37.5 39.3 4 -11 -10 7
North America 16.89 40.7 36.0 2 -10 -13 4
Western Europe 5.56 11.4 11.8 4 -1 -5 9
Latin America 3.52 5.9 7.5 6 11 -8 -6
C./E. Europe/Baltic States/CIS 1.34 1.5 2.9 11 -15 -9 23
Africa 1.08 2.9 2.3 1 -14 -10 2
Middle East 0.10 0.2 0.2 2 -5 -19 -7
a Imports of Canada are valued f.o.b.

Trad
e by
sec
tor
103
Table IV.15
Leading exporters and importers of food, 1999
(Billion dollars and percentage)
Share in world Value exports/imports Annual percentage change
1999 1980 1990 1999 1990-99 1997 1998 1999
Exporters
United States 51.97 17.6 13.5 11.9 2 -6 -9 -4
France 36.25 8.0 10.5 8.3 1 -4 -1 -4
Netherlands 27.74 6.6 8.3 6.4 1 -13 -3 -3
Germany 23.31 4.5 6.3 5.3 2 -9 6 -13
Belgium 17.57 - - 4.0 - - - -
Canada 16.57 3.5 3.5 3.8 5 15 -6 -2
United Kingdom 16.39 3.5 4.1 3.8 3 3 -7 -6
Spain 15.83 1.7 2.6 3.6 8 7 -1 -5
Italy 15.03 2.4 3.4 3.4 4 -8 2 -3
Brazil 13.80 4.2 2.8 3.2 5 15 -8 -9
Australia 11.86 3.3 2.6 2.7 4 4 -22 10
China 11.73 1.4 2.5 2.7 5 5 -7 -4
Argentina 11.43 2.3 2.2 2.6 6 4 4 -15
Denmark 10.51 2.4 3.0 2.4 1 -1 -3 -2
Thailand 9.96 1.3 2.1 2.3 5 -3 -9 3
Above 15 289.95 65.2 70.8 66.4 - - - -
Memorandum item:
European Union (15) 189.18 34.8 45.7 43.3 3 -4 1 -2
Intra-exports 138.27 23.5 33.7 31.7 3 -6 4 -3
Extra-exports 50.91 11.3 12.0 11.7 3 2 -6 -2
Importers
United States 48.64 8.8 8.9 10.3 5 11 3 6
Japan 46.95 7.2 10.1 10.0 4 -8 -10 6
Germany 36.05 9.7 10.6 7.6 0 -9 2 -14
United Kingdom 29.02 6.6 6.8 6.1 3 1 1 -2
France 26.29 5.9 6.7 5.6 2 -7 4 -5
Italy 21.15 5.5 6.4 4.5 0 -6 1 -7
Netherlands 17.88 4.9 4.7 3.8 1 -18 0 0
Belgium 16.15 - - 3.4 - - - -
Spain 14.99 1.8 2.8 3.2 5 -3 5 -2
Canada a 11.44 1.8 2.1 2.4 5 10 3 2
Russian Fed. b 9.23 - - 2.0 - 5 -24 -28
Hong Kong, China 8.94 - - - 4 5 -13 -11
retained imports 5.67 1.0 1.2 1.2 4 15 -12 -9
Mexico a 7.58 1.4 1.3 1.6 6 0 8 4
China 6.73 1.4 1.4 1.4 4 -12 -7 1
Korea, Rep. of 6.68 0.9 1.2 1.4 6 -8 -30 18
Above 15 304.43 60.2 67.4 64.5 - - - -
a Imports are valued f.o.b.
b Includes Secretariat estimates.

Trad
e by
sec
tor
104
Table IV.16
World trade in mining products, 1999
(Billion dollars and percentage)
Value 556
Annual percentage change
1980-85 -5
1985-90 2
1990-99 2
1997 3
1998 -21
1999 12
Share in world merchandise trade 10.2
Share in world exports of primary products 50.6
Table IV.18
Share of mining products in trade in total merchandiseand in primary products by region, 1999(Percentage)
Exports Imports
Share of mining products in total merchandise
World 10.2 10.2
North America 5.7 8.7
Latin America 18.9 9.1
Western Europe 5.5 8.6
C./E. Europe/Baltic States/CIS 28.0 11.9
Africa 47.2 10.1
Middle East 69.3 6.6
Asia 6.3 14.5
Share of mining products in primary products
World 50.6 50.6
North America 34.9 57.7
Latin America 48.2 48.5
Western Europe 35.4 44.1
C./E. Europe/Baltic States/CIS 73.5 48.9
Africa 70.5 37.8
Middle East 95.0 32.2
Asia 46.9 57.70 10 20 30 40 50 60
Exports
Imports
Western Europe
Asia
North America
Latin America
C./E. Europe/Baltic States/CIS
Africa
Middle East
Chart IV.5
Regional shares in world trade in mining products, 1999
(Percentage)
Table IV.17
Major regional flows in world exports of mining products, 1999(Billion dollars and percentage)
Value Annual percentage change
1999 1990-99 1998 1999
Intra-Western Europe 99.8 1 -16 3
Intra-Asia 71.1 3 -21 10
Middle East to Asia 64.3 3 -33 24
C./E. Europe/Baltic States/CIS 31.4 2 -16 9 to Western Europe
Intra-North America 30.4 4 -14 2
Latin America to North America 28.1 2 -29 31
3. Mining products

Trad
e by
sec
tor
105
Table IV.19
Exports of mining products by region, 1999
(Billion dollars and percentage)
Share in
Value Region’s exports World exports Annual percentage change
1999 1990 1999 1990 1999 1990-99 1998 1999
World 556.3 - - 100.0 100.0 2 -21 12
Western Europe
World 129.3 100.0 100.0 24.5 23.2 1 -16 5 Western Europe 99.8 80.0 77.2 19.6 17.9 1 -16 3 North America 12.7 8.6 9.9 2.1 2.3 2 -21 39 Asia 5.5 2.9 4.3 0.7 1.0 5 -29 27 C./E. Europe/Baltic States/CIS 3.7 1.7 2.9 0.4 0.7 7 -15 -1 Africa 2.0 1.7 1.6 0.4 0.4 0 0 -11 Middle East 1.5 1.2 1.2 0.3 0.3 1 -20 -2 Latin America 1.3 0.5 1.0 0.1 0.2 10 1 -3
Middle East
World 118.0 100.0 100.0 22.4 21.2 1 -30 30 Asia 64.3 45.2 54.5 10.1 11.6 3 -33 24 Western Europe 19.8 24.9 16.8 5.6 3.6 -3 -22 17 North America 13.7 14.0 11.6 3.1 2.5 -1 -23 50 Africa 5.2 3.2 4.4 0.7 0.9 5 -16 42 Middle East 4.9 3.4 4.1 0.8 0.9 3 -27 48 Latin America 1.4 4.3 1.2 1.0 0.3 -12 -39 8 C./E. Europe/Baltic States/CIS 0.2 1.4 0.1 0.3 0.0 -22 -38 -9
Asia
World 87.1 100.0 100.0 13.6 15.7 3 -15 8 Asia 71.1 79.7 81.6 10.9 12.8 3 -21 10 Western Europe 5.6 6.9 6.5 0.9 1.0 2 9 -9 North America 5.4 8.9 6.2 1.2 1.0 -1 5 0 Latin America 1.5 1.0 1.7 0.1 0.3 10 107 -1 All other regions 1.8 1.9 2.1 0.3 0.3 5 25 16
C./E. Europe/Baltic States/CIS a
World 60.0 100.0 100.0 8.1 I 10.8 … -16 4 Western Europe 31.4 67.7 52.3 5.5 5.6 2 -16 9 C./E. Europe/Baltic States/CIS 19.1 17.6 I 31.8 1.4 I 3.4 … -21 -10 Asia 3.8 8.4 6.3 0.7 0.7 2 -14 28 North America 2.4 2.5 4.0 0.2 0.4 10 23 23 Latin America 1.9 2.1 3.2 0.2 0.3 10 7 39 All other regions 0.9 1.7 1.5 0.1 0.2 3 -13 -5
Latin America
World 56.0 100.0 100.0 10.1 10.1 2 -24 19 North America 28.1 47.2 50.2 4.8 5.1 2 -29 31 Latin America 12.1 12.7 21.5 1.3 2.2 8 -23 20 Western Europe 8.3 20.7 14.8 2.1 1.5 -2 -1 -7 Asia 5.5 11.6 9.9 1.2 1.0 0 -34 7 All other regions 1.0 3.7 1.8 0.4 0.2 -6 -8 -10
North America
World 53.0 100.0 100.0 9.8 9.5 1 -15 2 North America 30.4 44.3 57.3 4.4 5.5 4 -14 2 Western Europe 8.7 20.0 16.4 2.0 1.6 -1 -10 9 Asia 7.3 25.9 13.7 2.5 1.3 -6 -28 -2 Latin America 5.8 7.7 11.0 0.8 1.0 5 -11 -2 All other regions 0.8 2.0 1.6 0.2 0.2 -1 -22 -17
Africa
World 53.0 100.0 100.0 11.4 9.5 0 -27 17 Western Europe 24.0 61.5 45.3 7.0 4.3 -4 -24 6 North America 12.3 24.7 23.1 2.8 2.2 -1 -27 4 Asia 8.1 5.9 15.3 0.7 1.5 11 -37 40 Africa 2.9 3.3 5.4 0.4 0.5 5 -25 54 Latin America 2.6 2.3 4.9 0.3 0.5 8 -13 37 All other regions 0.6 1.9 1.2 0.2 0.1 -5 -33 7
a Includes the intra trade of the Baltic States and the CIS beginning with 1996.

Trad
e by
sec
tor
106
3.1 Fuels
Table IV.20
World trade in fuels, 1999
(Billion dollars and percentage)
Value 401
Annual percentage change
1980-85 -5
1985-90 0
1990-99 1
1997 1
1998 -26
1999 19
Share in world merchandise trade 7.3
Share in world exports of primary products 36.5
Table IV.22
Share of fuels in trade in total merchandise and in primary products by region, 1999(Percentage)
Exports Imports
Share of fuels in total merchandise
World 7.3 7.3
North America 3.2 6.6
Latin America 12.8 7.0
Western Europe 3.3 5.6
C./E. Europe/Baltic States/CIS 19.0 9.0
Africa 39.5 8.2
Middle East 67.2 4.7
Asia 4.1 10.7
Share of fuels in primary products
World 36.5 36.5
North America 19.9 43.3
Latin America 32.7 37.8
Western Europe 20.9 28.9
C./E. Europe/Baltic States/CIS 50.0 36.8
Africa 59.0 30.7
Middle East 92.0 22.8
Asia 30.7 42.8
0 10 20 30 40 50 60
Exports
Imports
Western Europe
Asia
North America
Latin America
C./E. Europe/Baltic States/CIS
Africa
Middle East
Chart IV.6
Regional shares in world trade in fuels, 1999
(Percentage)
Table IV.21
Major regional flows in world exports of fuels, 1999
(Billion dollars and percentage)
Value Annual percentage change
1999 1990-99 1998 1999
Middle East to Asia 62.7 3 -33 24
Intra-Western Europe 59.7 1 -24 10
Intra-Asia 48.5 3 -25 14
Latin America to North America 23.9 2 -32 36
C./E. Europe/Baltic States/CIS to Western Europe 21.1 -1 -26 21
Africa to Western Europe 20.3 -4 -28 7

Trad
e by
sec
tor
107
Table IV.23
Fuels imports of selected economies by region and supplier, 1999
(Million dollars and percentage)
United States EU (15) Japan
Annual percentage Annual percentage Annual percentageValue Share change Value Share change Value Share change
1999 1999 1998 1999 1999 1999 1998 1999 1999 1999 1998 1999
Region
World 79273 100.0 -25 28 117177 100.0 -23 9 49872 100.0 -31 15
Middle East 14418 18.2 -21 52 18317 15.6 -20 16 28676 57.5 -34 20
Western Europe 6884 8.7 -26 43 54538 46.5 -26 12 231 0.5 -6 59
Asia 2940 3.7 1 14 1856 1.6 7 -5 17990 36.1 -27 10
Africa 11378 14.4 -30 6 20132 17.2 -26 11 584 1.2 -40 37
Latin America 24999 31.5 -30 31 2761 2.4 -15 10 432 0.9 -52 76
North America 17643 22.3 -18 16 2432 2.1 -19 -12 1751 3.5 -22 -15
C./E. Europe/
Baltic States/CIS 1011 1.3 6 153 15775 13.5 -37 26 206 0.4 -29 -10
Suppliers
Saudi Arabia 8174 10.3 -32 26 7462 6.4 -33 13 8031 16.1 -41 17Canada 17643 22.3 -18 16 438 0.4 -13 13 810 1.6 -15 -22Norway 2362 3.0 -39 75 15538 13.3 -39 13 124 0.2 -8 32United Arab Emirates 27 0.0 175 -39 203 0.2 -25 12 8642 17.3 -33 6Netherlands 291 0.4 -17 -6 10721 9.1 -32 7 12 0.0 175 9
Above 5 28497 35.9 -24 22 34362 29.3 -35 11 17619 35.3 -35 9
Russian Fed. 571 0.7 89 128 11144 9.5 -43 24 206 0.4 -29 -10United Kingdom 2542 3.2 -26 53 9034 7.7 -29 16 4 0.0 0 -20Venezuela 10132 12.8 -33 20 1072 0.9 -22 28 31 0.1 -71 675Indonesia 583 0.7 -11 18 411 0.4 8 19 5708 11.4 -31 19Iran, Islamic Rep. of 0 0.0 ... ... 3901 3.3 -20 11 3041 6.1 -31 29
Kuwait 1540 1.9 -27 7 1303 1.1 -23 13 3004 6.0 -37 29Australia 364 0.5 -6 -14 1124 1.0 6 9 4782 9.6 -11 -4Iraq 4516 5.7 329 232 3006 2.6 64 18 688 1.4 -29 729Mexico 7425 9.4 -37 34 819 0.7 -21 19 309 0.6 -56 51Nigeria 4605 5.8 -32 2 2791 2.4 -41 8 177 0.4 -62 160
Algeria 1887 2.4 -32 5 5950 5.1 -25 12 98 0.2 -41 20Libyan Arab Jamahiriya ... ... ... ... 7560 6.5 -28 25 ... ... ... ...Qatar 109 0.1 -9 276 73 0.1 239 20 3440 6.9 -8 23Korea, Rep. of 325 0.4 53 50 8 0.0 -18 -11 1961 3.9 -31 75Oman ... 0.0 -73 ... 46 0.0 ... 21 1674 3.4 -41 55
Singapore 206 0.3 34 6 1 0.0 267 -91 404 0.8 -52 54Malaysia 289 0.4 3 22 28 0.0 -14 -7 2146 4.3 -24 2Colombia 3641 4.6 -3 64 765 0.7 2 5 17 0.0 29 -6United States - - - - 2163 1.8 -21 -8 941 1.9 -28 -7China 281 0.4 -30 -37 380 0.3 8 -7 1375 2.8 -39 -10
Angola 2564 3.2 -16 5 275 0.2 -19 15 7 0.0 ... -56Germany 299 0.4 19 27 2788 2.4 -16 11 18 0.0 -13 29France 221 0.3 -11 -10 2776 2.4 -6 3 10 0.0 20 -17Belgium-Luxembourg 382 0.5 -8 34 1896 1.6 -21 -23 4 0.0 -20 0South Africa 21 0.0 28 -34 1288 1.1 -1 -1 113 0.2 -26 -40
Syrian Arab Republic 26 0.0 -50 271 1796 1.5 -33 39 0 0.0 ... ...Brunei Darussalam 283 0.4 - 192 0 0.0 - - 1049 2.1 -27 2Gabon 1517 1.9 -42 13 96 0.1 40 -48 33 0.1 -40 6Egypt 61 0.1 -47 7 991 0.8 -27 -14 102 0.2 -50 137Congo 411 0.5 -33 29 190 0.2 -6 -3 0 0.0 - -
Above suppliers 73298 92.5 - - 98037 83.7 - - 48961 98.2 - -

Trad
e by
sec
tor
108
Table IV.23 (continued)
Fuels imports of selected economies by region and supplier, 1999
(Million dollars and percentage)
China Six East Asian traders Total
Annual percentage Annual percentage Annual percentageValue Share change Value Share change Value Share change
1999 1999 1998 1999 1999 1999 1998 1999 1999 1999 1998 1999
Region
World 8912 100.0 -34 32 51499 100.0 -32 24 306733 100.0 -27 18
Middle East 2777 31.2 -19 8 27496 53.4 -34 28 91684 29.9 -29 25
Western Europe 578 6.5 -49 496 598 1.2 -41 35 62829 20.5 -26 16
Asia 4014 45.0 -36 21 17618 34.2 -26 12 44418 14.5 -25 11
Africa 966 10.8 -68 225 3846 7.5 -39 64 36906 12.0 -30 16
Latin America 10 0.1 -14 -92 348 0.7 -56 98 28550 9.3 -29 29
North America 189 2.1 -7 -7 1340 2.6 -38 11 23355 7.6 -20 9
C./E. Europe/
Baltic States/CIS 371 4.2 -64 139 249 0.5 -72 135 17612 5.7 -37 32
Suppliers
Saudi Arabia 618 6.9 -4 11 10430 20.3 -39 19 34715 11.3 -36 19Canada 1 0.0 1150 -96 283 0.5 -1 -26 19175 6.3 -17 13Norway 254 2.9 -59 323 226 0.4 -44 3 18504 6.0 -39 20United Arab Emirates 158 1.8 361 22 4731 9.2 -30 16 13761 4.5 -31 9Netherlands 12 0.1 167 50 30 0.1 -59 -9 11066 3.6 -32 6
Above 5 1043 11.7 3 34 15700 30.5 -36 17 97221 31.7 -32 15
Russian Fed. 328 3.7 -73 183 235 0.5 -61 142 12484 4.1 -43 29United Kingdom 276 3.1 -50 5420 54 0.1 -31 116 11910 3.9 -28 25Venezuela 0 0.0 - - 29 0.1 -78 190 11264 3.7 -32 21Indonesia 586 6.6 -58 27 3867 7.5 -25 31 11155 3.6 -29 23Iran, Islamic Rep. of 597 6.7 9 17 2701 5.2 -40 46 10240 3.3 -27 24
Kuwait 53 0.6 39 -17 3113 6.0 -35 33 9013 2.9 -32 23Australia 251 2.8 -34 115 2436 4.7 -12 -4 8957 2.9 -10 -1Iraq 116 1.3 76 93 599 1.2 ... 226 8925 2.9 110 111Mexico 0 0.0 ... - 4 0.0 -31 -80 8557 2.8 -36 33Nigeria 168 1.9 - 600 514 1.0 -64 9 8255 2.7 -39 8
Algeria 60 0.7 - - 95 0.2 -62 44 8090 2.6 -28 12Libyan Arab Jamahiriya 16 0.2 91 -24 5 0.0 -100 ... 7581 2.5 -28 24Qatar 25 0.3 -64 400 1788 3.5 -29 43 5435 1.8 -15 31Korea, Rep. of 1401 15.7 9 29 1360 2.6 12 10 5055 1.6 -6 38Oman 633 7.1 -48 -10 2564 5.0 -24 26 4917 1.6 -34 27
Singapore 775 8.7 -46 -17 3332 6.5 -35 10 4718 1.5 -38 6Malaysia 183 2.1 17 45 1929 3.7 -40 7 4575 1.5 -30 6Colombia 0 0.0 - - 0 0.0 ... ... 4423 1.4 -2 49United States 188 2.1 -18 6 1057 2.1 -47 29 4349 1.4 -29 -1China - - - - 2262 4.4 -24 18 4298 1.4 -29 0
Angola 356 4.0 -75 133 951 1.8 54 120 4153 1.4 -20 26Germany 13 0.1 80 44 32 0.1 -29 0 3150 1.0 -14 13France 9 0.1 -18 0 66 0.1 -21 22 3082 1.0 -7 2Belgium-Luxembourg 10 0.1 50 233 12 0.0 0 -33 2304 0.8 -19 -16South Africa 55 0.6 -67 1275 403 0.8 -36 27 1880 0.6 -12 2
Syrian Arab Republic 0 0.0 - - 0 0.0 -57 ... 1822 0.6 -33 40Brunei Darussalam 0 0.0 - - 483 0.9 -36 -4 1815 0.6 -26 11Gabon 70 0.8 - - 97 0.2 -28 106 1813 0.6 -39 13Egypt 11 0.1 -48 -48 385 0.7 -20 77 1550 0.5 -29 4Congo 51 0.6 -73 28 880 1.7 -25 49 1532 0.5 -29 34
Above suppliers 7274 81.6 - - 46953 91.2 - - 274523 89.5 - -

Trad
e by
sec
tor
109
Table IV.24
Imports of fuels of selected economies, 1990-99
(Million dollars and percentage)
Share in economy’s totalValue merchandise imports
1990 1996 1997 1998 1999 1990 1999 a
Australia b 2170 3837 3724 2715 3814 5.4 5.9Austria 3146 I 3595 3419 2318 2590 6.4 3.8Bangladesh 566 445 609 524 ... 16.5 7.5Belgium - - - - 9511 - 5.9Belgium-Luxembourg 9622 I 11157 10898 8539 - 8.0 -Brazil 6045 7445 7563 5616 5846 26.8 11.3Bulgaria ... 1712 1499 1085 1030 ... 18.8Chile 1099 1840 1810 1499 ... 14.3 8.0China 1259 6878 10306 6775 8912 2.4 5.4Croatia - 857 850 596 859 - 11.0
Cyprus 270 338 308 243 321 10.5 8.9Czech Rep. b - 2416 2349 1866 1884 - 6.5Finland 3171 I 3252 2985 2387 2674 11.7 8.5France 22331 I 22762 21796 16712 18883 9.5 6.5Germany 31965 I 34996 33456 26294 26438 9.0 5.6Greece 1518 I 2485 1628 2217 1530 7.7 5.1Guatemala 277 466 411 384 447 16.8 10.2Hong Kong, China 1995 4479 4108 3201 3681 2.4 2.0 retained imports 1567 2524 2058 1974 3131 5.0 10.9Hungary 1470 I 2196 2107 1685 1715 14.2 6.1India 6495 11459 10054 8045 ... 27.5 18.8
Indonesia 1937 3670 4047 2686 3695 8.9 15.4Israel 1354 1833 2269 1804 2142 8.1 6.5Italy 18816 I 17409 16512 12027 14181 10.3 6.5Japan 57453 60863 62831 43273 49872 24.4 16.0Jordan 470 535 541 355 450 18.1 12.1Kenya 424 451 530 578 440 20.0 15.4Korea, Rep. of 11023 24284 27381 18195 22875 15.8 19.1Luxembourg - - - - 392 - 3.6Mauritius 132 179 168 138 159 8.2 7.4Morocco 1167 I 1285 1297 ... ... 17.2 13.6
Netherlands 13221 I 14271 14098 10480 12660 10.5 6.7New Zealand 726 929 954 749 883 7.6 6.2Pakistan 1528 2435 2215 1481 2227 20.2 20.7Panama 244 442 419 320 ... 15.9 10.4Peru 327 804 885 649 660 9.4 8.2Philippines 1942 3192 3296 2230 2672 14.9 8.2Poland 2533 3389 3710 I 2964 3281 21.9 7.1Portugal 2733 I 2645 2682 2047 2711 10.8 7.0Romania 2906 2390 2131 1431 1050 38.2 10.1Singapore 9632 12279 12553 8173 10080 15.8 9.1 retained imports 9545 12154 12346 8074 9966 22.2 15.3
Slovak Rep. b - 1890 I 1831 795 1015 - 9.0South Africa b ... 2558 3528 I 2229 2432 ... 10.0Spain 10330 I 11503 11121 8575 9617 11.8 6.6Sri Lanka 332 433 ... ... 306 12.4 5.7Sweden 4963 I 4781 4513 3054 4090 9.1 6.0Taipei, Chinese 5952 8265 9090 6721 8061 10.9 7.3Thailand 3084 6324 5781 3436 4834 9.2 9.6Tunisia 492 644 632 433 556 8.9 6.6Turkey 4622 5894 4993 3621 4427 20.7 10.9Ukraine c - 8430 7846 6065 5383 - 45.4
United States 68741 77063 82545 62152 79273 13.3 7.5Zimbabwe b 288 292 317 ... ... 15.6 10.3
Memorandum item: European Union (15) 139379 I 145101 138407 107227 117177 8.9 5.2 Intra-imports d 37430 I 3.8 Extra-imports 101949 101194 95489 72804 78720 17.7 9.3
a Or nearest year.
b Imports are valued f.o.b.
c Includes Secretariat estimates.
d See the Technical Notes for information on intra-EU imports.

Trad
e by
sec
tor
110
4. Manufactures
Table IV.25
World trade in manufactures, 1999
(Billion dollars and percentage)
Value 4186
Annual percentage change
1980-85 2
1985-90 15
1990-99 6
1997 5
1998 1
1999 4
Share in world merchandise trade 76.5
Table IV.27
Share of manufactures in total merchandise trade by region, 1999(Percentage)
Exports Imports
Share of manufactures in total merchandise
World 76.5 76.5
North America 78.8 82.4
Latin America 60.3 78.0
Western Europe 80.5 76.9
C./E. Europe/Baltic States/CIS 57.1 71.0
Africa 30.3 70.2
Middle East 25.5 75.4
Asia 84.5 72.5
0 10 20 30 40 50 60
Exports
Imports
Western Europe
Asia
North America
Latin America
C./E. Europe/Baltic States/CIS
Africa
Middle East
Chart IV.7
Regional shares in world trade in manufactures, 1999
(Percentage)
Table IV.26
Major regional flows in world exports of manufactures, 1999(Billion dollars and percentage)
Value Annual percentage change
1999 1990-99 1998 1999
Intra-Western Europe 1282.2 4 7 -1
Intra-Asia 504.2 10 -16 14
Asia to North America 343.6 7 3 9
Intra-North America 288.6 9 5 11
Asia to Western Europe 224.1 6 6 4
Western Europe to North America 203.1 7 11 10

Trad
e by
sec
tor
111
Table IV.28
Exports of manufactures by region, 1999
(Billion dollars and percentage)
Share in
Value Region’s exports World exports Annual percentage change
1999 1990 1999 1990 1999 1990-99 1998 1999
World 4186.2 - - 100.0 100.0 6 1 4
Western EuropeWorld 1894.2 100.0 100.0 54.2 45.2 4 4 0 Western Europe 1282.2 70.6 67.7 38.3 30.6 4 7 -1 North America 203.1 8.3 10.7 4.5 4.9 7 11 10 Asia 150.9 8.2 8.0 4.4 3.6 4 -21 1 C./E. Europe/Baltic States/CIS 101.8 4.1 5.4 2.2 2.4 7 4 -8 Latin America 49.8 2.0 2.6 1.1 1.2 8 5 -6 Middle East 48.4 2.8 2.6 1.5 1.2 3 -6 -5 Africa 47.5 3.4 2.5 1.8 1.1 1 6 -7
AsiaWorld 1177.2 100.0 100.0 24.5 28.1 8 -5 9 Asia 504.2 36.0 42.8 8.8 12.0 10 -16 14 North America 343.6 33.0 29.2 8.1 8.2 7 3 9 Western Europe 224.1 22.0 19.0 5.4 5.4 6 6 4 Latin America 31.4 2.0 2.7 0.5 0.7 12 5 -8 Middle East 29.2 2.9 2.5 0.7 0.7 6 12 -10 Africa 16.8 1.4 1.4 0.3 0.4 8 5 0 C./E. Europe/Baltic States/CIS 10.6 1.5 0.9 0.4 0.3 2 -9 -10
North AmericaWorld 736.1 100.0 100.0 15.2 17.6 8 2 5 North America 288.6 35.9 39.2 5.5 6.9 9 5 11 Asia 151.4 23.1 20.6 3.5 3.6 7 -13 4 Western Europe 147.3 25.1 20.0 3.8 3.5 5 8 4 Latin America 120.0 11.7 16.3 1.8 2.9 12 6 1 Middle East 17.4 2.3 2.4 0.3 0.4 9 18 -13 All other regions 11.2 1.9 1.5 0.3 0.3 6 2 -18
Latin AmericaWorld 179.1 100.0 100.0 2.3 4.3 14 10 9 North America 136.3 59.7 76.1 1.4 3.3 17 15 20 Latin America 25.5 16.6 14.2 0.4 0.6 12 -2 -24 Western Europe 10.7 13.2 6.0 0.3 0.3 4 14 1 Asia 4.5 7.4 2.5 0.2 0.1 1 -23 3 All other regions 1.4 3.1 0.8 0.1 0.0 -2 -9 -22
C./E. Europe/Baltic States/CIS aWorld 122.3 100.0 100.0 2.1 I 2.9 … 9 -2 Western Europe 77.6 43.5 63.5 0.9 1.9 15 24 5 C./E. Europe/Baltic States/CIS 24.1 32.0 I 19.7 0.7 I 0.6 … -9 -20 Asia 8.1 12.3 6.6 0.3 0.2 3 -24 14 North America 5.6 2.4 4.6 0.0 0.1 19 21 -16 Middle East 2.3 3.4 1.9 0.1 0.1 3 16 -18 Latin America 1.8 3.5 1.4 0.1 0.0 0 10 9 Africa 1.7 2.9 1.4 0.1 0.0 2 0 5
Middle EastWorld 43.4 100.0 100.0 0.8 1.0 9 0 11 Western Europe 12.4 32.4 28.6 0.3 0.3 8 7 2 North America 10.3 16.4 23.8 0.1 0.2 14 16 11 Asia 7.3 19.6 16.8 0.2 0.2 7 -24 19 Middle East 6.5 17.9 15.0 0.1 0.2 7 2 10 Africa 2.3 2.6 5.2 0.0 0.1 18 16 18 All other regions 1.5 7.5 3.4 0.1 0.0 0 2 -16
AfricaWorld 34.0 100.0 100.0 0.9 0.8 6 -2 9 Western Europe 19.6 62.1 57.5 0.5 0.5 5 3 5 Africa 5.5 11.6 16.2 0.1 0.1 10 -13 15 North America 3.3 5.9 9.7 0.1 0.1 12 9 11 Asia 3.2 10.5 9.5 0.1 0.1 4 -17 8 All other regions 1.4 9.4 4.0 0.1 0.0 -4 -4 -4
a Includes the intra trade of the Baltic States and the CIS beginning with 1996.
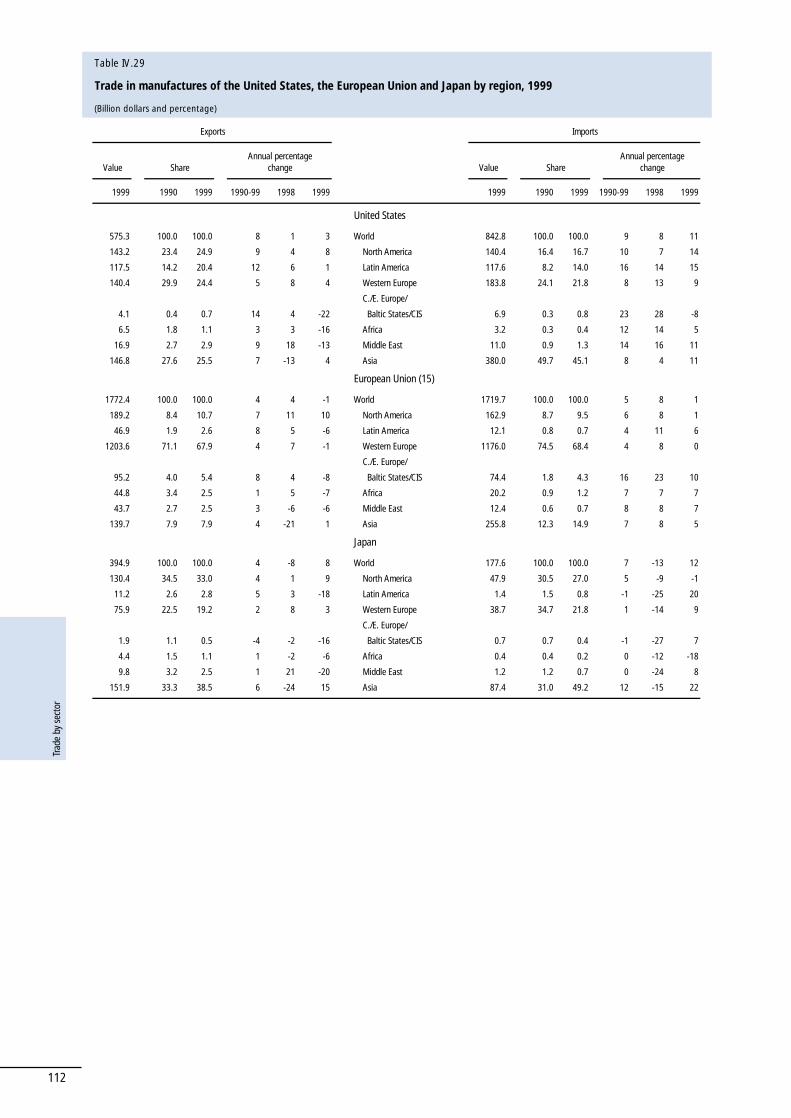
Trad
e by
sec
tor
112
Table IV.29
Trade in manufactures of the United States, the European Union and Japan by region, 1999
(Billion dollars and percentage)
Exports Imports
Annual percentage Annual percentageValue Share change Value Share change
1999 1990 1999 1990-99 1998 1999 1999 1990 1999 1990-99 1998 1999
United States
575.3 100.0 100.0 8 1 3 World 842.8 100.0 100.0 9 8 11
143.2 23.4 24.9 9 4 8 North America 140.4 16.4 16.7 10 7 14
117.5 14.2 20.4 12 6 1 Latin America 117.6 8.2 14.0 16 14 15
140.4 29.9 24.4 5 8 4 Western Europe 183.8 24.1 21.8 8 13 9
C./E. Europe/
4.1 0.4 0.7 14 4 -22 Baltic States/CIS 6.9 0.3 0.8 23 28 -8
6.5 1.8 1.1 3 3 -16 Africa 3.2 0.3 0.4 12 14 5
16.9 2.7 2.9 9 18 -13 Middle East 11.0 0.9 1.3 14 16 11
146.8 27.6 25.5 7 -13 4 Asia 380.0 49.7 45.1 8 4 11
European Union (15)
1772.4 100.0 100.0 4 4 -1 World 1719.7 100.0 100.0 5 8 1
189.2 8.4 10.7 7 11 10 North America 162.9 8.7 9.5 6 8 1
46.9 1.9 2.6 8 5 -6 Latin America 12.1 0.8 0.7 4 11 6
1203.6 71.1 67.9 4 7 -1 Western Europe 1176.0 74.5 68.4 4 8 0
C./E. Europe/
95.2 4.0 5.4 8 4 -8 Baltic States/CIS 74.4 1.8 4.3 16 23 10
44.8 3.4 2.5 1 5 -7 Africa 20.2 0.9 1.2 7 7 7
43.7 2.7 2.5 3 -6 -6 Middle East 12.4 0.6 0.7 8 8 7
139.7 7.9 7.9 4 -21 1 Asia 255.8 12.3 14.9 7 8 5
Japan
394.9 100.0 100.0 4 -8 8 World 177.6 100.0 100.0 7 -13 12
130.4 34.5 33.0 4 1 9 North America 47.9 30.5 27.0 5 -9 -1
11.2 2.6 2.8 5 3 -18 Latin America 1.4 1.5 0.8 -1 -25 20
75.9 22.5 19.2 2 8 3 Western Europe 38.7 34.7 21.8 1 -14 9
C./E. Europe/
1.9 1.1 0.5 -4 -2 -16 Baltic States/CIS 0.7 0.7 0.4 -1 -27 7
4.4 1.5 1.1 1 -2 -6 Africa 0.4 0.4 0.2 0 -12 -18
9.8 3.2 2.5 1 21 -20 Middle East 1.2 1.2 0.7 0 -24 8
151.9 33.3 38.5 6 -24 15 Asia 87.4 31.0 49.2 12 -15 22

Trad
e by
sec
tor
113
Table IV.30
Leading exporters and importers of manufactures, 1999
(Billion dollars and percentage)
Share in world Value exports/imports Annual percentage change
1999 1980 1990 1999 1990-99 1997 1998 1999
Exporters
United States 575.3 13.0 12.2 13.7 8 14 1 3
Germany 452.0 14.8 15.7 10.8 2 -1 5 -3
Japan 392.7 11.2 11.5 9.4 4 2 -8 7
France 238.7 7.4 6.7 5.7 4 -1 8 -1
United Kingdom 225.0 7.5 6.1 5.4 5 9 -1 -3
Italy 202.1 6.0 6.2 4.8 4 -6 2 -6
China a 172.1 0.8 1.9 4.1 16 23 3 7
Hong Kong, China 164.7 - - - 9 5 -7 1
domestic exports 20.9 1.2 1.1 0.5 -3 -1 -10 -9
re-exports 143.8 - - - 13 6 -6 3
Canada 159.0 2.7 3.1 3.8 9 7 4 13
Belgium 139.0 - - 3.3 - - - -
Korea, Rep. of 128.7 1.4 2.5 3.1 9 3 -3 13
Netherlands 118.5 3.4 3.3 2.8 5 17 -10 1
Taipei, Chinese 116.5 1.6 2.6 2.8 7 7 -9 9
Mexico a 115.1 0.2 1.1 2.8 18 19 12 15
Singapore 98.5 0.8 1.6 2.4 11 1 -11 6
domestic exports 57.7 0.3 1.0 1.4 10 0 -10 8
re-exports 40.9 0.5 0.6 1.0 13 1 -13 3
Above 15 3154.1 75.9 79.2 75.3 - - - -
Importers
United States 842.8 11.2 15.4 19.3 9 10 8 11
Germany 326.6 8.8 10.3 7.5 3 -4 10 -5
United Kingdom 264.7 6.4 6.9 6.1 5 9 4 2
France 228.2 6.5 7.0 5.2 3 -3 12 0
Canada b 183.5 3.7 3.8 4.2 8 17 4 8
Japan 177.6 2.3 4.1 4.1 7 -4 -13 12
Hong Kong, China 161.0 - - - 10 6 -11 -2
retained imports 17.2 1.1 0.9 0.4 -3 6 -32 -29
Italy 153.3 4.0 4.6 3.5 3 2 9 0
China a 132.8 1.1 1.7 3.0 14 0 3 17
Mexico a, b 125.6 1.3 1.3 2.9 16 25 13 19
Belgium 125.5 - - 2.9 - - - -
Netherlands 121.1 3.7 3.6 2.8 3 5 -1 1
Spain 109.9 1.1 2.5 2.5 7 2 14 8
Singapore 92.4 1.2 1.8 2.1 8 0 -21 8
retained imports 51.5 0.7 1.3 1.2 6 -1 -28 13
Taipei, Chinese 86.1 0.9 1.5 2.0 10 12 -4 9
Above 15 2987.4 56.7 69.1 68.5 - - - -
a Includes significant shipments through processing zones.
b Imports are valued f.o.b.

Trad
e by
sec
tor
114
Table IV.31
Exports of manufactures of selected economies, 1990-99
(Billion dollars and percentage)
Share in economy’s totalValue merchandise exports
1990 1996 1997 1998 1999 1990 1999 a
World 2390.00 I 3787.10 3990.90 4044.00 4186.20 70.5 76.5
Argentina 3.57 7.15 9.07 9.22 7.28 28.9 31.2Australia 6.90 16.11 16.77 14.06 14.94 17.4 26.6Austria 36.79 I 50.87 51.63 50.46 49.43 89.1 77.9Belgium b - - - - 138.99 - 78.9Belgium-Luxembourg b 91.19 I 129.47 132.17 139.73 - 77.5 -Brazil 16.14 25.19 27.97 27.51 25.51 51.4 53.1Bulgaria … 2.94 3.02 2.65 2.43 … 59.7Canada 73.31 125.84 134.79 140.24 159.03 57.4 66.7China c 44.31 127.26 155.91 160.34 172.06 71.4 88.2Croatia - 3.27 3.01 3.47 3.24 - 75.8
Czech Rep. c - 18.37 19.47 23.00 23.66 - 88.1Denmark 20.93 I 29.02 29.95 30.98 33.50 56.8 68.3Egypt 1.09 1.12 1.49 1.41 … 42.3 44.0Finland 22.12 I 33.72 34.10 37.02 35.60 83.3 85.4France 161.31 I 224.67 221.32 240.11 238.72 74.5 79.5Germany 375.65 I 450.68 445.78 468.07 451.98 89.2 83.5Greece 4.26 I 5.70 5.55 5.82 5.00 52.5 44.9Hong Kong, China 75.64 166.88 174.52 162.91 164.70 91.8 94.4 domestic exports 27.41 25.62 25.48 23.06 20.89 94.5 93.3 re-exports 48.23 141.26 149.04 139.85 143.82 90.3 94.6Hungary c 6.28 I 11.72 14.95 19.03 21.57 62.8 86.2India b 12.52 24.13 25.73 25.21 … 69.7 75.0
Indonesia 9.04 25.55 22.49 21.55 26.20 35.2 53.8Ireland 16.44 I 36.91 43.07 53.48 59.50 69.2 84.5Israel b 10.43 18.67 20.71 21.51 24.06 86.3 93.3Italy 148.08 I 225.15 212.48 215.98 202.06 87.0 87.6Japan 275.13 389.78 398.00 365.56 392.69 95.7 93.6Korea, Rep. of 60.60 114.92 118.24 114.21 128.67 93.2 88.9Luxembourg - - - - 6.23 - 80.3Macau, China 1.67 2.01 2.21 2.07 2.14 98.6 99.5Malaysia c 15.82 59.28 60.18 57.66 67.84 53.8 80.3Mauritius 0.80 1.15 1.14 1.23 1.16 67.3 74.7
Mexico c 25.26 74.70 88.82 99.88 115.13 62.0 84.2Morocco c 2.21 I 2.39 2.31 … … 51.8 32.8Netherlands 77.82 I 111.23 130.65 117.76 118.54 59.1 59.2New Zealand 2.39 4.23 4.32 3.78 3.98 25.2 31.9Norway 11.13 11.23 11.76 11.96 12.15 32.7 27.1Pakistan 4.39 7.82 7.51 7.14 7.48 78.6 84.2Philippines c 5.66 17.01 21.60 26.46 32.16 70.1 87.7Poland 8.47 18.11 18.72 I 21.77 21.54 59.1 78.6Portugal 13.07 I 19.76 20.09 20.96 20.11 79.6 84.1Romania 3.60 6.20 6.60 6.69 6.66 72.6 78.3
Russian Fed. d - 26.25 23.57 23.14 24.40 - 32.8Singapore 37.55 104.12 104.75 92.93 98.54 71.2 85.9 domestic exports 23.76 59.26 59.34 53.20 57.68 68.2 84.0 re-exports 13.79 44.86 45.42 39.73 40.87 77.0 88.8Slovak Rep. - 7.24 I 8.08 9.01 8.40 - 81.9Slovenia - 7.49 7.47 8.14 … - 89.9Spain 41.68 I 78.71 80.46 84.72 84.44 74.9 76.7Sweden 47.45 I 66.83 64.91 67.47 65.62 82.5 77.3Switzerland 59.59 75.69 70.69 73.31 74.07 93.4 92.2Taipei, Chinese 62.05 109.23 117.22 107.13 116.52 92.4 95.8Thailand 14.58 39.67 41.24 39.33 43.09 63.2 73.8Tunisia 2.42 4.40 4.34 4.72 4.61 68.5 78.0
Turkey 8.78 17.00 19.65 20.66 20.85 67.7 80.1United Kingdom 146.71 I 215.54 234.37 233.14 224.98 79.2 83.6United States 290.49 484.57 553.51 558.11 575.33 73.8 82.8
Memorandum item: European Union (15) 1203.33 I 1678.25 1711.76 1781.86 1772.40 79.8 81.3 Intra-exports 771.74 I 1020.39 1022.65 1099.22 1095.26 78.8 79.1 Extra-exports 431.60 657.86 689.11 682.64 677.14 81.6 85.1
a Or nearest year.
b Includes significant exports of diamonds. For the most recent year, the share of diamonds in exports of manufactures was 9 per cent for Belgium, 19 per cent for India,
and 32 per cent for Israel.
c Includes significant exports from processing zones.
d Includes Secretariat estimates.

Trad
e by
sec
tor
115
Table IV.32
Imports of manufactures of selected economies, 1990-99
(Billion dollars and percentage)
Share in economy’s totalValue merchandise imports
1990 1996 1997 1998 1999 1990 1999 a
Algeria 6.66 5.75 5.42 … … 68.6 62.3Argentina 3.10 20.65 26.61 27.50 22.59 76.0 88.7Australia b 31.61 52.21 52.62 51.40 55.47 78.9 85.3Austria 40.67 I 55.05 52.68 56.07 55.41 82.8 80.6Belgium c - - - - 125.48 - 78.0Belgium-Luxembourg c 88.78 I 120.37 121.25 131.04 - 74.2 -Brazil 12.62 39.70 48.13 46.45 39.24 56.0 75.8Canada b 92.90 139.37 162.50 169.70 183.52 79.7 85.1Chile 5.29 13.12 14.39 13.79 … 68.9 73.4China d 42.39 109.64 109.63 113.05 132.77 79.5 80.1
Colombia 4.28 10.61 12.14 11.63 8.41 76.5 78.9Croatia - 5.35 6.61 6.29 5.70 - 73.3Czech Rep. b, d - 21.74 21.38 23.32 23.72 - 82.3Denmark 23.07 I 30.62 32.40 35.14 35.41 69.2 79.9Egypt 5.18 7.79 8.23 9.73 … 56.2 60.2Finland 20.56 I 22.42 22.68 24.78 23.82 76.2 75.6France 172.11 I 208.53 203.27 227.18 228.19 73.4 78.7Germany 252.63 I 327.65 313.56 343.85 326.65 71.0 69.1Greece 13.90 I 20.28 18.27 22.39 20.20 70.3 66.9Hong Kong, China 70.53 174.81 184.65 164.10 161.03 83.2 89.1 retained imports 22.30 33.55 35.61 24.25 17.21 71.2 60.0
Hungary d 7.27 I 13.94 16.97 21.67 24.23 70.3 86.5India c 12.17 19.08 20.72 20.09 … 51.5 47.0Indonesia 16.64 30.57 30.40 18.89 12.18 76.2 50.7Ireland 15.74 I 27.44 31.05 35.88 37.71 76.1 81.3Israel c 11.68 24.53 23.47 22.57 25.87 69.5 78.0Italy 113.13 I 137.93 140.43 152.90 153.34 62.2 70.7Japan 99.95 189.55 182.76 158.73 177.63 42.5 57.1Korea, Rep. of 44.10 96.69 87.97 54.51 74.52 63.1 62.2Kuwait 2.61 6.72 6.59 6.87 5.95 65.6 78.1Luxembourg - - - - 7.74 - 71.1
Malaysia d 22.87 64.51 65.15 48.64 54.33 78.2 83.6Mauritius 1.28 1.61 1.63 1.60 1.70 79.2 79.6Mexico b, d 32.48 74.80 93.51 105.89 125.60 80.6 86.3Netherlands 88.95 I 115.16 121.43 119.89 121.07 70.5 64.5New Zealand 7.56 12.02 11.81 9.03 11.79 79.6 82.4Norway 21.40 26.93 28.79 30.82 27.57 78.6 81.0Pakistan 3.99 6.77 6.06 5.05 5.53 52.8 51.3Peru 1.61 5.66 6.27 5.99 4.98 46.5 61.7Philippines d 8.96 26.88 30.59 25.26 25.86 68.7 79.5Poland 7.26 27.83 32.77 I 37.76 36.88 62.8 80.3
Portugal 18.11 I 25.03 25.50 28.30 28.14 71.7 72.9Romania 2.95 7.37 7.66 8.62 8.00 38.8 77.0Russian Fed. e - 45.88 49.16 40.63 27.70 - 67.4Saudi Arabia 18.23 20.19 20.77 21.96 … 75.7 73.2Singapore 44.42 108.47 108.57 85.25 92.42 72.9 83.2 retained imports 30.63 63.61 63.15 45.51 51.55 71.2 79.2Slovak Rep. b - 7.70 I 8.27 9.96 8.29 - 73.7Slovenia - 7.19 7.09 8.04 … - 79.5South Africa b … 19.23 19.34 I 18.41 17.17 … 70.6Spain 61.65 I 88.63 90.00 102.17 109.89 70.3 75.9Sweden 42.77 I 50.68 49.56 52.18 51.96 78.8 75.9
Switzerland 58.01 67.54 63.50 67.02 68.09 83.3 85.2Taipei, Chinese 36.77 73.87 82.63 79.29 86.11 67.1 77.8Thailand 24.83 56.24 48.35 32.90 38.92 74.4 77.4Tunisia 3.91 5.80 5.96 6.58 6.65 70.5 78.5Turkey 13.63 29.55 34.95 34.64 29.87 61.1 73.4United Kingdom 169.49 I 229.98 250.29 260.06 264.68 76.0 82.6United States 375.65 634.20 698.99 757.56 842.84 72.7 79.6Venezuela b 5.05 6.82 10.67 11.68 11.02 76.5 81.3
Memorandum item: European Union (15) 1121.53 I 1539.52 1567.07 1697.14 1719.68 72.0 77.0 Intra-imports f 772.63 I 78.7 Extra-imports 348.89 519.13 544.43 597.92 624.42 60.5 74.0
a Or nearest year.b Imports are valued f.o.b.c Includes significant imports of diamonds. For the most recent year, the share of diamonds in total imports of manufactures was 9 per cent for Belgium, 18 per cent for Indiaand 22 per cent for Israel.d Includes significant imports into processing zones.e Includes Secretariat estimates.f See the Technical Notes for information on intra-EU imports.

Trad
e by
sec
tor
116
4.1 Iron and steel
Table IV.33
World trade in iron and steel, 1999
(Billion dollars and percentage)
Value 126
Annual percentage change
1980-85 -2
1985-90 9
1990-99 2
1997 3
1998 -2
1999 -11
Share in world merchandise trade 2.3
Share in world exports of manufactures 3.0
Table IV.35
Share of iron and steel in trade in total merchandiseand in manufactures by region, 1999(Percentage)
Exports Imports
Share of iron and steel in total merchandise
World 2.3 2.3
North America 0.9 1.6
Latin America 2.4 2.0
Western Europe 2.7 2.5
C./E. Europe/Baltic States/CIS 6.9 3.0
Africa 2.3 3.1
Middle East 0.6 3.4
Asia 2.1 2.5
Share of iron and steel in manufactures
World 3.0 3.0
North America 1.1 2.0
Latin America 3.9 2.6
Western Europe 3.3 3.2
C./E. Europe/Baltic States/CIS 12.1 4.2
Africa 7.6 4.5
Middle East 2.5 4.5
Asia 2.5 3.50 10 20 30 40 50 60
Exports
Imports
Western Europe
Asia
North America
Latin America
C./E. Europe/Baltic States/CIS
Africa
Middle East
Chart IV.8
Regional shares in world trade in iron and steel, 1999
(Percentage)
Table IV.34
Major regional flows in world exports of iron and steel, 1999(Billion dollars and percentage)
Value Annual percentage change
1999 1990-99 1998 1999
Intra-Western Europe 47.5 0 6 -10
Intra-Asia 20.3 5 -24 4
Intra-North America 5.5 7 -1 -5
Western Europe to North America 4.9 1 -5 -3
C./E. Europe/Baltic States/CIS to
Western Europe 4.9 6 5 -14
Asia to North America 4.4 2 76 -33
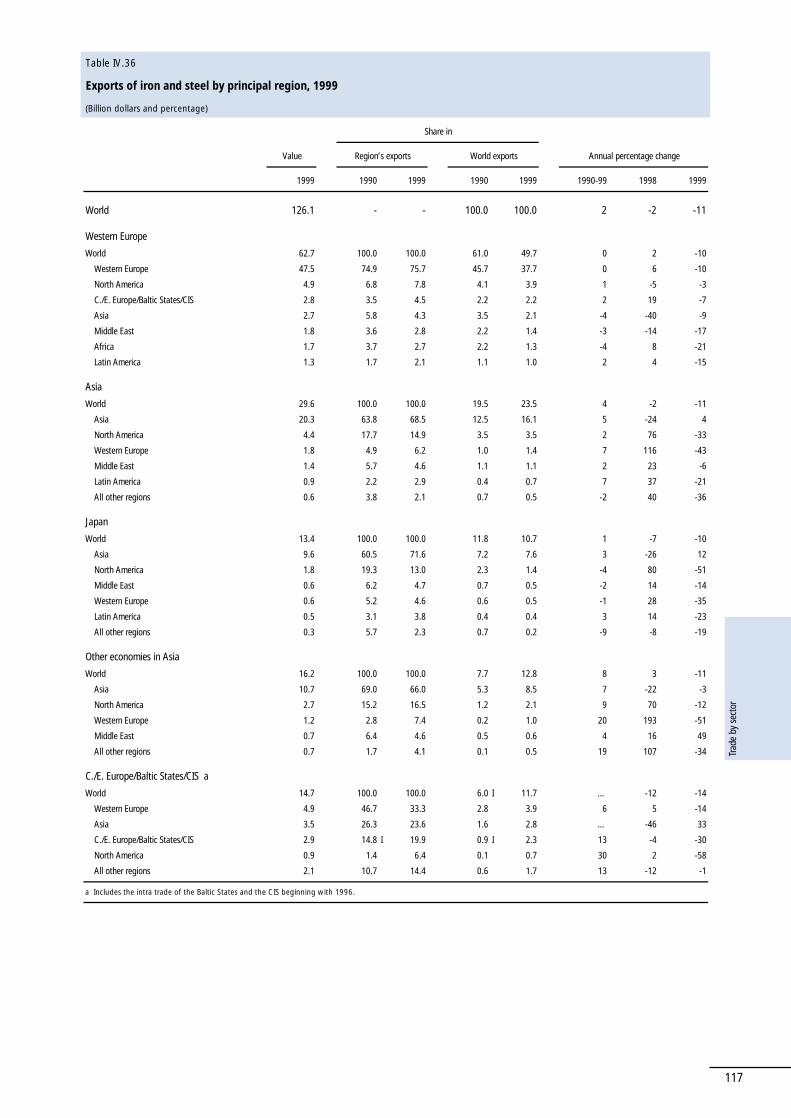
Trad
e by
sec
tor
117
Table IV.36
Exports of iron and steel by principal region, 1999
(Billion dollars and percentage)
Share in
Value Region’s exports World exports Annual percentage change
1999 1990 1999 1990 1999 1990-99 1998 1999
World 126.1 - - 100.0 100.0 2 -2 -11
Western Europe
World 62.7 100.0 100.0 61.0 49.7 0 2 -10
Western Europe 47.5 74.9 75.7 45.7 37.7 0 6 -10
North America 4.9 6.8 7.8 4.1 3.9 1 -5 -3
C./E. Europe/Baltic States/CIS 2.8 3.5 4.5 2.2 2.2 2 19 -7
Asia 2.7 5.8 4.3 3.5 2.1 -4 -40 -9
Middle East 1.8 3.6 2.8 2.2 1.4 -3 -14 -17
Africa 1.7 3.7 2.7 2.2 1.3 -4 8 -21
Latin America 1.3 1.7 2.1 1.1 1.0 2 4 -15
Asia
World 29.6 100.0 100.0 19.5 23.5 4 -2 -11
Asia 20.3 63.8 68.5 12.5 16.1 5 -24 4
North America 4.4 17.7 14.9 3.5 3.5 2 76 -33
Western Europe 1.8 4.9 6.2 1.0 1.4 7 116 -43
Middle East 1.4 5.7 4.6 1.1 1.1 2 23 -6
Latin America 0.9 2.2 2.9 0.4 0.7 7 37 -21
All other regions 0.6 3.8 2.1 0.7 0.5 -2 40 -36
Japan
World 13.4 100.0 100.0 11.8 10.7 1 -7 -10
Asia 9.6 60.5 71.6 7.2 7.6 3 -26 12
North America 1.8 19.3 13.0 2.3 1.4 -4 80 -51
Middle East 0.6 6.2 4.7 0.7 0.5 -2 14 -14
Western Europe 0.6 5.2 4.6 0.6 0.5 -1 28 -35
Latin America 0.5 3.1 3.8 0.4 0.4 3 14 -23
All other regions 0.3 5.7 2.3 0.7 0.2 -9 -8 -19
Other economies in Asia
World 16.2 100.0 100.0 7.7 12.8 8 3 -11
Asia 10.7 69.0 66.0 5.3 8.5 7 -22 -3
North America 2.7 15.2 16.5 1.2 2.1 9 70 -12
Western Europe 1.2 2.8 7.4 0.2 1.0 20 193 -51
Middle East 0.7 6.4 4.6 0.5 0.6 4 16 49
All other regions 0.7 1.7 4.1 0.1 0.5 19 107 -34
C./E. Europe/Baltic States/CIS a
World 14.7 100.0 100.0 6.0 I 11.7 … -12 -14
Western Europe 4.9 46.7 33.3 2.8 3.9 6 5 -14
Asia 3.5 26.3 23.6 1.6 2.8 … -46 33
C./E. Europe/Baltic States/CIS 2.9 14.8 I 19.9 0.9 I 2.3 13 -4 -30
North America 0.9 1.4 6.4 0.1 0.7 30 2 -58
All other regions 2.1 10.7 14.4 0.6 1.7 13 -12 -1
a Includes the intra trade of the Baltic States and the CIS beginning with 1996.
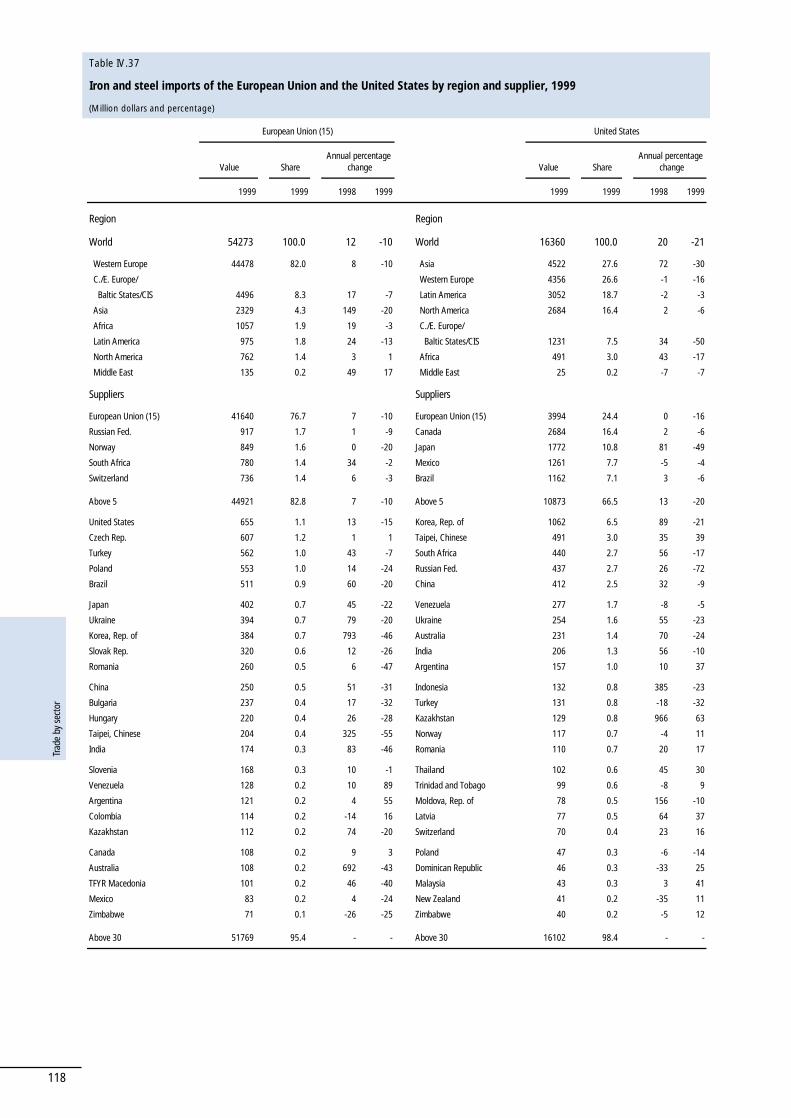
Trad
e by
sec
tor
118
Table IV.37
Iron and steel imports of the European Union and the United States by region and supplier, 1999
(Million dollars and percentage)
European Union (15) United States
Annual percentage Annual percentageValue Share change Value Share change
1999 1999 1998 1999 1999 1999 1998 1999
Region Region
World 54273 100.0 12 -10 World 16360 100.0 20 -21
Western Europe 44478 82.0 8 -10 Asia 4522 27.6 72 -30
C./E. Europe/ Western Europe 4356 26.6 -1 -16
Baltic States/CIS 4496 8.3 17 -7 Latin America 3052 18.7 -2 -3
Asia 2329 4.3 149 -20 North America 2684 16.4 2 -6
Africa 1057 1.9 19 -3 C./E. Europe/
Latin America 975 1.8 24 -13 Baltic States/CIS 1231 7.5 34 -50
North America 762 1.4 3 1 Africa 491 3.0 43 -17
Middle East 135 0.2 49 17 Middle East 25 0.2 -7 -7
Suppliers Suppliers
European Union (15) 41640 76.7 7 -10 European Union (15) 3994 24.4 0 -16
Russian Fed. 917 1.7 1 -9 Canada 2684 16.4 2 -6
Norway 849 1.6 0 -20 Japan 1772 10.8 81 -49
South Africa 780 1.4 34 -2 Mexico 1261 7.7 -5 -4
Switzerland 736 1.4 6 -3 Brazil 1162 7.1 3 -6
Above 5 44921 82.8 7 -10 Above 5 10873 66.5 13 -20
United States 655 1.1 13 -15 Korea, Rep. of 1062 6.5 89 -21
Czech Rep. 607 1.2 1 1 Taipei, Chinese 491 3.0 35 39
Turkey 562 1.0 43 -7 South Africa 440 2.7 56 -17
Poland 553 1.0 14 -24 Russian Fed. 437 2.7 26 -72
Brazil 511 0.9 60 -20 China 412 2.5 32 -9
Japan 402 0.7 45 -22 Venezuela 277 1.7 -8 -5
Ukraine 394 0.7 79 -20 Ukraine 254 1.6 55 -23
Korea, Rep. of 384 0.7 793 -46 Australia 231 1.4 70 -24
Slovak Rep. 320 0.6 12 -26 India 206 1.3 56 -10
Romania 260 0.5 6 -47 Argentina 157 1.0 10 37
China 250 0.5 51 -31 Indonesia 132 0.8 385 -23
Bulgaria 237 0.4 17 -32 Turkey 131 0.8 -18 -32
Hungary 220 0.4 26 -28 Kazakhstan 129 0.8 966 63
Taipei, Chinese 204 0.4 325 -55 Norway 117 0.7 -4 11
India 174 0.3 83 -46 Romania 110 0.7 20 17
Slovenia 168 0.3 10 -1 Thailand 102 0.6 45 30
Venezuela 128 0.2 10 89 Trinidad and Tobago 99 0.6 -8 9
Argentina 121 0.2 4 55 Moldova, Rep. of 78 0.5 156 -10
Colombia 114 0.2 -14 16 Latvia 77 0.5 64 37
Kazakhstan 112 0.2 74 -20 Switzerland 70 0.4 23 16
Canada 108 0.2 9 3 Poland 47 0.3 -6 -14
Australia 108 0.2 692 -43 Dominican Republic 46 0.3 -33 25
TFYR Macedonia 101 0.2 46 -40 Malaysia 43 0.3 3 41
Mexico 83 0.2 4 -24 New Zealand 41 0.2 -35 11
Zimbabwe 71 0.1 -26 -25 Zimbabwe 40 0.2 -5 12
Above 30 51769 95.4 - - Above 30 16102 98.4 - -

Trad
e by
sec
tor
119
Table IV.38
Leading exporters and importers of iron and steel, 1999
(Billion dollars and percentage)
Share in world Value exports/imports Annual percentage change
1999 1980 1990 1999 1990-99 1997 1998 1999
Exporters
Japan 13.44 20.4 11.8 10.7 1 5 -7 -10
Germany 12.57 15.1 15.1 10.0 -3 0 2 -20
France 8.63 9.5 8.5 6.8 0 -5 2 -9
Belgium 7.54 - - 6.0 - - - -
Korea, Rep. of 5.91 2.2 3.4 4.7 6 9 26 -18
Italy 5.80 4.9 5.6 4.6 0 -4 -1 -20
United States 5.45 4.2 3.3 4.3 5 18 -3 -10
Russian Fed. a 4.94 - - 3.9 - -4 -26 -18
United Kingdom 4.21 3.0 5.1 3.3 -3 -7 -7 -24
Ukraine a 4.01 - - 3.2 - 25 -9 -7
Taipei, Chinese 3.55 0.4 0.8 2.8 17 28 -2 12
Sweden 3.25 3.0 3.2 2.6 -1 -5 -11 -10
Brazil 3.10 1.1 3.4 2.5 -2 -7 -6 -15
Spain 2.98 2.5 2.6 2.4 1 -5 -5 -12
Canada 2.89 2.3 1.9 2.3 4 -1 1 -8
Above 15 88.27 75.4 72.1 70.0 - - - -
Memorandum item:
European Union (15) 58.54 52.9 57.0 46.4 0 -3 2 -11
Intra-exports 41.64 30.9 39.5 33.0 0 -1 7 -10
Extra-exports 16.90 22.0 17.5 13.4 -1 -6 -7 -12
Importers
United States 16.36 10.1 9.5 11.9 5 5 20 -21
Germany 9.88 8.3 11.5 7.2 -3 -7 10 -23
China 7.50 … 2.5 5.4 11 -8 -3 16
France 7.47 6.6 7.0 5.4 -1 -2 14 -15
Italy 7.24 5.1 6.1 5.3 1 2 13 -21
Belgium 4.36 - - 3.2 - - - -
Canada b 4.25 1.6 2.0 3.1 7 33 7 -10
Taipei, Chinese 4.19 1.4 2.5 3.0 4 8 -20 -5
United Kingdom 4.17 4.2 4.3 3.0 -2 -1 -2 -24
Spain 4.08 1.0 2.3 3.0 5 5 15 -8
Korea, Rep. of 4.00 1.2 2.9 2.9 2 -14 -50 42
Netherlands 3.24 2.9 3.6 2.4 -2 -10 5 -19
Mexico b 3.05 2.2 1.0 2.2 12 24 14 -9
Hong Kong, China 3.00 - - - 8 -3 -10 -15
retained imports 1.21 0.8 0.8 0.9 3 2 -9 -10
Japan 2.95 1.1 4.1 2.1 -5 -1 -28 -8
Above 15 83.94 49.8 63.1 61.0 - - - -
a Includes Secretariat estimates.
b Imports are valued f.o.b.

Trad
e by
sec
tor
120
4.2 Chemicals
Table IV.39
World trade in chemicals, 1999
(Billion dollars and percentage)
Value 526
Annual percentage change
1980-85 1
1985-90 14
1990-99 7
1997 4
1998 1
1999 4
Share in world merchandise trade 9.6
Share in world exports of manufactures 12.6
Table IV.41
Share of chemicals in trade in total merchandise andin manufactures by region, 1999(Percentage)
Exports Imports
Share of chemicals in total merchandise
World 9.6 9.6
North America 9.1 6.5
Latin America 4.8 11.3
Western Europe 13.2 11.1
C./E. Europe/Baltic States/CIS 6.6 10.3
Africa 5.0 10.7
Middle East 6.5 8.5
Asia 6.1 9.5
Share of chemicals in manufactures
World 12.6 12.6
North America 11.6 7.9
Latin America 8.0 14.5
Western Europe 16.4 14.4
C./E. Europe/Baltic States/CIS 11.5 14.6
Africa 16.6 15.3
Middle East 25.7 11.2
Asia 7.2 13.1
0 10 20 30 40 50 60
Exports
Imports
Western Europe
Asia
North America
Latin America
C./E. Europe/Baltic States/CIS
Africa
Middle East
Chart IV.9
Regional shares in world trade in chemicals, 1999
(Percentage)
Table IV.40
Major regional flows in world exports of chemicals, 1999
(Billion dollars and percentage)
Value Annual percentage change
1999 1990-99 1998 1999
Intra-Western Europe 208.4 5 8 0
Intra-Asia 54.0 11 -13 15
Western Europe to North America 34.4 12 12 23
Western Europe to Asia 26.7 5 -16 15
Intra-North America 25.4 10 3 7
North America to Western Europe 21.8 6 6 3

Trad
e by
sec
tor
121
Table IV.42
Exports of chemicals by principal region, 1999
(Billion dollars and percentage)
Share in
Value Region’s exports World exports Annual percentage change
1999 1990 1999 1990 1999 1990-99 1998 1999
World 525.7 - - 100.0 100.0 7 1 4
Western Europe
World 310.7 100.0 100.0 65.1 59.1 5 6 2
Western Europe 208.4 70.2 67.1 45.7 39.6 5 8 0
North America 34.4 6.5 11.1 4.2 6.5 12 12 23
Asia 26.7 9.2 8.6 6.0 5.1 5 -16 15
C./E. Europe/Baltic States/CIS 14.9 4.0 4.8 2.6 2.8 7 -1 -6
Latin America 9.0 2.6 2.9 1.7 1.7 7 1 -3
Africa 7.5 3.5 2.4 2.3 1.4 1 2 -7
Middle East 7.0 2.9 2.3 1.9 1.3 2 -1 -4
North America
World 85.0 100.0 100.0 15.6 16.2 7 -2 4
North America 25.4 23.2 29.9 3.6 4.8 10 3 7
Western Europe 21.8 27.0 25.6 4.2 4.1 6 6 3
Asia 20.9 32.2 24.6 5.0 4.0 4 -17 9
Latin America 14.8 14.0 17.4 2.2 2.8 10 4 -3
All other regions 1.1 1.4 1.2 0.2 0.2 5 -9 6
Asia
World 84.7 100.0 100.0 11.4 16.1 11 -6 11
Asia 54.0 62.0 63.7 7.1 10.3 11 -13 15
Western Europe 12.9 16.1 15.2 1.8 2.4 10 7 5
North America 11.4 13.2 13.4 1.5 2.2 11 2 8
Latin America 1.9 1.2 2.3 0.1 0.4 18 16 5
Middle East 1.5 1.8 1.8 0.2 0.3 11 10 0
Africa 1.4 1.3 1.6 0.1 0.3 13 15 -5
C./E. Europe/Baltic States/CIS 0.7 3.0 0.8 0.3 0.1 -5 4 -5
Japan
World 30.7 100.0 100.0 5.3 5.8 8 -9 13
Asia 17.8 57.0 57.8 3.0 3.4 8 -16 19
North America 6.6 16.4 21.5 0.9 1.3 11 -1 7
Western Europe 5.4 20.3 17.6 1.1 1.0 6 4 3
Latin America 0.5 1.6 1.7 0.1 0.1 8 2 -3
All other regions 0.4 4.7 1.4 0.3 0.1 -6 -1 -5
Other economies in Asia
World 54.0 100.0 100.0 6.1 10.3 13 -5 10
Asia 36.2 66.5 67.0 4.0 6.9 13 -12 13
Western Europe 7.5 12.3 13.8 0.7 1.4 14 10 7
North America 4.8 10.3 8.9 0.6 0.9 11 6 10
Latin America 1.4 0.9 2.6 0.1 0.3 27 24 8
Middle East 1.3 1.9 2.4 0.1 0.2 16 13 1
Africa 1.2 1.7 2.3 0.1 0.2 17 17 -5

Trad
e by
sec
tor
122
Table IV.43
Leading exporters and importers of chemicals, 1999
(Billion dollars and percentage)
Share in world Value exports/imports Annual percentage change
1999 1980 1990 1999 1990-99 1997 1998 1999
Exporters
United States 71.98 14.8 13.3 13.7 7 13 -2 4
Germany 69.71 17.2 17.9 13.3 3 0 4 -2
France 40.37 9.4 9.6 7.7 4 -9 6 4
United Kingdom 34.64 8.7 8.0 6.6 4 3 2 -6
Belgium 32.90 - - 6.3 - - - -
Japan 30.69 4.7 5.3 5.8 8 4 -9 13
Netherlands 25.96 8.0 6.8 4.9 3 6 -8 -3
Switzerland 23.37 4.0 4.7 4.4 6 -4 6 4
Ireland 22.39 0.8 1.3 4.3 22 26 52 9
Italy 20.62 3.9 3.7 3.9 7 -1 3 2
Canada 12.86 2.5 2.3 2.4 8 11 -4 6
Korea, Rep. of 10.76 0.5 0.8 2.0 18 17 -4 5
China a 10.37 0.8 1.3 2.0 12 15 1 1
Spain 9.71 1.1 1.6 1.8 8 7 6 5
Hong Kong, China 9.36 - - - 9 -1 -11 -1
domestic exports 0.73 0.1 0.3 0.1 -2 -7 -16 -16
re-exports 8.63 - - - 11 0 -10 0
Above 15 417.07 81.5 82.3 79.3 - - - -
Memorandum item:
European Union (15) 282.76 58.4 59.0 53.8 5 2 6 2
Intra-exports 172.56 35.0 37.9 32.8 5 0 9 -1
Extra-exports 110.20 23.3 21.1 21.0 6 6 0 7
Importers
United States 64.07 6.2 7.7 11.7 12 12 8 14
Germany 41.47 9.2 10.3 7.6 3 -3 15 -8
France 35.89 8.4 8.2 6.6 4 -2 8 0
United Kingdom 30.07 5.1 6.3 5.5 5 2 2 0
Italy 27.84 5.5 6.5 5.1 4 0 3 0
Belgium 26.17 - - 4.8 - - - -
China a 24.03 2.0 2.2 4.4 15 7 4 19
Japan 22.78 4.1 5.0 4.2 5 1 -10 11
Canada b 18.35 2.2 2.5 3.4 10 11 5 9
Netherlands 17.11 4.4 4.3 3.1 3 -2 -4 -4
Spain 15.94 1.8 2.8 2.9 7 3 7 1
Switzerland 13.41 2.5 2.6 2.5 6 4 6 4
Mexico a, b 12.99 1.5 1.2 2.4 15 24 7 13
Taipei, Chinese 12.50 1.3 2.3 2.3 7 5 -13 5
Hong Kong, China 11.59 - - - 7 -1 -13 -2
retained imports 2.96 0.7 0.9 0.5 1 -3 -19 -7
Above 15 365.58 58.9 67.1 66.8 - - - -
a Includes significant shipments through processing zones.
b Imports are valued f.o.b.

Trad
e by
sec
tor
123
4.3 Machinery and transport equipment
Table IV.44
World trade in machinery and transport equipment, 1999(Billion dollars and percentage)
Value 2295
Annual percentage change
1980-85 3
1985-90 15
1990-99 7
1997 6
1998 3
1999 5
Share in world merchandise trade 41.9
Share in world exports of manufactures 54.8
Table IV.46
Share of machinery and transport equipment in trade in total merchandise and in manufactures by region, 1999(Percentage)
Exports Imports
Share of machinery and transport equipment in total merchandise
World 41.9 41.9North America 50.5 50.0Latin America 34.0 43.5Western Europe 40.7 39.7C./E. Europe/Baltic States/CIS 23.1 32.7Africa 5.9 34.9Middle East 6.9 38.1Asia 50.0 40.9 Australia, Japan and New Zealand 60.9 32.2 Other Asia 44.2 44.6
Share of machinery and transport equipment in manufactures
World 54.8 54.8North America 64.1 60.5Latin America 55.3 55.7Western Europe 50.5 51.7C./E. Europe/Baltic States/CIS 40.5 46.1Africa 19.6 49.7Middle East 27.2 50.5Asia 59.2 56.4 Australia, Japan and New Zealand 71.8 50.5 Other Asia 52.4 58.6
0 10 20 30 40 50 60
Exports
Imports
Western Europe
Asia
North America
Latin America
C./E. Europe/Baltic States/CIS
Africa
Middle East
Chart IV.10
Regional shares in world trade in machineryand transport equipment, 1999(Percentage)
Table IV.45
Major regional flows in world exports of machineryand transport equipment, 1999(Billion dollars and percentage)
Value Annual percentage change
1999 1990-99 1998 1999
Intra-Western Europe 638.5 5 10 1
Intra-Asia 282.3 12 -17 17
Asia to North America 216.1 7 1 11
Intra-North America 186.2 9 4 12
Asia to Western Europe 137.3 7 8 6
Western Europe to North America 109.7 7 13 8
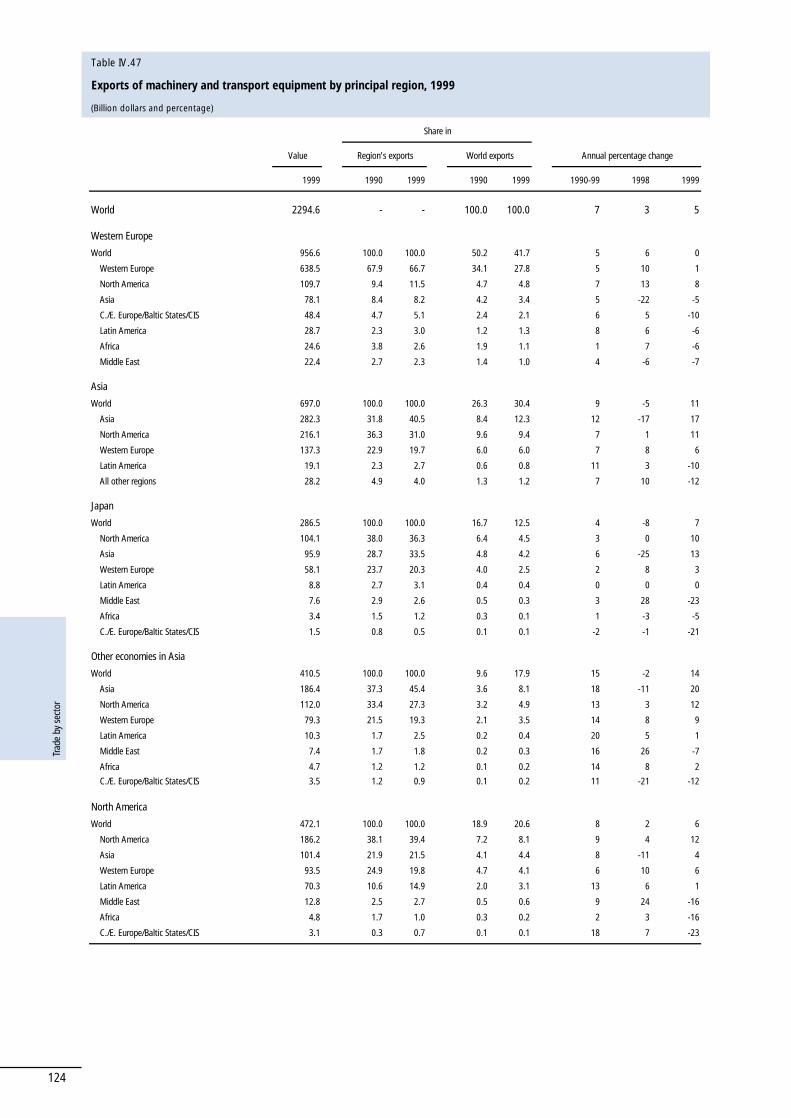
Trad
e by
sec
tor
124
Table IV.47
Exports of machinery and transport equipment by principal region, 1999
(Billion dollars and percentage)
Share in
Value Region’s exports World exports Annual percentage change
1999 1990 1999 1990 1999 1990-99 1998 1999
World 2294.6 - - 100.0 100.0 7 3 5
Western Europe
World 956.6 100.0 100.0 50.2 41.7 5 6 0
Western Europe 638.5 67.9 66.7 34.1 27.8 5 10 1
North America 109.7 9.4 11.5 4.7 4.8 7 13 8
Asia 78.1 8.4 8.2 4.2 3.4 5 -22 -5
C./E. Europe/Baltic States/CIS 48.4 4.7 5.1 2.4 2.1 6 5 -10
Latin America 28.7 2.3 3.0 1.2 1.3 8 6 -6
Africa 24.6 3.8 2.6 1.9 1.1 1 7 -6
Middle East 22.4 2.7 2.3 1.4 1.0 4 -6 -7
Asia
World 697.0 100.0 100.0 26.3 30.4 9 -5 11
Asia 282.3 31.8 40.5 8.4 12.3 12 -17 17
North America 216.1 36.3 31.0 9.6 9.4 7 1 11
Western Europe 137.3 22.9 19.7 6.0 6.0 7 8 6
Latin America 19.1 2.3 2.7 0.6 0.8 11 3 -10
All other regions 28.2 4.9 4.0 1.3 1.2 7 10 -12
Japan
World 286.5 100.0 100.0 16.7 12.5 4 -8 7
North America 104.1 38.0 36.3 6.4 4.5 3 0 10
Asia 95.9 28.7 33.5 4.8 4.2 6 -25 13
Western Europe 58.1 23.7 20.3 4.0 2.5 2 8 3
Latin America 8.8 2.7 3.1 0.4 0.4 0 0 0
Middle East 7.6 2.9 2.6 0.5 0.3 3 28 -23
Africa 3.4 1.5 1.2 0.3 0.1 1 -3 -5
C./E. Europe/Baltic States/CIS 1.5 0.8 0.5 0.1 0.1 -2 -1 -21
Other economies in Asia
World 410.5 100.0 100.0 9.6 17.9 15 -2 14
Asia 186.4 37.3 45.4 3.6 8.1 18 -11 20
North America 112.0 33.4 27.3 3.2 4.9 13 3 12
Western Europe 79.3 21.5 19.3 2.1 3.5 14 8 9
Latin America 10.3 1.7 2.5 0.2 0.4 20 5 1
Middle East 7.4 1.7 1.8 0.2 0.3 16 26 -7
Africa 4.7 1.2 1.2 0.1 0.2 14 8 2
C./E. Europe/Baltic States/CIS 3.5 1.2 0.9 0.1 0.2 11 -21 -12
North America
World 472.1 100.0 100.0 18.9 20.6 8 2 6
North America 186.2 38.1 39.4 7.2 8.1 9 4 12
Asia 101.4 21.9 21.5 4.1 4.4 8 -11 4
Western Europe 93.5 24.9 19.8 4.7 4.1 6 10 6
Latin America 70.3 10.6 14.9 2.0 3.1 13 6 1
Middle East 12.8 2.5 2.7 0.5 0.6 9 24 -16
Africa 4.8 1.7 1.0 0.3 0.2 2 3 -16
C./E. Europe/Baltic States/CIS 3.1 0.3 0.7 0.1 0.1 18 7 -23

Trad
e by
sec
tor
125
Table IV.48
Leading exporters and importers of machinery and transport equipment, 1999
(Billion dollars and percentage)
Share in world Value exports/imports Annual percentage change
1999 1980 1990 1999 1990-99 1997 1998 1999
Exporters
United States 369.3 16.4 15.1 16.1 8 15 2 3
Japan 286.5 14.5 16.7 12.5 4 2 -8 7
Germany 264.2 16.3 17.2 11.5 3 0 5 -2
France 130.7 7.0 6.5 5.7 6 2 12 -1
United Kingdom 128.3 7.6 6.2 5.6 6 12 0 -2
Canada 101.7 3.2 3.9 4.4 9 7 4 16
Italy 88.6 4.8 5.2 3.9 4 -7 5 -6
Mexico a 80.7 0.1 1.3 3.5 20 16 14 19
Korea, Rep. of 78.0 0.7 2.1 3.4 13 1 -4 20
Singapore 76.0 1.0 2.2 3.3 12 0 -11 4
domestic exports 45.1 1.0 1.5 2.0 11 -2 -12 4
re-exports 30.9 0.0 0.7 1.3 15 3 -11 4
Taipei, Chinese 68.8 0.9 2.2 3.0 11 11 -7 12
Hong Kong, China 60.8 - - - 12 6 -5 4
domestic exports 5.1 0.5 0.6 0.2 -4 -1 -21 -15
re-exports 55.6 - - - 17 7 -3 6
Netherlands 59.2 2.4 2.5 2.6 8 17 -3 3
China a 58.8 0.2 0.9 2.6 21 24 15 17
Malaysia a 52.7 0.3 0.9 2.3 20 2 -2 21
Above 15 1848.5 75.9 83.4 80.6 - - - -
Importers
United States 489.2 12.1 17.5 20.7 10 9 7 13
Germany 169.8 6.6 9.4 7.2 4 -2 10 0
United Kingdom 146.5 5.7 6.9 6.2 6 11 4 4
Canada b 114.9 5.1 4.8 4.9 8 17 3 9
France 114.5 5.5 6.5 4.8 4 -3 16 2
Japan 85.3 1.6 2.9 3.6 10 -2 -10 14
Italy 75.8 3.8 4.4 3.2 4 3 13 4
Mexico a, b 73.4 1.6 1.6 3.1 16 25 16 22
Hong Kong, China 69.7 - - - 13 10 -10 -4
retained imports 14.1 0.7 0.7 0.6 5 14 -24 -30
China a 69.5 1.0 1.8 2.9 14 -4 8 22
Singapore 66.9 1.4 2.2 2.8 11 0 -19 9
retained imports 35.9 1.3 1.5 1.5 8 -1 -26 13
Netherlands 66.7 2.9 3.2 2.8 6 11 5 4
Spain 61.5 1.1 2.7 2.6 7 0 17 13
Taipei, Chinese 53.6 1.0 1.7 2.3 11 14 4 11
Belgium 50.0 - - 2.1 - - - -
Above 15 1651.6 52.9 69.2 69.9 - - - -
a Includes significant shipments through processing zones.
b Imports are valued f.o.b.

Trad
e by
sec
tor
126
Table IV.49
Exports of machinery and transport equipment of selected economies, 1990-99
(Million dollars and percentage)
Share in economy’s totalValue merchandise exports
1990 1996 1997 1998 1999 1990 1999 a
World 1212940 I 2005330 2131570 2185480 2294610 35.8 41.9
Argentina 711 2595 4008 4200 2755 5.8 11.8Australia 3167 7801 8401 6725 7092 8.0 12.6Austria 15700 I 23506 24026 23932 24063 38.0 37.9Belgium - - - - 50961 - 28.9Belgium-Luxembourg 32267 I 47886 48446 52009 - 27.4 -Brazil 5829 9522 11993 12599 11387 18.6 23.7Canada 47229 78665 84098 87393 101708 37.0 42.7China b 10832 35312 43709 50217 58836 17.4 30.1Croatia - 964 752 1380 1247 - 29.2Czech Rep. b - 7166 8591 10875 11601 - 43.2
Denmark 9196 I 12490 12788 13185 14126 24.9 28.8Finland 8251 I 15575 15919 18043 17854 31.1 42.8France 78378 I 115551 118146 131936 130693 36.2 43.5Germany 209174 I 258232 257196 269803 264208 49.7 48.8Hong Kong, China 21176 58238 61829 58597 60761 25.7 34.8 domestic exports 7206 7675 7583 6000 5121 24.8 22.9 re-exports 13970 50563 54246 52597 55640 26.2 36.6Hungary b 2565 I 5698 8631 11956 14328 25.7 57.3Indonesia 366 5001 4624 4656 5293 1.4 10.9Ireland 7446 I 16752 20331 23444 27537 31.4 39.1Israel 2929 5987 6810 7804 8418 24.2 32.6Italy 63232 I 96529 90202 94511 88584 37.1 38.4
Japan 202934 285761 291065 268466 286465 70.6 68.3Korea, Rep. of 25545 67584 68109 65090 77954 39.3 53.9Luxembourg - - - - 1813 - 23.4Malaysia b 10513 43300 44191 43405 52671 35.7 62.4Malta 580 1051 965 1192 1256 51.2 63.1Mexico b 16152 51187 59467 68041 80738 39.7 59.1Netherlands 30730 I 50555 59260 57428 59152 23.3 29.5Philippines b 2160 11624 16278 21266 27232 26.8 74.3Poland 3754 5719 5551 I 8022 8277 26.2 30.2Portugal 3201 I 7088 7365 8002 7958 19.5 33.3
Romania 1451 1100 1179 1209 1429 29.3 16.8Russian Fed. c - 7148 5451 6379 7195 - 9.7Singapore 26436 82403 82466 73025 76018 50.1 66.3 domestic exports 17951 49798 49041 43336 45077 51.5 65.6 re-exports 8485 32605 33425 29689 30941 47.4 67.3Slovak Rep. - 2043 I 2736 3943 3968 - 38.7Slovenia - 2773 2813 3319 ... - 36.7Spain 21611 I 43475 43406 46718 46648 38.8 42.4Sweden 24859 I 37158 36516 38918 39349 43.2 46.4Switzerland 20116 25691 23764 24794 24518 31.5 30.5Taipei, Chinese 26223 59475 65720 61404 68809 39.1 56.6Thailand 5070 21077 22345 21878 24474 22.0 41.9
Turkey 854 2914 3363 4056 5037 6.6 19.4United Kingdom 74902 I 115637 130033 130538 128284 40.4 47.7United States 182599 306180 352641 358168 369298 46.4 53.1
Memorandum item: European Union (15) 579293 I 841395 866902 917388 915656 38.4 42.0 Intra-exports 360776 I 496758 501810 553115 561822 36.8 40.6 Extra-exports 218517 344637 365092 364273 353834 41.3 44.5
a Or nearest year.
b Includes significant exports from processing zones.
c Includes Secretariat estimates.
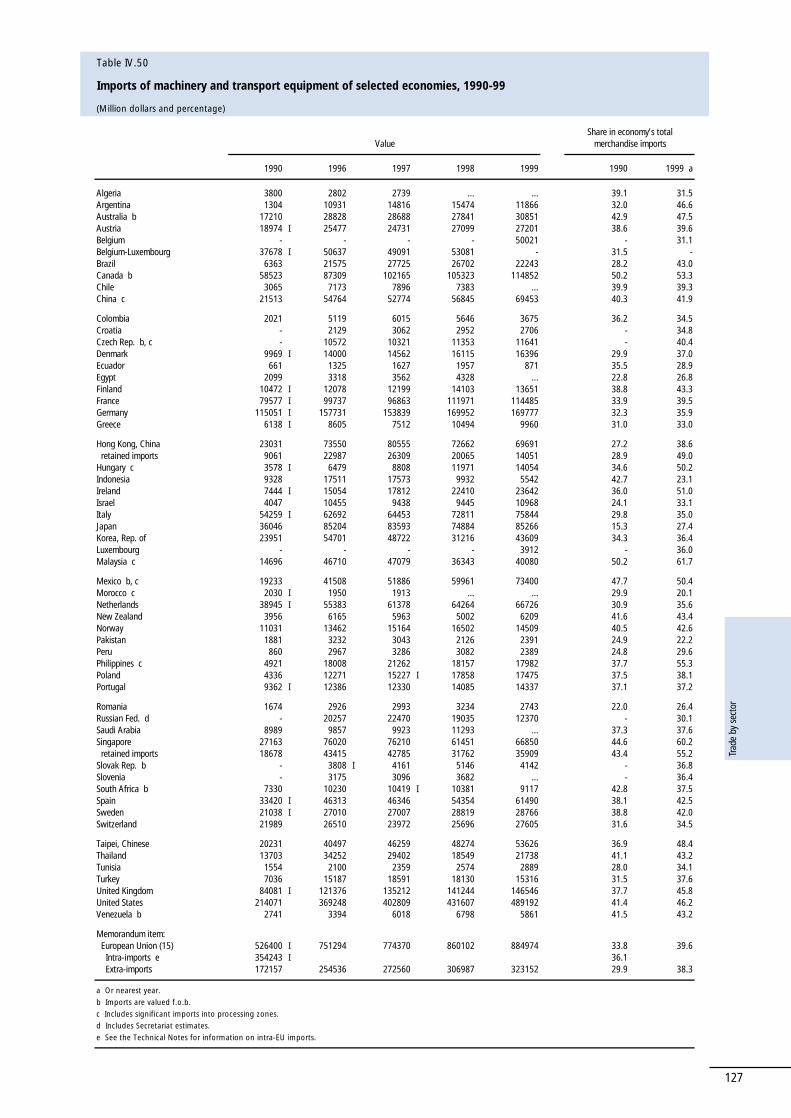
Trad
e by
sec
tor
127
Table IV.50
Imports of machinery and transport equipment of selected economies, 1990-99
(Million dollars and percentage)
Share in economy’s totalValue merchandise imports
1990 1996 1997 1998 1999 1990 1999 a
Algeria 3800 2802 2739 ... ... 39.1 31.5Argentina 1304 10931 14816 15474 11866 32.0 46.6Australia b 17210 28828 28688 27841 30851 42.9 47.5Austria 18974 I 25477 24731 27099 27201 38.6 39.6Belgium - - - - 50021 - 31.1Belgium-Luxembourg 37678 I 50637 49091 53081 - 31.5 -Brazil 6363 21575 27725 26702 22243 28.2 43.0Canada b 58523 87309 102165 105323 114852 50.2 53.3Chile 3065 7173 7896 7383 ... 39.9 39.3China c 21513 54764 52774 56845 69453 40.3 41.9
Colombia 2021 5119 6015 5646 3675 36.2 34.5Croatia - 2129 3062 2952 2706 - 34.8Czech Rep. b, c - 10572 10321 11353 11641 - 40.4Denmark 9969 I 14000 14562 16115 16396 29.9 37.0Ecuador 661 1325 1627 1957 871 35.5 28.9Egypt 2099 3318 3562 4328 ... 22.8 26.8Finland 10472 I 12078 12199 14103 13651 38.8 43.3France 79577 I 99737 96863 111971 114485 33.9 39.5Germany 115051 I 157731 153839 169952 169777 32.3 35.9Greece 6138 I 8605 7512 10494 9960 31.0 33.0
Hong Kong, China 23031 73550 80555 72662 69691 27.2 38.6 retained imports 9061 22987 26309 20065 14051 28.9 49.0Hungary c 3578 I 6479 8808 11971 14054 34.6 50.2Indonesia 9328 17511 17573 9932 5542 42.7 23.1Ireland 7444 I 15054 17812 22410 23642 36.0 51.0Israel 4047 10455 9438 9445 10968 24.1 33.1Italy 54259 I 62692 64453 72811 75844 29.8 35.0Japan 36046 85204 83593 74884 85266 15.3 27.4Korea, Rep. of 23951 54701 48722 31216 43609 34.3 36.4Luxembourg - - - - 3912 - 36.0Malaysia c 14696 46710 47079 36343 40080 50.2 61.7
Mexico b, c 19233 41508 51886 59961 73400 47.7 50.4Morocco c 2030 I 1950 1913 ... ... 29.9 20.1Netherlands 38945 I 55383 61378 64264 66726 30.9 35.6New Zealand 3956 6165 5963 5002 6209 41.6 43.4Norway 11031 13462 15164 16502 14509 40.5 42.6Pakistan 1881 3232 3043 2126 2391 24.9 22.2Peru 860 2967 3286 3082 2389 24.8 29.6Philippines c 4921 18008 21262 18157 17982 37.7 55.3Poland 4336 12271 15227 I 17858 17475 37.5 38.1Portugal 9362 I 12386 12330 14085 14337 37.1 37.2
Romania 1674 2926 2993 3234 2743 22.0 26.4Russian Fed. d - 20257 22470 19035 12370 - 30.1Saudi Arabia 8989 9857 9923 11293 ... 37.3 37.6Singapore 27163 76020 76210 61451 66850 44.6 60.2 retained imports 18678 43415 42785 31762 35909 43.4 55.2Slovak Rep. b - 3808 I 4161 5146 4142 - 36.8Slovenia - 3175 3096 3682 ... - 36.4South Africa b 7330 10230 10419 I 10381 9117 42.8 37.5Spain 33420 I 46313 46346 54354 61490 38.1 42.5Sweden 21038 I 27010 27007 28819 28766 38.8 42.0Switzerland 21989 26510 23972 25696 27605 31.6 34.5
Taipei, Chinese 20231 40497 46259 48274 53626 36.9 48.4Thailand 13703 34252 29402 18549 21738 41.1 43.2Tunisia 1554 2100 2359 2574 2889 28.0 34.1Turkey 7036 15187 18591 18130 15316 31.5 37.6United Kingdom 84081 I 121376 135212 141244 146546 37.7 45.8United States 214071 369248 402809 431607 489192 41.4 46.2Venezuela b 2741 3394 6018 6798 5861 41.5 43.2
Memorandum item: European Union (15) 526400 I 751294 774370 860102 884974 33.8 39.6 Intra-imports e 354243 I 36.1 Extra-imports 172157 254536 272560 306987 323152 29.9 38.3
a Or nearest year.
b Imports are valued f.o.b.
c Includes significant imports into processing zones.
d Includes Secretariat estimates.
e See the Technical Notes for information on intra-EU imports.

Trad
e by
sec
tor
128
Office machines and telecom equipment
Table IV.51
World trade in office machines and telecom equipment, 1999(Billion dollars and percentage)
Value 769
Annual percentage change
1980-85 9
1985-90 18
1990-99 11
1997 10
1998 0
1999 10
Share in world merchandise trade 14.1
Share in world exports of manufactures 18.4
Table IV.53
Share of office machines and telecom equipment in tradein total merchandise and in manufactures by region, 1999(Percentage)
Exports Imports
Share in total merchandise
World 14.1 14.1North America 15.0 15.8Latin America 10.3 12.0Western Europe 9.4 11.8C./E. Europe/Baltic States/CIS 4.2 6.9Africa 0.5 6.6Middle East 2.6 6.4Asia 26.1 20.8 Australia, Japan and New Zealand 19.0 14.5 Other Asia 29.9 23.5
Share in manufactures
World 18.4 18.4North America 19.0 19.2Latin America 17.1 15.4Western Europe 11.7 15.4C./E. Europe/Baltic States/CIS 7.3 9.8Africa 1.6 9.4Middle East 10.3 8.5Asia 30.9 28.7 Australia, Japan and New Zealand 22.5 22.7 Other Asia 35.5 30.9
0 10 20 30 40 50 60
Exports
Imports
Western Europe
Asia
North America
Latin America
C./E. Europe/Baltic States/CIS
Africa
Middle East
Chart IV.11
Regional shares in world trade in office machinesand telecom equipment, 1999(Percentage)
Table IV.52
Major regional flows in world exports of office machines and telecom equipment, 1999(Billion dollars and percentage)
Value Annual percentage change
1999 1990-99 1998 1999
Intra-Asia 162.2 17 -11 23
Intra-Western Europe 159.5 9 12 3
Asia to North America 113.8 9 -2 9
Asia to Western Europe 74.5 8 5 7
North America to Asia 51.4 11 -11 15
Intra-North America 31.0 11 1 8

Trad
e by
sec
tor
129
Table IV.54
Exports of office machines and telecom equipment by principal region, 1999
(Billion dollars and percentage)
Share in
Value Region’s exports World exports Annual percentage change
1999 1990 1999 1990 1999 1990-99 1998 1999
World 769.4 - - 100.0 100.0 11 0 10
Asia
World 363.8 100.0 100.0 45.9 47.3 11 -5 14
Asia 162.2 29.8 44.6 13.7 21.1 17 -11 23
North America 113.8 37.9 31.3 17.4 14.8 9 -2 9
Western Europe 74.5 27.3 20.5 12.5 9.7 8 5 7
Latin America 6.6 1.9 1.8 0.9 0.9 11 -3 4
Middle East 2.7 1.2 0.7 0.5 0.4 6 -2 -12
C./E. Europe/Baltic States/CIS 1.8 0.9 0.5 0.4 0.2 4 -23 -12
Africa 1.5 0.6 0.4 0.3 0.2 8 1 0
Japan
World 91.3 100.0 100.0 22.4 11.9 3 -11 7
Asia 37.0 26.7 40.6 6.0 4.8 8 -18 16
North America 31.3 38.8 34.3 8.7 4.1 2 -9 5
Western Europe 20.1 29.5 22.0 6.6 2.6 0 1 2
All other regions 2.9 5.0 3.2 1.1 0.4 -2 -4 -20
Other economies in Asia
World 272.5 100.0 100.0 23.5 35.4 16 -2 17
Asia 125.2 32.7 45.9 7.7 16.3 21 -8 26
North America 82.5 37.1 30.3 8.7 10.7 14 1 11
Western Europe 54.4 25.1 20.0 5.9 7.1 13 7 9
All other regions 9.7 4.2 3.6 1.0 1.3 14 -7 4
Western Europe
World 220.9 100.0 100.0 32.0 28.7 10 8 3
Western Europe 159.5 76.2 72.2 24.4 20.7 9 12 3
Asia 21.9 6.5 9.9 2.1 2.8 15 -15 -1
North America 16.6 6.7 7.5 2.1 2.2 11 3 12
C./E. Europe/Baltic States/CIS 10.1 3.3 4.6 1.1 1.3 14 7 0
Africa 4.9 2.7 2.2 0.9 0.6 7 38 -6
Middle East 3.9 1.8 1.8 0.6 0.5 10 26 7
Latin America 3.5 1.6 1.6 0.5 0.5 9 9 -5
North America
World 140.0 100.0 100.0 19.2 18.2 10 -4 10
Asia 51.4 33.7 36.7 6.5 6.7 11 -11 15
North America 31.0 21.4 22.1 4.1 4.0 11 1 8
Western Europe 29.9 32.6 21.4 6.3 3.9 5 -1 5
Latin America 24.0 9.5 17.2 1.8 3.1 18 3 11
All other regions 3.7 2.8 2.7 0.5 0.5 10 2 1

Trad
e by
sec
tor
130
Table IV.55
Imports of office machines and telecom equipment of selected economies by region and supplier, 1999
(Million dollars and percentage)
Canada a United States
Annual percentage Annual percentageValue Share change Value Share change
1999 1999 1998 1999 1999 1999 1998 1999
Region Region
World 24884 100.0 0 10 World 176840 100.0 3 13
North America 11969 48.1 -1 0 Asia 128795 72.8 -1 13
Asia 8492 34.1 -2 12 Latin America 22668 12.8 28 22
Latin America 1469 5.9 14 40 Western Europe 12391 7.0 4 8
Western Europe 1461 5.9 7 24 North America 10464 5.9 5 10
Middle East 47 0.2 10 7 C./E. Europe/
C./E. Europe/ Baltic States/CIS 1284 0.7 68 37
Baltic States/CIS 24 0.1 57 9 Middle East 1094 0.6 6 24
Africa 18 0.1 25 80 Africa 146 0.1 15 33
Suppliers Suppliers
United States 11969 48.1 -1 0 Japan 33129 18.7 -10 8
Japan 2503 10.1 -5 6 Mexico 20651 11.7 26 17
Taipei, Chinese 1495 6.0 18 21 China 17117 9.7 27 24
European Union (15) 1394 5.6 14 23 Malaysia 16562 9.4 6 18
Mexico 1365 5.5 14 43 Taipei, Chinese 15965 9.0 -1 7
Above 5 18726 75.3 1 6 Above 5 103425 58.5 5 14
Malaysia 984 4.0 -9 -2 Korea, Rep. of 15332 8.7 -8 47
China 889 3.6 18 31 Singapore 14109 8.0 -10 -4
Korea, Rep. of 815 3.3 -24 15 European Union (15) 11580 6.5 3 7
Singapore 635 2.6 -8 0 Canada 10464 5.9 5 10
Philippines 487 2.0 33 8 Philippines 7439 4.2 17 7
Thailand 349 1.4 -5 44 Thailand 5319 3.0 7 3
Hong Kong, China 208 0.8 -27 41 Indonesia 1889 1.1 8 10
Indonesia 88 0.4 9 -9 Hong Kong, China 1681 1.0 -16 -6
Brazil 84 0.3 2 3 Costa Rica 1572 0.9 275 188
Israel 45 0.2 18 5 Hungary 1199 0.7 76 36
Malta 22 0.1 -64 10 Israel 1087 0.6 6 25
Switzerland 22 0.1 12 49 Switzerland 416 0.2 22 104
Australia 20 0.1 -9 -11 Brazil 386 0.2 -1 4
Hungary 20 0.1 59 4 Malta 235 0.1 64 -11
Norway 16 0.1 -79 90 Norway 153 0.1 14 10
Above 20 23411 94.1 - - Above 20 176286 99.7 - -

Trad
e by
sec
tor
131
Table IV.55 (continued)
Imports of office machines and telecom equipment of selected economies by region and supplier, 1999
(Million dollars and percentage)
European Union (15) Japan
Annual percentage Annual percentageValue Share change Value Share change
1999 1999 1998 1999 1999 1999 1998 1999
Region Region
World 276697 100.0 10 5 World 44060 100.0 -13 21
Western Europe 148358 53.6 12 3 Asia 27652 62.8 -11 36
Asia 80548 29.1 7 8 North America 12153 27.6 -14 -5
North America 37101 13.4 1 4 Western Europe 3554 8.1 -17 20
C./E. Europe/ Latin America 331 0.8 -15 102
Baltic States/CIS 6514 2.4 58 20 C./E. Europe/
Middle East 1440 0.5 30 5 Baltic States/CIS 182 0.4 12 5
Latin America 1355 0.5 63 51 Middle East 167 0.4 -11 52
Africa 685 0.2 22 3 Africa 10 0.0 100 400
Suppliers Suppliers
European Union (15) 144934 52.4 11 3 United States 11944 27.1 -14 -6
United States 35787 12.9 0 6 Taipei, Chinese 5663 12.9 -6 63
Japan 22804 8.2 10 4 Malaysia 4565 10.4 -13 49
Taipei, Chinese 10816 3.9 14 5 Korea, Rep. of 4526 10.3 -20 75
Singapore 10270 3.7 -7 -4 China 4261 9.7 -2 19
Above 5 224610 81.2 8 3 Above 5 30958 70.3 -12 22
China 8705 3.1 24 18 European Union (15) 3472 7.9 -17 21
Malaysia 7593 2.7 -2 2 Singapore 3000 6.8 -17 14
Korea, Rep. of 7486 2.7 6 25 Philippines 2560 5.8 -14 28
Hungary 4388 1.6 61 28 Thailand 1797 4.1 -15 4
Hong Kong, China 4215 1.5 23 16 Indonesia 619 1.4 28 7
Philippines 3395 1.2 -7 19 Hong Kong, China 563 1.3 -5 6
Thailand 3092 1.1 0 6 Mexico 281 0.6 -15 75
Switzerland 1736 0.6 23 12 Canada 212 0.5 -6 19
Canada 1609 0.6 1 4 Hungary 177 0.4 13 3
Israel 1154 0.4 35 10 Israel 166 0.4 -11 52
Indonesia 1090 0.4 23 23 Switzerland 74 0.2 -27 19
Poland 922 0.3 38 6 Australia 70 0.2 -28 -6
Norway 756 0.3 14 1 Costa Rica 48 0.1 5098 4243
Mexico 712 0.3 30 37 Viet Nam 18 0.0 -9 -15
Turkey 685 0.2 76 -12 Norway 8 0.0 -25 -15
Above 20 272148 98.4 - - Above 20 44021 99.9 - -
a Imports are valued f.o.b.

Trad
e by
sec
tor
132
Table IV.56
Leading exporters and importers of office machines and telecom equipment, 1999
(Billion dollars and percentage)
Share in world Value exports/imports Annual percentage change
1999 1980 1990 1999 1990-99 1997 1998 1999
Exporters
United States 125.66 20.2 17.3 16.3 10 14 -4 10
Japan 91.27 21.1 22.4 11.9 3 1 -11 7
Singapore 60.60 3.2 6.4 7.9 14 0 -11 5
domestic exports 38.62 2.5 4.9 5.0 11 -2 -12 5
re-exports 21.99 0.7 1.5 2.9 19 4 -10 6
Taipei, Chinese 45.10 3.2 4.7 5.9 14 13 -3 17
Malaysia a 44.27 1.4 2.7 5.8 21 4 -5 28
United Kingdom 44.04 6.4 6.5 5.7 10 8 3 2
Korea, Rep. of 42.92 2.0 4.8 5.6 13 6 -6 35
Hong Kong, China 38.42 - - - 13 9 -3 5
domestic exports 3.61 2.0 1.6 0.5 -3 4 -17 -16
re-exports 34.81 - - - 18 10 0 8
Germany 36.96 9.9 7.5 4.8 6 4 7 4
Netherlands 31.77 4.0 3.4 4.1 14 28 -3 6
China a 30.14 … … 3.9 … 25 18 19
France 28.40 4.7 4.1 3.7 10 10 15 -1
Mexico a 25.42 0.1 1.5 3.3 21 25 21 17
Philippines a 23.09 0.1 0.6 3.0 32 41 31 24
Ireland 22.43 0.9 1.7 2.9 18 22 17 21
Above 15 655.67 78.3 85.4 85.2 - - - -
Importers
United States 176.84 15.9 21.1 22.3 12 8 3 13
United Kingdom 51.74 7.0 8.0 6.5 9 6 4 9
Germany 50.39 9.7 9.8 6.4 6 -3 17 2
Japan 44.05 2.6 3.7 5.6 16 -3 -13 21
Hong Kong, China 43.55 - - - 15 14 -9 1
retained imports 8.75 1.7 1.4 1.1 8 25 -28 -18
Singapore 42.28 2.6 4.5 5.3 14 2 -18 14
retained imports 20.30 1.9 2.9 2.6 10 1 -27 24
Netherlands 34.37 3.9 4.1 4.3 12 29 6 8
France 30.68 6.4 6.0 3.9 6 6 16 -1
China a 30.49 … … 3.8 … 20 32 38
Taipei, Chinese 28.79 1.4 2.5 3.6 16 20 5 21
Malaysia a 25.23 1.6 1.9 3.2 18 1 -10 17
Canada b 24.88 4.1 3.5 3.1 10 10 0 10
Korea, Rep. of 24.73 1.3 2.6 3.1 14 10 -20 49
Mexico a, b 21.09 0.9 1.5 2.7 18 23 19 25
Italy 18.27 4.6 4.4 2.3 4 2 9 4
Above 15 612.58 63.5 74.9 77.3 - - - -
a Includes significant shipments through processing zones.
b Imports are valued f.o.b.

Trad
e by
sec
tor
133
Table IV.57
Exports of office machines and telecom equipment of selected economies, 1990-99
(Million dollars and percentage)
Share in economy’s totalValue merchandise exports
1990 1996 1997 1998 1999 1990 1999 a
World 298490 I 631150 695230 697300 769420 8.8 14.1
Australia 738 1987 2089 1627 1617 1.9 2.9Austria 2886 I 3175 3582 2706 2787 7.0 4.4Belgium - - - - 8472 - 4.8Belgium-Luxembourg 3491 I 7209 7496 8392 - 3.0 -Brazil 692 899 1050 1068 1345 2.2 2.8Canada 5621 12333 13351 12997 14040 4.4 5.9China b ... 17198 21493 25344 30139 ... 15.4Czech Rep. b - 509 507 682 691 - 2.6Denmark 1350 I 2417 2891 3036 3326 3.7 6.8Finland 1495 I 5223 6087 7765 8405 5.6 20.2
France 12303 I 22726 25085 28789 28398 5.7 9.5Germany 22435 I 31775 33200 35652 36955 5.3 6.8Greece 33 I 119 137 206 210 0.4 1.9Hong Kong, China 12886 34593 37653 36633 38418 15.6 22.0 domestic exports 4772 4955 5173 4297 3610 16.5 16.1 re-exports 8114 29638 32480 32336 34808 15.2 22.9Hungary b 505 I 1121 2994 4232 5401 5.1 21.6Indonesia 124 3089 2893 2356 2976 0.5 6.1Ireland 5144 I 12994 15881 18546 22426 21.7 31.9Israel 1226 3065 3730 4173 4880 10.1 18.9Italy 7804 I 10584 9423 9561 9117 4.6 4.0Japan 67007 93932 95071 85030 91268 23.3 21.8
Korea, Rep. of 14338 31866 33868 31824 42918 22.1 29.7Luxembourg - - - - 545 - 7.0Malaysia b 8207 35004 36313 34611 44268 27.9 52.4Malta 472 898 789 991 1059 41.7 53.2Mexico b 4535 14377 17917 21682 25420 11.1 18.6Netherlands 10137 I 24178 30969 30061 31772 7.7 15.9Philippines b 1835 10056 14201 18625 23091 22.7 63.0Poland 342 552 807 I 1146 1183 2.4 4.3Portugal 607 I 1135 1085 1156 1275 3.7 5.3Singapore 19234 64475 64616 57547 60601 36.5 52.8 domestic exports 14685 42284 41600 36755 38615 42.1 56.2 re-exports 4549 22191 23016 20792 21986 25.4 47.8
Spain 1769 I 4046 4208 4745 4743 3.2 4.3Sweden 4172 I 10358 11605 12232 13663 7.3 16.1Switzerland 1520 2365 2293 2397 2730 2.4 3.4Taipei, Chinese 14104 35501 40016 38623 45095 21.0 37.1Thailand 3520 13271 14151 14303 15221 15.3 26.1Turkey 259 327 493 895 821 2.0 3.2United Kingdom 19261 I 38918 42064 43232 44044 10.4 16.4United States 51658 104617 118885 113893 125664 13.1 18.1
Memorandum item: European Union (15) 92894 I 174859 195087 210284 215778 6.2 9.9 Intra-exports 65803 I 115757 126764 140932 144934 6.7 10.5 Extra-exports 27091 59102 68323 69352 70844 5.1 8.9
a Or nearest year.
b Includes significant exports from processing zones.

Trad
e by
sec
tor
134
Table IV.58
Imports of office machines and telecom equipment of selected economies, 1990-99
(Million dollars and percentage)
Share in economy’s totalValue merchandise imports
1990 1996 1997 1998 1999 1990 1999 a
Argentina 305 2100 3150 3207 2899 7.5 11.4Australia b 4262 8391 8399 7771 9241 10.6 14.2Austria 3886 I 4438 4682 5588 6121 7.9 8.9Belgium - - - - 9846 - 6.1Belgium-Luxembourg 4736 I 8144 8708 9614 - 4.0 -Brazil 1514 6056 7001 6207 5922 6.7 11.4Canada b 10474 20514 22645 22703 24884 9.0 11.5Chile 456 1245 1511 1658 ... 5.9 8.8China c ... 13940 16696 22042 30489 ... 18.4Colombia 364 1295 1606 1745 1018 6.5 9.6
Czech Rep. b, c - 2242 1991 2011 2204 - 7.6Denmark 2349 I 4335 4591 4730 5211 7.0 11.8Finland 2189 I 3634 3904 4513 4493 8.1 14.3France 18013 I 25321 26782 30955 30676 7.7 10.6Germany 29421 I 43088 41953 49267 50392 8.3 10.7Greece 720 I 1413 1177 2017 1950 3.6 6.5Hong Kong, China 12325 41588 47431 43032 43554 14.5 24.1 retained imports 4211 11950 14951 10696 8746 13.4 30.5Hungary c 670 I 1565 2924 3707 4381 6.5 15.6Indonesia 891 2405 2348 753 ... 4.1 2.8Ireland 2843 I 8453 9928 12324 13446 13.8 29.0
Israel 938 3055 2839 3013 3594 5.6 10.8Italy 13310 I 15924 16179 17604 18273 7.3 8.4Japan 11258 43353 41898 36549 44049 4.8 14.2Korea, Rep. of 7740 18963 20777 16573 24729 11.1 20.7Luxembourg - - - - 959 - 8.8Malaysia c 5743 23823 24052 21642 25233 19.6 38.8Malta 488 833 718 878 993 24.8 34.7Mexico b, c 4639 11505 14194 16897 21093 11.5 14.5Netherlands 12243 I 23272 29931 31740 34371 9.7 18.3New Zealand 905 1487 1473 1285 1519 9.5 10.6
Norway 1732 2904 3103 3321 3251 6.4 9.6Paraguay 319 375 246 255 ... 23.6 8.0Peru 100 761 837 717 603 2.9 7.5Philippines c 2044 9296 12318 12132 11860 15.7 36.4Poland 784 2536 3053 I 3793 4187 6.8 9.1Portugal 1594 I 2256 2265 2739 2721 6.3 7.1Romania 211 570 630 893 757 2.8 7.3Saudi Arabia 810 1107 ... 1266 ... 3.4 4.2Singapore 13391 44444 45446 37163 42281 22.0 38.1 retained imports 8842 22253 22430 16371 20295 20.6 31.2Slovak Rep. b - 700 I 901 896 692 - 6.2
Slovenia - 441 461 511 ... - 5.1South Africa b ... 2822 3191 I 3891 ... ... 14.6Spain 7111 I 9280 8946 10255 11790 8.1 8.1Sweden 4823 I 7812 8225 9261 9041 8.9 13.2Switzerland 4797 6490 6324 6846 7604 6.9 9.5Taipei, Chinese 7438 18766 22576 23764 28785 13.6 26.0Thailand 3420 10804 10862 8037 9759 10.2 19.4Turkey 1234 2088 2775 3346 4325 5.5 10.6United Kingdom 23985 I 42826 45548 47437 51742 10.8 16.2United States 63365 140661 151735 155908 176840 12.3 16.7
Venezuela b 367 591 970 1117 1133 5.6 8.4Zimbabwe b 58 163 175 ... ... 3.1 5.7
Memorandum item: European Union (15) 127230 I 223392 240464 264009 276697 8.2 12.4 Intra-imports d 61513 I 6.3 Extra-imports 65717 107635 113700 123077 131763 11.4 15.6
a Or nearest year.
b Imports are valued f.o.b.
c Includes significant imports into processing zones.
d See the Technical Notes for information on intra-EU imports.

Trad
e by
sec
tor
135
Automotive products
Table IV.59
World trade in automotive products, 1999
(Billion dollars and percentage)
Value 549
Annual percentage change
1980-85 5
1985-90 14
1990-99 6
1997 5
1998 5
1999 5
Share in world merchandise trade 10.0
Share in world exports of manufactures 13.1
Table IV.61
Share of automotive products in trade in total merchandise and in manufactures by region, 1999(Percentage)
Exports Imports
Share of automotive products in total merchandise
World 10.0 10.0North America 13.2 16.7Latin America 10.9 9.1Western Europe 11.5 10.9C./E. Europe/Baltic States/CIS 6.7 7.4Africa 1.6 7.9Middle East 0.7 8.4Asia 7.5 2.9 Australia, Japan and New Zealand 17.3 5.1 Other Asia 2.2 1.9
Share of automotive products in manufactures
World 13.1 13.1North America 16.8 20.3Latin America 18.1 11.7Western Europe 14.3 14.2C./E. Europe/Baltic States/CIS 11.7 10.4Africa 5.1 11.3Middle East 2.7 11.2Asia 8.9 3.9 Australia, Japan and New Zealand 20.4 8.0 Other Asia 2.7 2.5
0 10 20 30 40 50 60
Exports
Imports
Western Europe
Asia
North America
Latin America
C./E. Europe/Baltic States/CIS
Africa
Middle East
Chart IV.12
Regional shares in world trade in automotive products,1999(Percentage)
Table IV.60
Major regional flows in world exports of automotive products, 1999(Billion dollars and percentage)
Value Annual percentage change
1999 1990-99 1998 1999
Intra-Western Europe 207.5 5 11 1
Intra-North America 98.2 8 2 19
Asia to North America 49.2 3 4 21
Western Europe to North America 28.2 7 17 16
Latin America to North America 25.3 19 10 22
Asia to Western Europe 22.2 4 8 3

Trad
e by
sec
tor
136
Table IV.62
Exports of automotive products by principal region, 1999
(Billion dollars and percentage)
Share in
Value Region’s exports World exports Annual percentage change
1999 1990 1999 1990 1999 1990-99 1998 1999
World 549.2 - - 100.0 100.0 6 5 5
Western Europe
World 271.3 100.0 100.0 54.4 49.4 5 8 1
Western Europe 207.5 78.2 76.5 42.6 37.8 5 11 1
North America 28.2 8.9 10.4 4.9 5.1 7 17 16
C./E. Europe/Baltic States/CIS 10.6 1.3 3.9 0.7 1.9 18 0 -9
Asia 10.4 5.7 3.8 3.1 1.9 1 -31 -1
Latin America 5.9 1.1 2.2 0.6 1.1 13 4 -11
Africa 4.9 3.1 1.8 1.7 0.9 -1 1 1
Middle East 3.6 1.5 1.3 0.8 0.6 3 0 -10
North America
World 123.7 100.0 100.0 19.1 22.5 8 1 12
North America 98.2 77.6 79.3 14.8 17.9 8 2 19
Latin America 11.8 7.7 9.5 1.5 2.1 11 -1 -7
Western Europe 7.4 6.3 6.0 1.2 1.3 8 11 1
Asia 4.6 5.9 3.7 1.1 0.8 3 -27 -7
All other regions 1.8 2.5 1.5 0.5 0.3 2 -3 -33
Asia
World 104.6 100.0 100.0 22.4 19.0 4 -4 9
North America 49.2 51.1 47.0 11.5 9.0 3 4 21
Western Europe 22.2 21.4 21.3 4.8 4.0 4 8 3
Asia 17.2 17.8 16.4 4.0 3.1 3 -36 16
Middle East 6.2 4.1 5.9 0.9 1.1 9 26 -15
Latin America 4.6 2.4 4.4 0.5 0.8 11 4 -29
Africa 3.1 2.5 3.0 0.6 0.6 6 2 -2
C./E. Europe/Baltic States/CIS 1.8 0.3 1.7 0.1 0.3 26 -11 -19
Japan
World 82.6 100.0 100.0 20.8 15.0 2 -3 6
North America 43.1 51.5 52.2 10.7 7.9 3 4 18
Western Europe 16.8 22.1 20.3 4.6 3.1 1 9 1
Asia 12.3 16.9 14.9 3.5 2.2 1 -37 12
Middle East 4.5 4.2 5.5 0.9 0.8 5 24 -18
Latin America 3.4 2.5 4.1 0.5 0.6 8 9 -31
Africa 2.0 2.5 2.4 0.5 0.4 2 -4 -10
C./E. Europe/Baltic States/CIS 0.6 0.3 0.7 0.1 0.1 14 -2 -28
Latin America
World 32.4 100.0 100.0 2.3 5.9 18 8 4
North America 25.3 70.5 77.9 1.6 4.6 19 10 22
Latin America 4.5 12.7 13.7 0.3 0.8 19 -3 -44
Western Europe 2.4 14.3 7.3 0.3 0.4 10 77 30
All other regions 0.3 2.5 0.9 0.1 0.1 5 -17 -43

Trad
e by
sec
tor
137
Table IV.63
Imports of automotive products of selected economies by region and supplier, 1999
(Million dollars and percentage)
Annual percentage Annual percentageValue Share change Value Share change
1999 1999 1998 1999 1999 1999 1998 1999
Region Region
World 45252 100.0 1 13 World 155723 100.0 8 20
North America 37810 83.6 2 12 North America 59370 38.1 5 23
Asia 3746 8.3 -2 24 Asia 45555 29.3 4 19
Latin America 1922 4.2 -14 23 Western Europe 27470 17.6 21 18
Western Europe 1608 3.6 12 6 Latin America 22970 14.8 9 17
All other regions 17 0.0 0 13 All other regions 359 0.2 14 35
Suppliers Suppliers
United States 37810 83.6 2 12 Canada 59370 38.1 5 23
Japan 3255 7.2 -3 21 Japan 39989 25.7 4 16
Mexico 1856 4.1 -14 23 European Union (15) 27258 17.5 20 18
European Union (15) 1580 3.5 12 7 Mexico 22149 14.2 9 17
Korea, Rep. of 339 0.7 17 75 Korea, Rep. of 3453 2.2 -7 69
Above 5 44840 99.1 - - Above 5 152219 97.7 - -
Region Region
World 240577 100.0 14 3 World 8595 100.0 -23 10
Western Europe 196001 81.5 13 1 Western Europe 5674 66.0 -27 13
Asia 22119 9.2 12 1 North America 1960 22.8 -21 -6
C./E. Europe/ Asia 854 9.9 2 30
Baltic States/CIS 11901 4.9 63 21 Latin America 90 1.0 -8 143
North America 6929 2.9 16 6 All other regions 16 0.2 42 -6
Latin America 2082 0.9 72 25
All other regions 1245 0.5 121 51
Suppliers Suppliers
European Union (15) 192902 80.2 12 1 European Union (15) 5671 66.0 -27 13
Japan 17393 7.2 10 -1 United States 1817 21.1 -21 -10
United States 6120 2.5 6 6 Taipei, Chinese 177 2.1 -25 27
Hungary 4322 1.8 50 27 Thailand 179 2.1 108 38
Korea, Rep. of 3620 1.5 25 20 Canada 143 1.7 -32 105
Above 5 224357 93.3 - - Above 5 7987 92.9 - -
a Imports are valued f.o.b.
Canada a United States
JapanEuropean Union (15)

Trad
e by
sec
tor
138
Table IV.64
Leading exporters and importers of automotive products, 1999
(Billion dollars and percentage)
Share in world Value exports/imports Annual percentage change
1999 1980 1990 1999 1990-99 1997 1998 1999
Exporters
Germany 93.15 21.0 21.9 17.0 3 1 5 0
Japan 82.64 19.8 20.8 15.0 2 7 -3 6
United States 62.92 11.9 10.2 11.5 8 12 -1 3
Canada 60.53 6.9 8.9 11.0 9 7 2 24
France 39.69 9.9 8.2 7.2 5 1 12 3
Spain 27.00 1.8 3.7 4.9 10 -2 9 -1
United Kingdom 26.46 5.8 4.4 4.8 7 8 0 1
Mexico a 25.25 0.3 1.5 4.6 21 6 9 16
Belgium 24.69 - - 4.5 - - - -
Italy 18.24 4.5 4.1 3.3 4 -7 6 -3
Korea, Rep. of 13.04 0.1 0.7 2.4 21 6 -7 15
Sweden 9.84 2.8 2.4 1.8 3 -7 14 -8
Netherlands 8.93 1.1 1.5 1.6 7 2 16 -2
Austria 7.81 0.5 1.1 1.4 9 -33 51 10
Czech Rep. a 4.13 - - 0.8 - 40 36 10
Above 15 504.31 91.2 95.0 91.8 - - - -
Importers
United States 155.72 20.3 24.7 27.5 8 8 8 20
Germany 46.13 6.2 9.6 8.2 5 -3 0 1
Canada b 45.25 8.7 7.7 8.0 7 16 1 13
United Kingdom 40.10 5.7 7.1 7.1 6 10 5 5
France 30.41 5.4 6.7 5.4 4 -18 22 6
Spain 27.12 0.9 3.2 4.8 12 1 22 18
Italy 26.74 5.5 5.6 4.7 4 11 11 7
Belgium 21.70 - - 3.8 - - - -
Mexico a, b 15.87 1.8 1.6 2.8 13 26 7 36
Netherlands 13.74 2.6 2.6 2.4 6 -3 15 0
Japan 8.60 0.5 2.3 1.5 2 -18 -23 10
Austria 8.28 1.6 1.7 1.5 5 -19 20 5
Australia b 7.78 1.3 1.2 1.4 8 10 3 8
Sweden 7.12 1.5 1.4 1.3 5 6 10 8
Switzerland 6.54 1.8 1.9 1.2 1 -15 16 6
Above 15 461.10 68.8 82.8 81.5 - - - -
a Includes significant shipments through processing zones.
b Imports are valued f.o.b.
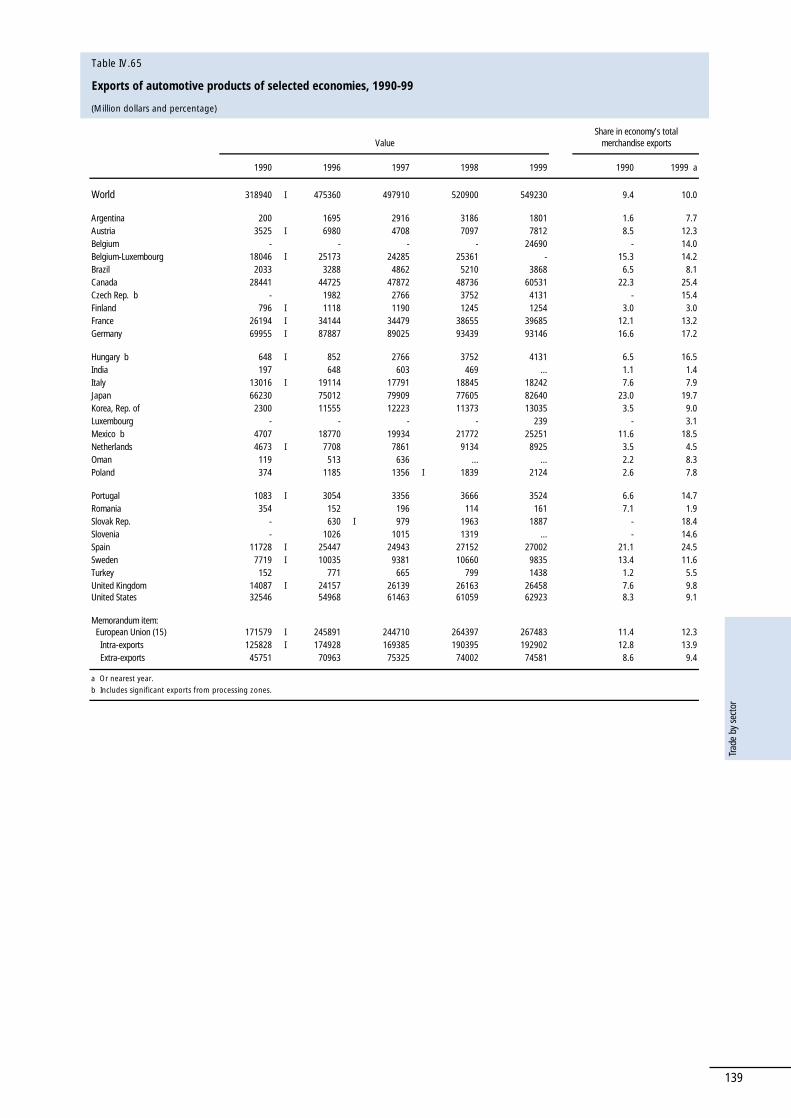
Trad
e by
sec
tor
139
Table IV.65
Exports of automotive products of selected economies, 1990-99
(Million dollars and percentage)
Share in economy’s totalValue merchandise exports
1990 1996 1997 1998 1999 1990 1999 a
World 318940 I 475360 497910 520900 549230 9.4 10.0
Argentina 200 1695 2916 3186 1801 1.6 7.7Austria 3525 I 6980 4708 7097 7812 8.5 12.3Belgium - - - - 24690 - 14.0Belgium-Luxembourg 18046 I 25173 24285 25361 - 15.3 14.2Brazil 2033 3288 4862 5210 3868 6.5 8.1Canada 28441 44725 47872 48736 60531 22.3 25.4Czech Rep. b - 1982 2766 3752 4131 - 15.4Finland 796 I 1118 1190 1245 1254 3.0 3.0France 26194 I 34144 34479 38655 39685 12.1 13.2Germany 69955 I 87887 89025 93439 93146 16.6 17.2
Hungary b 648 I 852 2766 3752 4131 6.5 16.5India 197 648 603 469 ... 1.1 1.4Italy 13016 I 19114 17791 18845 18242 7.6 7.9Japan 66230 75012 79909 77605 82640 23.0 19.7Korea, Rep. of 2300 11555 12223 11373 13035 3.5 9.0Luxembourg - - - - 239 - 3.1Mexico b 4707 18770 19934 21772 25251 11.6 18.5Netherlands 4673 I 7708 7861 9134 8925 3.5 4.5Oman 119 513 636 ... ... 2.2 8.3Poland 374 1185 1356 I 1839 2124 2.6 7.8
Portugal 1083 I 3054 3356 3666 3524 6.6 14.7Romania 354 152 196 114 161 7.1 1.9Slovak Rep. - 630 I 979 1963 1887 - 18.4Slovenia - 1026 1015 1319 ... - 14.6Spain 11728 I 25447 24943 27152 27002 21.1 24.5Sweden 7719 I 10035 9381 10660 9835 13.4 11.6Turkey 152 771 665 799 1438 1.2 5.5United Kingdom 14087 I 24157 26139 26163 26458 7.6 9.8United States 32546 54968 61463 61059 62923 8.3 9.1
Memorandum item: European Union (15) 171579 I 245891 244710 264397 267483 11.4 12.3 Intra-exports 125828 I 174928 169385 190395 192902 12.8 13.9 Extra-exports 45751 70963 75325 74002 74581 8.6 9.4
a Or nearest year.
b Includes significant exports from processing zones.

Trad
e by
sec
tor
140
Table IV.66
Imports of automotive products of selected economies, 1990-99
(Million dollars and percentage)
Share in economy’s totalValue merchandise imports
1990 1996 1997 1998 1999 1990 1999 a
Argentina 183 3243 4803 5211 3072 4.5 12.1Australia b 3794 6343 6964 7203 7783 9.5 12.0Austria 5520 I 8135 6586 7877 8281 11.2 12.0Belgium - - - - 21701 - 13.5Belgium-Luxembourg 18481 I 24865 21567 23261 - 15.4 -Brazil 532 4578 6106 6355 4097 2.4 7.9Canada b 24639 34130 39636 40038 45252 21.1 21.0Chile 578 1991 2171 1758 ... 7.5 9.4Colombia 415 928 1221 1002 437 7.4 4.1Czech Rep. b, c - 1916 2162 2225 2389 - 8.3
Denmark 1540 I 3018 3069 3396 3187 4.6 7.2Ecuador 157 442 452 492 186 8.4 6.2Egypt 415 613 614 661 ... 4.5 4.1Finland 2595 I 2121 2196 2608 2574 9.6 8.2France 21595 I 28567 23459 28566 30413 9.2 10.5Germany 30856 I 47118 45483 45653 46126 8.7 9.8Greece 1934 I 2346 2094 2487 2917 9.8 9.7Hong Kong, China 993 4087 5169 3601 1755 1.2 1.0 retained imports 666 2896 3624 2372 1035 2.1 3.6Hungary c 715 I 1022 1222 1884 2491 6.9 8.9Indonesia 1522 2609 2589 954 ... 7.0 3.5
Ireland 1236 I 1876 2261 3068 3106 6.0 6.7Israel 870 2324 1984 1774 1856 5.2 5.6Italy 18089 I 20327 22604 25018 26740 9.9 12.3Japan 7315 12480 10204 7814 8595 3.1 2.8Korea, Rep. of 929 2314 1920 918 1393 1.3 1.2Kuwait 452 1174 1264 1375 1216 11.4 16.0Luxembourg - - - - 952 - 8.8Malaysia c 1311 3160 3057 748 1351 4.5 2.1Mexico b, c 5267 8644 10903 11703 15868 13.1 10.9Morocco c 317 I 392 424 ... ... 4.7 4.5
Netherlands 8244 I 12297 11986 13748 13743 6.5 7.3New Zealand 1011 1904 1426 1299 1691 10.6 11.8Norway 1419 2762 3077 3152 2712 5.2 8.0Oman 429 882 975 ... ... 16.0 19.4Peru 175 632 683 761 546 5.0 6.8Philippines c 536 1869 1473 573 723 4.1 2.2Poland 391 2783 3956 I 4770 4951 3.4 10.8Portugal 3196 I 5228 4956 5771 6251 12.7 16.2Romania 409 390 303 431 236 5.4 2.3Saudi Arabia 2838 1868 1944 2696 ... 11.8 9.0
Slovak Rep. b - 1106 I 1117 1645 1259 - 11.2Slovenia - 1336 1266 1525 ... - 15.1South Africa b ... 1231 920 I 964 ... ... 3.6Spain 10132 I 18623 18795 22986 27116 11.6 18.7Sweden 4584 I 5624 5987 6574 7117 8.4 10.4Switzerland 6048 6246 5329 6181 6542 8.7 8.2Taipei, Chinese 2564 3269 3237 2608 2223 4.7 2.0Thailand 2651 4860 2393 567 1449 7.9 2.9Tunisia 306 489 559 564 655 5.5 7.7Turkey 1176 2834 4348 4029 3303 5.3 8.1
United Kingdom 22821 I 32908 36323 38260 40104 10.2 12.5United States 79319 111957 120727 129834 155723 15.3 14.7Venezuela b 426 813 1825 1888 1106 6.5 8.2Zimbabwe b 129 311 351 ... ... 7.0 11.4
Memorandum item: European Union (15) 150825 I 207819 205498 234382 240577 9.7 10.8 Intra-imports d 127496 I 13.0 Extra-imports 23329 32891 36113 43987 47675 4.0 5.7
a Or nearest year.
b Imports are valued f.o.b.
c Includes significant imports into processing zones.
d See the Technical Notes for information on intra-EU imports.

Trad
e by
sec
tor
141
4.4 Textiles
Table IV.67
World trade in textiles, 1999
(Billion dollars and percentage)
Value 148
Annual percentage change
1980-85 -1
1985-90 15
1990-99 4
1997 4
1998 -4
1999 -2
Share in world merchandise trade 2.7
Share in world exports of manufactures 3.5
Table IV.69
Share of textiles in trade in total merchandise and inmanufactures by region, 1999(Percentage)
Exports Imports
Share of textiles in total merchandise
World 2.7 2.7North America 1.2 1.5Latin America 1.4 3.2Western Europe 2.7 2.5C./E. Europe/Baltic States/CIS 2.0 4.6Africa 1.2 5.6Middle East 1.0 4.2Asia 4.4 3.6 Australia, Japan and New Zealand 1.5 1.8 Other Asia 6.0 4.4
Share of textiles in manufactures
World 3.5 3.5North America 1.6 1.8Latin America 2.3 4.0Western Europe 3.3 3.2C./E. Europe/Baltic States/CIS 3.5 6.5Africa 4.0 7.9Middle East 3.8 5.6Asia 5.3 5.0 Australia, Japan and New Zealand 1.7 2.9 Other Asia 7.2 5.8
0 10 20 30 40 50 60
Exports
Imports
Western Europe
Asia
North America
Latin America
C./E. Europe/Baltic States/CIS
Africa
Middle East
Chart IV.13
Regional shares in world trade in textiles, 1999
(Percentage)
Table IV.68
Major regional flows in world exports of textiles, 1999
(Billion dollars and percentage)
Value Annual percentage change
1999 1990-99 1998 1999
Intra-Western Europe 42.8 0 1 -9
Intra-Asia 36.4 6 -17 5
Asia to Western Europe 8.1 3 3 -7
Western Europe to C./E. Europe/Baltic States/CIS 7.1 13 7 -6
Asia to North America 7.0 7 3 4
Intra-North America 4.6 12 7 3

Trad
e by
sec
tor
142
Table IV.70
Exports of textiles by principal region, 1999
(Billion dollars and percentage)
Share in
Value Region’s exports World exports Annual percentage change
1999 1990 1999 1990 1999 1990-99 1998 1999
World 147.9 - - 100.0 100.0 4 -4 -2
Western Europe
World 63.2 100.0 100.0 53.2 42.7 1 1 -7
Western Europe 42.8 78.1 67.6 41.5 28.9 0 1 -9
C./E. Europe/Baltic States/CIS 7.1 4.2 11.3 2.3 4.8 13 7 -6
Asia 3.5 5.7 5.5 3.0 2.4 1 -24 4
North America 3.5 4.5 5.5 2.4 2.4 4 5 5
Africa 3.5 4.5 5.5 2.4 2.4 4 12 -6
Middle East 1.4 2.2 2.2 1.1 0.9 2 -5 -7
Latin America 0.8 0.7 1.3 0.4 0.6 9 4 -6
Asia
World 61.8 100.0 100.0 35.3 41.8 6 -10 2
Asia 36.4 57.9 58.9 20.4 24.6 6 -17 5
Western Europe 8.1 16.2 13.0 5.7 5.4 3 3 -7
North America 7.0 10.4 11.3 3.7 4.7 7 3 4
Middle East 3.9 6.5 6.4 2.3 2.7 6 -8 -1
Latin America 3.1 2.4 5.0 0.8 2.1 15 1 -3
Africa 2.4 2.9 3.9 1.0 1.6 10 -2 6
C./E. Europe/Baltic States/CIS 0.8 2.5 1.4 0.9 0.6 -1 -6 -12
Japan
World 6.6 100.0 100.0 5.6 4.5 1 -12 10
Asia 4.9 60.3 73.8 3.4 3.3 4 -17 17
Western Europe 0.7 14.2 11.0 0.8 0.5 -1 16 -2
North America 0.6 11.2 9.0 0.6 0.4 -1 -1 1
Middle East 0.3 9.5 4.4 0.5 0.2 -7 -5 -20
All other regions 0.1 4.7 1.6 0.3 0.1 -10 -13 -8
Other economies in Asia
World 55.2 100.0 100.0 29.7 37.3 7 -11 1
Asia 31.6 57.4 57.1 17.1 21.3 7 -19 4
Western Europe 7.3 16.6 13.3 4.9 5.0 4 1 -8
North America 6.4 10.2 11.6 3.0 4.3 8 8 -5
Middle East 3.6 5.9 6.6 1.8 2.5 8 -5 0
Latin America 3.0 2.6 5.5 0.8 2.0 16 -1 4
Africa 2.4 3.1 4.3 0.9 1.6 10 3 2
C./E. Europe/Baltic States/CIS 0.8 2.5 1.5 0.8 0.6 1 -6 -8
North America
World 11.6 100.0 100.0 5.5 7.8 8 1 4
North America 4.6 28.8 39.9 1.6 3.1 12 7 3
Latin America 4.0 20.2 34.7 1.1 2.7 15 14 23
Western Europe 1.4 25.0 12.0 1.4 0.9 0 -4 -19
Asia 1.2 19.1 10.3 1.1 0.8 1 -22 -4
Middle East 0.2 4.4 1.8 0.2 0.1 -2 -22 -25
All other regions 0.1 2.3 2.2 0.1 0.1 1 -22 -17

Trad
e by
sec
tor
143
Table IV.71
Textile imports of selected economies by region and supplier, 1999
(Million dollars and percentage)
Canada a United States
Annual percentage Annual percentageValue Share change Value Share change
1999 1999 1998 1999 1999 1999 1998 1999
Region Region
World 3996 100.0 4 -1 World 14305 100.0 8 6
North America 2610 65.3 4 -1 Asia 7154 50.0 9 7
Asia 806 20.2 2 2 Western Europe 3104 21.7 5 3
Western Europe 397 9.9 5 -5 North America 1781 12.5 10 9
Latin America 125 3.1 2 4 Latin America 1704 11.9 3 8
Middle East 26 0.7 13 0 Middle East 237 1.7 26 11
C./E. Europe/ C./E. Europe/
Baltic States/CIS 16 0.4 -13 -20 Baltic States/CIS 187 1.3 4 -1
Africa 11 0.3 0 0 Africa 138 1.0 27 -14
Suppliers Suppliers
United States 2610 65.3 4 -1 European Union (15) 2601 18.2 3 1European Union (15) 357 8.9 4 -2 Canada 1781 12.4 10 9China 197 4.9 7 10 China 1692 11.8 5 12Korea, Rep. of 119 3.0 -4 2 Mexico 1342 9.4 6 11India 107 2.7 7 1 India 1065 7.4 14 12
Above 5 3389 84.8 4 -1 Above 5 8481 59.3 7 8
Taipei, Chinese 101 2.5 -2 3 Korea, Rep. of 908 6.3 0 4Pakistan 92 2.3 5 7 Taipei, Chinese 819 5.7 -1 6Mexico 79 2.0 4 4 Pakistan 789 5.5 30 1Indonesia 53 1.3 3 -9 Japan 595 4.2 -1 0Japan 45 1.1 -1 -7 Turkey 387 2.7 30 25
Hong Kong, China 32 0.8 -6 4 Thailand 311 2.2 26 4Turkey 26 0.7 9 -20 Hong Kong, China 226 1.6 19 11Brazil 22 0.5 -11 -6 Israel 207 1.4 26 11Thailand 20 0.5 -22 -18 Indonesia 176 1.2 7 -29Iran, Islamic Rep. of 16 0.4 10 -11 Brazil 161 1.1 -9 4
Australia 13 0.3 7 -19 Philippines 145 1.0 32 30Switzerland 9 0.2 14 -11 Sri Lanka 111 0.8 19 13Viet Nam 9 0.2 53 23 Egypt 96 0.7 33 -16Israel 7 0.2 21 5 Switzerland 94 0.7 9 -8Bangladesh 6 0.2 34 49 Bangladesh 94 0.7 43 11
Czech Rep. 6 0.1 -21 -5 Malaysia 81 0.6 -7 22South Africa 5 0.1 -18 14 Australia 47 0.3 17 14Egypt 5 0.1 17 7 Colombia 43 0.3 0 22Malaysia 5 0.1 10 -28 Czech Rep. 40 0.3 12 -1Uruguay 4 0.1 49 -42 Russian Fed. 39 0.3 -4 -16
Dominican Republic 4 0.1 62 93 Dominican Republic 34 0.2 4 -17Haiti 4 0.1 - - Nepal 34 0.2 43 5Peru 4 0.1 -16 -22 El Salvador 33 0.2 22 6Romania 3 0.1 -11 -28 South Africa 30 0.2 2 -3Sri Lanka 3 0.1 -10 75 Belarus 24 0.2 122 35
Norway 2 0.1 36 -31 Macau, China 24 0.2 2044 183Poland 2 0.1 -3 -47 New Zealand 19 0.1 41 28Philippines 2 0.1 6 -43 Peru 19 0.1 -17 -22Colombia 2 0.1 -20 61 Costa Rica 18 0.1 -7 6Chile 2 0.0 -18 28 Poland 13 0.1 -22 13
New Zealand 2 0.0 38 33 United Arab Emirates 13 0.1 -31 53Saudi Arabia 1 0.0 121 40 Guatemala 13 0.1 -14 -4Cuba 1 0.0 113 30 Romania 12 0.1 -4 -23Nepal 1 0.0 13 92 Uzbekistan 12 0.1 482 500Slovenia 1 0.0 -15 -54 Slovenia 11 0.1 -38 -13
Above 40 3980 99.6 - - Above 40 14162 99.0 - -

Trad
e by
sec
tor
144
Table IV.71 (continued)
Textile imports of selected economies by region and supplier, 1999
(Million dollars and percentage)
European Union (15) Japan
Annual percentage Annual percentageValue Share change Value Share change
1999 1999 1998 1999 1999 1999 1998 1999
Region Region
World 53916 100.0 2 -7 World 4546 100.0 -25 4
Western Europe 39010 72.4 1 -8 Asia 3396 74.7 -26 9
Asia 8719 16.2 4 -3 Western Europe 728 16.0 -24 -11
C./E. Europe/ North America 324 7.1 -20 -4
Baltic States/CIS 2513 4.7 21 5 Middle East 39 0.9 -23 26
North America 1788 3.3 0 -9 Latin America 34 0.7 -16 -11
Middle East 779 1.4 1 -1 C./E. Europe/
Africa 755 1.4 -16 -6 Baltic States/CIS 16 0.4 18 23
Latin America 271 0.5 -15 -5 Africa 9 0.2 -17 -10
Suppliers Suppliers
European Union (15) 35297 65.5 1 -9 China 1726 38.0 -20 12Turkey 1900 3.5 13 1 European Union (15) 688 15.1 -24 -10India 1778 3.3 -1 -9 Korea, Rep. of 390 8.6 -33 13United States 1623 3.0 0 -11 United States 317 7.0 -20 -4China 1611 3.0 7 5 Indonesia 315 6.9 -23 13
Above 5 42210 78.3 1 -8 Above 5 3436 75.6 -23 5
Switzerland 1241 2.3 2 -9 Taipei, Chinese 258 5.7 -33 -1Pakistan 1059 2.0 3 -6 Pakistan 212 4.7 -39 -8Korea, Rep. of 875 1.6 6 -3 India 158 3.5 -29 1Japan 824 1.5 11 5 Thailand 112 2.5 -30 8Czech Rep. 711 1.3 12 9 Malaysia 81 1.8 -42 29
Taipei, Chinese 652 1.2 18 -10 Viet Nam 78 1.7 -12 12Indonesia 569 1.1 0 -27 Iran, Islamic Rep. of 33 0.7 -27 22Poland 471 0.9 30 -5 Philippines 25 0.6 -18 34Iran, Islamic Rep. of 355 0.7 -4 -10 Switzerland 23 0.5 -13 -22Thailand 346 0.6 -4 -18 Brazil 19 0.4 -20 -18
Egypt 255 0.5 -24 -23 Turkey 16 0.3 -26 -10Israel 239 0.4 4 -4 Bangladesh 11 0.3 -21 0Hungary 214 0.4 11 -5 Hong Kong, China 11 0.2 -50 42Slovak Rep. 179 0.3 10 -4 Uzbekistan 10 0.2 312 36Slovenia 170 0.3 4 -12 Mexico 10 0.2 39 8
Hong Kong, China 144 0.3 4 -1 Australia 9 0.2 -14 7Lithuania 133 0.2 26 8 Canada 7 0.1 -12 -33Romania 131 0.2 24 -3 Egypt 6 0.1 -13 -8Malaysia 122 0.2 -3 -18 Israel 5 0.1 62 28Nepal 115 0.2 -18 -1 Peru 4 0.1 -39 -20
Canada 113 0.2 -6 -6 Singapore 3 0.1 -22 -40Bangladesh 109 0.2 -4 -3 Sri Lanka 2 0.0 -26 -2Tunisia 108 0.2 -11 -3 Macau, China 2 0.0 -99 9011Brazil 103 0.2 -9 -15 South Africa 2 0.0 -36 36Estonia 100 0.2 13 -9 New Zealand 2 0.0 -16 -16
Norway 96 0.2 -2 -6 Romania 2 0.0 -35 -7Morocco 90 0.2 -8 -1 Saudi Arabia 1 0.0 -34 436Latvia 85 0.2 69 -6 Tanzania, United Rep. of 1 0.0 16 -60South Africa 78 0.1 18 -15 Myanmar 1 0.0 21 27Bulgaria 76 0.1 10 -13 Russian Fed. 1 0.0 -46 58
Russian Fed. 69 0.1 -1 -14 Nepal 1 0.0 6 24Mexico 59 0.1 -19 -16 Latvia 1 0.0 -15 67Viet Nam 58 0.1 43 47 Belarus 1 0.0 281 82Croatia 56 0.1 8 -11 Norway 1 0.0 -38 -2United Arab Emirates 48 0.1 7 -21 Korea, Dem. People’s Rep. of 1 0.0 38 -39
Above 40 52263 96.9 - - Above 40 4543 99.9 - -
a Imports are valued f.o.b.

Trad
e by
sec
tor
145
Table IV.72
Leading exporters and importers of textiles, 1999
(Billion dollars and percentage)
Share in world Value exports/imports Annual percentage change
1999 1980 1990 1999 1990-99 1997 1998 1999
Exporters
China a 13.04 4.6 6.9 8.8 7 14 -7 2
Hong Kong, China 12.27 - - - 5 3 -11 -6
domestic exports 1.22 1.7 2.1 0.8 -6 -8 -15 -12
re-exports 11.05 - - - 7 5 -10 -5
Germany 11.89 11.4 13.5 8.0 -2 -4 3 -13
Italy 11.78 7.6 9.1 8.0 2 -2 1 -10
Korea, Rep. of 11.62 4.0 5.8 7.9 7 5 -15 3
Taipei, Chinese 10.99 3.2 5.9 7.4 7 6 -13 -2
United States 9.51 6.8 4.8 6.4 7 15 0 3
France 7.03 6.2 5.8 4.8 2 -1 5 -7
Japan 6.59 9.3 5.6 4.5 1 -3 -12 10
Belgium 6.59 - - 4.5 - - - -
Pakistan 4.51 1.6 2.6 3.1 6 -6 -7 5
India b 4.56 2.1 2.1 3.0 10 6 -13 …
United Kingdom 4.48 5.7 4.2 3.0 0 4 -3 -17
Netherlands 3.86 4.1 2.8 2.6 3 -7 34 -5
Turkey 3.48 0.6 1.4 2.4 10 23 6 -2
Above 15 111.15 75.1 78.3 75.1 - - - -
Importers
United States 14.31 4.5 6.2 9.2 9 16 8 6
Hong Kong, China 12.56 - - - 2 -2 -17 -7
retained imports 1.51 3.7 3.8 1.0 -11 -22 -43 -17
China a 11.08 1.9 4.9 7.1 9 2 -10 0
Germany 9.89 12.1 11.0 6.4 -2 -9 8 -15
United Kingdom 7.41 6.2 6.5 4.8 1 5 -2 -11
France 6.92 7.2 7.0 4.4 -1 -1 8 -8
Italy 5.83 4.6 5.7 3.7 -1 4 3 -12
Mexico a, c 4.83 0.2 0.9 3.1 19 29 20 41
Japan 4.55 2.9 3.8 2.9 1 -4 -25 4
Canada c 4.00 2.3 2.2 2.6 6 17 4 -1
Belgium 3.69 - - 2.4 - - - -
Spain 3.29 0.6 1.9 2.1 5 7 12 -6
Korea, Rep. of 3.00 0.7 1.8 1.9 5 -7 -38 35
Netherlands 2.60 4.0 3.4 1.7 -4 11 -24 -11
Poland 2.50 0.5 0.2 1.6 29 3 14 -9
Above 15 85.40 55.3 62.5 54.9 - - - -
a Includes significant shipments through processing zones.
b 1998 instead of 1999.
c Imports are valued f.o.b.

Trad
e by
sec
tor
146
Table IV.73
Exports of textiles of selected economies, 1990-99
(Million dollars and percentage)
Share in economy’s totalValue merchandise exports
1990 1996 1997 1998 1999 1990 1999 a
World 104270 I 151060 157730 151310 147920 3.1 2.7
Austria 2083 I 2005 1938 1828 1532 5.0 2.4Bangladesh 343 445 465 433 ... 22.0 8.6Belgium - - - - 6585 - 3.7Belgium-Luxembourg 6374 I 7438 7393 7472 - 5.4 -Brazil 769 1007 1022 892 822 2.4 1.7Bulgaria ... 174 171 146 116 ... 2.9China b 7219 12112 13828 12817 13043 11.6 6.7Colombia 133 284 294 267 237 2.0 2.0Croatia - 110 91 89 82 - 1.9Czech Rep. b - 976 983 1136 1097 - 4.1
Egypt 554 426 533 441 ... 21.4 13.8France 6057 I 7303 7214 7570 7030 2.8 2.3Germany 14033 I 13787 13228 13672 11885 3.3 2.2Greece 500 I 507 389 537 411 6.2 3.7Hong Kong, China 8212 14146 14602 13040 12271 10.0 7.0 domestic exports 2170 1770 1634 1390 1223 7.5 5.5 re-exports 6042 12376 12968 11650 11048 11.3 7.3India 2179 4936 5243 4558 ... 12.1 13.6Indonesia 1241 2835 2255 2359 3019 4.8 6.2Iran, Islamic Rep. of c 510 547 467 443 ... 3.0 3.5Israel 269 397 446 473 477 2.2 1.8Italy 9492 I 13205 12907 13034 11783 5.6 5.1
Japan 5858 6927 6750 5971 6591 2.0 1.6Korea, Rep. of 6075 12718 13337 11279 11618 9.3 8.0Luxembourg - - - - 373 - 4.8Macau, China 136 155 148 175 228 8.0 10.6Malaysia b 343 1302 1292 1095 1120 1.2 1.3Mexico b 713 1548 1910 2030 2518 1.8 1.8Morocco b 202 I 158 135 ... ... 4.7 1.9Netherlands 2911 I 3240 3010 4044 3860 2.2 1.9Pakistan 2662 4919 4608 4302 4512 47.6 50.8Peru 220 159 196 164 115 6.8 1.9
Philippines b 132 312 337 287 276 1.6 0.8Poland 284 562 662 I 753 727 2.0 2.7Portugal 1328 I 1610 1683 1773 1694 8.1 7.1Romania 125 167 188 191 165 2.5 1.9Russian Fed. c - 583 514 442 392 - 0.5Singapore 903 1347 1242 860 853 1.7 0.7 domestic exports 141 250 250 203 249 0.4 0.4 re-exports 762 1097 992 657 604 4.3 1.3Slovak Rep. - 303 I 343 328 291 - 2.8Slovenia - 325 305 324 ... - 3.6Spain 1497 I 2886 3027 3235 3142 2.7 2.9Sri Lanka 24 166 ... ... 206 1.2 4.5
Switzerland 2556 2010 1795 1811 1641 4.0 2.0Taipei, Chinese 6128 12048 12772 11159 10986 9.1 9.0Thailand 927 1891 2020 1760 1816 4.0 3.1Tunisia 111 151 127 126 129 3.1 2.2Turkey 1440 2722 3352 3549 3478 11.1 13.4United Kingdom 4379 I 5399 5618 5427 4484 2.4 1.7United States 5039 8009 9193 9216 9510 1.3 1.4Uruguay 84 85 92 85 ... 5.0 3.1
Memorandum item: European Union (15) 50795 I 60040 61393 61693 57437 3.4 2.6 Intra-exports 35672 I 37495 38387 38636 35297 3.6 2.5 Extra-exports 15123 22544 23006 23057 22140 2.9 2.8
a Or nearest year.
b Includes significant exports from processing zones.
c Includes Secretariat estimates.

Trad
e by
sec
tor
147
Table IV.74
Imports of textiles of selected economies, 1990-99
(Million dollars and percentage)
Share in economy’s totalValue merchandise imports
1990 1996 1997 1998 1999 1990 1999 a
Argentina 52 609 792 794 632 1.3 2.5Australia b 1442 1818 1770 1636 1667 3.6 2.6Austria 1971 I 1894 1782 1751 1599 4.0 2.3Bangladesh 452 1380 998 1522 ... 13.2 21.7Belgium - - - - 3691 - 2.3Belgium-Luxembourg 3579 I 3935 4309 4422 - 3.0 -Brazil 252 1110 1201 1065 898 1.1 1.7Canada b 2325 3317 3887 4031 3996 2.0 1.9Chile 203 494 491 452 ... 2.6 2.4China c 5292 11980 12267 11082 11079 9.9 6.7
Colombia 75 379 442 468 414 1.3 3.9Croatia - 203 212 194 160 - 2.1Czech Rep. b, c - 1007 970 1122 1123 - 3.9Egypt 210 289 300 394 ... 2.3 2.4France 7595 I 7041 6972 7504 6921 3.2 2.4Germany 11867 I 11892 10771 11652 9894 3.3 2.1Greece 1204 I 1171 1083 1137 935 6.1 3.1Hong Kong, China 10182 16515 16205 13484 12562 12.0 7.0 retained imports 4140 4139 3237 1834 1514 13.2 5.3Hungary c 270 I 992 1020 1169 1146 2.6 4.1Indonesia 785 1266 1152 1021 803 3.6 3.3
Israel 474 759 771 769 758 2.8 2.3Italy 6132 I 6152 6420 6612 5827 3.4 2.7Japan 4105 6075 5807 4357 4546 1.7 1.5Korea, Rep. of 1946 3838 3560 2218 3001 2.8 2.5Kuwait 168 251 263 245 206 4.2 2.7Luxembourg - - - - 221 - 2.0Macau, China 619 769 840 842 803 40.4 39.4Malaysia c 951 1363 1225 928 1015 3.3 1.6Mauritius 350 458 448 468 413 21.6 19.3Mexico b, c 992 2221 2869 3435 4829 2.5 3.3
Morocco c 360 I 399 389 ... ... 5.3 4.1Netherlands 3615 I 3437 3801 2907 2599 2.9 1.4New Zealand 396 474 452 340 401 4.2 2.8Philippines c 910 1256 1322 1195 1278 7.0 3.9Poland 245 2353 2417 I 2747 2499 2.1 5.4Portugal 1680 I 1910 1965 2105 1839 6.7 4.8Romania 67 1050 1250 1471 1574 0.9 15.1Russian Fed. d - 1551 1649 1341 1138 - 2.8Saudi Arabia 1312 1164 1088 1075 ... 5.5 3.6Singapore 1778 1916 1721 1049 1119 2.9 1.0 retained imports 1016 819 729 392 515 2.4 0.8
Slovenia - 322 326 384 ... - 3.8South Africa b 561 675 679 I 597 526 3.3 2.2Spain 2050 I 2937 3133 3506 3288 2.3 2.3Sri Lanka 412 822 ... ... 1331 15.3 24.9Switzerland 1848 1717 1522 1569 1467 2.7 1.8Thailand 898 1412 1249 1159 1345 2.7 2.7Tunisia 790 1296 1245 1441 1332 14.3 15.7Turkey 567 1933 2324 2317 1907 2.5 4.7United Arab Emirates d 1009 1952 1979 1815 ... 9.0 6.7United Kingdom 7017 I 8081 8456 8307 7411 3.1 2.3United States 6730 10702 12463 13462 14305 1.3 1.4
Memorandum item: European Union (15) 50370 I 54776 56588 57756 53916 3.2 2.4 Intra-imports e 36133 I 3.7 Extra-imports 14237 17280 18201 19120 18619 2.5 2.2
a Or nearest year.
b Imports are valued f.o.b.
c Includes significant imports into processing zones.
d Includes Secretariat estimates.
e See the Technical Notes for information on intra-EU imports.

Trad
e by
sec
tor
148
4.5 Clothing
Table IV.75
World trade in clothing, 1999
(Billion dollars and percentage)
Value 186
Annual percentage change
1980-85 4
1985-90 17
1990-99 6
1997 11
1998 1
1999 1
Share in world merchandise trade 3.4
Share in world exports of manufactures 4.4
Table IV.77
Share of clothing in trade in total merchandise and inmanufactures by region, 1999(Percentage)
Exports Imports
Share of clothing in total merchandise
World 3.4 3.4North America 1.1 4.8Latin America 6.5 3.1Western Europe 2.6 3.5C./E. Europe/Baltic States/CIS 4.1 3.1Africa 5.5 2.1Middle East 1.3 2.2Asia 5.7 2.2 Australia, Japan and New Zealand 0.2 5.1 Other Asia 8.6 0.9
Share of clothing in manufactures
World 4.4 4.4North America 1.4 5.9Latin America 10.7 4.0Western Europe 3.2 4.5C./E. Europe/Baltic States/CIS 7.2 4.3Africa 18.0 2.9Middle East 5.3 2.9Asia 6.7 3.0 Australia, Japan and New Zealand 0.2 7.9 Other Asia 10.3 1.2
0 10 20 30 40 50 60
Exports
Imports
Western Europe
Asia
North America
Latin America
C./E. Europe/Baltic States/CIS
Africa
Middle East
Chart IV.14
Regional shares in world trade in clothing, 1999
(Percentage)
Table IV.76
Major regional flows in world exports of clothing, 1999
(Billion dollars and percentage)
Value Annual percentage change
1999 1990-99 1998 1999
Intra-Western Europe 46.6 2 -7 -2
Asia to North America 31.5 5 6 1
Intra-Asia 21.0 10 -7 8
Asia to Western Europe 19.7 4 -2 3
Latin America to North America 18.1 23 30 15
C./E. Europe/Baltic States/CIS to Western Europe 7.9 17 11 -2

Trad
e by
sec
tor
149
Table IV.78
Exports of clothing by principal region, 1999
(Billion dollars and percentage)
Share in
Value Region’s exports World exports Annual percentage change
1999 1990 1999 1990 1999 1990-99 1998 1999
World 186.03 - - 100.0 100.0 6 1 1
Asia
World 79.14 100.0 100.0 43.6 42.5 6 -1 3
North America 31.49 44.7 39.8 19.5 16.9 5 6 1
Asia 21.04 18.6 26.6 8.1 11.3 10 -7 8
Western Europe 19.73 29.9 24.9 13.0 10.6 4 -2 3
C./E. Europe/Baltic States/CIS 2.04 2.3 2.6 1.0 1.1 7 2 -9
Latin America 1.56 1.0 2.0 0.4 0.8 15 12 -4
Middle East 1.49 2.7 1.9 1.2 0.8 2 -11 -3
Africa 0.74 0.7 0.9 0.3 0.4 10 13 -5
Western Europe
World 60.31 100.0 100.0 43.6 32.4 3 -5 -2
Western Europe 46.62 82.7 77.3 36.1 25.1 2 -7 -2
North America 3.80 5.8 6.3 2.5 2.0 4 11 4
C./E. Europe/Baltic States/CIS 3.59 3.7 5.9 1.6 1.9 9 -1 -9
Asia 3.14 5.2 5.2 2.3 1.7 3 -21 2
Africa 1.41 1.1 2.3 0.5 0.8 12 22 -5
Middle East 1.23 1.1 2.0 0.5 0.7 10 8 -10
Latin America 0.45 0.5 0.7 0.2 0.2 8 21 -8
Latin America
World 19.19 100.0 100.0 3.3 10.3 21 28 14
North America 18.15 79.2 94.6 2.6 9.8 23 30 15
Latin America 0.77 12.4 4.0 0.4 0.4 7 11 -1
Western Europe 0.21 7.3 1.1 0.2 0.1 -2 -16 -10
All other regions 0.04 0.9 0.2 0.0 0.0 3 -42 -4
North America
World 10.17 100.0 100.0 2.7 5.5 15 4 -3
Latin America 6.43 47.4 63.2 1.3 3.5 19 9 -5
North America 2.56 18.2 25.2 0.5 1.4 19 13 7
Asia 0.62 14.8 6.1 0.4 0.3 4 -33 -6
Western Europe 0.46 16.9 4.5 0.5 0.2 -1 -18 -20
All other regions 0.11 2.7 1.0 0.1 0.1 3 -11 -30

Trad
e by
sec
tor
150
Table IV.79
Clothing imports of selected economies by region and supplier, 1999
(Million dollars and percentage)
Canada a United States
Annual percentage Annual percentageValue Share change Value Share change
1999 1999 1998 1999 1999 1999 1998 1999
Region Region
World 3282 100.0 8 0 World 58785 100.0 11 6
Asia 2164 65.9 10 3 Asia 32812 55.8 7 3
North America 564 17.2 3 -10 Latin America 17817 30.3 16 10
Western Europe 256 7.8 4 -5 Western Europe 3536 6.0 10 -1
Latin America 214 6.5 20 12 North America 1759 3.0 16 12
C./E. Europe/ Middle East 1212 2.1 18 14
Baltic States/CIS 33 1.0 19 -11 Africa 1086 1.8 24 3
Africa 29 0.9 3 -3 C./E. Europe/
Middle East 18 0.5 8 38 Baltic States/CIS 563 1.0 25 -10
Suppliers Suppliers
China 745 22.7 8 9 Mexico 7908 13.5 27 15United States 564 17.2 3 -10 China 7735 13.2 -4 4Hong Kong, China 329 10.0 -1 -8 Hong Kong, China 4552 7.7 11 -3European Union (15) 216 6.6 1 -7 European Union (15) 2485 4.2 8 -2India 211 6.4 12 16 Dominican Republic 2403 4.1 6 0
Above 5 2064 62.9 4 -1 Above 5 25084 42.7 9 5
Korea, Rep. of 182 5.5 33 8 Korea, Rep. of 2382 4.1 23 12Mexico 110 3.4 30 26 Honduras 2244 3.8 13 15Taipei, Chinese 99 3.0 11 -10 Taipei, Chinese 2191 3.7 2 -5Thailand 94 2.9 18 14 Indonesia 1933 3.3 3 2Indonesia 87 2.6 15 -4 Philippines 1914 3.3 8 3
Bangladesh 87 2.6 13 3 Thailand 1879 3.2 18 6Malaysia 78 2.4 21 -1 Bangladesh 1797 3.1 12 5Pakistan 54 1.6 -3 5 India 1778 3.0 9 1Philippines 50 1.5 0 -10 Canada 1758 3.0 16 12Sri Lanka 37 1.1 15 -10 Sri Lanka 1380 2.3 8 -2
Turkey 31 1.0 40 16 El Salvador 1361 2.3 11 14Macau, China 31 0.9 5 -9 Malaysia 1344 2.3 10 -5Honduras 26 0.8 48 10 Guatemala 1280 2.2 18 8Dominican Republic 24 0.7 8 18 Macau, China 1075 1.8 9 2Viet Nam 21 0.7 4 -18 Turkey 896 1.5 15 7
Singapore 13 0.4 44 58 Pakistan 876 1.5 10 8Mauritius 13 0.4 24 10 Costa Rica 847 1.4 -3 1Myanmar 12 0.4 -17 81 Cambodia 628 1.1 263 64El Salvador 10 0.3 -11 15 Israel 439 0.7 27 16Egypt 9 0.3 42 14 Colombia 385 0.7 4 3
Costa Rica 9 0.3 -1 -36 Egypt 350 0.6 16 -7Israel 8 0.2 29 16 Jamaica 349 0.6 -11 -19Peru 7 0.2 4 51 Singapore 345 0.6 7 8Cambodia 7 0.2 38 91 Peru 319 0.5 15 38Guatemala 7 0.2 4 -17 United Arab Emirates 316 0.5 9 12
Romania 7 0.2 5 -5 Nicaragua 284 0.5 27 20Japan 6 0.2 2 3 Haiti 265 0.5 56 14Bulgaria 6 0.2 -8 -40 South Africa 254 0.4 14 18United Arab Emirates 5 0.2 -13 144 Mauritius 246 0.4 26 -1Poland 5 0.2 39 12 Myanmar 200 0.3 50 46
Above 35 3200 97.5 - - Above 35 56399 95.9 - -

Trad
e by
sec
tor
151
Table IV.79 (continued)
Clothing imports of selected economies by region and supplier, 1999
(Million dollars and percentage)
European Union (15) Japan
Annual percentage Annual percentage Value Share change Value Share change
1999 1999 1998 1999 1999 1999 1998 1999
Region Region
World 86853 100.0 -1 1 World 16402 100.0 -12 11
Western Europe 43450 50.0 -7 -2 Asia 14157 86.3 -11 16
Asia 25418 29.3 1 5 Western Europe 1617 9.9 -12 -12
C./E. Europe/ North America 514 3.1 -33 -5
Baltic States/CIS 9222 10.6 16 3 Latin America 65 0.4 -5 12
Africa 6782 7.8 9 3 C./E. Europe/
Middle East 828 1.0 -3 3 Baltic States/CIS 27 0.2 8 -4
North America 700 0.8 -18 -13 Africa 12 0.1 33 0
Latin America 324 0.4 -11 -1 Middle East 6 0.0 -22 -14
Suppliers Suppliers
European Union (15) 35869 41.3 -9 -2 China 11434 69.7 -9 20China 7460 8.6 1 10 European Union (15) 1585 9.7 -13 -12Turkey 5447 6.3 11 -2 Korea, Rep. of 1031 6.3 5 14Hong Kong, China 4546 5.2 1 1 United States 488 3.0 -33 -4Tunisia 2772 3.2 12 -2 Viet Nam 450 2.7 -12 4
Above 5 56094 64.6 -5 0 Above 5 14987 91.4 -10 14
Romania 2380 2.7 23 7 Thailand 301 1.8 -23 -5Morocco 2326 2.7 7 -5 Indonesia 219 1.3 -30 -7India 2306 2.7 -1 -1 Taipei, Chinese 138 0.8 -32 -13Poland 2066 2.4 11 -8 Malaysia 136 0.8 -17 14Bangladesh 1996 2.3 10 4 Philippines 119 0.7 -33 3
Indonesia 1679 1.9 -1 2 Hong Kong, China 97 0.6 -44 -35Thailand 1122 1.3 11 11 India 90 0.5 -4 1Hungary 1033 1.2 14 -18 Korea, Dem. People’s Rep. of 59 0.4 -33 -7Korea, Rep. of 887 1.0 9 17 Canada 27 0.2 -18 -21Pakistan 814 0.9 0 -6 Mexico 25 0.2 -5 38
Sri Lanka 789 0.9 2 5 Bangladesh 16 0.1 12 -33Viet Nam 763 0.9 8 10 Switzerland 16 0.1 -11 -21Malaysia 730 0.8 -8 -7 Sri Lanka 16 0.1 -34 -2Mauritius 689 0.8 -1 1 Macau, China 13 0.1 -29 -27Bulgaria 616 0.7 26 3 Hungary 13 0.1 9 -9
Taipei, Chinese 606 0.7 -10 4 Pakistan 11 0.1 21 -15United States 585 0.7 -20 -19 Singapore 9 0.1 -34 44Czech Rep. 542 0.6 4 -10 Turkey 8 0.0 30 -14Macau, China 492 0.6 -16 -6 Peru 7 0.0 -21 4Croatia 463 0.5 4 -17 El Salvador 7 0.0 27 -19
Slovak Rep. 449 0.5 12 -6 Honduras 6 0.0 34 12Lithuania 447 0.5 17 4 Slovenia 6 0.0 44 -21Slovenia 406 0.5 -8 -17 Dominican Republic 5 0.0 5 38Switzerland 398 0.5 -4 1 Mauritius 5 0.0 7 -8Ukraine 325 0.4 22 8 Romania 5 0.0 34 3
Israel 321 0.4 -11 10 Jamaica 4 0.0 41 -33Philippines 302 0.3 -16 -4 Brazil 4 0.0 -36 25Egypt 285 0.3 14 11 Australia 4 0.0 -43 -8TFYR Macedonia 262 0.3 27 6 Tunisia 4 0.0 121 0United Arab Emirates 257 0.3 6 -8 Israel 3 0.0 -23 -36
Madagascar 240 0.3 18 10 Mongolia 3 0.0 12 39Cambodia 232 0.3 -3 52 New Zealand 2 0.0 -28 -19Singapore 204 0.2 -2 9 Nepal 2 0.0 -9 75Latvia 195 0.2 18 10 Costa Rica 2 0.0 -40 -7Estonia 181 0.2 9 -2 Poland 2 0.0 -21 -24
Above 40 83482 96.1 - - Above 40 16367 99.8 - -
a Imports are valued f.o.b.

Trad
e by
sec
tor
152
Table IV.80
Leading exporters and importers of clothing, 1999
(Billion dollars and percentage)
Share in world Value exports/imports Annual percentage change
1999 1980 1990 1999 1990-99 1997 1998 1999
Exporters
China a 30.08 4.0 9.0 16.2 13 27 -6 0
Hong Kong, China 22.37 - - - 4 5 -4 1
domestic exports 9.57 11.5 8.6 5.1 0 4 4 -1
re-exports 12.80 - - - 9 6 -9 2
Italy 13.24 11.3 11.0 7.1 1 -8 -1 -10
United States 8.27 3.1 2.4 4.4 14 15 1 -6
Mexico a 7.81 0.0 0.5 4.2 33 50 17 18
Germany 7.44 7.1 7.3 4.0 -1 -1 7 -7
Turkey 6.52 0.3 3.1 3.5 8 10 5 -8
France 5.69 5.6 4.3 3.1 2 -3 8 -1
Korea, Rep. of 4.87 7.3 7.3 2.6 -5 -1 11 5
India b 4.78 1.5 2.3 2.6 8 3 10 …
United Kingdom 4.49 4.6 2.8 2.4 4 2 -7 -9
Indonesia 3.86 0.2 1.5 2.1 10 -19 -9 47
Belgium 3.83 - - 2.1 - - - -
Bangladesh b 3.79 0.0 0.6 2.1 25 21 41 …
Thailand 3.45 0.7 2.6 1.9 2 -1 -4 -3
Above 15 117.68 59.6 65.1 63.3 - - - -
Importers
United States 58.79 16.4 24.1 30.0 9 16 11 6
Germany 20.77 19.7 18.2 10.6 0 -7 1 -10
Japan 16.40 3.6 7.8 8.4 7 -15 -12 11
Hong Kong, China 14.76 - - - 9 10 -5 3
retained imports 1.96 0.9 0.7 1.0 11 96 45 9
United Kingdom 12.53 6.8 6.2 6.4 7 15 7 5
France 11.58 6.2 7.5 5.9 4 -1 8 -1
Italy 5.84 1.9 2.3 3.0 10 6 10 0
Netherlands 5.14 6.8 4.3 2.6 1 9 -11 -3
Belgium 4.87 - - 2.5 - - - -
Mexico a, c 3.65 0.3 0.5 1.9 23 40 12 -3
Spain 3.53 0.4 1.5 1.8 9 2 7 10
Switzerland 3.41 3.4 3.1 1.7 0 -9 4 -3
Canada c 3.28 1.7 2.1 1.7 4 19 8 0
Austria 2.79 2.2 2.1 1.4 2 -9 2 -6
Denmark 2.46 1.2 1.0 1.3 10 15 10 6
Above 15 156.99 75.6 84.2 80.2 - - - -
a Includes significant shipments through processing zones.
b 1998 instead of 1999.
c Imports are valued f.o.b.

Trad
e by
sec
tor
153
Table IV.81
Exports of clothing of selected economies, 1990-99
(Million dollars and percentage)
Share in economy’s totalValue merchandise exports
1990 1996 1997 1998 1999 1990 1999 a
World 108000 I 164140 182280 183330 186030 3.2 3.4
Austria 1168 I 1390 1357 1377 1257 2.8 2.0Bangladesh 643 2218 2688 3786 ... 41.3 74.9Belgium - - - - 3833 - 2.2Belgium-Luxembourg 2000 I 3017 3494 4042 - 1.7 -Bulgaria ... 281 354 451 620 ... 15.3China b 9669 25034 31803 30048 30078 15.6 15.4Colombia 459 476 445 433 427 6.8 3.7Croatia - 633 633 556 524 - 12.3Czech Rep. b - 622 621 705 670 - 2.5Denmark 859 I 1288 1542 1752 1939 2.3 4.0
Egypt 144 239 259 333 ... 5.6 10.4France 4670 I 5529 5345 5748 5690 2.2 1.9Germany 7881 I 7579 7503 8014 7441 1.9 1.4Greece 1714 I 1878 1632 1821 1505 21.1 13.5Hong Kong, China 15406 21976 23107 22164 22371 18.7 12.8 domestic exports 9266 8979 9329 9667 9571 31.9 42.8 re-exports 6140 12997 13778 12497 12800 11.5 8.4Hungary b 375 I 1135 1119 1277 1312 3.8 5.2India 2529 4217 4343 4782 ... 14.1 14.2Indonesia 1646 3591 2904 2630 3857 6.4 7.9Israel 482 644 600 651 731 4.0 2.8Italy 11838 I 16172 14857 14742 13240 7.0 5.7
Jamaica 83 250 228 ... ... 7.3 16.5Korea, Rep. of 7878 4221 4192 4651 4871 12.1 3.4Luxembourg - - - - 66 - 0.9Macau, China 1110 1547 1805 1642 1630 65.5 75.6Malaysia b 1315 2376 2337 2304 2253 4.5 2.7Mauritius 619 919 892 970 910 51.8 58.9Mexico b 587 3753 5636 6603 7805 1.4 5.7Morocco b 722 I 779 724 ... ... 16.9 10.3Netherlands 2188 I 3053 3655 2860 2631 1.7 1.3Pakistan 1013 1872 1810 1840 1957 18.1 22.0
Peru 120 257 326 336 414 3.7 6.8Philippines b 1733 2389 2319 2324 2111 21.5 5.8Poland 384 2373 2223 I 2386 2199 2.7 8.0Portugal 3490 I 3591 3457 3462 3151 21.3 13.2Romania 363 1559 1752 1979 2044 7.3 24.0Russian Fed. c - 382 306 303 351 - 0.5Singapore 1588 1398 1491 1427 1603 3.0 1.4 domestic exports 996 495 440 430 471 2.9 0.7 re-exports 592 903 1051 997 1132 3.3 2.5Slovak Rep. - 271 I 516 536 529 - 5.2Slovenia - 593 550 538 ... - 5.9Spain 598 I 1377 1434 1730 1827 1.1 1.7
Sri Lanka 637 1805 ... ... 2287 32.1 49.7Taipei, Chinese 3987 3206 3409 3189 2883 5.9 2.4Thailand 2816 3729 3686 3540 3449 12.2 5.9Tunisia 1125 2396 2299 2474 2375 31.9 40.2Turkey 3330 6067 6697 7058 6516 25.7 25.0United Kingdom 3041 I 5185 5281 4920 4487 1.6 1.7United States 2564 7511 8672 8793 8269 0.7 1.2Uruguay 153 141 153 145 ... 9.0 5.2
Memorandum item: European Union (15) 40782 I 51332 56127 52347 51371 2.7 2.4 Intra-exports 29444 I 35442 40366 36535 35869 3.0 2.6 Extra-exports 11338 15890 15761 15812 15501 2.1 1.9
a Or nearest year.
b Includes significant exports from processing zones.
c Includes Secretariat estimates.

Trad
e by
sec
tor
154
Table IV.82
Imports of clothing of selected economies, 1990-99
(Million dollars and percentage)
Share in economy’s totalValue merchandise imports
1990 1996 1997 1998 1999 1990 1999 a
Australia b 711 1411 1519 1519 1661 1.8 2.6Austria 2346 I 3184 2911 2967 2790 4.8 4.1Belgium - - - - 4870 - 3.0Belgium-Luxembourg 3589 I 4584 4914 5297 - 3.0 -Canada b 2388 2544 3017 3269 3282 2.0 1.5Chile 52 416 441 468 ... 0.7 2.5Croatia - 286 270 257 215 - 2.8Czech Rep. b, c - 501 432 438 426 - 1.5Denmark 1069 I 1834 2111 2315 2458 3.2 5.5Finland 887 I 877 903 933 907 3.3 2.9
France 8380 I 10891 10755 11653 11578 3.6 4.0Germany 20410 I 24647 22846 23084 20765 5.7 4.4Greece 433 I 952 934 1054 931 2.2 3.1Hong Kong, China 6913 13630 15019 14297 14757 8.2 8.2 retained imports 773 633 1241 1800 1957 2.5 6.8Hungary c 167 I 402 386 446 510 1.6 1.8Ireland 825 I 1019 1091 1145 1152 4.0 2.5Israel 61 332 341 364 356 0.4 1.1Italy 2580 I 5028 5311 5855 5843 1.4 2.7Jamaica 87 239 220 ... ... 4.7 7.0Japan 8736 19672 16727 14723 16402 3.7 5.3
Jordan 27 52 38 62 ... 1.0 1.6Korea, Rep. of 150 1507 1394 504 763 0.2 0.6Kuwait 206 322 350 372 330 5.2 4.3Luxembourg - - - - 237 - 2.2Macau, China 25 102 107 126 169 1.6 8.3Mexico b, c 573 2394 3355 3750 3645 1.4 2.5Netherlands 4768 I 5436 5921 5274 5141 3.8 2.7New Zealand 148 350 407 352 402 1.6 2.8Norway 1231 1381 1394 1429 1380 4.5 4.1Poland 209 453 519 I 599 610 1.8 1.3Portugal 436 I 869 890 985 962 1.7 2.5
Romania 26 189 219 272 292 0.3 2.8Russian Fed. d - 2345 3253 2717 1847 - 4.5Saudi Arabia 832 846 829 922 ... 3.5 3.1Singapore 922 1730 1805 1410 1650 1.5 1.5 retained imports 330 827 754 413 518 0.8 0.8Slovenia - 481 446 448 ... - 4.4Spain 1648 I 2927 2988 3198 3531 1.9 2.4Sweden 2510 I 2172 2116 2166 2146 4.6 3.1Switzerland 3437 3731 3405 3528 3410 4.9 4.3Tunisia 190 475 493 517 476 3.4 5.6United Arab Emirates d 528 1199 1222 1118 ... 4.7 4.1
United Kingdom 6960 I 9695 11169 11977 12533 3.1 3.9United States 26977 43317 50297 55720 58785 5.2 5.6
Memorandum item: European Union (15) 56844 I 81678 87484 86354 86853 3.6 3.9 Intra-imports e 28549 I 2.9 Extra-imports 28295 46235 47118 49819 50983 4.9 6.0
a Or nearest year.
b Imports are valued f.o.b.
c Includes significant imports into processing zones.
d Includes Secretariat estimates.
e See the Technical Notes for information on intra-EU imports.

Trad
e by
sec
tor
155
5. Commercial services
5.1 Transportation services
Table IV.83
World exports of transportation services, 1999
(Billion dollars and percentage)
Value 310
Annual percentage change
1990-99 4
1997 2
1998 -1
1999 1
Share in world exports of commercial services 23.0
Chart IV.15
World exports of transportation servicesand share in total commercial services, 1992-99(Billion dollars and percentage)
20
25
30
35
40
45
50
1998 1999199719961995199419931992
600
500
400
300
200
100
0
Share (right scale)Value (left scale)
Table IV.84
Share of transportation services in total trade ofcommercial services by selected region, 1999(Percentage)
Exports Imports
North America 19.0 29.2
Latin America 18.1 39.2
Western Europe 22.4 23.7
European Union (15) 22.1 23.3
Africa 25.1 40.0
Asia 27.4 30.3
Japan 38.0 26.8
0 10 20 30 40 50 60
Exports
Imports
Chart IV.16
Regional shares in world trade in transportationservices, 1999(Percentage)
Western Europe
Asia
North America
All other regions

Trad
e by
sec
tor
156
Table IV.85
Leading exporters and importers of transportation services, 1999
(Billion dollars and percentage)
Share in world Value exports/imports Annual percentage change
1999 1990 1999 1990-99 1997 1998 1999
Exporters
United States 48.4 16.7 15.6 3 3 -5 6
Japan 22.9 7.9 7.4 3 1 -3 8
Netherlands 20.4 5.8 6.6 5 4 1 -3
Germany 20.0 6.6 6.5 3 -3 5 -2
France 20.0 7.3 6.4 2 -4 6 -2
United Kingdom 18.8 6.1 6.1 4 8 4 -1
Hong Kong, China 11.4 3.1 3.7 6 1 -14 0
Korea, Rep. of 11.2 1.4 3.6 15 26 -7 10
Belgium-Luxembourg 9.9 3.3 3.2 3 1 3 0
Italy a 9.8 4.6 3.1 0 -2 0 …
Norway 9.5 3.8 3.1 1 2 -4 12
Spain 7.5 2.1 2.4 5 1 7 2
Denmark 6.9 1.8 2.2 6 -2 4 -6
Canada 6.3 1.9 2.0 5 5 -1 6
Singapore 4.6 1.0 1.5 8 -1 -14 3
Above 15 230.0 73.5 73.3 4 2 -1 2
Importers
United States 55.8 13.6 15.0 5 9 7 11
Japan 30.6 10.2 8.2 2 -7 -9 8
Germany 24.4 6.6 6.6 4 -3 7 -3
United Kingdom 23.5 5.7 6.3 5 17 5 3
France 19.6 6.7 5.3 1 -5 1 -2
Netherlands 14.3 4.2 3.8 3 0 9 -3
Italy a 12.6 4.2 3.4 2 -1 0 …
Korea, Rep. of 10.1 1.5 2.7 11 1 -13 12
Canada 8.1 2.2 2.2 4 7 -5 3
China 7.9 1.2 2.1 10 -4 -32 17
Spain 7.7 1.8 2.1 6 2 9 8
Belgium-Luxembourg 7.2 2.3 1.9 2 1 -2 -3
India 7.0 1.3 1.9 8 6 4 -2
Norway 6.5 2.1 1.8 2 5 -4 27
Denmark 6.4 1.5 1.7 6 4 2 -8
Above 15 240.0 65.3 65.0 4 2 0 4
a Includes Secretariat estimates.

Trad
e by
sec
tor
157
5.2 Travel services
Table IV.86
World exports of travel services, 1999
(Billion dollars and percentage)
Value 440
Annual percentage change
1990-99 6
1997 0
1998 0
1999 2
Share in world exports of commercial services 32.8
20
25
30
35
40
45
50
1998 1999199719961995199419931992
600
500
400
300
200
100
0
Share (right scale)Value (left scale)
Chart IV.17
World exports of travel servicesand share in total commercial services, 1992-99(Billion dollars and percentage)
Table IV.87
Share of travel services in total trade of commercial services by selected region, 1999(Percentage)
Exports Imports
North America 33.8 33.5
Latin America 56.0 31.7
Western Europe 30.8 31.7
European Union (15) 30.9 31.6
Africa 48.1 21.0
Asia 28.4 27.5
Japan 5.7 28.7
0 10 20 30 40 50 60
Exports
Imports
Chart IV.18
Regional shares in world trade in travelservices, 1999(Percentage)
Western Europe
Asia
North America
All other regions

Trad
e by
sec
tor
158
Table IV.88
Leading exporters and importers of travel services, 1999
(Billion dollars and percentage)
Share in world Value exports/imports Annual percentage change
1999 1990 1999 1990-99 1997 1998 1999
Exporters
United States 87.1 18.8 19.7 6 5 -1 4
Spain 32.4 7.0 7.3 6 -3 12 8
France 31.4 7.7 7.1 5 -2 7 5
Italy a 27.4 6.2 6.2 6 -1 0 …
United Kingdom 23.1 5.9 5.2 4 5 5 -2
Germany 16.7 5.4 3.8 2 -6 1 -1
China 14.1 0.7 3.2 26 18 4 12
Austria 11.1 5.1 2.5 -2 -14 1 -1
Canada 10.2 2.4 2.3 5 2 6 8
Australia 8.2 1.6 1.8 8 -3 -17 12
Switzerland 7.6 2.8 1.7 0 -11 -1 -2
Mexico 7.6 2.1 1.7 4 10 4 -4
Belgium-Luxembourg 7.3 1.4 1.6 8 8 3 34
Thailand 7.1 1.6 1.6 6 -16 -19 15
Netherlands 7.0 1.6 1.6 6 -4 8 3
Above 15 300.0 70.2 67.4 5 0 2 3
Importers
United States 62.0 14.7 15.1 6 8 8 7
Germany 48.4 13.0 11.7 4 -10 2 -1
United Kingdom 36.4 7.1 8.8 8 9 17 9
Japan 32.8 9.6 8.0 3 -11 -13 14
France 18.6 4.7 4.5 5 -7 8 4
Italy a 16.3 4.0 4.0 5 5 6 …
Hong Kong, China 13.2 1.8 3.2 12 11 6 -2
Canada 11.3 4.2 2.8 0 2 -6 5
Netherlands 11.2 2.8 2.7 5 -11 6 3
China 10.9 0.2 2.6 42 82 13 18
Belgium-Luxembourg 10.5 2.1 2.5 7 -3 6 19
Austria 9.1 3.0 2.2 2 -9 -5 -4
Sweden 8.1 2.4 2.0 3 4 18 5
Taipei, Chinese 7.4 1.9 1.8 4 1 -11 1
Switzerland 7.2 2.3 1.7 2 -8 2 1
Above 15 305.0 73.8 73.7 5 0 4 5
a Includes Secretariat estimates.

Trad
e by
sec
tor
159
5.3 Other commercial services
Table IV.89
World exports of other commercial services, 1999
(Billion dollars and percentage)
Value 600
Annual percentage change
1990-99 8
1997 8
1998 2
1999 1
Share in world trade in commercial services 44.2
Chart IV.19
World exports of other commercial servicesand share in total commercial services, 1992-99(Billion dollars and percentage)
20
25
30
35
40
45
50
1998 1999199719961995199419931992
600
500
400
300
200
100
0
Share (right scale)
Value (left scale)
Table IV.90
Share of other commercial services in total trade of commercial services by selected region, 1999(Percentage)
Exports Imports
North America 47.1 37.3
Latin America 25.9 29.1
Western Europe 46.8 44.5
European Union (15) 47.0 45.1
Africa 26.8 39.0
Asia 44.1 42.2
Japan 56.3 44.5
0 10 20 30 40 50 60
Exports
Imports
Chart IV.20
Regional shares in world trade in other commercialservices, 1999(Percentage)
Western Europe
Asia
North America
All other regions

Trad
e by
sec
tor
160
Table IV.91
Leading exporters and importers of other commercial services, 1999
(Billion dollars and percentage)
Share in world Value exports/imports Annual percentage change
1999 1990 1999 1990-99 1997 1998 1999
Exporters
United States 117.8 15.3 19.7 11 15 8 6
United Kingdom 59.6 8.1 10.0 11 21 9 6
Germany 42.6 7.6 7.1 7 1 0 1
Japan 34.0 6.8 5.7 6 3 -12 -8
France 31.2 10.1 5.2 1 -3 4 -9
Netherlands 26.8 4.3 4.5 9 5 6 9
Italy a 24.0 7.4 4.0 1 8 1 …
Belgium-Luxembourg 21.9 4.6 3.7 5 3 11 3
Canada 17.7 2.6 3.0 10 12 7 4
Hong Kong, China 16.6 2.0 2.8 12 12 -6 10
Switzerland 15.6 2.9 2.6 7 -2 9 4
Austria 15.1 2.7 2.5 8 -15 14 -6
Singapore 13.8 2.0 2.3 10 10 -49 46
Spain 13.1 1.5 2.2 13 5 15 12
Ireland 10.1 0.3 1.7 32 18 … -8
Above 15 460.0 78.2 77.0 8 8 4 3
Importers
United States 62.6 8.3 11.2 11 16 11 8
Germany 60.0 9.6 10.7 9 3 4 10
Japan 50.8 11.2 9.0 5 0 -8 -5
Italy a 29.4 8.7 5.2 2 5 10 …
France 24.9 7.1 4.4 2 -5 7 -10
Netherlands 21.9 3.7 3.9 8 6 2 4
United Kingdom 21.5 3.9 3.8 7 2 7 -3
Ireland 21.2 0.9 3.8 26 17 … -7
Canada 19.0 3.7 3.4 7 9 3 3
Belgium-Luxembourg 18.9 4.4 3.4 4 2 15 6
Spain 16.7 2.1 3.0 12 6 16 13
Austria 16.3 1.8 2.9 14 3 13 -6
Korea, Rep. of 13.1 1.1 2.3 17 3 -1 12
China 11.9 0.1 2.1 46 27 9 13
Sweden 10.9 2.3 1.9 5 9 20 12
Above 15 400.0 68.9 71.1 8 5 9 2
a Includes Secretariat estimates.

Appe
ndix
tabl
es
161
Appendix tables
Table A1
World merchandise exports, production and gross domestic product, 1989-99
(Index, 1990=100)
1989 1990 1991 1992 1993 1994 1995 1996 1997 1998 1999
World merchandise exports
Value
Total merchandise a 89 100 102 108 107 121 145 152 157 155 160
Agricultural products 96 100 101 108 104 119 139 143 142 135 131
Mining products 87 100 94 93 88 91 108 127 130 103 115
Manufactures 87 100 103 112 111 128 152 159 167 169 175
Unit value
Total merchandise a 93 100 98 100 95 98 107 106 99 93 92
Agricultural products 96 100 98 99 94 99 111 109 103 97 92
Mining products 90 100 92 87 81 80 86 96 90 67 78
Manufactures 93 100 100 103 99 102 111 109 102 99 96
Volume
Total merchandise a 95 100 104 109 113 124 136 143 158 166 174
Agricultural products 99 100 103 109 111 120 126 131 139 139 143
Mining products 97 100 103 107 108 114 126 132 144 154 147
Manufactures 94 100 104 109 112 126 137 146 163 172 182
World merchandise production
Total merchandise 99 100 100 100 100 104 107 110 115 117 120
Agriculture 98 100 100 103 103 107 109 113 115 117 118
Mining 99 100 100 100 102 107 109 112 115 117 115
Manufacturing 99 100 99 99 99 102 106 109 115 118 122
World real GDP 97 100 101 102 103 105 108 111 114 117 120
a Includes unspecified products.Note: For sources and methods, see the Technical Notes.

Appe
ndix
tabl
es
162
Table A2
Network of world merchandise trade by region, 1997-99
(Billion dollars)
North LatinDestination World a America America Western Europe C/E.Europe/Baltic States/CIS
C/ETotal EU(15) Total b Europe BS/CIS b
Origin
World 1997 5374.00 1042.20 299.96 2189.74 1992.12 237.42 116.23 121.191998 5290.00 1081.23 309.52 2297.89 2097.56 227.73 124.66 103.071999 5473.00 1203.00 294.17 2307.25 2120.55 200.09 121.78 78.31
North America 1997 903.47 327.28 138.31 168.25 152.74 8.39 3.01 5.381998 897.13 337.16 146.31 176.14 161.29 8.07 2.82 5.251999 934.01 370.19 145.76 180.95 165.96 6.09 2.62 3.47
Latin America 1997 282.67 146.13 59.40 41.07 38.66 3.16 0.95 2.211998 279.06 152.54 56.48 40.76 38.38 2.91 0.90 2.011999 296.99 183.04 47.44 38.34 36.08 2.56 0.81 1.75
Western Europe 1997 2281.80 191.03 56.57 1543.04 1403.07 128.58 79.25 49.331998 2361.86 207.94 60.68 1630.38 1488.67 132.85 89.38 43.471999 2352.54 231.88 56.82 1624.98 1492.00 120.25 87.97 32.28
European Union (15) 1997 2109.88 174.00 53.40 1429.80 1297.20 118.67 75.04 43.641998 2193.62 191.53 57.19 1517.57 1383.12 123.68 84.76 38.921999 2180.45 212.00 53.50 1511.43 1384.81 111.73 83.39 28.35
C./E. Europe/Baltic States/CIS b 1997 223.98 8.44 3.22 107.39 92.41 78.05 24.67 53.391998 215.34 9.52 3.24 113.30 99.52 66.64 23.36 43.281999 214.04 9.34 3.99 119.79 105.56 55.92 22.34 33.58
Central and Eastern Europe 1997 90.83 2.79 0.73 60.03 55.36 21.47 12.12 9.351998 101.17 3.29 0.89 71.40 66.65 20.65 12.99 7.661999 102.36 3.59 0.79 76.13 70.99 17.01 11.92 5.09
Baltic States and the CIS b 1997 133.15 5.65 2.49 47.36 37.06 56.59 12.55 44.041998 114.17 6.23 2.35 41.90 32.88 45.99 10.37 35.621999 111.68 5.75 3.21 43.66 34.57 38.91 10.42 28.49
Africa 1997 124.91 20.05 3.23 63.62 59.83 1.62 1.07 0.551998 103.18 16.01 2.82 56.80 53.74 1.42 1.00 0.421999 112.13 16.72 3.36 57.18 54.45 1.38 0.91 0.47
Middle East 1997 177.72 20.81 3.14 35.70 31.90 1.49 0.78 0.711998 137.66 19.25 2.33 31.39 28.40 1.24 0.68 0.561999 170.11 25.22 2.22 34.38 30.67 1.14 0.61 0.53
Asia 1997 1379.15 328.46 36.09 230.68 213.52 16.14 6.51 9.631998 1295.87 338.81 37.66 249.11 227.56 14.62 6.52 8.091999 1393.63 366.61 34.60 251.64 235.85 12.76 6.53 6.24
Japan 1997 420.96 124.55 13.62 71.30 65.81 2.43 1.18 1.251998 387.93 126.22 14.01 77.19 71.69 2.40 1.14 1.261999 419.36 136.60 11.48 79.43 74.50 2.02 1.23 0.78
Australia and 1997 76.99 7.22 1.32 9.71 8.73 0.69 0.34 0.35 New Zealand 1998 67.96 7.88 1.39 11.13 9.91 0.59 0.32 0.28
1999 68.53 8.07 1.15 9.73 9.20 0.47 0.25 0.22
Other Asia 1997 881.21 196.69 21.15 149.67 138.99 13.03 4.99 8.041998 839.98 204.72 22.25 160.79 145.97 11.62 5.06 6.561999 905.74 221.94 21.97 162.48 152.15 10.28 5.04 5.24

Appe
ndix
tabl
es
163
Table A2 (continued)
Network of world merchandise trade by region, 1997-99
(Billion dollars)
Africa Middle East Asia Destination
South Other Aust./Total Africa Africa Total Japan N.Zealand Other Asia
Total China Other Origin
116.26 25.81 90.45 146.36 1281.94 300.11 71.45 910.38 133.05 777.33 1997 World118.85 25.72 93.13 147.06 1045.97 248.99 69.07 727.91 124.79 603.12 1998115.92 23.16 92.75 139.23 1144.93 271.98 71.50 801.45 136.01 665.44 1999
12.97 3.37 9.60 22.62 225.29 73.70 14.92 136.67 14.54 122.14 1997 North America12.61 3.96 8.65 24.73 191.69 63.84 14.64 113.20 15.97 97.23 199811.02 3.00 8.01 22.22 197.41 63.30 14.56 119.54 14.94 104.60 1999
3.55 0.87 2.68 3.41 23.90 8.85 0.63 14.41 3.62 10.79 1997 Latin America3.45 0.60 2.85 3.30 17.97 6.57 0.56 10.83 2.80 8.03 19982.82 0.51 2.31 2.85 17.78 6.76 0.63 10.38 2.27 8.11 1999
59.66 11.68 47.98 64.27 213.80 44.51 17.90 151.38 19.38 132.00 1997 Western Europe63.54 12.26 51.28 61.24 172.11 38.69 17.08 116.34 19.89 96.45 199858.98 10.49 48.49 57.45 175.88 42.71 16.13 117.05 23.72 93.33 1999
56.84 11.17 45.67 58.26 197.56 40.18 16.90 140.48 18.36 122.12 1997 European Union (15)60.02 11.73 48.28 55.70 158.80 34.51 16.14 108.16 19.02 89.14 199855.77 10.03 45.74 51.76 161.84 38.00 15.12 108.71 23.00 85.71 1999
2.41 0.10 2.31 4.78 17.08 3.69 0.12 13.27 5.88 7.39 1997 C./E. Europe/Baltic States/CIS b2.52 0.10 2.43 4.82 13.24 2.83 0.16 10.26 4.95 5.32 19982.64 0.11 2.53 4.10 15.93 2.74 0.11 13.08 5.85 7.23 1999
1.23 1.23 0.06 1.60 2.58 0.35 0.10 2.13 2.13 0.19 1997 Central and Eastern Europe1.16 1.16 0.06 1.53 1.92 0.29 0.14 1.49 1.49 0.17 19981.12 1.12 0.05 1.21 2.25 0.26 0.10 1.90 1.90 0.32 1999
1.18 1.18 0.04 3.18 14.50 3.35 0.02 11.14 11.14 5.70 1997 Baltic States and the CIS b1.36 1.36 0.04 3.29 11.32 2.54 0.02 8.77 8.77 4.78 19981.53 1.53 0.06 2.89 13.68 2.48 0.02 11.18 11.18 5.53 1999
10.74 0.87 9.87 1.84 19.27 3.96 0.59 14.72 1.69 13.02 1997 Africa9.21 0.63 8.58 1.64 12.90 3.21 0.49 9.20 0.82 8.37 1998
11.12 0.85 10.27 1.72 15.44 3.35 0.54 11.55 1.49 10.07 1999
6.53 2.33 4.20 13.25 86.53 34.40 1.75 50.38 3.38 47.00 1997 Middle East6.10 1.70 4.40 11.70 59.09 22.90 1.15 35.04 2.84 32.20 19988.02 2.30 5.72 14.04 72.92 27.25 1.41 44.27 3.18 41.09 1999
20.41 6.60 13.81 36.19 696.08 131.00 35.54 529.54 84.55 444.99 1997 Asia21.43 6.48 14.95 39.63 578.99 110.95 34.99 433.04 77.51 355.53 199821.33 5.90 15.43 36.86 649.58 125.87 38.12 485.58 84.57 401.02 1999
4.91 1.88 3.03 10.64 187.01 - 9.36 177.65 33.62 144.03 1997 Japan4.80 1.79 3.00 12.76 144.34 - 9.21 135.13 31.41 103.72 19984.52 1.64 2.88 10.16 165.82 - 9.92 155.90 34.30 121.60 1999
1.71 0.82 0.90 2.65 52.76 14.51 7.44 30.81 3.34 27.47 1997 Australia and 1.59 0.72 0.87 2.50 42.10 12.51 6.11 23.47 2.74 20.74 1998 New Zealand1.52 0.63 0.89 2.58 44.07 12.34 7.01 24.72 2.97 21.74 1999
13.79 3.90 9.89 22.91 456.32 116.49 18.74 321.09 47.60 273.49 1997 Other Asia15.04 3.96 11.08 24.37 392.55 98.44 19.67 274.44 43.37 231.07 199815.29 3.64 11.65 24.13 439.70 113.53 21.20 304.97 47.29 257.68 1999
a Includes unspecified destinations.
b Includes the intra-trade of the Baltic States and the CIS.
Note: For sources and methods, see the Technical Notes.

Appe
ndix
tabl
es
164
Table A3
World merchandise exports by region and selected economy, 1989-99
(Million dollars)
1989 1990 1991 1992 1993 1994 1995 1996 1997 1998 1999
World a 3089000 I 3442000 3509000 3759000 I 3746000 4243000 5078000 I 5345000 5535000 5440000 5625000
North America 486145 521775 549335 583055 610305 678355 777370 827145 903465 897130 934005
Canada 121832 127629 127163 134435 145178 165376 192197 201633 214422 214327 238446 United States 363812 393592 421730 448163 464773 512627 584743 625073 688697 682497 695215
Latin America 134500 I 146800 145100 152900 I 161500 187800 228700 255600 282700 279100 297000
Antigua and Barbuda 32 33 32 53 62 45 41 44 45 45 ... Argentina 9579 12353 11978 12235 13118 15659 20967 23811 26370 26441 23333 Bahamas 946 1050 1517 1770 1450 1030 940 1030 1110 860 1090 Barbados 186 209 205 191 179 182 239 281 283 252 229 Belize 94 108 98 115 118 127 142 154 159 154 167 Bolivia 822 926 849 710 728 1032 1100 1137 1167 1103 1045 Brazil 34383 31414 31620 35793 38597 43558 46506 47747 52990 51120 48011 Chile 8080 8372 8941 10007 9198 11604 16024 15405 16663 14830 15616 Colombia 5717 6766 7232 6917 7115 8419 10125 10587 11522 10852 11576 Costa Rica 1415 1448 1598 1841 I 2625 2869 3453 3730 4268 5511 6577 Cuba 5353 I 5100 2800 1600 1000 1385 1600 2015 1970 1560 1630 Dominica 45 55 54 56 48 47 45 51 52 63 54 Dominican Republic 2241 2170 2449 2831 3211 3453 3780 4053 4614 4989 5200 Ecuador 2354 2714 2852 3007 2904 3819 4307 4900 5264 4203 4451 El Salvador 498 582 588 598 732 843 998 1024 1359 1263 1164 Grenada 28 27 23 20 22 25 23 21 20 27 ... Guatemala 1108 1163 1202 1295 1340 1521 2155 2031 2344 2582 2398 Guyana 227 251 248 302 423 456 455 517 644 484 530 Haiti 144 160 166 73 80 82 110 90 119 175 196 Honduras 859 831 792 802 814 843 1220 1316 1447 1575 1249 Jamaica 967 1135 1053 1102 1069 1212 1427 1383 1383 1312 1131 Mexico 35171 40711 42688 46196 51886 60882 79542 96000 110431 117460 136703 Netherlands Antilles 1454 1789 1599 1559 1283 1376 1522 1269 1488 1196 1360 Nicaragua 311 330 272 223 267 351 526 671 704 573 544 Panama 318 340 358 502 553 583 625 623 723 784 822 Paraguay 1009 959 737 657 725 816 919 1044 1089 1014 741 Peru 3488 3230 3329 3484 3514 4554 5575 5897 6841 5735 6114 St. Kitts and Nevis 29 28 30 33 31 30 27 31 36 38 ... St. Lucia 109 127 110 123 120 95 94 77 57 52 ... St. Vincent and the Grenadines 75 83 67 78 57 50 42 46 46 50 49 Suriname 541 472 346 357 298 294 457 500 460 440 430 Trinidad and Tobago 1578 2080 1985 1869 1662 1954 2467 2569 2569 2264 2240 Uruguay 1598 1693 1605 1703 1645 1913 2106 2397 2725 2769 2232 Venezuela 13310 17497 15155 14185 14066 16089 18457 23060 21624 17193 19852
Western Europe 1349955 I 1637120 1619250 1719020 I 1591090 1807735 2215470 2294390 2281795 2361855 2352535
Austria 31906 41265 41111 44435 40174 44913 57533 57827 58588 62584 63467 Belgium - - - - - - - - - - 176258 Belgium-Luxembourg 100012 117703 118199 123132 I 120688 139452 171001 170324 168223 I 178811 - Bosnia and Herzegovina - - - 276 95 91 152 336 570 650 ... Croatia - - - 4597 3913 4260 4632 4511 4170 4541 4268 Denmark 29570 36870 37824 41577 I 37748 42401 50594 51026 48631 48173 49043 Finland 23298 26571 23080 23981 23446 29514 40310 40448 40778 43145 41677 France 179397 216588 217100 235871 I 210319 235249 286795 I 289461 290002 305437 300362 Germany b 341231 I 421100 402843 430042 I 380075 427100 523007 524291 512448 542812 541514 Greece 7545 8105 8666 9510 I 8437 9399 10945 11880 11167 10765 11130 Iceland 1381 1592 1550 1528 1399 1623 1803 1897 1851 2050 2004 Ireland 20667 23743 24224 28331 I 29092 34080 44610 48649 53569 64284 70387 Italy 140556 170304 169465 178155 I 169164 191048 234003 252048 240225 245468 230613 Luxembourg - - - - - - - - - - 7760 Malta 844 1133 1234 1540 1355 1570 1914 1731 1641 1821 1989 Netherlands 108261 131775 133631 140335 I 139095 157941 196902 200976 193598 200769 200357 Norway 27062 34047 34107 35178 31853 34692 41991 49645 48541 39645 44884 Portugal 12799 16417 16280 18350 I 15388 17927 22596 24610 23929 24770 23901

Appe
ndix
tabl
es
165
Table A3 (continued)
World merchandise exports by region and selected economy, 1989-99
(Million dollars)
1989 1990 1991 1992 1993 1994 1995 1996 1997 1998 1999
Slovenia - - - 6681 6083 6828 8316 8312 8372 9048 8604 Spain 44492 55642 60177 64334 I 60935 73129 91613 102091 104277 109037 110100 Sweden 51547 57540 55217 56118 49857 61292 79584 84879 82883 84731 84878 Switzerland 51525 63784 61517 65678 63185 70360 81641 80843 76150 78856 80365 TFYR Macedonia - - - 1199 1055 1086 1204 1147 1236 1311 1200 Turkey 11625 12959 13594 14716 15343 18106 21637 23224 26245 26974 26028 United Kingdom 152345 185172 184964 190003 I 181645 205021 242008 261693 281556 272832 268998 Yugoslavia - - - 2929 332 240 230 2018 2677 2858 1515 Yugoslavia, former 13460 14308 13947 - - - - - - - -
European Union (15) 1243625 I 1508795 1492780 1584175 I 1466065 1668465 2051500 2120205 2109875 2193620 2180445 Extra-exports 438315 I 529135 504450 539615 552035 626675 756220 798095 812675 810495 795630
C./E. Europe/Baltic States/CIS 195620 I 105420 92905 I 100050 I 107215 123705 I 159475 I 213635 I 223975 I 215340 214035
Albania ... 230 100 70 125 140 200 215 140 210 270 Armenia - - - ... ... 55 100 I 290 235 220 235 Azerbaijan - - - ... ... 375 340 I 630 780 605 930 Belarus - - - ... ... 965 1415 I 5650 7300 7070 5920 Bulgaria 16220 I 5030 3760 3550 3580 4005 5355 4890 4940 4300 4060 Czech and Slovak Fed. Rep., former 14450 11880 11460 - - - - - - - - Czech Rep. - - - 12170 I 14465 16205 21655 21905 22775 26350 26855 Estonia - - - ... ... 735 1155 I 2080 2940 3240 2940 Georgia - - - ... ... 40 55 I 200 240 190 240 German Dem. Rep., former 22200 - - - - - - - - - - Hungary 9670 10000 10185 10705 8905 10700 12865 I 15705 19100 23005 25015 Kazakhstan - - - ... ... 1325 2195 I 5910 6495 5435 5590 Kyrgyzstan - - - ... ... 115 135 I 505 605 515 455 Latvia - - - ... ... 485 695 I 1445 1670 1810 1725 Lithuania - - - ... ... 860 I 1310 I 3355 3860 3710 3005 Moldova, Rep. of - - - ... ... 150 265 I 795 875 635 470 Poland 13470 14320 13800 14500 14140 17240 22895 24440 25750 I 28230 27405 Romania 10490 4960 4400 4500 4890 6150 7910 8085 8430 8300 8505 Russian Fed. - - - 40000 45480 51320 63320 I 88600 88330 74200 74300 Slovak Rep. - - - 6355 5460 6690 8580 8830 I 9695 10775 10245 Tajikistan - - - ... ... 380 470 I 770 745 595 690 Turkmenistan - - - ... ... 480 940 I 1695 1330 920 1600 Ukraine - - - ... ... 4345 I 5945 I 14400 14230 12635 11580 USSR, former 109120 I 59000 49200 - - - - - - - - Uzbekistan - - - ... ... 945 1675 I 3240 3510 2390 2000
Central and Eastern Europe 86500 I 46420 43705 I 51850 I 51565 61130 79460 I 84070 I 90830 I 101170 102355
Baltic States and the CIS - - - 48200 55650 62575 I 80015 I 129565 133145 114170 111680
Africa 86200 104100 99000 96900 90700 94300 107300 I 122400 124900 I 103200 112100
Algeria 9570 12930 12570 11130 10230 8880 10240 12620 13894 10213 11900 Angola 3015 3910 3427 3833 2832 3002 3880 4521 4222 2880 3950 Benin 218 288 330 363 383 391 414 424 424 414 389 Botswana 1857 1784 1849 1742 1780 1878 2142 2536 2842 1948 2500 Burkina Faso 95 152 155 157 151 245 306 310 327 319 ... Burundi 78 75 90 72 68 107 105 39 86 65 55 Cameroon 1682 2002 1834 1840 1883 1486 1651 1768 1860 1680 1430 Cape Verde 7 6 6 5 4 5 9 13 14 10 ... Central African Republic 134 120 126 124 133 151 178 147 175 182 195 Chad 155 188 194 182 131 157 184 243 237 261 305 Comoros 18 18 24 22 22 11 11 6 9 9 ... Congo 910 981 1029 1183 1068 959 1172 1555 1668 1250 ... Congo, Dem. Rep. of 1254 999 829 426 368 418 437 591 530 600 ... Côte d'Ivoire 2807 3072 2686 2840 2648 2742 3644 4281 4179 4092 4077 Djibouti 25 25 17 16 17 17 17 23 23 23 ...
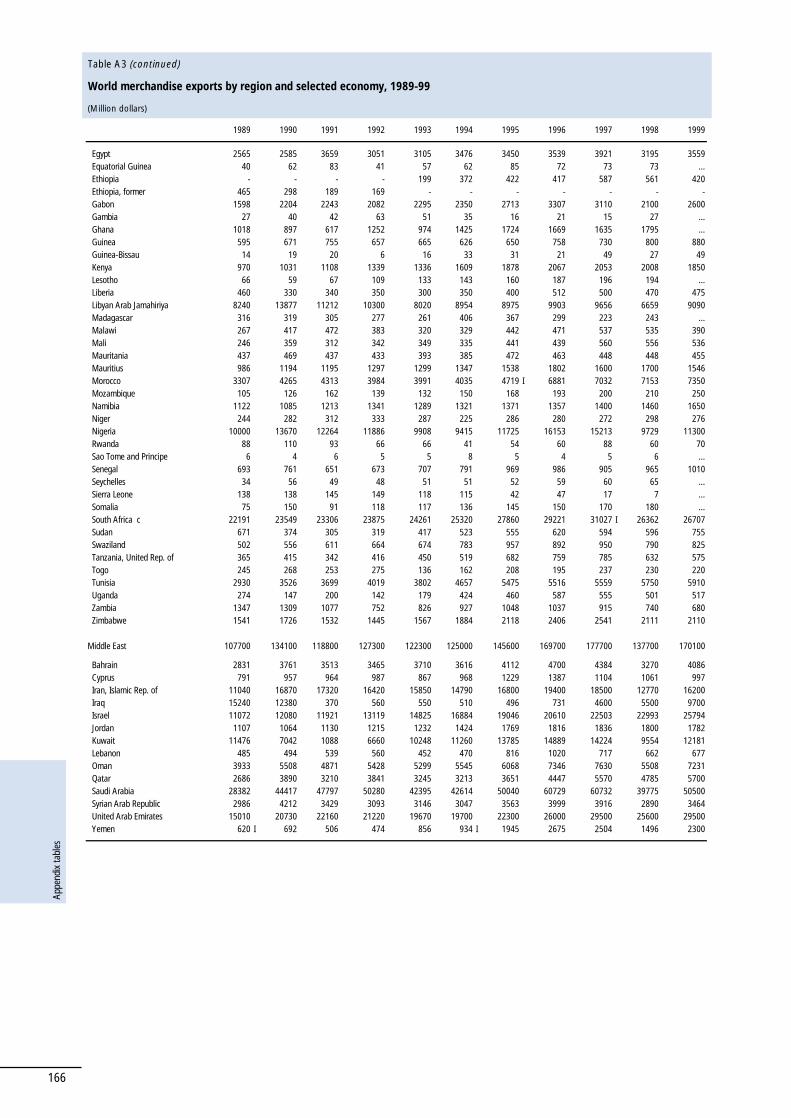
Appe
ndix
tabl
es
166
Table A3 (continued)
World merchandise exports by region and selected economy, 1989-99
(Million dollars)
1989 1990 1991 1992 1993 1994 1995 1996 1997 1998 1999
Egypt 2565 2585 3659 3051 3105 3476 3450 3539 3921 3195 3559 Equatorial Guinea 40 62 83 41 57 62 85 72 73 73 ... Ethiopia - - - - 199 372 422 417 587 561 420 Ethiopia, former 465 298 189 169 - - - - - - - Gabon 1598 2204 2243 2082 2295 2350 2713 3307 3110 2100 2600 Gambia 27 40 42 63 51 35 16 21 15 27 ... Ghana 1018 897 617 1252 974 1425 1724 1669 1635 1795 ... Guinea 595 671 755 657 665 626 650 758 730 800 880 Guinea-Bissau 14 19 20 6 16 33 31 21 49 27 49 Kenya 970 1031 1108 1339 1336 1609 1878 2067 2053 2008 1850 Lesotho 66 59 67 109 133 143 160 187 196 194 ... Liberia 460 330 340 350 300 350 400 512 500 470 475 Libyan Arab Jamahiriya 8240 13877 11212 10300 8020 8954 8975 9903 9656 6659 9090 Madagascar 316 319 305 277 261 406 367 299 223 243 ... Malawi 267 417 472 383 320 329 442 471 537 535 390 Mali 246 359 312 342 349 335 441 439 560 556 536 Mauritania 437 469 437 433 393 385 472 463 448 448 455 Mauritius 986 1194 1195 1297 1299 1347 1538 1802 1600 1700 1546 Morocco 3307 4265 4313 3984 3991 4035 4719 I 6881 7032 7153 7350 Mozambique 105 126 162 139 132 150 168 193 200 210 250 Namibia 1122 1085 1213 1341 1289 1321 1371 1357 1400 1460 1650 Niger 244 282 312 333 287 225 286 280 272 298 276 Nigeria 10000 13670 12264 11886 9908 9415 11725 16153 15213 9729 11300 Rwanda 88 110 93 66 66 41 54 60 88 60 70 Sao Tome and Principe 6 4 6 5 5 8 5 4 5 6 ... Senegal 693 761 651 673 707 791 969 986 905 965 1010 Seychelles 34 56 49 48 51 51 52 59 60 65 ... Sierra Leone 138 138 145 149 118 115 42 47 17 7 ... Somalia 75 150 91 118 117 136 145 150 170 180 ... South Africa c 22191 23549 23306 23875 24261 25320 27860 29221 31027 I 26362 26707 Sudan 671 374 305 319 417 523 555 620 594 596 755 Swaziland 502 556 611 664 674 783 957 892 950 790 825 Tanzania, United Rep. of 365 415 342 416 450 519 682 759 785 632 575 Togo 245 268 253 275 136 162 208 195 237 230 220 Tunisia 2930 3526 3699 4019 3802 4657 5475 5516 5559 5750 5910 Uganda 274 147 200 142 179 424 460 587 555 501 517 Zambia 1347 1309 1077 752 826 927 1048 1037 915 740 680 Zimbabwe 1541 1726 1532 1445 1567 1884 2118 2406 2541 2111 2110
Middle East 107700 134100 118800 127300 122300 125000 145600 169700 177700 137700 170100
Bahrain 2831 3761 3513 3465 3710 3616 4112 4700 4384 3270 4086 Cyprus 791 957 964 987 867 968 1229 1387 1104 1061 997 Iran, Islamic Rep. of 11040 16870 17320 16420 15850 14790 16800 19400 18500 12770 16200 Iraq 15240 12380 370 560 550 510 496 731 4600 5500 9700 Israel 11072 12080 11921 13119 14825 16884 19046 20610 22503 22993 25794 Jordan 1107 1064 1130 1215 1232 1424 1769 1816 1836 1800 1782 Kuwait 11476 7042 1088 6660 10248 11260 13785 14889 14224 9554 12181 Lebanon 485 494 539 560 452 470 816 1020 717 662 677 Oman 3933 5508 4871 5428 5299 5545 6068 7346 7630 5508 7231 Qatar 2686 3890 3210 3841 3245 3213 3651 4447 5570 4785 5700 Saudi Arabia 28382 44417 47797 50280 42395 42614 50040 60729 60732 39775 50500 Syrian Arab Republic 2986 4212 3429 3093 3146 3047 3563 3999 3916 2890 3464 United Arab Emirates 15010 20730 22160 21220 19670 19700 22300 26000 29500 25600 29500 Yemen 620 I 692 506 474 856 934 I 1945 2675 2504 1496 2300

Appe
ndix
tabl
es
167
Table A3 (continued)
World merchandise exports by region and selected economy, 1989-99
(Million dollars)
1989 1990 1991 1992 1993 1994 1995 1996 1997 1998 1999
Asia a 729400 792300 884700 980000 1062800 1226300 1444500 1462300 1540000 1446100 1545700
Afghanistan 236 235 188 145 140 155 155 155 150 150 ... Australia 37125 39752 41854 42824 42723 47538 53111 60300 62910 55893 56080 Bangladesh 1328 1556 1690 1942 2253 2483 3407 3539 4017 5057 5180 Bhutan 70 75 72 71 69 66 82 99 118 120 ... Brunei Darussalam 1883 2213 2675 2401 2167 2234 2389 2474 2442 2307 ... Cambodia 44 86 213 265 265 240 342 300 330 320 ... China 52538 62091 71910 84940 91744 121006 148780 151048 182877 183589 195150 Fiji 494 615 462 407 405 550 619 748 590 650 ... Hong Kong, China 73336 82390 98659 119587 135385 151465 173871 180916 188195 174863 174408 domestic exports 28730 29002 29738 30251 28831 28736 29946 27431 27306 24587 22381 re-exports 44606 53388 68921 89336 106554 122729 143925 153485 160889 150276 152027 India 15846 17975 17664 19563 21553 25022 30630 33105 35008 33626 36560 Indonesia 22160 25675 29142 33966 36823 40054 45417 49814 53443 48847 48665 Japan 273932 287581 314786 339885 362244 397005 443116 410901 420957 387927 419363 Kiribati 5 3 3 5 3 5 7 5 6 7 ... Korea, Rep. of 62377 65016 71870 76632 82236 96013 125058 129715 136164 132313 144745 Lao People’s Dem. Rep. 63 78 96 132 240 300 311 322 359 370 311 Macau, China 1627 1694 1660 1755 1768 1843 2025 2100 2282 2134 2155 Malaysia 25053 29416 34349 40713 47122 58844 73914 78327 78741 73305 84455 Maldives 45 52 54 40 35 45 49 59 73 76 64 Mongolia 721 660 348 388 380 356 473 424 452 345 336 Myanmar 215 325 419 537 583 798 851 746 866 1065 1125 Nepal 158 210 264 374 390 363 344 384 402 474 590 New Caledonia 675 449 444 409 356 355 515 492 527 398 ... New Zealand 8875 9488 9589 9824 10537 12185 13645 14452 14076 12071 12452 Pakistan 4709 5589 6528 7317 6688 7535 8176 9536 8768 8519 8884 Papua New Guinea 1404 1144 1338 1810 2491 2640 2644 2513 2163 1775 1877 Philippines 7755 8068 8767 9752 11089 13304 17501 20408 25056 29496 36650 Samoa 13 9 6 6 6 4 9 10 15 15 ... Singapore 44665 52752 59025 63484 74012 96826 118268 125014 124986 109895 114689 domestic exports 28327 34848 38485 40762 46732 58333 69557 73466 72402 63381 68691 re-exports 16338 17904 20540 22722 27280 38493 48711 51548 52584 46514 45998 Solomon Islands 75 70 83 102 129 142 168 162 175 126 ... Sri Lanka 1545 1983 2039 2455 2859 3207 3797 4095 4632 4797 4599 Taipei, Chinese 66084 67142 76115 81395 84678 92876 111563 115730 121081 110518 121637 Thailand 20078 23070 28428 32472 36775 45261 56439 55720 57388 54456 58392 Tonga 9 11 13 12 16 14 14 9 11 8 ... Tuvalu 0 0 0 0 0 0 ... ... ... ... ... Vanuatu 22 19 18 24 23 25 28 30 35 34 ... Viet Nam 1946 2404 2087 2580 2970 4054 5449 7255 9185 9361 11523
Memorandum items World excl. EU intra-exports 2284000 I 2462000 2521000 2714000 2832000 3201000 3783000 I 4023000 4238000 4057000 4241000
Western Europe excl. EU intra-exports 544645 I 657460 630920 674460 677060 765945 920190 972280 984595 978730 967720
a Includes significant re-exports.
b Figures for 1989 refer to the former Federal Republic of Germany.
c Beginning with 1998, figures refer to South Africa only and no longer to the South African Customs Union.Note: Breaks in the continuity of the value series for particular countries and regional groupings are indicated by an ’I’.
They result from (i) major adjustments in trade conversion factors for countries in Central and Eastern Europe, and in the former USSR; (ii) changes in political boundaries;(iii) inclusion of the Baltic States and the CIS mutual trade beginning with 1996; and (iv) changes in the methods of collecting and reporting merchandise trade statistics.
Details are in the Technical Notes.
It should be noted that the World and Asia totals contain a significant element of double counting due to the use of the general system of recording merchandise trade statistics
which includes re-exports.
Recent figures for a number of countries and territories have been estimated by the Secretariat.

Appe
ndix
tabl
es
168
Table A4
World merchandise imports by region and selected economy, 1989-99
(Million dollars)
1989 1990 1991 1992 1993 1994 1995 1996 1997 1998 1999
World a 3190000 I 3542000 3626000 3880000 I 3858000 4368000 5216000 I 5521000 5719000 5658000 5881000
North America 613730 641360 634145 684280 743415 845305 940405 998370 1100985 1151530 1280350
Canada 119792 123244 124782 129262 139035 155072 168426 175158 200873 206066 220183 United States 492922 516987 508363 553923 603438 689215 770852 822025 899020 944353 1059126
Latin America 118400 I 130200 147900 176800 I 193500 226000 254000 278200 328800 345200 334700
Antigua and Barbuda 228 210 215 225 230 250 260 275 300 310 ... Argentina 4203 4076 8275 14872 16784 21527 20122 23762 30450 31404 25466 Bahamas 1516 1738 1806 2100 2870 2080 1550 2960 2000 2220 1960 Barbados 673 700 694 521 574 615 771 833 996 1010 1021 Belize 216 211 256 274 280 259 257 255 286 325 366 Bolivia 611 687 970 1090 1206 1209 1424 1635 1851 1983 1755 Brazil 19875 22524 22950 23068 27740 35997 53783 56947 65077 60793 51747 Chile 7144 7678 8094 10129 11125 11824 15914 17827 19662 18779 15137 Colombia 5004 5590 4906 6516 9831 11882 13853 13683 15377 14635 10659 Costa Rica 1717 1990 1877 2440 I 3515 3789 4036 4300 4924 6230 6320 Cuba 7526 I 4600 2600 1500 1500 2055 2825 3205 3380 3500 3990 Dominica 107 118 110 111 94 96 117 129 124 136 141 Dominican Republic 3216 3006 3054 3859 4654 4903 5170 5727 6609 7597 8200 Ecuador 1855 1861 2397 2500 2561 3622 4152 3934 4954 5576 3017 El Salvador 1161 1263 1406 1699 1912 2574 2853 2670 2973 3112 3130 Grenada 99 105 121 107 118 119 130 152 166 200 ... Guatemala 1654 1649 1851 2531 2599 2781 3292 3146 3851 4651 4382 Guyana 258 311 307 442 484 506 527 597 630 565 ... Haiti 291 332 400 278 355 251 653 665 648 797 1025 Honduras 969 935 955 1037 1130 1056 1642 1839 2149 2500 2728 Jamaica 1852 1859 1491 1668 2097 2224 2818 2965 3132 2997 2587 Mexico 36400 43548 52315 65050 68439 83075 75858 93674 114846 130948 148741 Netherlands Antilles 1610 2146 2173 1869 1807 1758 1841 2519 2083 2082 2100 Nicaragua 615 638 751 855 744 874 961 1141 1532 1492 1846 Panama 986 1539 1695 2024 2188 2404 2510 2779 3002 3074 3516 Paraguay 760 1352 1460 1422 1689 2370 3144 3204 3403 3200 2275 Peru 2749 3470 4195 4861 4859 6690 9224 9472 10262 9840 8060 St. Kitts and Nevis 103 117 125 141 150 150 150 155 158 160 ... St. Lucia 274 271 295 313 300 303 307 304 332 335 ... St. Vincent and the Grenadines 127 136 139 132 134 130 135 131 188 193 201 Suriname 443 469 509 640 620 543 583 501 658 552 640 Trinidad and Tobago 1222 1262 1667 1436 1463 1134 1724 2204 3059 3012 2470 Uruguay 1202 1343 1637 2045 2325 2786 2867 3323 3727 3811 3357 Venezuela 7803 7335 11147 14065 12510 9187 12649 9880 14606 15967 14789
Western Europe 1396690 I 1700335 1711215 1789965 I 1607990 1807100 2209240 2280070 2277225 2402785 2417900
Austria 38980 49146 50815 54112 48578 55069 66263 67327 64752 68028 68763 Belgium - - - - - - - - - - 160852 Belgium-Luxembourg 98473 119702 120182 125047 I 111065 128198 156676 161304 155845 I 166798 - Bosnia and Herzegovina - - - 360 365 894 1082 1882 2199 2500 ... Croatia - - - 4500 4666 5229 7510 7788 9104 8384 7774 Denmark 28015 33333 34190 35714 I 31270 36390 45564 44984 44443 46086 44319 Finland 24436 27001 21809 21208 18032 23090 29440 30695 30665 32338 31507 France 192986 234436 231784 239638 I 203272 230019 276295 I 282367 271616 289672 290098 Germany b 269702 I 355686 389908 408619 I 342559 381539 463485 458807 445284 470656 472456 Greece 16151 19777 21580 23220 I 22035 21492 25927 28419 26971 28754 30215 Iceland 1401 1680 1760 1684 1349 1472 1755 2031 1992 2489 2503 Ireland 17420 20669 20771 22477 I 21837 25887 33058 35885 39237 44538 46396 Italy 153011 181968 182679 188451 I 148053 168930 206062 208235 209962 218168 216938 Luxembourg - - - - - - - - - - 10879 Malta 1479 1964 2130 2331 2174 2447 2890 2801 2555 2686 2860 Netherlands 104330 126098 125873 134650 I 124718 140901 177582 182907 177806 187128 187632 Norway 23666 27231 25572 25905 23956 27307 32968 35615 35708 36193 34041 Portugal 19072 25263 26113 29581 I 24147 26990 32359 35185 35022 38394 38589

Appe
ndix
tabl
es
169
Table A4 (continued)
World merchandise imports by region and selected economy, 1989-99
(Million dollars)
1989 1990 1991 1992 1993 1994 1995 1996 1997 1998 1999
Slovenia - - - 6142 6529 7304 9492 9423 9357 10110 9952 Spain 71469 87715 93306 99758 I 79609 92182 114832 121865 122710 132789 144750 Sweden 48975 54264 49990 50017 42681 51725 64556 66910 65633 68203 68455 Switzerland 58194 69681 66485 65723 60828 67997 80152 79264 75960 80094 79921 TFYR Macedonia - - - 1206 1199 1484 1719 1627 1779 1915 1913 Turkey 15792 22302 21047 22872 29174 23270 35709 43627 48585 45921 40404 United Kingdom 197731 222977 209947 221551 I 206380 227229 265210 287246 308215 315145 320251 Yugoslavia - - - 4634 550 750 900 4102 4799 4820 3215 Yugoslavia, former 14829 18871 14738 - - - - - - - -
European Union (15) 1280750 I 1558035 1578950 1654045 I 1476750 1668475 2034520 2091310 2084610 2207080 2232225 extra-imports 479840 I 576510 589445 606470 560080 623675 735495 765385 783660 819965 843410
C./E. Europe/Baltic States/CIS 193720 I 113720 97505 I 99930 I 109470 121000 I 155290 I 229905 I 246165 I 241830 213875
Albania ... 380 410 180 420 550 650 940 630 840 1230 Armenia - - - ... ... 190 340 I 855 890 900 800 Azerbaijan - - - ... ... 285 430 I 960 795 1075 1035 Belarus - - - ... ... 945 1700 I 6940 8690 8550 6665 Bulgaria 15180 I 5100 3790 4220 4900 4585 5660 5075 4930 4980 5475 Czech and Slovak Fed. Rep., former c 14260 12460 10680 - - - - - - - - Czech Rep. c - - - 12880 I 14615 17425 25265 27715 27165 28790 28825 Estonia - - - ... ... 1255 1970 I 3235 4440 4790 4115 Georgia - - - ... ... 70 230 I 685 940 885 600 German Dem. Rep., former 22200 - - - - - - - - - - Hungary 8865 10340 11370 11080 12530 14555 15465 I 18145 21235 25705 28010 Kazakhstan - - - ... ... 1355 1115 I 4240 4300 4350 3685 Kyrgyzstan - - - ... ... 105 160 I 840 710 840 600 Latvia - - - ... ... 750 I 1110 I 2320 2720 3190 2945 Lithuania - - - ... ... 1065 I 2000 I 4560 5645 5795 4835 Moldova, Rep. of - - - ... ... 180 260 I 1070 1170 1025 570 Poland 10270 11570 18390 18540 20180 22680 29050 37135 42310 I 47055 45910 Romania 8435 7600 5795 6260 6525 7110 10280 11435 11280 11840 10390 Russian Fed. - - - 33100 I 32865 36300 43055 I 68830 73615 59100 41100 Slovak Rep. c - - - 6670 6325 6610 8770 11125 I 11670 13005 11245 Tajikistan - - - ... ... 295 320 I 670 750 710 665 Turkmenistan - - - ... ... 760 610 I 1315 1230 980 1080 Ukraine - - - ... ... 2740 I 5250 I 17605 17130 14675 11845 USSR, former c 114510 I 66270 47070 - - - - - - - - Uzbekistan - - - ... ... 1190 1600 I 4210 3920 2750 2250
Central and Eastern Europe 79210 I 47450 50435 I 59830 I 65495 73515 95140 I 111570 119220 I 132215 131085
Baltic States and the CIS - - - 40100 I 43975 47485 I 60150 I 118335 126945 109615 82790
Africa 85700 94800 93500 99200 97300 104800 125600 I 124300 131500 I 132400 132500
Algeria 9208 9712 7539 8633 8781 9702 10768 9102 8691 9403 9800 Angola 1338 1578 1347 1988 1463 1633 1700 2053 2332 2120 2330 Benin 421 265 241 578 571 431 745 654 681 671 643 Botswana 1500 1946 1947 1861 1771 1640 1911 1723 2258 2387 2300 Burkina Faso 322 536 533 590 555 489 667 748 735 750 670 Burundi 187 231 248 221 204 224 234 127 121 158 118 Cameroon 1261 1400 1173 1163 1102 1083 1199 1227 1359 1520 1500 Cape Verde 112 136 147 180 154 209 252 234 235 240 ... Central African Republic 150 154 92 145 125 139 175 180 232 280 300 Chad 240 285 249 243 200 136 250 244 246 264 320 Comoros 43 52 58 76 59 53 63 64 55 54 ... Congo 518 621 472 687 581 631 670 590 540 470 520 Congo, Dem. Rep. of 849 887 710 419 372 381 397 424 318 322 370 Côte d'Ivoire 2111 2097 2103 2317 2014 1917 2945 2902 2781 3196 3270 Djibouti 197 215 214 219 230 243 275 308 310 320 ...

Appe
ndix
tabl
es
170
Table A4 (continued)
World merchandise imports by region and selected economy, 1989-99
(Million dollars)
1989 1990 1991 1992 1993 1994 1995 1996 1997 1998 1999
Egypt 7434 9216 7862 8245 8184 10219 11760 13038 13211 16166 16022 Equatorial Guinea 51 61 117 92 59 37 50 85 80 32 ... Ethiopia 943 1081 472 799 787 1033 1145 1401 1420 1450 1740 Ethiopia, former 943 1081 472 799 - - - - - - - Gabon 767 918 834 700 845 756 882 969 1034 1160 1200 Gambia 161 199 222 234 243 212 182 258 278 245 192 Ghana 1273 1205 1055 2169 2575 2108 1906 2108 2326 2563 ... Guinea 589 723 735 740 730 706 750 859 1000 1090 1100 Guinea-Bissau 69 68 67 84 62 164 133 87 89 63 95 Kenya 2148 2125 1797 1713 1711 2091 2991 2949 3279 3197 2850 Lesotho 617 672 813 977 912 845 986 999 1025 863 910 Liberia 323 220 259 314 323 280 350 405 400 380 ... Libyan Arab Jamahiriya 4923 5336 5361 4530 5080 5548 5392 5873 6123 5466 5850 Madagascar 342 571 450 448 468 441 543 507 470 514 ... Malawi 503 581 703 718 546 497 475 624 781 637 660 Mali 502 619 671 608 634 589 792 843 760 762 751 Mauritania 345 387 421 461 400 352 293 346 316 319 ... Mauritius 1325 1618 1576 1630 1715 1930 1976 2289 2189 2073 2138 Morocco 5493 6800 6873 7348 6760 7188 8563 I 9704 9525 10290 10610 Mozambique 808 878 899 855 955 1019 784 744 760 910 1040 Namibia 1259 1163 1149 1283 1188 1196 1468 1580 1600 1680 1700 Niger 363 388 355 479 375 328 373 448 391 414 396 Nigeria 4187 5627 9031 8119 7508 6512 9332 7996 10330 10002 10370 Rwanda 333 288 306 288 332 236 236 258 297 285 270 Sao Tome and Principe 18 27 31 31 30 39 31 35 20 25 ... Senegal 1221 1219 1173 1034 1087 1022 1243 1268 1335 1437 1530 Seychelles 165 186 172 192 238 206 232 274 340 403 ... Sierra Leone 183 149 163 146 147 150 133 211 93 95 81 Somalia 72 95 55 65 263 269 193 170 180 180 ... South Africa d 18498 18399 18834 19761 20017 23387 30555 30126 32998 I 29242 26696 Sudan 1335 618 890 820 944 1227 1218 1547 1580 1915 1412 Swaziland 583 663 718 866 873 927 1104 1174 1192 1030 1100 Tanzania, United Rep. of 990 1027 1533 1510 1497 1504 1675 1388 1366 1514 1781 Togo 472 581 443 394 179 222 594 664 645 631 620 Tunisia 4374 5542 5189 6431 6214 6580 7902 7700 7914 8338 8476 Uganda 271 213 196 439 535 875 1056 1191 1316 1414 1341 Zambia 906 1220 790 795 809 594 700 835 819 700 720 Zimbabwe 1623 1847 2055 2203 1819 2241 2660 2803 3074 2772 2830
Middle East 93300 99200 111400 129600 121400 117300 130400 139500 150800 145900 149700
Bahrain 3134 3712 4115 4263 3858 3747 3716 4273 4026 3463 3405 Cyprus 2288 2568 2620 3313 2590 3017 3690 3979 3698 3685 3618 Iran, Islamic Rep. of 12807 15716 21688 23200 15540 10900 11230 13050 14000 12500 13200 Iraq 11600 7660 540 870 700 620 720 950 4260 4600 6800 Israel 14347 16793 18848 20261 22623 25237 29578 31620 30781 29342 33160 Jordan 2126 2600 2508 3255 3539 3381 3697 4293 4102 3836 3728 Kuwait 6295 3972 4761 7261 7036 6697 7790 8373 8246 8619 7617 Lebanon 2237 2529 3747 4202 4821 5933 7278 7575 7464 7070 6207 Oman 2255 2681 3194 3769 4114 3914 4247 4578 5026 5682 4674 Qatar 1326 1695 1720 2015 1891 1927 3108 2952 4424 3797 4200 Saudi Arabia 21154 24069 29079 33698 28198 23338 28091 27765 28742 30013 28032 Syrian Arab Republic 2084 2400 2767 3490 4139 5467 4709 5380 4028 3895 3832 United Arab Emirates 10010 11199 13746 17410 19520 21024 20984 22638 29951 27210 28870 Yemen 1610 I 1571 2025 2587 2821 2087 1580 2038 2014 2167 2380

Appe
ndix
tabl
es
171
Table A4 (continued)
World merchandise imports by region and selected economy, 1989-99
(Million dollars)
1989 1990 1991 1992 1993 1994 1995 1996 1997 1998 1999
Asia a 688600 762200 830000 899900 985300 1146300 1401200 1470800 1483600 1238000 1351600
Afghanistan 822 936 616 411 380 370 450 450 450 450 ... Australia 44933 42032 41697 43807 45577 53425 61282 65427 65892 64630 69113 Bangladesh 2955 3432 3137 3467 3526 3420 5438 6225 6784 7018 7740 Bhutan 100 108 102 134 100 92 111 131 137 120 ... Brunei Darussalam 859 1001 1208 1482 1822 1874 2078 2487 2180 1741 1500 Cambodia 135 164 245 351 404 500 631 467 660 680 ... China 59142 53345 63791 80585 103959 115615 132084 138833 142189 140305 165788 Fiji 581 753 652 630 720 829 867 984 965 721 ... Hong Kong, China a 77662 84725 103883 127340 141308 165894 196072 201284 213297 186759 180716 retained imports 33056 31337 34962 38004 34754 43165 52147 47799 52408 36483 28689 India 20535 23642 20418 23580 22761 26846 34707 37942 41432 42742 44589 Indonesia 16444 21837 25869 27280 28327 31985 40630 42929 41694 27337 24004 Japan 209715 235368 236999 233246 241624 275235 335882 349152 338754 280484 311262 Kiribati 23 27 26 37 28 26 35 33 35 36 ... Korea, Rep. of 61465 69844 81525 81775 83800 102348 135119 150339 144616 93282 119750 Lao People’s Dem. Rep. 185 201 215 253 432 564 588 689 706 553 525 Macau, China 1480 1532 1842 1949 1992 2098 2025 1992 2077 1948 2036 Malaysia 22496 29258 36648 39926 45657 59600 77691 78418 79030 58319 64966 Maldives 113 138 161 189 185 221 267 301 348 354 402 Mongolia 963 924 360 418 361 258 415 451 468 503 426 Myanmar 201 270 646 651 814 885 1334 1358 2037 2666 2300 Nepal 580 686 758 792 880 1155 1333 1398 1693 1246 1390 New Caledonia 766 883 863 917 849 876 912 1005 937 963 ... New Zealand 8784 9501 8381 9202 9636 11913 13958 14724 14518 12495 14301 Pakistan 7143 7546 8633 9595 9719 9094 11725 12411 11663 9335 10782 Papua New Guinea 1530 1193 1614 1485 1299 1522 1451 1740 1697 1232 1188 Philippines 11171 13041 12786 15449 18754 22641 28341 34126 38676 31552 32546 Samoa 75 80 94 110 105 81 95 100 96 96 115 Singapore a 49667 60899 66293 72179 85234 102670 124507 131338 132437 101496 111060 retained imports 33329 42995 45753 49457 57954 64177 75796 79790 79853 54982 65062 Solomon Islands 114 94 110 98 137 142 166 170 180 155 ... Sri Lanka 2188 2685 3054 3445 3991 4767 5306 5442 5851 5889 5893 Taipei, Chinese 52507 54831 63078 72181 77099 85507 103698 101287 113924 104946 110698 Thailand 25771 33379 37591 40686 46208 54459 70786 72331 62853 42971 50305 Tonga 54 62 59 63 61 69 77 75 73 80 ... Tuvalu 5 5 5 5 7 8 9 8 10 10 ... Vanuatu 71 96 83 82 78 89 95 98 94 88 ... Viet Nam 2565 2752 2338 2540 3924 5826 7500 11144 11592 11494 11600
Memorandum items
World excl. EU intra-imports 2389000 2560000 2636000 2832000 2941000 3323000 3917000 4195000 4418000 4271000 4492000
Western Europe excl. EU intra-imports 595780 I 718810 721710 742390 691320 762300 910215 954145 976275 1015670 1029085
a Includes significant imports for re-export.
b Figures for 1989 refer to the former Federal Republic of Germany.
c Imports are valued f.o.b.
d Beginning with 1998, figures refer to South Africa only and no longer to the South African Customs Union.
Note: Breaks in the continuity of the value series for particular countries and regional groupings are indicated by an ’I’.
They result from (i) major adjustments in trade conversion factors for countries in Central and Eastern Europe, and in the former USSR; (ii) changes in political boundaries;
(iii) inclusion of the Baltic States and the CIS mutual trade beginning with 1996; and (iv) changes in the methods of collecting and reporting merchandise trade statistics.
Details are in the Technical Notes.
It should be noted that the World and Asia totals contain a significant element of double counting due to the use of the general system of recording merchandise trade statistics
which includes imports for re-exports.
Recent figures for a number of countries and territories have been estimated by the Secretariat.

Appe
ndix
tabl
es
172
Table A5
World exports of commercial services by selected region and economy, 1989-99
(Million dollars)
1989 1990 1991 1992 1993 1994 1995 1996 1997 1998 1999
World 657000 782700 824200 921300 939000 1035400 1187500 1269800 1321900 1331600 1350000
North America 130100 150500 166500 177800 186500 203800 222600 244300 265600 272200 287500
Canada 16776 18350 19550 20030 21211 23210 25425 28601 30735 32272 34161 United States 113340 132184 146979 157808 165301 180562 197161 215703 234834 239957 253358
Latin America 26200 29700 30900 34600 36700 41400 44500 46700 50100 53500 53400
Antigua and Barbuda 259 308 317 339 374 396 348 367 ... ... ... Argentina 2086 2264 2174 2893 3050 3280 3705 4278 4357 4532 4288 Aruba 338 398 464 559 588 605 626 751 799 877 972 Bahamas 1442 1465 1313 1361 1434 1490 1523 1558 1573 1517 1789 Barbados 675 627 594 591 663 785 890 934 933 995 ... Belize 61 83 89 108 116 109 117 125 124 122 ... Bolivia 130 133 143 150 165 177 174 167 232 238 243 Brazil 3070 3706 3268 4002 3911 4817 6005 4453 5488 7083 6763 Chile 1479 1786 2060 2283 2441 2764 3249 3575 4017 4030 3701 Colombia 1252 1548 1540 1932 2457 1597 1703 2127 2074 1999 1840 Costa Rica 473 583 662 808 1005 1163 957 1042 1117 1315 ... Cuba ... ... ... 743 832 1160 1419 1841 2071 2350 ... Dominica 24 33 37 44 47 53 54 59 71 72 ... Dominican Republic 1032 1086 1187 1337 1491 1737 1894 2078 2373 2421 2829 Ecuador 486 508 524 584 619 706 809 811 779 761 763 El Salvador 320 301 284 338 291 338 342 318 276 277 328 Grenada 53 63 71 75 87 100 98 105 ... ... ... Guatemala 219 313 422 580 625 659 628 533 542 581 653 Guyana ... ... ... 102 112 117 130 ... ... ... ... Haiti 79 43 48 33 26 7 98 104 172 178 ... Honduras 133 121 159 186 191 207 221 277 328 361 416 Jamaica 829 976 950 1060 1211 1452 1568 1574 1672 1727 1795 Mexico 6396 7222 7876 8150 8296 10075 9585 10693 11214 11937 11829 Netherlands Antilles 932 1130 1191 1302 1323 1382 1656 1574 1604 1604 1628 Nicaragua 17 34 50 51 72 92 120 146 186 220 255 Panama 828 907 1019 1029 1071 1172 1298 1356 1442 1563 1589 Paraguay 384 404 419 350 424 411 484 486 504 469 412 Peru 753 715 742 751 741 951 1043 1322 1445 1653 1608 St. Kitts and Nevis 50 54 68 79 83 91 ... ... ... ... ... St. Lucia 134 149 171 191 205 237 265 269 ... ... ... St. Vincent and the Grenadines 37 41 43 56 61 61 72 92 ... ... ... Suriname 35 31 33 36 45 70 101 ... ... ... ... Trinidad and Tobago 268 322 397 444 343 317 331 447 535 574 ... Uruguay 425 460 590 822 1020 1324 1309 1388 1413 1309 1269 Venezuela 898 1121 1148 1206 1230 1454 1529 1448 1364 1297 ...
Western Europe 335500 416000 427100 477400 459000 492800 565100 589100 601600 644700 640100
Austria 18006 22755 25096 26914 26326 27494 31692 33425 29214 31817 30510 Belgium-Luxembourg 20425 24690 26665 29233 28911 35392 33619 33064 34097 36688 39036 Croatia - - - ... 2286 2857 2451 3297 4011 3964 3708 Denmark 9443 12731 14236 14034 12479 13578 15171 16341 14044 15212 15823 Finland 3957 4562 4021 4560 4331 5415 7334 7060 6569 6693 6574 France 58606 66274 70080 74536 73796 74688 83108 82585 80269 84627 82577 Germany a 39708 I 51605 53449 58758 56574 59011 75182 79346 78023 79281 79305 Greece 4766 6514 7142 8641 8153 9142 9528 9262 9224 10068 ... Iceland 372 440 451 455 502 527 586 653 724 840 843 Ireland 2405 3286 3492 3850 3574 4145 4799 5562 6046 I 15889 13985 Italy 30924 48579 45916 57662 51745 53170 61173 64913 66409 66621 61177 Malta 628 721 781 862 892 975 1062 1097 1144 1217 1284 Netherlands 24058 29621 32162 37878 37813 41678 46754 48699 50396 52484 54232 Norway 10564 12452 12982 12450 11900 11915 13133 13951 14427 13953 15406 Portugal 3705 5054 5170 5433 6795 6701 8161 7876 7533 8512 8280 Slovenia - - - 1219 1391 1802 2012 2117 2032 2045 1947 Spain 24370 27649 28810 33535 30085 33465 39760 43985 43828 48977 53001 Sweden 11129 13453 14382 15877 12298 13383 15336 16669 17505 17675 18408 Switzerland 15256 18232 19079 20328 20755 21898 25042 25339 24483 25795 26319 TFYR Macedonia - - - 116 117 128 147 151 127 130 ... Turkey 6291 7882 8163 9262 10518 10723 14475 12895 19193 23161 16031 United Kingdom 45400 53172 52557 60043 57761 64702 74572 80813 92332 99007 101517 Yugoslavia, former 5441 6374 2465 - - - - - - - -
European Union (15) 296902 369943 383179 430954 410641 441964 506187 529599 535489 573549 574475

Appe
ndix
tabl
es
173
Table A5 (continued)
World exports of commercial services by selected region and economy, 1989-99
(Million dollars)
1989 1990 1991 1992 1993 1994 1995 1996 1997 1998 1999
C./E. Europe/Baltic States/CIS
Albania 40 32 9 19 73 79 94 123 52 83 253 Armenia - - - ... ... 12 27 75 97 118 132 Azerbaijan - - - ... ... ... 166 139 332 320 ... Belarus - - - ... 185 251 466 907 919 870 ... Bulgaria 1223 837 400 1070 1171 1257 1431 1366 1307 1766 1756 Czech Rep. - - - - 4679 5120 6638 8071 7033 7366 6807 Czech and Slovak Fed. Rep., former 2767 2563 2806 3952 - - - - - - - Estonia - - - 200 326 508 868 1100 1314 1476 1486 Georgia - - - ... ... ... ... ... ... 278 ... Hungary 1263 2677 2354 3213 2768 3046 5122 5920 5684 5881 5608 Kazakhstan - - - ... ... ... 535 674 842 904 933 Kyrgyzstan - - - ... 9 33 39 31 40 58 ... Latvia - - - 290 529 651 718 1121 1027 1103 1026 Lithuania - - - ... 198 322 482 786 1020 1096 1083 Moldova, Rep. of - - - ... ... 33 144 111 130 117 105 Poland 3201 3200 3687 4773 4201 6655 10637 9786 8969 10890 9961 Romania 834 610 680 659 799 1023 1476 1552 1500 1192 1342 Russian Fed. - - - ... ... 8425 10568 13283 14079 12373 9087 Slovak Rep. - - - - 1939 2221 2378 2060 2151 2275 2058 Ukraine - - - ... ... 2747 2846 4799 4937 3922 3771
Africa 15000 18800 18900 21500 21500 22200 25300 27700 27700 27000 29200
Algeria 476 479 375 ... ... ... ... ... ... ... ... Angola 150 65 117 95 89 150 113 226 182 114 116 Benin 78 109 123 125 116 114 159 123 102 ... ... Botswana 82 183 186 168 174 175 236 145 187 241 ... Burundi 5 7 8 7 7 6 4 4 3 ... ... Cameroon 457 369 397 386 363 309 242 ... ... ... ... Cape Verde 22 30 29 30 34 39 57 65 79 74 ... Central African Republic 15 17 16 16 17 ... ... ... ... ... ... Congo 73 65 65 54 40 49 55 68 45 ... ... Côte d'Ivoire 376 425 420 479 483 419 426 473 443 461 454 Djibouti ... ... ... 34 38 33 28 ... ... ... ... Egypt 3372 4813 6140 7054 7076 7693 8262 9079 9096 7832 9276 Ethiopia 253 261 234 I 224 250 266 310 321 318 348 ... Gabon 266 214 291 312 286 200 248 ... ... ... ... Gambia 46 55 59 69 63 75 38 87 94 ... ... Ghana 74 79 95 109 133 136 139 144 152 162 ... Guinea 64 91 87 84 46 14 17 63 70 66 36 Kenya 624 774 739 748 761 815 851 789 716 638 632 Lesotho 27 34 34 33 29 30 30 34 79 46 ... Libyan Arab Jamahiriya 80 83 73 67 31 25 24 20 20 37 ... Madagascar 113 129 125 143 153 183 219 253 243 264 ... Malawi 31 37 39 29 30 22 ... ... ... ... ... Mali 65 71 57 63 62 51 68 66 62 ... ... Mauritania 22 14 19 10 15 17 19 23 25 24 ... Mauritius 368 478 522 573 561 629 773 955 889 911 1065 Morocco 1533 1871 1492 1968 1857 1877 2020 2433 2203 2558 2818 Mozambique 95 103 147 165 180 191 242 253 279 286 ... Namibia ... 106 123 150 212 245 301 325 367 315 ... Nigeria 552 965 886 1053 1163 371 608 733 786 884 980 Rwanda 33 31 28 20 21 ... 11 13 34 31 ... Senegal 272 356 296 336 268 309 364 315 329 ... ... Seychelles 134 162 156 182 201 186 200 222 231 263 ... Sierra Leone 13 45 51 36 45 86 71 ... ... ... ... South Africa 2699 3442 3051 3211 3120 3556 4414 4808 5150 5109 4780 Sudan 163 134 37 135 39 44 82 37 30 14 82 Swaziland 87 102 85 94 87 110 150 98 122 102 70 Tanzania, United Rep. of 117 131 142 170 311 411 566 602 470 534 636 Togo 98 114 87 93 55 52 64 102 78 65 ... Tunisia 1328 1575 1308 1887 1953 2174 2401 2527 2518 2607 2763 Uganda ... ... 21 35 94 64 104 145 165 ... ... Zambia 78 94 69 ... ... ... ... ... ... ... ... Zimbabwe 226 253 259 277 345 390 469 601 663 646 ...

Appe
ndix
tabl
es
174
Table A5 (continued)
World exports of commercial services by selected region and economy, 1989-99
(Million dollars)
1989 1990 1991 1992 1993 1994 1995 1996 1997 1998 1999
Middle East
Bahrain 807 359 411 543 652 819 683 666 637 725 764 Cyprus 1398 1760 1568 2217 2045 2398 2715 2609 2544 2657 2893 Iran, Islamic Rep. of 321 343 484 457 1048 410 533 743 1018 902 ... Israel 4334 4546 4647 5780 5940 6549 7713 8031 8348 8980 10309 Jordan 1221 1430 1333 1435 1560 1543 1689 1830 1717 1810 1770 Kuwait 1123 1054 756 1269 1027 1189 1143 1262 1507 1496 1416 Oman 59 68 61 13 13 13 13 18 18 18 ... Saudi Arabia 2510 3031 2908 3466 3283 3347 3480 2772 4257 4730 5156 Syrian Arab Republic 756 740 866 1085 1383 1616 1712 1581 1366 1551 ... Yemen - 82 89 120 135 104 141 147 168 166 ...
Asia 117300 131100 143900 164800 187000 220600 261600 285900 299300 255100 263500
Australia 8515 9833 10644 10854 11611 13767 15741 18106 18102 15827 17201 Bangladesh 268 296 344 393 435 419 469 223 266 252 266 Cambodia ... ... ... 50 59 45 103 152 150 99 118 China 4452 5748 6864 9108 10992 16354 18430 20567 24504 23879 23695 Fiji 326 377 382 413 438 489 524 566 616 475 ... Hong Kong, China 16167 18128 20574 24290 27690 31142 34338 38295 38514 33653 34853 India 4092 4609 4905 4893 5034 6031 6763 7179 8926 11067 13940 Indonesia 1875 2488 2822 3391 3878 4680 5342 6462 6792 4340 4624 Japan 40260 41384 43465 47621 51611 56776 63966 66382 68136 61795 60313 Korea, Rep. of 8440 9155 9690 10479 12479 16233 22133 22648 25439 23843 24822 Lao People’s Dem. Rep. 10 11 19 36 55 56 68 79 78 116 ... Macau, China 1164 1473 1769 2245 2479 2723 3154 3252 3163 2845 2688 Malaysia 2779 3769 4285 4880 6294 9200 11438 14345 14868 10249 11986 Maldives 86 101 107 153 158 195 230 286 307 327 ... Mongolia 36 48 27 29 25 35 47 43 50 75 73 Myanmar 57 93 56 102 232 256 350 417 508 529 ... Nepal 161 166 201 210 284 527 592 679 795 433 454 New Zealand 2342 2415 2509 2580 2804 3599 4400 4553 4234 3684 4246 Pakistan 979 1218 1266 1294 1330 1444 1432 1546 1446 ... ... Papua New Guinea 148 198 267 329 307 235 321 432 397 318 248 Philippines 2682 2897 3313 4565 4617 6749 9323 12929 15130 I 7465 I 4778 Samoa 30 34 27 33 33 40 53 62 59 58 ... Singapore 9570 12719 13730 16102 18497 22939 29724 29572 30121 18829 23612 Solomon Islands 20 19 24 29 36 42 35 47 64 52 ... Sri Lanka 324 425 524 602 619 729 800 741 850 888 ... Taipei, Chinese 7063 6937 8389 10140 13229 13115 14927 16154 17021 16660 14518 Thailand 5318 6292 7132 9162 10877 11425 14652 16704 15619 13074 14142 Tonga 10 11 13 13 12 ... ... ... ... ... ... Vanuatu 39 56 60 65 64 70 75 85 80 110 ... Viet Nam ... 182 449 724 772 1283 2147 2711 2536 2609 ...
a Figures for 1989 to mid-1990 refer to the former Federal Republic of Germany.Note: Due to frequent revisions to the services data, there are numerous breaks in the continuity of the data series at the country and regional levels.
See the Technical Notes.

Appe
ndix
tabl
es
175
Table A6
World imports of commercial services by selected region and economy, 1989-99
(Million dollars)
1989 1990 1991 1992 1993 1994 1995 1996 1997 1998 1999
World 679400 812400 841400 932000 946900 1030200 1187600 1253700 1291000 1313700 1345300
North America 108600 125400 129400 130900 140200 151700 162200 173000 190700 203000 218900
Canada 23692 27479 29434 30080 31873 32088 32985 35422 37710 37201 38469 United States 84954 97940 99923 100777 108307 119588 129264 137581 152952 165827 180415
Latin America 28900 34700 37300 42500 48000 52000 54400 56300 63700 66600 62400
Antigua and Barbuda 88 103 109 119 127 128 136 150 ... ... ... Argentina 2534 2876 3769 5210 6173 6865 6911 7489 8404 8795 8184 Aruba 79 111 123 129 137 198 207 483 557 528 685 Bahamas 491 520 501 475 531 593 605 669 790 939 904 Barbados 223 237 209 194 249 299 347 365 389 409 ... Belize 50 54 59 71 82 86 88 88 87 94 ... Bolivia 280 291 291 290 299 314 321 337 401 423 435 Brazil 5092 6733 6381 6609 9156 9836 13161 12200 14447 15743 11924 Chile 1906 1983 1991 2419 2625 2868 3524 3786 3917 4077 3959 Colombia 1510 1683 1750 1959 2246 2585 2829 3317 3572 3472 3221 Costa Rica 478 540 523 700 801 846 895 1020 1017 1168 ... Cuba ... ... ... 375 355 497 574 469 528 536 ... Dominica 25 30 28 30 28 35 37 40 46 45 ... Dominican Republic 460 435 474 546 815 911 957 1100 1160 1300 1351 Ecuador 583 755 867 888 1097 1091 1202 1170 1427 1498 1264 El Salvador 365 296 308 349 370 409 488 481 354 539 630 Grenada 28 30 33 33 36 39 37 44 ... ... ... Guatemala 356 363 328 500 548 602 672 638 627 759 760 Guyana ... ... ... 131 141 157 168 ... ... ... ... Haiti 143 71 73 35 30 64 236 241 321 370 ... Honduras 224 213 220 236 288 304 326 326 359 396 427 Jamaica 690 667 639 674 785 923 1073 1118 1196 1233 1264 Mexico 7654 10063 10676 11642 11771 12391 9021 9968 11812 12621 13796 Netherlands Antilles 402 510 535 603 588 665 719 794 730 771 878 Nicaragua 58 73 77 116 106 160 207 239 229 264 319 Panama 556 666 820 886 942 1030 1049 1001 1244 1129 1057 Paraguay 273 361 385 391 510 569 672 611 619 535 464 Peru 1048 1071 1157 1330 1328 1484 1800 1990 2208 2191 2050 St. Kitts and Nevis 28 34 34 38 45 43 ... ... ... ... ... St. Lucia 71 78 76 82 84 99 119 135 ... ... ... St. Vincent and the Grenadines 32 30 31 39 42 50 53 53 ... ... ... Suriname 137 150 147 154 92 99 146 ... ... ... ... Trinidad and Tobago 423 460 512 545 455 424 223 199 232 235 ... Uruguay 393 363 388 516 711 821 814 795 840 831 850 Venezuela 1873 2390 3272 4106 4361 4525 4654 4625 5353 4824 ...
Western Europe 313400 391800 397000 447000 424100 456900 529100 549900 552700 604300 609300
Austria 11452 14104 15239 17844 19081 20594 27552 29195 28431 30035 28274 Belgium-Luxembourg 20843 24298 26392 28368 27457 33550 32511 31419 31437 34095 36584 Croatia - - - ... 1148 1224 1410 1717 1980 1890 2029 Denmark 8476 10106 10370 10665 10402 11997 13945 14642 13727 15779 15201 Finland 6054 7432 7514 7424 6469 7094 9418 8612 8039 7677 7556 France 45018 50455 52780 54572 55737 56177 64523 65617 62086 65420 63118 Germany a 61140 I 79214 84536 97864 95710 104091 125308 128061 123777 128819 132816 Greece 2202 2756 2950 3436 3187 3420 4003 3830 4196 4976 ... Iceland 472 547 595 582 588 567 630 728 788 947 1000 Ireland 4312 5145 5630 7050 6724 8404 11252 13416 15158 I 28790 26069 Italy 31901 46602 44236 57962 48730 48075 54613 57030 58944 62887 58376 Malta 417 499 503 564 588 668 790 804 764 817 869 Netherlands 24885 28995 33201 37799 37241 40316 44609 44680 44528 46797 47465 Norway 10523 12247 12528 12103 11385 11905 13036 13422 14655 15211 17683 Portugal 2613 3772 4158 4486 5258 5255 6339 6227 6056 6708 6519 Slovenia - - - 1034 1010 1112 1376 1409 1439 1520 1569 Spain 11418 15197 16385 20249 17594 17906 20970 23521 23903 27038 29998 Sweden 14297 16959 17239 18976 13255 14594 17112 18651 19427 21620 23006 Switzerland 9097 11086 10978 11800 11427 12844 15107 15772 14173 15273 16106 TFYR Macedonia - - - 225 230 251 289 300 266 297 ... Turkey 2208 2794 2931 3277 3591 3418 4654 6032 8085 9441 8376 United Kingdom 37796 44608 43288 49090 47336 53441 59613 64804 70814 78231 81376 Yugoslavia, former 8245 15012 5586 - - - - - - - -
European Union (15) 282407 349642 363918 415786 394180 424914 491768 509705 510522 558872 561370

Appe
ndix
tabl
es
176
Table A6 (continued)
World imports of commercial services by selected region and economy, 1989-99
(Million dollars)
1989 1990 1991 1992 1993 1994 1995 1996 1997 1998 1999
C./E. Europe/Baltic States/CIS
Albania 28 29 33 87 158 128 98 134 93 119 152 Armenia - - - ... 40 41 52 129 157 175 171 Azerbaijan - - - ... ... ... 297 433 714 692 ... Belarus - - - ... 125 197 276 330 354 431 ... Bulgaria 785 600 486 1165 1229 1246 1278 1246 1157 1398 1465 Czech Rep. - - - - 3701 4685 4860 6198 5305 5665 5624 Czech and Slovak Fed. Rep., former 2059 2419 1935 2365 - - - - - - - Estonia - - - 123 185 331 420 525 649 814 829 Georgia - - - ... ... ... ... ... ... 335 ... Hungary 1601 2264 1882 2526 2535 2875 3542 3446 3404 4082 4188 Kazakhstan - - - ... ... ... 776 928 1124 1154 1104 Kyrgyzstan - - - ... 51 69 193 247 169 177 ... Latvia - - - 120 179 211 225 703 637 717 628 Lithuania - - - ... 177 266 457 639 850 816 747 Moldova, Rep. of - - - ... ... 74 204 170 191 191 156 Poland 3053 2847 2994 4045 3631 3746 7008 6314 5681 6559 7622 Romania 450 787 819 946 914 1166 1801 1924 1899 1838 1753 Russian Fed. - - - ... ... 15140 19971 18405 18836 16219 12427 Slovak Rep. - - - - 1666 1549 1800 1997 2062 2272 1797 Ukraine - - - ... ... 1538 1334 1625 2268 2545 2292
Africa 23400 27000 28400 29500 30500 30800 34800 35900 36600 36100 35200
Algeria 1098 1155 999 ... ... ... ... ... ... ... ... Angola 1142 1288 1737 1854 1402 1425 1665 1738 1605 1605 1789 Benin 104 113 169 157 149 155 235 189 170 ... ... Botswana 207 371 379 355 322 317 440 339 435 517 ... Burundi 48 59 67 62 54 59 62 29 33 ... ... Cameroon 981 1018 1115 885 723 477 485 ... ... ... ... Cape Verde 22 23 17 22 25 30 55 62 66 85 ... Central African Republic 135 166 135 152 131 114 ... ... ... ... ... Congo 476 748 780 734 843 983 766 708 553 ... ... Côte d'Ivoire 1114 1518 1298 1349 1258 899 1234 1296 1235 1341 1307 Djibouti ... ... ... 104 106 84 77 ... ... ... ... Egypt 2856 3327 2998 4646 5164 5382 4511 4709 5813 5886 5959 Ethiopia 314 348 272 I 360 288 299 342 331 379 405 ... Gabon 867 984 837 867 1004 809 930 ... ... ... ... Gambia 32 36 49 53 53 49 47 59 58 ... ... Ghana 204 226 252 293 332 319 332 364 395 433 ... Guinea 183 243 252 199 249 233 252 321 204 274 236 Kenya 500 598 542 486 499 601 733 712 705 603 583 Lesotho 44 48 51 57 49 43 58 55 58 50 ... Libyan Arab Jamahiriya 991 926 2194 836 817 705 638 879 853 915 ... Madagascar 152 172 178 197 204 249 277 280 289 326 ... Malawi 231 268 356 339 260 234 ... ... ... ... ... Mali 251 352 308 392 327 296 412 360 324 ... ... Mauritania 188 126 136 160 167 162 197 207 180 130 ... Mauritius 333 407 436 507 503 526 630 666 656 706 651 Morocco 766 940 1014 1148 1049 1208 1350 1301 1267 1414 1541 Mozambique 196 206 237 246 271 323 350 319 329 396 ... Namibia ... 341 447 494 471 455 538 569 522 449 ... Nigeria 1325 1901 2387 1739 2681 2981 4398 4541 4694 4054 3311 Rwanda 83 96 77 89 97 104 58 63 99 115 ... Senegal 272 368 358 403 353 333 405 385 389 ... ... Seychelles 64 79 66 74 91 82 98 102 115 126 ... Sierra Leone 43 67 63 59 61 93 79 ... ... ... ... South Africa 3608 4096 3659 4202 4529 4886 5754 5505 5809 5278 5207 Sudan 347 202 184 197 100 199 150 169 168 200 270 Swaziland 87 171 175 202 249 190 206 233 236 185 170 Tanzania, United Rep. of 272 288 300 341 603 439 729 883 709 885 773 Togo 174 217 255 181 111 109 148 197 168 149 ... Tunisia 571 682 664 970 1195 1198 1245 1131 1066 1121 1106 Uganda 237 195 242 248 293 436 563 675 693 ... ... Zambia 408 370 352 ... ... ... ... ... ... ... ... Zimbabwe 429 460 585 622 517 637 704 801 934 754 ...

Appe
ndix
tabl
es
177
Table A6 (continued)
World imports of commercial services by selected region and economy, 1989-99
(Million dollars)
1989 1990 1991 1992 1993 1994 1995 1996 1997 1998 1999
Middle East
Bahrain 556 474 534 604 582 622 634 613 635 652 635 Cyprus 549 663 716 871 753 847 1087 1143 1082 1119 1135 Iran, Islamic Rep. of 2418 3703 5403 5541 5484 3062 2192 2899 3182 2392 ... Israel 4190 4825 5064 5405 6229 7523 8190 9079 9207 9626 10812 Jordan 959 1118 963 1168 1149 1197 1385 1348 1241 1588 1584 Kuwait 3530 2805 3075 3274 3373 3641 3847 4215 4055 4243 4093 Oman 570 719 961 932 906 900 985 975 1166 1303 ... Saudi Arabia 9154 12694 14355 15177 13927 8928 8681 12592 14410 8659 9452 Syrian Arab Republic 603 702 792 912 1279 1450 1358 1378 1302 1297 ... Yemen - 493 630 953 1038 568 545 503 567 510 ...
Asia 159100 178500 189700 214800 233400 270300 327500 351800 357800 319300 336300
Australia 12818 13388 13076 13361 13031 15064 16691 18197 18427 16880 17874 Bangladesh 594 554 555 644 782 857 1192 1059 1188 1164 1305 Cambodia ... ... ... 64 118 132 181 209 182 185 190 China 3573 4113 3937 9207 11563 15781 24635 22369 27724 26467 30666 Fiji 206 239 261 278 296 344 371 387 381 320 ... Hong Kong, China 9043 11018 12719 14439 15594 18642 20796 22101 23284 25036 24456 India 5738 5943 5797 6615 6356 8030 10062 11000 12277 14192 17185 Indonesia 5291 5898 6376 7884 9595 11136 13230 14777 16214 11744 11303 Japan 76960 84281 85947 92323 95488 105449 121548 128674 122079 110705 114173 Korea, Rep. of 8305 10050 11903 13289 14725 18248 25394 29158 29037 23523 26106 Lao People’s Dem. Rep. 25 25 47 69 73 149 119 123 107 92 ... Macau, China 204 229 267 296 353 370 395 425 527 523 562 Malaysia 4604 5394 6455 7248 9371 11918 14821 17140 17363 11905 14322 Maldives 28 37 41 49 56 62 75 86 93 97 ... Mongolia 257 155 66 62 65 88 87 108 101 142 140 Myanmar 44 72 54 33 115 118 230 289 429 429 ... Nepal 141 159 179 220 246 290 305 235 216 189 202 New Zealand 3078 3251 3351 3514 3455 4034 4600 4838 4863 4451 4496 Pakistan 1517 1863 2084 2423 2377 2182 2431 2913 2424 ... ... Papua New Guinea 390 393 543 686 805 608 642 779 924 794 728 Philippines 1536 1721 1783 2305 3072 4639 6906 9392 14073 I 10087 I 7492 Samoa 15 21 31 40 35 28 34 33 39 29 ... Singapore 6797 8575 9053 9430 11217 13800 17642 19635 18995 17377 18768 Solomon Islands 50 56 65 61 79 104 76 80 103 54 ... Sri Lanka 546 620 735 800 844 1020 1169 1173 1271 1325 ... Taipei, Chinese 12808 13923 16023 18589 20469 20465 22982 23750 24120 23246 23475 Thailand 4384 6160 7854 10254 12307 15231 18601 19313 17126 11874 13970 Tonga 19 20 20 20 18 ... ... ... ... ... ... Vanuatu 19 24 27 27 30 33 35 36 35 41 ... Viet Nam ... 126 270 412 694 1264 1982 2772 3134 3156 ...
a Figures for 1989 to mid-1990 refer to the former Federal Republic of Germany.
Note: Due to frequent revisions to the services trade data, there are numerous breaks in the continuity of the series at the country and regional levels.
See the Technical Notes.

Appe
ndix
tabl
es
178
Table A7
Network of world merchandise trade by product and region, 1997-99
(Billion dollars)
Destination World a North America Latin America Western Europe
Origin 1997 1998 1999 1997 1998 1999 1997 1998 1999 1997 1998 1999
World
Agricultural products 589.23 560.56 543.82 71.97 72.47 77.00 32.11 33.48 28.22 261.02 262.54 250.14 Food 468.01 452.60 436.53 52.81 54.39 57.66 26.58 28.18 23.81 211.80 214.78 205.19 Raw materials 121.22 107.95 107.30 19.16 18.08 19.33 5.53 5.30 4.41 49.22 47.76 44.95
Mining products 625.04 496.24 556.29 110.82 88.64 104.98 27.56 23.48 26.62 223.88 187.98 197.58 Ores and other minerals 63.51 58.93 56.14 7.80 7.73 7.32 2.19 2.04 2.16 27.27 25.88 23.56 Fuels 457.35 337.17 401.12 85.51 63.19 78.86 21.76 17.49 20.73 150.00 114.28 129.48 Non-ferrous metals 104.18 100.15 99.04 17.51 17.71 18.80 3.61 3.95 3.73 46.61 47.83 44.54
Manufactures 3990.85 4043.97 4186.20 834.38 892.71 990.86 232.38 242.95 229.59 1638.73 1765.06 1773.86 Iron and steel 144.39 141.52 126.10 21.03 23.72 19.73 7.36 7.49 5.93 59.45 64.71 56.57 Chemicals 499.82 506.54 525.65 64.87 68.51 77.98 33.58 34.62 33.30 237.74 255.22 255.43 Other semi-manufactures 403.51 402.78 414.02 73.11 79.82 89.36 21.59 22.46 21.52 185.43 194.48 192.24 Machinery and transport equipment 2131.57 2185.48 2294.61 502.93 534.69 601.88 130.46 136.41 127.83 805.98 892.92 916.52 Automotive products 497.91 520.90 549.23 159.40 168.04 201.06 33.70 33.92 26.82 218.88 247.29 252.35 Office and telecom equipment 695.23 697.30 769.42 166.96 169.95 190.31 32.06 32.93 35.41 239.82 260.96 273.36 Other machinery and transport equipment 938.42 967.27 975.96 176.58 196.71 210.51 64.71 69.56 65.60 347.28 384.67 390.81 Textiles 157.73 151.31 147.92 16.33 17.25 18.07 8.78 9.03 9.29 61.16 61.81 56.53 Clothing 182.28 183.33 186.03 48.73 55.22 58.23 8.75 9.65 9.23 84.31 81.37 80.45 Other consumer goods 471.55 473.01 491.86 107.39 113.50 125.61 21.87 23.28 22.50 204.66 214.55 216.12 Total merchandise exports b 5374.00 5290.00 5473.00 1042.20 1081.23 1203.00 299.96 309.52 294.17 2189.74 2297.89 2307.25
North America
Agricultural products 111.77 101.52 99.04 30.06 29.94 31.84 13.61 14.51 13.00 18.24 16.65 14.07 Food 77.55 71.55 68.97 16.96 17.70 18.44 10.66 11.34 10.47 12.60 11.31 9.24 Raw materials 34.23 29.96 30.07 13.10 12.24 13.40 2.95 3.17 2.52 5.63 5.34 4.83
Mining products 61.65 52.13 53.00 34.59 29.83 30.36 6.69 5.93 5.81 8.83 7.95 8.71 Ores and other minerals 10.97 9.18 8.59 3.43 3.12 2.99 0.83 0.69 0.59 3.19 2.88 2.62 Fuels 34.61 27.81 30.26 22.45 18.52 19.00 4.29 3.48 3.61 2.99 2.26 4.16 Non-ferrous metals 16.06 15.14 14.16 8.71 8.20 8.37 1.57 1.76 1.61 2.64 2.81 1.92
Manufactures 688.02 699.79 736.06 246.61 260.05 288.63 112.51 119.36 120.04 130.53 141.05 147.30 Iron and steel 9.31 9.18 8.36 5.87 5.82 5.55 1.74 1.70 1.44 0.61 0.61 0.55 Chemicals 83.51 81.64 85.04 23.05 23.63 25.39 14.77 15.29 14.81 19.95 21.15 21.75 Other semi-manufactures 59.58 60.83 64.45 29.37 32.20 35.52 9.89 10.41 10.74 7.92 7.96 8.06 Machinery and transport equipment 436.55 446.48 472.10 158.48 165.57 186.22 66.01 69.91 70.33 80.39 88.24 93.49 Automotive products 109.29 110.02 123.74 80.36 82.35 98.18 12.75 12.68 11.80 6.64 7.35 7.39 Office and telecom equipment 132.18 127.15 140.03 28.43 28.72 30.98 20.96 21.69 24.04 28.77 28.42 29.92 Other machinery and transport equipment 195.09 209.31 208.33 49.68 54.49 57.06 32.31 35.54 34.50 44.98 52.47 56.18 Textiles 11.04 11.16 11.57 4.20 4.47 4.62 2.88 3.27 4.02 1.79 1.71 1.39 Clothing 10.16 10.52 10.17 2.12 2.40 2.56 6.18 6.73 6.43 0.70 0.57 0.46 Other consumer goods 77.87 79.98 84.37 23.52 25.96 28.78 11.04 12.05 12.27 19.17 20.80 21.61 Total merchandise exports b 903.47 897.13 934.01 327.28 337.16 370.19 138.31 146.31 145.76 168.25 176.14 180.95
Latin America
Agricultural products 68.56 65.54 60.12 17.29 17.41 18.60 12.06 12.80 9.75 21.53 19.80 17.73 Food 61.16 58.92 53.12 15.09 15.18 16.02 10.75 11.72 8.78 19.58 17.95 15.91 Raw materials 7.40 6.62 7.01 2.20 2.22 2.58 1.31 1.08 0.96 1.95 1.85 1.83
Mining products 62.31 47.27 56.02 29.98 21.42 28.13 13.15 10.09 12.05 9.01 8.88 8.27 Ores and other minerals 9.31 9.12 8.99 1.49 1.58 1.51 0.97 0.90 1.11 2.99 3.11 2.82 Fuels 41.88 28.79 37.98 25.97 17.54 23.90 10.62 7.68 9.59 2.86 2.37 2.65 Non-ferrous metals 11.12 9.35 9.04 2.52 2.30 2.72 1.55 1.51 1.35 3.15 3.40 2.80
Manufactures 150.35 164.65 179.08 98.86 113.71 136.31 34.05 33.47 25.51 9.28 10.63 10.72 Iron and steel 9.10 8.35 6.99 3.50 3.44 3.42 2.64 2.45 1.54 1.01 1.23 0.86 Chemicals 14.57 14.58 14.37 3.97 4.12 4.71 7.03 7.22 6.61 2.07 1.94 1.70 Other semi-manufactures 15.44 15.39 16.02 6.80 7.37 9.01 5.16 5.08 4.22 1.82 1.79 1.67 Machinery and transport equipment 78.34 88.89 100.99 59.12 68.50 84.61 14.14 13.63 8.86 2.74 4.22 5.13 Automotive products 28.70 31.12 32.44 18.84 20.65 25.28 8.23 7.97 4.46 1.03 1.82 2.37 Office and telecom equipment 19.31 24.02 30.71 17.25 21.15 27.09 1.00 0.96 1.05 0.37 0.69 1.09 Other machinery and transport equipment 30.33 33.75 37.85 23.03 26.69 32.24 4.91 4.70 3.35 1.34 1.71 1.67 Textiles 4.33 4.22 4.06 1.93 2.11 2.37 1.83 1.65 1.30 0.36 0.29 0.25 Clothing 13.19 16.85 19.19 12.13 15.77 18.15 0.70 0.78 0.77 0.28 0.24 0.21 Other consumer goods 15.39 16.38 17.45 11.42 12.42 14.03 2.55 2.66 2.21 1.01 0.93 0.88 Total merchandise exports b 282.67 279.06 296.99 146.13 152.54 183.04 59.40 56.48 47.44 41.07 40.76 38.34

Appe
ndix
tabl
es
179
Table A7 (continued)
Network of world merchandise trade by product and region, 1997-99
(Billion dollars)
C./E.Europe/BS/CIS c Africa Middle East Asia Destination
1997 1998 1999 1997 1998 1999 1997 1998 1999 1997 1998 1999 Origin
World
36.90 30.78 24.84 20.36 20.56 19.24 20.71 18.99 19.34 142.82 118.56 121.23 Agricultural products... ... ... ... ... ... ... ... ... 104.19 89.69 90.47 Food... ... ... ... ... ... ... ... ... 38.63 28.86 30.77 Raw materials
32.99 26.42 23.82 10.61 9.44 11.69 9.29 7.25 9.17 195.61 142.52 165.65 Mining products... ... ... ... ... ... ... ... ... 19.63 16.47 17.03 Ores and other minerals... ... ... ... ... ... ... ... ... 145.77 101.40 122.78 Fuels... ... ... ... ... ... ... ... ... 30.21 24.65 25.84 Non-ferrous metals
159.61 159.67 142.07 81.72 84.92 81.33 109.92 113.29 104.98 909.78 755.50 829.60 Manufactures... ... ... ... ... ... ... ... ... 38.92 27.52 28.71 Iron and steel... ... ... ... ... ... ... ... ... 112.69 95.67 108.65 Chemicals... ... ... ... ... ... ... ... ... 77.54 60.47 65.94 Other semi-manufactures... ... ... ... ... ... ... ... ... 508.32 425.69 467.87 Machinery and transport equipment... ... ... ... ... ... ... ... ... 45.89 30.63 32.65 Automotive products... ... ... ... ... ... ... ... ... 225.87 200.45 238.17 Office and telecom equipment... ... ... ... ... ... ... ... ... 236.57 194.60 197.05 Other machinery and transport equipment... ... ... ... ... ... ... ... ... 48.35 39.75 41.48 Textiles... ... ... ... ... ... ... ... ... 25.77 23.23 24.90 Clothing... ... ... ... ... ... ... ... ... 98.19 83.18 92.05 Other consumer goods
237.42 227.73 200.09 116.26 118.85 115.92 146.36 147.06 139.23 1281.94 1045.97 1144.93 Total merchandise exports b
North America
2.30 1.94 1.29 3.57 3.39 3.06 3.41 2.69 2.84 40.25 32.07 32.58 Agricultural products2.22 1.87 1.22 3.22 3.11 2.80 3.18 2.45 2.61 28.35 23.45 23.82 Food0.08 0.07 0.07 0.35 0.28 0.26 0.23 0.23 0.23 11.89 8.62 8.76 Raw materials
0.29 0.20 0.08 0.51 0.44 0.39 0.51 0.38 0.38 10.23 7.40 7.27 Mining products0.04 0.05 0.01 0.16 0.11 0.09 0.03 0.04 0.04 3.27 2.29 2.24 Ores and other minerals0.24 0.13 0.05 0.29 0.25 0.20 0.18 0.16 0.16 4.17 3.00 3.07 Fuels0.01 0.02 0.02 0.05 0.08 0.10 0.29 0.17 0.17 2.79 2.11 1.96 Non-ferrous metals
5.45 5.59 4.36 7.92 8.06 6.89 16.96 19.94 17.38 168.04 145.64 151.45 Manufactures0.02 0.02 0.02 0.16 0.25 0.18 0.16 0.16 0.07 0.75 0.62 0.54 Iron and steel0.55 0.47 0.33 0.95 0.91 0.80 1.09 1.00 1.06 23.13 19.19 20.90 Chemicals0.28 0.23 0.26 0.46 0.44 0.42 1.60 1.78 1.77 10.06 7.81 7.68 Other semi-manufactures3.81 4.08 3.13 5.57 5.71 4.80 12.31 15.22 12.77 109.98 97.65 101.36 Machinery and transport equipment0.40 0.32 0.23 0.50 0.55 0.41 1.91 1.84 1.19 6.73 4.92 4.56 Automotive products0.92 0.98 0.84 0.69 0.77 0.80 2.00 1.95 2.10 50.41 44.62 51.35 Office and telecom equipment2.50 2.78 2.06 4.38 4.39 3.59 8.40 11.43 9.48 52.84 48.11 45.45 Other machinery and transport equipment0.13 0.10 0.07 0.09 0.08 0.07 0.35 0.28 0.21 1.60 1.24 1.19 Textiles0.04 0.03 0.02 0.02 0.02 0.02 0.11 0.10 0.07 0.99 0.67 0.62 Clothing0.60 0.66 0.54 0.67 0.64 0.59 1.34 1.42 1.42 21.53 18.46 19.16 Other consumer goods8.39 8.07 6.09 12.97 12.61 11.02 22.62 24.73 22.22 225.29 191.69 197.41 Total merchandise exports b
Latin America
2.30 2.14 1.89 2.23 2.17 1.71 2.34 2.40 2.18 10.46 8.44 7.76 Agricultural products2.27 2.10 1.87 2.17 2.11 1.65 2.28 2.33 2.11 8.67 7.16 6.33 Food0.03 0.03 0.02 0.06 0.06 0.06 0.06 0.07 0.07 1.78 1.28 1.43 Raw materials
0.47 0.37 0.30 0.42 0.47 0.43 0.35 0.30 0.29 7.79 5.18 5.53 Mining products0.25 0.22 0.18 0.25 0.23 0.21 0.20 0.18 0.18 2.99 2.70 2.92 Ores and other minerals0.22 0.15 0.12 0.16 0.22 0.21 0.12 0.10 0.09 0.96 0.39 0.56 Fuels0.00 0.00 0.00 0.02 0.02 0.02 0.02 0.02 0.03 3.84 2.09 2.05 Non-ferrous metals
0.38 0.40 0.36 0.88 0.80 0.67 0.71 0.60 0.37 5.60 4.32 4.47 Manufactures0.01 0.02 0.01 0.13 0.11 0.12 0.17 0.16 0.11 1.64 0.94 0.89 Iron and steel0.03 0.03 0.03 0.14 0.13 0.13 0.05 0.05 0.05 0.98 0.79 0.78 Chemicals0.05 0.04 0.03 0.19 0.18 0.16 0.17 0.10 0.08 1.22 0.75 0.75 Other semi-manufactures0.20 0.26 0.27 0.38 0.34 0.24 0.25 0.21 0.08 1.29 1.49 1.71 Machinery and transport equipment0.10 0.11 0.04 0.18 0.15 0.11 0.18 0.13 0.03 0.14 0.10 0.11 Automotive products0.07 0.13 0.17 0.01 0.01 0.01 0.00 0.01 0.00 0.62 1.07 1.30 Office and telecom equipment0.03 0.03 0.06 0.20 0.18 0.12 0.07 0.07 0.05 0.53 0.32 0.30 Other machinery and transport equipment0.01 0.01 0.01 0.01 0.01 0.01 0.03 0.03 0.01 0.15 0.10 0.09 Textiles0.03 0.01 0.01 0.00 0.00 0.00 0.02 0.02 0.02 0.02 0.01 0.02 Clothing0.06 0.04 0.02 0.02 0.02 0.02 0.03 0.04 0.02 0.29 0.24 0.24 Other consumer goods3.16 2.91 2.56 3.55 3.45 2.82 3.41 3.30 2.85 23.90 17.97 17.78 Total merchandise exports b

Appe
ndix
tabl
es
180
Table A7 (continued)
Network of world merchandise trade by product and region, 1997-99
(Billion dollars)
Destination World a North America Latin America Western Europe
Origin 1997 1998 1999 1997 1998 1999 1997 1998 1999 1997 1998 1999
Western Europe
Agricultural products 240.23 241.83 236.05 10.93 11.19 12.31 3.99 4.05 3.69 179.22 184.92 179.73 Food 204.54 207.00 202.48 9.91 10.17 11.28 3.69 3.75 3.41 150.99 156.99 153.28 Raw materials 35.69 34.83 33.57 1.02 1.02 1.03 0.30 0.30 0.29 28.24 27.94 26.45
Mining products 145.44 122.55 129.27 11.58 9.17 12.75 1.37 1.38 1.34 114.65 96.60 99.80 Ores and other minerals 16.82 14.81 14.18 0.51 0.54 0.65 0.12 0.11 0.11 13.27 12.12 11.03 Fuels 88.99 68.83 76.49 8.09 5.66 8.71 0.85 0.80 0.77 71.19 54.41 59.70 Non-ferrous metals 39.64 38.91 38.59 2.98 2.98 3.38 0.40 0.47 0.46 30.19 30.06 29.07
Manufactures 1828.09 1903.30 1894.22 165.97 183.87 203.13 50.27 52.89 49.75 1206.68 1292.73 1282.18 Iron and steel 68.81 69.87 62.71 5.31 5.04 4.92 1.48 1.53 1.30 50.07 52.95 47.48 Chemicals 288.40 304.33 310.74 25.14 28.09 34.41 9.23 9.31 9.00 193.31 208.96 208.38 Other semi-manufactures 211.48 215.38 214.30 14.89 16.52 18.02 4.37 4.64 4.31 144.87 151.60 147.86 Machinery and transport equipment 904.78 958.77 956.60 89.98 101.65 109.65 28.94 30.65 28.72 576.06 633.30 638.47 Automotive products 248.00 268.40 271.30 20.79 24.25 28.15 6.36 6.64 5.89 185.02 206.28 207.54 Office and telecom equipment 199.36 215.08 220.91 14.39 14.76 16.58 3.37 3.67 3.47 138.63 154.87 159.49 Other machinery and transport equipment 457.42 475.29 464.39 54.80 62.64 64.92 19.21 20.35 19.36 252.41 272.15 271.44 Textiles 67.27 67.81 63.22 3.17 3.32 3.50 0.86 0.89 0.84 46.42 46.80 42.75 Clothing 65.18 61.70 60.31 3.30 3.65 3.80 0.41 0.49 0.45 51.04 47.61 46.62 Other consumer goods 222.17 225.45 226.34 24.18 25.59 28.83 4.98 5.37 5.13 144.91 151.52 150.61 Total merchandise exports b 2281.80 2361.86 2352.54 191.03 207.94 231.88 56.57 60.68 56.82 1543.04 1630.38 1624.98
C./E. Europe/Baltic States/CIS c
Agricultural products 26.92 23.34 21.64 0.32 0.36 0.37 0.20 0.11 0.12 9.67 9.35 9.53 Mining products 68.86 57.78 59.96 1.57 1.93 2.38 1.30 1.40 1.93 34.18 28.84 31.38 Manufactures 113.99 124.64 122.26 5.51 6.66 5.57 1.46 1.61 1.76 59.76 73.82 77.61 Total merchandise exports b 223.98 215.34 214.04 8.44 9.52 9.34 3.22 3.24 3.99 107.39 113.30 119.79
Africa
Agricultural products 24.07 23.66 22.16 1.12 1.23 1.10 0.43 0.36 0.31 13.36 13.81 12.01 Mining products 61.98 45.09 52.96 16.14 11.75 12.26 2.18 1.90 2.60 29.81 22.60 23.98 Manufactures 31.76 31.08 34.00 2.74 2.98 3.30 0.61 0.55 0.44 18.17 18.64 19.57 Total merchandise exports b 124.91 103.18 112.13 20.05 16.01 16.72 3.23 2.82 3.36 63.62 56.80 57.18
Middle East
Agricultural products 6.97 6.09 6.27 0.19 0.22 0.24 0.05 0.06 0.04 2.27 2.07 1.97 Mining products 129.42 90.76 117.95 11.82 9.13 13.72 2.17 1.32 1.43 21.74 16.93 19.81 Manufactures 38.99 39.08 43.37 8.02 9.30 10.34 0.88 0.94 0.74 11.43 12.19 12.41 Total merchandise exports b 177.72 137.66 170.11 20.81 19.25 25.22 3.14 2.33 2.22 35.70 31.39 34.38
Asia
Agricultural products 110.70 98.58 98.54 12.05 12.13 12.54 1.76 1.58 1.31 16.73 15.93 15.10 Food 83.70 76.99 76.86 9.48 9.81 10.52 1.26 1.17 0.96 11.72 11.50 11.08 Raw materials 27.00 21.59 21.69 2.57 2.31 2.02 0.50 0.41 0.36 5.01 4.44 4.03
Mining products 95.37 80.67 87.13 5.14 5.40 5.39 0.71 1.46 1.46 5.67 6.18 5.63 Ores and other minerals 14.04 13.10 12.16 1.62 1.66 1.39 0.07 0.10 0.10 2.61 2.40 2.02 Fuels 63.04 50.31 57.04 2.24 2.18 2.51 0.58 1.28 1.22 1.94 2.53 2.41 Non-ferrous metals 18.29 17.26 17.94 1.28 1.56 1.48 0.06 0.08 0.14 1.12 1.25 1.20
Manufactures 1139.65 1081.43 1177.22 306.67 316.15 343.58 32.60 34.11 31.35 202.88 215.99 224.07 Iron and steel 33.74 33.14 29.64 3.76 6.60 4.42 0.80 1.10 0.87 1.48 3.20 1.83 Chemicals 81.18 76.15 84.71 10.34 10.50 11.37 1.57 1.83 1.92 11.43 12.26 12.87 Other semi-manufactures 82.90 75.35 81.12 17.99 19.08 21.26 1.97 2.12 2.05 13.31 13.84 13.79 Machinery and transport equipment 658.38 627.13 696.95 191.90 194.33 216.06 20.49 21.20 19.09 119.72 129.30 137.32 Automotive products 99.98 96.23 104.57 39.14 40.52 49.18 6.20 6.46 4.60 19.86 21.55 22.22 Office and telecom equipment 333.83 318.81 363.79 105.91 103.95 113.76 6.54 6.37 6.63 66.23 69.49 74.45 Other machinery and transport equipment 224.57 212.10 228.59 46.85 49.86 53.12 7.75 8.37 7.86 33.63 38.25 40.64 Textiles 67.65 60.62 61.81 6.53 6.74 7.00 3.13 3.16 3.08 8.47 8.69 8.05 Clothing 78.07 77.19 79.14 29.35 31.25 31.49 1.44 1.62 1.56 19.68 19.21 19.73 Other consumer goods 137.73 131.84 143.84 46.79 47.66 51.98 3.19 3.08 2.79 28.78 29.48 30.47 Total merchandise exports b 1379.15 1295.87 1393.63 328.46 338.81 366.61 36.09 37.66 34.60 230.68 249.11 251.64

Appe
ndix
tabl
es
181
Table A7 (continued)
Network of world merchandise trade by product and region, 1997-99
(Billion dollars)
C./E.Europe/BS/CIS c Africa Middle East Asia Destination
1997 1998 1999 1997 1998 1999 1997 1998 1999 1997 1998 1999 Origin
Western Europe
15.74 13.32 10.84 8.07 8.59 7.79 6.50 6.12 6.42 14.83 12.62 14.31 Agricultural products14.30 11.86 9.44 6.82 7.39 6.69 6.00 5.64 5.97 12.04 10.39 11.62 Food1.44 1.46 1.40 1.25 1.20 1.10 0.50 0.48 0.45 2.79 2.23 2.69 Raw materials
4.43 3.77 3.73 2.29 2.28 2.03 1.92 1.54 1.50 6.12 4.34 5.53 Mining products0.55 0.50 0.51 0.22 0.26 0.23 0.21 0.20 0.18 1.88 1.02 1.40 Ores and other minerals2.58 1.90 1.83 1.57 1.46 1.31 0.75 0.56 0.63 1.16 0.75 1.14 Fuels1.30 1.37 1.39 0.50 0.56 0.49 0.97 0.78 0.70 3.08 2.57 2.98 Non-ferrous metals
107.02 110.96 101.79 48.16 50.94 47.50 54.25 50.74 48.35 188.45 148.72 150.87 Manufactures2.54 3.01 2.81 1.97 2.12 1.68 2.48 2.13 1.77 4.90 2.94 2.67 Iron and steel
16.09 15.92 14.93 7.83 8.02 7.46 7.42 7.34 7.02 27.82 23.31 26.73 Chemicals13.15 13.61 12.93 5.16 5.15 4.78 9.00 8.04 8.75 19.95 15.26 17.12 Other semi-manufactures50.92 53.63 48.40 24.46 26.19 24.63 25.67 24.04 22.42 104.90 82.18 78.05 Machinery and transport equipment11.59 11.63 10.61 4.86 4.91 4.94 3.93 3.94 3.55 15.34 10.56 10.44 Automotive products9.53 10.17 10.12 3.78 5.21 4.89 2.92 3.68 3.94 26.00 22.00 21.86 Office and telecom equipment
29.79 31.83 27.67 15.83 16.07 14.80 18.82 16.42 14.93 63.56 49.62 45.75 Other machinery and transport equipment7.08 7.56 7.13 3.32 3.71 3.50 1.57 1.50 1.39 4.42 3.36 3.51 Textiles4.01 3.96 3.59 1.21 1.48 1.41 1.25 1.36 1.23 3.91 3.09 3.14 Clothing
13.24 13.26 12.00 4.20 4.27 4.04 6.85 6.33 5.77 22.55 18.59 19.65 Other consumer goods128.58 132.85 120.25 59.66 63.54 58.98 64.27 61.24 57.45 213.80 172.11 175.88 Total merchandise exports b
C./E. Europe/Baltic States/CIS c
12.72 10.04 8.02 0.43 0.39 0.36 0.70 0.60 0.56 2.32 2.06 2.27 Agricultural products26.79 21.25 19.06 0.15 0.14 0.15 0.90 0.77 0.72 3.45 2.97 3.79 Mining products32.76 29.97 24.10 1.65 1.65 1.73 2.45 2.84 2.31 9.28 7.07 8.08 Manufactures78.05 66.64 55.92 2.41 2.52 2.64 4.78 4.82 4.10 17.08 13.24 15.93 Total merchandise exports b
Africa
1.13 1.02 1.01 2.70 2.49 2.64 0.55 0.56 0.50 4.11 3.59 3.61 Agricultural products0.36 0.29 0.25 2.49 1.86 2.87 0.53 0.31 0.39 9.28 5.82 8.12 Mining products0.12 0.11 0.12 5.48 4.80 5.51 0.74 0.76 0.81 3.61 3.00 3.23 Manufactures1.62 1.42 1.38 10.74 9.21 11.12 1.84 1.64 1.72 19.27 12.90 15.44 Total merchandise exports b
Middle East
0.25 0.23 0.21 0.43 0.46 0.48 2.71 2.25 2.25 0.65 0.51 0.62 Agricultural products0.30 0.19 0.17 4.40 3.68 5.23 4.50 3.29 4.87 77.01 51.86 64.28 Mining products0.82 0.79 0.73 1.66 1.93 2.27 5.82 5.93 6.51 8.09 6.12 7.27 Manufactures1.49 1.24 1.14 6.53 6.10 8.02 13.25 11.70 14.04 86.53 59.09 72.92 Total merchandise exports b
Asia
2.46 2.09 1.59 2.92 3.07 3.19 4.49 4.38 4.58 70.21 59.26 60.08 Agricultural products2.26 1.88 1.40 2.64 2.80 2.95 4.16 4.07 4.28 52.16 45.63 45.55 Food0.20 0.21 0.19 0.29 0.27 0.24 0.33 0.30 0.30 18.05 13.63 14.53 Raw materials
0.35 0.35 0.23 0.34 0.57 0.59 0.58 0.66 1.01 81.73 64.96 71.14 Mining products0.09 0.11 0.04 0.05 0.04 0.04 0.09 0.14 0.26 9.47 8.58 8.24 Ores and other minerals0.23 0.22 0.18 0.18 0.41 0.41 0.33 0.32 0.46 56.89 42.63 48.49 Fuels0.02 0.02 0.02 0.12 0.12 0.14 0.16 0.20 0.29 15.37 13.75 14.41 Non-ferrous metals
13.06 11.84 10.61 15.97 16.76 16.77 28.99 32.48 29.25 526.71 440.63 504.23 Manufactures0.12 0.13 0.16 0.57 0.83 0.46 1.17 1.44 1.36 25.61 19.58 20.31 Iron and steel0.66 0.69 0.65 1.24 1.42 1.35 1.37 1.51 1.51 53.80 46.81 53.97 Chemicals0.48 0.48 0.53 1.81 1.82 2.18 3.38 3.24 2.97 43.59 34.49 38.04 Other semi-manufactures6.97 5.86 5.01 7.98 8.22 8.16 13.97 17.76 14.99 288.13 240.50 282.30 Machinery and transport equipment2.52 2.24 1.82 3.10 3.18 3.11 5.78 7.28 6.20 23.15 14.74 17.15 Automotive products2.60 1.99 1.75 1.50 1.51 1.51 3.12 3.07 2.71 147.56 131.60 162.18 Office and telecom equipment1.85 1.63 1.44 3.38 3.54 3.54 5.07 7.40 6.08 117.41 94.16 102.97 Other machinery and transport equipment1.01 0.96 0.84 2.31 2.27 2.41 4.33 3.99 3.93 41.84 34.77 36.42 Textiles2.20 2.25 2.04 0.69 0.78 0.74 1.74 1.55 1.49 20.80 19.41 21.04 Clothing1.61 1.48 1.39 1.37 1.41 1.45 3.03 3.00 2.99 52.95 45.08 52.15 Other consumer goods
16.14 14.62 12.76 20.41 21.43 21.33 36.19 39.63 36.86 696.08 578.99 649.58 Total merchandise exports b
a Includes unspecified destinations.
b Includes unspecified products.
c Includes the intra-trade of the Baltic States and the CIS.
Note : For sources and methods, see the Technical Notes.

Appe
ndix
tabl
es
182
Table A8
Merchandise trade by product, region and major trading partner, 1997-99 - Canada
(Billion dollars)
C./E. Europe/
North America Latin America Western Europe Baltic States/CIS Africa Middle East Asia
exp imp exp imp exp imp exp imp exp imp exp imp exp imp
Agricultural products 1997 19.91 8.68 1.44 1.55 3.30 1.53 0.15 0.12 0.93 0.22 0.74 0.03 7.81 1.591998 19.49 8.86 1.38 1.52 3.01 1.62 0.13 0.15 0.95 0.26 0.29 0.03 5.97 1.541999 21.16 9.06 1.18 1.50 2.83 1.73 0.08 0.16 0.59 0.24 0.49 0.03 6.26 1.52
Food 1997 9.27 6.41 1.32 1.45 1.44 1.37 0.14 0.11 0.86 0.20 0.68 0.03 4.13 1.311998 9.72 6.63 1.30 1.41 1.29 1.46 0.12 0.14 0.89 0.23 0.24 0.03 3.28 1.281999 10.27 6.81 1.11 1.37 1.15 1.55 0.06 0.15 0.53 0.22 0.44 0.03 3.00 1.29
Raw materials 1997 10.64 2.27 0.12 0.10 1.86 0.16 0.01 0.00 0.08 0.02 0.06 0.00 3.69 0.281998 9.77 2.23 0.08 0.11 1.73 0.17 0.02 0.01 0.06 0.02 0.05 0.00 2.69 0.271999 10.89 2.25 0.07 0.13 1.69 0.18 0.01 0.01 0.06 0.03 0.05 0.00 3.26 0.23
Mining products 1997 28.07 6.04 0.40 1.45 2.92 4.15 0.03 0.16 0.15 1.06 0.07 0.88 3.21 0.461998 23.52 6.10 0.33 1.35 2.58 2.64 0.01 0.17 0.09 0.83 0.04 0.38 2.50 0.511999 24.16 5.12 0.25 1.53 4.37 3.81 0.02 0.23 0.08 0.81 0.03 0.41 1.98 0.52
Ores and other 1997 1.65 1.70 0.14 0.54 1.67 0.16 0.01 0.04 0.12 0.13 0.01 0.00 0.93 0.36 minerals 1998 1.57 1.48 0.10 0.53 1.45 0.17 0.00 0.03 0.07 0.16 0.01 0.01 0.66 0.37
1999 1.41 1.48 0.09 0.57 1.32 0.16 0.01 0.02 0.05 0.09 0.01 0.01 0.50 0.35
Fuels 1997 20.02 2.22 0.18 0.88 0.34 3.76 0.02 0.06 0.02 0.82 0.00 0.88 1.43 0.021998 16.00 2.56 0.15 0.78 0.32 2.28 0.01 0.08 0.01 0.61 0.00 0.37 1.20 0.051999 16.70 1.51 0.13 0.93 2.49 3.42 0.01 0.17 0.02 0.67 0.00 0.40 0.91 0.06
Non-ferrous metals 1997 6.40 2.12 0.08 0.03 0.91 0.24 0.00 0.07 0.01 0.10 0.06 0.00 0.85 0.081998 5.96 2.06 0.08 0.04 0.82 0.20 0.00 0.06 0.01 0.06 0.03 0.00 0.65 0.101999 6.05 2.13 0.03 0.03 0.56 0.23 0.00 0.04 0.00 0.05 0.01 0.01 0.56 0.11
Manufactures 1997 118.56 114.73 2.95 5.48 5.40 16.61 0.47 0.62 0.49 0.23 0.56 0.30 6.38 23.341998 126.36 119.20 2.50 5.63 5.90 17.36 0.40 0.70 0.38 0.27 0.51 0.33 4.20 24.791999 144.73 127.21 2.29 6.76 6.57 18.99 0.29 0.55 0.39 0.32 0.46 0.37 4.30 27.24
Iron and steel 1997 2.95 2.62 0.04 0.34 0.05 0.80 0.00 0.24 0.00 0.08 0.01 0.00 0.06 0.311998 3.00 2.48 0.03 0.30 0.05 0.86 0.00 0.31 0.00 0.09 0.00 0.00 0.04 0.661999 2.76 2.49 0.03 0.23 0.05 0.73 0.00 0.12 0.00 0.07 0.01 0.01 0.04 0.57
Chemicals 1997 9.94 12.49 0.34 0.13 0.61 2.62 0.04 0.08 0.04 0.05 0.05 0.08 1.66 0.591998 9.88 13.09 0.32 0.14 0.69 2.84 0.03 0.07 0.04 0.07 0.04 0.05 1.18 0.621999 10.49 14.19 0.31 0.13 0.72 3.07 0.04 0.07 0.05 0.12 0.05 0.06 1.21 0.71
Other semi- 1997 17.60 11.02 0.54 0.27 0.97 1.48 0.05 0.04 0.07 0.01 0.10 0.07 1.14 1.47 manufactures 1998 19.50 11.81 0.48 0.28 0.84 1.60 0.04 0.04 0.06 0.02 0.08 0.08 0.69 1.63
1999 21.55 12.93 0.44 0.34 1.15 1.71 0.03 0.05 0.07 0.02 0.06 0.10 0.71 1.70
Machinery and 1997 75.50 73.21 1.84 3.93 2.99 9.19 0.27 0.16 0.32 0.04 0.33 0.09 2.87 14.49 transport 1998 79.76 75.46 1.47 4.02 3.55 9.39 0.23 0.16 0.24 0.04 0.31 0.12 1.84 14.86 equipment 1999 93.95 80.17 1.34 5.03 3.82 10.71 0.16 0.20 0.24 0.06 0.27 0.12 1.94 16.66
Power generating 1997 1.91 2.15 0.04 0.09 0.36 0.65 0.01 0.02 0.01 0.00 0.04 0.01 0.16 0.11 machinery 1998 2.23 2.51 0.04 0.08 0.41 0.85 0.01 0.02 0.01 0.00 0.02 0.01 0.11 0.12
1999 2.23 2.62 0.03 0.10 0.42 1.10 0.01 0.03 0.01 0.00 0.05 0.01 0.17 0.22
Other non- 1997 8.26 14.26 0.34 0.21 0.68 3.44 0.07 0.08 0.07 0.02 0.09 0.02 0.71 1.89 electrical 1998 9.00 14.45 0.35 0.26 0.71 3.56 0.08 0.08 0.06 0.01 0.10 0.03 0.39 2.10 machinery 1999 9.32 14.26 0.28 0.29 0.67 3.89 0.06 0.07 0.07 0.01 0.06 0.03 0.36 1.98
Office and 1997 10.70 12.02 0.46 0.92 0.95 1.10 0.10 0.01 0.06 0.01 0.07 0.04 1.02 7.77 telecommunication 1998 10.75 11.93 0.42 1.05 0.93 1.18 0.07 0.02 0.04 0.01 0.08 0.04 0.72 7.60 equipment 1999 11.90 11.97 0.33 1.47 0.96 1.46 0.04 0.02 0.05 0.02 0.07 0.05 0.70 8.49
Electrical 1997 3.29 6.09 0.07 0.80 0.18 0.64 0.03 0.02 0.02 0.00 0.02 0.02 0.20 1.20 machinery and 1998 3.56 6.16 0.09 0.96 0.19 0.64 0.04 0.02 0.02 0.00 0.02 0.02 0.15 1.27 apparatus 1999 3.91 6.91 0.08 1.11 0.21 0.79 0.02 0.03 0.02 0.01 0.02 0.03 0.14 1.52
Automotive 1997 46.27 33.30 0.79 1.82 0.27 1.35 0.05 0.01 0.02 0.01 0.07 0.00 0.39 3.06 products 1998 47.66 33.81 0.52 1.56 0.31 1.51 0.03 0.01 0.02 0.01 0.03 0.00 0.18 3.01
1999 59.35 37.81 0.42 1.92 0.35 1.61 0.02 0.00 0.03 0.01 0.02 0.00 0.34 3.75
Other transport 1997 5.08 5.39 0.12 0.10 0.55 2.03 0.01 0.02 0.13 0.00 0.05 0.01 0.39 0.46 equipment 1998 6.56 6.59 0.05 0.11 1.01 1.65 0.00 0.01 0.09 0.00 0.07 0.02 0.31 0.77
1999 7.25 6.59 0.19 0.13 1.21 1.86 0.01 0.04 0.06 0.01 0.05 0.01 0.21 0.71
Textiles 1997 1.53 2.53 0.05 0.12 0.12 0.40 0.04 0.02 0.01 0.01 0.03 0.02 0.09 0.781998 1.68 2.65 0.04 0.12 0.11 0.42 0.02 0.02 0.01 0.01 0.02 0.03 0.05 0.791999 1.83 2.61 0.03 0.13 0.10 0.40 0.01 0.02 0.01 0.01 0.01 0.03 0.04 0.81
Clothing 1997 1.39 0.61 0.01 0.16 0.05 0.26 0.01 0.03 0.00 0.03 0.01 0.01 0.03 1.911998 1.61 0.63 0.01 0.19 0.05 0.27 0.01 0.04 0.00 0.03 0.01 0.01 0.02 2.091999 1.80 0.56 0.01 0.21 0.05 0.26 0.00 0.03 0.00 0.03 0.01 0.02 0.02 2.16
Other consumer 1997 9.66 12.25 0.13 0.53 0.61 1.86 0.06 0.05 0.04 0.01 0.05 0.03 0.53 3.80 goods 1998 10.93 13.09 0.15 0.58 0.60 1.99 0.06 0.06 0.03 0.01 0.05 0.04 0.38 4.14
1999 12.35 14.27 0.13 0.69 0.70 2.13 0.04 0.07 0.03 0.01 0.06 0.04 0.35 4.63
Total merchandise a 1997 176.95 133.11 4.91 8.70 12.32 22.80 0.67 0.90 1.58 1.52 1.46 1.22 18.14 25.521998 181.91 137.32 4.33 8.74 12.39 21.96 0.58 1.03 1.43 1.36 0.90 0.74 13.07 26.941999 205.08 144.44 3.83 10.00 14.44 24.92 0.41 0.94 1.09 1.37 1.05 0.82 12.89 29.35
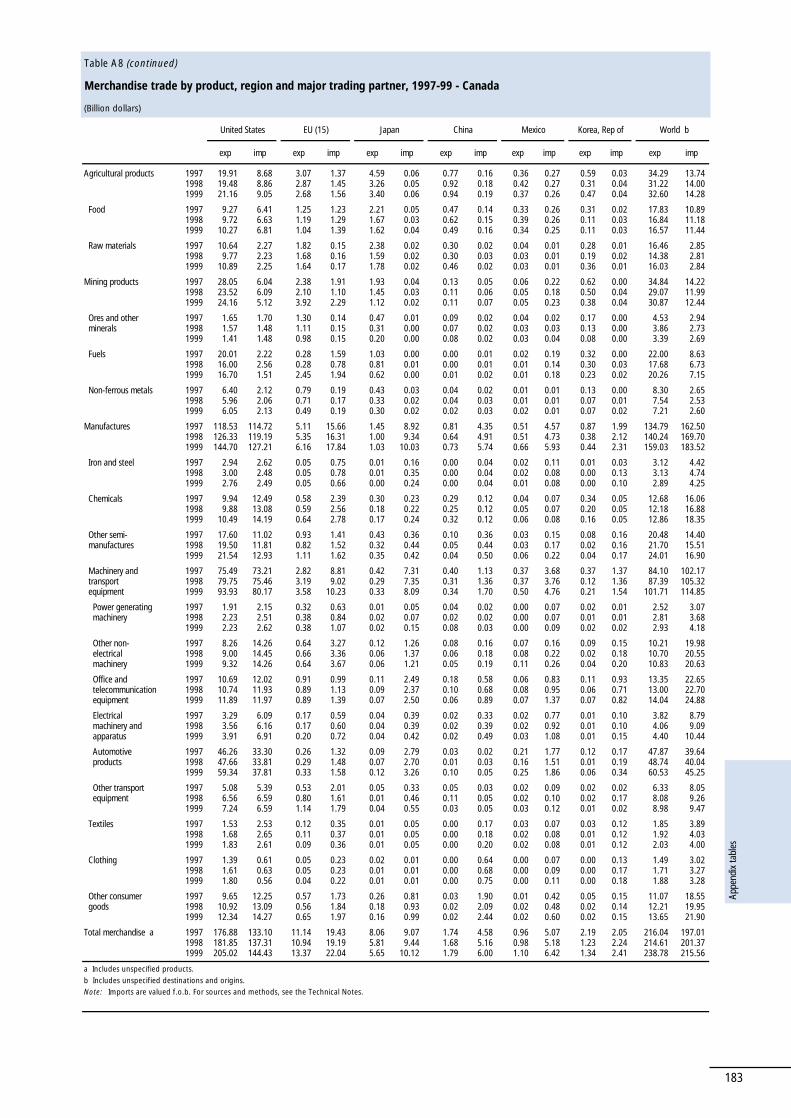
Appe
ndix
tabl
es
183
Table A8 (continued)
Merchandise trade by product, region and major trading partner, 1997-99 - Canada
(Billion dollars)
United States EU (15) Japan China Mexico Korea, Rep of World b
exp imp exp imp exp imp exp imp exp imp exp imp exp imp
Agricultural products 1997 19.91 8.68 3.07 1.37 4.59 0.06 0.77 0.16 0.36 0.27 0.59 0.03 34.29 13.741998 19.48 8.86 2.87 1.45 3.26 0.05 0.92 0.18 0.42 0.27 0.31 0.04 31.22 14.001999 21.16 9.05 2.68 1.56 3.40 0.06 0.94 0.19 0.37 0.26 0.47 0.04 32.60 14.28
Food 1997 9.27 6.41 1.25 1.23 2.21 0.05 0.47 0.14 0.33 0.26 0.31 0.02 17.83 10.891998 9.72 6.63 1.19 1.29 1.67 0.03 0.62 0.15 0.39 0.26 0.11 0.03 16.84 11.181999 10.27 6.81 1.04 1.39 1.62 0.04 0.49 0.16 0.34 0.25 0.11 0.03 16.57 11.44
Raw materials 1997 10.64 2.27 1.82 0.15 2.38 0.02 0.30 0.02 0.04 0.01 0.28 0.01 16.46 2.851998 9.77 2.23 1.68 0.16 1.59 0.02 0.30 0.03 0.03 0.01 0.19 0.02 14.38 2.811999 10.89 2.25 1.64 0.17 1.78 0.02 0.46 0.02 0.03 0.01 0.36 0.01 16.03 2.84
Mining products 1997 28.05 6.04 2.38 1.91 1.93 0.04 0.13 0.05 0.06 0.22 0.62 0.00 34.84 14.221998 23.52 6.09 2.10 1.10 1.45 0.03 0.11 0.06 0.05 0.18 0.50 0.04 29.07 11.991999 24.16 5.12 3.92 2.29 1.12 0.02 0.11 0.07 0.05 0.23 0.38 0.04 30.87 12.44
Ores and other 1997 1.65 1.70 1.30 0.14 0.47 0.01 0.09 0.02 0.04 0.02 0.17 0.00 4.53 2.94 minerals 1998 1.57 1.48 1.11 0.15 0.31 0.00 0.07 0.02 0.03 0.03 0.13 0.00 3.86 2.73
1999 1.41 1.48 0.98 0.15 0.20 0.00 0.08 0.02 0.03 0.04 0.08 0.00 3.39 2.69
Fuels 1997 20.01 2.22 0.28 1.59 1.03 0.00 0.00 0.01 0.02 0.19 0.32 0.00 22.00 8.631998 16.00 2.56 0.28 0.78 0.81 0.01 0.00 0.01 0.01 0.14 0.30 0.03 17.68 6.731999 16.70 1.51 2.45 1.94 0.62 0.00 0.01 0.02 0.01 0.18 0.23 0.02 20.26 7.15
Non-ferrous metals 1997 6.40 2.12 0.79 0.19 0.43 0.03 0.04 0.02 0.01 0.01 0.13 0.00 8.30 2.651998 5.96 2.06 0.71 0.17 0.33 0.02 0.04 0.03 0.01 0.01 0.07 0.01 7.54 2.531999 6.05 2.13 0.49 0.19 0.30 0.02 0.02 0.03 0.02 0.01 0.07 0.02 7.21 2.60
Manufactures 1997 118.53 114.72 5.11 15.66 1.45 8.92 0.81 4.35 0.51 4.57 0.87 1.99 134.79 162.501998 126.33 119.19 5.35 16.31 1.00 9.34 0.64 4.91 0.51 4.73 0.38 2.12 140.24 169.701999 144.70 127.21 6.16 17.84 1.03 10.03 0.73 5.74 0.66 5.93 0.44 2.31 159.03 183.52
Iron and steel 1997 2.94 2.62 0.05 0.75 0.01 0.16 0.00 0.04 0.02 0.11 0.01 0.03 3.12 4.421998 3.00 2.48 0.05 0.78 0.01 0.35 0.00 0.04 0.02 0.08 0.00 0.13 3.13 4.741999 2.76 2.49 0.05 0.66 0.00 0.24 0.00 0.04 0.01 0.08 0.00 0.10 2.89 4.25
Chemicals 1997 9.94 12.49 0.58 2.39 0.30 0.23 0.29 0.12 0.04 0.07 0.34 0.05 12.68 16.061998 9.88 13.08 0.59 2.56 0.18 0.22 0.25 0.12 0.05 0.07 0.20 0.05 12.18 16.881999 10.49 14.19 0.64 2.78 0.17 0.24 0.32 0.12 0.06 0.08 0.16 0.05 12.86 18.35
Other semi- 1997 17.60 11.02 0.93 1.41 0.43 0.36 0.10 0.36 0.03 0.15 0.08 0.16 20.48 14.40 manufactures 1998 19.50 11.81 0.82 1.52 0.32 0.44 0.05 0.44 0.03 0.17 0.02 0.16 21.70 15.51
1999 21.54 12.93 1.11 1.62 0.35 0.42 0.04 0.50 0.06 0.22 0.04 0.17 24.01 16.90
Machinery and 1997 75.49 73.21 2.82 8.81 0.42 7.31 0.40 1.13 0.37 3.68 0.37 1.37 84.10 102.17 transport 1998 79.75 75.46 3.19 9.02 0.29 7.35 0.31 1.36 0.37 3.76 0.12 1.36 87.39 105.32 equipment 1999 93.93 80.17 3.58 10.23 0.33 8.09 0.34 1.70 0.50 4.76 0.21 1.54 101.71 114.85
Power generating 1997 1.91 2.15 0.32 0.63 0.01 0.05 0.04 0.02 0.00 0.07 0.02 0.01 2.52 3.07 machinery 1998 2.23 2.51 0.38 0.84 0.02 0.07 0.02 0.02 0.00 0.07 0.01 0.01 2.81 3.68
1999 2.23 2.62 0.38 1.07 0.02 0.15 0.08 0.03 0.00 0.09 0.02 0.02 2.93 4.18
Other non- 1997 8.26 14.26 0.64 3.27 0.12 1.26 0.08 0.16 0.07 0.16 0.09 0.15 10.21 19.98 electrical 1998 9.00 14.45 0.66 3.36 0.06 1.37 0.06 0.18 0.08 0.22 0.02 0.18 10.70 20.55 machinery 1999 9.32 14.26 0.64 3.67 0.06 1.21 0.05 0.19 0.11 0.26 0.04 0.20 10.83 20.63
Office and 1997 10.69 12.02 0.91 0.99 0.11 2.49 0.18 0.58 0.06 0.83 0.11 0.93 13.35 22.65 telecommunication 1998 10.74 11.93 0.89 1.13 0.09 2.37 0.10 0.68 0.08 0.95 0.06 0.71 13.00 22.70 equipment 1999 11.89 11.97 0.89 1.39 0.07 2.50 0.06 0.89 0.07 1.37 0.07 0.82 14.04 24.88
Electrical 1997 3.29 6.09 0.17 0.59 0.04 0.39 0.02 0.33 0.02 0.77 0.01 0.10 3.82 8.79 machinery and 1998 3.56 6.16 0.17 0.60 0.04 0.39 0.02 0.39 0.02 0.92 0.01 0.10 4.06 9.09 apparatus 1999 3.91 6.91 0.20 0.72 0.04 0.42 0.02 0.49 0.03 1.08 0.01 0.15 4.40 10.44
Automotive 1997 46.26 33.30 0.26 1.32 0.09 2.79 0.03 0.02 0.21 1.77 0.12 0.17 47.87 39.64 products 1998 47.66 33.81 0.29 1.48 0.07 2.70 0.01 0.03 0.16 1.51 0.01 0.19 48.74 40.04
1999 59.34 37.81 0.33 1.58 0.12 3.26 0.10 0.05 0.25 1.86 0.06 0.34 60.53 45.25
Other transport 1997 5.08 5.39 0.53 2.01 0.05 0.33 0.05 0.03 0.02 0.09 0.02 0.02 6.33 8.05 equipment 1998 6.56 6.59 0.80 1.61 0.01 0.46 0.11 0.05 0.02 0.10 0.02 0.17 8.08 9.26
1999 7.24 6.59 1.14 1.79 0.04 0.55 0.03 0.05 0.03 0.12 0.01 0.02 8.98 9.47
Textiles 1997 1.53 2.53 0.12 0.35 0.01 0.05 0.00 0.17 0.03 0.07 0.03 0.12 1.85 3.891998 1.68 2.65 0.11 0.37 0.01 0.05 0.00 0.18 0.02 0.08 0.01 0.12 1.92 4.031999 1.83 2.61 0.09 0.36 0.01 0.05 0.00 0.20 0.02 0.08 0.01 0.12 2.03 4.00
Clothing 1997 1.39 0.61 0.05 0.23 0.02 0.01 0.00 0.64 0.00 0.07 0.00 0.13 1.49 3.021998 1.61 0.63 0.05 0.23 0.01 0.01 0.00 0.68 0.00 0.09 0.00 0.17 1.71 3.271999 1.80 0.56 0.04 0.22 0.01 0.01 0.00 0.75 0.00 0.11 0.00 0.18 1.88 3.28
Other consumer 1997 9.65 12.25 0.57 1.73 0.26 0.81 0.03 1.90 0.01 0.42 0.05 0.15 11.07 18.55 goods 1998 10.92 13.09 0.56 1.84 0.18 0.93 0.02 2.09 0.02 0.48 0.02 0.14 12.21 19.95
1999 12.34 14.27 0.65 1.97 0.16 0.99 0.02 2.44 0.02 0.60 0.02 0.15 13.65 21.90
Total merchandise a 1997 176.88 133.10 11.14 19.43 8.06 9.07 1.74 4.58 0.96 5.07 2.19 2.05 216.04 197.011998 181.85 137.31 10.94 19.19 5.81 9.44 1.68 5.16 0.98 5.18 1.23 2.24 214.61 201.371999 205.02 144.43 13.37 22.04 5.65 10.12 1.79 6.00 1.10 6.42 1.34 2.41 238.78 215.56
a Includes unspecified products.
b Includes unspecified destinations and origins.
Note: Imports are valued f.o.b. For sources and methods, see the Technical Notes.

Appe
ndix
tabl
es
184
Table A9
Merchandise trade by product, region and major trading partner, 1997-99 - United States
(Billion dollars)
C./E. Europe/
North America Latin America Western Europe Baltic States/CIS Africa Middle East Asia
exp imp exp imp exp imp exp imp exp imp exp imp exp imp
Agricultural products 1997 10.16 19.70 12.18 17.98 14.69 10.39 2.15 0.56 2.64 1.17 2.67 0.18 32.44 11.861998 10.39 19.27 13.10 17.81 13.39 10.96 1.81 0.63 2.44 1.21 2.39 0.21 26.01 12.301999 10.60 20.96 11.78 18.32 10.96 11.97 1.21 0.72 2.46 1.11 2.34 0.23 26.21 12.83
Food 1997 7.70 9.08 9.34 15.80 10.92 9.23 2.08 0.49 2.37 0.98 2.50 0.15 24.23 9.001998 7.94 9.52 10.02 15.60 9.79 9.64 1.76 0.56 2.21 1.03 2.21 0.18 20.10 9.541999 8.12 10.08 9.34 15.86 7.83 10.60 1.15 0.64 2.26 0.93 2.16 0.17 20.74 10.36
Raw materials 1997 2.46 10.61 2.83 2.18 3.77 1.16 0.07 0.07 0.27 0.19 0.17 0.03 8.22 2.861998 2.45 9.75 3.08 2.21 3.60 1.32 0.05 0.07 0.23 0.19 0.18 0.03 5.91 2.761999 2.48 10.88 2.44 2.46 3.13 1.38 0.06 0.08 0.20 0.18 0.18 0.06 5.47 2.47
Mining products 1997 6.54 26.60 6.29 31.18 5.92 9.90 0.26 2.36 0.36 16.96 0.43 12.08 7.02 5.091998 6.25 22.77 5.59 23.14 5.35 8.20 0.19 3.09 0.35 12.54 0.34 9.63 4.88 5.251999 6.13 25.16 5.55 29.21 4.31 10.31 0.06 4.29 0.32 13.23 0.35 14.61 5.28 5.51
Ores and other 1997 1.78 1.73 0.69 1.73 1.52 0.58 0.03 0.10 0.04 0.58 0.02 0.04 2.34 1.37 minerals 1998 1.54 1.66 0.59 1.77 1.42 0.61 0.05 0.08 0.04 0.64 0.03 0.04 1.63 1.24
1999 1.57 1.49 0.50 1.54 1.30 0.70 0.01 0.11 0.04 0.65 0.03 0.03 1.74 1.01
Fuels 1997 2.44 18.48 4.11 27.25 2.65 6.47 0.22 0.37 0.28 15.43 0.18 11.99 2.74 2.551998 2.48 15.16 3.33 19.03 1.94 4.80 0.12 0.40 0.24 10.73 0.16 9.46 1.80 2.571999 2.26 17.64 3.47 25.00 1.66 6.88 0.05 1.01 0.18 11.38 0.16 14.42 2.15 2.94
Non-ferrous metals 1997 2.31 6.38 1.49 2.20 1.74 2.85 0.01 1.88 0.04 0.95 0.24 0.05 1.94 1.171998 2.22 5.95 1.67 2.34 1.99 2.79 0.01 2.62 0.07 1.17 0.15 0.13 1.46 1.441999 2.31 6.03 1.58 2.67 1.36 2.73 0.01 3.17 0.10 1.20 0.16 0.17 1.39 1.56
Manufactures 1997 128.16 114.72 109.61 89.82 125.18 148.67 4.99 5.85 7.44 2.70 16.41 8.50 161.73 328.721998 133.15 123.29 116.62 102.55 134.87 167.85 5.18 7.47 7.67 3.07 19.39 9.86 141.15 343.461999 143.24 140.43 117.48 117.58 140.39 183.75 4.06 6.86 6.47 3.23 16.88 10.96 146.79 380.02
Iron and steel 1997 2.92 2.81 1.70 3.19 0.56 5.22 0.02 1.83 0.16 0.41 0.15 0.03 0.69 3.771998 2.81 2.86 1.67 3.13 0.56 5.17 0.02 2.45 0.25 0.59 0.15 0.03 0.58 6.491999 2.77 2.68 1.41 3.05 0.50 4.36 0.02 1.23 0.18 0.49 0.07 0.02 0.50 4.52
Chemicals 1997 13.12 9.88 14.44 3.44 19.35 25.34 0.52 0.94 0.91 0.32 1.05 1.25 21.48 10.961998 13.71 9.80 14.94 3.40 20.42 29.37 0.43 1.14 0.87 0.29 0.95 1.34 17.98 11.101999 14.84 10.34 14.47 3.76 20.99 35.04 0.29 1.18 0.76 0.27 1.01 1.29 19.63 12.20
Other semi- 1997 11.78 17.38 9.35 5.57 6.95 14.11 0.23 0.42 0.38 0.56 1.50 3.27 8.93 19.06 manufactures 1998 12.62 19.24 9.90 6.16 7.10 15.47 0.19 0.52 0.38 0.48 1.69 3.83 7.10 21.14
1999 13.90 21.26 10.27 7.23 6.89 16.19 0.22 0.65 0.35 0.56 1.70 4.62 6.95 24.35
Machinery and 1997 83.05 72.79 64.20 51.23 77.43 75.16 3.55 1.54 5.26 0.27 11.99 1.96 107.16 199.86 transport 1998 85.47 77.92 68.30 59.70 84.51 86.50 3.84 2.06 5.47 0.32 14.88 2.18 95.61 202.93 equipment 1999 91.84 91.02 68.83 70.57 89.45 93.95 2.96 2.46 4.55 0.50 12.47 2.30 99.19 228.40
Power generating 1997 2.39 1.77 2.39 1.47 6.50 7.14 0.08 0.10 0.34 0.00 0.85 0.25 5.09 2.10 machinery 1998 2.67 2.04 2.87 1.79 8.19 9.08 0.07 0.07 0.32 0.01 0.75 0.25 4.27 2.21
1999 2.89 2.13 3.05 2.08 8.67 9.89 0.06 0.11 0.21 0.00 0.81 0.15 4.30 2.59
Other non- 1997 15.93 7.65 14.20 4.10 13.00 24.03 1.31 0.45 2.00 0.08 2.31 0.32 19.12 19.72 electrical 1998 16.23 8.28 15.25 4.67 13.65 26.39 1.08 0.52 2.05 0.09 2.44 0.35 14.69 21.06 machinery 1999 16.01 8.58 13.39 5.24 13.63 25.83 0.77 0.43 1.39 0.13 2.14 0.32 15.24 21.06
Office and 1997 17.75 9.06 20.50 14.56 27.83 11.02 0.82 0.55 0.64 0.10 1.94 0.84 49.41 115.60 telecommunication 1998 17.92 9.47 21.22 18.58 27.43 11.46 0.91 0.93 0.73 0.11 1.86 0.88 43.81 114.47 equipment 1999 19.01 10.46 23.65 22.67 28.90 12.39 0.80 1.28 0.75 0.15 2.03 1.09 50.53 128.80
Electrical 1997 7.30 3.12 11.45 11.57 7.31 6.75 0.22 0.24 0.23 0.02 0.78 0.34 8.16 18.93 machinery and 1998 7.46 3.38 11.69 12.54 7.69 7.30 0.20 0.25 0.23 0.01 0.74 0.43 6.92 19.56 apparatus 1999 8.45 3.76 12.44 14.00 7.74 8.03 0.19 0.30 0.25 0.01 0.67 0.42 7.53 21.87
Automotive 1997 34.13 46.23 11.96 18.01 6.37 19.30 0.35 0.16 0.47 0.06 1.84 0.01 6.34 36.95 products 1998 34.53 48.43 12.13 19.62 7.03 23.26 0.29 0.17 0.53 0.08 1.81 0.02 4.74 38.26
1999 38.60 59.37 11.35 22.97 7.02 27.47 0.21 0.22 0.37 0.12 1.16 0.02 4.20 45.55
Other transport 1997 5.54 4.95 3.70 1.52 16.41 6.92 0.77 0.03 1.58 0.02 4.28 0.20 19.04 6.56 equipment 1998 6.67 6.32 5.12 2.51 20.52 9.02 1.30 0.11 1.60 0.02 7.28 0.26 21.17 7.37
1999 6.88 6.71 4.95 3.62 23.49 10.34 0.93 0.12 1.59 0.08 5.67 0.29 17.38 8.53
Textiles 1997 2.67 1.48 2.84 1.52 1.67 2.85 0.10 0.18 0.09 0.13 0.33 0.17 1.51 6.141998 2.79 1.63 3.22 1.57 1.60 3.00 0.08 0.19 0.07 0.16 0.26 0.21 1.19 6.701999 2.77 1.78 3.97 1.70 1.29 3.10 0.06 0.19 0.07 0.14 0.20 0.24 1.14 7.15
Clothing 1997 0.74 1.35 6.17 13.95 0.65 3.22 0.03 0.50 0.02 0.85 0.10 0.90 0.97 29.521998 0.78 1.57 6.71 16.13 0.52 3.55 0.02 0.62 0.02 1.06 0.09 1.06 0.65 31.721999 0.75 1.76 6.41 17.82 0.41 3.54 0.01 0.56 0.01 1.09 0.07 1.21 0.61 32.81
Other consumer 1997 13.88 9.03 10.91 10.92 18.57 22.78 0.55 0.45 0.62 0.16 1.29 0.92 21.01 59.41 goods 1998 14.98 10.26 11.87 12.46 20.16 24.79 0.59 0.49 0.61 0.18 1.37 1.20 18.04 63.37
1999 16.36 11.59 12.11 13.45 20.86 27.59 0.50 0.60 0.56 0.19 1.37 1.28 18.77 70.59
Total merchandise a 1997 150.47 171.37 133.46 144.21 155.74 178.39 7.72 8.94 11.40 21.08 21.17 21.60 207.23 352.431998 154.56 177.94 141.69 149.83 163.18 198.10 7.47 11.45 11.15 17.02 23.78 20.36 178.19 369.651999 164.25 201.48 141.59 172.84 165.85 219.40 5.66 12.22 9.91 17.96 21.12 26.80 184.03 408.52

Appe
ndix
tabl
es
185
Table A9 (continued)
Merchandise trade by product, region and major trading partner, 1997-99 - United States
(Billion dollars)
Canada EU (15) Mexico Japan China Taipei, Chinese World b
exp imp exp imp exp imp exp imp exp imp exp imp exp imp
Agricultural products 1997 10.08 19.68 13.26 9.33 5.97 5.43 16.33 0.63 2.02 1.10 3.06 0.45 77.27 61.831998 10.30 19.26 12.07 9.95 7.04 5.94 13.80 0.63 1.68 1.18 2.11 0.50 69.85 62.401999 10.52 20.94 9.93 10.87 6.58 6.23 13.99 0.69 1.27 1.36 2.26 0.53 65.94 66.14
Food 1997 7.62 9.07 9.81 8.21 4.50 4.93 12.95 0.44 1.00 0.82 2.40 0.33 59.48 44.731998 7.86 9.51 8.76 8.69 5.20 5.51 11.32 0.43 1.11 0.84 1.58 0.36 54.33 46.071999 8.05 10.06 6.95 9.56 5.08 5.78 11.72 0.48 0.77 0.98 1.79 0.39 51.97 48.64
Raw materials 1997 2.46 10.61 3.45 1.12 1.47 0.50 3.38 0.19 1.02 0.28 0.65 0.13 17.78 17.101998 2.44 9.75 3.31 1.26 1.84 0.43 2.48 0.19 0.57 0.34 0.53 0.13 15.52 16.331999 2.48 10.88 2.98 1.31 1.51 0.45 2.27 0.21 0.50 0.38 0.46 0.14 13.97 17.50
Mining products 1997 6.52 26.60 5.46 7.06 3.45 10.01 2.43 0.83 0.60 1.14 0.74 0.08 26.83 104.161998 6.21 22.77 4.95 6.26 3.34 7.06 1.82 0.82 0.46 0.98 0.60 0.10 22.95 84.631999 6.11 25.16 4.08 7.33 3.81 8.72 1.86 0.90 0.58 0.84 0.52 0.12 22.01 102.33
Ores and other 1997 1.78 1.73 1.44 0.50 0.51 0.54 0.73 0.05 0.20 0.32 0.26 0.01 6.44 6.14 minerals 1998 1.54 1.66 1.36 0.53 0.41 0.50 0.54 0.04 0.21 0.25 0.21 0.01 5.30 6.04
1999 1.57 1.49 1.28 0.63 0.37 0.42 0.53 0.04 0.32 0.19 0.19 0.00 5.17 5.53
Fuels 1997 2.42 18.48 2.46 4.22 2.01 8.73 0.98 0.28 0.23 0.63 0.24 0.00 12.62 82.551998 2.45 15.16 1.81 3.40 1.77 5.53 0.73 0.28 0.13 0.44 0.19 0.00 10.07 62.151999 2.24 17.64 1.54 4.46 2.27 7.42 0.76 0.35 0.12 0.28 0.17 0.01 9.93 79.27
Non-ferrous metals 1997 2.31 6.38 1.56 2.34 0.94 0.74 0.72 0.51 0.17 0.19 0.24 0.07 7.77 15.471998 2.22 5.95 1.79 2.33 1.16 1.02 0.56 0.50 0.12 0.29 0.20 0.09 7.57 16.441999 2.31 6.03 1.26 2.24 1.17 0.88 0.57 0.50 0.14 0.37 0.16 0.10 6.91 17.53
Manufactures 1997 127.96 114.72 116.16 137.92 58.92 68.32 45.41 120.20 10.02 63.04 15.88 32.61 553.51 698.991998 132.92 123.29 125.21 156.24 64.98 79.05 40.64 120.56 11.91 72.18 14.79 32.98 558.11 757.561999 143.05 140.43 131.03 170.90 72.53 91.23 40.03 129.23 11.06 84.63 15.86 35.07 575.33 842.84
Iron and steel 1997 2.92 2.81 0.49 4.75 1.08 1.38 0.13 1.91 0.05 0.34 0.07 0.26 6.20 17.261998 2.80 2.86 0.51 4.74 1.17 1.31 0.10 3.45 0.06 0.45 0.04 0.35 6.03 20.731999 2.77 2.68 0.45 3.99 1.15 1.26 0.12 1.77 0.07 0.41 0.04 0.49 5.45 16.36
Chemicals 1997 13.11 9.88 17.82 22.79 6.35 1.60 6.42 6.28 1.94 1.34 2.46 0.45 70.86 52.131998 13.69 9.80 19.05 26.93 6.88 1.54 5.55 6.28 1.97 1.53 1.95 0.49 69.30 56.441999 14.82 10.34 19.18 32.28 7.19 1.65 5.79 6.76 2.09 1.80 2.25 0.53 71.98 64.07
Other semi- 1997 11.75 17.38 6.45 13.02 5.76 3.56 2.59 5.22 0.52 4.23 0.62 3.19 39.13 60.37 manufactures 1998 12.60 19.24 6.61 14.32 6.50 4.10 2.16 5.19 0.60 5.27 0.52 3.27 39.00 66.85
1999 13.87 21.26 6.27 14.94 7.21 4.70 2.02 5.46 0.60 6.72 0.47 3.40 40.29 74.84
Machinery and 1997 82.96 72.79 72.53 72.06 35.81 47.58 27.07 93.83 6.52 18.16 11.19 21.05 352.64 402.81 transport 1998 85.34 77.92 79.34 82.94 38.84 54.96 24.76 92.84 8.24 22.43 10.75 21.14 358.17 431.61 equipment 1999 91.76 91.02 84.70 89.91 43.77 64.21 24.12 101.65 7.15 27.74 11.32 22.81 369.30 489.19
Power generating 1997 2.39 1.77 5.95 6.93 1.08 1.35 1.14 1.10 0.57 0.29 0.30 0.11 17.65 12.84 machinery 1998 2.67 2.04 7.63 8.80 1.27 1.61 1.14 1.11 0.50 0.32 0.28 0.11 19.13 15.44
1999 2.89 2.13 8.19 9.58 1.40 1.88 1.19 1.45 0.46 0.37 0.26 0.12 19.99 16.96
Other non- 1997 15.92 7.65 12.14 22.33 5.56 3.21 3.49 13.92 1.71 1.49 2.44 2.12 67.87 56.34 electrical 1998 16.21 8.28 12.78 24.57 6.72 3.76 2.88 14.38 1.40 1.83 2.13 2.33 65.40 61.37 machinery 1999 15.98 8.58 12.81 23.89 7.30 4.32 3.08 13.60 1.33 2.33 2.83 2.45 62.57 61.59
Office and 1997 17.71 9.06 26.65 10.56 10.67 13.99 12.28 33.97 1.25 10.87 4.83 14.97 118.88 151.73 telecommunication 1998 17.87 9.47 26.18 10.85 11.45 17.61 10.40 30.74 2.05 13.82 4.54 14.87 113.89 155.91 equipment 1999 18.98 10.46 27.62 11.58 14.18 20.65 10.47 33.13 2.23 17.12 5.07 15.97 125.66 176.84
Electrical 1997 7.29 3.12 6.99 6.33 8.76 10.84 2.17 6.91 0.47 4.75 0.88 2.55 35.45 40.97 machinery and 1998 7.44 3.38 7.34 6.82 9.01 11.83 1.97 6.77 0.48 5.45 0.79 2.34 34.92 43.46 apparatus 1999 8.44 3.76 7.38 7.47 9.99 13.21 2.05 7.28 0.55 6.67 0.77 2.60 37.27 48.39
Automotive 1997 34.13 46.23 6.13 19.15 8.67 17.38 3.14 33.14 0.35 0.25 0.52 0.65 61.46 120.73 products 1998 34.52 48.43 6.80 23.06 8.81 18.89 2.63 34.57 0.16 0.32 0.26 0.72 61.06 129.83
1999 38.60 59.37 6.84 27.26 9.39 22.15 2.12 39.99 0.22 0.43 0.21 0.89 62.92 155.72
Other transport 1997 5.52 4.95 14.66 6.75 1.08 0.80 4.85 4.78 2.17 0.51 2.20 0.65 51.33 20.20 equipment 1998 6.63 6.32 18.61 8.84 1.57 1.26 5.74 5.27 3.64 0.69 2.75 0.76 63.76 25.60
1999 6.87 6.71 21.85 10.13 1.51 2.00 5.21 6.20 2.37 0.82 2.19 0.79 60.89 29.69
Textiles 1997 2.66 1.48 1.58 2.49 1.54 1.14 0.32 0.60 0.06 1.43 0.11 0.78 9.19 12.461998 2.78 1.63 1.51 2.57 1.96 1.21 0.25 0.59 0.08 1.51 0.09 0.77 9.22 13.461999 2.77 1.78 1.21 2.60 2.88 1.34 0.23 0.59 0.09 1.69 0.08 0.82 9.51 14.30
Clothing 1997 0.73 1.35 0.59 2.34 2.23 5.40 0.72 0.10 0.01 7.77 0.02 2.27 8.67 50.301998 0.78 1.57 0.48 2.54 2.65 6.87 0.49 0.09 0.01 7.44 0.02 2.32 8.79 55.721999 0.75 1.76 0.38 2.48 2.55 7.91 0.45 0.10 0.01 7.74 0.01 2.19 8.27 58.78
Other consumer 1997 13.82 9.03 16.69 20.47 6.15 7.66 8.17 12.27 0.92 29.77 1.41 4.60 66.83 103.66 goods 1998 14.93 10.26 17.70 22.20 6.98 9.06 7.35 12.12 0.95 33.55 1.42 4.64 67.61 112.75
1999 16.31 11.59 18.85 24.69 7.78 10.15 7.30 12.90 1.05 38.54 1.68 4.83 70.52 125.29
Total merchandise a 1997 150.12 171.33 141.40 162.54 71.35 87.12 65.66 124.27 12.80 65.81 20.39 33.72 687.53 898.031998 154.15 177.92 149.81 182.03 79.00 96.07 57.88 125.09 14.26 75.09 18.16 34.34 680.43 944.351999 163.90 201.43 151.96 201.10 87.04 111.07 57.48 134.87 13.12 87.78 19.12 36.76 692.78 1059.22
a Includes unspecified products.
b Includes unspecified destinations and origins.
Note: For sources and methods, see the Technical Notes.

Appe
ndix
tabl
es
186
Table A10
Merchandise trade by product, region and major trading partner, 1997-99 - Mexico
(Billion dollars)
C./E. Europe/
North America Latin America Western Europe Baltic States/CIS Africa Middle East Asia
exp imp exp imp exp imp exp imp exp imp exp imp exp imp
Agricultural products 1997 5.96 7.15 0.51 0.55 0.73 0.64 0.02 0.02 0.07 0.04 0.08 0.01 0.48 0.491998 6.45 7.99 0.49 0.54 0.60 0.48 0.04 0.03 0.09 0.03 0.08 0.02 0.38 0.471999 7.18 7.93 0.46 0.63 0.53 0.52 0.00 0.03 0.05 0.04 0.06 0.02 0.31 0.47
Food 1997 5.26 5.43 0.38 0.43 0.63 0.57 0.02 0.01 0.06 0.01 0.06 0.01 0.33 0.331998 5.81 6.10 0.41 0.45 0.52 0.40 0.04 0.02 0.08 0.01 0.07 0.01 0.29 0.311999 6.54 6.23 0.38 0.52 0.46 0.44 0.00 0.03 0.04 0.01 0.05 0.01 0.25 0.34
Raw materials 1997 0.70 1.72 0.13 0.12 0.10 0.07 0.00 0.01 0.00 0.03 0.02 0.01 0.15 0.161998 0.63 1.89 0.08 0.09 0.08 0.08 0.00 0.01 0.00 0.02 0.01 0.01 0.09 0.161999 0.63 1.70 0.08 0.11 0.07 0.08 0.00 0.00 0.00 0.03 0.01 0.01 0.06 0.13
Mining products 1997 10.06 4.16 0.99 0.76 1.25 0.16 0.03 0.02 0.10 0.19 0.03 0.05 0.65 0.181998 7.02 4.01 0.70 0.71 0.86 0.23 0.01 0.03 0.09 0.26 0.01 0.06 0.30 0.201999 9.13 4.30 0.90 0.93 1.21 0.23 0.01 0.06 0.02 0.23 0.03 0.11 0.44 0.20
Ores and other 1997 0.55 0.66 0.04 0.21 0.12 0.02 0.02 0.00 0.00 0.11 0.00 0.00 0.05 0.06 minerals 1998 0.56 0.49 0.03 0.17 0.07 0.02 0.01 0.00 0.00 0.10 0.00 0.00 0.07 0.04
1999 0.61 0.48 0.03 0.33 0.08 0.03 0.01 0.00 0.00 0.08 0.00 0.00 0.07 0.04
Fuels 1997 8.67 2.30 0.88 0.33 0.86 0.08 0.00 0.00 0.10 0.07 0.03 0.05 0.50 0.101998 5.44 2.07 0.61 0.17 0.64 0.13 0.00 0.00 0.09 0.13 0.01 0.06 0.15 0.121999 7.57 2.36 0.82 0.17 0.99 0.12 0.00 0.00 0.02 0.14 0.03 0.11 0.30 0.08
Non-ferrous metals 1997 0.84 1.20 0.07 0.22 0.27 0.06 0.00 0.02 0.00 0.01 0.00 0.00 0.10 0.031998 1.02 1.46 0.06 0.38 0.14 0.08 0.00 0.03 0.00 0.03 0.00 0.00 0.08 0.041999 0.95 1.46 0.05 0.42 0.14 0.09 0.00 0.06 0.00 0.01 0.00 0.00 0.06 0.08
Manufactures 1997 79.12 71.81 5.63 1.45 2.09 10.00 0.09 0.34 0.06 0.06 0.29 0.11 1.52 9.661998 90.02 81.69 4.97 1.61 2.57 11.34 0.15 0.46 0.05 0.07 0.23 0.14 1.49 10.441999 104.03 97.10 3.94 1.80 3.75 12.92 0.17 0.26 0.04 0.13 0.08 0.17 1.69 12.89
Iron and steel 1997 1.64 1.56 0.46 0.35 0.15 0.52 0.00 0.18 0.02 0.02 0.08 0.00 0.24 0.311998 1.56 1.65 0.38 0.34 0.14 0.54 0.00 0.26 0.02 0.03 0.05 0.00 0.12 0.511999 1.29 1.65 0.11 0.29 0.17 0.48 0.00 0.10 0.01 0.07 0.01 0.00 0.12 0.42
Chemicals 1997 2.15 7.69 1.37 0.29 0.47 1.97 0.00 0.06 0.01 0.02 0.01 0.05 0.30 0.641998 2.20 8.20 1.34 0.29 0.46 2.12 0.00 0.10 0.01 0.01 0.01 0.05 0.26 0.671999 2.44 9.29 1.40 0.29 0.50 2.30 0.00 0.06 0.01 0.02 0.01 0.06 0.23 0.84
Other semi- 1997 4.85 9.52 0.60 0.20 0.13 0.90 0.00 0.01 0.01 0.01 0.01 0.01 0.09 0.62 manufactures 1998 5.35 10.50 0.60 0.20 0.15 1.02 0.00 0.01 0.00 0.01 0.01 0.01 0.05 0.69
1999 6.41 12.26 0.49 0.22 0.13 1.07 0.00 0.03 0.01 0.01 0.01 0.01 0.04 0.89
Machinery and 1997 55.16 39.54 2.41 0.40 0.95 5.41 0.07 0.07 0.01 0.01 0.15 0.04 0.71 6.40 transport 1998 63.37 46.22 1.85 0.53 1.45 6.34 0.13 0.07 0.01 0.01 0.11 0.05 0.92 6.71 equipment 1999 74.14 56.32 1.12 0.75 2.52 7.61 0.16 0.06 0.01 0.03 0.03 0.06 1.10 8.45
Power generating 1997 1.55 1.26 0.04 0.01 0.01 0.13 0.00 0.00 0.00 0.00 0.01 0.00 0.01 0.08 machinery 1998 1.92 1.41 0.04 0.02 0.04 0.17 0.00 0.00 0.00 0.00 0.00 0.00 0.00 0.11
1999 2.50 1.50 0.01 0.01 0.07 0.31 0.00 0.00 0.00 0.01 0.01 0.00 0.00 0.27
Other non- 1997 3.53 7.07 0.33 0.12 0.16 2.93 0.00 0.04 0.01 0.01 0.00 0.02 0.05 1.10 electrical 1998 3.95 8.46 0.30 0.14 0.16 3.32 0.00 0.03 0.00 0.00 0.00 0.02 0.02 1.24 machinery 1999 5.11 9.70 0.18 0.17 0.17 3.70 0.00 0.02 0.00 0.01 0.00 0.02 0.03 1.47
Office and 1997 16.57 10.29 0.45 0.03 0.28 0.65 0.07 0.00 0.00 0.00 0.00 0.02 0.55 3.20 telecommunication 1998 20.08 12.78 0.39 0.03 0.32 0.68 0.11 0.01 0.00 0.00 0.00 0.02 0.78 3.37 equipment 1999 23.47 15.84 0.31 0.04 0.44 0.96 0.15 0.01 0.00 0.01 0.00 0.03 0.91 4.20
Electrical 1997 14.13 10.42 0.33 0.05 0.14 0.60 0.00 0.00 0.00 0.00 0.00 0.00 0.05 1.27 machinery and 1998 15.01 11.75 0.29 0.05 0.18 0.75 0.00 0.01 0.00 0.00 0.00 0.01 0.04 1.32 apparatus 1999 16.76 12.97 0.22 0.06 0.19 0.96 0.00 0.01 0.00 0.00 0.00 0.01 0.04 1.84
Automotive 1997 18.21 9.37 1.22 0.18 0.31 0.89 0.00 0.00 0.00 0.00 0.14 0.00 0.04 0.47 products 1998 19.96 9.77 0.78 0.27 0.67 1.18 0.01 0.00 0.00 0.00 0.11 0.00 0.06 0.48
1999 23.44 13.52 0.37 0.44 1.53 1.46 0.01 0.00 0.01 0.00 0.01 0.00 0.07 0.45
Other transport 1997 1.18 1.13 0.05 0.02 0.04 0.21 0.00 0.02 0.00 0.00 0.00 0.00 0.01 0.29 equipment 1998 2.44 2.04 0.06 0.02 0.09 0.25 0.00 0.01 0.00 0.00 0.00 0.00 0.01 0.19
1999 2.66 2.80 0.02 0.03 0.14 0.22 0.00 0.02 0.00 0.00 0.00 0.00 0.04 0.21
Textiles 1997 1.49 2.18 0.28 0.07 0.09 0.22 0.01 0.01 0.00 0.00 0.02 0.00 0.03 0.391998 1.68 2.71 0.21 0.07 0.07 0.19 0.00 0.00 0.00 0.00 0.02 0.00 0.03 0.451999 2.19 3.98 0.17 0.07 0.05 0.21 0.00 0.00 0.00 0.00 0.01 0.00 0.08 0.56
Clothing 1997 5.52 3.09 0.06 0.02 0.05 0.11 0.00 0.00 0.00 0.00 0.00 0.00 0.01 0.131998 6.41 3.43 0.14 0.03 0.03 0.11 0.00 0.00 0.00 0.00 0.00 0.00 0.01 0.171999 7.49 3.29 0.27 0.04 0.03 0.11 0.00 0.00 0.00 0.00 0.00 0.00 0.01 0.19
Other consumer 1997 8.32 8.23 0.46 0.13 0.26 0.87 0.01 0.01 0.00 0.00 0.01 0.01 0.14 1.16 goods 1998 9.45 8.97 0.45 0.15 0.27 1.02 0.00 0.01 0.00 0.00 0.02 0.02 0.11 1.25
1999 11.43 10.32 0.38 0.14 0.34 1.13 0.00 0.01 0.00 0.00 0.01 0.03 0.12 1.55
Total merchandise a 1997 95.34 85.23 7.15 2.79 4.10 11.11 0.14 0.47 0.23 0.30 0.39 0.18 2.67 11.811998 103.66 95.50 6.18 2.90 4.07 12.45 0.20 0.58 0.23 0.36 0.32 0.22 2.18 13.031999 121.87 111.23 5.31 3.49 5.53 14.04 0.19 0.43 0.11 0.40 0.16 0.30 2.45 15.29

Appe
ndix
tabl
es
187
Table A10 (continued )
Merchandise trade by product, region and major trading partner, 1997-99 - Mexico
(Billion dollars)
United States EU (15) Japan Canada Korea, Rep of China World b
exp imp exp imp exp imp exp imp exp imp exp imp exp imp
Agricultural products 1997 5.87 6.68 0.68 0.62 0.21 0.01 0.07 0.47 0.04 0.00 0.08 0.02 7.88 8.901998 6.36 7.41 0.56 0.46 0.16 0.01 0.08 0.58 0.01 0.01 0.06 0.04 8.18 9.571999 7.07 7.35 0.47 0.49 0.15 0.01 0.08 0.58 0.02 0.01 0.01 0.04 8.62 9.65
Food 1997 5.18 5.02 0.58 0.55 0.19 0.00 0.07 0.41 0.03 0.00 0.00 0.01 6.77 6.791998 5.73 5.56 0.48 0.38 0.15 0.00 0.07 0.54 0.01 0.01 0.01 0.01 7.27 7.311999 6.44 5.70 0.40 0.41 0.14 0.00 0.08 0.53 0.02 0.01 0.00 0.01 7.76 7.58
Raw materials 1997 0.69 1.66 0.10 0.07 0.03 0.01 0.01 0.06 0.01 0.00 0.08 0.01 1.10 2.111998 0.63 1.85 0.08 0.08 0.01 0.01 0.00 0.04 0.00 0.00 0.05 0.03 0.92 2.261999 0.63 1.65 0.06 0.08 0.01 0.01 0.00 0.05 0.00 0.00 0.01 0.03 0.86 2.08
Mining products 1997 9.84 4.07 1.24 0.15 0.59 0.03 0.22 0.09 0.01 0.01 0.00 0.09 13.11 5.541998 6.88 3.93 0.86 0.23 0.24 0.03 0.14 0.08 0.01 0.01 0.00 0.09 9.03 5.521999 8.98 4.21 1.12 0.21 0.39 0.03 0.15 0.09 0.01 0.01 0.00 0.07 11.76 6.07
Ores and other 1997 0.53 0.61 0.12 0.02 0.04 0.01 0.02 0.05 0.00 0.00 0.00 0.02 0.78 1.06 minerals 1998 0.54 0.45 0.07 0.02 0.05 0.00 0.02 0.04 0.00 0.00 0.00 0.01 0.74 0.83
1999 0.59 0.45 0.06 0.02 0.06 0.00 0.02 0.03 0.01 0.00 0.00 0.01 0.81 0.96
Fuels 1997 8.46 2.27 0.85 0.07 0.49 0.01 0.20 0.03 0.01 0.00 0.00 0.07 11.03 2.931998 5.33 2.06 0.64 0.13 0.14 0.01 0.12 0.02 0.01 0.00 0.00 0.07 6.98 2.671999 7.44 2.34 0.93 0.11 0.30 0.01 0.13 0.02 0.00 0.00 0.00 0.05 9.73 2.99
Non-ferrous metals 1997 0.84 1.18 0.27 0.06 0.07 0.01 0.00 0.02 0.00 0.01 0.00 0.00 1.29 1.541998 1.02 1.43 0.14 0.08 0.05 0.02 0.00 0.02 0.00 0.01 0.00 0.01 1.31 2.021999 0.95 1.43 0.13 0.08 0.04 0.02 0.00 0.04 0.00 0.01 0.00 0.01 1.21 2.11
Manufactures 1997 77.11 70.38 1.96 9.35 0.20 3.85 2.01 1.43 0.16 1.49 0.06 1.13 88.82 93.511998 88.51 80.11 2.44 10.65 0.15 3.98 1.50 1.58 0.11 1.62 0.13 1.43 99.88 105.891999 102.15 94.82 3.59 12.10 0.31 4.74 1.88 2.28 0.16 2.57 0.14 1.73 115.12 125.60
Iron and steel 1997 1.55 1.48 0.14 0.50 0.00 0.16 0.09 0.08 0.08 0.05 0.01 0.05 2.60 2.951998 1.49 1.54 0.12 0.53 0.00 0.27 0.07 0.11 0.05 0.12 0.01 0.06 2.29 3.371999 1.26 1.53 0.16 0.48 0.05 0.26 0.04 0.11 0.04 0.11 0.00 0.01 1.71 3.05
Chemicals 1997 2.10 7.55 0.42 1.71 0.06 0.25 0.05 0.15 0.05 0.10 0.02 0.08 4.31 10.761998 2.15 8.04 0.42 1.84 0.05 0.23 0.05 0.17 0.02 0.10 0.01 0.11 4.36 11.521999 2.34 9.10 0.45 2.00 0.05 0.25 0.06 0.18 0.02 0.20 0.01 0.12 4.66 12.99
Other semi- 1997 4.78 9.34 0.12 0.87 0.00 0.27 0.08 0.18 0.00 0.08 0.00 0.07 5.70 11.28 manufactures 1998 5.26 10.32 0.15 0.99 0.01 0.30 0.08 0.18 0.00 0.06 0.00 0.08 6.22 12.44
1999 6.33 11.97 0.12 1.04 0.01 0.33 0.08 0.29 0.00 0.11 0.00 0.11 7.15 14.50
Machinery and 1997 53.52 38.67 0.89 5.15 0.09 2.75 1.64 0.87 0.01 0.97 0.02 0.59 59.47 51.89 transport 1998 62.24 45.24 1.40 6.07 0.06 2.76 1.12 0.98 0.02 1.05 0.10 0.74 68.04 59.96 equipment 1999 72.72 54.83 2.44 7.23 0.16 3.42 1.42 1.49 0.04 1.57 0.13 0.94 80.74 73.40
Power generating 1997 1.52 1.25 0.01 0.12 0.00 0.03 0.02 0.01 0.00 0.00 0.00 0.01 1.61 1.48 machinery 1998 1.90 1.40 0.04 0.16 0.00 0.04 0.02 0.01 0.00 0.00 0.00 0.02 2.00 1.71
1999 2.47 1.47 0.04 0.22 0.00 0.19 0.03 0.03 0.00 0.01 0.00 0.02 2.60 2.10
Other non- 1997 3.50 6.84 0.11 2.76 0.02 0.73 0.03 0.23 0.00 0.09 0.00 0.07 4.08 11.30 electrical 1998 3.92 8.15 0.12 3.13 0.01 0.82 0.03 0.31 0.00 0.10 0.00 0.11 4.44 13.25 machinery 1999 5.03 9.34 0.13 3.48 0.02 0.93 0.09 0.37 0.00 0.21 0.00 0.10 5.51 15.16
Office and 1997 16.16 10.14 0.27 0.62 0.04 0.84 0.41 0.16 0.00 0.62 0.00 0.38 17.92 14.19 telecommunication 1998 19.67 12.63 0.31 0.65 0.03 0.85 0.41 0.16 0.01 0.72 0.07 0.39 21.68 16.90 equipment 1999 23.06 15.67 0.44 0.93 0.10 1.15 0.41 0.17 0.01 1.02 0.12 0.50 25.42 21.09
Electrical 1997 14.04 10.31 0.14 0.56 0.01 0.48 0.09 0.11 0.00 0.26 0.00 0.12 14.65 12.35 machinery and 1998 14.90 11.64 0.17 0.71 0.00 0.48 0.11 0.11 0.00 0.22 0.00 0.20 15.54 13.89 apparatus 1999 16.64 12.82 0.17 0.92 0.01 0.64 0.12 0.14 0.00 0.31 0.00 0.29 17.35 15.89
Automotive 1997 17.16 9.03 0.31 0.88 0.01 0.43 1.05 0.33 0.00 0.00 0.02 0.00 19.93 10.90 products 1998 19.45 9.43 0.67 1.17 0.01 0.44 0.51 0.35 0.01 0.00 0.02 0.00 21.77 11.70
1999 22.81 12.87 1.53 1.45 0.02 0.39 0.63 0.64 0.03 0.00 0.01 0.00 25.25 15.87
Other transport 1997 1.14 1.11 0.04 0.20 0.00 0.24 0.03 0.02 0.00 0.00 0.00 0.01 1.28 1.67 equipment 1998 2.41 2.00 0.09 0.24 0.00 0.12 0.03 0.04 0.00 0.00 0.00 0.02 2.60 2.51
1999 2.60 2.66 0.14 0.22 0.01 0.12 0.06 0.14 0.00 0.01 0.00 0.02 2.86 3.28
Textiles 1997 1.42 2.15 0.09 0.20 0.00 0.02 0.07 0.02 0.01 0.19 0.00 0.01 1.91 2.871998 1.61 2.68 0.07 0.18 0.01 0.02 0.07 0.03 0.01 0.20 0.00 0.02 2.03 3.431999 2.12 3.92 0.05 0.20 0.01 0.03 0.07 0.06 0.05 0.31 0.00 0.03 2.52 4.83
Clothing 1997 5.50 3.08 0.05 0.11 0.00 0.00 0.02 0.01 0.00 0.02 0.00 0.01 5.64 3.351998 6.39 3.42 0.03 0.11 0.00 0.00 0.02 0.02 0.00 0.02 0.00 0.02 6.60 3.751999 7.46 3.27 0.03 0.11 0.00 0.00 0.04 0.02 0.00 0.02 0.00 0.01 7.81 3.64
Other consumer 1997 8.24 8.12 0.25 0.81 0.04 0.39 0.07 0.11 0.01 0.07 0.00 0.33 9.21 10.42 goods 1998 9.37 8.87 0.26 0.94 0.03 0.40 0.08 0.10 0.01 0.07 0.00 0.41 10.34 11.42
1999 11.34 10.19 0.34 1.05 0.04 0.44 0.09 0.12 0.01 0.25 0.00 0.51 12.31 13.18
Total merchandise a 1997 93.02 83.21 3.90 10.43 1.01 4.47 2.30 2.02 0.21 1.64 0.14 1.29 110.05 111.981998 101.93 93.24 3.89 11.71 0.56 4.55 1.72 2.26 0.14 1.82 0.19 1.62 117.33 125.191999 119.26 108.23 5.23 13.16 0.85 5.11 2.61 3.00 0.19 2.80 0.15 1.93 136.70 145.56
a Includes unspecified products.
b Includes unspecified destinations and origins.
Note: Imports are valued f.o.b. For sources and methods, see the Technical Notes.

Appe
ndix
tabl
es
188
Table A11
Merchandise trade by product, region and major trading partner, 1997-99 - European Union (15)
(Billion dollars)
C./E. Europe/
North America Latin America Western Europe Baltic States/CIS Africa Middle East Asia
exp imp exp imp exp imp exp imp exp imp exp imp exp imp
Agricultural products 1997 9.91 17.04 3.72 22.74 169.78 168.97 13.84 8.85 7.68 13.21 5.69 2.06 13.67 16.751998 10.16 16.62 3.71 22.45 175.29 175.43 11.77 8.90 8.15 13.95 5.33 1.93 11.54 17.351999 11.15 15.93 3.36 21.87 170.13 170.39 9.44 9.47 7.40 13.46 5.66 1.99 13.14 16.93
Food 1997 8.92 11.08 3.42 20.48 143.14 143.18 12.43 4.44 6.46 10.31 5.24 1.41 10.98 11.441998 9.17 10.84 3.42 20.26 148.81 149.48 10.35 4.52 6.98 11.00 4.90 1.31 9.40 12.351999 10.15 10.33 3.09 19.60 145.15 145.57 8.08 4.54 6.33 10.60 5.26 1.34 10.53 12.37
Raw materials 1997 0.98 5.96 0.30 2.26 26.64 25.78 1.41 4.41 1.22 2.90 0.46 0.65 2.70 5.301998 0.99 5.78 0.29 2.19 26.48 25.95 1.42 4.38 1.17 2.96 0.43 0.61 2.14 5.001999 0.99 5.59 0.28 2.26 24.98 24.82 1.36 4.93 1.07 2.86 0.40 0.64 2.61 4.56
Mining products 1997 7.40 9.14 1.28 9.57 86.38 105.86 3.99 28.71 2.22 28.01 1.75 20.28 4.79 5.921998 6.26 9.12 1.34 8.83 75.56 87.87 3.39 21.10 2.20 21.75 1.33 16.42 3.15 6.131999 8.35 7.91 1.29 8.80 77.19 91.36 3.36 24.15 1.95 24.17 1.30 18.94 4.12 5.73
Ores and other 1997 0.49 2.93 0.11 3.91 12.30 12.48 0.48 3.06 0.21 2.19 0.19 0.31 1.79 2.91 minerals 1998 0.52 3.22 0.11 3.61 11.24 11.52 0.44 2.92 0.24 2.26 0.18 0.29 0.97 2.80
1999 0.63 2.99 0.11 3.51 10.12 10.83 0.45 2.83 0.22 2.62 0.17 0.29 1.35 2.58
Fuels 1997 4.60 3.42 0.80 2.94 48.43 66.03 2.30 19.67 1.55 24.57 0.70 19.81 0.62 1.841998 3.49 2.76 0.79 2.50 39.02 48.79 1.67 12.48 1.44 18.14 0.47 15.77 0.38 1.961999 5.44 2.43 0.76 2.76 43.16 54.54 1.61 15.77 1.28 20.13 0.53 18.32 0.78 1.86
Non-ferrous metals 1997 2.30 2.78 0.37 2.73 25.65 27.36 1.22 5.99 0.46 1.25 0.86 0.16 2.38 1.171998 2.25 3.13 0.44 2.72 25.31 27.55 1.27 5.69 0.52 1.35 0.68 0.35 1.80 1.371999 2.28 2.49 0.42 2.53 23.91 25.99 1.31 5.54 0.45 1.42 0.60 0.33 1.99 1.30
Manufactures 1997 154.41 149.38 47.52 10.28 1133.60 1094.40 99.60 54.75 45.86 17.55 49.29 10.76 175.14 224.581998 171.66 160.71 49.87 11.40 1213.18 1177.79 103.84 67.51 47.99 18.85 46.24 11.63 138.04 243.581999 189.16 162.90 46.88 12.14 1203.56 1176.01 95.15 74.44 44.78 20.19 43.67 12.42 139.69 255.83
Iron and steel 1997 4.89 0.74 1.41 0.90 47.44 45.93 2.45 4.16 1.80 0.91 1.95 0.08 4.09 1.161998 4.68 0.76 1.43 1.12 50.32 49.38 2.89 4.85 1.80 1.09 1.70 0.12 2.64 2.901999 4.53 0.76 1.20 0.98 44.93 44.48 2.70 4.50 1.38 1.06 1.35 0.14 2.39 2.33
Chemicals 1997 22.62 21.76 8.12 1.90 177.49 174.74 14.20 5.59 7.31 1.50 6.71 1.93 24.84 10.911998 25.49 23.46 8.08 1.72 192.23 190.20 14.03 5.46 7.46 1.60 6.56 2.12 20.50 12.191999 31.25 24.21 7.86 1.65 190.91 188.57 13.14 5.68 6.98 1.56 6.22 2.45 23.70 12.57
Other semi- 1997 13.90 9.13 4.25 1.90 136.00 133.85 12.33 8.98 4.88 4.32 7.96 2.12 19.20 14.87 manufactures 1998 15.40 9.81 4.49 1.86 142.24 139.77 12.82 9.92 4.89 3.74 7.32 2.15 14.72 16.19
1999 16.78 10.21 4.19 1.91 138.75 139.54 12.19 10.81 4.54 4.38 7.79 2.41 16.54 16.93
Machinery and 1997 86.18 93.26 27.90 3.70 552.24 523.25 48.91 19.28 23.61 2.51 24.62 3.43 100.09 125.38 transport 1998 97.73 100.93 29.59 4.91 605.80 577.96 51.58 27.82 25.15 3.57 22.87 4.06 78.37 137.56 equipment 1999 104.91 100.83 27.66 5.81 611.68 586.91 46.58 32.66 23.71 4.07 21.16 4.00 74.28 146.50
Power generating 1997 8.67 10.68 0.94 0.15 14.84 14.51 1.28 0.76 1.03 0.18 1.50 0.83 4.85 2.40 machinery 1998 11.47 12.69 1.32 0.21 16.77 16.33 1.22 1.01 1.26 0.18 1.72 0.85 4.43 2.51
1999 12.71 14.35 1.18 0.18 18.13 17.46 1.08 1.06 1.24 0.19 1.69 1.04 4.58 2.80
Other non- 1997 23.53 14.44 11.41 0.50 114.44 108.20 16.39 3.58 9.15 0.43 7.25 0.63 33.95 11.43 electrical 1998 25.96 15.54 11.25 0.64 125.32 119.82 17.29 4.52 9.14 0.56 7.44 0.68 23.94 13.30 machinery 1999 26.32 15.71 10.53 0.66 120.75 117.38 14.84 5.06 8.22 0.67 6.56 0.68 22.77 13.90
Office and 1997 14.01 35.11 3.27 0.55 135.90 129.40 9.20 3.44 3.70 0.54 2.81 1.05 25.45 69.67 telecommunication 1998 14.36 35.62 3.57 0.90 151.60 144.32 9.80 5.43 5.09 0.66 3.58 1.37 21.56 74.64 equipment 1999 15.84 37.10 3.36 1.36 156.18 148.36 9.81 6.51 4.81 0.68 3.83 1.44 21.41 80.55
Electrical 1997 7.52 9.15 2.89 0.43 63.50 62.17 8.44 4.39 2.89 0.68 3.22 0.45 10.59 15.81 machinery and 1998 7.96 9.53 3.21 0.47 65.32 64.15 8.86 5.43 3.15 0.81 3.28 0.46 8.65 16.98 apparatus 1999 8.95 10.12 2.94 0.50 63.09 62.46 7.97 6.06 2.92 0.91 3.14 0.51 8.86 18.57
Automotive 1997 20.64 5.64 6.34 0.97 182.47 171.59 11.34 6.04 4.71 0.29 3.84 0.08 15.31 19.59 products 1998 24.08 6.55 6.61 1.67 203.24 193.17 11.40 9.85 4.75 0.66 3.77 0.16 10.51 21.90
1999 27.95 6.93 5.86 2.08 204.66 196.00 10.40 11.90 4.78 1.05 3.41 0.19 10.40 22.12
Other transport 1997 11.82 18.24 3.04 1.11 41.08 37.37 2.27 1.07 2.13 0.38 6.01 0.39 9.93 6.48 equipment 1998 13.91 21.01 3.63 1.02 43.55 40.16 3.01 1.57 1.76 0.70 3.09 0.54 9.28 8.22
1999 13.14 16.63 3.80 1.02 48.87 45.24 2.47 2.07 1.75 0.56 2.54 0.14 6.27 8.57
Textiles 1997 2.78 1.95 0.81 0.34 42.60 41.79 6.48 1.98 3.21 0.95 1.14 0.77 4.21 8.671998 2.85 1.96 0.85 0.29 42.79 42.33 7.00 2.39 3.55 0.80 1.10 0.78 3.19 9.031999 3.04 1.79 0.80 0.27 39.00 39.01 6.59 2.51 3.34 0.75 1.00 0.78 3.34 8.72
Clothing 1997 2.55 0.98 0.40 0.37 44.34 47.47 2.86 7.73 1.03 6.02 1.11 0.83 3.82 23.951998 2.80 0.81 0.49 0.33 40.66 44.34 3.10 9.00 1.04 6.58 1.24 0.80 3.01 24.311999 2.97 0.70 0.44 0.32 40.02 43.45 2.76 9.22 0.99 6.78 1.11 0.83 3.06 25.42
Other consumer 1997 21.49 21.56 4.64 1.18 133.50 127.37 12.38 7.04 4.01 1.34 5.80 1.60 18.90 39.63 goods 1998 22.71 22.99 4.96 1.18 139.15 133.81 12.42 8.06 4.09 1.47 5.45 1.59 15.62 41.38
1999 25.69 24.39 4.73 1.21 138.27 134.06 11.20 9.06 3.85 1.57 5.03 1.82 16.38 43.36
Total merchandise a 1997 174.00 179.07 53.40 42.81 1429.80 1414.15 118.67 94.60 56.84 63.13 58.26 33.33 197.56 248.131998 191.53 189.87 57.19 42.78 1517.57 1499.14 123.68 99.54 60.02 58.23 55.70 30.12 158.80 267.991999 212.00 189.06 53.50 42.92 1511.43 1503.91 111.73 110.42 55.77 61.75 51.76 33.49 161.84 279.31

Appe
ndix
tabl
es
189
Table A11 (continued)
Merchandise trade by product, region and major trading partner, 1997-99 - European Union (15)
(Billion dollars)
Intra-EU Extra-EU United States Switzerland Japan China World b
exp imp exp imp exp imp exp imp exp imp exp imp exp imp
Agricultural products 1997 160.28 64.55 89.61 8.54 13.20 3.97 1.62 4.71 0.41 0.63 2.05 224.83 249.891998 166.26 60.45 90.75 8.70 12.75 3.94 1.66 4.41 0.41 0.85 2.11 226.71 257.011999 161.56 59.45 88.78 9.45 11.31 4.07 1.75 4.89 0.47 1.42 2.21 221.00 250.33
Food 1997 136.07 54.92 66.48 7.66 9.27 3.06 1.23 3.83 0.11 0.42 1.27 190.99 202.551998 141.89 51.73 68.12 7.82 8.93 3.13 1.28 3.81 0.11 0.58 1.36 193.62 210.021999 138.27 50.91 66.32 8.55 7.94 3.29 1.37 4.18 0.12 0.88 1.40 189.18 204.59
Raw materials 1997 24.21 9.63 23.13 0.88 3.93 0.90 0.39 0.89 0.29 0.21 0.78 33.84 47.341998 24.37 8.72 22.63 0.88 3.83 0.80 0.38 0.60 0.30 0.27 0.76 33.09 46.991999 23.29 8.54 22.46 0.87 3.40 0.77 0.37 0.71 0.35 0.55 0.80 31.83 45.75
Mining products 1997 77.49 33.36 130.26 6.70 6.58 4.53 1.97 0.87 0.38 0.38 0.96 110.85 207.751998 67.93 28.73 108.26 5.77 6.49 4.06 2.12 0.77 0.46 0.31 1.12 96.66 176.191999 69.88 30.23 112.64 7.97 5.07 3.89 2.10 0.92 0.41 0.80 1.04 100.11 182.52
Ores and other 1997 11.09 4.54 16.71 0.39 1.61 0.26 0.42 0.29 0.07 0.22 0.31 15.63 27.80 minerals 1998 10.20 3.56 16.49 0.41 1.79 0.28 0.37 0.23 0.08 0.16 0.35 13.75 26.69
1999 9.29 3.81 16.41 0.54 1.55 0.26 0.65 0.30 0.09 0.32 0.31 13.10 25.69
Fuels 1997 42.92 18.88 95.49 4.16 2.99 2.98 0.43 0.04 0.06 0.02 0.38 61.80 138.411998 34.42 16.12 72.80 3.25 2.36 2.60 0.41 0.06 0.06 0.02 0.41 50.54 107.231999 38.46 17.50 78.72 5.43 1.69 2.55 0.40 0.06 0.04 0.28 0.36 55.96 117.18
Non-ferrous metals 1997 23.48 9.94 18.06 2.15 1.99 1.29 1.12 0.54 0.25 0.14 0.27 33.42 41.541998 23.31 9.06 18.97 2.11 2.34 1.17 1.33 0.49 0.32 0.13 0.36 32.36 42.281999 22.14 8.92 17.51 2.05 1.79 1.07 1.12 0.56 0.27 0.20 0.38 31.06 39.65
Manufactures 1997 1022.65 689.11 544.43 140.47 141.91 50.13 43.65 34.07 72.50 17.01 36.79 1711.76 1567.071998 1099.22 682.64 597.92 157.32 151.10 53.02 46.48 28.55 78.95 16.54 41.08 1781.86 1697.141999 1095.26 677.14 624.42 168.54 154.29 56.31 47.37 31.58 80.91 18.97 46.94 1772.40 1719.68
Iron and steel 1997 43.29 20.79 10.73 4.22 0.64 1.50 0.71 0.18 0.35 0.40 0.24 64.08 54.021998 46.31 19.28 13.97 4.04 0.65 1.57 0.76 0.14 0.51 0.43 0.36 65.59 60.281999 41.64 16.90 12.63 3.54 0.66 1.36 0.74 0.10 0.40 0.43 0.25 58.54 54.27
Chemicals 1997 159.70 103.06 59.48 20.64 21.19 9.56 12.20 6.74 4.78 1.56 2.21 262.76 219.181998 174.43 103.19 63.31 23.29 22.62 9.85 12.74 5.88 4.92 1.43 2.27 277.62 237.741999 172.56 110.20 64.80 28.60 23.68 10.63 12.30 7.49 5.11 2.02 2.42 282.76 237.36
Other semi- 1997 122.52 76.03 52.73 12.63 8.09 6.67 7.50 2.56 2.66 1.19 3.06 198.54 175.24 manufactures 1998 128.28 74.08 55.58 14.01 8.65 6.86 7.37 2.09 2.93 1.18 3.46 202.36 183.85
1999 126.46 74.76 59.97 14.66 8.46 6.59 8.53 2.28 3.09 1.49 3.95 201.22 186.43
Machinery and 1997 501.81 365.09 272.56 78.29 88.51 18.81 13.78 16.11 54.62 12.73 10.42 866.90 774.37 transport 1998 553.11 364.27 306.99 89.85 94.77 21.05 15.37 13.03 60.10 12.32 12.86 917.39 860.10 equipment 1999 561.82 353.83 323.15 92.80 95.59 23.74 15.38 13.73 62.03 13.45 15.65 915.66 884.97
Power generating 1997 13.08 20.02 16.97 7.89 9.98 0.89 0.93 0.36 0.77 0.63 0.42 33.10 30.05 machinery 1998 14.76 23.43 19.38 10.34 11.67 0.96 0.99 0.40 0.91 0.73 0.48 38.19 34.14
1999 15.81 24.80 21.63 10.96 13.68 1.36 1.03 0.39 0.94 0.94 0.57 40.61 37.44
Other non- 1997 99.30 116.95 40.11 21.07 13.59 5.21 7.27 3.55 7.55 5.58 0.91 216.25 139.41 electrical 1998 109.71 110.88 45.71 23.46 14.49 5.73 8.14 2.88 8.71 4.72 1.06 220.60 155.43 machinery 1999 107.01 103.17 47.25 22.32 14.78 5.74 8.22 2.77 9.17 5.40 1.21 210.19 154.27
Office and 1997 126.76 68.32 113.70 13.18 33.75 3.73 1.26 3.40 20.05 2.36 5.90 195.09 240.46 telecommunication 1998 140.93 69.35 123.08 13.58 33.91 4.61 1.55 2.68 21.96 3.32 7.35 210.28 264.01 equipment 1999 144.93 70.84 131.76 13.85 35.79 5.44 1.74 2.76 22.80 3.20 8.71 215.78 276.70
Electrical 1997 57.46 41.66 36.05 7.02 8.89 2.51 3.05 1.52 6.30 1.10 2.87 99.12 93.50 machinery and 1998 59.06 41.67 39.39 7.44 9.15 2.59 3.15 1.31 6.47 1.18 3.45 100.73 98.45 apparatus 1999 57.44 40.72 42.03 8.07 9.97 2.72 3.11 1.40 7.04 1.66 4.40 98.16 99.47
Automotive 1997 169.39 75.33 36.11 19.53 5.37 4.54 0.61 6.58 16.04 1.17 0.05 244.71 205.50 products 1998 190.40 74.00 43.99 22.87 5.75 4.98 0.70 5.01 17.64 0.65 0.09 264.40 234.38
1999 192.90 74.58 47.68 26.21 6.12 5.17 0.68 5.82 17.39 0.57 0.12 267.48 240.58
Other transport 1997 35.82 42.81 29.63 9.60 16.92 1.92 0.66 0.71 3.90 1.90 0.26 78.63 65.44 equipment 1998 38.26 44.93 35.43 12.16 19.79 2.18 0.84 0.74 4.41 1.72 0.43 83.19 73.69
1999 43.73 39.72 32.80 11.00 15.34 3.54 0.60 0.58 4.69 1.68 0.64 83.44 76.53
Textiles 1997 38.39 23.01 18.20 2.44 1.83 1.28 1.33 0.99 0.70 0.24 1.43 61.39 56.591998 38.64 23.06 19.12 2.52 1.83 1.26 1.36 0.77 0.79 0.21 1.54 61.69 57.761999 35.30 22.14 18.62 2.62 1.62 1.18 1.24 0.79 0.82 0.28 1.61 57.44 53.92
Clothing 1997 40.37 15.76 47.12 2.31 0.91 2.34 0.41 1.88 0.14 0.03 6.72 56.13 87.481998 36.54 15.81 49.82 2.54 0.73 2.39 0.39 1.68 0.13 0.05 6.81 52.35 86.351999 35.87 15.50 50.98 2.48 0.59 2.40 0.40 1.72 0.14 0.06 7.46 51.37 86.85
Other consumer 1997 116.58 85.37 83.60 19.93 20.73 9.97 7.71 5.62 9.26 0.85 12.72 201.95 200.19 goods 1998 121.92 82.95 89.14 21.07 21.87 10.04 8.48 4.97 9.56 0.92 13.77 204.87 211.05
1999 121.61 83.81 94.26 23.50 23.77 10.40 8.58 5.49 9.31 1.24 15.61 205.42 215.87
Total merchandise a 1997 1297.20 1300.95 812.68 783.66 157.80 164.79 60.02 50.85 40.18 73.58 18.36 39.85 2109.88 2084.611998 1383.12 1387.12 810.49 819.96 174.90 173.86 62.22 53.83 34.51 80.15 19.02 44.34 2193.62 2207.081999 1384.81 1388.81 795.63 843.41 188.89 173.16 65.27 54.48 38.00 82.08 23.00 50.22 2180.44 2232.22
a Includes unspecified products.
b Includes unspecified destinations and origins.
Note: The figures are affected by the "INTRASTAT" system of recording trade between EU member States. Unspecified products account for 4.3 per cent of total
intra-EU trade, and intra-EU imports are under-recorded. To compensate for this under-recording, intra-EU exports have been used to obtain total (World) imports.
Major trading partners were selected on the basis of 1998 data. 1999 exports and imports have been partly estimated by the Secretariat. See the Technical Notes.

Appe
ndix
tabl
es
190
Table A12
Merchandise trade by product, region and major trading partner, 1997-99 - France
(Billion dollars)
C./E. Europe/
North America Latin America Western Europe Baltic States/CIS Africa Middle East Asia
exp imp exp imp exp imp exp imp exp imp exp imp exp imp
Agricultural products 1997 1.99 1.61 0.54 2.75 31.50 22.37 1.25 0.62 2.26 2.59 1.31 0.30 2.65 1.901998 2.22 1.64 0.51 2.57 31.25 23.19 1.04 0.64 2.39 2.79 1.13 0.30 2.52 1.871999 2.44 1.45 0.49 2.37 29.83 22.47 0.86 0.61 1.92 2.56 1.32 0.29 2.50 1.66
Food 1997 1.89 0.92 0.50 2.40 28.67 19.32 1.17 0.35 2.14 2.11 1.27 0.25 2.44 1.181998 2.12 0.97 0.48 2.26 28.52 20.08 0.95 0.38 2.27 2.30 1.10 0.26 2.29 1.221999 2.33 0.82 0.45 2.04 27.33 19.36 0.78 0.37 1.81 2.10 1.29 0.26 2.25 1.16
Raw materials 1997 0.10 0.69 0.03 0.35 2.84 3.05 0.08 0.27 0.12 0.48 0.04 0.05 0.22 0.721998 0.10 0.67 0.04 0.32 2.73 3.11 0.09 0.26 0.12 0.49 0.03 0.04 0.22 0.651999 0.11 0.63 0.04 0.32 2.50 3.12 0.08 0.24 0.11 0.46 0.03 0.03 0.25 0.50
Mining products 1997 0.55 0.92 0.14 1.26 10.89 14.74 0.15 3.44 0.47 4.49 0.26 4.70 0.50 0.791998 0.56 0.85 0.13 1.16 10.03 12.24 0.16 2.46 0.48 3.70 0.17 3.76 0.32 0.761999 0.42 0.77 0.09 1.15 9.98 12.95 0.16 2.98 0.41 3.72 0.15 4.24 0.30 0.72
Ores and other 1997 0.05 0.18 0.01 0.36 1.52 1.29 0.02 0.05 0.03 0.34 0.01 0.03 0.06 0.30 minerals 1998 0.04 0.19 0.01 0.37 1.43 1.28 0.02 0.08 0.04 0.35 0.01 0.02 0.04 0.27
1999 0.05 0.18 0.01 0.33 1.45 1.16 0.02 0.07 0.03 0.31 0.01 0.02 0.04 0.25
Fuels 1997 0.29 0.45 0.09 0.34 5.88 9.42 0.09 2.69 0.33 3.86 0.17 4.66 0.12 0.351998 0.26 0.36 0.08 0.31 5.31 7.04 0.08 1.86 0.32 3.04 0.09 3.73 0.06 0.331999 0.18 0.33 0.05 0.35 5.60 8.02 0.08 2.47 0.26 3.18 0.09 4.20 0.07 0.31
Non-ferrous metals 1997 0.21 0.30 0.04 0.56 3.49 4.04 0.05 0.69 0.11 0.29 0.08 0.01 0.32 0.141998 0.26 0.29 0.04 0.48 3.28 3.92 0.06 0.53 0.12 0.30 0.07 0.02 0.21 0.151999 0.19 0.27 0.03 0.47 2.93 3.77 0.05 0.44 0.12 0.23 0.05 0.02 0.19 0.16
Manufactures 1997 17.80 22.35 5.78 1.35 146.97 138.92 7.54 3.82 11.94 4.42 5.47 0.78 24.09 27.981998 21.28 24.44 6.92 1.44 160.64 156.83 8.22 4.97 13.30 4.96 5.58 0.85 20.98 29.851999 22.82 24.55 5.54 1.44 163.51 155.05 7.94 5.61 12.94 4.76 6.53 0.81 18.75 31.96
Iron and steel 1997 0.77 0.10 0.22 0.10 7.06 6.98 0.16 0.15 0.39 0.14 0.22 0.00 0.46 0.111998 0.75 0.10 0.20 0.17 7.27 7.89 0.18 0.25 0.43 0.16 0.21 0.00 0.39 0.141999 0.65 0.08 0.17 0.11 6.85 6.87 0.17 0.15 0.27 0.13 0.15 0.00 0.36 0.08
Chemicals 1997 2.71 3.53 1.15 0.27 24.83 25.72 1.77 0.71 2.06 0.36 0.97 0.21 3.46 1.651998 2.91 3.88 1.19 0.25 26.95 27.93 1.83 0.86 2.32 0.51 1.00 0.21 2.80 1.781999 3.31 4.12 1.15 0.21 27.69 27.89 1.72 0.74 2.26 0.44 0.97 0.22 3.28 1.87
Other semi- 1997 1.60 1.02 0.46 0.14 16.68 17.74 0.69 0.46 1.05 0.15 0.46 0.08 1.44 1.34 manufactures 1998 1.68 1.03 0.48 0.13 17.86 19.32 0.70 0.54 1.14 0.16 0.45 0.11 1.15 1.51
1999 1.71 1.00 0.38 0.15 17.43 19.07 0.73 0.60 1.10 0.16 0.41 0.08 1.23 1.61
Machinery and 1997 10.01 14.07 3.43 0.55 75.31 62.66 3.78 1.32 6.11 0.82 2.85 0.25 14.95 15.04 transport 1998 13.06 15.61 4.44 0.63 83.70 73.95 4.18 1.97 6.84 0.94 3.02 0.31 13.52 16.05 equipment 1999 14.12 15.58 3.34 0.69 87.00 74.14 4.04 2.58 6.88 0.92 4.11 0.27 10.52 17.63
Power generating 1997 1.71 2.65 0.09 0.00 2.48 1.88 0.10 0.05 0.25 0.00 0.15 0.02 0.55 0.12 machinery 1998 2.91 3.44 0.19 0.01 2.70 2.55 0.09 0.06 0.29 0.02 0.21 0.03 0.55 0.11
1999 3.15 3.85 0.18 0.00 2.77 2.01 0.09 0.06 0.29 0.02 0.21 0.02 0.62 0.13
Other non- 1997 2.15 2.23 0.84 0.05 12.81 15.83 0.97 0.20 1.77 0.05 0.69 0.06 2.77 1.34 electrical 1998 2.67 2.34 0.97 0.06 14.18 17.94 1.09 0.27 1.97 0.05 0.77 0.07 2.34 1.55 machinery 1999 2.34 2.36 0.80 0.06 13.93 17.55 0.99 0.33 1.77 0.05 0.73 0.06 1.93 1.72
Office and 1997 1.64 5.25 0.46 0.11 16.62 10.50 0.93 0.46 1.23 0.38 0.52 0.10 3.68 9.36 telecommunication 1998 1.95 5.43 0.57 0.16 19.22 13.27 1.13 0.74 1.71 0.45 0.66 0.13 3.47 9.93 equipment 1999 2.06 4.68 0.52 0.14 18.59 13.06 1.20 1.02 1.70 0.43 0.58 0.10 3.39 10.44
Electrical 1997 0.90 1.20 0.44 0.08 7.83 7.57 0.82 0.34 0.91 0.23 0.64 0.06 1.56 1.97 machinery and 1998 0.88 1.22 0.61 0.11 8.19 8.21 0.64 0.39 1.07 0.28 0.71 0.06 1.32 2.00 apparatus 1999 1.02 1.22 0.40 0.11 8.00 8.03 0.56 0.48 1.02 0.32 0.60 0.06 1.31 2.32
Automotive 1997 0.93 0.27 0.88 0.13 29.45 21.34 0.86 0.23 1.19 0.04 0.37 0.00 0.80 1.13 products 1998 1.02 0.37 1.04 0.19 33.12 25.68 1.01 0.43 1.37 0.05 0.48 0.00 0.61 1.44
1999 1.10 0.44 0.94 0.13 34.37 27.12 0.99 0.60 1.38 0.07 0.39 0.01 0.53 1.65
Other transport 1997 2.69 2.46 0.72 0.17 6.14 5.54 0.10 0.05 0.75 0.12 0.47 0.02 5.58 1.12 equipment 1998 3.62 2.81 1.06 0.10 6.28 6.31 0.21 0.07 0.43 0.09 0.20 0.02 5.22 1.02
1999 4.44 3.03 0.51 0.25 9.35 6.37 0.22 0.09 0.72 0.02 1.61 0.03 2.74 1.39
Textiles 1997 0.28 0.17 0.07 0.05 4.92 5.41 0.33 0.11 1.04 0.16 0.14 0.05 0.42 0.941998 0.29 0.18 0.08 0.04 5.15 5.81 0.41 0.14 1.18 0.17 0.13 0.05 0.32 1.001999 0.29 0.18 0.07 0.03 4.66 5.29 0.45 0.15 1.11 0.14 0.13 0.05 0.32 0.97
Clothing 1997 0.26 0.13 0.05 0.05 3.56 4.09 0.21 0.66 0.26 2.41 0.24 0.10 0.76 3.181998 0.30 0.10 0.06 0.04 4.01 4.38 0.23 0.76 0.27 2.62 0.23 0.08 0.64 3.491999 0.29 0.06 0.05 0.03 4.05 4.15 0.24 0.83 0.26 2.53 0.20 0.08 0.60 3.73
Other consumer 1997 2.16 3.33 0.41 0.19 14.61 16.32 0.60 0.40 1.02 0.38 0.59 0.10 2.60 5.72 goods 1998 2.30 3.54 0.47 0.18 15.70 17.53 0.67 0.46 1.11 0.41 0.52 0.10 2.17 5.86
1999 2.45 3.52 0.39 0.22 15.82 17.64 0.59 0.57 1.07 0.44 0.56 0.10 2.43 6.06
Total merchandise a 1997 20.87 25.08 6.70 5.37 194.51 176.32 9.15 7.88 15.02 11.55 7.19 5.79 28.02 30.681998 24.64 26.97 7.84 5.18 206.98 192.74 9.63 8.08 16.53 11.48 7.13 4.92 24.46 32.491999 26.19 26.79 6.33 4.96 207.97 190.94 9.13 9.20 15.52 11.07 8.12 5.33 22.17 34.35

Appe
ndix
tabl
es
191
Table A12 (continued)
Merchandise trade by product, region and major trading partner, 1997-99 - France
(Billion dollars)
Intra-EU (15) Extra-EU United States Switzerland Japan China World b
exp imp exp imp exp imp exp imp exp imp exp imp exp imp
Agricultural products 1997 29.93 21.34 11.58 10.98 1.70 1.23 0.99 0.26 0.90 0.04 0.10 0.26 41.51 32.321998 29.69 22.06 11.38 11.15 1.88 1.26 1.03 0.27 1.12 0.04 0.19 0.26 41.07 33.211999 28.40 21.34 10.97 10.28 2.10 1.07 1.05 0.31 0.89 0.04 0.27 0.25 39.37 31.62
Food 1997 27.28 18.41 10.81 8.27 1.61 0.77 0.88 0.22 0.86 0.01 0.07 0.21 38.09 26.681998 27.12 19.08 10.62 8.55 1.79 0.82 0.93 0.23 1.09 0.01 0.13 0.21 37.74 27.631999 26.04 18.36 10.21 7.93 2.00 0.68 0.96 0.26 0.86 0.01 0.18 0.21 36.25 26.29
Raw materials 1997 2.64 2.93 0.78 2.71 0.08 0.46 0.11 0.05 0.04 0.04 0.03 0.04 3.42 5.641998 2.57 2.98 0.76 2.60 0.09 0.44 0.10 0.05 0.03 0.03 0.06 0.05 3.33 5.581999 2.36 2.99 0.76 2.34 0.10 0.39 0.09 0.05 0.03 0.04 0.08 0.04 3.12 5.33
Mining products 1997 9.00 10.38 4.00 20.05 0.47 0.67 1.64 0.26 0.10 0.05 0.06 0.18 13.00 30.431998 8.11 8.72 3.80 16.33 0.49 0.61 1.62 0.34 0.08 0.05 0.04 0.18 11.91 25.051999 8.23 9.26 3.31 17.32 0.38 0.56 1.42 0.31 0.06 0.04 0.05 0.16 11.54 26.58
Ores and other 1997 1.44 1.22 0.25 1.34 0.04 0.05 0.06 0.03 0.01 0.00 0.01 0.02 1.69 2.56 minerals 1998 1.35 1.22 0.24 1.35 0.04 0.04 0.06 0.03 0.01 0.00 0.01 0.02 1.59 2.57
1999 1.37 1.10 0.25 1.21 0.05 0.04 0.06 0.02 0.01 0.00 0.01 0.02 1.62 2.31
Fuels 1997 4.30 5.58 2.70 16.22 0.24 0.40 1.40 0.06 0.01 0.01 0.00 0.13 7.00 21.801998 3.70 4.10 2.58 12.61 0.22 0.33 1.40 0.10 0.01 0.01 0.01 0.14 6.28 16.711999 4.09 4.87 2.27 14.01 0.16 0.29 1.25 0.10 0.01 0.01 0.01 0.10 6.36 18.88
Non-ferrous metals 1997 3.26 3.58 1.05 2.50 0.19 0.22 0.17 0.17 0.07 0.04 0.05 0.03 4.31 6.081998 3.06 3.40 0.99 2.37 0.23 0.24 0.16 0.21 0.06 0.04 0.03 0.03 4.05 5.771999 2.76 3.29 0.80 2.09 0.17 0.24 0.12 0.19 0.04 0.03 0.03 0.04 3.56 5.38
Manufactures 1997 134.36 130.74 86.96 72.53 15.80 21.27 6.96 5.76 3.70 8.83 3.13 6.20 221.32 203.271998 147.32 147.28 92.79 79.90 19.37 23.43 7.40 6.44 3.32 9.42 2.96 6.77 240.11 227.181999 149.36 145.60 89.36 82.59 20.11 23.58 8.23 6.37 3.44 10.16 2.88 7.64 238.72 228.19
Iron and steel 1997 6.60 6.82 2.68 0.82 0.65 0.08 0.18 0.08 0.02 0.02 0.05 0.01 9.28 7.641998 6.88 7.67 2.57 1.07 0.64 0.08 0.20 0.09 0.01 0.02 0.09 0.02 9.45 8.741999 6.53 6.70 2.10 0.77 0.54 0.07 0.17 0.09 0.01 0.02 0.07 0.01 8.63 7.47
Chemicals 1997 22.44 23.22 14.52 9.85 2.49 3.46 1.71 2.35 0.96 0.80 0.15 0.36 36.96 33.071998 24.61 25.32 14.39 10.48 2.65 3.79 1.60 2.46 0.77 0.83 0.15 0.32 39.00 35.801999 25.31 25.33 15.06 10.56 3.06 4.05 1.54 2.42 0.94 0.78 0.18 0.36 40.37 35.89
Other semi- 1997 15.41 16.88 6.98 4.22 1.45 0.92 0.77 0.57 0.29 0.32 0.14 0.35 22.39 21.10 manufactures 1998 16.47 18.42 6.99 4.58 1.51 0.92 0.80 0.62 0.25 0.38 0.12 0.41 23.46 23.00
1999 16.12 18.09 6.88 4.78 1.53 0.90 0.81 0.63 0.30 0.39 0.12 0.48 23.00 22.87
Machinery and 1997 69.42 60.14 48.73 36.72 8.81 13.36 2.45 1.62 1.00 6.18 2.64 1.93 118.15 96.86 transport 1998 77.38 70.63 54.56 41.34 12.02 15.01 2.80 1.95 0.95 6.72 2.48 2.27 131.94 111.97 equipment 1999 79.68 70.88 51.01 43.60 12.33 14.97 3.66 1.92 0.83 7.53 2.35 2.59 130.69 114.48
Power generating 1997 2.29 1.76 3.03 3.49 1.63 2.53 0.10 0.07 0.04 0.05 0.08 0.03 5.32 5.25 machinery 1998 2.46 2.38 4.48 4.20 2.78 3.31 0.14 0.09 0.04 0.05 0.14 0.03 6.94 6.58
1999 2.49 1.82 4.82 4.80 2.86 3.74 0.17 0.10 0.03 0.05 0.28 0.03 7.31 6.62
Other non- 1997 11.58 14.82 10.43 5.16 1.93 2.16 0.51 0.91 0.31 0.98 0.50 0.11 22.01 19.98 electrical 1998 12.86 16.70 11.14 5.86 2.43 2.27 0.56 1.12 0.28 1.11 0.43 0.12 24.00 22.56 machinery 1999 12.81 16.37 9.66 6.00 2.08 2.28 0.52 1.08 0.26 1.18 0.37 0.14 22.47 22.37
Office and 1997 15.49 10.11 9.59 16.67 1.56 5.11 0.43 0.10 0.18 2.93 0.22 1.29 25.08 26.78 telecommunication 1998 17.90 12.83 10.89 18.13 1.86 5.29 0.56 0.14 0.20 3.09 0.42 1.50 28.79 30.96 equipment 1999 17.16 12.67 11.24 18.01 1.90 4.52 0.51 0.13 0.23 3.34 0.37 1.57 28.40 30.68
Electrical 1997 7.22 7.04 5.92 4.58 0.81 1.17 0.27 0.37 0.13 0.74 0.21 0.45 13.14 11.62 machinery and 1998 7.50 7.59 6.02 4.87 0.80 1.18 0.30 0.44 0.12 0.69 0.22 0.58 13.52 12.46 apparatus 1999 7.33 7.38 5.77 5.39 0.89 1.19 0.30 0.47 0.11 0.77 0.28 0.78 13.10 12.77
Automotive 1997 27.68 21.00 6.80 2.46 0.91 0.26 0.63 0.06 0.12 0.90 0.24 0.01 34.48 23.46 products 1998 31.15 24.93 7.51 3.64 1.00 0.36 0.68 0.08 0.14 1.19 0.14 0.01 38.66 28.57
1999 32.37 26.38 7.32 4.03 1.08 0.40 0.70 0.09 0.14 1.35 0.10 0.02 39.69 30.41
Other transport 1997 5.16 5.40 12.96 4.37 1.96 2.14 0.51 0.11 0.22 0.58 1.39 0.04 18.12 9.77 equipment 1998 5.51 6.20 14.51 4.65 3.14 2.60 0.57 0.07 0.17 0.59 1.14 0.04 20.02 10.85
1999 7.53 6.26 12.20 5.37 3.52 2.85 1.45 0.07 0.06 0.84 0.96 0.05 19.73 11.63
Textiles 1997 4.63 5.05 2.58 1.92 0.25 0.16 0.12 0.15 0.10 0.11 0.01 0.18 7.21 6.971998 4.85 5.40 2.72 2.10 0.26 0.18 0.12 0.16 0.08 0.12 0.02 0.21 7.57 7.501999 4.39 4.90 2.64 2.02 0.26 0.17 0.11 0.14 0.07 0.12 0.02 0.21 7.03 6.92
Clothing 1997 3.17 3.49 2.17 7.27 0.23 0.13 0.28 0.03 0.38 0.03 0.00 0.95 5.34 10.761998 3.57 3.64 2.18 8.01 0.26 0.10 0.31 0.04 0.36 0.03 0.01 1.05 5.75 11.651999 3.63 3.46 2.06 8.12 0.26 0.06 0.30 0.03 0.33 0.04 0.01 1.23 5.69 11.58
Other consumer 1997 12.68 15.13 9.30 11.74 1.92 3.16 1.45 0.97 0.95 1.38 0.13 2.41 21.98 26.87 goods 1998 13.56 16.19 9.39 12.31 2.02 3.34 1.58 1.11 0.88 1.32 0.10 2.50 22.95 28.50
1999 13.71 16.25 9.60 12.72 2.12 3.36 1.64 1.13 0.95 1.28 0.13 2.76 23.31 28.97
Total merchandise a 1997 177.88 162.66 110.21 104.60 18.45 23.36 9.97 6.36 4.88 8.93 3.42 6.64 288.09 267.261998 189.76 178.49 115.69 108.31 22.27 25.35 10.35 7.10 4.67 9.52 3.31 7.22 305.45 286.801999 190.28 176.65 108.78 111.03 23.04 25.22 10.96 7.01 4.55 10.25 3.27 8.06 299.06 287.68
a Includes unspecified products.
b Includes unspecified destinations and origins.
Note: In this table figures refer to the combined trade of France and her overseas departments (French Guiana, Guadeloupe, Martinique and Reunion). For sources and methods,
see the Technical Notes.

Appe
ndix
tabl
es
192
Table A13
Merchandise trade by product, region and major trading partner, 1997-99 - Germany
(Billion dollars)
C./E. Europe/
North America Latin America Western Europe Baltic States/CIS Africa Middle East Asia
exp imp exp imp exp imp exp imp exp imp exp imp exp imp
Agricultural products 1997 0.98 3.20 0.30 5.34 22.12 33.48 4.20 2.75 0.46 1.98 0.61 0.44 1.33 3.861998 0.95 3.14 0.29 5.00 23.75 34.67 3.76 2.85 0.65 1.90 0.57 0.38 1.33 3.881999 0.93 2.57 0.27 4.47 20.65 29.27 2.84 2.69 0.67 1.56 0.73 0.33 1.40 3.39
Food 1997 0.79 1.93 0.20 4.93 18.53 27.81 3.64 1.81 0.32 1.64 0.53 0.33 0.93 2.681998 0.78 1.95 0.20 4.61 20.22 28.82 3.19 1.87 0.52 1.60 0.50 0.25 0.98 2.791999 0.80 1.57 0.19 4.07 17.65 24.58 2.30 1.72 0.55 1.31 0.67 0.23 0.92 2.54
Raw materials 1997 0.19 1.27 0.10 0.40 3.59 5.68 0.55 0.94 0.14 0.35 0.07 0.11 0.41 1.181998 0.17 1.19 0.09 0.39 3.53 5.85 0.57 0.98 0.13 0.31 0.07 0.12 0.35 1.091999 0.13 1.00 0.08 0.40 2.99 4.69 0.54 0.98 0.12 0.24 0.06 0.09 0.48 0.85
Mining products 1997 0.84 1.35 0.28 2.19 14.78 28.03 1.08 10.87 0.16 4.66 0.22 1.64 1.10 1.101998 1.00 1.53 0.31 2.00 12.19 19.54 1.14 6.63 0.17 3.55 0.18 1.31 0.88 1.191999 1.11 1.25 0.31 1.75 10.97 16.97 1.25 7.85 0.14 4.09 0.18 1.70 1.02 1.01
Ores and other 1997 0.04 0.58 0.02 1.19 3.28 2.41 0.11 1.20 0.02 0.31 0.01 0.03 0.29 0.64 minerals 1998 0.04 0.67 0.02 1.15 2.85 2.27 0.12 1.24 0.02 0.38 0.01 0.04 0.19 0.64
1999 0.05 0.60 0.02 1.00 2.24 1.96 0.12 0.97 0.02 0.41 0.01 0.04 0.27 0.52
Fuels 1997 0.17 0.24 0.06 0.47 4.77 19.37 0.41 7.62 0.06 4.02 0.05 1.57 0.07 0.161998 0.22 0.27 0.04 0.34 2.54 10.88 0.40 3.58 0.05 2.79 0.02 1.20 0.06 0.221999 0.33 0.16 0.07 0.37 2.70 9.67 0.46 5.16 0.04 3.29 0.03 1.61 0.07 0.19
Non-ferrous metals 1997 0.62 0.53 0.20 0.53 6.74 6.24 0.57 2.05 0.08 0.32 0.16 0.04 0.74 0.301998 0.73 0.59 0.25 0.52 6.80 6.39 0.63 1.81 0.09 0.38 0.14 0.08 0.63 0.331999 0.73 0.49 0.22 0.38 6.03 5.34 0.67 1.72 0.08 0.39 0.14 0.05 0.68 0.31
Manufactures 1997 45.84 31.24 13.08 2.02 274.20 192.08 42.41 25.51 9.28 2.54 9.93 1.48 50.95 58.731998 51.38 34.66 13.29 2.52 294.12 207.16 45.01 31.72 8.99 2.93 9.33 1.70 39.45 61.701999 54.80 35.91 12.91 2.78 279.41 184.65 40.92 34.37 8.46 3.22 8.99 1.83 39.92 62.74
Iron and steel 1997 1.37 0.12 0.40 0.16 10.43 9.35 1.15 1.46 0.38 0.14 0.49 0.01 1.21 0.291998 1.22 0.14 0.44 0.16 11.07 10.22 1.37 1.73 0.31 0.16 0.37 0.01 0.82 0.341999 1.04 0.13 0.31 0.07 8.49 7.90 1.36 1.33 0.22 0.15 0.28 0.01 0.71 0.26
Chemicals 1997 6.69 3.93 2.56 0.35 42.73 30.61 5.63 1.71 1.19 0.06 1.46 0.18 7.99 2.571998 7.44 4.68 2.52 0.36 42.37 35.03 5.60 1.70 1.19 0.10 1.41 0.25 6.36 2.641999 8.08 4.55 2.42 0.32 40.52 31.63 5.33 1.61 1.10 0.12 1.41 0.38 7.00 2.47
Other semi- 1997 2.57 1.81 1.11 0.25 28.27 24.01 4.81 4.04 0.72 0.12 0.79 0.19 3.28 3.42 manufactures 1998 2.81 1.98 1.09 0.26 30.49 26.03 5.29 4.54 0.74 0.14 0.74 0.19 2.38 3.53
1999 3.11 1.73 1.02 0.26 27.69 22.53 5.16 4.80 0.72 0.12 0.70 0.18 2.55 3.60
Machinery and 1997 30.49 20.71 7.86 0.82 150.80 88.05 22.62 9.89 5.77 0.62 6.24 0.43 33.36 33.31 transport 1998 34.92 22.89 8.08 1.30 165.09 93.48 23.92 14.29 5.49 0.84 5.78 0.53 25.46 36.16 equipment 1999 37.18 24.67 8.04 1.71 160.87 86.67 20.91 17.09 5.21 1.31 5.61 0.56 25.05 37.38
Power generating 1997 1.94 3.03 0.20 0.02 3.68 2.35 0.45 0.46 0.16 0.04 0.21 0.03 1.00 0.55 machinery 1998 2.32 3.44 0.28 0.03 4.15 2.52 0.57 0.60 0.21 0.02 0.30 0.06 0.87 0.58
1999 2.52 4.23 0.20 0.04 4.06 2.71 0.51 0.61 0.21 0.02 0.29 0.05 0.89 0.61
Other non- 1997 9.18 2.77 3.91 0.19 36.97 17.02 7.92 1.97 2.21 0.14 2.06 0.07 14.23 2.53 electrical 1998 10.10 3.14 3.73 0.23 40.45 19.36 8.43 2.50 1.92 0.18 2.00 0.07 9.68 3.04 machinery 1999 9.54 3.12 3.36 0.23 37.39 17.32 6.93 2.80 1.84 0.24 1.69 0.10 8.67 3.19
Office and 1997 1.82 8.02 0.56 0.08 21.98 14.26 2.76 0.94 0.62 0.03 0.51 0.16 4.95 18.46 telecommunication 1998 1.90 8.59 0.51 0.09 24.33 18.55 3.04 1.50 0.84 0.05 0.62 0.22 4.41 20.26 equipment 1999 2.30 8.99 0.49 0.13 24.68 17.79 3.21 2.09 0.66 0.05 0.73 0.23 4.89 21.10
Electrical 1997 2.73 1.94 0.87 0.13 18.29 10.17 3.76 2.49 0.66 0.27 0.85 0.15 3.52 5.02 machinery and 1998 2.99 2.17 0.92 0.13 19.17 10.86 4.22 3.02 0.75 0.32 0.80 0.15 3.10 5.18 apparatus 1999 3.23 2.31 0.83 0.14 17.91 9.33 3.75 3.25 0.71 0.34 0.83 0.14 3.15 5.64
Automotive 1997 12.22 2.03 1.91 0.27 56.73 34.30 6.40 3.38 1.50 0.11 1.93 0.01 8.32 5.39 products 1998 14.75 2.29 2.17 0.63 61.60 31.14 6.08 5.80 1.35 0.23 1.75 0.02 5.76 5.54
1999 16.52 1.99 1.85 1.00 60.49 30.36 5.19 7.05 1.54 0.64 1.65 0.02 5.91 5.08
Other transport 1997 2.60 2.93 0.40 0.13 13.14 9.97 1.32 0.65 0.61 0.02 0.70 0.02 1.33 1.36 equipment 1998 2.84 3.26 0.48 0.19 15.39 11.05 1.59 0.88 0.42 0.04 0.31 0.01 1.64 1.57
1999 3.07 4.04 1.32 0.16 16.36 9.16 1.31 1.31 0.26 0.02 0.42 0.03 1.54 1.76
Textiles 1997 0.43 0.32 0.10 0.08 8.26 7.44 3.09 0.83 0.54 0.11 0.13 0.32 0.64 1.651998 0.39 0.32 0.09 0.06 8.25 7.99 3.39 1.03 0.57 0.10 0.14 0.32 0.52 1.741999 0.41 0.31 0.09 0.06 6.79 6.53 3.15 1.02 0.50 0.08 0.13 0.28 0.51 1.62
Clothing 1997 0.21 0.20 0.03 0.10 6.05 10.26 0.80 3.84 0.08 1.08 0.07 0.18 0.26 7.191998 0.21 0.16 0.03 0.08 6.51 10.51 0.87 4.20 0.07 1.12 0.09 0.18 0.22 6.821999 0.20 0.13 0.02 0.07 6.13 8.67 0.74 3.98 0.05 1.01 0.08 0.17 0.20 6.73
Other consumer 1997 4.09 4.14 1.04 0.26 27.65 22.36 4.31 3.74 0.59 0.41 0.73 0.18 4.22 10.28 goods 1998 4.39 4.49 1.03 0.28 30.34 23.91 4.56 4.23 0.62 0.46 0.82 0.21 3.67 10.45
1999 4.77 4.41 1.01 0.29 28.92 20.72 4.27 4.54 0.65 0.44 0.78 0.26 3.90 10.68
Total merchandise a 1997 48.06 37.03 13.78 9.69 325.84 281.41 48.22 39.65 10.07 9.33 10.90 3.66 54.13 64.181998 54.11 40.46 15.06 9.55 341.28 285.99 52.76 41.52 10.35 8.44 10.68 3.40 44.50 66.971999 57.49 40.19 14.37 9.03 336.39 277.25 47.61 45.12 9.98 8.90 10.35 3.87 44.51 67.40

Appe
ndix
tabl
es
193
Table A13 (continued)
Merchandise trade by product, region and major trading partner, 1997-99 - Germany
(Billion dollars)
Intra-EU (15) Extra-EU United States Switzerland Japan Poland World b
exp imp exp imp exp imp exp imp exp imp exp imp exp imp
Agricultural products 1997 20.69 31.09 9.43 19.95 0.89 2.39 0.76 0.54 0.38 0.07 0.80 0.84 30.12 51.041998 22.30 32.26 9.37 19.62 0.87 2.35 0.78 0.59 0.34 0.09 0.87 0.87 31.67 51.881999 19.20 27.04 8.65 17.30 0.84 1.92 0.75 0.61 0.32 0.11 0.72 0.85 27.85 44.34
Food 1997 17.59 25.74 7.48 15.38 0.71 1.72 0.48 0.44 0.30 0.02 0.61 0.61 25.07 41.121998 19.21 26.73 7.44 15.16 0.71 1.70 0.52 0.48 0.29 0.02 0.68 0.64 26.65 41.891999 16.63 22.65 6.68 13.40 0.72 1.40 0.52 0.51 0.26 0.02 0.55 0.64 23.31 36.05
Raw materials 1997 3.10 5.35 1.95 4.57 0.18 0.67 0.28 0.10 0.08 0.05 0.19 0.23 5.05 9.921998 3.09 5.53 1.94 4.47 0.16 0.64 0.26 0.10 0.04 0.07 0.19 0.23 5.03 10.001999 2.56 4.39 1.98 3.90 0.12 0.51 0.23 0.10 0.05 0.09 0.17 0.21 4.54 8.29
Mining products 1997 12.78 19.75 6.29 30.14 0.80 0.78 1.42 0.93 0.17 0.09 0.31 0.77 19.07 49.891998 10.56 14.94 7.75 27.94 0.96 0.83 1.11 0.88 0.19 0.10 0.39 0.88 18.31 42.881999 9.43 11.94 7.68 28.76 1.07 0.71 1.12 0.95 0.17 0.11 0.47 0.81 17.11 40.70
Ores and other 1997 3.00 2.00 0.78 4.37 0.04 0.28 0.10 0.14 0.01 0.02 0.03 0.12 3.78 6.37 minerals 1998 2.58 1.89 0.67 4.55 0.04 0.30 0.11 0.13 0.01 0.02 0.04 0.11 3.25 6.44
1999 2.02 1.53 0.72 4.01 0.04 0.25 0.10 0.19 0.02 0.02 0.04 0.12 2.74 5.54
Fuels 1997 3.89 12.90 2.12 20.56 0.17 0.21 0.75 0.28 0.01 0.03 0.14 0.35 6.01 33.461998 2.02 8.15 3.59 18.14 0.22 0.22 0.42 0.23 0.01 0.03 0.19 0.42 5.61 26.291999 2.13 6.45 3.34 19.99 0.33 0.12 0.48 0.22 0.01 0.02 0.19 0.37 5.47 26.44
Non-ferrous metals 1997 5.90 4.85 3.38 5.21 0.59 0.29 0.57 0.50 0.15 0.05 0.15 0.30 9.28 10.061998 5.95 4.91 3.49 5.23 0.70 0.32 0.57 0.51 0.17 0.05 0.17 0.35 9.44 10.141999 5.27 3.96 3.63 4.77 0.70 0.33 0.54 0.54 0.15 0.07 0.24 0.33 8.90 8.73
Manufactures 1997 237.43 167.32 208.34 146.24 42.12 29.78 20.43 15.18 11.19 21.34 10.73 6.58 445.77 313.561998 256.63 180.62 211.44 163.23 47.48 33.11 21.60 16.27 9.53 22.84 11.74 7.49 468.07 343.851999 244.50 158.66 207.48 167.99 51.35 34.44 21.56 15.96 10.25 22.32 11.28 7.97 451.98 326.65
Iron and steel 1997 9.22 8.73 6.24 2.88 1.18 0.10 0.61 0.34 0.03 0.08 0.30 0.38 15.46 11.611998 9.78 9.49 6.03 3.31 1.02 0.11 0.63 0.38 0.03 0.09 0.51 0.43 15.81 12.801999 7.56 7.27 5.01 2.61 0.88 0.10 0.54 0.34 0.02 0.10 0.34 0.35 12.57 9.88
Chemicals 1997 36.74 26.33 31.63 13.08 6.20 3.78 3.87 3.79 2.34 1.27 1.69 0.29 68.37 39.411998 36.40 30.70 34.47 14.62 6.91 4.52 3.95 3.84 1.91 1.26 1.79 0.33 70.87 45.321999 34.54 27.67 35.17 13.80 7.47 4.39 4.05 3.52 2.12 1.23 1.89 0.29 69.71 41.47
Other semi- 1997 24.53 21.21 16.80 12.50 2.37 1.66 2.43 1.81 0.48 0.73 1.44 1.44 41.33 33.71 manufactures 1998 26.49 23.01 17.48 13.87 2.60 1.82 2.64 1.93 0.40 0.83 1.67 1.60 43.97 36.88
1999 23.87 19.56 17.48 13.83 2.86 1.59 2.57 1.96 0.42 0.83 1.71 1.65 41.35 33.39
Machinery and 1997 132.56 79.99 124.64 73.85 27.94 19.76 8.63 5.85 6.86 16.10 5.03 1.62 257.20 153.84 transport 1998 146.73 84.43 123.07 85.52 32.30 21.89 9.28 6.57 5.88 17.47 5.29 1.93 269.80 169.95 equipment 1999 144.09 77.31 120.12 92.47 35.12 23.69 9.38 6.57 6.36 17.17 4.98 2.53 264.21 169.78
Power generating 1997 3.12 1.84 4.51 4.64 1.77 2.77 0.36 0.37 0.08 0.11 0.09 0.05 7.63 6.48 machinery 1998 3.52 1.96 5.18 5.28 2.01 3.10 0.38 0.42 0.08 0.13 0.12 0.06 8.70 7.24
1999 3.38 2.20 5.30 6.06 2.19 3.94 0.43 0.39 0.06 0.11 0.14 0.07 8.68 8.26
Other non- 1997 31.00 13.47 45.51 11.15 8.32 2.57 2.69 3.14 1.63 1.70 2.03 0.31 76.51 24.62 electrical 1998 34.33 15.33 42.26 13.20 9.25 2.91 3.05 3.56 1.25 2.09 2.40 0.41 76.59 28.53 machinery 1999 32.13 13.19 37.57 13.82 8.72 2.90 2.96 3.65 1.11 2.22 2.05 0.44 69.70 27.01
Office and 1997 19.71 13.51 13.49 28.44 1.77 7.82 1.26 0.48 0.27 6.60 0.57 0.11 33.20 41.95 telecommunication 1998 21.96 17.55 13.69 31.72 1.84 8.44 1.37 0.59 0.37 7.18 0.73 0.11 35.65 49.27 equipment 1999 22.06 16.80 14.90 33.59 2.22 8.81 1.48 0.63 0.50 7.09 0.80 0.12 36.96 50.39
Electrical 1997 15.77 8.15 14.94 12.08 2.59 1.89 1.40 1.35 0.64 2.16 0.67 0.47 30.71 20.23 machinery and 1998 16.49 8.74 15.85 13.51 2.83 2.12 1.47 1.36 0.61 2.24 0.76 0.60 32.34 22.25 apparatus 1999 15.42 7.27 15.24 14.23 3.03 2.26 1.48 1.30 0.60 2.47 0.73 0.67 30.66 21.50
Automotive 1997 50.79 33.41 38.24 12.07 11.65 1.97 2.36 0.35 4.12 4.64 1.48 0.50 89.03 45.48 products 1998 56.05 30.22 37.39 15.43 14.15 2.22 2.53 0.41 3.36 4.86 1.06 0.57 93.44 45.65
1999 55.69 29.13 37.46 17.00 15.99 1.93 2.55 0.37 3.80 4.33 1.02 0.78 93.15 46.13
Other transport 1997 12.16 9.61 7.96 5.46 1.84 2.73 0.55 0.17 0.12 0.90 0.19 0.17 20.12 15.07 equipment 1998 14.38 10.63 8.70 6.38 2.21 3.11 0.49 0.23 0.21 0.97 0.22 0.19 23.08 17.01
1999 15.42 8.71 9.65 7.78 2.96 3.85 0.47 0.23 0.28 0.96 0.24 0.46 25.07 16.49
Textiles 1997 6.62 6.38 6.61 4.39 0.39 0.29 0.45 0.51 0.10 0.19 1.09 0.21 13.23 10.771998 6.63 6.87 7.04 4.78 0.35 0.29 0.46 0.53 0.08 0.22 1.16 0.29 13.67 11.651999 5.46 5.44 6.42 4.45 0.38 0.28 0.43 0.50 0.07 0.21 1.02 0.26 11.88 9.89
Clothing 1997 4.93 6.08 2.57 16.77 0.16 0.18 0.90 0.16 0.11 0.06 0.20 1.22 7.50 22.851998 5.36 6.21 2.65 16.87 0.16 0.15 0.91 0.13 0.10 0.04 0.22 1.32 8.01 23.081999 5.02 4.75 2.42 16.02 0.16 0.11 0.90 0.14 0.08 0.03 0.20 1.16 7.44 20.77
Other consumer 1997 22.83 18.61 19.85 22.77 3.87 4.00 3.55 2.71 1.28 2.91 0.99 1.41 42.68 41.38 goods 1998 25.24 19.91 20.70 24.25 4.13 4.32 3.74 2.88 1.13 2.92 1.10 1.60 45.94 44.16
1999 23.95 16.65 20.87 24.82 4.49 4.27 3.70 2.93 1.18 2.75 1.13 1.72 44.82 41.47
Total merchandise a 1997 284.67 244.93 227.77 200.57 44.18 34.06 23.23 17.51 11.81 21.63 11.92 8.29 512.44 445.501998 299.84 252.09 243.72 219.14 50.04 37.39 23.83 18.03 10.15 23.17 13.55 9.25 543.56 471.231999 297.82 243.77 238.10 220.99 53.87 37.52 23.74 17.71 10.85 22.72 12.95 9.64 535.92 464.76
a Includes unspecified products.
b Includes unspecified destinations and origins.
Note: For sources and methods, see the Technical Notes.

Appe
ndix
tabl
es
194
Table A14
Merchandise trade by product, region and major trading partner, 1997-99 - United Kingdom
(Billion dollars)
C./E. Europe/
North America Latin America Western Europe Baltic States/CIS Africa Middle East Asia
exp imp exp imp exp imp exp imp exp imp exp imp exp imp
Agricultural products 1997 1.69 2.92 1.00 2.81 12.94 22.87 0.69 0.78 0.80 2.19 0.91 0.33 2.85 3.601998 1.70 2.81 0.94 2.60 12.68 23.15 0.57 0.68 0.74 2.27 0.85 0.35 2.00 3.421999 1.68 2.47 0.75 2.53 11.13 22.74 0.35 0.70 0.76 2.13 0.88 0.35 2.06 3.42
Food 1997 1.55 1.92 0.98 2.43 11.53 19.61 0.60 0.26 0.66 1.90 0.87 0.29 2.57 2.881998 1.57 1.98 0.93 2.29 11.33 19.99 0.51 0.24 0.59 2.04 0.82 0.33 1.77 2.811999 1.62 1.74 0.73 2.25 10.35 19.68 0.31 0.22 0.65 1.95 0.87 0.33 1.81 2.85
Raw materials 1997 0.14 0.99 0.02 0.38 1.41 3.25 0.08 0.52 0.14 0.29 0.04 0.04 0.29 0.731998 0.13 0.83 0.02 0.30 1.34 3.16 0.07 0.44 0.15 0.23 0.03 0.02 0.24 0.621999 0.06 0.73 0.01 0.29 0.78 3.06 0.05 0.48 0.11 0.18 0.01 0.02 0.26 0.57
Mining products 1997 3.60 2.54 0.13 1.12 17.37 11.35 0.56 1.83 0.26 1.34 0.34 0.64 1.03 1.291998 2.64 2.75 0.27 1.00 12.78 8.59 0.34 1.75 0.30 1.31 0.18 0.62 0.72 1.281999 4.17 1.86 0.22 1.00 13.38 9.10 0.26 1.57 0.19 1.60 0.17 0.55 1.14 1.09
Ores and other 1997 0.17 0.84 0.01 0.25 1.29 0.96 0.02 0.29 0.03 0.35 0.02 0.05 0.33 0.53 minerals 1998 0.18 0.94 0.02 0.18 1.32 0.88 0.02 0.21 0.03 0.43 0.02 0.05 0.15 0.48
1999 0.24 0.89 0.01 0.16 1.00 0.86 0.02 0.32 0.03 0.65 0.02 0.03 0.24 0.35
Fuels 1997 2.86 0.60 0.09 0.37 13.14 7.28 0.41 0.75 0.18 0.85 0.06 0.54 0.10 0.351998 1.90 0.54 0.22 0.36 8.81 4.67 0.19 0.61 0.22 0.75 0.04 0.51 0.08 0.321999 3.45 0.31 0.17 0.41 10.28 5.69 0.11 0.58 0.13 0.72 0.07 0.45 0.42 0.33
Non-ferrous metals 1997 0.56 1.10 0.02 0.50 2.94 3.12 0.14 0.78 0.05 0.14 0.25 0.05 0.59 0.411998 0.56 1.27 0.04 0.46 2.66 3.04 0.12 0.93 0.05 0.13 0.13 0.07 0.50 0.471999 0.49 0.65 0.04 0.44 2.10 2.54 0.12 0.67 0.03 0.23 0.08 0.06 0.49 0.42
Manufactures 1997 33.13 39.14 4.65 1.60 138.40 148.36 6.67 4.21 6.93 2.73 13.09 3.83 31.52 50.431998 35.55 40.59 4.66 1.79 144.89 154.01 6.50 4.85 6.66 2.73 10.59 4.01 24.27 52.071999 35.13 35.28 3.47 1.88 136.00 152.75 5.61 4.88 5.61 2.97 7.69 3.70 22.38 53.81
Iron and steel 1997 0.57 0.22 0.09 0.09 3.93 4.64 0.11 0.26 0.24 0.12 0.25 0.02 0.77 0.241998 0.62 0.21 0.08 0.05 3.90 4.35 0.13 0.27 0.17 0.14 0.24 0.01 0.39 0.461999 0.49 0.22 0.07 0.05 2.91 3.30 0.11 0.17 0.13 0.13 0.18 0.00 0.32 0.28
Chemicals 1997 4.64 3.60 1.08 0.22 22.09 22.47 1.25 0.62 1.21 0.21 1.49 0.22 4.32 2.061998 4.82 3.63 1.17 0.18 23.24 22.92 1.16 0.47 1.16 0.20 1.47 0.22 3.83 2.331999 5.82 3.70 0.99 0.16 20.32 22.79 0.99 0.50 0.92 0.17 1.20 0.21 3.85 2.04
Other semi- 1997 1.97 2.53 0.27 0.32 13.52 19.08 0.55 1.16 0.60 0.75 1.16 0.29 3.01 2.78 manufactures 1998 2.35 2.62 0.31 0.30 13.14 18.95 0.45 1.35 0.57 0.63 1.12 0.33 2.35 3.07
1999 2.34 2.77 0.24 0.29 13.41 19.36 0.40 1.23 0.46 0.77 1.22 0.33 2.36 3.20
Machinery and 1997 19.90 25.66 2.69 0.52 75.04 76.17 3.46 1.31 3.48 0.47 7.90 1.90 17.56 29.18 transport 1998 21.18 26.40 2.50 0.88 81.17 79.84 3.47 1.76 3.34 0.58 5.85 2.18 13.02 29.61 equipment 1999 19.42 20.69 1.71 1.03 77.67 80.34 2.97 1.88 2.84 0.61 3.55 1.87 11.69 31.34
Power generating 1997 3.76 2.46 0.19 0.05 3.42 2.13 0.15 0.04 0.27 0.09 0.67 0.69 1.94 1.18 machinery 1998 4.72 2.92 0.24 0.09 4.12 2.31 0.14 0.06 0.30 0.10 0.72 0.68 1.65 1.28
1999 4.82 3.05 0.22 0.05 4.48 2.44 0.10 0.05 0.27 0.11 0.72 0.86 1.78 1.45
Other non- 1997 3.90 3.76 0.72 0.08 11.98 13.28 0.94 0.20 1.31 0.10 1.21 0.27 4.03 2.90 electrical 1998 4.27 3.74 0.71 0.10 12.73 13.21 1.00 0.21 1.21 0.11 1.16 0.26 2.90 2.92 machinery 1999 3.88 3.57 0.53 0.10 11.73 12.35 0.80 0.18 0.96 0.14 0.92 0.17 2.60 2.71
Office and 1997 5.01 9.52 0.38 0.12 28.71 19.31 1.19 0.29 0.73 0.08 0.75 0.45 5.29 15.78 telecommunication 1998 4.43 9.04 0.46 0.34 31.41 20.90 1.21 0.50 0.80 0.10 0.82 0.52 4.11 16.03 equipment 1999 4.68 9.26 0.28 0.72 32.18 22.65 0.95 0.57 0.74 0.11 0.88 0.50 4.03 17.83
Electrical 1997 1.56 2.43 0.18 0.04 7.02 7.22 0.52 0.30 0.35 0.06 0.62 0.14 2.00 3.66 machinery and 1998 1.58 2.42 0.19 0.06 7.38 7.28 0.57 0.36 0.36 0.06 0.58 0.14 1.63 3.63 apparatus 1999 1.69 2.51 0.17 0.05 7.05 7.09 0.59 0.50 0.32 0.06 0.60 0.18 1.60 4.07
Automotive 1997 2.74 0.85 0.86 0.06 18.15 30.43 0.47 0.44 0.58 0.07 0.45 0.04 2.87 4.44 products 1998 3.02 0.93 0.70 0.05 19.36 32.14 0.45 0.53 0.44 0.10 0.45 0.11 1.74 4.38
1999 3.65 1.35 0.42 0.06 19.90 33.58 0.46 0.55 0.39 0.16 0.31 0.13 1.32 4.28
Other transport 1997 2.93 6.63 0.36 0.17 5.77 3.82 0.17 0.05 0.24 0.08 4.19 0.30 1.44 1.21 equipment 1998 3.15 7.33 0.19 0.23 6.18 3.99 0.10 0.09 0.23 0.10 2.13 0.47 0.99 1.37
1999 0.70 0.95 0.09 0.05 2.34 2.22 0.07 0.03 0.16 0.03 0.11 0.04 0.36 0.99
Textiles 1997 0.41 0.56 0.08 0.04 3.69 5.46 0.31 0.11 0.23 0.18 0.17 0.15 0.73 1.951998 0.45 0.53 0.07 0.02 3.63 5.48 0.33 0.13 0.24 0.15 0.17 0.14 0.54 1.861999 0.42 0.44 0.05 0.02 2.67 4.86 0.32 0.12 0.26 0.12 0.14 0.14 0.53 1.70
Clothing 1997 0.30 0.24 0.02 0.05 3.80 4.06 0.15 0.44 0.27 0.73 0.25 0.35 0.50 5.291998 0.30 0.22 0.02 0.03 3.51 4.83 0.14 0.57 0.30 0.79 0.28 0.34 0.37 5.201999 0.25 0.21 0.02 0.04 3.25 4.74 0.16 0.62 0.26 0.90 0.23 0.36 0.32 5.68
Other consumer 1997 5.33 6.32 0.41 0.37 16.33 16.48 0.86 0.30 0.89 0.26 1.87 0.91 4.62 8.92 goods 1998 5.83 6.98 0.51 0.32 16.30 17.62 0.81 0.30 0.87 0.25 1.46 0.79 3.77 9.55
1999 6.39 7.25 0.40 0.29 15.76 17.36 0.67 0.37 0.74 0.27 1.17 0.78 3.30 9.58
Total merchandise a 1997 38.63 45.44 5.82 5.56 169.41 183.27 7.96 6.83 8.11 6.29 15.24 4.90 35.73 55.551998 40.22 47.06 5.94 5.42 171.15 186.54 7.47 7.31 7.80 6.37 12.99 5.07 27.41 57.041999 41.18 40.15 4.56 5.45 161.13 185.16 6.24 7.18 6.65 6.75 8.78 4.63 25.69 58.51

Appe
ndix
tabl
es
195
Table A14 (continued)
Merchandise trade by product, region and major trading partner, 1997-99 - United Kingdom
(Billion dollars)
Intra-EU Extra-EU United States Japan Switzerland Hong Kong, China World b
exp imp exp imp exp imp exp imp exp imp exp imp exp imp
Agricultural products 1997 12.15 21.60 8.73 13.89 1.42 2.23 0.56 0.09 0.13 0.13 0.37 0.07 20.88 35.491998 11.97 21.80 7.52 13.48 1.43 2.12 0.48 0.06 0.13 0.12 0.32 0.06 19.49 35.281999 10.55 21.47 7.13 12.96 1.47 1.79 0.43 0.07 0.13 0.12 0.26 0.06 17.68 34.43
Food 1997 10.92 18.45 7.84 10.84 1.30 1.55 0.53 0.04 0.11 0.12 0.35 0.05 18.76 29.291998 10.79 18.74 6.72 10.95 1.31 1.56 0.45 0.02 0.12 0.12 0.30 0.05 17.51 29.691999 9.84 18.51 6.56 10.51 1.41 1.33 0.41 0.03 0.12 0.11 0.25 0.04 16.40 29.02
Raw materials 1997 1.23 3.15 0.89 3.06 0.12 0.68 0.03 0.05 0.02 0.01 0.03 0.02 2.12 6.211998 1.16 3.06 0.81 2.54 0.12 0.55 0.03 0.04 0.01 0.01 0.02 0.01 1.97 5.601999 0.71 2.97 0.58 2.45 0.06 0.46 0.02 0.04 0.01 0.00 0.02 0.02 1.29 5.42
Mining products 1997 16.54 5.49 6.74 14.62 3.29 1.75 0.23 0.15 0.26 0.17 0.12 0.02 23.28 20.111998 12.28 4.86 4.96 12.44 2.47 1.97 0.21 0.20 0.12 0.35 0.07 0.05 17.24 17.301999 12.92 5.15 6.80 11.71 3.98 1.20 0.23 0.15 0.08 0.27 0.07 0.02 19.72 16.86
Ores and other 1997 1.16 0.83 0.72 2.44 0.15 0.39 0.03 0.04 0.01 0.03 0.03 0.02 1.88 3.27 minerals 1998 1.20 0.74 0.53 2.42 0.15 0.49 0.02 0.04 0.01 0.03 0.01 0.03 1.73 3.16
1999 0.93 0.61 0.63 2.75 0.18 0.47 0.03 0.05 0.00 0.15 0.01 0.01 1.56 3.36
Fuels 1997 12.75 2.14 4.09 8.60 2.60 0.49 0.01 0.01 0.00 0.00 0.01 0.00 16.84 10.741998 8.58 1.80 2.86 5.96 1.80 0.44 0.01 0.00 0.00 0.00 0.01 0.00 11.44 7.761999 10.00 2.49 4.78 6.01 3.34 0.23 0.00 0.00 0.00 0.00 0.01 0.00 14.78 8.50
Non-ferrous metals 1997 2.63 2.53 1.94 3.58 0.54 0.86 0.19 0.11 0.25 0.13 0.09 0.01 4.57 6.111998 2.50 2.32 1.56 4.06 0.52 1.04 0.18 0.15 0.10 0.32 0.05 0.02 4.06 6.381999 1.99 2.05 1.39 2.95 0.46 0.49 0.19 0.10 0.07 0.12 0.05 0.01 3.38 5.00
Manufactures 1997 126.75 136.85 107.62 113.44 30.10 36.39 6.02 15.06 4.53 7.74 4.74 7.02 234.37 250.291998 133.05 141.97 100.08 118.09 32.37 37.82 4.63 15.43 4.69 7.87 4.08 7.53 233.13 260.061999 126.53 140.18 98.45 124.50 31.72 32.08 4.51 14.98 4.14 8.48 3.32 8.18 224.98 264.68
Iron and steel 1997 3.48 4.30 2.48 1.29 0.48 0.19 0.05 0.08 0.11 0.05 0.12 0.00 5.96 5.591998 3.50 4.01 2.05 1.49 0.54 0.18 0.04 0.19 0.11 0.04 0.05 0.00 5.55 5.501999 2.68 2.99 1.53 1.18 0.43 0.20 0.02 0.09 0.07 0.05 0.05 0.00 4.21 4.17
Chemicals 1997 20.43 20.95 15.66 8.44 4.21 3.45 0.98 0.71 0.76 1.13 0.41 0.05 36.09 29.391998 21.50 21.29 15.35 8.67 4.34 3.47 0.97 0.68 0.80 1.23 0.35 0.05 36.85 29.961999 18.94 21.16 15.70 8.91 5.40 3.56 1.07 0.64 0.58 1.27 0.30 0.06 34.64 30.07
Other semi- 1997 12.35 14.92 8.71 11.99 1.73 2.08 0.35 0.54 0.71 3.54 0.37 0.35 21.06 26.91 manufactures 1998 11.87 15.09 8.43 12.16 2.10 2.21 0.29 0.56 0.66 3.24 0.29 0.39 20.30 27.25
1999 12.54 14.55 7.89 13.48 2.00 2.06 0.25 0.58 0.41 4.19 0.22 0.38 20.43 28.03
Machinery and 1997 69.13 73.59 60.91 61.62 18.05 23.91 3.41 11.92 1.64 1.48 2.90 2.27 130.04 135.21 transport 1998 75.42 76.96 55.12 64.28 19.25 24.61 2.22 11.94 1.69 1.58 2.48 2.52 130.54 141.24 equipment 1999 73.02 77.86 55.26 68.69 17.25 18.80 2.11 11.96 1.78 1.31 2.04 2.90 128.28 146.55
Power generating 1997 3.08 1.88 7.33 4.76 3.32 2.24 0.15 0.44 0.14 0.14 0.52 0.09 10.41 6.64 machinery 1998 3.78 2.04 8.11 5.41 4.22 2.62 0.14 0.55 0.10 0.13 0.43 0.09 11.89 7.45
1999 4.14 2.13 8.24 5.89 4.25 2.62 0.18 0.58 0.15 0.15 0.53 0.21 12.38 8.02
Other non- 1997 10.57 12.31 13.51 8.27 3.60 3.53 0.43 1.91 0.26 0.69 0.43 0.09 24.08 20.58 electrical 1998 11.21 12.15 12.77 8.41 3.96 3.50 0.39 1.88 0.26 0.69 0.25 0.09 23.98 20.56 machinery 1999 10.59 11.49 10.82 7.73 3.55 3.30 0.37 1.81 0.23 0.57 0.20 0.08 21.41 19.22
Office and 1997 27.17 18.89 14.89 26.66 4.54 8.95 1.21 3.79 0.71 0.21 1.07 1.30 42.06 45.55 telecommunication 1998 29.74 20.39 13.49 27.05 4.00 8.42 0.78 3.95 0.77 0.24 0.97 1.48 43.23 47.44 equipment 1999 30.35 22.11 13.69 29.63 3.76 8.54 0.78 4.16 0.89 0.25 0.74 1.73 44.04 51.74
Electrical 1997 6.55 6.73 5.70 7.12 1.43 2.30 0.31 1.32 0.18 0.31 0.47 0.72 12.25 13.85 machinery and 1998 6.93 6.76 5.37 7.18 1.46 2.29 0.24 1.33 0.16 0.29 0.37 0.71 12.30 13.94 apparatus 1999 6.60 6.61 5.42 7.85 1.54 2.40 0.25 1.46 0.18 0.27 0.38 0.84 12.02 14.46
Automotive 1997 17.05 30.27 9.09 6.05 2.58 0.81 1.14 3.76 0.28 0.04 0.29 0.01 26.14 36.32 products 1998 18.45 31.97 7.71 6.29 2.87 0.89 0.53 3.51 0.27 0.04 0.35 0.02 26.16 38.26
1999 19.20 33.39 7.26 6.72 3.48 1.09 0.48 3.32 0.31 0.05 0.15 0.02 26.46 40.11
Other transport 1997 4.70 3.52 10.39 8.74 2.58 6.08 0.17 0.69 0.08 0.10 0.12 0.04 15.09 12.26 equipment 1998 5.31 3.64 7.67 9.94 2.75 6.89 0.13 0.71 0.13 0.19 0.10 0.13 12.98 13.58
1999 2.15 2.11 9.82 10.88 0.66 0.85 0.04 0.62 0.02 0.01 0.04 0.02 11.97 12.99
Textiles 1997 3.46 4.97 2.16 3.49 0.37 0.54 0.13 0.10 0.06 0.09 0.16 0.09 5.62 8.461998 3.40 4.97 2.03 3.34 0.40 0.51 0.11 0.10 0.06 0.11 0.12 0.10 5.43 8.311999 2.50 4.41 1.98 3.00 0.38 0.42 0.07 0.10 0.04 0.09 0.14 0.10 4.48 7.41
Clothing 1997 3.55 3.46 1.73 7.71 0.27 0.21 0.19 0.03 0.08 0.05 0.10 1.84 5.28 11.171998 3.27 4.14 1.65 7.84 0.27 0.19 0.17 0.03 0.08 0.06 0.07 1.93 4.92 11.981999 3.04 3.91 1.45 8.62 0.23 0.18 0.13 0.03 0.07 0.06 0.06 2.09 4.49 12.53
Other consumer 1997 14.33 14.66 15.98 18.91 4.99 6.01 0.90 1.68 1.16 1.39 0.68 2.41 30.31 33.57 goods 1998 14.11 15.50 15.45 20.31 5.46 6.65 0.83 1.94 1.30 1.59 0.72 2.53 29.56 35.81
1999 13.81 15.31 14.63 20.60 6.03 6.87 0.85 1.59 1.19 1.51 0.52 2.64 28.44 35.91
Total merchandise a 1997 155.82 164.41 126.02 144.22 35.01 41.16 6.84 15.42 4.95 8.06 5.26 7.12 281.84 308.631998 157.63 169.17 116.21 146.49 36.51 42.72 5.34 15.82 4.96 8.36 4.47 7.65 273.84 315.661999 150.38 167.17 118.86 153.20 37.33 35.56 5.18 15.27 4.36 8.88 3.66 8.27 269.24 320.37
a Includes unspecified products.
b Includes unspecified destinations and origins.
Note: For sources and methods, see the Technical Notes.

Appe
ndix
tabl
es
196
Table A15
Merchandise trade by product, region and major trading partner, 1997-99 - Japan
(Billion dollars)
C./E. Europe/
North America Latin America Western Europe Baltic States/CIS Africa Middle East Asia
exp imp exp imp exp imp exp imp exp imp exp imp exp imp
Agricultural products 1997 0.62 25.93 0.05 5.01 0.41 6.60 0.02 2.06 0.06 1.61 0.07 0.14 3.26 25.751998 0.59 21.35 0.06 4.52 0.46 5.95 0.02 1.58 0.06 1.40 0.08 0.12 2.83 21.661999 0.67 22.10 0.06 4.33 0.47 6.68 0.02 2.02 0.05 1.40 0.07 0.12 2.86 23.07
Food 1997 0.43 18.49 0.02 4.07 0.12 5.33 0.01 1.21 0.03 1.17 0.03 0.13 1.62 19.191998 0.40 16.18 0.02 3.73 0.11 5.09 0.01 1.10 0.02 1.06 0.03 0.10 1.45 17.211999 0.47 16.89 0.03 3.52 0.11 5.56 0.01 1.34 0.01 1.08 0.03 0.10 1.51 18.46
Raw materials 1997 0.19 7.44 0.03 0.94 0.29 1.27 0.01 0.85 0.03 0.44 0.05 0.02 1.64 6.551998 0.19 5.17 0.03 0.79 0.35 0.86 0.01 0.48 0.03 0.34 0.05 0.02 1.38 4.451999 0.20 5.21 0.03 0.82 0.36 1.13 0.01 0.68 0.04 0.31 0.04 0.03 1.35 4.61
Mining products 1997 0.86 5.32 0.08 4.63 0.34 1.35 0.04 2.09 0.01 2.37 0.09 36.64 5.32 30.821998 0.89 4.17 0.07 3.26 0.37 1.29 0.04 1.51 0.01 1.93 0.08 24.23 4.52 23.631999 0.86 3.69 0.06 3.54 0.37 1.44 0.02 1.84 0.02 2.21 0.09 28.97 4.88 25.10
Ores and other 1997 0.03 1.39 0.00 2.45 0.05 0.37 0.00 0.07 0.00 0.46 0.00 0.09 0.69 5.70 minerals 1998 0.03 1.11 0.00 2.01 0.07 0.33 0.00 0.07 0.00 0.41 0.00 0.08 0.73 4.81
1999 0.03 1.06 0.00 2.13 0.07 0.36 0.00 0.07 0.00 0.39 0.00 0.08 0.77 4.80
Fuels 1997 0.24 2.62 0.05 0.51 0.06 0.15 0.03 0.32 0.00 0.71 0.03 36.14 1.51 22.371998 0.27 2.05 0.04 0.24 0.05 0.15 0.03 0.23 0.00 0.43 0.01 23.82 0.83 16.361999 0.31 1.75 0.03 0.43 0.03 0.23 0.02 0.21 0.00 0.58 0.01 28.68 0.83 17.99
Non-ferrous metals 1997 0.58 1.31 0.03 1.67 0.23 0.83 0.01 1.70 0.00 1.20 0.06 0.41 3.13 2.761998 0.60 1.01 0.03 1.00 0.25 0.82 0.01 1.22 0.01 1.09 0.07 0.34 2.96 2.461999 0.52 0.89 0.03 0.98 0.26 0.86 0.01 1.56 0.02 1.23 0.08 0.21 3.28 2.31
Manufactures 1997 119.02 53.14 13.30 1.51 68.65 41.33 2.34 0.85 4.76 0.58 10.24 1.45 173.14 83.911998 120.19 48.25 13.64 1.14 73.99 35.40 2.29 0.62 4.67 0.51 12.36 1.10 132.01 71.711999 130.41 47.90 11.16 1.37 75.89 38.70 1.94 0.67 4.38 0.42 9.84 1.19 151.94 87.38
Iron and steel 1997 1.97 0.19 0.59 0.32 0.74 0.28 0.08 0.33 0.33 0.37 0.64 0.00 11.60 2.931998 3.55 0.17 0.67 0.18 0.94 0.23 0.07 0.12 0.31 0.33 0.73 0.00 8.60 2.171999 1.75 0.15 0.51 0.14 0.61 0.20 0.09 0.14 0.22 0.25 0.63 0.01 9.63 2.06
Chemicals 1997 6.24 7.66 0.52 0.43 5.04 9.49 0.07 0.15 0.14 0.07 0.24 0.45 17.67 4.711998 6.15 6.56 0.53 0.36 5.26 8.81 0.07 0.11 0.14 0.08 0.23 0.41 14.86 4.231999 6.59 6.81 0.51 0.33 5.41 10.48 0.07 0.10 0.13 0.04 0.22 0.42 17.75 4.59
Other semi- 1997 4.99 3.65 0.64 0.16 2.63 2.84 0.12 0.07 0.37 0.07 0.75 0.56 9.67 8.64 manufactures 1998 4.98 2.96 0.68 0.09 2.85 2.30 0.13 0.07 0.40 0.05 0.70 0.38 7.34 6.29
1999 5.22 2.81 0.65 0.09 2.89 2.38 0.16 0.08 0.38 0.06 0.60 0.36 8.29 7.85
Machinery and 1997 94.80 31.17 10.75 0.39 52.23 17.53 1.89 0.19 3.68 0.01 7.68 0.21 113.49 34.10 transport 1998 94.60 29.24 11.01 0.32 56.42 14.20 1.87 0.21 3.59 0.01 9.81 0.18 84.74 30.73 equipment 1999 104.08 28.71 8.79 0.56 58.07 15.40 1.48 0.23 3.41 0.02 7.58 0.26 95.93 40.08
Power generating 1997 1.11 1.94 0.17 0.00 0.87 0.57 0.01 0.00 0.03 0.00 0.34 0.00 2.98 1.08 machinery 1998 1.21 2.10 0.23 0.00 1.11 0.50 0.01 0.00 0.06 0.00 0.44 0.00 3.17 1.06
1999 1.63 2.14 0.30 0.01 0.85 0.55 0.03 0.00 0.04 0.00 0.25 0.00 2.49 1.08
Other non- 1997 14.34 4.33 1.62 0.06 7.79 4.16 0.38 0.01 0.62 0.00 1.14 0.06 31.43 3.09 electrical 1998 14.52 3.86 1.82 0.04 8.97 3.61 0.35 0.01 0.63 0.00 1.26 0.05 20.21 2.72 machinery 1999 13.49 3.70 1.45 0.04 9.46 3.17 0.35 0.01 0.62 0.00 1.31 0.04 23.51 3.02
Office and 1997 32.76 15.02 2.17 0.19 19.48 3.56 0.50 0.15 0.23 0.00 0.87 0.12 39.07 22.85 telecommunication 1998 29.85 12.86 2.02 0.16 19.60 2.95 0.49 0.17 0.22 0.00 0.89 0.11 31.96 20.29 equipment 1999 31.30 12.15 1.78 0.33 20.07 3.55 0.33 0.18 0.24 0.01 0.54 0.17 37.01 27.65
Electrical 1997 6.58 3.33 1.11 0.06 5.04 1.65 0.12 0.01 0.21 0.00 0.49 0.02 16.36 5.69 machinery and 1998 6.62 2.95 1.15 0.04 5.34 1.47 0.15 0.02 0.20 0.00 0.63 0.02 14.17 5.33 apparatus 1999 7.61 3.15 1.17 0.04 5.71 1.57 0.12 0.02 0.24 0.00 0.50 0.05 16.66 6.61
Automotive 1997 35.11 2.67 4.48 0.04 15.20 6.84 0.85 0.01 2.27 0.00 4.47 0.00 17.53 0.64 products 1998 36.62 2.09 4.90 0.04 16.55 5.01 0.83 0.01 2.19 0.01 5.53 0.00 10.98 0.66
1999 43.14 1.96 3.40 0.09 16.76 5.67 0.60 0.01 1.96 0.01 4.51 0.00 12.27 0.85
Other transport 1997 4.90 3.88 1.21 0.03 3.85 0.75 0.03 0.00 0.33 0.00 0.37 0.00 6.12 0.75 equipment 1998 5.78 5.37 0.89 0.03 4.84 0.66 0.04 0.00 0.29 0.00 1.07 0.00 4.25 0.67
1999 6.91 5.61 0.69 0.06 5.23 0.87 0.05 0.00 0.31 0.00 0.47 0.00 3.98 0.87
Textiles 1997 0.59 0.42 0.08 0.04 0.64 1.07 0.02 0.01 0.03 0.01 0.39 0.04 4.99 4.211998 0.59 0.34 0.07 0.04 0.74 0.82 0.02 0.01 0.03 0.01 0.37 0.03 4.16 3.111999 0.60 0.32 0.06 0.03 0.73 0.73 0.01 0.02 0.04 0.01 0.29 0.04 4.86 3.40
Clothing 1997 0.09 0.80 0.00 0.06 0.11 2.11 0.00 0.03 0.00 0.01 0.01 0.01 0.27 13.711998 0.08 0.54 0.00 0.06 0.11 1.84 0.00 0.03 0.00 0.01 0.01 0.01 0.20 12.231999 0.08 0.51 0.00 0.06 0.12 1.62 0.00 0.03 0.00 0.01 0.01 0.01 0.25 14.16
Other consumer 1997 10.35 9.24 0.71 0.10 7.26 8.02 0.16 0.07 0.20 0.03 0.54 0.18 15.45 15.61 goods 1998 10.23 8.45 0.68 0.09 7.67 7.19 0.13 0.07 0.20 0.02 0.51 0.09 12.12 12.95
1999 12.10 8.58 0.64 0.14 8.07 7.89 0.12 0.07 0.20 0.02 0.52 0.10 15.22 15.24
Total merchandise a 1997 124.54 85.89 13.62 11.20 71.30 50.13 2.43 5.04 4.91 4.84 10.64 38.27 187.01 143.461998 126.22 75.23 14.01 8.97 77.19 43.49 2.40 3.76 4.80 3.88 12.76 25.51 144.34 119.791999 136.60 75.53 11.48 9.30 79.43 47.81 2.02 4.63 4.52 4.05 10.15 30.32 165.81 138.29

Appe
ndix
tabl
es
197
Table A15 (continued)
Merchandise trade by product, region and major trading partner, 1997-99 - Japan
(Billion dollars)
United States EU (15) China Taipei, Chinese Korea, Rep of Hong Kong, China World b
exp imp exp imp exp imp exp imp exp imp exp imp exp imp
Agricultural products 1997 0.57 20.31 0.39 5.70 0.61 6.21 0.62 1.61 0.41 1.77 0.62 0.18 4.49 67.101998 0.55 17.00 0.43 5.19 0.53 5.45 0.60 1.09 0.26 1.83 0.50 0.09 4.09 56.591999 0.63 17.35 0.45 5.69 0.51 6.23 0.59 1.23 0.42 2.15 0.49 0.07 4.21 59.73
Food 1997 0.39 15.76 0.10 4.47 0.11 5.14 0.39 1.29 0.20 1.57 0.47 0.17 2.26 49.591998 0.37 13.76 0.10 4.35 0.10 4.68 0.39 0.87 0.09 1.65 0.38 0.09 2.05 44.461999 0.43 14.33 0.10 4.59 0.10 5.33 0.43 1.01 0.20 1.94 0.38 0.06 2.16 46.95
Raw materials 1997 0.17 4.54 0.28 1.23 0.50 1.07 0.23 0.33 0.21 0.20 0.15 0.01 2.23 17.511998 0.18 3.24 0.33 0.83 0.43 0.77 0.20 0.22 0.17 0.18 0.13 0.00 2.04 12.121999 0.19 3.02 0.34 1.10 0.40 0.90 0.17 0.22 0.22 0.21 0.10 0.00 2.04 12.78
Mining products 1997 0.82 3.09 0.32 1.02 1.18 3.58 1.03 0.38 1.01 1.89 0.68 0.08 6.73 83.221998 0.87 2.33 0.35 0.99 0.86 2.34 1.02 0.27 0.80 1.35 0.66 0.04 5.99 60.021999 0.85 2.15 0.35 1.07 1.03 2.22 1.05 0.23 1.01 2.15 0.45 0.04 6.29 66.80
Ores and other 1997 0.03 0.86 0.05 0.33 0.17 0.49 0.07 0.12 0.27 0.11 0.08 0.07 0.78 10.52 minerals 1998 0.03 0.69 0.06 0.29 0.20 0.39 0.13 0.09 0.27 0.09 0.04 0.03 0.84 8.81
1999 0.03 0.66 0.06 0.31 0.23 0.40 0.14 0.09 0.28 0.07 0.02 0.03 0.87 8.89
Fuels 1997 0.24 1.41 0.05 0.05 0.68 2.51 0.15 0.03 0.25 1.63 0.15 0.00 1.91 62.831998 0.26 1.01 0.05 0.05 0.24 1.52 0.10 0.01 0.12 1.12 0.13 0.00 1.24 43.271999 0.31 0.94 0.03 0.10 0.20 1.38 0.12 0.01 0.19 1.96 0.09 0.00 1.22 49.87
Non-ferrous metals 1997 0.55 0.83 0.22 0.64 0.33 0.58 0.81 0.23 0.50 0.15 0.45 0.01 4.04 9.871998 0.58 0.63 0.24 0.64 0.42 0.43 0.78 0.17 0.41 0.14 0.49 0.00 3.91 7.941999 0.51 0.55 0.25 0.65 0.59 0.44 0.79 0.12 0.53 0.12 0.34 0.01 4.20 8.04
Manufactures 1997 113.04 51.18 63.56 37.68 19.60 31.87 25.13 10.02 24.09 10.56 24.78 1.77 398.00 182.761998 113.99 46.75 68.90 32.20 18.31 29.11 23.12 8.41 13.87 8.63 20.47 1.39 365.56 158.731999 123.63 46.23 71.48 35.30 21.19 34.10 26.16 10.93 20.84 11.55 20.17 1.44 392.69 177.63
Iron and steel 1997 1.83 0.18 0.46 0.21 1.73 0.66 1.57 0.45 2.05 1.44 1.27 0.00 15.95 4.421998 3.22 0.16 0.62 0.19 1.51 0.43 1.42 0.35 1.17 1.14 1.05 0.00 14.87 3.201999 1.56 0.14 0.43 0.17 1.53 0.38 1.35 0.37 1.92 1.08 0.91 0.00 13.44 2.95
Chemicals 1997 6.10 7.27 4.70 8.25 2.21 1.38 3.88 0.61 3.74 0.96 2.19 0.03 29.92 22.961998 6.02 6.29 4.91 7.72 2.32 1.26 3.48 0.59 2.66 0.83 1.93 0.02 27.24 20.571999 6.44 6.51 5.04 9.31 3.00 1.31 3.98 0.63 3.50 0.87 2.08 0.02 30.69 22.78
Other semi- 1997 4.68 3.13 2.36 2.73 1.08 2.03 1.34 0.72 1.26 0.71 1.49 0.15 19.17 16.00 manufactures 1998 4.66 2.56 2.60 2.21 1.08 1.89 1.24 0.52 0.65 0.61 1.24 0.10 17.08 12.14
1999 4.93 2.38 2.68 2.29 1.23 2.16 1.35 0.54 0.93 0.78 1.26 0.13 18.19 13.63
Machinery and 1997 89.82 30.57 48.39 16.62 11.16 7.76 15.00 5.51 13.61 4.43 15.75 0.79 291.07 83.59 transport 1998 89.58 28.76 52.59 13.54 10.37 7.69 14.02 4.91 7.66 3.67 12.67 0.71 268.47 74.88 equipment 1999 98.38 28.09 54.78 14.80 11.62 9.18 15.57 7.28 11.85 5.85 11.91 0.78 286.47 85.27
Power generating 1997 1.08 1.91 0.64 0.38 0.39 0.55 0.33 0.11 0.48 0.06 0.22 0.01 5.50 3.60 machinery 1998 1.16 2.09 0.84 0.47 0.87 0.54 0.40 0.07 0.37 0.08 0.17 0.01 6.23 3.67
1999 1.47 2.11 0.79 0.51 0.48 0.59 0.31 0.07 0.35 0.07 0.18 0.00 5.60 3.78
Other non- 1997 13.59 4.20 7.12 3.72 4.32 0.80 4.61 0.65 5.42 0.46 2.72 0.05 57.32 11.72 electrical 1998 13.77 3.77 8.35 3.20 3.27 0.77 4.81 0.50 1.87 0.47 2.00 0.03 47.76 10.30 machinery 1999 12.83 3.63 9.06 2.83 3.71 0.83 5.75 0.51 3.18 0.55 2.02 0.03 50.18 9.99
Office and 1997 31.74 14.83 19.10 3.46 2.80 3.63 5.83 3.71 4.32 3.24 7.02 0.56 95.07 41.90 telecommunication 1998 28.89 12.68 19.22 2.88 2.90 3.57 4.72 3.48 2.92 2.58 5.76 0.53 85.03 36.55 equipment 1999 30.31 11.94 19.70 3.47 3.62 4.26 5.34 5.66 4.65 4.52 6.05 0.56 91.27 44.05
Electrical 1997 6.42 3.27 4.84 1.50 2.14 2.41 2.38 0.65 2.62 0.53 2.63 0.15 29.91 10.77 machinery and 1998 6.43 2.88 5.10 1.35 2.09 2.47 2.32 0.52 2.03 0.43 2.43 0.12 28.25 9.82 apparatus 1999 7.37 3.06 5.49 1.48 2.54 3.04 2.66 0.63 2.98 0.51 2.61 0.15 32.01 11.45
Automotive 1997 32.41 2.56 13.44 6.84 1.15 0.10 1.28 0.19 0.47 0.06 2.18 0.00 79.91 10.20 products 1998 33.99 2.02 14.84 5.01 0.93 0.10 1.20 0.14 0.34 0.06 1.44 0.00 77.61 7.81
1999 40.00 1.82 15.30 5.67 0.90 0.14 1.09 0.18 0.49 0.09 0.72 0.00 82.64 8.59
Other transport 1997 4.58 3.80 3.26 0.72 0.35 0.27 0.56 0.21 0.29 0.07 0.98 0.01 23.35 5.41 equipment 1998 5.35 5.33 4.24 0.64 0.30 0.24 0.58 0.19 0.13 0.06 0.87 0.01 23.59 6.73
1999 6.40 5.54 4.45 0.85 0.36 0.33 0.42 0.23 0.20 0.09 0.32 0.03 24.77 7.41
Textiles 1997 0.55 0.41 0.61 1.01 2.11 1.93 0.38 0.39 0.47 0.51 0.92 0.02 6.75 5.811998 0.55 0.33 0.69 0.77 1.79 1.54 0.35 0.26 0.29 0.34 0.78 0.01 5.97 4.361999 0.56 0.32 0.69 0.69 2.26 1.73 0.33 0.26 0.37 0.39 0.84 0.01 6.59 4.55
Clothing 1997 0.09 0.76 0.10 2.07 0.06 10.49 0.07 0.23 0.05 0.87 0.05 0.27 0.47 16.731998 0.08 0.51 0.11 1.80 0.05 9.55 0.07 0.16 0.01 0.91 0.03 0.15 0.41 14.721999 0.08 0.49 0.11 1.58 0.05 11.43 0.10 0.14 0.02 1.03 0.05 0.10 0.46 16.40
Other consumer 1997 9.98 8.87 6.95 6.80 1.24 7.61 2.89 2.12 2.90 1.63 3.11 0.53 34.68 33.25 goods 1998 9.87 8.15 7.37 5.96 1.18 6.75 2.54 1.62 1.43 1.13 2.77 0.40 31.54 28.86
1999 11.68 8.29 7.77 6.45 1.49 7.91 3.48 1.72 2.24 1.55 3.13 0.40 36.86 32.06
Total merchandise a 1997 118.40 76.01 65.81 45.03 21.74 41.88 27.57 12.50 26.06 14.58 27.26 2.25 421.00 338.831998 119.85 67.48 71.69 39.09 20.09 37.09 25.60 10.23 15.36 12.08 22.60 1.73 388.14 280.631999 129.65 67.51 74.50 42.77 23.31 42.84 28.74 12.79 22.86 16.03 22.00 1.79 417.14 309.92
a Includes unspecified products.
b Includes unspecified destinations and origins.
Note: For sources and methods, see the Technical Notes.

Appe
ndix
tabl
es
198
Table A16
Merchandise trade by product, region and major trading partner, 1997-99 - Hong Kong, China
(Billion dollars)
C./E. Europe/
North America Latin America Western Europe Baltic States/CIS Africa Middle East Asia
exp imp exp imp exp imp exp imp exp imp exp imp exp imp
Agricultural products 1997 0.29 3.19 0.02 0.64 0.19 2.31 0.00 0.02 0.01 0.30 0.01 0.10 6.92 8.081998 0.27 2.85 0.02 0.59 0.17 2.15 0.00 0.01 0.01 0.26 0.01 0.10 5.80 6.731999 0.28 2.24 0.02 0.51 0.14 1.84 0.00 0.02 0.01 0.30 0.01 0.09 5.08 6.33
Food 1997 0.25 2.60 0.01 0.57 0.14 1.74 0.00 0.01 0.01 0.18 0.01 0.07 4.82 6.391998 0.24 2.36 0.01 0.54 0.13 1.51 0.00 0.01 0.01 0.16 0.01 0.06 3.86 5.431999 0.24 1.81 0.01 0.47 0.11 1.20 0.00 0.01 0.01 0.19 0.01 0.08 3.25 5.17
Raw materials 1997 0.04 0.59 0.00 0.07 0.04 0.57 0.00 0.01 0.00 0.12 0.00 0.03 2.10 1.691998 0.04 0.49 0.00 0.04 0.03 0.65 0.00 0.01 0.00 0.10 0.00 0.04 1.94 1.301999 0.03 0.42 0.00 0.03 0.03 0.63 0.00 0.01 0.00 0.11 0.00 0.01 1.83 1.16
Mining products 1997 0.04 0.47 0.00 0.27 0.08 0.69 0.00 0.62 0.01 0.12 0.01 0.13 4.92 6.161998 0.04 0.31 0.01 0.22 0.16 0.57 0.00 0.27 0.00 0.07 0.00 0.05 3.78 5.481999 0.05 0.23 0.01 0.05 0.12 0.61 0.00 0.19 0.00 0.12 0.02 0.05 2.93 5.45
Ores and other 1997 0.01 0.18 0.00 0.01 0.04 0.19 0.00 0.01 0.00 0.04 0.00 0.04 0.70 0.35 minerals 1998 0.01 0.11 0.00 0.01 0.10 0.06 0.00 0.01 0.00 0.02 0.00 0.02 0.50 0.27
1999 0.02 0.05 0.00 0.02 0.09 0.07 0.00 0.01 0.00 0.02 0.00 0.02 0.46 0.25
Fuels 1997 0.00 0.04 0.00 0.00 0.00 0.03 0.00 0.13 0.00 0.03 0.00 0.08 2.16 3.801998 0.00 0.03 0.00 0.00 0.00 0.03 0.00 0.01 0.00 0.01 0.00 0.02 1.30 3.111999 0.00 0.02 0.00 0.00 0.00 0.02 0.00 0.04 0.00 0.03 0.00 0.02 0.62 3.55
Non-ferrous metals 1997 0.03 0.24 0.00 0.26 0.04 0.47 0.00 0.49 0.00 0.05 0.01 0.02 2.07 2.001998 0.03 0.17 0.01 0.21 0.05 0.49 0.00 0.25 0.00 0.04 0.00 0.01 1.98 2.101999 0.03 0.16 0.01 0.03 0.03 0.52 0.00 0.14 0.00 0.07 0.01 0.01 1.85 1.65
Manufactures 1997 43.28 13.80 5.20 0.73 29.45 22.33 1.08 0.35 2.12 0.37 2.55 1.47 90.84 145.611998 43.08 11.73 4.81 0.65 29.02 18.92 0.94 0.24 1.87 0.29 2.35 0.94 80.84 131.331999 43.89 11.21 3.88 0.56 29.55 16.05 0.71 0.32 1.79 0.31 2.22 1.16 82.67 131.43
Iron and steel 1997 0.00 0.05 0.00 0.05 0.00 0.70 0.00 0.20 0.01 0.12 0.00 0.05 2.49 2.781998 0.01 0.04 0.00 0.03 0.00 0.44 0.00 0.10 0.00 0.09 0.00 0.00 2.20 2.841999 0.01 0.03 0.00 0.03 0.00 0.39 0.00 0.15 0.00 0.06 0.00 0.03 1.79 2.30
Chemicals 1997 0.16 1.79 0.04 0.09 0.17 2.82 0.01 0.02 0.08 0.07 0.02 0.28 10.14 8.451998 0.15 1.38 0.04 0.06 0.13 2.40 0.01 0.01 0.06 0.05 0.02 0.24 9.06 7.641999 0.14 1.39 0.03 0.05 0.12 2.41 0.00 0.01 0.05 0.05 0.02 0.23 8.99 7.45
Other semi- 1997 2.17 1.67 0.25 0.38 1.54 3.04 0.03 0.06 0.13 0.11 0.27 0.70 7.13 10.64 manufactures 1998 2.32 1.29 0.19 0.27 1.44 2.19 0.03 0.05 0.11 0.09 0.26 0.39 6.17 9.53
1999 2.45 1.11 0.13 0.25 1.42 2.11 0.03 0.06 0.09 0.09 0.35 0.58 6.00 9.85
Machinery and 1997 11.83 8.00 1.26 0.09 8.98 10.05 0.29 0.06 0.51 0.03 0.71 0.36 38.25 61.97 transport 1998 11.85 7.10 1.24 0.20 9.14 9.41 0.30 0.07 0.49 0.04 0.67 0.25 34.90 55.58 equipment 1999 12.26 6.75 0.96 0.17 9.28 6.59 0.31 0.09 0.47 0.08 0.60 0.24 36.87 55.77
Power generating 1997 0.18 0.19 0.02 0.00 0.13 0.33 0.00 0.00 0.01 0.00 0.00 0.01 1.20 1.49 machinery 1998 0.19 0.12 0.03 0.00 0.13 0.30 0.00 0.00 0.01 0.02 0.00 0.00 1.27 1.59
1999 0.23 0.11 0.02 0.00 0.17 0.48 0.00 0.00 0.02 0.06 0.02 0.05 1.52 1.84
Other non- 1997 0.53 0.97 0.14 0.01 0.39 2.44 0.01 0.00 0.07 0.01 0.06 0.02 5.47 6.15 electrical 1998 0.55 0.81 0.14 0.01 0.34 1.97 0.01 0.00 0.07 0.01 0.06 0.02 4.31 4.98 machinery 1999 0.58 0.67 0.08 0.01 0.33 1.58 0.01 0.00 0.06 0.00 0.06 0.03 3.86 4.51
Office and 1997 7.98 5.29 0.80 0.03 6.01 4.02 0.21 0.05 0.30 0.01 0.53 0.06 21.83 37.97 telecommunication 1998 7.90 4.44 0.80 0.14 6.23 3.44 0.21 0.05 0.30 0.01 0.46 0.06 20.72 34.90 equipment 1999 7.91 4.52 0.61 0.14 6.18 2.65 0.21 0.06 0.31 0.01 0.42 0.06 22.78 36.12
Electrical 1997 2.83 0.97 0.26 0.03 2.35 1.40 0.06 0.01 0.11 0.01 0.11 0.01 7.23 11.03 machinery and 1998 2.93 0.83 0.23 0.03 2.32 1.16 0.07 0.01 0.09 0.01 0.09 0.01 6.78 10.30 apparatus 1999 3.25 0.81 0.21 0.02 2.50 1.03 0.08 0.03 0.07 0.01 0.09 0.01 7.48 11.21
Automotive 1997 0.04 0.38 0.00 0.02 0.03 1.22 0.00 0.00 0.01 0.00 0.01 0.25 1.47 3.30 products 1998 0.04 0.14 0.01 0.02 0.04 1.05 0.00 0.00 0.01 0.00 0.06 0.07 1.10 2.31
1999 0.05 0.05 0.01 0.01 0.03 0.62 0.00 0.00 0.01 0.01 0.02 0.03 0.62 1.04
Other transport 1997 0.27 0.20 0.04 0.00 0.07 0.63 0.01 0.00 0.01 0.00 0.00 0.01 1.06 2.02 equipment 1998 0.23 0.77 0.03 0.00 0.07 1.48 0.00 0.00 0.01 0.00 0.00 0.09 0.72 1.51
1999 0.24 0.60 0.03 0.00 0.07 0.23 0.00 0.00 0.01 0.00 0.00 0.05 0.61 1.05
Textiles 1997 0.45 0.36 0.33 0.03 0.35 1.01 0.02 0.00 0.40 0.03 0.12 0.02 12.93 14.751998 0.48 0.29 0.26 0.02 0.32 0.82 0.02 0.00 0.37 0.02 0.11 0.01 11.48 12.321999 0.53 0.26 0.19 0.01 0.28 0.83 0.02 0.00 0.34 0.01 0.12 0.02 10.80 11.43
Clothing 1997 8.29 0.09 0.99 0.01 7.11 0.89 0.13 0.00 0.36 0.00 0.35 0.00 5.88 14.021998 8.49 0.08 0.93 0.00 6.80 0.64 0.10 0.00 0.28 0.01 0.35 0.00 5.20 13.561999 8.31 0.06 0.87 0.00 6.95 0.57 0.08 0.00 0.30 0.01 0.35 0.00 5.51 14.11
Other consumer 1997 20.38 1.84 2.33 0.08 11.30 3.83 0.61 0.00 0.65 0.01 1.07 0.05 14.03 32.99 goods 1998 19.77 1.55 2.15 0.07 11.18 3.02 0.48 0.01 0.57 0.01 0.93 0.04 11.83 29.85
1999 20.18 1.60 1.69 0.05 11.50 3.14 0.28 0.00 0.54 0.01 0.78 0.06 12.70 30.52
Total merchandise a 1997 43.72 18.03 5.23 1.71 29.87 26.80 1.08 0.99 2.16 1.15 2.59 1.70 103.48 162.901998 43.48 15.09 4.84 1.46 30.03 22.28 0.94 0.52 1.90 0.73 2.38 1.10 91.25 145.561999 44.26 13.72 3.91 1.11 30.06 18.97 0.72 0.53 1.83 0.75 2.25 1.31 91.34 144.29

Appe
ndix
tabl
es
199
Table A16 (continued)
Merchandise trade by product, region and major trading partner, 1997-99 - Hong Kong, China
(Billion dollars)
China United States EU (15) Japan Taipei, Chinese Singapore World b
exp imp exp imp exp imp exp imp exp imp exp imp exp imp
Agricultural products 1997 4.69 2.85 0.22 2.68 0.18 2.22 0.46 0.83 0.29 0.49 0.32 0.39 7.44 14.641998 4.35 2.49 0.21 2.34 0.16 2.07 0.23 0.54 0.19 0.39 0.16 0.28 6.29 12.701999 3.68 2.38 0.22 1.90 0.14 1.74 0.22 0.53 0.18 0.34 0.11 0.26 5.53 11.32
Food 1997 2.99 2.48 0.18 2.23 0.14 1.67 0.41 0.70 0.18 0.18 0.29 0.34 5.25 11.571998 2.64 2.23 0.18 1.96 0.13 1.43 0.20 0.43 0.11 0.16 0.15 0.23 4.27 10.061999 2.07 2.14 0.20 1.59 0.11 1.12 0.18 0.44 0.12 0.16 0.09 0.23 3.64 8.94
Raw materials 1997 1.70 0.37 0.04 0.45 0.04 0.56 0.04 0.13 0.11 0.31 0.02 0.05 2.19 3.081998 1.71 0.27 0.03 0.38 0.03 0.64 0.03 0.12 0.08 0.23 0.01 0.04 2.02 2.641999 1.61 0.25 0.03 0.32 0.03 0.62 0.04 0.09 0.06 0.18 0.01 0.03 1.90 2.38
Mining products 1997 4.39 1.41 0.04 0.41 0.07 0.56 0.10 0.60 0.13 0.49 0.07 2.22 5.07 8.471998 3.30 1.45 0.04 0.24 0.12 0.34 0.05 0.59 0.11 0.31 0.05 1.40 3.99 6.981999 2.18 1.52 0.04 0.17 0.06 0.29 0.07 0.41 0.08 0.31 0.02 1.72 3.12 6.69
Ores and other 1997 0.53 0.11 0.01 0.17 0.03 0.19 0.06 0.08 0.07 0.03 0.00 0.04 0.75 0.83 minerals 1998 0.37 0.09 0.01 0.11 0.07 0.06 0.03 0.04 0.05 0.01 0.00 0.03 0.62 0.50
1999 0.29 0.09 0.02 0.04 0.04 0.06 0.03 0.03 0.04 0.02 0.00 0.01 0.57 0.43
Fuels 1997 2.04 0.83 0.00 0.04 0.00 0.03 0.00 0.10 0.02 0.11 0.01 2.09 2.16 4.111998 1.19 0.82 0.00 0.02 0.00 0.03 0.00 0.12 0.02 0.06 0.00 1.30 1.31 3.201999 0.40 1.00 0.00 0.02 0.00 0.02 0.00 0.08 0.01 0.06 0.00 1.65 0.63 3.68
Non-ferrous metals 1997 1.82 0.48 0.03 0.19 0.04 0.34 0.04 0.42 0.05 0.35 0.06 0.09 2.16 3.531998 1.74 0.53 0.03 0.11 0.05 0.26 0.02 0.43 0.04 0.24 0.05 0.08 2.06 3.271999 1.49 0.43 0.03 0.11 0.02 0.21 0.04 0.30 0.04 0.24 0.02 0.06 1.92 2.58
Manufactures 1997 56.01 73.88 40.59 13.03 27.43 20.09 10.82 27.13 4.29 15.06 4.48 7.60 174.52 184.651998 51.77 70.63 40.37 11.11 27.06 17.12 8.82 22.04 4.06 12.69 3.75 6.24 162.91 164.101999 51.85 74.16 41.12 10.60 27.78 14.32 9.10 19.99 3.97 12.27 4.04 5.75 164.71 161.04
Iron and steel 1997 2.41 0.33 0.00 0.05 0.00 0.49 0.01 1.27 0.02 0.58 0.00 0.03 2.50 3.951998 2.16 0.26 0.01 0.03 0.00 0.29 0.00 1.15 0.01 0.56 0.00 0.03 2.22 3.541999 1.76 0.25 0.01 0.03 0.00 0.33 0.00 0.89 0.00 0.54 0.00 0.03 1.81 3.00
Chemicals 1997 8.80 1.28 0.15 1.69 0.16 2.53 0.09 2.14 0.28 2.08 0.09 0.62 10.61 13.511998 7.97 1.08 0.14 1.30 0.12 2.12 0.08 1.88 0.24 1.68 0.07 0.57 9.47 11.781999 7.92 1.17 0.13 1.31 0.12 2.14 0.08 1.91 0.24 1.64 0.08 0.50 9.36 11.59
Other semi- 1997 5.44 3.88 2.02 1.50 1.41 2.93 0.46 1.59 0.13 0.99 0.15 0.21 11.51 16.60 manufactures 1998 4.87 3.87 2.16 1.16 1.29 2.11 0.35 1.23 0.12 0.78 0.08 0.20 10.52 13.81
1999 4.44 4.26 2.29 0.98 1.31 2.03 0.40 1.07 0.13 0.67 0.08 0.16 10.47 14.05
Machinery and 1997 22.29 22.54 11.17 7.57 8.52 9.70 3.69 17.50 2.49 6.84 3.09 6.08 61.83 80.56 transport 1998 20.83 22.53 11.19 6.77 8.72 9.16 3.24 13.79 2.55 6.08 2.87 4.96 58.60 72.66 equipment 1999 22.08 24.37 11.55 6.45 8.92 6.37 3.39 11.92 2.51 6.25 2.99 4.58 60.76 69.69
Power generating 1997 0.82 0.87 0.18 0.18 0.12 0.33 0.14 0.30 0.03 0.11 0.09 0.08 1.53 2.02 machinery 1998 0.84 1.05 0.19 0.11 0.12 0.29 0.17 0.26 0.04 0.09 0.09 0.09 1.65 2.02
1999 1.01 1.13 0.22 0.10 0.16 0.47 0.16 0.27 0.05 0.10 0.09 0.09 1.98 2.54
Other non- 1997 4.44 1.41 0.48 0.93 0.36 2.30 0.17 2.72 0.16 0.92 0.11 0.39 6.66 9.62 electrical 1998 3.45 1.35 0.50 0.77 0.33 1.86 0.13 1.99 0.13 0.68 0.09 0.31 5.49 7.80 machinery 1999 3.09 1.37 0.54 0.64 0.31 1.48 0.12 1.80 0.12 0.62 0.09 0.26 4.98 6.79
Office and 1997 11.25 13.34 7.56 5.01 5.68 3.88 2.36 8.40 1.69 3.99 2.28 5.02 37.65 47.43 telecommunication 1998 11.32 13.52 7.50 4.21 5.92 3.37 1.98 6.83 1.80 3.92 2.25 4.03 36.63 43.03 equipment 1999 12.99 14.37 7.48 4.29 5.93 2.60 1.95 6.55 1.72 4.36 2.36 3.73 38.42 43.56
Electrical 1997 3.93 6.22 2.65 0.93 2.26 1.35 0.93 2.37 0.58 1.21 0.48 0.47 12.96 13.46 machinery and 1998 3.84 6.10 2.74 0.80 2.24 1.11 0.89 2.13 0.55 0.96 0.39 0.42 12.51 12.36 apparatus 1999 4.21 6.92 3.06 0.78 2.42 0.98 1.04 2.24 0.55 0.91 0.43 0.40 13.69 13.12
Automotive 1997 1.01 0.17 0.04 0.33 0.03 1.22 0.01 2.83 0.01 0.14 0.11 0.06 1.56 5.17 products 1998 0.86 0.09 0.04 0.13 0.04 1.05 0.01 1.96 0.01 0.10 0.04 0.05 1.25 3.60
1999 0.42 0.08 0.05 0.04 0.03 0.62 0.03 0.81 0.04 0.05 0.01 0.03 0.75 1.76
Other transport 1997 0.84 0.52 0.26 0.19 0.07 0.62 0.07 0.88 0.03 0.48 0.02 0.07 1.46 2.86 equipment 1998 0.52 0.42 0.21 0.76 0.07 1.48 0.07 0.62 0.04 0.32 0.02 0.06 1.07 3.85
1999 0.36 0.50 0.21 0.60 0.07 0.23 0.10 0.25 0.03 0.20 0.01 0.06 0.96 1.93
Textiles 1997 10.30 5.93 0.38 0.34 0.31 0.97 0.11 0.92 0.18 3.53 0.09 0.04 14.60 16.211998 9.01 5.27 0.41 0.28 0.29 0.78 0.06 0.77 0.14 2.82 0.07 0.04 13.04 13.481999 8.26 5.31 0.45 0.25 0.25 0.79 0.06 0.78 0.12 2.43 0.07 0.03 12.27 12.56
Clothing 1997 1.85 13.61 7.68 0.09 6.56 0.87 2.24 0.08 0.35 0.07 0.29 0.02 23.11 15.021998 2.23 13.22 7.87 0.08 6.29 0.62 1.70 0.06 0.28 0.05 0.18 0.01 22.16 14.301999 2.50 13.71 7.73 0.06 6.47 0.56 1.60 0.08 0.25 0.05 0.24 0.01 22.37 14.76
Other consumer 1997 4.93 26.32 19.19 1.79 10.47 2.60 4.22 3.63 0.84 0.97 0.77 0.59 50.36 38.81 goods 1998 4.70 24.40 18.60 1.49 10.35 2.04 3.38 3.16 0.72 0.72 0.48 0.44 46.91 34.54
1999 4.88 25.10 18.95 1.52 10.71 2.09 3.57 3.35 0.72 0.70 0.58 0.43 47.67 35.38
Total merchandise a 1997 65.61 78.60 40.94 16.44 27.77 23.94 11.42 28.69 4.75 16.09 4.88 10.38 188.20 213.301998 59.85 74.97 40.69 13.85 27.86 20.02 9.13 23.36 4.41 13.44 3.99 8.12 174.86 186.761999 58.01 78.32 41.43 12.72 28.13 16.76 9.41 21.02 4.39 12.95 4.19 7.76 174.41 180.72
a Includes unspecified products.
b Includes unspecified destinations and origins.
Note: A substantial proportion of Hong Kong, China’s merchandise exports and imports is made up of re-exports. Hong-Kong, China’s total exports, as reported
above, are listed separately for domestic (national) exports and for re-exports in Appendix Table A17. For sources and methods, see the Technical Notes.

Appe
ndix
tabl
es
200
Table A17Domestic exports and re-exports of merchandise by product, region and major trading partner, 1997-99 - Hong Kong, China(Billion dollars)
C./E. Europe/
North America Latin America Western Europe Baltic States/CIS Africa Middle East Asia
dom.exp re-exp. dom.exp re-exp. dom.exp re-exp. dom.exp re-exp. dom.exp re-exp. dom.exp re-exp. dom.exp re-exp.
Agricultural products 1997 0.09 0.20 0.00 0.01 0.04 0.15 0.00 0.00 0.00 0.01 0.00 0.01 0.72 6.201998 0.08 0.19 0.00 0.01 0.04 0.12 0.00 0.00 0.00 0.01 0.00 0.01 0.37 5.431999 0.08 0.20 0.00 0.01 0.04 0.10 0.00 0.00 0.00 0.01 0.00 0.01 0.30 4.78
Food 1997 0.09 0.16 0.00 0.01 0.04 0.11 0.00 0.00 0.00 0.01 0.00 0.01 0.67 4.151998 0.08 0.16 0.00 0.01 0.04 0.09 0.00 0.00 0.00 0.01 0.00 0.01 0.33 3.531999 0.08 0.16 0.00 0.01 0.04 0.07 0.00 0.00 0.00 0.00 0.00 0.01 0.24 3.00
Raw materials 1997 0.00 0.04 0.00 0.00 0.00 0.04 0.00 0.00 0.00 0.00 0.00 0.00 0.05 2.041998 0.00 0.04 0.00 0.00 0.00 0.03 0.00 0.00 0.00 0.00 0.00 0.00 0.04 1.901999 0.00 0.03 0.00 0.00 0.00 0.03 0.00 0.00 0.00 0.00 0.00 0.00 0.05 1.78
Mining products 1997 0.01 0.03 0.00 0.00 0.01 0.07 0.00 0.00 0.00 0.00 0.00 0.01 0.47 4.451998 0.01 0.03 0.01 0.00 0.02 0.13 0.00 0.00 0.00 0.00 0.00 0.00 0.39 3.381999 0.01 0.04 0.01 0.00 0.03 0.09 0.00 0.00 0.00 0.00 0.00 0.02 0.44 2.49
Ores and other 1997 0.00 0.01 0.00 0.00 0.00 0.04 0.00 0.00 0.00 0.00 0.00 0.00 0.17 0.52 minerals 1998 0.00 0.01 0.00 0.00 0.01 0.09 0.00 0.00 0.00 0.00 0.00 0.00 0.13 0.37
1999 0.00 0.02 0.00 0.00 0.02 0.07 0.00 0.00 0.00 0.00 0.00 0.00 0.12 0.35
Fuels 1997 0.00 0.00 0.00 0.00 0.00 0.00 0.00 0.00 0.00 0.00 0.00 0.00 0.11 2.041998 0.00 0.00 0.00 0.00 0.00 0.00 0.00 0.00 0.00 0.00 0.00 0.00 0.08 1.221999 0.00 0.00 0.00 0.00 0.00 0.00 0.00 0.00 0.00 0.00 0.00 0.00 0.08 0.54
Non-ferrous metals 1997 0.01 0.02 0.00 0.00 0.01 0.03 0.00 0.00 0.00 0.00 0.00 0.01 0.19 1.881998 0.01 0.02 0.01 0.00 0.01 0.04 0.00 0.00 0.00 0.00 0.00 0.00 0.18 1.801999 0.01 0.02 0.01 0.00 0.01 0.02 0.00 0.00 0.00 0.00 0.00 0.01 0.25 1.60
Manufactures 1997 7.49 35.79 0.26 4.93 4.95 24.50 0.04 1.03 0.14 1.99 0.15 2.40 12.45 78.391998 7.44 35.64 0.25 4.56 4.72 24.30 0.04 0.90 0.13 1.74 0.13 2.22 10.36 70.481999 6.93 36.96 0.17 3.71 4.35 25.20 0.03 0.69 0.10 1.69 0.10 2.12 9.21 73.46
Iron and steel 1997 0.00 0.00 0.00 0.00 0.00 0.00 0.00 0.00 0.00 0.01 0.00 0.00 0.02 2.471998 0.00 0.01 0.00 0.00 0.00 0.00 0.00 0.00 0.00 0.00 0.00 0.00 0.02 2.181999 0.00 0.01 0.00 0.00 0.00 0.00 0.00 0.00 0.00 0.00 0.00 0.00 0.02 1.77
Chemicals 1997 0.01 0.15 0.00 0.03 0.02 0.15 0.00 0.01 0.01 0.07 0.00 0.02 0.99 9.151998 0.01 0.14 0.01 0.03 0.01 0.12 0.00 0.01 0.01 0.05 0.00 0.02 0.83 8.231999 0.01 0.13 0.01 0.02 0.00 0.12 0.00 0.00 0.00 0.04 0.00 0.02 0.70 8.29
Other semi- 1997 0.13 2.04 0.01 0.24 0.07 1.47 0.00 0.02 0.01 0.12 0.01 0.26 0.80 6.33 manufactures 1998 0.11 2.21 0.01 0.18 0.05 1.40 0.00 0.03 0.01 0.10 0.00 0.26 0.56 5.61
1999 0.09 2.36 0.00 0.13 0.03 1.39 0.00 0.02 0.00 0.09 0.01 0.34 0.37 5.63
Machinery and 1997 1.46 10.37 0.04 1.22 1.04 7.94 0.02 0.27 0.03 0.48 0.03 0.68 4.97 33.28 transport 1998 1.10 10.75 0.03 1.21 1.03 8.11 0.02 0.29 0.02 0.47 0.02 0.65 3.78 31.12 equipment 1999 1.00 11.26 0.03 0.94 0.93 8.36 0.02 0.30 0.01 0.46 0.02 0.58 3.13 33.75
Power generating 1997 0.00 0.18 0.00 0.02 0.00 0.13 0.00 0.00 0.00 0.01 0.00 0.00 0.09 1.10 machinery 1998 0.00 0.19 0.00 0.03 0.00 0.13 0.00 0.00 0.00 0.01 0.00 0.00 0.08 1.20
1999 0.00 0.22 0.00 0.02 0.00 0.17 0.00 0.00 0.00 0.02 0.00 0.02 0.08 1.44
Other non- 1997 0.04 0.49 0.01 0.12 0.02 0.37 0.00 0.01 0.01 0.06 0.01 0.06 0.57 4.90 electrical 1998 0.03 0.52 0.01 0.13 0.01 0.33 0.00 0.01 0.01 0.07 0.00 0.06 0.40 3.91 machinery 1999 0.02 0.56 0.01 0.08 0.01 0.32 0.00 0.01 0.01 0.06 0.00 0.05 0.34 3.52
Office and 1997 1.11 6.88 0.01 0.78 0.81 5.19 0.01 0.20 0.02 0.28 0.01 0.51 3.20 18.63 telecommunication 1998 0.86 7.05 0.01 0.79 0.88 5.35 0.01 0.20 0.01 0.29 0.01 0.45 2.51 18.21 equipment 1999 0.77 7.14 0.01 0.60 0.81 5.37 0.01 0.20 0.01 0.30 0.01 0.41 1.99 20.79
Electrical 1997 0.29 2.55 0.01 0.24 0.21 2.15 0.00 0.06 0.00 0.11 0.01 0.10 1.09 6.14 machinery and 1998 0.17 2.75 0.01 0.22 0.13 2.19 0.00 0.07 0.00 0.08 0.01 0.08 0.77 6.01 apparatus 1999 0.15 3.10 0.01 0.20 0.10 2.40 0.00 0.08 0.00 0.07 0.01 0.08 0.71 6.77
Automotive 1997 0.01 0.03 0.00 0.00 0.00 0.03 0.00 0.00 0.00 0.01 0.00 0.01 0.00 1.47 products 1998 0.02 0.03 0.00 0.01 0.00 0.04 0.00 0.00 0.00 0.01 0.00 0.06 0.00 1.09
1999 0.02 0.02 0.00 0.01 0.00 0.03 0.00 0.00 0.00 0.01 0.00 0.02 0.00 0.62
Other transport 1997 0.02 0.25 0.00 0.04 0.00 0.07 0.00 0.01 0.00 0.01 0.00 0.00 0.02 1.04 equipment 1998 0.02 0.21 0.00 0.03 0.00 0.07 0.00 0.00 0.00 0.01 0.00 0.00 0.02 0.71
1999 0.02 0.22 0.00 0.02 0.00 0.07 0.00 0.00 0.00 0.01 0.00 0.00 0.02 0.60
Textiles 1997 0.18 0.28 0.02 0.31 0.03 0.31 0.00 0.02 0.04 0.36 0.02 0.10 1.34 11.591998 0.20 0.28 0.01 0.25 0.03 0.29 0.00 0.02 0.05 0.32 0.02 0.10 1.07 10.401999 0.21 0.32 0.02 0.17 0.03 0.24 0.00 0.02 0.05 0.29 0.02 0.10 0.89 9.91
Clothing 1997 4.54 3.75 0.04 0.95 2.73 4.38 0.00 0.12 0.01 0.35 0.01 0.34 2.01 3.871998 4.88 3.61 0.05 0.88 2.52 4.28 0.00 0.10 0.01 0.27 0.01 0.35 2.19 3.011999 4.61 3.70 0.05 0.82 2.51 4.44 0.00 0.07 0.00 0.30 0.00 0.34 2.38 3.12
Other consumer 1997 1.18 19.20 0.15 2.17 1.05 10.25 0.02 0.59 0.05 0.60 0.08 0.99 2.32 11.71 goods 1998 1.14 18.64 0.13 2.02 1.08 10.11 0.02 0.46 0.04 0.53 0.07 0.85 1.91 9.93
1999 1.01 19.17 0.06 1.63 0.85 10.65 0.01 0.27 0.03 0.51 0.04 0.74 1.72 10.99
Total merchandise a 1997 7.62 36.10 0.27 4.96 5.02 24.84 0.04 1.04 0.14 2.01 0.16 2.43 13.97 89.511998 7.55 35.93 0.26 4.59 4.91 25.11 0.04 0.90 0.14 1.76 0.13 2.24 11.51 79.741999 7.03 37.23 0.18 3.73 4.57 25.49 0.03 0.69 0.12 1.71 0.10 2.15 10.31 81.03
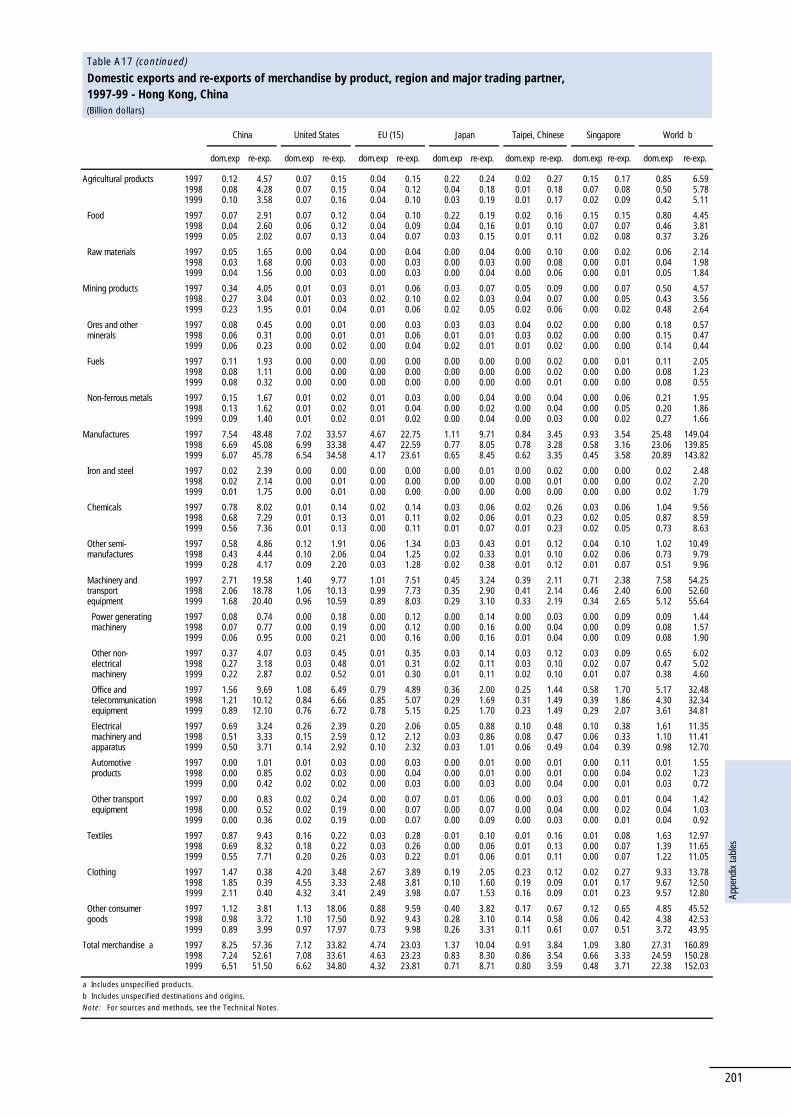
Appe
ndix
tabl
es
201
Table A17 (continued)
Domestic exports and re-exports of merchandise by product, region and major trading partner, 1997-99 - Hong Kong, China(Billion dollars)
China United States EU (15) Japan Taipei, Chinese Singapore World b
dom.exp re-exp. dom.exp re-exp. dom.exp re-exp. dom.exp re-exp. dom.exp re-exp. dom.exp re-exp. dom.exp re-exp.
Agricultural products 1997 0.12 4.57 0.07 0.15 0.04 0.15 0.22 0.24 0.02 0.27 0.15 0.17 0.85 6.591998 0.08 4.28 0.07 0.15 0.04 0.12 0.04 0.18 0.01 0.18 0.07 0.08 0.50 5.781999 0.10 3.58 0.07 0.16 0.04 0.10 0.03 0.19 0.01 0.17 0.02 0.09 0.42 5.11
Food 1997 0.07 2.91 0.07 0.12 0.04 0.10 0.22 0.19 0.02 0.16 0.15 0.15 0.80 4.451998 0.04 2.60 0.06 0.12 0.04 0.09 0.04 0.16 0.01 0.10 0.07 0.07 0.46 3.811999 0.05 2.02 0.07 0.13 0.04 0.07 0.03 0.15 0.01 0.11 0.02 0.08 0.37 3.26
Raw materials 1997 0.05 1.65 0.00 0.04 0.00 0.04 0.00 0.04 0.00 0.10 0.00 0.02 0.06 2.141998 0.03 1.68 0.00 0.03 0.00 0.03 0.00 0.03 0.00 0.08 0.00 0.01 0.04 1.981999 0.04 1.56 0.00 0.03 0.00 0.03 0.00 0.04 0.00 0.06 0.00 0.01 0.05 1.84
Mining products 1997 0.34 4.05 0.01 0.03 0.01 0.06 0.03 0.07 0.05 0.09 0.00 0.07 0.50 4.571998 0.27 3.04 0.01 0.03 0.02 0.10 0.02 0.03 0.04 0.07 0.00 0.05 0.43 3.561999 0.23 1.95 0.01 0.04 0.01 0.06 0.02 0.05 0.02 0.06 0.00 0.02 0.48 2.64
Ores and other 1997 0.08 0.45 0.00 0.01 0.00 0.03 0.03 0.03 0.04 0.02 0.00 0.00 0.18 0.57 minerals 1998 0.06 0.31 0.00 0.01 0.01 0.06 0.01 0.01 0.03 0.02 0.00 0.00 0.15 0.47
1999 0.06 0.23 0.00 0.02 0.00 0.04 0.02 0.01 0.01 0.02 0.00 0.00 0.14 0.44
Fuels 1997 0.11 1.93 0.00 0.00 0.00 0.00 0.00 0.00 0.00 0.02 0.00 0.01 0.11 2.051998 0.08 1.11 0.00 0.00 0.00 0.00 0.00 0.00 0.00 0.02 0.00 0.00 0.08 1.231999 0.08 0.32 0.00 0.00 0.00 0.00 0.00 0.00 0.00 0.01 0.00 0.00 0.08 0.55
Non-ferrous metals 1997 0.15 1.67 0.01 0.02 0.01 0.03 0.00 0.04 0.00 0.04 0.00 0.06 0.21 1.951998 0.13 1.62 0.01 0.02 0.01 0.04 0.00 0.02 0.00 0.04 0.00 0.05 0.20 1.861999 0.09 1.40 0.01 0.02 0.01 0.02 0.00 0.04 0.00 0.03 0.00 0.02 0.27 1.66
Manufactures 1997 7.54 48.48 7.02 33.57 4.67 22.75 1.11 9.71 0.84 3.45 0.93 3.54 25.48 149.041998 6.69 45.08 6.99 33.38 4.47 22.59 0.77 8.05 0.78 3.28 0.58 3.16 23.06 139.851999 6.07 45.78 6.54 34.58 4.17 23.61 0.65 8.45 0.62 3.35 0.45 3.58 20.89 143.82
Iron and steel 1997 0.02 2.39 0.00 0.00 0.00 0.00 0.00 0.01 0.00 0.02 0.00 0.00 0.02 2.481998 0.02 2.14 0.00 0.01 0.00 0.00 0.00 0.00 0.00 0.01 0.00 0.00 0.02 2.201999 0.01 1.75 0.00 0.01 0.00 0.00 0.00 0.00 0.00 0.00 0.00 0.00 0.02 1.79
Chemicals 1997 0.78 8.02 0.01 0.14 0.02 0.14 0.03 0.06 0.02 0.26 0.03 0.06 1.04 9.561998 0.68 7.29 0.01 0.13 0.01 0.11 0.02 0.06 0.01 0.23 0.02 0.05 0.87 8.591999 0.56 7.36 0.01 0.13 0.00 0.11 0.01 0.07 0.01 0.23 0.02 0.05 0.73 8.63
Other semi- 1997 0.58 4.86 0.12 1.91 0.06 1.34 0.03 0.43 0.01 0.12 0.04 0.10 1.02 10.49 manufactures 1998 0.43 4.44 0.10 2.06 0.04 1.25 0.02 0.33 0.01 0.10 0.02 0.06 0.73 9.79
1999 0.28 4.17 0.09 2.20 0.03 1.28 0.02 0.38 0.01 0.12 0.01 0.07 0.51 9.96
Machinery and 1997 2.71 19.58 1.40 9.77 1.01 7.51 0.45 3.24 0.39 2.11 0.71 2.38 7.58 54.25 transport 1998 2.06 18.78 1.06 10.13 0.99 7.73 0.35 2.90 0.41 2.14 0.46 2.40 6.00 52.60 equipment 1999 1.68 20.40 0.96 10.59 0.89 8.03 0.29 3.10 0.33 2.19 0.34 2.65 5.12 55.64
Power generating 1997 0.08 0.74 0.00 0.18 0.00 0.12 0.00 0.14 0.00 0.03 0.00 0.09 0.09 1.44 machinery 1998 0.07 0.77 0.00 0.19 0.00 0.12 0.00 0.16 0.00 0.04 0.00 0.09 0.08 1.57
1999 0.06 0.95 0.00 0.21 0.00 0.16 0.00 0.16 0.01 0.04 0.00 0.09 0.08 1.90
Other non- 1997 0.37 4.07 0.03 0.45 0.01 0.35 0.03 0.14 0.03 0.12 0.03 0.09 0.65 6.02 electrical 1998 0.27 3.18 0.03 0.48 0.01 0.31 0.02 0.11 0.03 0.10 0.02 0.07 0.47 5.02 machinery 1999 0.22 2.87 0.02 0.52 0.01 0.30 0.01 0.11 0.02 0.10 0.01 0.07 0.38 4.60
Office and 1997 1.56 9.69 1.08 6.49 0.79 4.89 0.36 2.00 0.25 1.44 0.58 1.70 5.17 32.48 telecommunication 1998 1.21 10.12 0.84 6.66 0.85 5.07 0.29 1.69 0.31 1.49 0.39 1.86 4.30 32.34 equipment 1999 0.89 12.10 0.76 6.72 0.78 5.15 0.25 1.70 0.23 1.49 0.29 2.07 3.61 34.81
Electrical 1997 0.69 3.24 0.26 2.39 0.20 2.06 0.05 0.88 0.10 0.48 0.10 0.38 1.61 11.35 machinery and 1998 0.51 3.33 0.15 2.59 0.12 2.12 0.03 0.86 0.08 0.47 0.06 0.33 1.10 11.41 apparatus 1999 0.50 3.71 0.14 2.92 0.10 2.32 0.03 1.01 0.06 0.49 0.04 0.39 0.98 12.70
Automotive 1997 0.00 1.01 0.01 0.03 0.00 0.03 0.00 0.01 0.00 0.01 0.00 0.11 0.01 1.55 products 1998 0.00 0.85 0.02 0.03 0.00 0.04 0.00 0.01 0.00 0.01 0.00 0.04 0.02 1.23
1999 0.00 0.42 0.02 0.02 0.00 0.03 0.00 0.03 0.00 0.04 0.00 0.01 0.03 0.72
Other transport 1997 0.00 0.83 0.02 0.24 0.00 0.07 0.01 0.06 0.00 0.03 0.00 0.01 0.04 1.42 equipment 1998 0.00 0.52 0.02 0.19 0.00 0.07 0.00 0.07 0.00 0.04 0.00 0.02 0.04 1.03
1999 0.00 0.36 0.02 0.19 0.00 0.07 0.00 0.09 0.00 0.03 0.00 0.01 0.04 0.92
Textiles 1997 0.87 9.43 0.16 0.22 0.03 0.28 0.01 0.10 0.01 0.16 0.01 0.08 1.63 12.971998 0.69 8.32 0.18 0.22 0.03 0.26 0.00 0.06 0.01 0.13 0.00 0.07 1.39 11.651999 0.55 7.71 0.20 0.26 0.03 0.22 0.01 0.06 0.01 0.11 0.00 0.07 1.22 11.05
Clothing 1997 1.47 0.38 4.20 3.48 2.67 3.89 0.19 2.05 0.23 0.12 0.02 0.27 9.33 13.781998 1.85 0.39 4.55 3.33 2.48 3.81 0.10 1.60 0.19 0.09 0.01 0.17 9.67 12.501999 2.11 0.40 4.32 3.41 2.49 3.98 0.07 1.53 0.16 0.09 0.01 0.23 9.57 12.80
Other consumer 1997 1.12 3.81 1.13 18.06 0.88 9.59 0.40 3.82 0.17 0.67 0.12 0.65 4.85 45.52 goods 1998 0.98 3.72 1.10 17.50 0.92 9.43 0.28 3.10 0.14 0.58 0.06 0.42 4.38 42.53
1999 0.89 3.99 0.97 17.97 0.73 9.98 0.26 3.31 0.11 0.61 0.07 0.51 3.72 43.95
Total merchandise a 1997 8.25 57.36 7.12 33.82 4.74 23.03 1.37 10.04 0.91 3.84 1.09 3.80 27.31 160.891998 7.24 52.61 7.08 33.61 4.63 23.23 0.83 8.30 0.86 3.54 0.66 3.33 24.59 150.281999 6.51 51.50 6.62 34.80 4.32 23.81 0.71 8.71 0.80 3.59 0.48 3.71 22.38 152.03
a Includes unspecified products.
b Includes unspecified destinations and origins.
Note: For sources and methods, see the Technical Notes.

Appe
ndix
tabl
es
202
Table A18
Merchandise trade by product, region and major trading partner, 1997-99 - Korea, Rep. of
(Billion dollars)
C./E. Europe/
North America Latin America Western Europe Baltic States/CIS Africa Middle East Asia
exp imp exp imp exp imp exp imp exp imp exp imp exp imp
Agricultural products 1997 0.34 5.29 0.05 1.18 0.25 1.18 0.36 0.54 0.03 0.18 0.04 0.01 3.42 5.631998 0.36 3.65 0.05 0.48 0.37 0.77 0.19 0.56 0.03 0.17 0.04 0.01 2.98 3.661999 0.36 4.16 0.04 0.64 0.28 0.91 0.08 0.68 0.02 0.16 0.03 0.02 3.40 4.51
Food 1997 0.19 3.05 0.02 0.76 0.14 0.78 0.36 0.19 0.01 0.08 0.02 0.00 2.16 3.261998 0.19 2.12 0.02 0.33 0.20 0.55 0.19 0.34 0.01 0.12 0.02 0.00 2.02 2.191999 0.21 2.54 0.02 0.40 0.13 0.65 0.07 0.37 0.01 0.08 0.02 0.01 2.36 2.62
Raw materials 1997 0.14 2.24 0.03 0.42 0.11 0.40 0.00 0.35 0.02 0.10 0.02 0.00 1.26 2.371998 0.17 1.53 0.03 0.16 0.17 0.22 0.00 0.22 0.02 0.05 0.02 0.01 0.97 1.471999 0.15 1.62 0.03 0.24 0.15 0.26 0.01 0.31 0.02 0.08 0.02 0.01 1.04 1.89
Mining products 1997 0.24 2.67 0.02 1.67 0.11 0.79 0.07 0.54 0.02 2.72 0.08 15.95 6.65 11.381998 0.42 1.62 0.08 1.14 0.14 0.40 0.07 0.40 0.01 1.54 0.04 10.45 6.03 8.791999 0.50 1.73 0.07 1.46 0.12 0.67 0.04 0.61 0.02 2.49 0.07 13.43 6.93 9.87
Ores and other 1997 0.01 1.02 0.00 0.51 0.03 0.32 0.00 0.13 0.00 0.16 0.00 0.06 0.15 1.75 minerals 1998 0.01 0.57 0.00 0.49 0.03 0.08 0.00 0.14 0.00 0.12 0.00 0.02 0.11 1.75
1999 0.01 0.60 0.00 0.62 0.03 0.13 0.00 0.19 0.00 0.12 0.00 0.04 0.10 1.91
Fuels 1997 0.16 1.12 0.02 0.27 0.01 0.08 0.06 0.07 0.01 2.17 0.06 15.70 5.02 7.971998 0.25 0.71 0.07 0.12 0.02 0.10 0.07 0.08 0.01 1.24 0.02 10.31 4.17 5.631999 0.33 0.78 0.04 0.28 0.02 0.22 0.04 0.14 0.01 2.07 0.03 13.25 5.34 6.14
Non-ferrous metals 1997 0.06 0.52 0.01 0.89 0.07 0.39 0.01 0.35 0.01 0.40 0.01 0.20 1.48 1.661998 0.16 0.34 0.01 0.52 0.09 0.22 0.00 0.18 0.00 0.18 0.02 0.12 1.75 1.411999 0.15 0.34 0.03 0.56 0.06 0.32 0.00 0.28 0.01 0.30 0.05 0.15 1.49 1.82
Manufactures 1997 22.93 24.01 6.61 1.20 18.42 17.23 4.33 1.03 2.26 0.30 4.25 0.96 56.17 43.221998 23.77 15.58 6.86 0.54 19.70 9.85 3.33 0.47 2.40 0.19 5.58 0.64 49.31 26.531999 30.41 20.05 6.86 0.75 21.41 11.40 2.64 0.80 2.68 0.30 4.96 0.80 57.16 40.42
Iron and steel 1997 0.71 0.15 0.08 0.43 0.11 0.45 0.02 0.41 0.02 0.20 0.16 0.01 4.60 3.961998 1.45 0.08 0.22 0.28 0.86 0.26 0.02 0.08 0.09 0.13 0.36 0.00 4.17 1.981999 1.07 0.11 0.18 0.32 0.35 0.26 0.03 0.29 0.08 0.18 0.24 0.00 3.95 2.85
Chemicals 1997 0.64 3.55 0.27 0.13 1.09 2.94 0.14 0.31 0.22 0.04 0.20 0.42 8.11 5.741998 0.74 2.42 0.39 0.10 1.15 2.06 0.16 0.17 0.29 0.02 0.27 0.27 7.22 4.191999 0.76 2.78 0.42 0.13 1.03 2.52 0.18 0.25 0.28 0.02 0.26 0.24 7.83 5.38
Other semi- 1997 1.20 1.28 0.36 0.09 0.89 1.47 0.14 0.04 0.36 0.01 0.35 0.04 5.09 2.76 manufactures 1998 1.50 0.81 0.46 0.03 1.03 0.67 0.10 0.07 0.21 0.02 0.40 0.03 4.37 1.31
1999 1.72 1.03 0.41 0.03 1.13 0.99 0.09 0.05 0.40 0.03 0.31 0.06 4.50 2.13
Machinery and 1997 15.41 15.80 4.13 0.51 13.55 9.52 3.26 0.15 1.16 0.03 1.97 0.44 25.42 22.27 transport 1998 14.87 10.62 4.05 0.09 13.68 5.31 2.41 0.07 1.33 0.01 3.07 0.32 22.52 14.34 equipment 1999 21.09 14.07 4.10 0.23 16.03 5.71 1.82 0.11 1.44 0.05 2.64 0.45 28.39 22.99
Power generating 1997 0.23 0.92 0.01 0.00 0.02 0.64 0.00 0.00 0.02 0.00 0.01 0.00 0.26 0.75 machinery 1998 0.30 0.58 0.03 0.00 0.05 0.25 0.01 0.00 0.02 0.00 0.00 0.00 0.33 0.60
1999 0.40 0.51 0.03 0.00 0.09 0.29 0.01 0.01 0.00 0.00 0.02 0.00 0.33 0.70
Other non- 1997 0.98 3.58 0.55 0.02 0.81 4.68 0.53 0.04 0.23 0.01 0.20 0.01 3.77 6.34 electrical 1998 1.30 1.62 0.41 0.01 0.92 2.42 0.30 0.01 0.22 0.00 0.31 0.00 2.80 2.34 machinery 1999 1.43 2.32 0.43 0.01 1.05 2.29 0.18 0.01 0.24 0.00 0.39 0.01 2.88 3.81
Office and 1997 9.53 7.74 1.39 0.03 6.17 2.03 0.84 0.03 0.27 0.00 0.50 0.42 15.15 10.52 telecommunication 1998 9.11 6.69 1.16 0.05 6.06 1.34 0.50 0.02 0.23 0.00 0.47 0.31 14.29 7.92 equipment 1999 12.79 9.21 1.72 0.10 7.45 1.52 0.35 0.04 0.21 0.01 0.57 0.41 19.80 13.45
Electrical 1997 1.25 1.22 0.57 0.01 0.87 0.98 0.24 0.01 0.14 0.00 0.28 0.01 2.70 3.26 machinery and 1998 1.13 0.63 0.48 0.01 0.84 0.57 0.16 0.00 0.19 0.00 0.26 0.01 1.92 2.44 apparatus 1999 1.40 0.94 0.46 0.01 0.95 0.68 0.10 0.02 0.17 0.00 0.28 0.01 2.33 3.91
Automotive 1997 2.48 0.50 1.44 0.00 3.38 0.62 1.64 0.01 0.48 0.01 0.78 0.00 1.96 0.77 products 1998 2.34 0.19 1.20 0.01 3.59 0.20 1.36 0.00 0.61 0.00 1.04 0.00 1.18 0.51
1999 4.15 0.32 0.72 0.03 3.83 0.30 1.17 0.00 0.70 0.00 0.96 0.00 1.45 0.74
Other transport 1997 0.94 1.84 0.17 0.44 2.30 0.57 0.01 0.05 0.03 0.01 0.20 0.00 1.58 0.62 equipment 1998 0.69 0.92 0.77 0.01 2.20 0.53 0.08 0.02 0.06 0.01 1.00 0.00 2.01 0.54
1999 0.92 0.77 0.73 0.08 2.66 0.64 0.00 0.03 0.13 0.03 0.43 0.03 1.60 0.38
Textiles 1997 1.02 0.25 1.40 0.02 1.15 0.49 0.29 0.11 0.38 0.02 1.33 0.01 7.73 2.671998 0.98 0.16 1.39 0.02 1.16 0.17 0.24 0.07 0.36 0.01 1.19 0.00 5.88 1.721999 1.05 0.18 1.39 0.01 1.02 0.26 0.26 0.09 0.35 0.01 1.21 0.01 6.26 2.44
Clothing 1997 1.82 0.06 0.11 0.00 0.62 0.41 0.24 0.00 0.03 0.00 0.08 0.00 1.29 0.911998 2.22 0.01 0.11 0.00 0.63 0.10 0.22 0.00 0.04 0.00 0.07 0.00 1.37 0.341999 2.41 0.02 0.09 0.00 0.75 0.14 0.15 0.00 0.04 0.00 0.05 0.00 1.39 0.59
Other consumer 1997 2.13 2.93 0.25 0.03 1.01 1.95 0.24 0.02 0.09 0.00 0.17 0.04 3.92 4.90 goods 1998 2.00 1.47 0.24 0.02 1.19 1.28 0.17 0.01 0.09 0.00 0.22 0.03 3.78 2.65
1999 2.31 1.87 0.27 0.02 1.10 1.52 0.12 0.01 0.08 0.00 0.25 0.03 4.84 4.05
Total merchandise a 1997 23.54 32.74 6.68 4.06 20.74 21.70 4.77 2.37 2.31 4.80 4.43 16.93 70.40 62.011998 24.59 22.24 6.99 2.16 25.23 12.82 3.59 1.55 2.56 2.28 5.90 11.10 60.19 40.241999 31.28 26.74 6.97 2.84 23.71 14.50 2.76 2.34 2.72 3.39 5.25 14.25 68.43 55.67

Appe
ndix
tabl
es
203
Table A18 (continued)
Merchandise trade by product, region and major trading partner, 1997-99 - Korea, Rep. of
(Billion dollars)
United States Japan EU (15) China Hong Kong, China Taipei, Chinese World b
exp imp exp imp exp imp exp imp exp imp exp imp exp imp
Agricultural products 1997 0.30 4.62 1.74 0.45 0.22 1.12 0.75 1.50 0.34 0.01 0.09 0.11 4.49 14.011998 0.32 3.29 1.69 0.29 0.32 0.71 0.53 0.95 0.26 0.01 0.09 0.06 4.02 9.311999 0.32 3.62 2.11 0.43 0.24 0.84 0.50 1.26 0.23 0.02 0.09 0.10 4.23 11.08
Food 1997 0.17 2.75 1.57 0.23 0.13 0.73 0.16 1.17 0.18 0.01 0.05 0.03 2.91 8.131998 0.16 2.00 1.53 0.10 0.17 0.51 0.13 0.78 0.14 0.00 0.04 0.01 2.64 5.651999 0.18 2.38 1.93 0.21 0.11 0.59 0.09 0.93 0.10 0.02 0.04 0.03 2.82 6.68
Raw materials 1997 0.13 1.87 0.17 0.22 0.09 0.39 0.59 0.33 0.16 0.00 0.05 0.07 1.59 5.881998 0.16 1.28 0.16 0.19 0.14 0.21 0.41 0.17 0.12 0.00 0.05 0.05 1.38 3.651999 0.14 1.24 0.18 0.23 0.13 0.25 0.41 0.32 0.13 0.00 0.06 0.07 1.41 4.41
Mining products 1997 0.22 1.99 2.08 1.14 0.08 0.73 1.83 1.79 1.07 0.04 0.39 0.08 7.19 35.721998 0.38 1.06 1.67 0.90 0.12 0.29 1.47 1.21 1.12 0.03 0.54 0.06 6.80 24.481999 0.45 1.29 2.30 1.18 0.10 0.44 1.73 1.32 0.91 0.05 0.54 0.09 7.76 30.26
Ores and other 1997 0.01 0.84 0.09 0.35 0.03 0.29 0.01 0.22 0.01 0.02 0.01 0.01 0.19 3.95 minerals 1998 0.01 0.43 0.06 0.31 0.03 0.07 0.01 0.18 0.01 0.03 0.01 0.01 0.16 3.18
1999 0.01 0.52 0.06 0.32 0.03 0.12 0.01 0.20 0.00 0.04 0.01 0.02 0.15 3.62
Fuels 1997 0.14 0.80 1.71 0.28 0.01 0.07 1.56 1.24 0.76 0.00 0.21 0.02 5.35 27.381998 0.22 0.40 1.19 0.15 0.02 0.04 1.15 0.73 0.68 0.00 0.32 0.02 4.60 18.201999 0.31 0.55 2.08 0.29 0.02 0.04 1.31 0.72 0.62 0.00 0.35 0.02 5.81 22.87
Non-ferrous metals 1997 0.06 0.36 0.28 0.51 0.05 0.37 0.25 0.33 0.30 0.02 0.16 0.05 1.65 4.401998 0.15 0.23 0.41 0.44 0.07 0.18 0.31 0.30 0.43 0.00 0.21 0.03 2.05 3.111999 0.13 0.22 0.16 0.57 0.04 0.28 0.40 0.40 0.28 0.01 0.19 0.05 1.80 3.77
Manufactures 1997 21.30 22.89 10.64 26.28 16.47 15.74 10.98 6.83 8.55 0.85 3.90 2.23 118.24 87.971998 22.27 14.96 8.79 15.41 17.20 9.04 9.93 4.14 7.49 0.44 4.44 1.54 114.21 54.511999 28.81 19.39 11.44 22.50 19.66 10.41 11.45 6.29 7.54 0.79 5.70 2.79 128.67 74.52
Iron and steel 1997 0.69 0.14 1.46 2.12 0.09 0.40 0.87 1.40 0.44 0.00 0.22 0.07 5.71 5.611998 1.32 0.08 1.07 1.30 0.78 0.24 0.96 0.41 0.70 0.00 0.32 0.03 7.18 2.811999 0.97 0.10 1.09 2.00 0.31 0.24 1.00 0.49 0.54 0.00 0.25 0.09 5.91 4.00
Chemicals 1997 0.61 3.17 1.02 4.03 0.97 2.70 2.73 0.65 1.04 0.02 0.82 0.20 10.67 13.131998 0.70 2.15 0.81 2.88 1.03 1.88 2.73 0.51 0.90 0.01 0.82 0.12 10.24 9.261999 0.72 2.50 0.89 3.65 0.94 2.32 3.00 0.66 0.89 0.02 0.75 0.19 10.76 11.33
Other semi- 1997 1.06 1.16 0.76 1.32 0.83 1.43 1.52 0.51 0.99 0.03 0.19 0.10 8.40 5.69 manufactures 1998 1.35 0.76 0.66 0.71 0.93 0.64 1.45 0.20 0.78 0.01 0.19 0.04 8.08 2.97
1999 1.56 0.96 0.80 1.05 0.97 0.93 1.37 0.37 0.77 0.03 0.23 0.06 8.58 4.31
Machinery and 1997 14.34 15.29 4.43 14.90 12.15 8.53 3.02 1.72 3.26 0.57 1.96 1.40 68.11 48.72 transport 1998 14.06 10.39 3.74 8.45 11.97 4.83 2.57 1.57 3.00 0.26 1.86 1.09 65.09 31.22 equipment 1999 20.18 13.82 5.39 12.79 14.85 5.14 3.52 2.62 3.44 0.56 3.09 1.99 77.95 43.61
Power generating 1997 0.22 0.81 0.06 0.48 0.02 0.34 0.07 0.15 0.01 0.00 0.01 0.02 0.54 2.32 machinery 1998 0.29 0.56 0.07 0.38 0.05 0.22 0.06 0.13 0.01 0.00 0.04 0.01 0.74 1.45
1999 0.39 0.48 0.08 0.38 0.09 0.25 0.10 0.20 0.02 0.01 0.02 0.01 0.88 1.50
Other non- 1997 0.88 3.41 0.44 5.81 0.66 4.27 1.20 0.15 0.19 0.02 0.12 0.14 7.08 14.68 electrical 1998 1.18 1.56 0.43 2.08 0.82 2.18 0.87 0.06 0.18 0.01 0.15 0.04 6.27 6.49 machinery 1999 1.28 2.26 0.51 3.38 0.93 1.93 0.82 0.11 0.16 0.02 0.16 0.10 6.61 8.44
Office and 1997 9.20 7.62 3.06 5.38 5.92 1.89 1.13 0.85 2.52 0.47 1.25 1.06 33.87 20.78 telecommunication 1998 8.87 6.62 2.45 3.67 5.87 1.21 1.11 0.77 2.35 0.20 1.37 0.93 31.82 16.57 equipment 1999 12.54 9.10 4.04 5.62 7.25 1.42 1.98 1.60 2.86 0.45 2.58 1.66 42.92 24.73
Electrical 1997 1.16 1.18 0.56 2.25 0.75 0.89 0.47 0.51 0.30 0.07 0.22 0.15 6.05 5.49 machinery and 1998 1.04 0.61 0.43 1.72 0.72 0.50 0.36 0.36 0.24 0.04 0.14 0.11 4.98 3.74 apparatus 1999 1.27 0.92 0.53 2.63 0.82 0.62 0.48 0.65 0.30 0.08 0.15 0.20 5.69 5.57
Automotive 1997 2.30 0.46 0.10 0.50 2.75 0.62 0.07 0.00 0.08 0.00 0.14 0.00 12.22 1.92 products 1998 2.10 0.17 0.08 0.36 3.09 0.20 0.10 0.00 0.06 0.00 0.09 0.00 11.37 0.92
1999 3.83 0.30 0.13 0.51 3.46 0.29 0.11 0.01 0.04 0.00 0.08 0.00 13.03 1.39
Other transport 1997 0.57 1.81 0.19 0.47 2.05 0.52 0.09 0.06 0.17 0.01 0.22 0.03 8.35 3.53 equipment 1998 0.58 0.87 0.28 0.24 1.42 0.51 0.07 0.25 0.16 0.00 0.06 0.00 9.90 2.05
1999 0.87 0.76 0.09 0.27 2.30 0.63 0.03 0.05 0.07 0.00 0.10 0.01 8.83 1.97
Textiles 1997 0.90 0.22 0.50 0.51 0.91 0.47 2.03 1.16 2.30 0.04 0.23 0.27 13.34 3.561998 0.87 0.14 0.33 0.30 0.92 0.17 1.58 0.80 1.68 0.01 0.18 0.15 11.28 2.221999 0.94 0.16 0.38 0.38 0.85 0.25 1.77 0.93 1.53 0.03 0.17 0.23 11.62 3.00
Clothing 1997 1.69 0.06 0.91 0.06 0.59 0.41 0.11 0.66 0.08 0.07 0.09 0.01 4.19 1.391998 2.07 0.01 0.96 0.02 0.60 0.10 0.10 0.27 0.09 0.01 0.14 0.00 4.65 0.501999 2.25 0.02 1.11 0.03 0.72 0.14 0.14 0.51 0.02 0.01 0.03 0.00 4.87 0.76
Other consumer 1997 2.02 2.86 1.56 3.35 0.92 1.80 0.70 0.73 0.43 0.12 0.40 0.18 7.82 9.87 goods 1998 1.91 1.43 1.22 1.75 0.97 1.19 0.53 0.39 0.34 0.13 0.92 0.11 7.70 5.53
1999 2.20 1.82 1.77 2.60 1.02 1.40 0.66 0.71 0.34 0.13 1.18 0.23 8.97 7.50
Total merchandise a 1997 21.85 30.13 14.77 27.91 16.91 18.98 13.57 10.12 11.73 0.90 4.61 2.42 136.15 144.611998 22.99 20.27 12.24 16.63 18.21 10.86 11.94 6.30 9.26 0.47 5.14 1.65 132.30 93.281999 29.60 24.94 15.86 24.14 20.29 12.63 13.68 8.87 9.05 0.88 6.35 2.97 143.69 119.75
a Includes unspecified products.
b Includes unspecified destinations and origins.
Note: For sources and methods, see the Technical Notes.

Appe
ndix
tabl
es
204
Table A19
Merchandise trade by product, region and major trading partner, 1997-99 - Singapore
(Billion dollars)
C./E. Europe/
North America Latin America Western Europe Baltic States/CIS Africa Middle East Asia
exp imp exp imp exp imp exp imp exp imp exp imp exp imp
Agricultural products 1997 0.22 0.95 0.07 0.15 0.49 1.25 0.11 0.01 0.17 0.12 0.21 0.02 3.98 4.021998 0.25 0.77 0.04 0.14 0.47 0.94 0.09 0.00 0.14 0.09 0.19 0.02 3.29 3.031999 0.25 0.69 0.05 0.15 0.40 0.92 0.03 0.01 0.13 0.14 0.19 0.04 2.81 3.05
Food 1997 0.17 0.86 0.02 0.14 0.31 1.22 0.11 0.01 0.13 0.08 0.15 0.02 3.51 3.381998 0.21 0.71 0.02 0.13 0.31 0.91 0.08 0.00 0.12 0.07 0.14 0.02 2.85 2.601999 0.20 0.62 0.03 0.14 0.28 0.89 0.03 0.00 0.12 0.12 0.14 0.04 2.42 2.63
Raw materials 1997 0.05 0.09 0.05 0.01 0.18 0.03 0.00 0.00 0.04 0.03 0.06 0.00 0.47 0.651998 0.04 0.07 0.03 0.01 0.16 0.03 0.00 0.00 0.03 0.01 0.05 0.00 0.43 0.431999 0.04 0.06 0.02 0.01 0.12 0.03 0.00 0.00 0.02 0.01 0.04 0.00 0.40 0.43
Mining products 1997 0.25 0.44 0.02 0.29 0.04 0.44 0.00 0.19 0.02 0.35 0.06 9.42 10.51 4.111998 0.29 0.22 0.54 0.17 0.56 0.24 0.01 0.02 0.22 0.12 0.17 5.96 7.82 3.191999 0.41 0.34 0.64 0.13 0.57 0.38 0.01 0.08 0.27 0.29 0.25 7.18 8.39 3.38
Ores and other 1997 0.00 0.03 0.00 0.00 0.01 0.04 0.00 0.00 0.00 0.02 0.00 0.00 0.32 0.23 minerals 1998 0.00 0.02 0.00 0.00 0.01 0.02 0.00 0.00 0.00 0.01 0.00 0.00 0.26 0.17
1999 0.00 0.03 0.00 0.00 0.00 0.02 0.00 0.01 0.00 0.02 0.00 0.00 0.25 0.20
Fuels 1997 0.16 0.25 0.02 0.04 0.00 0.13 0.00 0.13 0.02 0.22 0.05 9.38 8.53 2.401998 0.23 0.13 0.54 0.04 0.52 0.07 0.01 0.00 0.22 0.07 0.16 5.94 6.54 1.921999 0.35 0.24 0.64 0.02 0.54 0.19 0.01 0.03 0.26 0.26 0.23 7.14 7.05 2.20
Non-ferrous metals 1997 0.09 0.15 0.00 0.25 0.03 0.27 0.00 0.05 0.01 0.10 0.00 0.04 1.66 1.481998 0.06 0.07 0.00 0.12 0.03 0.15 0.00 0.02 0.00 0.03 0.01 0.03 1.02 1.101999 0.05 0.07 0.00 0.11 0.02 0.17 0.00 0.04 0.01 0.01 0.02 0.04 1.08 0.98
Manufactures 1997 22.62 21.12 1.35 0.93 16.99 18.73 0.80 0.46 0.96 0.18 1.63 0.76 60.26 66.401998 21.50 17.79 1.19 0.84 17.12 14.17 0.47 0.36 0.97 0.47 1.75 0.60 49.80 51.021999 21.56 17.80 1.19 0.78 17.10 14.69 0.33 0.51 0.94 0.17 1.36 0.61 55.99 57.86
Iron and steel 1997 0.01 0.12 0.00 0.07 0.02 0.81 0.00 0.20 0.02 0.04 0.03 0.00 0.75 1.631998 0.01 0.09 0.00 0.06 0.02 0.46 0.00 0.10 0.02 0.02 0.04 0.00 0.47 1.211999 0.01 0.08 0.01 0.04 0.01 0.32 0.00 0.12 0.01 0.01 0.03 0.00 0.43 1.05
Chemicals 1997 0.58 2.15 0.05 0.05 0.67 2.36 0.02 0.03 0.06 0.02 0.09 0.30 6.08 2.681998 0.47 1.77 0.08 0.02 0.99 1.99 0.01 0.01 0.08 0.04 0.13 0.28 5.34 2.061999 0.76 1.72 0.11 0.03 1.96 2.23 0.02 0.01 0.10 0.04 0.14 0.22 5.99 2.39
Other semi- 1997 0.16 0.93 0.03 0.06 0.26 1.50 0.01 0.02 0.05 0.03 0.08 0.09 2.53 3.63 manufactures 1998 0.12 0.69 0.02 0.03 0.32 1.03 0.01 0.01 0.05 0.03 0.07 0.06 1.84 2.65
1999 0.14 0.63 0.02 0.05 0.28 1.10 0.02 0.01 0.04 0.02 0.07 0.06 1.87 2.79
Machinery and 1997 20.29 14.89 1.11 0.70 14.55 11.11 0.71 0.20 0.65 0.05 1.11 0.29 43.90 48.98 transport 1998 19.05 12.61 0.95 0.69 14.30 8.92 0.40 0.23 0.66 0.37 1.17 0.19 36.37 38.44 equipment 1999 18.75 12.43 0.93 0.62 13.49 9.11 0.25 0.37 0.64 0.07 0.84 0.25 41.05 44.01
Power generating 1997 0.07 0.34 0.00 0.00 0.08 0.31 0.00 0.00 0.00 0.00 0.01 0.00 1.05 1.35 machinery 1998 0.06 0.34 0.01 0.00 0.07 0.29 0.00 0.00 0.01 0.00 0.01 0.00 0.85 1.22
1999 0.06 0.40 0.01 0.00 0.07 0.24 0.00 0.00 0.01 0.00 0.01 0.00 0.79 1.12
Other non- 1997 0.39 2.95 0.04 0.02 0.26 2.92 0.03 0.02 0.12 0.01 0.19 0.03 5.33 5.24 electrical 1998 0.42 2.52 0.04 0.01 0.33 2.06 0.05 0.01 0.12 0.01 0.28 0.04 4.06 3.56 machinery 1999 0.43 2.56 0.05 0.01 0.37 1.99 0.03 0.01 0.11 0.01 0.22 0.06 4.09 3.82
Office and 1997 18.92 7.83 0.77 0.37 13.15 4.25 0.62 0.12 0.40 0.01 0.64 0.17 30.12 32.69 telecommunication 1998 17.33 6.37 0.64 0.46 12.75 3.91 0.30 0.15 0.44 0.01 0.62 0.08 25.46 26.20 equipment 1999 17.25 6.23 0.68 0.52 11.95 4.46 0.17 0.21 0.44 0.03 0.44 0.08 29.68 30.75
Electrical 1997 0.60 1.16 0.23 0.04 0.66 1.43 0.04 0.03 0.05 0.00 0.11 0.04 5.50 6.12 machinery and 1998 0.68 1.17 0.20 0.06 0.67 1.16 0.04 0.05 0.05 0.00 0.10 0.07 4.66 5.21 apparatus 1999 0.77 1.20 0.17 0.07 0.64 1.16 0.05 0.06 0.05 0.00 0.08 0.10 5.22 5.68
Automotive 1997 0.05 0.23 0.02 0.01 0.05 0.78 0.00 0.01 0.02 0.01 0.02 0.01 0.83 1.16 products 1998 0.05 0.19 0.01 0.00 0.06 0.41 0.00 0.00 0.02 0.00 0.03 0.00 0.45 0.69
1999 0.06 0.13 0.00 0.01 0.03 0.52 0.00 0.00 0.02 0.01 0.02 0.01 0.49 0.88
Other transport 1997 0.26 2.38 0.05 0.25 0.35 1.43 0.00 0.02 0.07 0.03 0.14 0.04 1.07 2.41 equipment 1998 0.51 2.02 0.05 0.15 0.42 1.09 0.00 0.03 0.01 0.35 0.13 0.01 0.90 1.56
1999 0.19 1.90 0.02 0.01 0.43 0.74 0.00 0.09 0.01 0.02 0.06 0.01 0.78 1.76
Textiles 1997 0.01 0.13 0.01 0.00 0.03 0.25 0.00 0.00 0.07 0.01 0.05 0.01 1.08 1.331998 0.01 0.07 0.01 0.00 0.03 0.12 0.00 0.00 0.05 0.00 0.05 0.00 0.71 0.851999 0.02 0.06 0.01 0.00 0.03 0.12 0.00 0.00 0.05 0.00 0.04 0.01 0.72 0.92
Clothing 1997 0.71 0.06 0.03 0.00 0.48 0.21 0.00 0.00 0.00 0.02 0.01 0.00 0.25 1.511998 0.81 0.03 0.03 0.00 0.40 0.10 0.00 0.00 0.01 0.01 0.01 0.00 0.17 1.261999 0.92 0.02 0.02 0.00 0.46 0.09 0.00 0.00 0.00 0.01 0.01 0.00 0.19 1.53
Other consumer 1997 0.86 2.85 0.12 0.05 0.97 2.49 0.06 0.01 0.10 0.01 0.27 0.06 5.68 6.64 goods 1998 1.03 2.54 0.11 0.03 1.06 1.55 0.04 0.00 0.11 0.00 0.28 0.06 4.90 4.54
1999 0.97 2.86 0.09 0.04 0.89 1.72 0.03 0.01 0.10 0.01 0.24 0.07 5.74 5.18
Total merchandise a 1997 23.42 23.07 2.04 1.38 18.36 20.87 0.94 0.65 1.42 0.66 2.04 10.22 76.62 75.591998 22.44 19.29 1.78 1.15 19.19 15.78 0.57 0.39 1.35 0.68 2.15 6.59 62.29 57.851999 22.51 19.43 1.88 1.11 18.29 16.49 0.37 0.61 1.37 0.60 1.85 7.87 68.33 64.96

Appe
ndix
tabl
es
205
Table A19 (continued)
Merchandise trade by product, region and major trading partner, 1997-99 - Singapore
(Billion dollars)
United States Malaysia EU (15) Japan Hong Kong, China Thailand World b
exp imp exp imp exp imp exp imp exp imp exp imp exp imp
Agricultural products 1997 0.19 0.90 0.74 1.49 0.47 1.20 0.63 0.18 0.37 0.18 0.12 0.40 5.26 6.511998 0.22 0.74 0.56 1.18 0.43 0.88 0.54 0.12 0.25 0.11 0.09 0.31 4.47 4.991999 0.22 0.66 0.54 1.15 0.39 0.84 0.56 0.13 0.25 0.06 0.09 0.36 3.86 4.98
Food 1997 0.16 0.82 0.60 1.16 0.30 1.17 0.56 0.15 0.33 0.17 0.11 0.34 4.40 5.701998 0.19 0.68 0.47 0.97 0.28 0.86 0.50 0.10 0.22 0.11 0.08 0.26 3.73 4.441999 0.19 0.60 0.43 0.97 0.28 0.81 0.51 0.11 0.22 0.05 0.07 0.31 3.22 4.44
Raw materials 1997 0.04 0.08 0.15 0.33 0.17 0.03 0.07 0.03 0.04 0.01 0.02 0.05 0.85 0.811998 0.03 0.06 0.09 0.21 0.16 0.03 0.05 0.02 0.03 0.01 0.01 0.06 0.75 0.551999 0.04 0.06 0.10 0.18 0.12 0.03 0.05 0.03 0.03 0.01 0.02 0.05 0.64 0.54
Mining products 1997 0.25 0.40 2.04 1.08 0.04 0.42 0.76 0.40 3.24 0.02 0.40 0.39 10.90 15.241998 0.27 0.20 1.56 0.74 0.44 0.23 0.48 0.31 2.11 0.02 0.24 0.30 9.61 9.921999 0.38 0.31 1.65 0.71 0.43 0.37 0.65 0.32 2.07 0.03 0.33 0.45 10.54 11.78
Ores and other 1997 0.00 0.03 0.08 0.13 0.01 0.04 0.07 0.01 0.05 0.00 0.01 0.02 0.33 0.33 minerals 1998 0.00 0.02 0.04 0.09 0.01 0.02 0.05 0.01 0.04 0.00 0.02 0.01 0.28 0.23
1999 0.00 0.02 0.06 0.13 0.00 0.02 0.05 0.01 0.02 0.00 0.01 0.01 0.26 0.28
Fuels 1997 0.16 0.25 1.48 0.75 0.00 0.13 0.57 0.05 3.10 0.00 0.32 0.34 8.78 12.551998 0.21 0.13 1.23 0.46 0.40 0.07 0.36 0.04 2.01 0.00 0.19 0.28 8.21 8.171999 0.33 0.24 1.26 0.40 0.41 0.19 0.51 0.07 1.99 0.01 0.28 0.43 9.10 10.08
Non-ferrous metals 1997 0.09 0.12 0.48 0.20 0.03 0.26 0.12 0.34 0.09 0.02 0.07 0.03 1.79 2.361998 0.06 0.05 0.29 0.19 0.03 0.14 0.08 0.26 0.06 0.02 0.04 0.01 1.12 1.521999 0.05 0.05 0.32 0.19 0.02 0.16 0.09 0.24 0.06 0.02 0.04 0.01 1.18 1.42
Manufactures 1997 22.28 20.51 18.69 17.28 16.40 16.57 7.10 22.31 8.22 3.60 5.02 5.92 104.75 108.571998 20.98 17.39 14.38 13.77 16.31 12.66 5.91 16.26 6.70 2.66 3.82 4.23 92.93 85.251999 21.16 17.46 16.57 15.39 16.43 12.49 7.08 17.73 6.39 3.03 4.52 4.43 98.54 92.41
Iron and steel 1997 0.01 0.11 0.38 0.15 0.01 0.45 0.01 0.91 0.03 0.00 0.07 0.08 0.83 2.871998 0.01 0.08 0.21 0.15 0.02 0.30 0.01 0.67 0.03 0.00 0.04 0.09 0.56 1.941999 0.01 0.07 0.22 0.14 0.01 0.21 0.01 0.57 0.03 0.00 0.03 0.04 0.50 1.62
Chemicals 1997 0.56 2.10 1.52 0.40 0.64 1.97 0.38 1.13 0.67 0.08 0.71 0.09 7.54 7.601998 0.46 1.74 1.23 0.35 0.94 1.72 0.36 0.88 0.58 0.05 0.59 0.11 7.11 6.171999 0.73 1.68 1.28 0.43 1.93 1.87 0.47 1.03 0.58 0.06 0.69 0.12 9.07 6.63
Other semi- 1997 0.15 0.85 0.93 0.96 0.24 1.41 0.16 1.02 0.23 0.22 0.23 0.26 3.12 6.25 manufactures 1998 0.11 0.62 0.62 0.76 0.30 0.98 0.13 0.77 0.21 0.11 0.15 0.20 2.43 4.51
1999 0.13 0.58 0.71 0.79 0.26 1.05 0.10 0.74 0.20 0.12 0.16 0.22 2.44 4.66
Machinery and 1997 20.03 14.46 13.73 13.10 14.11 10.53 5.70 16.70 6.44 2.18 3.52 5.19 82.47 76.21 transport 1998 18.62 12.34 10.92 10.49 13.74 8.30 4.71 12.18 5.13 1.82 2.66 3.62 73.02 61.45 equipment 1999 18.46 12.21 12.75 11.93 12.95 7.91 5.01 13.32 4.95 2.00 3.25 3.83 76.02 66.85
Power generating 1997 0.07 0.32 0.37 0.28 0.08 0.30 0.13 0.41 0.11 0.02 0.17 0.34 1.23 2.00 machinery 1998 0.06 0.32 0.30 0.29 0.07 0.28 0.13 0.38 0.09 0.02 0.08 0.29 1.01 1.86
1999 0.05 0.38 0.28 0.22 0.07 0.23 0.12 0.28 0.09 0.02 0.06 0.32 0.95 1.76
Other non- 1997 0.37 2.87 2.06 0.54 0.23 2.69 0.21 3.38 0.47 0.11 0.63 0.34 6.36 11.19 electrical 1998 0.40 2.46 1.14 0.44 0.30 1.87 0.21 2.17 0.42 0.11 0.44 0.24 5.29 8.21 machinery 1999 0.40 2.50 1.42 0.45 0.33 1.82 0.20 2.32 0.38 0.08 0.43 0.25 5.29 8.46
Office and 1997 18.70 7.58 8.16 10.56 12.89 4.02 4.72 8.22 5.15 1.61 2.04 4.03 64.62 45.45 telecommunication 1998 17.12 6.25 7.20 8.34 12.37 3.58 3.89 6.34 3.99 1.35 1.52 2.72 57.55 37.16 equipment 1999 17.03 6.13 8.46 9.74 11.54 3.52 4.20 7.11 3.88 1.53 2.05 2.90 60.60 42.28
Electrical 1997 0.58 1.14 2.69 1.51 0.64 1.32 0.47 2.28 0.54 0.36 0.54 0.44 7.18 8.82 machinery and 1998 0.66 1.15 2.12 1.25 0.65 1.07 0.34 1.94 0.48 0.30 0.49 0.35 6.40 7.71 apparatus 1999 0.74 1.19 2.38 1.34 0.63 1.09 0.37 2.14 0.45 0.34 0.59 0.33 6.98 8.26
Automotive 1997 0.05 0.23 0.29 0.04 0.05 0.77 0.03 0.92 0.07 0.06 0.08 0.02 0.99 2.21 products 1998 0.05 0.19 0.06 0.04 0.06 0.41 0.02 0.57 0.06 0.00 0.05 0.02 0.62 1.29
1999 0.06 0.13 0.11 0.05 0.03 0.52 0.02 0.71 0.06 0.01 0.07 0.02 0.63 1.55
Other transport 1997 0.25 2.32 0.17 0.16 0.22 1.42 0.15 1.48 0.10 0.03 0.07 0.03 2.09 6.55 equipment 1998 0.33 1.97 0.09 0.13 0.30 1.08 0.12 0.79 0.08 0.03 0.08 0.01 2.16 5.21
1999 0.18 1.88 0.11 0.13 0.36 0.73 0.10 0.75 0.09 0.02 0.06 0.02 1.57 4.53
Textiles 1997 0.01 0.12 0.57 0.22 0.03 0.22 0.01 0.15 0.05 0.08 0.06 0.07 1.24 1.721998 0.00 0.07 0.30 0.17 0.03 0.11 0.01 0.09 0.04 0.06 0.05 0.04 0.86 1.051999 0.02 0.06 0.31 0.17 0.02 0.11 0.01 0.10 0.04 0.07 0.04 0.05 0.85 1.12
Clothing 1997 0.68 0.06 0.10 0.73 0.47 0.21 0.06 0.02 0.02 0.33 0.01 0.04 1.49 1.811998 0.77 0.03 0.05 0.67 0.39 0.10 0.05 0.01 0.01 0.21 0.00 0.02 1.43 1.411999 0.87 0.02 0.06 0.67 0.45 0.08 0.05 0.01 0.01 0.27 0.00 0.04 1.60 1.65
Other consumer 1997 0.84 2.80 1.46 1.71 0.90 1.78 0.78 2.39 0.79 0.70 0.41 0.20 8.07 12.11 goods 1998 1.00 2.51 1.07 1.18 0.89 1.15 0.65 1.66 0.69 0.40 0.32 0.14 7.53 8.72
1999 0.94 2.83 1.24 1.26 0.81 1.26 1.45 1.96 0.58 0.51 0.33 0.12 8.06 9.89
Total merchandise a 1997 23.02 22.38 21.82 19.90 17.49 18.52 8.84 23.28 12.02 3.89 5.75 6.79 124.99 132.441998 21.87 18.83 16.75 15.72 17.42 14.13 7.23 17.03 9.22 2.85 4.21 4.86 109.90 101.731999 22.06 19.02 18.98 17.29 17.42 14.13 8.51 18.49 8.80 3.19 5.04 5.25 114.68 111.06
a Includes unspecified products.
b Includes unspecified destinations and origins.
Note: For sources and methods, see the Technical Notes.

Appe
ndix
tabl
es
206
Table A20
Merchandise trade by product, region and major trading partner, 1997-99 - Taipei, Chinese
(Billion dollars)
C./E. Europe/
North America Latin America Western Europe Baltic States/CIS Africa Middle East Asia
exp imp exp imp exp imp exp imp exp imp exp imp exp imp
Agricultural products 1997 0.44 3.79 0.02 0.67 0.13 1.30 0.00 0.08 0.04 0.37 0.03 0.03 3.27 3.521998 0.49 2.78 0.02 0.69 0.14 0.94 0.00 0.08 0.04 0.36 0.03 0.02 2.29 2.931999 0.45 2.98 0.02 0.44 0.13 0.99 0.00 0.07 0.04 0.31 0.03 0.03 2.33 2.84
Food 1997 0.33 2.71 0.01 0.48 0.04 1.06 0.00 0.02 0.02 0.04 0.01 0.03 1.70 1.751998 0.38 1.92 0.01 0.52 0.05 0.78 0.00 0.02 0.02 0.03 0.01 0.02 1.13 1.621999 0.34 2.19 0.01 0.27 0.05 0.80 0.00 0.01 0.03 0.03 0.01 0.02 1.17 1.62
Raw materials 1997 0.11 1.08 0.01 0.19 0.08 0.24 0.00 0.06 0.02 0.33 0.02 0.01 1.57 1.781998 0.11 0.86 0.01 0.17 0.09 0.16 0.00 0.06 0.02 0.33 0.02 0.00 1.17 1.311999 0.11 0.80 0.01 0.18 0.08 0.19 0.00 0.05 0.01 0.28 0.02 0.00 1.16 1.22
Mining products 1997 0.09 1.17 0.00 1.10 0.06 1.05 0.00 0.32 0.00 1.58 0.00 3.48 1.90 6.561998 0.10 0.81 0.01 0.70 0.08 0.61 0.00 0.19 0.00 1.25 0.00 2.40 1.48 5.871999 0.10 0.69 0.01 0.57 0.06 0.48 0.00 0.37 0.00 1.59 0.00 3.33 1.61 6.18
Ores and other 1997 0.01 0.34 0.00 0.17 0.00 0.31 0.00 0.01 0.00 0.09 0.00 0.05 0.18 0.92 minerals 1998 0.00 0.27 0.00 0.15 0.01 0.18 0.00 0.03 0.00 0.09 0.00 0.03 0.13 0.92
1999 0.00 0.24 0.00 0.12 0.00 0.18 0.00 0.03 0.00 0.06 0.00 0.03 0.14 0.78
Fuels 1997 0.00 0.39 0.00 0.07 0.00 0.45 0.00 0.01 0.00 1.27 0.00 3.20 0.50 3.711998 0.00 0.26 0.00 0.01 0.00 0.23 0.00 0.01 0.00 1.01 0.00 2.18 0.28 3.041999 0.00 0.21 0.01 0.01 0.00 0.11 0.00 0.04 0.00 1.34 0.00 3.09 0.32 3.27
Non-ferrous metals 1997 0.09 0.45 0.00 0.86 0.05 0.29 0.00 0.30 0.00 0.23 0.00 0.22 1.22 1.931998 0.09 0.29 0.00 0.55 0.07 0.21 0.00 0.15 0.00 0.15 0.00 0.19 1.07 1.911999 0.10 0.24 0.01 0.45 0.06 0.19 0.00 0.30 0.00 0.19 0.00 0.20 1.15 2.13
Manufactures 1997 31.39 17.41 3.25 0.73 18.11 13.97 0.72 1.56 1.47 0.47 2.28 0.63 59.63 47.121998 31.04 16.13 3.06 0.57 19.29 13.81 0.68 1.16 1.35 0.34 2.13 0.58 49.41 45.851999 32.24 15.88 2.77 0.85 19.65 13.75 0.66 1.32 1.23 0.29 1.86 0.65 58.07 52.22
Iron and steel 1997 0.27 0.09 0.03 0.32 0.08 0.67 0.00 1.34 0.01 0.27 0.11 0.03 2.75 2.741998 0.37 0.06 0.03 0.23 0.42 0.36 0.00 0.89 0.02 0.23 0.09 0.04 2.25 2.591999 0.54 0.05 0.02 0.26 0.19 0.36 0.01 1.06 0.01 0.19 0.08 0.06 2.70 2.21
Chemicals 1997 0.40 3.50 0.14 0.12 0.39 2.81 0.02 0.08 0.12 0.04 0.11 0.46 5.91 6.611998 0.42 2.82 0.14 0.09 0.44 2.53 0.02 0.07 0.11 0.04 0.13 0.37 5.08 5.941999 0.43 2.85 0.14 0.09 0.34 2.65 0.02 0.08 0.12 0.04 0.13 0.38 6.00 6.40
Other semi- 1997 3.38 0.82 0.29 0.12 1.78 1.04 0.03 0.02 0.13 0.02 0.21 0.03 5.25 2.86 manufactures 1998 3.43 0.69 0.26 0.07 1.77 0.90 0.04 0.01 0.12 0.01 0.20 0.02 4.10 2.62
1999 3.55 0.65 0.23 0.07 1.69 0.84 0.04 0.01 0.11 0.01 0.18 0.02 4.21 2.74
Machinery and 1997 20.02 10.55 1.50 0.14 12.49 7.36 0.40 0.10 0.65 0.14 0.83 0.05 29.45 27.27 transport 1998 19.73 10.44 1.47 0.14 13.38 8.08 0.38 0.16 0.60 0.04 0.85 0.06 24.80 28.55 equipment 1999 20.63 9.95 1.29 0.40 13.81 7.85 0.42 0.15 0.56 0.04 0.76 0.08 31.30 34.04
Power generating 1997 0.09 0.22 0.02 0.00 0.03 0.22 0.00 0.01 0.01 0.00 0.00 0.00 0.53 0.45 machinery 1998 0.09 0.34 0.02 0.00 0.03 0.33 0.00 0.02 0.01 0.00 0.01 0.00 0.42 0.49
1999 0.10 0.28 0.01 0.01 0.02 0.25 0.00 0.01 0.01 0.00 0.01 0.00 0.43 0.42
Other non- 1997 1.98 2.89 0.33 0.02 1.05 2.89 0.03 0.02 0.18 0.01 0.18 0.03 5.97 5.51 electrical 1998 2.11 2.56 0.33 0.01 1.06 3.16 0.03 0.02 0.16 0.01 0.17 0.03 3.91 5.96 machinery 1999 2.17 3.00 0.24 0.02 1.02 3.18 0.03 0.01 0.16 0.00 0.16 0.03 4.49 7.03
Office and 1997 13.93 4.74 0.48 0.08 8.91 2.14 0.27 0.05 0.22 0.02 0.36 0.01 15.83 14.93 telecommunication 1998 13.27 4.36 0.49 0.09 9.40 2.54 0.23 0.11 0.20 0.02 0.37 0.02 14.67 15.87 equipment 1999 13.77 4.38 0.41 0.33 10.12 2.67 0.23 0.11 0.17 0.02 0.33 0.04 20.06 20.20
Electrical 1997 2.63 0.80 0.26 0.03 1.28 0.61 0.05 0.01 0.07 0.01 0.12 0.01 4.98 3.88 machinery and 1998 2.68 0.80 0.28 0.04 1.18 0.68 0.07 0.01 0.07 0.00 0.11 0.01 4.41 3.89 apparatus 1999 2.95 0.92 0.31 0.04 1.22 0.72 0.09 0.01 0.07 0.00 0.10 0.01 4.58 4.30
Automotive 1997 0.69 0.53 0.14 0.00 0.19 1.17 0.01 0.00 0.10 0.01 0.11 0.00 0.69 1.53 products 1998 0.72 0.32 0.14 0.00 0.19 0.77 0.02 0.00 0.09 0.01 0.10 0.00 0.42 1.49
1999 0.82 0.21 0.14 0.01 0.22 0.67 0.02 0.00 0.10 0.01 0.10 0.00 0.52 1.33
Other transport 1997 0.70 1.37 0.28 0.00 1.03 0.32 0.04 0.00 0.08 0.09 0.06 0.00 1.46 0.97 equipment 1998 0.86 2.05 0.23 0.00 1.52 0.61 0.03 0.00 0.07 0.00 0.10 0.00 0.99 0.85
1999 0.83 1.16 0.18 0.00 1.21 0.37 0.05 0.00 0.06 0.00 0.06 0.00 1.22 0.76
Textiles 1997 0.78 0.14 0.71 0.01 0.67 0.29 0.18 0.01 0.38 0.01 0.55 0.00 9.49 1.391998 0.77 0.12 0.66 0.00 0.73 0.23 0.17 0.01 0.34 0.01 0.49 0.00 8.00 1.191999 0.79 0.10 0.64 0.01 0.64 0.19 0.13 0.01 0.29 0.01 0.41 0.01 8.08 1.14
Clothing 1997 2.19 0.03 0.06 0.00 0.51 0.26 0.01 0.01 0.02 0.00 0.07 0.00 0.56 0.701998 2.19 0.02 0.06 0.01 0.42 0.25 0.01 0.01 0.02 0.00 0.06 0.00 0.44 0.631999 2.00 0.02 0.04 0.00 0.38 0.19 0.00 0.01 0.01 0.01 0.04 0.00 0.41 0.62
Other consumer 1997 4.34 2.27 0.52 0.03 2.19 1.54 0.08 0.00 0.15 0.00 0.39 0.05 6.23 5.54 goods 1998 4.13 1.98 0.44 0.02 2.11 1.47 0.07 0.01 0.14 0.00 0.32 0.09 4.75 4.33
1999 4.29 2.27 0.40 0.02 2.61 1.66 0.05 0.00 0.13 0.00 0.25 0.10 5.36 5.08
Total merchandise a 1997 31.99 24.83 3.28 2.50 18.32 19.70 0.73 1.98 1.51 2.46 2.31 4.15 64.90 57.941998 31.68 20.84 3.09 1.95 19.52 19.18 0.68 1.42 1.39 1.96 2.16 3.01 53.27 55.361999 32.85 20.63 2.81 1.87 19.88 15.68 0.67 1.76 1.29 2.20 1.89 4.01 62.17 62.12

Appe
ndix
tabl
es
207
Table A20 (continued)
Merchandise trade by product, region and major trading partner, 1997-99 - Taipei, Chinese
(Billion dollars)
United States Japan EU (15) Hong Kong, China Korea, Rep. Of Singapore World b
exp imp exp imp exp imp exp imp exp imp exp imp exp imp
Agricultural products 1997 0.41 3.43 1.58 0.57 0.12 1.19 0.90 0.04 0.13 0.09 0.06 0.04 3.93 9.781998 0.46 2.48 1.03 0.59 0.13 0.86 0.69 0.02 0.06 0.09 0.04 0.03 3.05 7.801999 0.42 2.63 1.04 0.54 0.13 0.89 0.54 0.02 0.09 0.09 0.05 0.03 3.03 7.68
Food 1997 0.31 2.63 1.25 0.33 0.04 0.97 0.15 0.04 0.03 0.04 0.05 0.04 2.13 6.081998 0.36 1.84 0.79 0.36 0.05 0.71 0.12 0.02 0.01 0.03 0.03 0.03 1.64 4.901999 0.32 2.07 0.81 0.36 0.05 0.71 0.13 0.02 0.02 0.03 0.04 0.03 1.64 4.95
Raw materials 1997 0.11 0.81 0.33 0.24 0.08 0.23 0.75 0.00 0.10 0.05 0.02 0.01 1.80 3.691998 0.10 0.63 0.23 0.23 0.08 0.15 0.57 0.00 0.06 0.06 0.01 0.00 1.41 2.901999 0.10 0.56 0.23 0.18 0.08 0.17 0.41 0.00 0.07 0.06 0.01 0.00 1.39 2.73
Mining products 1997 0.08 0.95 0.31 1.05 0.06 0.61 0.98 0.06 0.08 0.49 0.20 0.52 2.79 15.261998 0.09 0.65 0.23 1.06 0.08 0.40 0.81 0.05 0.05 0.57 0.15 0.25 2.23 11.831999 0.09 0.54 0.20 1.09 0.06 0.37 0.86 0.03 0.06 0.65 0.14 0.24 2.53 13.20
Ores and other 1997 0.00 0.30 0.08 0.09 0.00 0.29 0.06 0.06 0.01 0.01 0.00 0.01 0.20 1.89 minerals 1998 0.00 0.23 0.05 0.16 0.01 0.17 0.05 0.04 0.01 0.01 0.00 0.01 0.14 1.66
1999 0.00 0.21 0.06 0.17 0.00 0.17 0.04 0.02 0.01 0.01 0.00 0.01 0.15 1.44
Fuels 1997 0.00 0.32 0.01 0.17 0.00 0.07 0.29 0.00 0.03 0.30 0.09 0.48 1.22 9.091998 0.00 0.19 0.01 0.12 0.00 0.06 0.15 0.00 0.02 0.36 0.06 0.21 0.85 6.721999 0.00 0.16 0.01 0.14 0.00 0.05 0.15 0.00 0.01 0.43 0.06 0.21 1.07 8.06
Non-ferrous metals 1997 0.07 0.34 0.22 0.78 0.05 0.25 0.63 0.00 0.04 0.17 0.11 0.03 1.37 4.281998 0.08 0.22 0.16 0.78 0.07 0.17 0.62 0.01 0.02 0.20 0.09 0.03 1.24 3.441999 0.09 0.17 0.13 0.78 0.05 0.15 0.67 0.01 0.04 0.21 0.08 0.03 1.32 3.70
Manufactures 1997 29.81 16.53 9.91 27.18 17.14 12.95 27.33 1.75 2.18 4.31 4.71 2.50 117.22 82.631998 29.49 15.46 8.17 25.16 18.40 12.66 23.82 1.74 1.39 4.97 3.16 2.34 107.12 79.291999 30.55 15.29 10.64 28.39 18.77 12.63 25.05 1.76 2.46 6.36 3.69 2.94 116.52 86.11
Iron and steel 1997 0.25 0.08 0.42 1.64 0.08 0.62 1.40 0.00 0.07 0.23 0.07 0.01 3.25 5.471998 0.34 0.06 0.31 1.50 0.42 0.34 1.34 0.00 0.03 0.33 0.04 0.01 3.18 4.401999 0.47 0.04 0.33 1.41 0.19 0.35 1.42 0.00 0.09 0.24 0.05 0.00 3.55 4.19
Chemicals 1997 0.37 3.20 0.56 4.11 0.34 2.56 3.44 0.04 0.20 0.89 0.15 0.40 7.09 13.621998 0.39 2.57 0.52 3.58 0.39 2.30 3.05 0.03 0.12 0.88 0.11 0.38 6.33 11.871999 0.40 2.62 0.60 4.05 0.31 2.39 3.14 0.03 0.19 0.79 0.13 0.37 7.18 12.50
Other semi- 1997 3.12 0.73 0.89 1.39 1.71 0.98 2.51 0.03 0.14 0.19 0.28 0.03 11.08 4.90 manufactures 1998 3.18 0.62 0.65 1.25 1.70 0.84 2.14 0.03 0.06 0.19 0.17 0.03 9.92 4.32
1999 3.30 0.60 0.68 1.34 1.63 0.79 2.05 0.03 0.07 0.22 0.18 0.03 10.01 4.34
Machinery and 1997 19.19 10.14 5.42 15.85 11.88 6.94 11.87 1.03 1.28 2.37 3.59 1.90 65.72 46.26 transport 1998 18.91 10.14 4.67 15.59 12.82 7.46 10.73 1.13 0.91 3.15 2.45 1.73 61.40 48.27 equipment 1999 19.70 9.68 6.85 17.89 13.18 7.27 12.02 1.14 1.66 4.60 2.92 2.34 68.81 53.63
Power generating 1997 0.08 0.22 0.11 0.36 0.03 0.21 0.21 0.01 0.01 0.00 0.07 0.01 0.69 0.92 machinery 1998 0.08 0.34 0.07 0.37 0.03 0.29 0.20 0.01 0.01 0.03 0.05 0.01 0.57 1.19
1999 0.09 0.27 0.06 0.30 0.02 0.18 0.20 0.01 0.01 0.01 0.04 0.01 0.58 0.96
Other non- 1997 1.81 2.84 0.64 4.88 0.91 2.62 2.68 0.06 0.17 0.13 0.20 0.12 9.71 11.38 electrical 1998 1.93 2.50 0.52 5.27 0.95 2.78 1.92 0.05 0.06 0.19 0.12 0.13 7.77 11.74 machinery 1999 1.98 2.95 0.57 6.31 0.94 2.78 2.09 0.05 0.12 0.20 0.15 0.11 8.28 13.28
Office and 1997 13.49 4.58 3.69 6.18 8.61 2.05 5.52 0.74 0.90 1.70 2.46 1.59 40.02 22.58 telecommunication 1998 12.82 4.24 3.32 5.56 9.12 2.42 5.63 0.86 0.75 2.62 1.75 1.41 38.62 23.76 equipment 1999 13.22 4.27 5.33 6.89 9.73 2.61 6.95 0.87 1.26 4.05 2.16 2.05 45.10 28.78
Electrical 1997 2.53 0.78 0.60 2.50 1.21 0.58 2.44 0.23 0.16 0.17 0.69 0.14 9.38 5.38 machinery and 1998 2.60 0.77 0.46 2.46 1.10 0.61 2.27 0.22 0.10 0.16 0.48 0.15 8.79 5.46 apparatus 1999 2.86 0.88 0.51 2.72 1.15 0.67 2.19 0.21 0.18 0.19 0.45 0.13 9.31 6.07
Automotive 1997 0.64 0.42 0.15 1.35 0.17 1.16 0.23 0.00 0.00 0.10 0.04 0.00 1.92 3.24 products 1998 0.67 0.26 0.10 1.34 0.18 0.77 0.15 0.00 0.00 0.08 0.01 0.00 1.67 2.61
1999 0.77 0.18 0.13 1.17 0.20 0.67 0.12 0.00 0.00 0.07 0.02 0.00 1.91 2.22
Other transport 1997 0.63 1.29 0.23 0.57 0.94 0.32 0.79 0.00 0.03 0.26 0.12 0.04 4.01 2.77 equipment 1998 0.80 2.02 0.20 0.59 1.44 0.59 0.56 0.00 0.00 0.08 0.04 0.04 3.97 3.51
1999 0.78 1.13 0.24 0.50 1.12 0.36 0.46 0.00 0.09 0.08 0.09 0.04 3.63 2.30
Textiles 1997 0.68 0.13 0.37 0.36 0.57 0.27 5.60 0.02 0.30 0.23 0.24 0.03 12.77 1.861998 0.67 0.11 0.32 0.35 0.64 0.21 4.52 0.02 0.16 0.19 0.17 0.03 11.16 1.581999 0.69 0.09 0.33 0.32 0.57 0.17 4.28 0.02 0.24 0.17 0.17 0.05 10.99 1.46
Clothing 1997 2.10 0.03 0.19 0.08 0.50 0.26 0.18 0.33 0.01 0.06 0.03 0.00 3.41 1.001998 2.09 0.02 0.14 0.08 0.42 0.24 0.15 0.28 0.00 0.06 0.01 0.00 3.19 0.921999 1.91 0.02 0.12 0.10 0.38 0.19 0.14 0.28 0.00 0.04 0.01 0.00 2.88 0.85
Other consumer 1997 4.09 2.23 2.05 3.74 2.07 1.31 2.33 0.29 0.19 0.34 0.36 0.13 13.90 9.51 goods 1998 3.91 1.93 1.58 2.81 2.01 1.26 1.88 0.25 0.11 0.18 0.21 0.16 11.94 7.93
1999 4.07 2.24 1.73 3.28 2.52 1.46 2.01 0.25 0.21 0.29 0.24 0.15 13.10 9.15
Total merchandise a 1997 30.37 23.25 11.80 29.00 17.34 17.93 29.27 2.00 2.39 5.03 5.00 3.15 124.18 114.361998 30.09 19.68 9.43 27.00 18.62 17.63 25.39 1.95 1.51 5.67 3.36 2.70 112.59 104.651999 31.11 19.51 11.91 30.25 18.98 14.27 26.53 2.07 2.61 7.11 3.90 3.28 122.38 109.47
a Includes unspecified products.
b Includes unspecified destinations and origins.
Note: For sources and methods, see the Technical Notes.

Appe
ndix
tabl
es
208
Table A21
Export prices of primary commodities, 1989-00
(Indices 1990=100)
1989 1991 1992 1993 1994 1995 1996 1997 1998 1999 1999 2000
Q1 Q2 Q3 Q4 Q1 Q2
Food, beverages and tobacco 110 99 98 97 111 118 125 122 106 89 95 89 85 88 88 86
Food 110 99 101 100 105 114 128 114 99 84 90 84 82 82 84 84
Cereals 114 98 105 98 105 123 148 114 96 84 91 85 82 79 83 81
Wheat 125 95 112 104 111 131 153 118 93 83 89 83 81 79 79 81
Maize 102 98 95 93 99 113 151 107 93 83 88 85 78 79 86 84
Rice 112 109 99 88 100 119 125 112 113 92 103 91 91 83 89 76
Vegetable oils and protein meals 113 101 105 106 115 124 137 137 123 94 101 93 89 93 94 94
Meat 98 101 96 102 93 77 76 79 71 75 72 72 77 79 80 79
Beef 100 104 96 102 91 74 70 72 67 72 69 69 74 76 77 77
Lamb 87 87 95 103 104 94 120 124 96 96 90 91 98 103 103 89
Sugar 96 89 83 88 99 108 101 95 81 67 71 64 65 66 60 69
Bananas 101 104 88 82 81 81 87 90 89 79 88 82 75 71 91 80
Beverages 114 93 81 86 150 151 125 165 140 110 119 111 99 113 103 95
Coffee 126 94 73 83 180 184 139 192 150 116 125 119 101 121 109 96
Cocoa beans 98 94 87 88 110 113 115 128 132 90 110 89 84 75 71 73
Tea 99 91 98 91 90 81 87 117 117 114 112 109 107 129 117 122
Tobacco 98 106 101 80 88 78 90 104 98 91 93 92 91 90 90 89
Agricultural raw materials 106 96 99 117 129 135 130 120 99 102 100 100 102 107 107 107
Timber 107 105 117 155 157 148 151 141 121 134 128 130 136 142 140 138
Cotton 92 93 70 70 97 119 98 96 79 64 68 71 63 56 64 72
Wool 117 71 68 58 83 93 84 84 61 60 57 60 61 62 64 62
Rubber 112 96 100 96 130 183 162 118 84 73 79 69 66 80 81 83
Hides and skins 98 86 82 87 94 96 95 96 83 78 76 72 79 86 83 84
Jute 91 90 68 66 72 90 111 74 64 68 61 63 72 74 74 71
Sisal 91 94 71 86 85 99 121 109 115 97 110 102 91 86 80 89
Minerals and non-ferrous metals (excluding crude petroleum) 112 87 84 72 84 100 89 92 78 77 70 74 80 83 88 84
Copper 107 88 86 72 87 110 86 86 62 59 53 55 63 65 68 65
Aluminum 119 80 77 70 90 110 92 98 83 83 73 80 88 92 100 90
Iron ore 86 108 103 91 83 88 93 98 101 90 88 88 90 90 94 94
Tin 141 91 100 85 90 102 101 93 91 89 86 89 86 93 94 89
Nickel 150 92 79 60 71 93 85 78 52 68 52 59 72 88 106 106
Zinc 109 74 82 64 66 68 68 87 68 71 65 67 75 76 74 75
Lead 83 69 67 50 68 78 96 77 65 62 62 64 62 57 56 52
Fertilizers 105 103 98 83 90 99 113 114 117 112 115 115 111 108 107 107
Total of above 107 94 94 96 109 118 117 113 96 90 89 88 89 92 94 92
Crude petroleum 78 84 83 73 69 75 89 84 57 78 51 70 89 104 116 117
All primary commodities 94 90 91 90 98 106 109 105 86 87 79 83 89 95 100 99
Note: The indices are period averages based on dollar prices. The quarterly figures are not seasonally adjusted. For sources and methods, see the Technical Notes.

209
This Note details the definitions, methods and sources of thestatistics used in International Trade Statistics 2000.
I. Composition of country groups
1. Regions
North America : Canada, United States of America, andterritories in North America n.e.s.
Latin America : Antigua and Barbuda, Argentina, Bahamas,Barbados, Belize, Bolivia, Brazil, Chile, Colombia, Costa Rica,Cuba, Dominica, Dominican Republic, Ecuador, El Salvador,Grenada, Guatemala, Guyana, Haiti, Honduras, Jamaica, Mexico,Netherlands Antilles, Nicaragua, Panama, Paraguay, Peru, SaintKitts and Nevis, Saint Lucia, Saint Vincent and the Grenadines,Suriname, Trinidad and Tobago, Uruguay, Venezuela and othercountries and territories in Latin America n.e.s.
Western Europe : Austria, Belgium, Denmark, Finland, France,Germany, Greece, Iceland, Ireland, Italy, Liechtenstein,Luxembourg, Malta, Netherlands, Norway, Portugal, Spain,Sweden, Switzerland, Turkey, United Kingdom, Bosnia andHerzegovina, Croatia, former Yugoslav Republic of Macedonia,Slovenia, Yugoslavia (the last five countries mentioned comprisethe former Yugoslavia), and territories in Western Europe n.e.s.
Central and Eastern Europe, the Baltic States and theCommonwealth of Independent States (transition economies), ofwhich Central and Eastern Europe : Albania, Bulgaria, CzechRepublic, Hungary, Poland, Romania and the Slovak Republic ;the Baltic States : Estonia, Latvia and Lithuania ; and theCommonwealth of Independent States (CIS) : Armenia,Azerbaijan, Belarus, Georgia, Kazakhstan, Kyrgyzstan, Republic ofMoldova, Russian Federation, Tajikistan, Turkmenistan, Ukraineand Uzbekistan. The grouping former USSR refers to the BalticStates and the CIS.
Africa, of which North Africa : Algeria, Egypt, Libyan ArabJamahiriya, Morocco and Tunisia ; and Sub-Saharan Africacomprising : Western Africa : Benin, Burkina Faso, Cape Verde,Côte d’Ivoire, Gambia, Ghana, Guinea, Guinea-Bissau, Liberia,Mali, Mauritania, Niger, Nigeria, Senegal, Sierra Leone and Togo ;Central Africa : Burundi, Cameroon, Central African Republic,Chad, Congo, Democratic Republic of the Congo, EquatorialGuinea, Gabon, Rwanda, and Sao Tome and Principe ; EasternAfrica : Comoros, Djibouti, Eritrea, Ethiopia, Kenya, Madagascar,Mauritius, Seychelles, Somalia, Sudan, United Republic of Tanzaniaand Uganda ; and Southern Africa : Angola, Botswana, Lesotho,Malawi, Mozambique, Namibia, South Africa, Swaziland, Zambia,Zimbabwe and territories in Africa n.e.s.
The Middle East : Bahrain, Cyprus, Iraq, Islamic Republic ofIran, Israel, Jordan, Kuwait, Lebanon, Oman, Qatar, Saudi Arabia,Syrian Arab Republic, United Arab Emirates, Yemen and othercountries and territories in the Middle East n.e.s.
Asia, of which West Asia : Afghanistan, Bangladesh, Bhutan,India, Maldives, Nepal, Pakistan and Sri Lanka ; and East Asia(incl. Oceania) : Australia ; Brunei Darussalam ; Cambodia ;China ; Fiji ; Hong Kong Special Administrative Region of China(Hong Kong, China) ; Indonesia ; Japan ; Kiribati ; Lao People’sDemocratic Republic ; Macau, China ; Malaysia ; Mongolia ;Myanmar ; New Zealand ; Papua New Guinea ; Philippines ;Republic of Korea ; Samoa ; Separate Customs Territory ofTaiwan, Penghu, Kinmen and Matsu (Taipei, Chinese) ;
Singapore ; Solomon Islands ; Thailand ; Tonga ; Tuvalu ;Vanuatu ; Viet Nam and other countries and territories in Asiaand the Pacific n.e.s.
2. Other country groupsANDEAN : Bolivia, Colombia, Ecuador, Peru and Venezuela.APEC : Australia ; Brunei Darussalam ; Canada ; Chile ;
China ; Hong Kong, China ; Indonesia ; Japan ; Republic ofKorea ; Malaysia ; Mexico ; New Zealand ; Papua New Guinea ;Peru ; Philippines ; Russian Federation ; Singapore ; Taipei,Chinese ; Thailand ; United States of America and Viet Nam.
ASEAN : Brunei Darussalam, Cambodia, Indonesia, LaoPeople’s Democratic Republic, Malaysia, Myanmar, Philippines,Singapore, Thailand and Viet Nam.
CEFTA : Czech Republic, Hungary, Poland, Romania, Sloveniaand the Slovak Republic.
EUROPEAN UNION : Austria, Belgium, Denmark, Finland,France, Germany, Greece, Ireland, Italy, Luxembourg, Netherlands,Portugal, Spain, Sweden and the United Kingdom.
Least-developed countries : Afghanistan, Angola, Bangladesh,Benin, Bhutan, Burkina Faso, Burundi, Cambodia, Cape Verde,Central African Republic, Chad, Comoros, Democratic Republic ofthe Congo, Djibouti, Equatorial Guinea, Eritrea, Ethiopia,Gambia, Guinea, Guinea-Bissau, Haiti, Kiribati, Lao People’sDemocratic Republic, Lesotho, Liberia, Madagascar, Malawi,Maldives, Mali, Mauritania, Mozambique, Myanmar, Nepal, Niger,Rwanda, Samoa, Sao Tome and Principe, Sierra Leone, SolomonIslands, Somalia, Sudan, Togo, Tuvalu, Uganda, United Republicof Tanzania, Vanuatu, Yemen and Zambia.
MERCOSUR : Argentina, Brazil, Paraguay and Uruguay.NAFTA : Canada, Mexico and the United States of America.SAPTA : Bangladesh, Bhutan, India, Maldives, Nepal, Pakistan
and Sri Lanka.Six East Asian traders : Hong Kong, China ; Malaysia ;
Republic of Korea ; Singapore ; Taipei, Chinese and Thailand.The designations used in this report do not imply an
expression of opinion by the Secretariat concerning either thestatus of any country, territory or area, or the delimitation of itsfrontiers.
3. Political boundariesChanges in political boundaries since 1991 involving the
former Czech and Slovak Federal Republic, the former Yugoslaviaand the former USSR are reflected in this report, as far asavailable statistics permit. This means that, beginning with 1992,data for these former entities are no longer given. Thisinformation is replaced with data for their successor states. Inthe case of the successor states to the former Czech and SlovakFederal Republic and the former Yugoslavia, the statistics includetheir mutual trade. In the case of the successor states of theformer USSR, the absence of detailed merchandise tradestatistics for most of them has ruled out the inclusion of theirmutual trade at the disaggregated product level, as well as, forcomparability reason, at the aggregate level. However, recentimprovements in data collection have meant that mutual tradebetween the successor states of the former USSR has beenincluded systematically in the tables, starting with data for 1996.The effects on the continuity of the data series are explained inSection III.2 below. N
otes
tech
niqu
es
TECHNICAL NOTES
210
II. DEFINITIONS AND METHODS
II.1 Merchandise trade
1. Exports and imports
Two systems of recording merchandise exports and importsare in common use. They are referred to as general trade andspecial trade and differ mainly in the way warehoused and re-exported goods are treated. General trade figures are larger thanthe corresponding special trade figures because the latterexclude certain trade flows, such as goods shipped throughbonded warehouses.
Unless otherwise noted, total merchandise trade is defined inthis report according to the general trade definition. It covers alltypes of inward and outward movement of goods through acountry or territory including movements through customswarehouses and free zones. For further explanations, see UnitedNations International Trade Statistics, Concepts and Definitions,Series M, No 52, Revision 2.
Unless otherwise indicated, exports are valued at transactionvalue, including the cost of transportation and insurance to bringthe merchandise to the frontier of the exporting country orterritory (f.o.b. valuation). Imports are valued at transaction valueplus the cost of transportation and insurance to the frontier ofthe importing country or territory (c.i.f. valuation).
2. Products All product groups are defined according to Revision 3 of the
Standard International Trade Classification (SITC).The following groupings are used in this report :
A. Primary products(i) Agricultural products- Food : food and live animals ; beverages and tobacco ;
animal and vegetable oils, fats and waxes ; oilseeds andoleaginous fruit (SITC sections 0, 1, 4 and division 22).
- Raw materials : hides, skins and furskins, raw ; crude rubber(including synthetic and reclaimed) ; cork and wood ; pulp andwaste paper ; textile fibres and their wastes ; crude animal andvegetable materials, n.e.s. (SITC divisions 21, 23, 24, 25, 26, 29).
(ii) Mining products- Ores and other minerals : crude fertilizers (other than
those classified in chemicals) and crude minerals ; metalliferousores and metal scrap (SITC divisions 27, 28).
- Fuels : (SITC section 3).- Non-ferrous metals : (SITC division 68).
B. Manufactures : (SITC sections 5, 6, 7, 8 minus division 68and group 891)
(i) Iron and steel : (SITC division 67).(ii) Chemicals : organic chemicals (SITC division 51) ;
plastics (SITC divisions 57, 58) ; inorganic chemicals(SITC division 52) ; pharmaceuticals (SITC division 54) ;other chemicals (SITC divisions 53, 55, 56, 59).
(iii) Other semi-manufactures : leather, leather manufactures,n.e.s., and dressed furskins ; rubber manufactures,n.e.s. ; cork and wood manufactures (excludingfurniture) ; paper, paperboard and articles of paper pulp,of paper or of paperboard ; non-metallic mineralmanufactures, n.e.s. ; manufactures of metals, n.e.s.(SITC divisions 61, 62, 63, 64, 66, 69).
(iv) Machinery and transport equipment : power generatingmachinery ; other non-electrical machinery ; officemachines and telecommunications equipment ; electrical
machinery and apparatus ; automotive products ; othertransport equipment (SITC section 7).- Power generating machinery : power generatingmachinery and equipment minus internal combustionpiston engines, and parts thereof, n.e.s. (SITC division 71minus group 713).- Other non-electrical machinery : machinery specializedfor particular industries ; metalworking machinery ;general industrial machinery and equipment, n.e.s., andmachine parts, n.e.s. (SITC divisions 72, 73, 74).- Office machines and telecommunications equipment :office machines and automatic data processingmachines ; telecommunications and sound recording andreproducing apparatus and equipment ; thermionic, coldcathode or photo-cathode valves and tubes (SITCdivisions 75, 76 and group 776).- Electrical machinery and apparatus : electricalmachinery, apparatus and appliances, n.e.s., andelectrical parts thereof ; minus thermionic, cold cathodeor photo-cathode valves and tubes ; minus electricalequipment, n.e.s., for internal combustion engines andvehicles, and parts thereof (SITC division 77 minus group776 and subgroup 7783).- Automotive products : motor cars and other motorvehicles principally designed for the transport of persons(other than public transport type vehicles) includingstation wagons and racing cars ; motor vehicles for thetransport of goods and special purpose motor vehicles ;road motor vehicles, n.e.s. ; parts and accessories ofmotor vehicles and tractors ; internal combustion pistonengines for vehicles listed above ; electrical equipment,n.e.s., for internal combustion engines and vehicles, andparts thereof (SITC groups 781, 782, 783, 784, andsubgroups 7132, 7783).- Other transport equipment : other transport equipment(railway vehicles, aircraft, spacecraft, ships and boats,and associated parts and equipment) ; motorcycles andcycles, motorized and non-motorized ; trailers and semi-trailers, other vehicles (not mechanically propelled), andspecially designed and equipped transport containers ;internal combustion piston engines for aircraft, and partsthereof, n.e.s. ; internal combustion piston engines,marine propulsion ; internal combustion piston engines,n.e.s. ; parts, n.e.s., for internal combustion pistonengines listed above (SITC division 79, groups 785, 786,and subgroups 7131, 7133, 7138, 7139).
(v) Textiles : (SITC division 65).(vi) Clothing : (SITC division 84).(vii) Other consumer goods : household articles, travel goods,
footwear, instruments and apparatus, photography,optical goods, watches and clocks, and othermanufactured articles, n.e.s. (SITC divisions 81, 82, 83,85, 87, 88, 89 excluding group 891, arms andammunition).
C. Other products : commodities and transactions not classifiedelsewhere (including gold) ; arms and ammunition (SITC section9 and group 891).
3. CoverageTrade flowing through processing zones is not systematically
recorded in national trade statistics and can result in significantunder-recording of trade in certain goods. For example, theexclusion of these flows from the statistics for Central Americanand Caribbean countries has resulted in under-recording of theirtrade in clothing. When included, practices for classifying theN
otes
tech
niqu
es
211
goods involved also differ between countries. In recent years,however, improvements in data collection have resulted in theinclusion of processing trade for a number of countries includingCosta Rica, Czech Republic, Hungary, Lithuania, Mexico, Moroccoand the Ukraine. In all but one of these countries, this hasresulted in breaks in the continuity of the data series. In the caseof Mexico, trade flows through the special manufacturing zoneknown as the « maquiladoras » were previously excluded fromofficial trade statistics, but reported separately by the Banco deMéxico. The Secretariat included these flows in Mexico’s exportsand imports given their magnitude (ranging from 29 to 40 percent of combined trade during the 1989-99 period). Theseshipments have been included in Mexico’s official trade statisticssince 1992.
4. World trade networkThe world merchandise trade network by region and product
from which Appendix tables A2 and A7 are derived is based onexport data. The network is constructed in the following way :
First, total merchandise exports from each of the sevenregions are aggregated from country figures published by theInternational Monetary Fund in International Financial Statistics,other international organizations, and national statisticalauthorities. They are supplemented by Secretariat estimates (seeAppendix table A3).
Next, the total merchandise exports of each region aredistributed by destination and then by product. The regional andcommodity breakdown is based on OECD, Monthly Statistics ofForeign Trade ; UNSD, Comtrade database, International TradeStatistics Yearbook, and Monthly Bulletin of Statistics ; nationalstatistics and Secretariat estimates.
During this process, the principal adjustments to the figuresare as follows :
(i) Exports of ships to the open registry countries Panamaand Liberia are re-allocated from each region’s exportsto Latin America and Africa to « unspecifieddestinations » (a category not shown separately).
(ii) Re-exports of Hong Kong, China are excluded. This isbecause the magnitude of Hong Kong, China’s re-exports(9.8 per cent of Asian total merchandise exports in1999) would introduce a significant element of doublecounting into the trade of the Asian region since a largeproportion of Hong Kong, China’s re-exports are goodsof Chinese origin or have China as final destination.
(iii) China’s exports are adjusted to approximate their finaldestination.
(iv) Exports of military goods and non-monetary gold, whereknown, are included. When they cannot be broken downby destination, they are allocated to « unspecifieddestinations ».
5. Merchandise trade of selected major traders byproduct, region and major trading partner (Appendixtables A8 to A20)
These tables are derived from the UNSD Comtrade database.The figures in the tables for total merchandise trade are notnecessarily the same as those in Appendix tables A3 and A4 (seeSection III.1 below). For trade by product, world totals includeshipments which have not been distinguished by origin ordestination. For trade by region and partner, world totals includegoods which have not been specified by product. The followingadjustments have been made to the figures :
(i) Exports of ships to the open registry countries Panamaand Liberia are re-allocated from each economy’s exportsto Latin America and Africa to « unspecifieddestinations » (a category not shown separately).
(ii) Merchandise trade of the European Union (Appendixtables A11 to A14) - part of Belgian imports included in « other products »are re-allocated to « automotive products » ;- French trade in military goods is included. It isallocated to « other products » and « unspecified originsand destinations ».- official supplementary estimates of intra-EU exportsand intra-EU imports beginning with 1993 that have notbeen transmitted to UNSD by the statistical authoritiesof EU member countries are included. For the UnitedKingdom, supplementary estimates have beendistributed by product using national statistics. For othercountries, whenever relevant, the figures have beenallocated to « other products ».- for the combined trade of EU member States(Appendix table A11), intra-imports have been replacedby intra-exports beginning with 1993 to partlycompensate for the observed under-reporting of intra-imports resulting from INTRASTAT procedures (seeSection III below).
Selection of each reporter’s major trading partners is basedon a ranking of total trade (exports plus imports) of eachreporter with their trading partners in 1999 (member States ofthe EU are counted as one trading partner).
6. Merchandise trade in balance of payments statisticsMerchandise trade statistics together with other basic
statistical systems (such as industrial and transport statistics)provide the foundation for the system of national accounts (SNA)and the balance of payments (BOP). Merchandise trade statisticsare basic to the compilation of the goods account in the balanceof payments as structured and defined in the fifth edition of theInternational Monetary Fund’s Balance of Payments Manual(BPM5).
Goods (merchandise) are defined in the SNA as « physicalobjects for which a demand exists, over which ownership rightscan be established and whose ownership can be transferredfrom one institutional unit to another by engaging intransactions on markets ». Thus, for the SNA and BOP statisticsthe recording of transactions should be based on the change of,ownership principle.
However, the compilation of international merchandise tradestatistics (ITS) is usually based on customs records whichessentially reflect the physical movement of goods acrossborders, and follow international guidelines on concepts anddefinitions which do not fully conform to the principles of theSNA and the BPM5.
A number of adjustments have to be made to internationalmerchandise trade statistics before they match the specificrequirements of national accounts and balance of paymentsstatistics. For aggregate exports and imports these adjustmentsare mainly related to coverage, the system of trade, and valuation.
With respect to coverage, the ITS in most instances conformswith the BPM5. Differences remain for the following cases :(i) transactions that represent services transactions (e.g.blueprints, videos, and tapes) should be valued in ITS at thevalue of the material in which they are incorporated, while underBPM5 these transactions should be excluded from goods andincluded, at market value, in services ; (ii) transactions in whichone or both national boundaries are not crossed (e.g. trade invessels and aircraft, exports of bunkers, etc.) are not alwaysincluded in ITS for practical reasons, whereas they are usuallyincluded in BOP statistics ; (iii) goods under the improvementand repair trade regime should be excluded from ITS, but theyare to be included at the value of the repair under the BPM5. N
otes
tech
niqu
es
212
Concerning the system of trade, the ITS guidelines outline themeasurement of trade flows on the basis of (1) the special tradesystem and (2) the general trade system. Under the special tradesystem, the customs frontier is regarded as the statisticalboundary whereas, under the general system of trade, thenational frontier is regarded as the statistical boundary. TheBPM5 stresses that measurement for BOP compilation should bebased on change of ownership rather than on the general tradesystem or the special trade system. The general trade systemappears to be a better proxy for measuring change of ownershipbecause it provides broader coverage and the date of change ofownership may be closer to the date goods cross the nationalfrontier than to the date goods clear through customs.
As far as valuation is concerned, the issue that affects mostdata comparability concerns the point of valuation, namely,whether goods are valued at the importer’s border – that is atthe c.i.f. value – or at the f.o.b. value at the exporter’s border. ITSguidelines recommend the adoption of the c.i.f. valuation forimports whereas BPM5 requires the f.o.b. valuation. Additionaladjustments may be made by BOP compilers to conform to theBPM5 requirement for a market price for valuing trade,processing trade, and with respect to currency conversion.
Once adjusted, merchandise trade is recorded in the goodscategory of the current account, along with services, income, andcurrent transfers. Therefore, within the balance of paymentsframework transactions in both goods and services areharmonized and provide for comparable statistical series, as inTable I.8. It is not strictly speaking correct to aggregate thefigures for commercial services and merchandise shownelsewhere in this report.
It should be noted that some countries still apply theconcepts of the fourth edition of the Balance of PaymentsManual, and thus do not include goods for processing and goodsprocured in port carriers in the goods account.
II.2 Trade in commercial services
1. Exports and importsExports (credits) and imports (debits) of commercial services
are derived from statistics on international service transactionsincluded in the balance of payments statistics provided by theInternational Monetary Fund (IMF). They conform to theconcepts, definitions and classification of the fourth (1977) orfifth (1993) edition of the IMF Balance of Payments Manual. Forcountries that do not report to the IMF data are drawn fromnational statistics e.g., Hong Kong, China ; Macau, China ; andTaipei, Chinese. Estimations for missing data are mainly based onnational statistics.
2. Definition of commercial servicesIn the fifth edition of the Balance of Payments Manual, the
current account is subdivided into goods, services (includinggovernment services, n.i.e.), income (investment income andcompensation of employees), and current transfers. Thecommercial services category in this report is defined as beingequal to services minus government services, n.i.e. Commercialservices is further sub-divided into transport, travel, and othercommercial services.
Transport covers all transportation services (sea, air and other– including land, internal waterway, space and pipeline) that areperformed by residents of one economy for those of another, andthat involve the carriage of passengers, the movement of goods(freight), rentals (charters) of carriers with crew, and relatedsupporting and auxiliary services.
Travel includes goods and services acquired by personaltravellers, for health, education or other purposes, and bybusiness travellers. Unlike other services, travel is not a specifictype of service, but an assortment of goods and servicesconsumed by travellers. The most common goods and servicescovered are lodging, food and beverages, entertainment andtransportation (within the economy visited), gifts and souvenirs.
Other commercial services corresponds to the followingcomponents defined in BPM5 :
(i) communication services (telecommunications, postal andcourier services) ;
(ii) construction services ;(iii) insurance services ;(iv) financial services ;(v) computer and information services (including news
agency services) ;(vi) royalties and licence fees, covering payments and
receipts for the use of intangible non-financial assetsand proprietary rights, such as patents, copyrights,trademarks, industrial processes, and franchises ;
(vii) other business services, comprising trade relatedservices, operational leasing (rentals), and miscellaneousbusiness, professional and technical services such aslegal, accounting, management consulting, publicrelations services, advertising, market research andpublic opinion polling, research and developmentservices, architectural, engineering, and other technicalservices, agricultural, mining and on-site processing ; and
(viii) personal, cultural, and recreational services includingaudiovisual services.
3. Coverage and comparabilityAlthough in recent years the coverage and comparability of
services trade data have improved, recorded trade figures stilllack comparability across countries and are subject to significantdistortions.
First, some countries do not collect statistics for certain servicecategories. Second, some service transactions are simply notregistered. If central bank records are used, situations where nofinancial intermediaries are employed are not counted. In the caseof surveys, the coverage of trading establishments is oftenincomplete. A particularly serious problem is that servicestransmitted electronically are frequently unregistered, especiallywhen the transactions take place within multinationalcorporations. Third, statistics may be reported on a net rather thanon a gross basis, often as a result of compensation arrangementssuch as in rail transport or in communication services. Fourth, thealternate sources used for countries which are not members of theIMF do not necessarily comply with the IMF concepts anddefinitions. Fifth, misclassification of transactions may lead to anunderestimation of commercial services when service transactionsare registered as income, transfers or trade in merchandise ratherthan trade in services or, conversely, to an overestimation ofcommercial services when transactions pertaining to income,transfers or official transactions are registered in the private servicecategories.
The implementation of BPM5 will result in an improvement ofcountry comparability over time. However, given that theseimprovements are being made gradually, they also result in anumber of breaks in series. The borderline between goods andservices, as well as the borderlines between the components ofcommercial services differ in BPM4 and BPM5. Examples of suchdifferences are :
(i) most processing transactions are included under goodson a gross basis in BPM5, while in BPM4 only the valueof the fees paid for processing are included in services ;N
otes
tech
niqu
es

213
(ii) goods procured in ports, such as fuels and provisions,are included in goods in BPM5, and in services(transport) in BPM4 ;
(iii) in BPM4, insurance services are normally measured bythe net premiums defined as premiums less claims, whilein BPM5, insurance services reflects the « normal »service charge, i.e. administrative services and part of theearnings ; the rest of the net premiums or the actual riskpremiums is recorded under current transfers or in thefinancial account in case of life insurance ; in addition,freight insurance is part of transport in BPM4, and partof insurance services in BPM5 ; and
(iv) the expenditure of seasonal and border workers isincluded in labour income in BPM4, and in travel inBPM5.
II.3 Other definitions and methods
1. Annual changesThroughout this report, average annual percentage changes are
analogous to compound interest rates. In calculating the averageannual rate of change between 1990 and 1999, for example, datafor calendar year 1990 were taken as the beginning point, anddata for calendar year 1999 as the end point.
2. Commodity prices Commodity price movements are primarily described by
indices largely based on spot market prices, and thereforeexclude transactions governed by longer-term contracts. Priceindices for such commodities as food, beverages, agricultural rawmaterials, minerals, non-ferrous metals, fertilizers and crudepetroleum are obtained from IMF International FinancialStatistics. Aggregates for all primary commodities and for non-fuel primary commodities are calculated using IMF weights.
3. Merchandise trade volume and unit value indicesThe volume and unit value indices are taken from a range of
different international and national sources. The reported volumeand unit value indices may not always be available for the mostrecent years or may differ in product coverage from thecorresponding value indices. For example, the indices reported byFrance exclude electricity, military and railway equipment,electronics, analysing and controlling instruments, shipbuildingand aeronautics, and machine tools. Switzerland excludesjewellery, antiques, and precious metals from its indices.
Aggregation of the indices to obtain a world total is a two-tier process. First, export and import unit values are adjusted tothe extent possible for differences in coverage and, in cases ofmissing data, completed with Secretariat estimates. They are thenaggregated to obtain regional totals. The volume index for eachregion is obtained by dividing the respective trade value indexfor each region by the corresponding regional unit value index.
Second, to obtain the total world merchandise volume index,regional unit value indices are aggregated and the world tradevalue is deflated by the world unit value index. Throughout theaggregation process trade values of the previous year are usedas weights.
4. World productionProduction of agriculture, mining and manufacturing is
defined according to major Divisions 1, 2 and 3 of theInternational Standard Industrial Classification (ISIC). Worldproduction in these sectors is estimated by combining productionindices published by the FAO, IMF, OECD, UNIDO and UNSD. Theworld index is derived through aggregation of the three sectorsby using value added shares in 1990 as weights.
5. World gross domestic productWorld GDP growth is estimated as a weighted average of
economies’ real GDP growth. The weights used are shares ofeconomies in 1990 world nominal GDP converted to dollars atmarket exchange rates.
The use of official exchange rates which are not market-basedfor some major economies, together with the fluctuations of theUnited States dollar vis-à-vis major currencies can have asignificant impact on the weighting pattern. The increasing useof weights based on purchasing power parities (PPP) by otherinternational organizations is meant to attenuate « anomalies »linked to these factors. In a period of widely diverging growthrates among countries and regions, the choice of the weightingpattern can have a marked influence on the global growthestimate. For the 1990-99 period, global growth estimates basedon PPP-weights indicate a significantly faster growth thanestimates using weights based on GDP data measured at marketexchange rates. This is because of differences in the twoweighting patterns. Relative to weights based on GDP at marketexchange rates, PPP weights are low for the transition economies- especially the successor States of the former USSR with a poorgrowth record, and high for major developing countries (inparticular China) with above average growth.
6. Re-exportsUnder the system of general trade adopted in this report, re-
exports are included in total merchandise trade (see Section II.1).However, in the case of Hong Kong, China, the magnitude of itsre-exports (amounting in 1999 to $152 billion), if included inregional or world aggregates, would adversely affect theanalytical value of the statistics by introducing a significantelement of double counting. Therefore, Hong Kong, China’s re-exports are excluded from the world and from Asia aggregates(unless otherwise indicated) ; only Hong Kong, China’s domesticexports and retained imports are included in the totals. For thisreason, the figures for world exports and for exports of Asiashown in Appendix tables A2 and A7 are smaller than those inAppendix table A3. Since retained imports cannot be identifiedfrom imports directly, an approximation is derived by subtractingthe value of re-exports from the value of imports. The resultingfigure will, however, under-estimate the value of retained importsby the amount of the re-export margin.
III. Breaks in data continuity
1. Merchandise trade statistics of the European Union
The introduction of a new system for collecting statistics ontrade between the member States of the EU in January 1993 –INTRASTAT – which was briefly described in the GATT annualreport 1994, International Trade Trends and Statistics, hasaffected EU merchandise trade statistics in a number of ways.The system has resulted in the loss of continuity with pre-1993trade figures. Difficulties in implementing the new system haveresulted in reporting delays and numerous revisions in thefigures. More generally, the EU intra-trade statistics collectedthrough INTRASTAT are markedly less accurate than statisticscollected under the previous system.
The coverage of the current system, which relies on reportssubmitted by firms for transactions above a minimum value, isnot as wide as the previous one, which was based on customsdeclarations. Estimates for non-response and exemptions fromreporting obligations are made by the statistical authorities ofsome member States but these estimates cannot always be N
otes
tech
niqu
es
214
broken down by product, and they most probably under-recordthe actual trade flows, so that continuity with pre-1993 figureshas been lost. In some cases, as well, estimates of under-reporting have not been included in submissions to the UnitedNations Statistical Division for inclusion in the Comtradedatabase, which has also contributed to a marked disruption inthe continuity of the Secretariat’s traditional data source.
Prior to the adoption of the current system, reported intra-EUimports (c.i.f.) closely matched reported intra-EU exports (f.o.b.).From 1993, however, the reported value of intra-EU imports hasbeen on average around 5 per cent below the value of intra-EUexports, indicating a substantial under-reporting of intra-EUimports. Given the significance of this inconsistency, theSecretariat has used intra-EU export data to adjust for the under-reporting of intra-EU imports. However, this adjustment could notbe allocated between EU member countries. As a result, the sumof reported imports of individual EU members does not add tothe figure for EU imports as a whole (see, for example, AppendixTable A4). This adjustment is also reflected in the volumeestimates for the EU as a whole.
Due to reporting delays to UNSD, the latest merchandisetrade statistics for all EU member States were not available atthe time the world trade network by region and product wasprepared. As a result, the Secretariat has had to partly estimatethe 1999 product breakdown of the EU.
The EU accounts for some 40 per cent of world merchandisetrade. It is also the major market for the exports of Africa, theMiddle East and the CIS – all regions for which detailed tradestatistics are scarce. EU trade statistics, both for EU membercountries and for trade with these partner countries, thereforeplay a key rôle in global trade statistics and are of particularimportance in the construction of the world trade network byregion and product. Reporting delays and the decline in thereliability of EU intra-trade statistics have resulted in an increasein the margin of error in the Secretariat’s trade estimates.
Due to a change in the definition of the statistical territory,the merchandise trade statistics of France include trade of FrenchGuiana, Guadeloupe, Martinique and Reunion beginning with1996.
2. Merchandise trade of Central and Eastern Europe,the Baltic States and the CIS
Beginning in 1990, trade data for Bulgaria and the formerUSSR were converted into dollars at official, market-orientedexchange rates, replacing the earlier practice of using implicitconversion factors. This created breaks in continuity in thecorresponding time series between 1989 and 1990. Valuationproblems are discussed in more detail in Box 1 in Volume I ofInternational Trade 1990-91 and in Box 2 in Volume I ofInternational Trade 1989-90.
Figures for the Czech Republic and the Slovak Republicinclude trade between these two countries. As regards the BalticStates and the CIS, trade figures cover their mutual exchangesstarting with 1996. Total merchandise exchanges among thesecountries amounted to some $44 billion in 1997, $36 billion in1998, and $28 billion in 1999. The inclusion of the mutual tradehas therefore resulted in substantial breaks in the continuity ofthe trade series at the country and regional levels between 1995and 1996.
The political and economic upheavals in the region causeddisruptions in statistical reporting systems. Although somecountries improved or adapted their systems, detailed tradestatistics are still not available for many country/periods (exceptfor the Russian Federation). As a result, the Secretariat hasestimated their trade largely on the basis of the statistics of theirtrading partners.
The implementation of internationally agreed concepts anddefinitions for collecting merchandise trade statistics will result inan improvement of country comparability over time. However,given that these improvements are being made gradually, theyalso result in a number of breaks in series. Breaks in thecontinuity in the trade figures were identified for the followingcountries : for the Czech Republic between 1992 and 1993, andfor Hungary between 1995 and 1996 due to the inclusion ofshipments through processing zones ; for Lithuania between1994 and 1995 due to the change from the special to thegeneral system of trade ; for Ukraine between 1994 and 1995due to a change in data collection procedures and the inclusionof shipments through processing zones ; for the Slovak Republicbetween 1996 and 1997 and for Poland between 1997 and1998 due to the introduction of new arrangements in customsprocedures to harmonize with the standards of the EuropeanUnion.
Considerable uncertainty remains about the accuracy of theforeign trade statistics of the Russian Federation, especially asregards imports. A large proportion of the reported data onimports consists of official estimates of inflows of goods whichenter the country without being registered by the customsauthorities. Such adjustments to import data accounted for 28,26 and 27 per cent of the officially reported totals in 1997,1998, and 1999 respectively ; on the export side, suchadjustments accounted for about 4 per cent in all three years.
IV. Statistical sources
Most frequently used sources for statistics are :EUROSTAT, External and Intra-European Union TradeFAO, Production YearbookFAO, Trade YearbookIMF, Balance of Payments StatisticsIMF, International Financial StatisticsOECD, Main Economic IndicatorsOECD, National AccountsOECD, Monthly Statistics of Foreign TradeOECD/IEA, Energy Prices & TaxesUNECE, Economic Survey of EuropeUNIDO, National Accounts Statistics DatabaseUNSD, Comtrade databaseUNSD, International Trade Statistics YearbookUNSD, Monthly Bulletin of StatisticsWorld Bank, World Development IndicatorsWorld Bank, World TablesThese sources are supplemented by national publications and
Secretariat estimates.The merchandise trade statistics in this report are largely
derived from two sources. Figures for total merchandise trade arederived from IMF, International Financial Statistics. Data onmerchandise trade by origin, destination and product comemainly from the UNSD Comtrade database. Some inconsistenciesin the aggregate export and import data for the same country orterritory between the two sources are inevitable. These can beattributed to the use of different systems of recording trade, tothe way in which IMF and UNSD have converted data expressedin national currencies into dollars, and revisions which can bemore readily incorporated in the IMF data.
Statistics on trade in commercial services are mainly drawnfrom the IMF Balance of Payments Statistics, and supplementedby national publications for countries that do not report to theIMF.N
otes
tech
niqu
es

215
Acknowledgements are due to the Food and AgricultureOrganization, the International Monetary Fund, the Organisationfor Economic Cooperation and Development, the Statistical Officeof the European Communities, the United Nations EconomicCommission for Europe, the United Nations Statistics Division, the
United Nations Industrial Development Organization and theWorld Bank whose assistance in supplying advance copies of theirpublications as well as other information has greatly facilitatedthe work of the Secretariat. Acknowledgements are also due tonational institutions for providing advance statistics.
Not
es te
chni
ques