wunderlich, kaufman, and smith - university of …rlsmith/predict for decent.pdf · wunderlich,...
TRANSCRIPT

Wunderlich, Kaufman, and Smith
1
LINK TRAVEL TIME PREDICTION FORDECENTRALIZED ROUTE GUIDANCE ARCHITECTURES*
Karl E. WunderlichMitretek Systems, Inc.
600 Maryland Avenue, SW, Suite 755Washington, DC 20024
Tel: (202) 488-5707 Fax: (202) 863-2988kwunder l@mi t re tek .o rg
David E. KaufmanAT&T Laboratories
379 Campus Drive, Room 2B19Somerset, NJ 08873
Tel: (732) 271-7470 Fax: (732) 563-7753dekaufman@att .com
Robert L. SmithUniversity of Michigan
Department of Industrial and Operations EngineeringAnn Arbor, MI 48109
Tel: (313) 763-2060 Fax: (313) 764-3451r l smi th@umich .edu
A b s t r a c tA critical problem in decentralized route guidance is tocommunicate anticipated congestion to individual drivers in such away that the routes chosen are likely to be consistent with theforecast. We propose a prediction technique for decentralizedroute guidance architectures to identify time-dependent link traveltimes which when communicated to drivers leads to time-dependentfastest paths consistent with this forecast. The fixed point propertyof the forecast is assured by an iterative process of trafficsimulations followed by dynamic route determinations until theroutes and hence the resulting dynamic link times become stable.The resulting routes yield an inherently accurate forecast ofcongestion as well as being user-optimal by construction. A novelback-dating process is utilized to insure the discovery of a stable

Wunderlich, Kaufman, and Smith
2
routing after a finite and usually small number of iterations. Anempirical case study based on the roadway network in Troy,Michigan is included.
* This research was supported in part by the University of Michigan ITS Research Centerof Excellen

Wunderlich, Kaufman, and Smith
3
1. Introduction.
The architecture of route guidance provision in ITS can be divided into two categories: a
decentralized architecture, where the route selection function is located in-vehicle (or on-
passenger, in the delivery of multi-modal route guidance); and a centralized architecture,
where the route selection function is performed at some central site by an Independent
Service Provider (ISP). These distinctions and the likely strengths and weaknesses of each
architecture have been addressed by researchers in precursor ITS architecture studies [1,2,3]
as well as documented in the National ITS Architecture [4,5].
Figure 1, adapted from the National ITS architecture document: Theory of Operations [6],
illustrates sample concepts of route guidance architecture, both decentralized and
centralized. In the Autonomous form of decentralized architecture, all route guidance
functionality is in-vehicle. Here route guidance is relegated to primarily static route
guidance applications, since there is no mechanism to systematically update the map
database with current link travel times.
In the Decentralized Dynamic architecture, link-travel times are broadcast to vehicles to
provide real-time estimates of network congestion. This one-way communications link
supports dynamic route selection in-vehicle by performing map-matching with the data
stream from an ISP. The ISP does not directly track route requests or location/destination
information from its clients. In the Centralized architecture, the ISP moves from the
broadcast of link travel times to the provision of detailed, individualized routes to its clients.
In-vehicle functionality is reduced to simple route display, but the vehicle gains the
capability to communicate location and desired destination to the ISP.
Each of these approaches are in compliance with the National ITS Architecture, and no
single approach is favored overall by national policy. However, the National ITS
Architecture does project a gradual progression over time from Autonomous to
Decentralized to Centralized route guidance provision [7]. Autonomous architectures are
replaced with Decentralized architectures as dynamic route guidance develops as a viable
service. Centralized architectures are projected to replace Decentralized architectures in
mature route guidance markets with high market penetration. This second step in the
progression over time is projected because of instability in the allocation of alternative
routes using a dynamic decentralized route guidance architecture. The decentralized feature

Wunderlich, Kaufman, and Smith
4
of generalized link travel time forecasts broadcast to an uncertain number of guided vehicles
precludes detailed, individualized route assignment. Therefore, route assignment techniques
developed for decentralized architecture are typically characterized by all-or-nothing
assignments. At high market penetrations, this may result in highly inefficient routing – too
many vehicles following the same path at the same time.
Allocation of routes under high market penetration is projected to be more stable under a
centralized architecture because the route guidance service provider can control more
precisely the number of vehicles routed onto a specific route. Research in the area of
dynamic traffic assignment suggests that predictive centralized strategies can effectively
counter instability at high market penetrations. Lee [8], and others [9] have dealt with
instability at high market penetration by employing multi-path routing strategies. These
multi-path routing strategies are associated with centralized route guidance architectures
because they rely on precise control of individual vehicle routing. In some cases, arbitrary
fractions of vehicle streams are routed, resulting in assignments of fractional vehicles to
individual paths.
This paper argues that this second evolutionary step, from Decentralized to Centralized, may
not be necessary for efficient predictive route guidance at high market penetrations. A
variant of the Decentralized architecture, Predictive Decentralized Route Guidance, is
proposed that includes a link travel time prediction function at the ISP (Figure 2). Route
requests from the vehicle to the ISP are optional. Such an architecture may be particularly
appealing to consumers who desire strict privacy about travel habits.
One example of a predictive approach consistent with a decentralized architecture is the
Simulation of Anticipatory Vehicle Network Traffic (SAVaNT) developed at the University
of Michigan [10, 11, 12]. This paper proposes a modified version of the SAVaNT travel
time prediction based on a heuristic search technique that mitigates a number of the
pathologies associated with decentralized, all-or-nothing route guidance provision at high
market penetrations.
First an overview of the SAVaNT method is presented in Section 2. Section 3 provides
details of the link travel time prediction method in SAVaNT, while Section 4 discusses the
observed pathologies associated with the technique at high market penetrations (failure to
converge and sub-optimal routing). Section 5 demonstrates a technique, “backdating”, to
adjust predicted link travel times to make them inherently more accurate. However, this

Wunderlich, Kaufman, and Smith
5
backdating technique can also be demonstrated to exacerbate the problem of divergence
where the exact number of vehicles taking a particular route cannot be determined (as is the
case with decentralized route guidance). Section 6 discusses the relationship between link
travel time accuracy and the uncertainty surrounding the number of vehicles impacted by
route guidance with respect to the issue of divergence in SAVaNT. Section 7 proposes a
heuristic search technique to find the most efficient, convergent amount of adjustment to
predicted link travel times. Results from a simulated test network based on portions of the
Troy, Michigan arterial network demonstrate the effectiveness of the improved prediction
technique when compared to both the SAVaNT method and non-predictive dynamic route
guidance. Section 8 presents some conclusions and extensions based on this work.
2. Link Travel Time Prediction and Anticipatory Route Guidance
Anticipatory route guidance can be defined as paths calculated from a set of predicted future
link travel times, which when disseminated to drivers cause the same set of predicted link
travel times to be realized by vehicles in the network. Thus the paths distributed as route
guidance were based on a correct assumption about future congestion conditions on the
network, corresponding to a user-optimal equilibrium condition. Chen and Underwood
[13] provide a overview of anticipatory route guidance and its implementation. Initial
applications of SAVaNT [10, 11, 12] demonstrated that anticipatory route guidance
computed by the SAVaNT method can be employed effectively in large-scale application
under low (<30%) market penetration rates. Predictive route guidance at these levels was
found to be superior to non-predictive route guidance methods. At market penetrations
above 30%, however, SAVaNT sometimes produced less efficient routings than non-
predictive methods and sometimes produced no solution at all. Clearly, new ATIS
consumers are unlikely to subscribe to a SAVaNT-based decentralized guidance service as
market penetrations approach 30%. Indeed, even if higher market penetrations were
realized, drivers of guided vehicles would be unlikely to trust or comply with the routes
calculated in-vehicle using SAVaNT-generated predictions of link travel times.
The SAVaNT concept is illustrated in Figure 3. Combining a time-dependent fastest-path
calculation, R, with a traffic simulation, A, in an iterative manner, we can identify a routing
policy, π, as a "fixed point" if in consecutive iterations, the dynamic link travel time profiles,
C, are identical, i.e., a stable set of predicted dynamic link travel times has been identified.
The link travel time profile comprises links travel times for all links and time periods over
Wunderlich, Kaufman, and Smith
6
the horizon of time we are trying to predict. Because we restrict our attention in this paper
to “all-or-nothing” policies (i.e., giving the same route to all vehicles having common
location and destination at a given time), the set of possible policies is finite. Thus, if
execution of SAVaNT does not result in a fixed point, the result must be the generation of a
repeating sequence of policies, π1 , π2 , π1 , π2 , π1 , π2 ,L , rather than convergence to a fixed
point. We call this situation cycling. The mechanics of the fastest path calculations are
discussed in [14]. For an investigation of this issue under multipath (as opposed to all-or-
nothing) routing, see [15].
SAVaNT uses a version of the INTEGRATION traffic simulation [16] for link-time
prediction, INTEGRATION-UM. The INTEGRATION model was originally developed
by Michel Van Aerde at Queen’s University (Canada) and modified by researchers at the
University of Michigan. INTEGRATION-UM retains the basic scope and modeling
approach of the model: a strongly deterministic mesoscopic approach employing
macroscopic travel-time and flow relationships and microscopic individual vehicle control
and link queuing. INTEGRATION allows the user to vary the fraction of vehicles on the
network receiving route guidance. Non-equipped (background) vehicles are routed
according to a static fastest-path route.
3. Accuracy of Predicted Link Travel Times in SAVaNT.
As observed in [10], there is an inherent inaccuracy introduced into SAVaNT by a
difference in the way the simulation produces predicted time-dependent travel times and
interpretation of that data by the routing module. Note that we impose a discrete-time lattice
on the solution horizon, H, over which we predict link travel times. Let ∆t be the number of
seconds in each time slice, and let t;t = 1,2KH correspond the t th time slice in the horizon.
Let cl t( ) be defined as the predicted link travel time for link l during time-slice t .
Consider the problem of constructing a link travel time profile C = cl t( ): ∀ l,t{ } . As
shown in Figure 4, the simulation reports experienced link travel times when vehicles finish
traversing links. Let cli t( ) represent the travel time reported by the vehicle making the i th
departure from link l during time-slice t . Let τ li t( ) be the simulation clock time when
cli t( ) is reported. In the version of SAVaNT employed in [10], cl t( ) is updated each time a

Wunderlich, Kaufman, and Smith
7
departure occurs according to an exponential smoothing function,
cl(t) = α cl(t) + 1 − α( )cli t( ), where α = 0.4.
The dynamic router interprets cl t( ) as the expected average travel time required to traverse
link l for vehicles which begin travel on link l during time slice t . But the value of cl t( ) is
computed based on vehicle reports made by vehicles finishing travel on the link during time
slice t . As illustrated in Figure 5, when a link departure reports a travel time for a link, it is
more precisely giving an estimate of vehicle travel time which begins earlier, at τ li t( ) − cl
i t( ) .
Note that reducing the length of each time slice ∆t does not correct for this particular kind
of error. Thus our estimating procedure is inherently inaccurate, but as we will see, this
inaccuracy is a crucial factor in the convergence of the SAVaNT iterative process.
4. Benefit Reduction Related to Inaccuracy in Link Time Prediction.
As stated above, routing policies are generated in SAVaNT by interpreting cl t( ) as the
expected average travel time for vehicles beginning travel on link l during time slice t . This
inaccuracy has the effect of causing a lag in the feedback control of vehicles under route
guidance.
For example, if travel time is dynamically rising on a particular path, there will be a lag in
accurate reporting of that change in that path time equal to the maximum individual link
travel time in the path. Consider the situation where, based on perfect information in the
system, a path currently identified by the route as optimal becomes congested and an
alternative path becomes more attractive. In the next iteration, then, vehicles currently on this
path cannot be re-directed to the alternate path until the router sees reports of travel times in
the constructed travel time profiles. These profiles contain the time lag associated with link-
departure travel time estimates, and thus the router misdirects vehicles for the duration of
that time lag. Vehicles on our initially optimal path will be erroneously routed on what will
be experienced as a slower path but which appears from the predicted travel time profile as
the fastest path. This inaccuracy cannot be corrected in an future iteration of SAVaNT,
since the travel time profile generated on all paths will be constructed with identical lag time.
Thus, the inaccuracy is carried forward from iteration to iteration, and cannot be corrected
within the current SAVaNT concept.

Wunderlich, Kaufman, and Smith
8
Hence, a fixed point in SAVaNT corresponds to a routing policy that is consistent with the
reproduced travel time profile, a travel time profile which necessarily contains some
inaccurate information. Thus the routings identified by SAVaNT are the minimum travel
time paths with respect to a predicted travel time profile, but not necessarily consistent with
experienced travel time.
This inaccuracy can be compared to the nature of the inaccuracy encountered in routing
vehicles in a non-predictive manner. These methods provide a fastest-path routing policy
based on the assumption that currently reported conditions persist indefinitely. The policies
generated are consistent with the expected (static) travel time profile, but not consistent with
experienced travel time.
The result of inaccurate link travel time prediction is a reduction in benefits to both the
traffic system as a whole and to the individuals receiving route guidance. Figure 6
illustrates the benefits seen in a 500-link, 200-node network of Troy, Michigan. Note that at
near 50 percent guided vehicles on the network, the performance of anticipatory vehicles
drops to the same level as the background (unguided) vehicles. At 80 percent, the guided
vehicles (assumed to follow fastest predicted paths) have longer trips on average than the
background vehicles, which would not be possible if their anticipatory fastest paths were
being computed from perfectly accurate link travel time forecasts. This difference, although
small, is statistically significant. As noted in [10], when SAVaNT was configured to correct
for this inaccuracy, the method always terminated with the construction of a cycle, rather
than a fixed point. We will discuss the nature of this phenomenon in more detail in section
5.
Wunderlich, Kaufman, and Smith
9
5. Improved Predictive Fixed Point Solutions
SAVaNT can be constructed to provide accurate predictive link times. The link travel time
estimated by link departures which occur in time slice t can be "backdated" to the time at
which travel on the link began, namely τ li t( ) − cl
i t( ) . There may be several link travel time
estimates for each time slice, so these values are averaged together to come up with a value
for cli ′t( ) where τ l
i t( ) − cli t( ) is contained in time slice ′t (the time slice in which travel on
the link began). These values of link travel time can be used in SAVaNT in the place of
values identified above in Section 2. However, such an implementation invariably results
with SAVaNT terminating in a cycle, even for market penetration levels which have fixed
points for SAVaNT implemented without backdating. This result is consistent with the
observation made Kaufman et al [15] that the existence of a fixed point in SAVaNT cannot
be guaranteed given the discontinuities inherent in all-or-nothing routing policies and
discrete-time traffic simulation.
The dilemma of SAVaNT can be summarized by the following: the inaccurate link time
forecasts cause the method to identify sub-optimal solutions for anticipatory route guidance,
yet only with the inaccuracy in link time forecasting will SAVaNT converge (albeit
inconsistently). However, we will show that it is possible to implement a heuristic based on
incrementally backdating travel time data that significantly improves the performance of
SAVaNT. Under this heuristic approach, SAVaNT is demonstrated to be reliably
convergent and to result in improved travel times for guided vehicles at all market
penetrations (even above 30%). While the heuristic cannot guarantee the identification of an
global optimal fixed point, it does offer a practical solution to the dilemma of SAVaNT and
can be viewed as a starting point from which further research on predictive guidance
algorithms can be conducted for decentralized route guidance architectures.
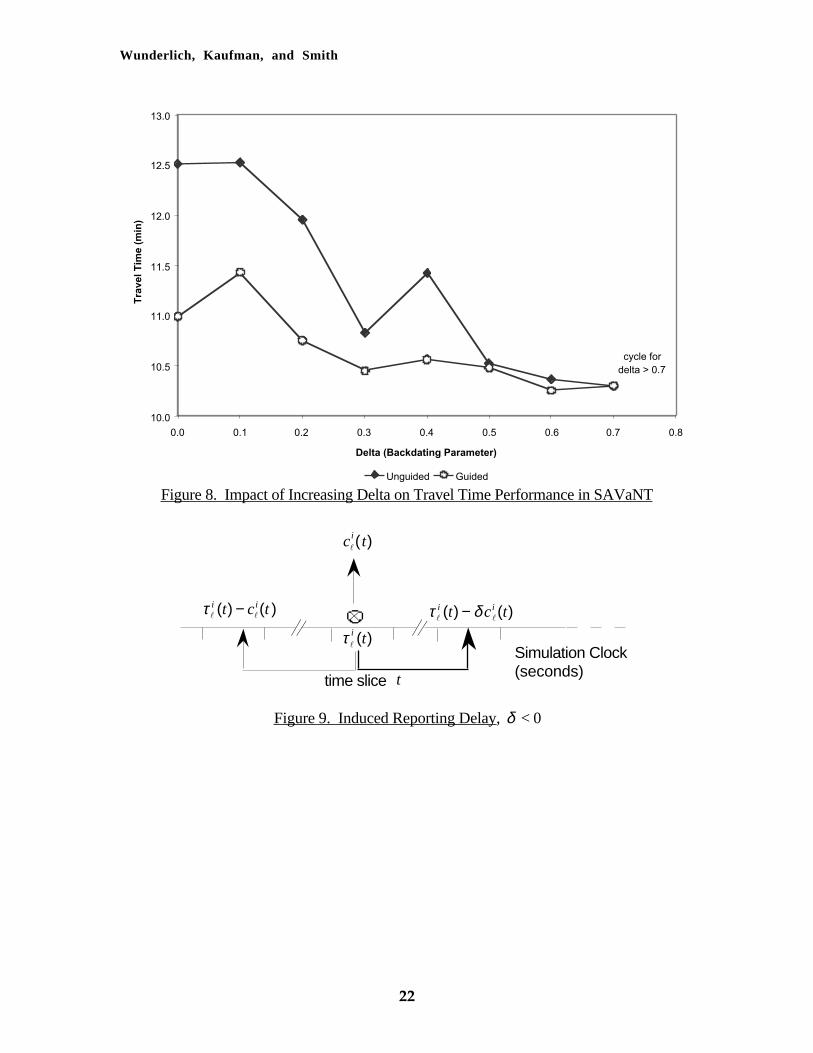
The heuristic tuning approach attempts to reduce the inaccuracy to the smallest amount
without causing a cycle to occur. This would allow for the maximum amount of benefit to
accrue to both the system and the guided vehicles without cycling. We define δ, 0 ≤ δ ≤ 1 ,
as the fractional amount of backdating implemented in SAVaNT. As illustrated in Figure 7,
as δ increases, the accuracy of the link time prediction scheme increases. When δ = 0 ,
SAVaNT is configured as in [10]. When δ = 1, SAVaNT is configured for accurate link
travel time prediction, but always diverges. By manipulating this fractional amount of
backdating, we alter both the accuracy of the link travel time forecast as well as the fraction
Wunderlich, Kaufman, and Smith
10
of vehicles impacted iteration-to-iteration by forecasts which include their own experience in
the previous iteration. The remainder of Section 5 deals with the impact of improved link
travel time accuracy. In Section 6, the issue of iteration-to-iteration forecasts are examined.
To test the behavior of SAVaNT with respect to δ , a corridor subnetwork (TroyCor) of the
Troy, Michigan network was constructed (20 links, 10 nodes). This network corresponds
to a pair of parallel, six-mile long arterial segments of John R and Dequindre Roads. The
two facilities are comparable, although Dequindre Road has slightly higher capacity and
higher speed limits. While both facilities have signals using fixed timings coordinated for
progression based on free-flow link travel times, there are significant delays at each of the
major signalized intersections. Accuracy in link-time prediction is especially important in
signalized corridors since the link travel time experienced can be strongly influenced by the
coordination of node arrival and the signal phasing. Links in this arterial network are 1 mile
or less in length. A network comprised of longer links (e.g., 10 miles) like those found in
highway networks would put an even larger premium on predicted travel times, because
current link reports would be 15 minutes or more out-of-date.
An experiment was performed on the TroyCor network using 50 percent guided and 50
percent unguided vehicles. The unguided vehicles were assumed to take the fastest free-
flow path, that is, the fastest expected path when the network is empty of vehicles
(Dequindre). Over 2500 vehicles were introduced traveling southbound in the network over
a 30 minute period. This travel demand exceeds the capacity of either Dequindre or John R
alone but does not exceed the capacity of the two facilities in combination. The network
(Figure 10) was initially empty of vehicles. Therefore, the level of travel demand
necessitates efficient allocation of guided vehicles over time between the two facilities
taking into account predicted delay at each of the downstream signalized intersections.
Travel times were measured for all the vehicles generated in the 30 minute period in ten
second time slices. An initial travel time forecast corresponding to a 100 percent unguided
vehicle loading was used to seed each run of the test. At the tested congestion level, vehicles
experience between 4-6 minutes of delay on a trip of between 10.5-12.5 minutes.
Under no backdating, δ = 0 , a fixed point was identified using SAVaNT. The value of δwas then incremented by 0.1 to 0.7 until a cycle appeared at 0.8. A cycle also results when
δ = 0.75. The results are graphically illustrated in Figure 8. In comparison with the initial
SAVaNT fixed point, a 12 percent improvement in benefits was obtained for the system as a
whole, and travel time for guided vehicles improved by 6 percent. Note that for smaller

Wunderlich, Kaufman, and Smith
11
values of δ , guided vehicles have higher travel times than at larger values of δ but enjoy a
minute or more advantage over unguided vehicle travel time. As delta increases, the
improved accuracy of the travel time prediction allows guided vehicles to judiciously avoid
the most serious intermittent signal delays at points along both Dequindre and John R. The
result is reduced travel time for the guided vehicles as well reduced delay for unguided
vehicles (both because the queues are smaller without the guided vehicles and because
progression in the corridor is more likely to be maintained). When δ = 0.7, the travel times
of the two vehicle classes are nearly the same. Although an interesting result, as we will see
in Section 7, identical travel times for guided and unguided vehicles are not always obtained
with the largest possible values of δ .
The number of iterations to convergence trended upwards with an increasing level of
accuracy in the link time prediction method (Table 1). SAVaNT requires fewer iterations to
identify routing policies that remain relatively stable from time-slice to time-slice, and more
iterations when identifying highly time-variant policies. The increased link time accuracy
provides the router with the ability to implement new routing policies with a shorter time-lag
on control, and for the Troy Corridor model, translates this into more frequent switching
between identified fastest predicted paths.
For comparison, alternative routing schemes for guided vehicles were tested. A network of
100 percent unguided (fastest free-flow path) vehicles averaged 18.15 minutes to traverse
the corridor. Note that the use of fastest free-flow path in this case results in all the travel
demand attempting to use Dequindre Road and no travel demand on John R, so this value
should be considered a “worst-case” assignment and not representative of current
conditions on the two facilities. A more complex test was also conducted using a mix of 50
percent shortest free-flow path and 50 percent non-predictive guided vehicles (fastest path
based on current travel times). This test resulted in an average travel time of 10.99 minutes
for the guided vehicles, 11.23 for the unguided vehicles, and 11.11 for the system as a
whole. Note that the presence of signalization in TroyCor penalizes less accurate predictive
methods compared to non-predictive methods. When δ = 0 , SAVaNT returns a system
travel time of 11.52 minutes, compared with 11.11 for the test case using non-predictive
dynamic route guidance, an increase of 3.7 percent. However, when δ = 0.7 then system
travel time under SAVaNT is 7.3 percent smaller than the non-predictive method.
6. Resolution of Cycling Through Delayed Link-Time Estimation

Wunderlich, Kaufman, and Smith
12
The results described in section 4 suggest a method which is initialized with a convergent
solution in SAVaNT and then seeks the maximum value of δ where a convergent solution
may still be obtained. From another perspective, we might consider the complement of that
situation, namely when SAVaNT has terminated with a cycle, rather than a fixed point. We
might then incrementally decrease the value of δ until a convergent solution is obtained.
As indicated in Figure 9, δ is not necessarily bounded below at δ = 0 . The effects of
decreasing δ are qualitatively the same whether δ is positive or negative. The first effect is
that link travel times generated are inherently less accurate. The second effect is that
SAVaNT is made more likely to find a convergent solution.
For example, SAVaNT does not find a fixed point withδ = 0 in the Troy corridor model
when 80 percent of the traffic on the network are guided vehicles. However, when
δ = −0.2 , a fixed point is found resulting in a system travel time of 10.33 minutes. In
general, the higher the fraction of guided vehicles traversing the network, the smaller the
value of δ required to force convergence in SAVaNT.
If we consider the effect of travel time profiles in a sequence of iterations in SAVaNT, the
effect of a changing the value of δ becomes more clear. Consider the simple case where
δ = 1.0 and we have a single guided vehicle traversing the network. Let P1 be the fastest
volume-independent path in the simulation, with predicted freeflow travel time C P1( ). In the
simulation, a guided vehicle traverses the set of links L1:l ∈ P1 , and reports link travel times
which are higher than freeflow times (because of the presence of traffic). Let the difference
between these higher reported travel times and the predicted travel time be ∆C P1( ) . Assume
there exists some alternative path, P2 , which contains at least one link not contained in L1.
If C P1( ) < C P2( ) and C P2( ) < C P1( ) + ∆C P1( ), then a cycle must develop.
When δ <1.0 , however, the single vehicle in the example above cannot impact the same
route guidance decision in following iterations. But we may have many link departures
within a time slice, so the marginal cost impact of our routing decision is also dependent on
the number of vehicles getting the same next-link information. In this case, for virtually any
δ , the marginal cost of a particular assignment can potentially yield a cycle. When δdecreases, the marginal cost effects are pushed downstream in time, causing some guided

Wunderlich, Kaufman, and Smith
13
vehicles to remain on a suboptimal path due to the time lag in providing information about
predicted conditions. The remaining vehicles, making their routing decisions later and
hence unaffected by earlier routings despite the time lag, will be fewer in number and thus
have little effect on observed link travel times. Therefore they will be less likely to change
routes from one SAVaNT iteration to the next, making it easier to obtain a fixed point.
Within SAVaNT, for example, if route guidance for all vehicles remains constant for two
consecutive iterations through some intermediate period h , where h < H , our solution
horizon, then that partial routing policy will remain stable even if SAVaNT fails to converge.
In the case of a fixed point, stable routing forecasts are constructed with monotonically
increasing values of h until finally h = H .
7. A Convergent Approach for SAVaNT
Consider H , our solution horizon. If we set δ to be strongly negative ( δ large), then the
effect in SAVaNT would be to push the delay downstream in time past the solution horizon.
Thus, the simulated traffic would have no effect on the travel time forecasts generated in
SAVaNT. SAVaNT would only construct travel time forecasts based on the default link
time travel times (free flow) and converge immediately. A more precise proof of this claim
is stated below.
Claim: There exists some finite value of δ such that SAVaNT must converge.
Pf. Assume H finite. Let L be the set of links in any finite
network. Under the non-restrictive assumption that
cl t( ) > 0 ∀ l ∈ L, t = 1,2,LH , there exists some finite
δl t( ) ∋ δl t( ) cl t( ) < −H ∀ l ∈ L, t = 1,2,LH .
Let δ < δl t( ) ∀ l, t . Then δ is finite since every δl t( ) is finite.
If we set δl t( ) ≤ δ ∀ l ∈ L,t = 1,2,LH , the simulation module in
SAVaNT produces link travel time estimates
cl t( ) = cl0 ∀ l ∈ L, t = 1,2,LH , where cl
0 is the free-flow link
travel time of link l . In any two consecutive iterations of
SAVaNT, the travel time profiles

Wunderlich, Kaufman, and Smith
14
Cn = Cn−1 = cl0 ∀ l ∈ L, t = 1,2,LH . Since Cn = Cn−1 ,
SAVaNT has converged to a fixed point.
We may thus force convergence in SAVaNT by choosing a sufficiently small value of δ .
However, we seek a value of δ as close to 1.0 as possible to realize the highest link time
prediction accuracy and the resulting improvement in travel time savings. The extreme case
δ = δ corresponds to a prediction of free-flow travel times across the network for all time
slices, the least accurate depiction of a network which has nonzero travel demand. A
solution procedure exploiting a variable-δ accuracy method is outlined in Algorithm 1.
This approach was tested on the Troy corridor model with σ = 0.05. Note that we could
have started from δ = 1.00and monotonically decreased δ . These approaches are
equivalent if there exists δ* such that SAVaNT cycles for all δ > δ* and converges for all
δ < δ* . Such a condition is difficult to prove, but is empirically borne out in TroyCor.
Practically, very small values ofδ do not appear necessary for convergence. Convergence
thresholds for SAVaNT-CNV are presented in Table 2.
For TroyCor, δ is observed to be roughly -50.0. However, SAVaNT obtained stable results
with δ as high as 0.9, and no worse than -0.2 (implying the use of an induced reporting
delay as in Figure 9), operating at forecast accuracy far superior to the worst case δ . When
δ ≤ δ , the percentage of links reported at free-flow over the entire horizon is 100%,
whereas forδ in the stable range identified for TroyCor, there were no links reported at
free-flow over the entire horizon. In general, how small δ must be for SAVaNT to find a
stable forecast is likely a function of network geometry, the level of congestion, and market
penetration.
Fixed points were identified at all market penetration levels. Comparable evaluations were
made of both non-predictive route guidance and the version of SAVaNT applied in [10]. As
in the experiment from Section 4, link times are assumed to be distributed every 10 seconds
over a solution horizon of 30 minutes.
In terms of both system and guided vehicle performance, SAVaNT-CNV identified better
solutions than either non-predictive route guidance or the version of SAVaNT employed by
Kaufman et al. Figure 11 graphically illustrates the benefit of improved link time prediction

Wunderlich, Kaufman, and Smith
15
accuracy in SAVaNT. Under guidance from SAVaNT-CNV, equipped vehicles
experienced up to 9% percent faster travel times when non-predictive methods were
employed. SAVaNT-CNV also significantly outperformed the older version of SAVaNT.
Travel time savings were most pronounced as the percentage of guided vehicles ranged
between 40-90%. In all market penetration levels, SAVaNT-CNV returned faster travel
times for guided vehicles than either of the methods tested, although differences for some
lower market penetrations (<40%) were not statistically significant.
As indicated from Figure 12, SAVaNT-CNV also proved most effective in reducing
system travel time. Solutions for SAVaNT-CNV provided 1-9% improvements over the
solutions obtained by either of the other two competing methods. Note that the travel time
reduction for SAVaNT-CNV is not monotonically decreasing both because the forecasts are
not perfectly accurate, and because individual vehicles choose routes according to a user-
optimal criterion rather than a system-optimal criterion. Table 3 summarizes the results
obtained for each approach.
8. Conclusions and Future Work
This work demonstrates that an effective predictive route guidance can be supported within
the constraints of a decentralized architecture and all-or-nothing assignment. The poor
performance of previous computational approaches under the constraints of decentralized
architecture are shown to be mitigated by judicious adjustment in the accuracy of link travel
time profiles. As an example, a version of the SAVaNT anticipatory guidance method has
been configured to demonstrate this effect. The revised method, SAVaNT-CNV, configured
to produce the most accurate link travel time prediction possible before the onset of cycling,
improves over non-predictive route guidance, even in the scenarios most difficult for
predictive logic. This technique may prove useful to traveler information service providers
utilizing current-day decentralized architectures who wish to postpone or avoid conversion
to a centralized architecture or reconfiguration to support multi-path assignment.
SAVaNT may require additional iterations to find fixed points given a more accurate
method of link time prediction, however. The SAVaNT-CNV method can require the
identification of several fixed points or cycles, since we are applying SAVaNT with different
values of δ . In practice, this can be done in parallel, so SAVaNT-CNV can be implemented
in the same real-time application as SAVaNT.

Wunderlich, Kaufman, and Smith
16
Several issues remain to be addressed. A closer examination of anticipatory route guidance
should be considered in relation to more complex characterizations of driver behavior. In
this paper, we assume drivers of unguided vehicles follow fixed paths based on shortest
free-flow routes and do not divert or change behavior with respect to experienced delay.
Similarly, we assume drivers of guided vehicles follow the fastest paths calculated from the
predicted travel times. Other factors such as route complexity [17], driver familiarity, and
route scenery all play into traveler behavior. At this point, however, how one can predict
traveler behavior is not well understood, particularly in relation to traveler information.
Another potential research area is the effect of initial point selection. The selection of a
initial point which is "close" to the best solution will drastically speed the convergence of
SAVaNT. However, this must be weighed against the possibility that many fixed point
solutions may exist and that the selection of a fixed point may be critical in determining
which of those solutions is identified.
Finally, the impact of having δ vary with time and location in the network has not yet been
addressed. It may be possible to identify fixed points when link travel time prediction is
more accurate on some links and less accurate on others, yielding additional improvements
in system average and guided vehicle travel time.

Wunderlich, Kaufman, and Smith
17
REFERENCES
[1] Cheslow, M., Hatcher, S., McGurrin, M., and Mertig, A. Alternative IntelligentVehicle Highway Systems Architectures, Technical Report #92W48, The MITRECorporation, McLean, Virginia (1992).
[2] Cheslow, M., Hatcher, S., and Patel, V. An Initial Evaluation of AlternativeIntelligent Vehicle Highway Systems Architectures, Technical Report #92W63, TheMITRE Corporation, McLean, Virginia (1992).
[3] Cheslow, M., Hatcher, S., and Hsin, V. Communication, Storage, and ProcessingLoad Requirements of Alternative Intelligent Vehicle Highway SystemsArchitectures, Technical Report, #93W18, The MITRE Corporation, McLean,Virginia (1993).
[4] U.S. Department of Transportation, The National Intelligent TransportationSystems Architecture, Ver. 2.0, Washington, DC (1998).
[5] www.odet ics .com/i tsarch/
[6] U.S. Department of Transportation, Theory of Operations, National IntelligentTransportation Systems Architecture, Washington DC (1998).
[7] ibid, pp. 113-114.
[8] Lee, C.K., “A Multiple-Path Routing Strategy for Vehicle Route GuidanceSystems,” Transportation Research: C, Vol. 2, No. 3, pp.185-195 (1994).
[9] Jayakrishnan, R., H. Mahmassani, and Hu, T., “An Evaluation Tool for AdvancedTraffic Information and Management Systems in Urban Networks”, TransportationResearch: C, Vol., 2, No. 3, pp. 127-147 (1994).
[10] Kaufman, D.E., Smith, R.L, and Wunderlich, K.E. "An IterativeRouting/Assignment Method for Anticipatory Real-Time Route Guidance", SAEVehicle Navigation and Information Systems Conference Proceedings, P-253, 701-708 (1991).
[11] Wunderlich, K.E and Smith, R.L. "Large Scale Traffic Modeling for Route-Guidance Evaluation: A Case Study", University of Michigan IVHS ProgramTechnical Report #92-08, Ann Arbor, Michigan (1992).
[12] Wunderlich, K.E. and Smith, R.L. "Refinement and Calibration in the Troy CaseStudy Model for Anticipatory Route Guidance Evaluation", University of MichiganIVHS Program Technical Report #93-04, Ann Arbor, Michigan (1993).
[13] Chen, K., and Underwood, S., "Research on Anticipatory Route Guidance", SAEVehicle Navigation and Information Systems Conference Proceedings, P-253,pp.427-439 (1991).
[14] Kaufman, D.E. and Smith, R.L., "Fastest Paths in Time-Dependent Networks ForIntelligent Vehicle-Highway Systems Application", IVHS Journal, Vol. 1(1), pp.1-11 (1991).

Wunderlich, Kaufman, and Smith
18
[15] Kaufman, D.E., Smith, R.L., and Wunderlich, K.E. “User-Equilibrium Properties ofFixed Points in Iterative Dynamic Routing/Assignment Methods”, TransportationResearch, Part C, Vol. 6, No. 1, pp. 1-16 (1998).
[16] Van Aerde, M., Voss, J., and McKinnon, G. Integration Simulation Model User'sGuide, Version 1.1. Department of Civil Engineering, Queen's University,Kingston, Ontario, Canada (1989).
[17] Adler, J., Blue, V., Wu, T., “Assessing Network and Driver Benefits from Bi-Objective In-Vehicle Route Guidance,” Transportation Research Board 78th AnnualMeeting, Preprint CD-ROM, Washington, DC (1999).

Wunderlich, Kaufman, and Smith
19
In-Vehicle Route GuidanceMap DatabaseVehicle LocationRoute Selection
Route GuidanceMap DatabaseVehicle LocationRoute Selection
Route GuidanceAccept/Reject Path
DecentralizedAutonomousRoute Guidance
DecentralizedDynamicRoute Guidance
CentralizedPredictiveRoute Guidance
InformationServiceProvider(ISP)
Map DatabaseCurrent LinkTravel Times
Map DatabasePredictiveRoute Selection
LinkTravelTimes
SuggestedRoute
RouteRequest
Figure 1. Example Route Guidance Architectures
In-Vehicle Route GuidanceMap DatabaseVehicle LocationRoute Selection
DecentralizedPredictiveRoute Guidance
InformationServiceProvider(ISP)
Map DatabaseLink Travel TimePrediction
LinkTravelTimes
RouteRequest
(optional)
SAVaNT
Figure 2. Decentralized Predictive Route Guidance Architecture

Wunderlich, Kaufman, and Smith
20
Dynamic Router
SimulationComplete Routing Policy
Link Travel Time Profile
Fixed Point?
Link Travel Time Profile
NO YESStop
AR
C
π
C
Figure 3. The SAVaNT iterative method
time slice
Simulation Clock (seconds)
cl
2 (t) cl
1 (t) cl
3( t) cl
4 (t)
t
∆t
Figure 4. Link Departures Reporting Link Travel times during Time Slice t
Simulation Clock (seconds)
cl
i t( )
τl
i t( )
τ li t( ) − cl
i t( )
time slice t
Figure 5. Link Departures Accurately Predict Past Travel Times

Wunderlich, Kaufman, and Smith
21
8.6
8.8
9.0
9.2
9.4
9.6
9.8
0% 10% 20% 30% 40% 50% 60% 70% 80% 90% 100%
Percent Guided Vehicles
Tra
vel T
ime
(min
)
Unguided Guided
cycle @90%, 100%
Figure 6. SAVaNT Impact on Travel Time Performance by Market Penetration
Simulation Clock (seconds)
cl
i t( )
τl
i t( ) τ l
i t( ) − cl
i t( )
time slice t
τ l
i t( ) − δcl
i t( )
Figure 7. Fractional Backdating in SAVaNT
Wunderlich, Kaufman, and Smith
22
10.0
10.5
11.0
11.5
12.0
12.5
13.0
0.0 0.1 0.2 0.3 0.4 0.5 0.6 0.7 0.8
Delta (Backdating Parameter)
Tra
vel T
ime
(min
)
Unguided Guided
cycle for delta > 0.7
Figure 8. Impact of Increasing Delta on Travel Time Performance in SAVaNT
Simulation Clock (seconds)
cl
i t( )
τ l
i t( ) τ l
i t( ) − cli t( )
time slice t
τ li t( ) − δcl
i t( )
Figure 9. Induced Reporting Delay, δ < 0

Wunderlich, Kaufman, and Smith
23
Figure 10. The Troy Corridor Network: Subset of the Troy Model
6
7
8
9
10
11
12
10% 20% 30% 40% 50% 60% 70% 80% 90% 100%
Percent Guided Vehicles
Gu
ided
Veh
icle
Ave
rag
e T
rave
l Tim
e (m
in)
NP SAVaNT SAVaNT-CNV
Figure 11. Guided Vehicle Travel Time Performance

Wunderlich, Kaufman, and Smith
24
10
11
12
13
14
15
16
17
18
19
0% 10% 20% 30% 40% 50% 60% 70% 80% 90% 100%
Percent Guided Vehicles
Ave
rag
e S
yste
m T
rave
l Tim
e (m
in)
NP SAVaNT SAVaNT-CNV
Figure 12. System Travel Time Performance

Wunderlich, Kaufman, and Smith
25
Table 1 Number of Iterations to ConvergenceUnder Varying Predictive Accuracy
δ Iterations to Convergence
0.0 140.1 160.2 150.3 200.4 220.5 190.6 270.7 36
0.8+ CYCLE
Algorithm 1 SAVaNT-CNV Method
Step 1. Set δ = 0 and i = 1, and choose some small increment value, σ .Step 2. Run SAVaNT, producing Si , the result of the iterative process.
Step 3a. If Si is a cycle, set δ = δ − σ . Goto Step 4.
Step 3b. If Si is a fixed point, set δ = δ + σ . Goto Step 4.
Step 4. If Si ,Si−1 both cycles or both fixed points, set i = i +1.
Goto Step 2.
Otherwise, STOP.
Table 2 Convergence of SAVaNT-CNV
Pct. Guided Vehicles Maximum Convergent
Value of δ10% 0.9020% 0.7030% 0.7040% 0.8050% 0.7060% 0.0570% -0.1080% -0.2090% -0.20100% 0.05

Wunderlich, Kaufman, and Smith
26
Table 3 Summary of Travel Times Obtained in Troy Corridor Model
Average System Travel Time(min)
Improvement vs. NP
Mkt. Pen. N P SAVaNT SAVaNT-CNV SAVaNT SAVaNT-CNV0% 18.15 18.15 18.15 0.00% 0.00%
10% 15.36 15.28 14.95 0.52% 2.67%20% 13.25 13.45 12.72 -1.51% 4.00%30% 11.71 12.48 11.28 -6.58% 3.67%40% 11.04 11.99 10.44 -8.61% 5.43%50% 11.11 11.72 10.30 -5.49% 7.29%60% 11.13 11.51 11.01 -3.41% 1.08%70% 11.16 CYCLE 10.74 NA 3.76%80% 11.27 CYCLE 10.33 NA 8.34%90% 11.53 CYCLE 11.06 NA 4.08%100% 11.70 11.91 11.58 -1.79% 1.03%
Average Guided Vehicle TravelTime
Improvement vs. NP
Mkt. Pen. N P SAVaNT SAVaNT-CNV SAVaNT SAVaNT-CNV10% 6.75 6.70 6.68 0.74% 1.04%20% 7.72 7.95 7.63 -2.98% 1.17%30% 9.02 9.13 9.02 -1.22% 0.00%40% 10.40 10.06 9.99 3.27% 3.94%50% 10.99 10.95 10.3 0.36% 6.28%60% 11.23 11.27 10.95 -0.36% 2.49%70% 11.28 CYCLE 10.62 NA 5.85%80% 11.38 CYCLE 10.46 NA 8.08%90% 11.57 CYCLE 11.15 NA 3.63%100% 11.70 11.91 11.58 -1.79% 1.03%