malaysia
TRANSCRIPT
MalaysiaNon-Communicable Disease Profile
2011-04-25 1http://Infobase.who.int
Demographics
98.498.598.3
92.189.894.3
69.172.366.0
2008
2008
2005
Youth literacy rate (% of people ages 15-24)
Adult literacy rate (% of people ages 15 and above)
Secondary school enrollment (% gross)
Both SexesFemalesMalesEducation
Totle health expenditure (% of GDP) 2007 4.4 Original Source: World Health Organization National Health Account database (www.who.int/nha/en) supplemented by country data.
GNI per capita (atlas method, current US$) 2008 7,250 Original Source: World Bank national accounts data, and OECD National Accounts data files.
Economics
Physicians (per 1,000 people) 2002 0.71
Nurses and midwives (per 1,000 people) 2002 1.81
Hospital beds (per 1,000 people) 2007 1.76 Original Source: World Health Organization, OECD, supplemented by country data.
Health Services
Maternal mortality ratio (modeled estimate, per 100,000 live births)
2005 62 Original Source: Maternal Mortality: Estimates Developed by WHO, UNICEF, UNFPA and the World Bank.
Infant mortality rate (per 1,000 live births)
2008 5.9 Original Source: Inter-agency Group for Child Mortality Estimation (UNICEF, WHO, World Bank, UNPD, universities and research institutions).
Crude birth rate (per 1,000 people) 2008 20.4 Original Source: (1) United Nations Population Division. 2009. World Population Prospects: The 2008 Revision. New York, United Nations, Department of Economic and Social Affairs (advanced Excel tables), (2) Census reports and other statistical publications from national statistical offices, (3) Eurostat: Demographic Statistics, (4) Secretariat of the Pacific Community: Statistics and Demography Programme, and (5) U.S. Census Bureau: International Database.WDI Footnote: Source: UN WPP 2008
Maternal and Child
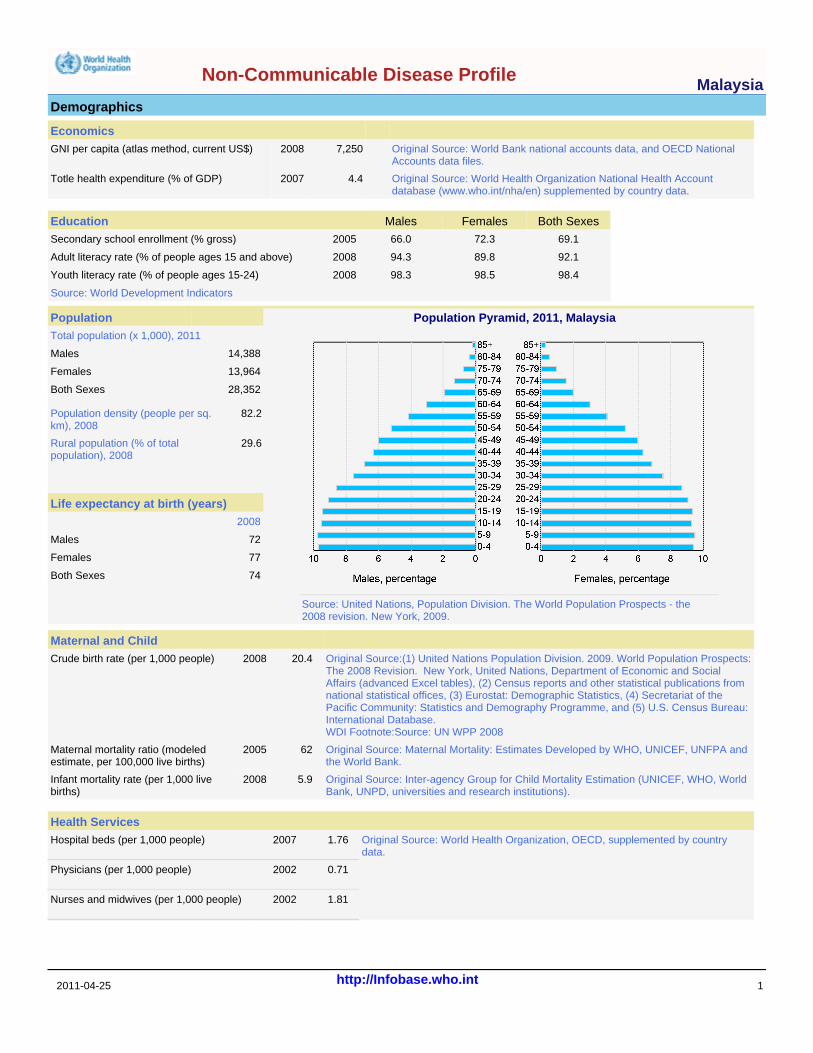
Population Pyramid, 2011, Malaysia
Source: United Nations, Population Division. The World Population Prospects - the 2008 revision. New York, 2009.
Both Sexes 74
Females 77
Males 72
Life expectancy at birth (years)2008
Rural population (% of total population), 2008
29.6
Population density (people per sq. km), 2008
82.2
Both Sexes 28,352
Females 13,964
Males 14,388
PopulationTotal population (x 1,000), 2011
Source: World Development Indicators
MalaysiaNon-Communicable Disease Profile
2011-04-25 2http://Infobase.who.int
Behavioural Risk Factors
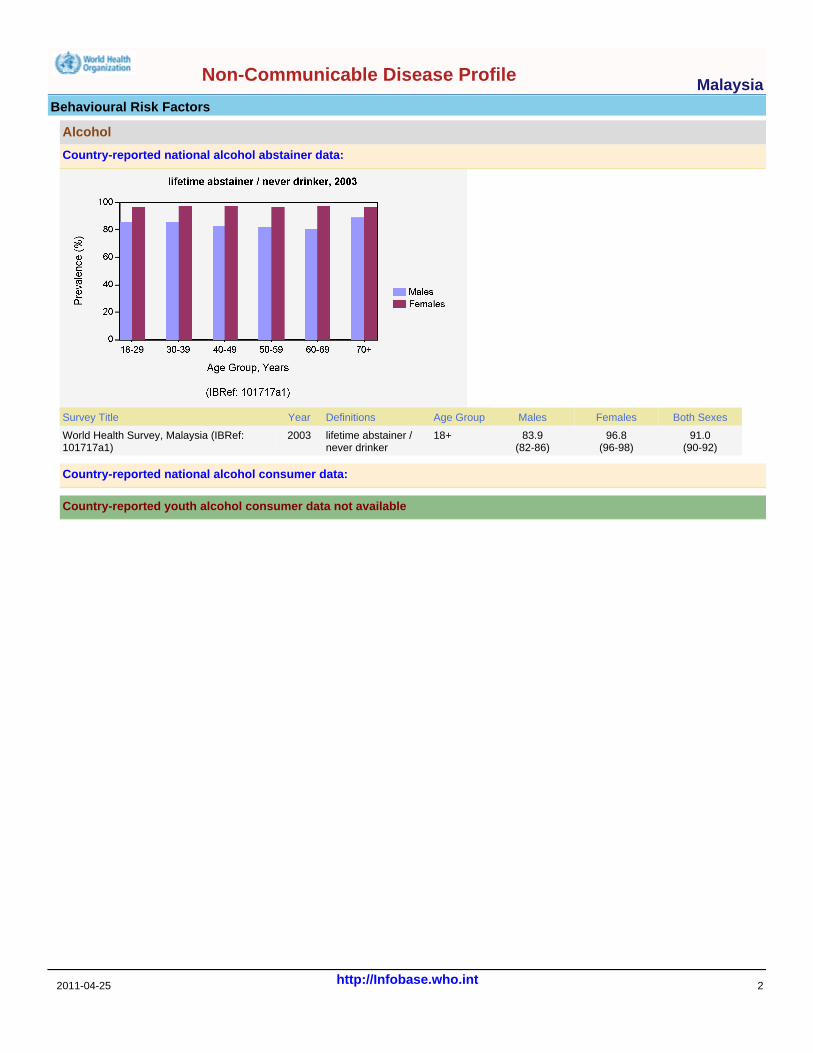
91.0 (90-92)
96.8 (96-98)
83.9 (82-86)
18+lifetime abstainer / never drinker
2003World Health Survey, Malaysia (IBRef: 101717a1)
Both SexesFemalesMalesSurvey Title Year Definitions Age Group
Country-reported national alcohol abstainer data:
Alcohol
Country-reported national alcohol consumer data:
Country-reported youth alcohol consumer data not available
MalaysiaNon-Communicable Disease Profile
2011-04-25 3http://Infobase.who.int
Behavioural Risk Factors
72.875.570.3Both urban & rural25-64Ó 5 fruit andvegetableservings per day
2006NCD Risk Factors in Malaysia (IBRef: 102705a1)
Both SexesFemalesMalesSurvey Title Year Definitions Age Group Urban/Rural
Country-reported national data:
Unhealthy Diet: Fruit and Vegetable Intake
Country-reported youth data not available
MalaysiaNon-Communicable Disease Profile
2011-04-25 4http://Infobase.who.int
Behavioural Risk Factors
60.165.155.4Both urban & rural25-64combined leisure time and work, inactive
2006NCD Risk Factors in Malaysia (IBRef: 102705a1)
Both SexesFemalesMalesSurvey Title Year Definitions Age Group Urban/Rural
Country-reported national data:
Physical Inactivity
Country-reported youth data not available
MalaysiaNon-Communicable Disease Profile
2011-04-25 5http://Infobase.who.int
Behavioural Risk Factors
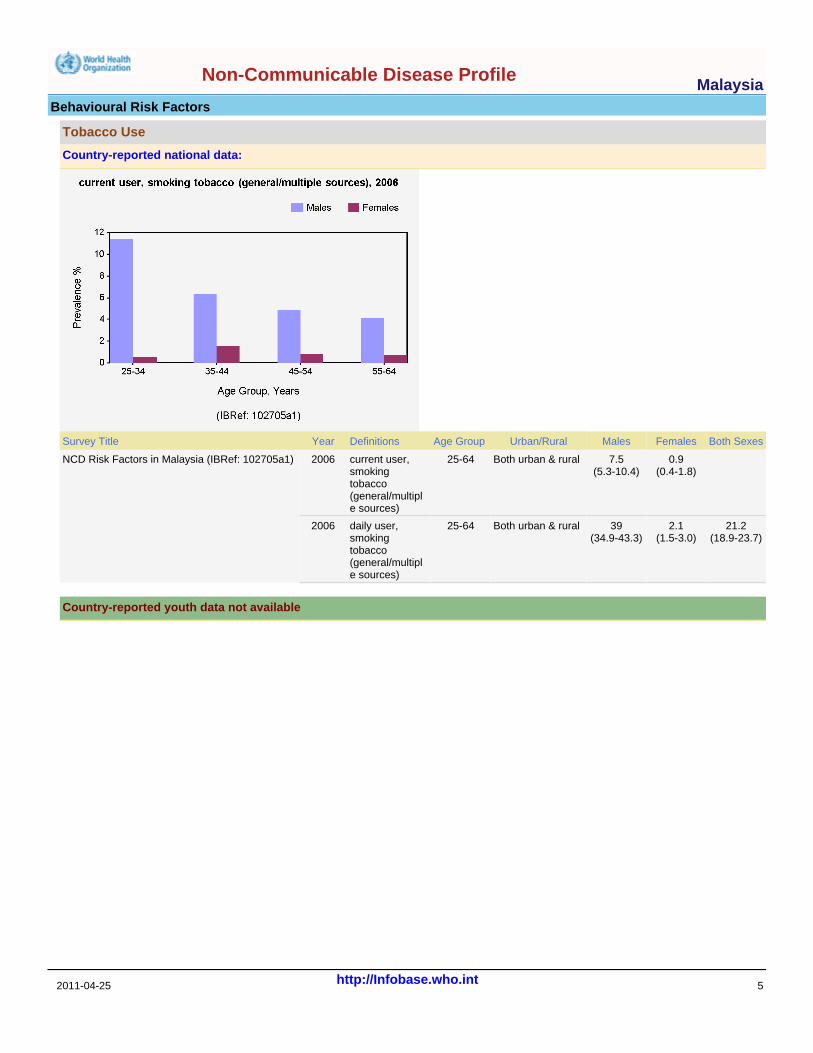
21.2 (18.9-23.7)
2.1 (1.5-3.0)
39 (34.9-43.3)
0.9 (0.4-1.8)
7.5 (5.3-10.4)
Both urban & rural
Both urban & rural
25-64
25-64
daily user, smoking tobacco (general/multiple sources)
current user, smoking tobacco (general/multiple sources)
2006
2006NCD Risk Factors in Malaysia (IBRef: 102705a1)
Both SexesFemalesMalesSurvey Title Year Definitions Age Group Urban/Rural
Country-reported national data:
Tobacco Use
Country-reported youth data not available
MalaysiaNon-Communicable Disease Profile
2011-04-25 6http://Infobase.who.int
Metabolic Risk Factors
Country-reported national data:
Raised Blood Pressure
MalaysiaNon-Communicable Disease Profile
2011-04-25 7http://Infobase.who.int
Metabolic Risk Factors
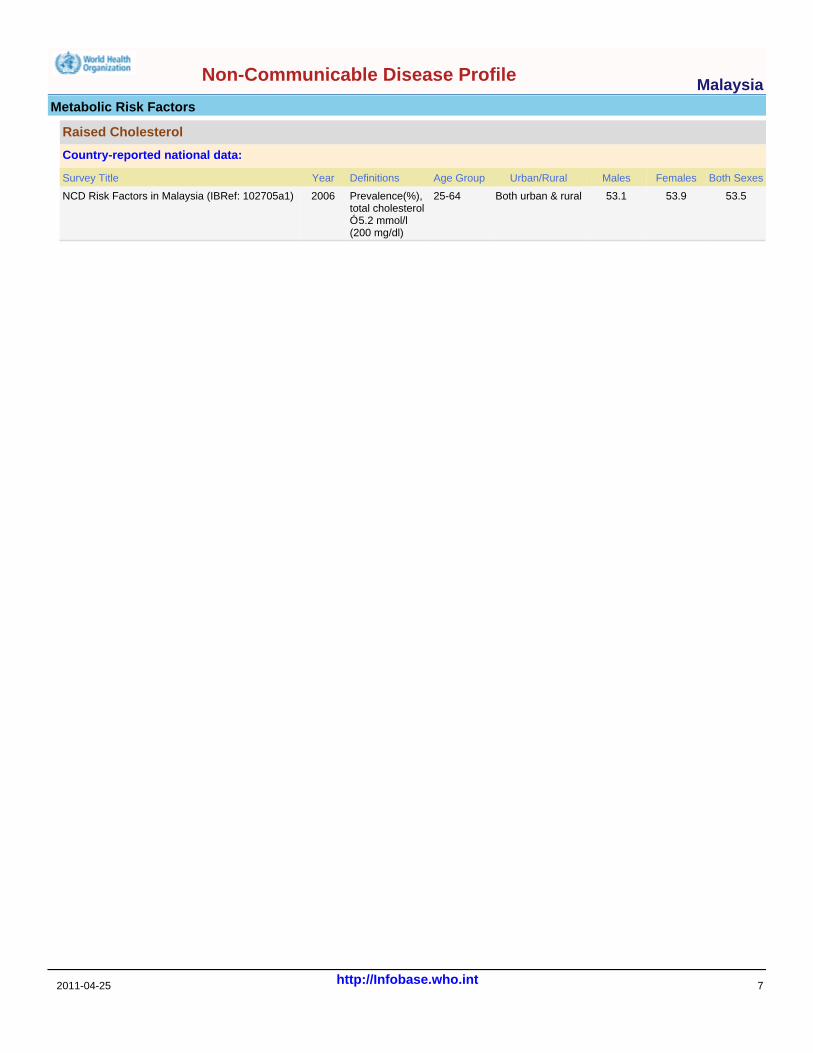
53.553.953.1Both urban & rural25-64Prevalence(%),total cholesterolÓ 5.2 mmol/l(200 mg/dl)
2006NCD Risk Factors in Malaysia (IBRef: 102705a1)
Both SexesFemalesMalesSurvey Title Year Definitions Age Group Urban/Rural
Country-reported national data:
Raised Cholesterol
MalaysiaNon-Communicable Disease Profile
2011-04-25 8http://Infobase.who.int
Metabolic Risk Factors
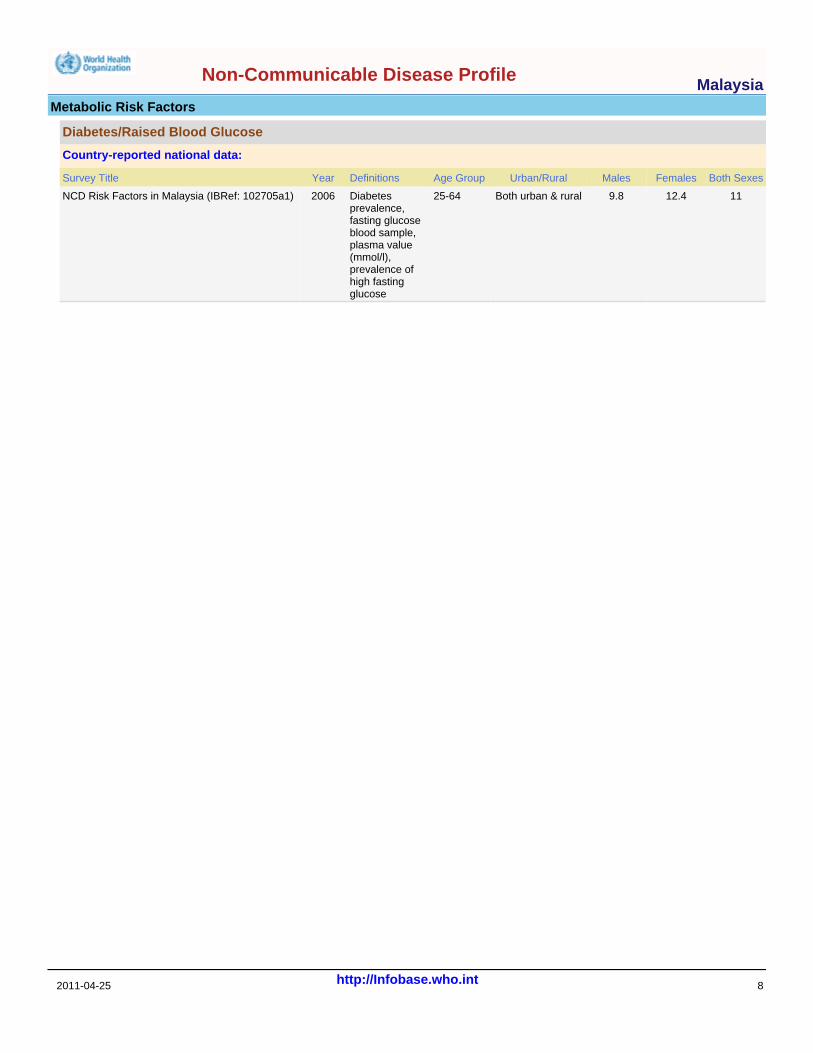
1112.49.8Both urban & rural25-64Diabetes prevalence, fasting glucose blood sample, plasma value (mmol/l), prevalence of high fasting glucose
2006NCD Risk Factors in Malaysia (IBRef: 102705a1)
Both SexesFemalesMalesSurvey Title Year Definitions Age Group Urban/Rural
Country-reported national data:
Diabetes/Raised Blood Glucose
MalaysiaNon-Communicable Disease Profile
2011-04-25 9http://Infobase.who.int
Metabolic Risk Factors
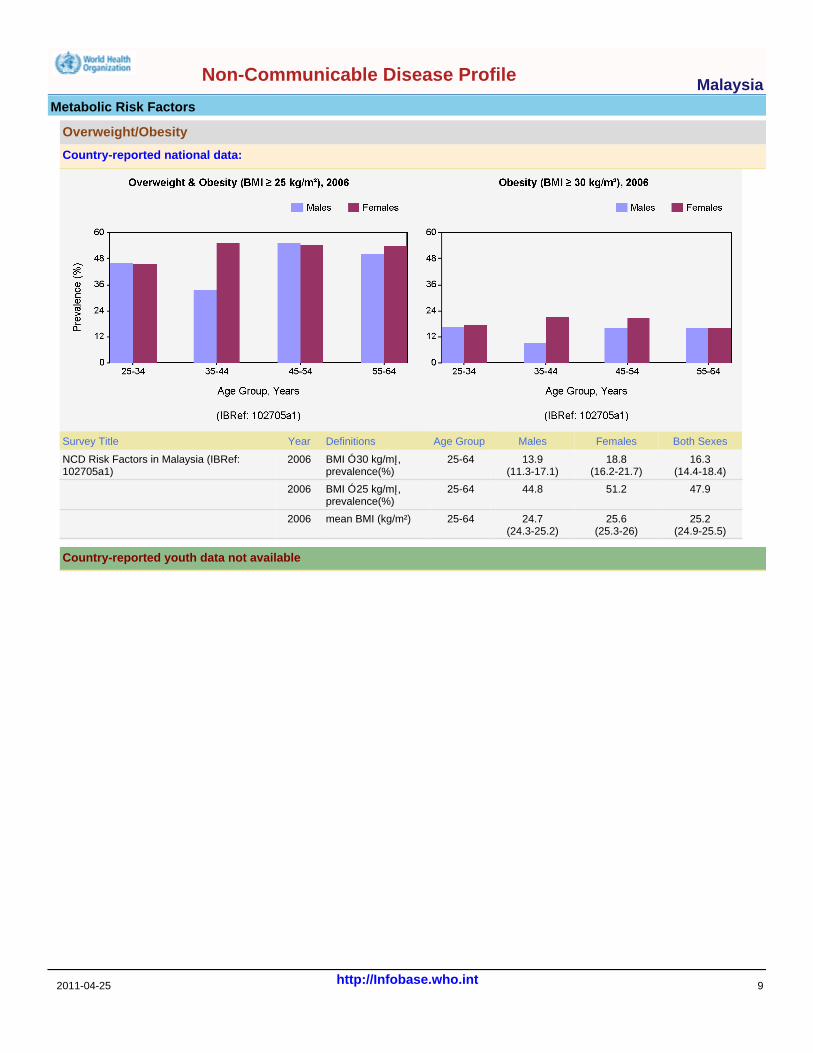
25.2 (24.9-25.5)
25.6 (25.3-26)
24.7 (24.3-25.2)
47.951.244.8
16.3 (14.4-18.4)
18.8 (16.2-21.7)
13.9 (11.3-17.1)
25-64
25-64
25-64
mean BMI (kg/m²)
BMI Ó 25 kg/mĮ,prevalence(%)
BMI Ó 30 kg/mĮ,prevalence(%)
2006
2006
2006NCD Risk Factors in Malaysia (IBRef: 102705a1)
Both SexesFemalesMalesSurvey Title Year Definitions Age Group
Country-reported national data:
Overweight/Obesity
Country-reported youth data not available
MalaysiaNon-Communicable Disease Profile
2011-04-25 10http://Infobase.who.int
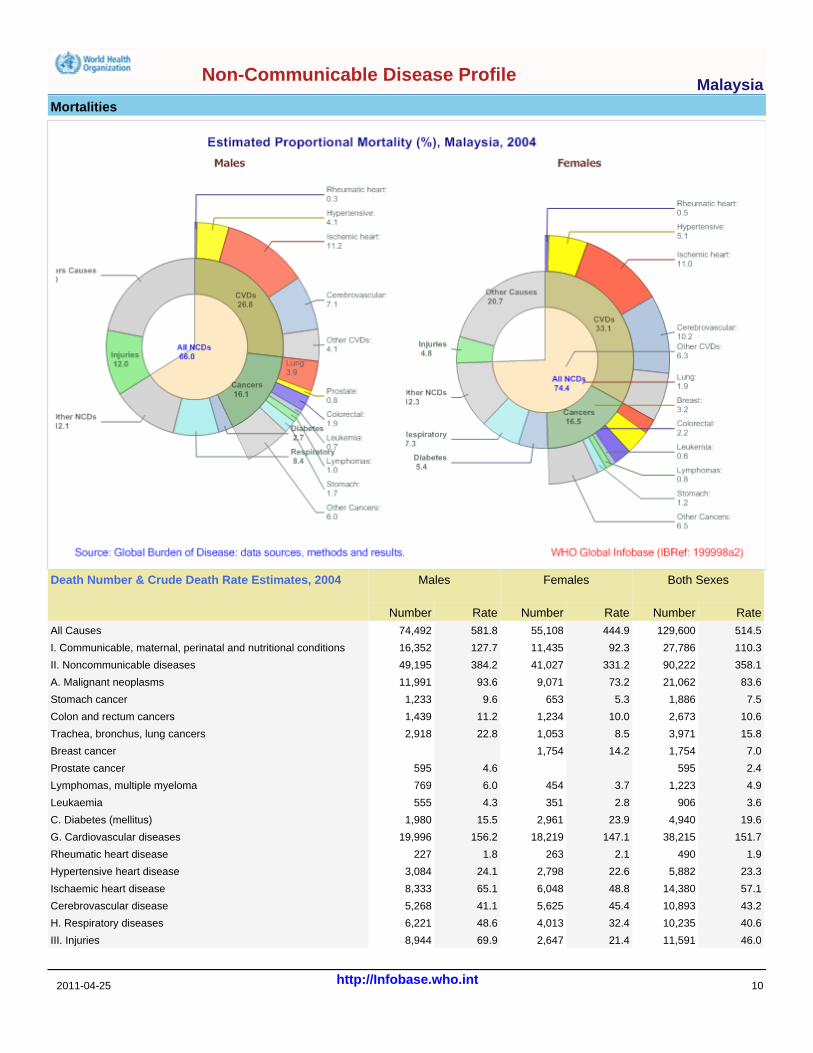
Mortalities
46.011,59121.42,64769.98,944
40.610,23532.44,01348.66,221
43.210,89345.45,62541.15,268
57.114,38048.86,04865.18,333
23.35,88222.62,79824.13,084
1.94902.12631.8227
151.738,215147.118,219156.219,996
19.64,94023.92,96115.51,980
3.69062.83514.3555
4.91,2233.74546.0769
2.45954.6595
7.01,75414.21,754
15.83,9718.51,05322.82,918
10.62,67310.01,23411.21,439
7.51,8865.36539.61,233
83.621,06273.29,07193.611,991
358.190,222331.241,027384.249,195
110.327,78692.311,435127.716,352
514.5129,600444.955,108581.874,492
III. Injuries
H. Respiratory diseases
Cerebrovascular disease
Ischaemic heart disease
Hypertensive heart disease
Rheumatic heart disease
G. Cardiovascular diseases
C. Diabetes (mellitus)
Leukaemia
Lymphomas, multiple myeloma
Prostate cancer
Breast cancer
Trachea, bronchus, lung cancers
Colon and rectum cancers
Stomach cancer
A. Malignant neoplasms
II. Noncommunicable diseases
I. Communicable, maternal, perinatal and nutritional conditions
All Causes
RateNumberRateNumberRateNumber
Both SexesFemalesMalesDeath Number & Crude Death Rate Estimates, 2004
MalaysiaNon-Communicable Disease Profile
2011-04-25 11http://Infobase.who.int
Notes
This report is dynamically generated from the WHO Global Infobase website (http://infobase.who.int), based on the latest available data in a regularly updated database. You can help this project by downloading our data template (https://apps.who.int/infobase/Publicfiles/Infobase_Data_template.xls), and entering details of your survey, for submission to the Infobase team at [email protected].